Embed Size (px)
Citation preview

Ofgem/Ofgem E-Serve 9 Millbank, London SW1P 3GE www.ofgem.gov.uk
State of the Market Assessment
Assessment
Contact: Maxine Frerk, Partner, Retail Markets
Publication date: 27 March 2014 Team: State of the Market
Tel: 0203 263 2724
Email: [email protected]
Overview:
This document sets out our joint assessment of the state of competition in the energy
markets in Great Britain, and how well competition is serving the interests of households
and small firms.

State of the Market Assessment
2
Associated documents
Letter from the OFT, Ofgem and CMA to the Secretary of State for Energy and
Climate Change
https://www.ofgem.gov.uk/ofgem-
publications/84642/ofgemoftandcmatosecretaryofstatecompetitioninenergymarkets.p
df
State of the market report – Assessment framework – 19 December 2013
https://www.ofgem.gov.uk/ofgem-
publications/85260/assessmentframework18decfinal.pdf

State of the Market Assessment
3
Contents
1. Summary of market outcomes and features 5 Market Outcomes 5
1. Prices and Profits are increasing 5 2. Market shares 7 3. Switching rates 9 4. Low customer trust 10 5. A persistent segmented market exists 10
Our findings – features of the market 11 1. Weak competition - market segmentation 11 2. Weak competition - tacit co-ordination 12 3. Barriers to entry and expansion 13 4. Vertical Integration 14 5. Weak customer pressure 15
2. Background 17 Structure of the energy markets 18 Consumer energy bills and tariffs 18 How we assessed competition in the market 20
3. Consumer engagement and response 21 Why an engaged demand side is important for competition 21 Findings: barriers to engagement 21 Awareness of the ability to switch 22 Ability to access information and identify the best offers 24
Number of tariffs and complexity of choices 24 Lack of clear information to facilitate like-for-like comparisons 26
Incentive and ability to act 27 Switching rates 27 Drivers of switching 29 Barriers to switching 30
Micro-business consumers 35 Barriers to engagement 35 Outcomes for small businesses 36 Consumers in vulnerable situations 37 Remedies that may impact on this 38
RMR Remedies 38 Change of Supplier Process 39
4. Unilateral market power / tacit coordination 40 Unilateral Market Power: overview 40 Tacit coordination: overview 43 Unilateral Market Power – in detail 44
Legacy customers 44 Shares of supply 47 Prices 49 Customer activity 52
Other market segments 57 Non-domestic market 58

State of the Market Assessment
4
Tacit coordination: in detail 59 Conditions for coordination 59 Supplier conduct 61 Indicators of competitive intensity 61 Recent trends in prices 65 Analysis of price announcements 65 Price announcements in retail markets 66 Price announcements and underlying cost movements 71 Suppliers’ pricing behaviour 72 Asymmetric price response to cost changes (‘rocket and feather’) 72
5. Barriers to entry and expansion and vertical integration 76 Barriers to entry and expansion 76
Why are barriers to entry and expansion a problem for competition? 76 Findings: Barriers to entry 77 Regulatory barriers to entry 78 Findings: Barriers to expansion 79 Small suppliers as buyers in the wholesale electricity market 81 Liquidity in the wholesale electricity market 82 Collateral requirements 85 Regulatory barriers to expansion 87 Reputational barriers 87
Vertical Integration 88 Vertical integration in GB electricity 88 Vertical integration across the supply chain 88 Interconnection 88 Vertical integration in electricity 90 Net positions of the six largest suppliers 90 The benefits of vertical integration (VI) 91 Risk/natural hedge 92 Less dependence on liquid wholesale market (resulting in less liquidity) 93 Economies of scope 93 The costs of vertical integration 93 Does vertical integration reduce liquidity in the wholesale market? 93 How much do the six largest suppliers trade? 95 The scope for suppliers raising their rivals’ costs 98 The costs and benefits of VI 99
6. Profitability 100 Introduction 100 Profitability 100
Trends in combined generation and supply EBIT 101 The profitability of supply 103
Efficiency assessment 110 Benchmarking EBIT Margins 111 Supply business return on capital employed (ROCE) 114
Generation profitability 116 ROCE analysis 116 Generation EBIT 116 Generation capital employed 118 Cost of capital 119 ROCE calculations 119

State of the Market Assessment
5
1. Summary of market outcomes and
features
Market Outcomes
1. Prices and Profits are increasing
1.1. Our analysis shows that average dual fuel prices increased by 24 per cent
between 2009 and 2013. This compares to a consumer price index (CPI) inflation
rate of 13.8 per cent during the period.
1.2. Energy consumption has declined during the period, which means that
average customer bills have increased less than prices. According to evidence from
published accounts, the average dual fuel bill has increased by 13 per cent between
2009 and 2012. This is slightly above the CPI inflation rate of 11 per cent during the
period. Ofgem also estimates a further increase in average bills of 6 per cent in
2013.
Figure 1: Average dual fuel1 household bills 2009-2012
Source: Consolidated Segmental Statements
1 A type of energy contract where a customer takes gas and electricity from the same supplier.
£646£588
£537£612
£265
£288
£294
£354
£123£152
£146
£154£8 £35
£30
£53
£52£53
£50
£59
£1,095£1,116
£1,057
£1,232
£0
£200
£400
£600
£800
£1,000
£1,200
2009 2010 2011 2012
Annual bill
Wholesale costs Other costs Supplier costs Operating profit VAT

State of the Market Assessment
6
1.3. There have also been increases in costs over this period, including
environmental and social policies mandated by government and paid for indirectly
through customers’ bills, and network charges. However, we have also observed an
increase in the aggregate reported profits of the six large vertically integrated
suppliers2 (also known as ‘the Big 6’) over the last four years.
Figure 2: Earnings before Interest and Tax (EBIT) of the six largest
suppliers (£m)
Source: Consolidated Segmental Statements
1.4. As set out in our analysis, combined Earnings before Interest and Tax (EBIT)
of the six largest suppliers from GB generation and supply increased from £3.0bn in
2009 to £3.7bn in 2012. Whilst generation and non-domestic supply profits have
fallen slightly over this period, domestic supply profits have increased from £233m to
£1,190m. As a percentage of sales, EBIT margin for domestic supply of electricity
and gas has increased from 0.9 to 4.3 per cent.
1.5. Generation profits have fluctuated over the period, reflecting changes in the
relative cost of generation by different technologies. Our analysis suggests that
return on capital employed, based on book values, was on average slightly below the
estimated cost of capital. This is supported by other evidence such as low spark
2 Centrica, EDF Energy, E.ON, Npower, SSE and Scottish Power
£233
£734 £681
£1,190£530
£861
£568
£410
£2,307
£1,385£2,288
£2,135
£3,070£2,980
£3,537
£3,735
£0
£500
£1,000
£1,500
£2,000
£2,500
£3,000
£3,500
£4,000
2009 2010 2011 2012
£ m
Domestic supply EBIT Non-domestic supply EBIT Generation EBIT

State of the Market Assessment
7
spreads3 on the marginal fuel (gas) and the closure or mothballing of some of this
marginal plant. However, in such a capital intensive industry we would require a
more in-depth valuation of capital employed in order to come up with a robust
measure of economic profitability.
1.6. There remains a wide variation in supply margins between the six largest
suppliers, with some making losses. Domestic electricity margins fell during the
period, from 2.2 per cent to 1.8 per cent. However, domestic gas margins have
increased significantly, from -0.3 per cent to 6.7 per cent over the period.
1.7. In the time available, we have not been able to conclude whether these profits
are excessive. In particular, to reach a firmer view, further work would be needed to
establish robust comparisons with other industries and countries, to develop
alternative measures of profitability and to examine the complex and varying
intercompany trading arrangements.
1.8. However, our analysis found that 2012 average domestic supply margins were
high compared to benchmarks and we did not find evidence to support some
suppliers’ contentions that 5 per cent was a ‘fair’ margin. We found a wide disparity
between the cost structures of the six largest suppliers and little evidence of cost
efficiency improvements over time. Some suppliers have recently announced 2013
results. While we have not been able to look at these in depth, we do not think levels
of profitability have changed significantly.
1.9. In conclusion, based on the available data, there are indications that suppliers
may have had an opportunity to earn high profits, although further work is required
to establish this conclusively. These indications include rising gas supply margins,
relatively high target margins, and signs that costs may not have been at an efficient
level across the industry as a whole. This is consistent with a view that competition
in the supply market may not be functioning effectively.
2. Market shares
1.10. The market shares of the six largest suppliers in the supply of domestic
electricity have remained at between 11 and 25 per cent throughout the period.
Market shares in incumbent regions for the electricity suppliers remains materially
higher than their overall market shares. For domestic gas, while Centrica’s former
monopoly on gas customers has continued to be eroded, with the five other large
suppliers now each having between 10-16 per cent market share, Centrica still
retains a 40 per cent market share.
3 Theoretical gross margin of a gas fired power plant from selling a unit of electricity

State of the Market Assessment
8
Figure 3: Domestic electricity supply market shares
Source: Meter Point Administration Number (MPAN) data from Distribution Network
Operators (DNOs)
0%
5%
10%
15%
20%
25%
30%
Jan-04 Jan-05 Jan-06 Jan-07 Jan-08 Jan-09 Jan-10 Jan-11 Jan-12 Jan-13 Jan-14
Smaller suppliers Centrica E.ON NPower SSE Scottish Power EDF

State of the Market Assessment
9
Figure 4: Domestic gas supply market shares
Source: Gas supply point data provided by Xoserve
1.11. The recent growth of smaller suppliers is an encouraging development. At
January 2014, the smaller suppliers’ domestic market share was over 5 per cent in
both electricity and gas, an increase of over 2 percentage points over a year
previously4. This shows that it is possible to enter these markets and compete with
the six largest suppliers. However, the market share of the small suppliers has
remained low over the past decade. It is unclear that any single existing supplier will
achieve sufficient scale in the near term to act as a disruptive constraint on the six
largest suppliers across the market.
3. Switching rates
1.12. Rates of switching are one indicator of the extent of competition in a market.
However, the figures should not be viewed in isolation. The speed of switching is
important, as is the quality of the outcome, such as the new tariff being better value
than the old one. Switching rates have shown a falling trend from 2008, despite
persistent price differentials and potentially large savings from switching. This may
be explained, at least in part, by the gradual withdrawal from doorstep selling of the
six largest suppliers. We also noted an increase in customers switching to different
4 This includes the acquisition by Telecom Plus of 770,000 customer accounts from Npower
0%
10%
20%
30%
40%
50%
60%
Jun-05 Mar-06 Dec-06 Sep-07 Jun-08 Mar-09 Dec-09 Sep-10 Jun-11 Mar-12 Dec-12 Sep-13
Smaller suppliers Centrica EON NPower SSE Scottish Power EDF

State of the Market Assessment
10
tariffs or payment methods from their existing supplier. While this may be evidence
of customer engagement, we cannot determine the extent of this.
1.13. We also noted that large numbers of people don’t switch, or switch very
rarely. In surveys, 62 per cent of customers could not recall ever having switched
supplier. We also noted that 37 per cent of electricity customers were still being
supplied by their regional incumbent, and 40 per cent of gas customers were being
supplied by Centrica more than 15 years after the market was liberalised.
1.14. We have observed a significant spike in switching recently, with switching
rates in November and December 2013 at their highest levels for five years. We also
saw an increase in switching away from the six largest suppliers, with 25-30 per cent
of customers that switched at the end of 2013 moving to smaller suppliers. We think
this is due to extensive publicity and media interest surrounding the recent price
rises. It is not clear whether these trends will be sustained, and we note that the
switching rate has materially decreased in January 2014.
4. Low customer trust
1.15. Levels of customer confidence and trust are not what we would expect to see
in an industry that is successful in meeting its customers’ needs and expectations.
This situation has deteriorated further since Ofgem performed its analysis for the
Retail Market Review in 2012.
1.16. We found evidence of low levels of customer satisfaction. Only 51-52 per cent
of customers said they were satisfied with their supplier, and customer complaints
have increased by more than 50 per cent since the beginning of 2011. Our survey
evidence showed that in 2013, 43 per cent of customers did not trust energy
suppliers to be open and transparent in their dealings with consumers, an increase of
4 percentage points from the previous year. We consider this to be an extremely
high figure for an industry providing such an essential service. We found that
customers were reluctant to engage in the market, and required large savings to
consider switching worthwhile.5
5. A persistently segmented market exists
1.17. We observed differences in prices between different domestic customer
groups. We did not consider that costs to serve these customers accounted for these
differences.
Customers on single fuel tariffs with their legacy supplier are likely to be paying
higher prices than those who have switched to another supplier, either to single
or dual fuel tariffs. These ‘sticky’ customers make up a significant minority of the
market.
5 See Chapter 3

State of the Market Assessment
11
Much of the rest of the market is characterised by weak competition. Price rises
by the six largest suppliers tend to be announced around the same time, and
price differences between standard dual fuel tariffs are converging.
Customers that are prepared to manage their accounts online, pay by direct
debit, and fix the cost of their energy for 12-18 months are able to get the best
deals. This is also the part of the market where many of the smaller suppliers
compete.
1.18. The effect of this ‘three-speed market’ is that the ‘stickiest’ customers, who
are more likely to belong to vulnerable groups, pay higher prices for their energy
than those that are able and willing to switch supplier for a better deal.
Our findings – features of the market
1.19. The outcomes described above are likely to be the result of a number of
features of the energy markets that may have an adverse effect on competition.
1.20. In summary, we have found weak competition between incumbent
suppliers. This arises from market segmentation and possible tacit co-
ordination. While we might expect competitive pressure from consumers or new
suppliers, we have also found barriers to entry and expansion (including vertical
integration) and weak customer pressure.
1.21. These features combine and reinforce each other to deliver poor outcomes for
domestic consumers. Small businesses are also affected by these features – the
smaller the size of business customer, the more similar their outcomes are to
domestic consumers. Many of these features were identified in the Probe in 2008
and have persisted since then. Some have become worse since the Retail Market
Review was carried out in 2011. We set them out in more detail below.
1. Weak competition - market segmentation
1.22. Suppliers are able to segment their customer base, and charge different
groups of customers different prices for what is essentially the same product. The six
largest suppliers retain a disproportionately high number of customers located in
their incumbent regions, or, for Centrica, a disproportionately high number of gas
customers. Most of these will be customers who have not switched away from that
supplier since market liberalisation. Our work showed that the switching rate of these
incumbent customers was about a quarter of the switching rate of non-incumbent
customers.
1.23. These ‘sticky’ customers are charged more for their energy than those from
outside the incumbent region or fuel, reflecting the fact that they are more likely to
be on higher priced single fuel tariffs.
1.24. We found that a typical single fuel customer of the six largest suppliers would
be able to save nearly £100 on average by switching to the best priced single fuel

State of the Market Assessment
12
tariff of the other large suppliers. While a difference in prices of products can act as
an incentive to switching, it is clear that significant numbers of customers have never
participated in this market, or have participated so rarely that their actions do not
constrain prices. Therefore, we have found that suppliers can exercise market power
over these incumbent customers.
1.25. Conversely, there appears to be a greater degree of price competition,
resulting in lower prices, on newer tariffs such as fixed and online, where customers
are more likely to be active. We found a difference of approximately £250 between
the average incumbent single fuel6 tariff and the best online dual fuel direct debit
tariff offered by small suppliers.
2. Weak competition - tacit coordination
1.26. When a market is sufficiently stable and rival firms interact repeatedly, for
example through price announcements, they may be able to anticipate each other’s
future actions, enabling them to establish a coordinated course of action without
communicating directly. This situation is referred to as tacit coordination between
suppliers. Although this does not breach competition law, it may result in competition
being less effective and so can result in prices being higher than they would be in
competitive markets.
1.27. As Ofgem found in its Retail Market Review, many characteristics of energy
retail markets may facilitate tacit coordination. There is a high level of concentration
in the market, company structure, products and costs are relatively similar, prices
are observable, and demand conditions are predictable. High barriers to expansion
and the absence of any major disruptive entrant also help to create conditions for
coordination between suppliers. Moreover, the 2008 Probe found direct evidence that
companies were active in pursuing strategies, such as matching hedging strategies
and pricing relative to a perceived market leader, in order to reduce risk and
increase profits. These strategies were found to be carried out independently, but
could have the effect of reducing competition, even if that was not the intent. This
assessment confirms this previous finding that the conditions for coordination are
prevalent in retail energy markets. We do not consider this to be a possible breach of
Competition Law.
1.28. We also looked at the behaviour of the six largest energy companies. We are
not in a position to conclude on whether tacit coordination exists in this market.
However, we found a number of aspects of the behaviour of the six largest suppliers
that would appear to be consistent with tacit coordination between them. We have
found that these aspects have become more entrenched recently. This includes our
observations that:
the large suppliers announce price changes around the same time and of a
similar magnitude
profitability has increased for all of the large suppliers, and domestic supply
margins have converged; and
6 A type of energy contract where a customer takes gas or electricity from a particular supplier.

State of the Market Assessment
13
the large suppliers appear to raise prices more quickly and fully when costs
increase than they reduce them when costs fall.
3. Barriers to entry and expansion
1.29. Any supplier considering raising the price or reducing the quality of their
product should feel constrained by the prospect of actual or potential rivals taking
their customers. The ability of such rivals to expand quickly is therefore a key
ingredient in competitive markets. Such markets allow for the possibility of entry and
expansion by new firms to undercut existing suppliers.
1.30. We spoke to a number of small suppliers and companies that had considered
entering the market. We identified a number of barriers set out below.
1.31. Non-integrated suppliers are required to post significant collateral in order to
trade on wholesale markets, and also when engaging with mandatory industry codes.
This acts as a barrier as suppliers need a strong credit rating or access to working
capital finance in order to enter or expand their operations.
1.32. Low wholesale market liquidity, identified by Ofgem in its 2008 Probe, acts as
a barrier to accessing wholesale electricity at a competitive cost. This is discussed
further in the section on vertical integration below.
1.33. The supply of electricity and gas is heavily regulated. As well as licences
governed by the sector regulator, the industry governs itself through a number of
codes. While this regulatory environment may be seen as a ‘cost of doing business’
applicable to all suppliers, the complexity and costs of compliance are more
burdensome for smaller suppliers, who have lower customer bases over which to
spread these costs.
1.34. A further feature of regulatory involvement is the requirement by government
that suppliers undertake certain social and environmental obligations. The costs of
these are passed to consumers through their bills. There is a size threshold (250,000
accounts), below which a supplier is not required to meet these obligations. While
this gives the smaller suppliers a cost advantage, the threshold also acts as a barrier
to expansion. As the benefit for exemption tapers away, the marginal cost of
meeting the obligation is higher than both smaller and larger competitors.
1.35. In addition to the regulatory barriers to entry, the industry is affected by a
high degree of policy change, political and media scrutiny, and negative publicity. As
part of our assessment, we spoke to a number of firms that had previously
considered entering the retail energy market. A consistent reason for not entering
was the political environment surrounding the energy market and uncertainties
surrounding the future course of policy. Damage to companies’ brand image, due to
the reputation of the market and poor cross-industry processes such as switching
processes, was also a reason for not entering. Some small suppliers reported that
similar factors affected their decisions not to expand.

State of the Market Assessment
14
4. Vertical Integration
1.36. Vertical integration (VI) is a feature of the electricity market, where the
largest six suppliers directly own about 70 per cent of generation capacity.7 It is not
such a strong feature of the gas market. Vertical integration provides a financial
hedge against volatile wholesale energy prices and a natural hedge against balancing
risk. As well as having less of a requirement to trade, integrated suppliers are also
likely to have stronger credit ratings, allowing them to post lower levels of collateral.
Without the benefit of this, non-integrated suppliers are required to post significant
collateral to trade in wholesale markets. We consider that vertical integration reduces
the cost of capital relative to similar non-integrated businesses, because it reduces
exposure to volatile market risk. Given the capital intensive nature of power
generation, this could yield a significant benefit to consumers through lower prices
and better security of supply.
1.37. We note that all of the large electricity suppliers have chosen to arrange their
supply chains by way of an integrated structure and that some smaller suppliers
have sought to put in place long term supply arrangements. This implies that there
are real benefits to integration for suppliers, which in a competitive market should be
passed through to customers.
1.38. However, we consider that vertical integration also has costs in terms of
reduced competition in energy markets. Low levels of liquidity in the wholesale
electricity markets, particularly for certain types of product at particular times, act as
a barrier to entry for non-integrated suppliers. They also act as a barrier to
expansion for those non-integrated suppliers already in the market. A lack of liquidity
in the market for longer-term contracts may also inhibit the ability of independent
generators to secure finance for new investment, or raise their cost of capital. Some
market participants have suggested that while VI gives large suppliers guaranteed
supplies of wholesale electricity products going forward, it also reduces the
availability of those products to smaller non-integrated suppliers. Ofgem’s liquidity
reforms, which come into effect in April 2014, aim to address wholesale liquidity
issues. These reforms were targeted specifically on providing improved price
discovery and access to wholesale products for independent suppliers and
generators. However, they were not intended to address challenges independent
suppliers might face around credit and collateral or more general efficiency
advantages that might arise from vertical integration. There was a range of views
from stakeholders we interviewed as to how far these reforms will address the
concerns identified.
1.39. We have not attempted to weigh the costs against the benefits of vertical
integration in electricity markets. Such an exercise would require a more detailed
examination of the effects of vertical integration than has been possible in this
assessment. Nevertheless we do not consider that the benefits of vertical integration
are so clear cut as to make this an unnecessary exercise. We also consider that the
costs to retail competition in terms of the barriers to entry and expansion resulting
7 Ofgem (2011), Retail Market Review: Findings and Initial Proposals‟, p5:
http://www.ofgem.gov.uk/Pages/MoreInformation.aspx?docid=1&refer=Markets/RetMkts/rmr

State of the Market Assessment
15
from vertical integration may be significant– particularly in a market where
competition is already weak, as discussed above.
5. Weak customer pressure
1.40. In competitive markets, we would expect to see consumer actions, such as
the threat of switching supplier, exert competitive pressure on suppliers. As noted
above, there appear to be large parts of the market where this is not occurring.
1.41. As part of its Retail Market Review (RMR) in 2011, Ofgem found the following
in respect of consumer action and behaviour in the energy markets:
A large number of tariffs, many of which had complex structures and discount
arrangements. This made the prospect of engaging in the market unattractive for
many consumers, and meant it was often difficult for consumers who did engage
to choose the best deal for their circumstances.
Gaps and lack of clarity in the information given by suppliers to consumers which
meant they were not prompted to engage or given the full set of information they
needed to assess options in the market.
Lack of trust and poor supplier conduct which further reduced the confidence of
some customers to engage in the market and contributed to the permanent
disengagement of others.
1.42. A number of reforms have been developed as a result of RMR, which are
currently being implemented. These include a limit on the number of tariffs offered
by a supplier, standards of conduct rules which govern how suppliers must treat their
customers, and clearer bill information. As part of this assessment, we asked
stakeholders about RMR. There was a range of views as to how far these reforms will
address the problems identified.
1.43. We also looked at updated consumer research carried out for Ofgem. With
respect to awareness, we found that there was a small increase since 2012 in
awareness that it is possible to switch energy supplier among those who have never
switched. However, one in ten of all consumers is not aware of their ability to switch
supplier. There was a larger increase in awareness that it was possible to switch
tariff or payment method within a supplier.
1.44. Our research also showed that barriers to accessing and identifying best offers
remained ahead of the RMR reforms being introduced. 62 per cent of consumers said
there were too many tariffs available, with 54 per cent saying they understood the
range of tariffs ‘not very much’ or ‘not at all’.
1.45. Switching from one supplier to another is seen as a hassle by 27 per cent of
customers who have never switched, and the fear of something ‘going wrong’ during
the switching process is also off-putting for many. Those consumers who have made
a switch often lack confidence in their decision. Over a quarter (26 per cent) of those

State of the Market Assessment
16
who switched in the year ending April 2012 would not do so again; while one reason
for this was being happy with the new supplier, other factors were less positive and
included finding the process difficult, or being disappointed in the outcome (e.g.
suspecting that they have ended up paying more).8
1.46. Overall satisfaction and trust in suppliers has also fallen – 43 per cent of
customers distrust energy companies to be open and transparent in their dealings
with consumers.
1.47. These results show that low consumer engagement and weak customer
pressure remain important features in these markets and have become more
pronounced in recent years.
8 Consumer Futures, Switched on? Consumer experiences of energy switching, 2013 p.23-25 http://www.consumerfocus.org.uk/files/2013/01/Switched-on.pdf

State of the Market Assessment
17
2. Background
2.1. In its response to the Energy and Climate Change Committee, Ofgem
committed to report annually on competition in the retail energy markets and on its
retail market reforms. This reporting is an important part of ongoing market
monitoring work that Ofgem undertakes as part of its duty to protect the interests of
consumers.
2.2. The Government subsequently announced that Ofgem would work with the
OFT to carry out an annual review into the state of competition in the energy
markets and, as far as possible, draw on the expertise of the CMA. The aim of this
assessment is to consider how well competition in the markets for gas and electricity
is serving the interests of households and small firms in GB.
2.3. Ofgem, OFT and the CMA committed to delivering our State of the Market
Assessment by the end of March 2014. We published our joint Assessment
Framework on 19 December 2013.9 This document set out the framework we had
developed to assess the market.
2.4. By working jointly on this project we have drawn on Ofgem’s knowledge and
expertise in energy markets and the OFT’s wide-ranging experience of assessing
competition in a range of markets.
Ofgem’s principal objective is to protect the interests of existing and future
energy consumers. These interests include the reduction of greenhouse gases,
the security of the supply of gas and electricity to consumers, and Ofgem’s
fulfilment of the objectives in the European Union (EU) Gas and Electricity
Directives.10
The OFT’s mission is to make markets work well for consumers. OFT considers
that markets work well when businesses are in open, fair and vigorous
competition with each other for the consumer’s custom.
The CMA’s objective is to promote competition, within and outside the United
Kingdom (UK), for the benefit of consumers. It will bring together the CC with
certain competition and consumer functions of the OFT in order to promote
competition, both within and outside the UK, for the benefit of consumers. The
CMA was launched in shadow form on 1 October 2013 and will go live on 1 April
2014. Although the CMA is not yet formally established, it monitored
developments and provided expertise in anticipation of its future role as
successor to certain of OFT’s functions.
2.5. In this document we use the terms “market” and “markets” as shorthand for
referring to different segments of the energy sector. For the avoidance of doubt
9 State of the Market Assessment Framework – December 2013 10 As set out in the Gas Act 1986 and the Electricity Act 1989.

State of the Market Assessment
18
these terms are not intended to describe or otherwise suggest the approach that
may be taken in defining relevant economic markets for the purposes of competition
law investigations which may be conducted by Ofgem or the CMA, or for purposes of
a market investigation which could be undertaken by the CMA in the event that a
market investigation reference is made.
Structure of the energy markets
2.6. Competition in the retail energy markets was introduced fully in 1999. Before
this, British Gas and the fourteen Public Electricity Suppliers (PESs) had a monopoly
to supply all domestic gas and electricity consumers respectively in GB. In the
subsequent five years the number of suppliers in the market fell to six, as a result of
horizontal mergers. Some of these businesses also merged with generation
companies to create vertically-integrated groups.
2.7. The six largest suppliers in GB now serve around 95 per cent of the domestic
retail gas and electricity markets, and own around 70 per cent of the generating
capacity.11 In the gas sector, vertical integration is less of a feature. Only Centrica
(British Gas) has significant gas production capability as a part of its UK group, with
production in 2012 representing around a third of its GB supply requirements for
domestic and Small to Medium Enterprise (SME) consumers.12
2.8. In our Assessment Framework, we provided an outline of how the energy
supply chain works, from production to end consumer. We also outlined Ofgem’s role
in regulating the market and key policy developments in the retail and wholesale
markets.
Consumer energy bills and tariffs
2.9. Just under half of an average domestic energy bill is the cost of wholesale gas
and electricity. Other elements of the bill include:
Network costs – to build, maintain and operate the transmission and distribution
networks which transport gas and electricity from source to end consumers.
Supplier costs – These include the costs of running a retail energy business,
including sales, metering and billing.
Environmental and social costs – policies set by government that aim to meet
environmental and social objectives, such as the Energy Companies Obligation
(ECO)13.
11 Ofgem (2011), Retail Market Review: Findings and Initial Proposals‟, p5: http://www.ofgem.gov.uk/Pages/MoreInformation.aspx?docid=1&refer=Markets/RetMkts/rmr 12 Ofgem analysis based on information received by suppliers and data provided by Datamonitor 13 The Energy Companies Obligation places obligations on the larger energy suppliers to deliver energy efficiency measures to domestic energy users.
State of the Market Assessment
19
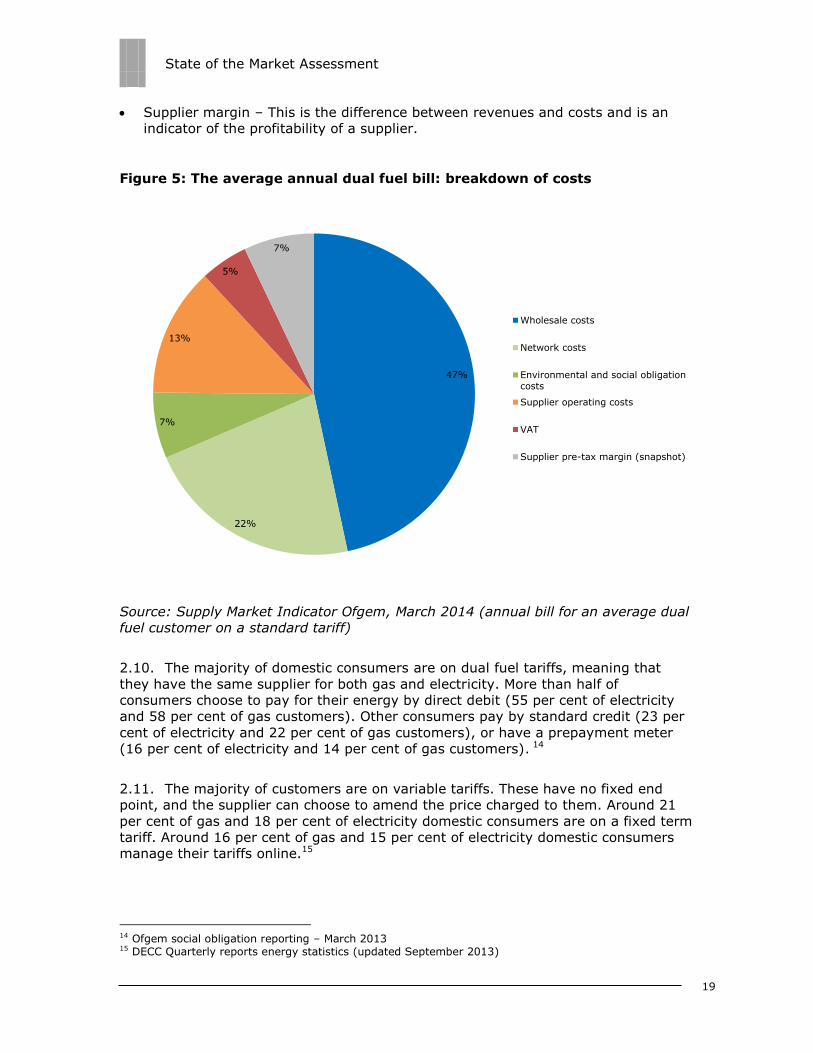
Supplier margin – This is the difference between revenues and costs and is an
indicator of the profitability of a supplier.
Figure 5: The average annual dual fuel bill: breakdown of costs
Source: Supply Market Indicator Ofgem, March 2014 (annual bill for an average dual
fuel customer on a standard tariff)
2.10. The majority of domestic consumers are on dual fuel tariffs, meaning that
they have the same supplier for both gas and electricity. More than half of
consumers choose to pay for their energy by direct debit (55 per cent of electricity
and 58 per cent of gas customers). Other consumers pay by standard credit (23 per
cent of electricity and 22 per cent of gas customers), or have a prepayment meter
(16 per cent of electricity and 14 per cent of gas customers). 14
2.11. The majority of customers are on variable tariffs. These have no fixed end
point, and the supplier can choose to amend the price charged to them. Around 21
per cent of gas and 18 per cent of electricity domestic consumers are on a fixed term
tariff. Around 16 per cent of gas and 15 per cent of electricity domestic consumers
manage their tariffs online.15
14 Ofgem social obligation reporting – March 2013 15 DECC Quarterly reports energy statistics (updated September 2013)
47%
22%
7%
13%
5%
7%
Wholesale costs
Network costs
Environmental and social obligationcosts
Supplier operating costs
VAT
Supplier pre-tax margin (snapshot)

State of the Market Assessment
20
How we assessed competition in the market
2.12. As outlined in our State of the Market Assessment Framework, we have
conducted our assessment of the state of competition in the market by considering
five potential sources of harm.
Consumer engagement and response: Ofgem’s Retail Market Review (RMR)
identified high levels of customer confusion and a lack of confidence in engaging
with the market, exacerbated by poor supplier behaviour and the complexity of
tariffs. Consumers struggled to access, assess and act on the offers in the
market. We have updated the evidence Ofgem considered in the RMR. We also
sought views from stakeholders on what they thought the impact of RMR would
be.
Unilateral market power: Former ‘incumbent’ suppliers’ have a proportion of
customers who have never engaged in the market. These consumers are unlikely
or unable to switch. These are termed ‘sticky’. There are questions over whether
suppliers can exploit their positions.
Tacit coordination: We examined how vigorously the six largest suppliers are
competing with each other. We looked at whether they follow similar strategies,
and if so, whether it mutes price competition?
Barriers to entry and expansion: We examined barriers to entry, exit and
expansion, covering levels of entry and growth. We spoke to smaller suppliers
and potential new entrants about the barriers they have faced.
Vertical integration: Common ownership of electricity generation and supply
brings benefits but may create barriers to entry in both retail and generation. We
looked at whether independent suppliers can access wholesale energy on
competitive terms, and whether independent generators can sell into those
wholesale markets without being vertically integrated. We looked at the
transparency of wholesale prices and the trading models of integrated suppliers,
as well as profits at different levels of the supply chain.

State of the Market Assessment
21
3. Consumer engagement and response
Chapter Summary
Our evidence shows that many consumers lack the ability to access, assess and act
on information on offerings in the market, and therefore cannot exercise effective
consumer choice. The main barriers are a combination of the complexity of tariffs,
unclear and incomplete information, and lack of trust and confidence in suppliers and
the market. These all contribute to an overall lack of engagement in the market.
This is likely to cause consumer detriment by failing to put competitive pressure on
suppliers to offer the products and services consumers want.
Trust and satisfaction with suppliers have continued to decline over recent years, as
have switching rates (with the exception of an uplift in switching at the latter end of
2013). Ofgem are in the process of introducing remedies through the Retail Market
Review (RMR) aimed at addressing these issues, the impact of which is yet to be
seen. Stakeholders have mixed views on how effective these remedies will be.
Why an engaged demand side is important for competition
3.1. For competition to work effectively, suppliers must feel a threat from
consumers switching to a competitor’s product should there be better offers in the
market. Therefore, for the energy market to work well, we need a sufficient number
of engaged consumers, able to assess, access, and act on information.16
Findings: barriers to engagement
3.2. Previous Ofgem studies have investigated the demand side in the energy retail
market to determine whether barriers exist that limit consumers’ ability and
willingness to exercise effective choice. In particular the Energy Supply Probe (ESP)17
and RMR18 found evidence of weak consumer response in the retail market and a
number of possible barriers to consumers exercising effective choice.
3.3. This assessment of demand side engagement builds on the detailed analysis in
these studies, and includes updated evidence where available. A number of remedies
are currently being introduced which aim to address some of the barriers identified.
However the remedies are expected to take time to have an effect on consumer
engagement. The information gathered for this report covers the period prior to full
implementation of these and therefore will not fully reflect their impact.
16 Competition Commission, Market Investigation Guidelines, paragraphs 295-318 http://www.competition-commission.org.uk/publications/cc-rules-and-guidance 17 Ofgem, The Energy Supply Probe (ESP)https://www.ofgem.gov.uk/electricity/retail-market/market-review-and-reform/retail-market-review/energy-supply-probe 18 Ofgem, Retail Market Review (RMR) https://www.ofgem.gov.uk/electricity/retail-market/market-review-and-reform/retail-market-review

State of the Market Assessment
22
3.4. To set out what may be restricting customers from exercising effective choice,
this chapter examines any barriers to accessing information, identifying the best-
value offers, and switching suppliers.
3.5. Our research shows that consumers have difficulty in accessing and assessing
and acting upon information about their options, and that this is mainly due to:
the number of tariffs and complexity of choices
lack of clear information to facilitate like-for-like comparisons, and
lack of trust in suppliers and the market.
3.6. This makes the prospect of engaging in the market unattractive for many
consumers. Many are put off from searching for better tariffs at all and some
abandon their search. The difficulty in assessing information may also result in a
greater number of consumers who have gone through with a switch being uncertain
of whether or not they have made a good switching decision. For example, in 2013
only around seven in ten switchers felt confident that they fully understood the
features of their new deal and that they would make the right choice in a future
switching decision.19
3.7. Some of the research findings that underpin these conclusions are set out
below.
Awareness of the ability to switch
3.8. Consumers need to be aware of their ability to switch supplier or change tariff
if they are to exercise this choice. Survey data shown in Figure 6 shows that:
Among those who report never having switched supplier20, the majority (84 per
cent) are aware that it is possible to do so. While this is largely positive, it means
nearly one in five (16 per cent) non-switchers are not aware of their ability to
switch supplier.21 This equates to one in ten (10 per cent) of all energy
consumers being unaware they can switch.22 Furthermore, those unaware of the
possibility to switch are comparatively more likely to be from DE socio-economic
grades (21 per cent unaware) and Black and Minority Ethnic groups (BME) (39
per cent unaware).23
19 Ipsos MORI, Customer Engagement with the Energy Market - Tracking Survey 2013, p.35-36 https://www.ofgem.gov.uk/ofgem-publications/74756/customer-engagement-energy-market-tracking-survey-2013.pdf 20 62 per cent of consumers report never having switched gas or electricity supplier - Ipsos MORI, Customer Engagement with the Energy Market - Tracking Survey 2013, p.12 21 Ipsos MORI, Customer Engagement with the Energy Market - Tracking Survey 2013, p.21 22 Table 88, data tables from Ipsos MORI, Customer Engagement with the Energy Market – Tracking Survey 2013 https://www.ofgem.gov.uk/publications-and-updates/consumer-research-datasets 23 Ipsos MORI, Customer Engagement with the Energy Market - Tracking Survey 2013, p.21

State of the Market Assessment
23
Among those who have not recently changed tariff or payment method while
staying with the same supplier24, more than four in five (82 per cent) are aware
that it is possible to do so. This is a 14 percentage point increase on 2012 figures
of 68 per cent25 The 2013 findings do however show that awareness of the
possibility of tariff or payment method change is significantly lower among more
vulnerable groups, notably Prepayment meter (PPM) consumers (especially gas
PPM, 68 per cent, though electricity PPM is also significantly lower at 73 per
cent), state-supported social grade E (68 per cent) and those who rent their
homes (77 per cent). Awareness is also lower among BME consumers (58 per
cent).26
Figure 6: Yearly comparison of levels of awareness of ability to switch
supplier, or tariff or payment method with current supplier
Source: Ipsos MORI, Customer Engagement with the Energy Market - Tracking
Survey 2013 p.19-21 and p.74
24 74 per cent of gas consumers (870 of 1181) and 74% of electricity consumers (1018 of 1380) stayed with the same supplier and did not change tariff or payment method with them in the last year; Ipsos MORI, Customer Engagement with the Energy Market - Tracking Survey 2013; Table 76 and Table 55 https://www.ofgem.gov.uk/publications-and-updates/consumer-research-datasets 25 Ipsos MORI, Customer Engagement with the Energy Market - Tracking Survey 2013 p.19 26 Ibid, p.19-20; see also Table 86 data tables from Ipsos MORI, Customer Engagement with the Energy Market – Tracking Survey 2013 https://www.ofgem.gov.uk/publications-and-updates/consumer-research-datasets
80%83%
87%
82%84%
68%
82%
0%
10%
20%
30%
40%
50%
60%
70%
80%
90%
100%
2008 2010 2011 2012 2013
Aware that can switch supplier (Base: Consumers who have never switched gas or electricity supplier)
Aware that can switch tariff or method of payment with current supplier (Base: Consumers who have not changed gasor electricity supplier, tariff or payment method in previous year)

State of the Market Assessment
24
Ability to access information and identify the best offers
3.9. If consumers cannot easily or effectively compare their products with others
on offer this may allow firms to exercise some market power. The possibility that
some firms hold market power is examined in Chapter 4.
3.10. Where information is relatively complex, difficult to obtain or process, or
where the cost of browsing alternatives is high (‘search costs’), consumers may not
search for the best offer available or may struggle to accurately identify their
preferred one.
Number of tariffs and complexity of choices
3.11. Ofgem’s review of tariffs in the market in 2012 found evidence that consumers
faced a large number of tariff options and that those tariff options were often
complex in structure and presentation. For instance, individual consumers could have
been faced with 161 core tariff choices from the large suppliers, many of which had
differing charging and discount structures making price calculations and like-for-like
comparisons difficult. 27
3.12. The survey results shown in Figure 7 show that, prior to RMR, a majority of
consumers felt that there were too many tariffs available in the market. Equally, less
than half of consumers say they understand the range of different tariffs available to
them completely or a fair amount.28 In addition, qualitative consumer research
consistently shows that people find and/or perceive these issues as barriers to
market engagement.29 For instance, findings from a consumer panel show that a lack
of standardisation in how tariffs and tariff information are presented was a cause of
confusion30 and led to a feeling of disempowerment amongst consumers who were
bewildered by the amount of choice.31
3.13. This inhibits consumers from exploring their options by putting many off from
searching for better tariffs in the first place or leading some to abandon their search
27 Ofgem analysis of supplier tariff permutations as at 28 August 2012 using information available from an information request to suppliers. This showed there were around 500 tariffs in the market and that individual consumers could be faced with 161 core tariff choices from the large suppliers. The total includes both large and small suppliers (including white labels), all meter types and payment methods, based on the London region. Previous definitions of a ‘core tariff’ had the figure at 900. Please see Ofgem, The Retail Market Review – Final domestic proposals, March 2013, p.25 https://www.ofgem.gov.uk/ofgem-publications/39350/retail-market-review-final-domestic-proposals.pdf 28 Ipsos MORI, Customer Engagement with the Energy Market - Tracking Survey 2013, p.40-42 29 For example, successive qualitative research from the Ofgem Consumer First Panel – reports dating from 2008 available here: https://www.ofgem.gov.uk/about-us/how-we-work/working-consumers/our-consumer-research-and-publications 30 Ipsos MORI, Consumer engagement with the energy market, information needs and perceptions of Ofgem, Findings from the Ofgem Consumer First Panel Year 4: second workshops (held in March 2012), October 2012, p.21 https://www.ofgem.gov.uk/ofgem-publications/39452/consumer-engagement-energy-market-information-needs-and-perceptions-ofgem.pdf 31 Insight Exchange, Consumer research and collaborative engagement on the proposed Standards of Conduct – Domestic Customers, October 2012, p.14

State of the Market Assessment
25
for a better tariff.32 Some consumers feel that suppliers are deliberately making it
difficult for consumers to assess different tariff options, which adds to the mistrust
many consumers feel towards energy suppliers.33
Figure 7: Consumer attitudes to tariff choices in 2013: number of tariffs
Source: Ipsos MORI, Customer Engagement in the Energy Market - Tracking Survey
2013, p.40-42
32 Ipsos MORI, Consumer engagement with the energy market, information needs and perceptions of Ofgem, Findings from the Ofgem Consumer First Panel Year 4: second workshops (held in March 2012), October 2012, p.21 33 Insight Exchange, Consumer research and collaborative engagement on the proposed Standards of Conduct – Domestic Customers, October 2012, p.14 https://www.ofgem.gov.uk/ofgem-publications/39461/consumer-research-and-collaborative-engagement-proposed-standards-conduct-domestic-customers.pdf
62%
20%
5%
14%
0%
10%
20%
30%
40%
50%
60%
70%
Too many tariffs The right number of tariffs Too few tariffs Don’t know
Thinking about the number of different tariffs available to you, are there the right number of energy tariffs available, or are there too manytariffs or too few tariffs? (Base: All those with mains electricity or gas and responsible for bills (1433))

State of the Market Assessment
26
Figure 8: Consumer attitudes to tariff choices in 2013: understanding
Source: Ipsos MORI, Customer Engagement in the Energy Market - Tracking Survey
2013, p.40-42
Lack of clear information to facilitate like-for-like comparisons
3.14. In addition, semiotics and language experts commissioned by Ofgem
concluded that a lack of clear communications and standardised language across the
energy industry further compounds the belief among consumers that the energy
market is confusing.34 This view was echoed in qualitative research in which many
consumers considered the information available to be unclear, complicated and
deliberately confusing.35
3.15. While arguably price comparison and switching sites have the potential to help
consumers make sense of their choices - and increasingly they are one of the most
popular ways for more active consumers to research and make a switch - research
shows that comparison websites are used most by those on direct debit, more
affluent socio-economic groups, the 35-64 age group and, naturally, those with
34 Lawes Consulting & Lawes Gadsby Semiotics, Retail Market Review – energy bills, annual statements and price rise notifications: advice on layout and the use of language. A research report for Ofgem, November 2011. http://www.ofgem.gov.uk/Markets/RetMkts/rmr/Documents1/Lawes_Language_Report.pdf 35 Ipsos MORI, Findings from first workshops (held October and November 2011), January 2012; Ipsos MORI, Consumer engagement with the energy market, information needs and perceptions of Ofgem, Findings from the Ofgem Consumer First Panel Year 4: second workshops (held in March 2012), October 2012
10%
35% 35%
19%
2%
0%
5%
10%
15%
20%
25%
30%
35%
40%
Completely A fair amount Not very much Not at all Don’t know
To what extent would you say you understand the range of different energy tariffs available to you? (Base: All with either mains gas or electricitywho are responsible for bills (1433))

State of the Market Assessment
27
internet access.36 In addition, there was some evidence that even more active and
engaged consumers found price comparison sites confusing and some are sceptical of
their independence.37
Incentive and ability to act
Switching rates
3.16. Figure 9 below shows the percentage of consumers switching supplier on a
monthly basis. Due to a variety of factors, including the reduction in doorstep and
other outbound sales activity by suppliers, switching rates have shown a year-on-
year decline since 2008.38 There was a spike in switching activity in November 2013,
particularly for electricity consumers.39 The latter may reflect the recent media and
political attention on retail energy prices and their increases over this period since
October 2013. It is not clear whether this trend will be sustained, and we note that
the switching rate has materially decreased in January 2014.
36 Ipsos MORI, Customer Engagement in the Energy Market - Tracking Survey 2013, p30-31; Ipsos MORI, Customer Engagement in the Energy Market – Tracking Survey 2012, p29 37 Ipsos MORI, Consumer First Panel Year 4: Findings from first workshops (held in October and November 2011), January 2012. 38 Ipsos MORI, Customer Engagement in the Energy Market - Tracking Survey 2013 p.10; Ipsos MORI, Customer Engagement in the Energy Market - Tracking Survey 2012 p.9; Data on completed switches provided by six largest suppliers and DNOs 39 Data on completed switches provided by the six largest suppliers and DNOs. Also see Figure [X in the Background section.

State of the Market Assessment
28
Figure 9: Monthly switching data
Source: DNOs, large suppliers, Xoserve
3.17. The proportion of consumers who are proactively engaged is relatively small,
with only 11-12 per cent of consumers reporting switching supplier in 2012, and
switching activity being increasingly concentrated among a limited subgroup over
time.40 There is a large proportion of consumers who say they have never switched
(62 per cent) or only once switched (14-16 per cent).41 Moreover, vulnerable
consumers are disproportionately represented among the ‘never switched’ group.
How switching patterns differ among different groups of consumers, including more
vulnerable consumers, is presented in more detail later in this chapter.
3.18. However, among those who reported they did not switch supplier in the
previous year, the incidence of switching tariff or payment method with the same
supplier has increased.42 This suggests that although switching levels in general are
fairly low and declining, consumers may be increasingly willing to move to a better
deal with their current supplier.
40 Ipsos MORI, Customer Engagement in the Energy Market - Tracking Survey 2013, p.10-13 41 Ibid. pp12, pp70, pp72; Table 73 and 52 Ipsos MORI, Customer Engagement with the Energy Market – Tracking Survey 2013 https://www.ofgem.gov.uk/publications-and-updates/consumer-research-datasets 42 Ipsos MORI, Customer Engagement in the Energy Market - Tracking Survey 2013, p.14-15
0.0%
0.5%
1.0%
1.5%
2.0%
2.5%
2006 2007 2008 2009 2010 2011 2012 2013
Electricity Gas

State of the Market Assessment
29
Figure 10 Consumers who reported switching supplier, tariff or payment
method
Source: Ipsos MORI, Customer Engagement in the Energy Market - Tracking Survey
2013, p.10-16
Drivers of switching
3.19. Research shows that monetary savings remain the reason most customers cite
for their decision to switch43, as illustrated in Figure 11 below. This is consistent with
research into the reported drivers of switching undertaken as part of the Probe and
RMR.44 However, it is important to note that previous Ofgem analysis on price
sensitivity showed that while consumers do switch in response to relative prices, this
relationship is not particularly strong which suggests that, in practice, switching rates
are affected by a far wider range of factors than relative prices.45 Ofgem also found
that some consumers were switching to more expensive tariffs46, in particular PPM
consumers and consumers switching as a result of direct sales.
43 Ibid, p.25-26 44 Ofgem, RMR https://www.ofgem.gov.uk/electricity/retail-market/market-review-and-reform/retail-market-review 45 Ofgem, Probe, p.48 https://www.ofgem.gov.uk/ofgem-publications/38437/energy-supply-probe-initial-findings-report.pdf 46 Ofgem, Probe, p.50 https://www.ofgem.gov.uk/ofgem-publications/38437/energy-supply-probe-initial-findings-report.pdf
0%
5%
10%
15%
20%
25%
2008 2010 2011 2012 2013
Switched gas supplier in last year (Base: all gas consumers responsible for bills)
Switched electricity supplier in last year (Base: all electricity consumers responsible for bills)
Switched gas tariff/payment method in last year but not supplier (Base: All gas consumers not switched supplierin previous year)Switched electricity tariff/payment method in last year but not supplier (Base: all electricity consumers nowswitched supplier in previous year)

State of the Market Assessment
30
Figure 11: Main triggers for switching supplier
Source: Ipsos MORI, Customer Engagement with the Energy Market - Tracking
Survey 2013, p.76 and 80
Barriers to switching
3.20. Figure 14 below shows that while ‘I’m happy with my current supplier’
remains the principal explanation for not switching in 2013, mentions of this have
reduced significantly in comparison with 2012. The figures for both years might
appear high, given other evidence around low levels of trust. The broader evidence
base suggests that for many respondents this could be due to ‘status quo bias’ rather
than genuine satisfaction, as there is much evidence of consumers also displaying
apathy, reporting being unhappy with suppliers’ prices and service, and reporting low
levels of trust.47
3.21. Overall satisfaction with suppliers appears to be in decline with a 12
percentage point decrease over the last five years, with only 52 per cent being quite
or very satisfied as of the third quarter of 2013.48 The most recent figures show a
continuing decline. Customer complaints, show in Figure 12, remain high and have
increased by more than 50 per cent since the start of 2011.
47 As indicated in Ofgem Consumer Panel reports 2011-12 and Insight Exchange, Consumer research and collaborative engagement on the proposed Standards of Conduct – Domestic Customers, October 2012. 48GfK Energy Monitor, Q1 2008 - Q3 2013, GfK uses a panel of 12,000 households, demographically representative of the 26m households in Britain. Quarterly surveys monitor supplier switching and satisfaction. Data is unpublished but available on request.
75%
6% 6%4%
76%
5% 5% 4%
0%
10%
20%
30%
40%
50%
60%
70%
80%
Believed new supplier wascheaper/to save money
Moved home Believed new supplieroffered better customer
service
Wanted a dual fuel package
Main trigger for switching (Base: All who have gas/electricity and are responsible for bill and have ever switchedgas/electricity supplier (440/510))
Gas Elec

State of the Market Assessment
31
Figure 12: Complaints received per 100k customer accounts
Source: Supplier information
3.22. Moreover, a total of 43 per cent of consumers did not trust energy suppliers to
be open and transparent in their dealings with them in 2013, compared to 39 per
cent in the previous year.49 In 2013, nearly one in five consumers (18 per cent) said
they ‘completely’ distrusted energy suppliers in this regard; up five percentage
points from 2012 when only 13 per cent reported this.50
49 Ipsos MORI, Customer Engagement with the Energy Market - Tracking Survey 2013, p.52 50 Table 238 (2013 data set) and Table 156 (2012 data set) Ipsos MORI, Customer Engagement with the Energy Market – Tracking Surveys https://www.ofgem.gov.uk/publications-and-updates/consumer-research-datasets
-
1,000
2,000
3,000
4,000
5,000
6,000
7,000
8,000
9,000
10,000
Q4 2008 Q4 2009 Q4 2010 Q4 2011 Q4 2012 Q4 2013
Com
pla
ints
receiv
ed p
er
100k c
usto
mer
accounts
EDF E.ON Npower SSE Scottish Power Centrica Average

State of the Market Assessment
32
Figure 13: Trust in suppliers
Source: Ipsos MORI, Customer Engagement with the Energy Market - Tracking
Survey 2013, p.52
6%
28%
26% 26%
13%
2%
5%
25%
27%26%
18%
0%0%
5%
10%
15%
20%
25%
30%
Trust completely Tend to trust Neither trust nordistrust
Tend to distrust Distrustcompletely
Don’t know
Using the words here, please tell me the extent to which you trust or distrust energy suppliers to be open andtransparent in their dealings with consumers? (Base: All with mains electricity or gas and responsible for bills)
2012 2013

State of the Market Assessment
33
Figure 14: Reasons for not switching supplier
Source: Ipsos MORI, Customer Engagement with the Energy Market - Tracking
Survey 2013, p.22
3.23. Combined with confusion and a lack of trust in the information available, many
are left uncertain as to whether or not it will be beneficial to switch.51 Figure 14
indicates that some consumers feel there is no point in switching either because
‘there isn’t any difference between suppliers to make switching worthwhile’ (17 per
cent, up from 13 per cent in 2012) or say they have checked prices and believe they
are on the best deal (12 per cent, up from 9 per cent). Many consumers doubt that
switching could lead to the kind of benefit (financial savings and/or improved
customer service) that would justify their time and effort and the risk that things
could go wrong.
3.24. When asked for a minimum saving necessary to induce them to switch, non-
switchers reported a wide range, shown in Figure 15 below, with a median necessary
minimum saving of £94 per year reported.
51 Ipsos MORI, Consumer engagement with the energy market, information needs and perceptions of Ofgem, Findings from the Ofgem Consumer First Panel Year 4: second workshops (held in March 2012), October 2012, p.21
78%
20%
13%
9%
55%
27%
17%
12%
0%
10%
20%
30%
40%
50%
60%
70%
80%
90%
I’m happy with my current
supplier/s
Switching is a hassle I don’t think there is any
difference between the suppliers to make switching
worthwhile
I’ve checked prices of other
suppliers and I think I’m on the best deal
Reasons to have never switched gas or electricity supplier (Base: All who have never switched either)
2012 2013

State of the Market Assessment
34
Figure 15: Necessary and expected savings from switching
Source: Ipsos MORI, Customer Engagement with the Energy Market - Tracking
Survey 2013, p.8552
3.25. However, the difficulty in assessing information means potential savings are
not fully understood and often believed to be marginal despite evidence that average
savings could be around £100/year.53 In combination with regular price fluctuations
this creates uncertainty and low confidence as to whether or not it will be beneficial
to switch suppliers.54 The perception that the promised gains from switching are
rarely realised, for instance due to the new supplier putting up prices once a
consumer has switched, means few consider it worthwhile to switch.55
3.26. In addition, a survey conducted by Consumer Futures found that 26 per cent
of those who had switched (between April 2011 and April 2012) would not do so
again; while one reason for this was being happy with the new supplier, other factors
were less positive and included finding the process difficult or being disappointed in
the outcome (e.g. suspecting that they have ended up paying more). It also found
52 Please note that p24 and p32 of the report present percentages based just on those able to give a numerical answer 53 See Chapter 4 54 Insight Exchange, Consumer research and collaborative engagement on the proposed Standards of Conduct – Domestic Customers, October 2012, p.14; Ipsos MORI, Consumer First Panel Year 4: Findings from first workshops (held in October and November 2011), January 2012 p.22 55 Ibid.
14%
16%
13%
7%
36%
12%
8%
17% 17%
7%
40%
11%
0%
5%
10%
15%
20%
25%
30%
35%
40%
45%
0-£50 £51-£100 £101-£200 £201+ Don’t know Not about savingmoney
Reported necessary savings of those who have never switched (Base: All who have never switchedeither gas or electricity (882))Expected savings of those who have ever switched (Base: All who have ever switched either gas orelectricity (551))

State of the Market Assessment
35
those in the poorest social groups were much less likely to consider switching
again.56
Micro-business consumers
3.27. Overall, the market for business consumers is more competitive and there is
less evidence of a weak demand side. In particular, large industrial and commercial
consumers are more likely to be able to engage effectively with suppliers, either
directly or through a broker.
3.28. The 2013 Element Energy non-domestic survey57 found a relatively positive
picture both in terms of customer satisfaction and market engagement, with some
exceptions. For example, there was relatively low engagement with contracts across
all business sizes and some evidence of dissatisfaction with suppliers’ response to
customer queries. Micro-businesses58 reported lower engagement or satisfaction
compared to other businesses across a number of aspects. The Federation of Small
Businesses recently published a report on small business protections across a range
of sectors including energy59. This report also suggested that engagement and
satisfaction levels are lower among small businesses compared with larger non-
domestic customers, and that similar protections for domestic customers should
apply to them.
Barriers to engagement
3.29. Micro-businesses face a number of barriers to engagement, some of which are
similar to those faced by domestic consumers.60 For example they are:
less likely to have read over their contract in the last year (25 per cent,
compared to 29-30 per cent among other business sizes)
less likely to have switched suppliers (14 per cent reported switching in the last
year compared to 18-19 per cent among other business sizes; and 41 per cent
reported they had not switched in the last 5 years compared to 19 per cent
among large businesses)
more likely to cite complexity as a barrier to switching (26 per cent compared to
9-20 per cent among non-switchers from other business sizes)
56 43 per cent in the DE group compared to 17 per cent in the AB group, Consumer Futures, Switched on? Consumer experiences of energy switching, 2013 p.23-25 http://www.consumerfocus.org.uk/files/2013/01/Switched-on.pdf 57 Element Energy, Quantitative research into Non-Domestic Consumer Engagement in, and Experience of, the Energy Market, 2013 https://www.ofgem.gov.uk/publications-and-updates/quantitative-research-non-domestic-consumer-engagement-energy-market 58 Micro-businesses were defined as organisations with <10 full time employees in the survey 59 Small Business as Consumers: Are they Sufficiently Protected: A report for The Federation of Small Businesses. ESRC Centre for Competition Policy University of East Anglia, March 2014 60 Element Energy, Quantitative research into Non-Domestic Consumer Engagement in, and Experience of, the Energy Market, 2013

State of the Market Assessment
36
more likely to disagree that the process of choosing a new supplier was easy (16
per cent compared to 7-8 per cent in other business sizes, among those that
reported switching in the last five years)
3.30. Micro-businesses are the least likely of all business sizes to use a broker to
help them choose a contract (11 per cent compared to 16-23 per cent among other
business sizes).61 Instead, micro businesses are the most likely to choose their
contract by comparing quotes on a switching site, either online or by phone (30 per
cent compared to 16-24 per cent among other business sizes).
Outcomes for small businesses
3.31. The chart below shows average gas prices paid by non-domestic customers of
different sizes. They are highly correlated, but there is a consistent price disparity,
with prices lower the larger the customer. While prices may be lower because of the
economies of scale in supplying larger customers, and because they may bear more
of the risk of changes in wholesale prices compared to smaller customers, it may also
be evidence of more active competition for large customers.
Figure 16: Average domestic and non-domestic gas prices, p/kWh
Source: Non-domestic prices: DECC QEP. Non-domestic prices (excluding VAT) are
based on DECC survey of energy suppliers. Prices include the Climate Change Levy.
Domestic prices: Ofgem SMI as of November 2013, based on a consumption value of
15300 kWh, not adjusted for falling consumption over time, and excluding VAT.
61 Figures report use of a broker in choosing current tariff. Element Energy, Quantitative research into Non-Domestic Consumer Engagement in, and Experience of, the Energy Market, 2013
0.0
0.5
1.0
1.5
2.0
2.5
3.0
3.5
4.0
4.5
5.0
01/11/2011 01/05/2012 01/11/2012 01/05/2013
p/k
Wh
Domestic exc. VAT Very Small Small Medium Large Very Large Average

State of the Market Assessment
37
Consumers in vulnerable situations
3.32. Energy is an essential service and different consumers have different needs or
interests. Ofgem must have regard to the interests of vulnerable customers
including, but not limited to, those who are: disabled, chronically sick, of pensionable
age, on low incomes, and/or living in rural areas. In 2013 Ofgem established a
Consumer Vulnerability Strategy which recognises that vulnerability can be complex,
multi-dimensional and transitory.62
3.33. Evidence has shown that, different consumers are likely to face barriers to
engagement to varying degrees, depending on their knowledge, skills, resources,
experience or circumstances63 which may mean some consumers are significantly
less able to protect or represent their interests in the energy market and suffer
detriment as a result.
3.34. In Ofgem’s tracking surveys carried out to date, the most frequent switchers
are a relatively small group whose sample size does not bear detailed comparative
analysis. However, they can be broadly characterised as (for both fuels)
disproportionately likely to be direct debit payers, aged 35-64, ABC1 social grades,
white ethnic group, with internet access and not renting their homes.64
3.35. Conversely, those who say they have never switched supplier are more likely
to:
be on standard credit or prepayment
be from DE social grades
be from a BME group
live in rented accommodation
have no internet access
in comparison to those who have ever switched.65
3.36. Many of these trends are also born out in the annual switching rates reported
for 2012. The availability of internet access continues to be a major factor in the
switching of both fuels; those with internet access are significantly more likely to
have switched. For example, only 5 per cent of consumers without internet access
switched electricity supplier in 2012, as compared with 12 per cent of all electricity
consumers. Those not in rented accommodation are also more likely to have
switched each fuel in 2012, while switching among the rented sector is below the
national aggregate. Switching rates are much higher among direct debit customers
than among standard credit or pre-payment meter (PPM) customers for both fuels.
For example 7 per cent of PPM consumers said they switched gas supplier in 2012 as
compared with 13 per cent of direct debit gas consumers. 66 In addition, our
62 Consumer Vulnerability Strategy, July 2013 63 For example, the Consumer First Panel Report 2011 looked at differing indicators to establish that consumers were on a spectrum from proactive to disengaged and the drivers of these differences. 64 Ipsos MORI, Customer Engagement with the Energy Market - Tracking Survey 2013, p.13 65 Ipsos MORI, Customer Engagement with the Energy Market - Tracking Survey 2013, p.13 66Ipsos MORI Customer Engagement with the Energy Market – Tracking Survey 2013, p 11

State of the Market Assessment
38
evidence shows that even engaged PPM consumers who tried to take advantage of
the Debt Assignment Protocol and switch with a debt were largely unable to do so as
only 0.5 per cent of those that tried to switch succeeded.67
3.37. This suggests that consumers in vulnerable situations are disproportionately
represented in the group of consumers disengaged in the market. Ofgem’s research
shows that consumers in vulnerable situations are likely to encounter additional and
greater barriers to engagement.68
Remedies that may impact on this
RMR Remedies
3.38. Ofgem carried out extensive consultation on its RMR proposals as well as
conducting a significant amount of consumer research. In their responses to
consultations, suppliers (including independents) gave broad support for the aims of
RMR to create a more open, transparent and accessible energy market. However a
number of suppliers raised concerns with some of the details around the tariff
simplification rules arguing that they could inhibit innovation and their ability to price
differentiate which could ultimately reduce competition and consumer engagement.
3.39. By contrast some consumer groups argued that the reforms should go further
and for example that suppliers should be limited to tariffs structured with a single
unit price and no standing charge, to further aid comparability. Based on its
consumer research, testing different remedies with consumers, and on the balance of
all the evidence put to it, Ofgem concluded that its tariff reforms were proportionate
and would help address consumer concerns over complexity and confusion which
were inhibiting engagement.
3.40. In the meetings conducted as part of this assessment, we heard similar
comments and concerns to those raised in the RMR consultation process. A number
of the small suppliers were more explicit in saying that they felt that the RMR
reforms – and in particular the rules around discounts and bundles - made it more
difficult for them to innovate and compete in the market and that this would impact
negatively on consumer engagement. A number of small suppliers also noted that
the RMR proposals had already shifted the focus of competition onto fixed price deals
as suppliers were limited to offering four tariffs, with the risk that this could lead to
customers being locked in. They were also concerned that the requirement on
suppliers to highlight their lowest tariff could reduce engagement in the wider
market.
3.41. While not the primary concern, RMR rules were also cited by some potential
new entrants as making the market less attractive to enter. A white label provider
raised concerns that they would be restricted in what they could offer beyond the
end of 2014 if the RMR exemption for white label deals ends then (subject to the
results of a call for evidence Ofgem issued earlier this month). By contrast some
67 Domestic suppliers Social Obligations Reporting, 2013. 68 FDS International, Vulnerable customers research report, March 2011

State of the Market Assessment
39
small suppliers argued that low levels of consumer engagement and the ability of the
larger suppliers to target discounts on active customers acted as a barrier to entry
and acknowledged that RMR should help address these issues.
3.42. Consumer groups continued to question whether RMR went far enough and
Which? have recently published consumer research which they argue points to the
need for further simplification.
3.43. Ofgem recognises that there is a difficult balance to be struck between
simplifying tariffs to support consumer engagement and allowing for tariff innovation,
which is particularly important in a market where there is low inherent interest. As
noted above Ofgem weighed these considerations carefully in reaching its original
decision and has committed to monitor the impacts of RMR.
Change of Supplier Process
Ofgem has also investigated the change of the supplier process, recognising this can
form a barrier to switching suppliers and given consumer perceptions that this is a
risky and time consuming process. Industry has committed to halve the switching
time (currently over five weeks) within a year and Ofgem is consulting on a licence
change to require a faster and more reliable switching process. Ofgem is also
exploring the potential to move to next day switching with the advent of smart
metering.

State of the Market Assessment
40
4. Unilateral market power / tacit
coordination
Chapter Summary
There are many signs that competition in the supply of energy to consumers is not
working well for all consumers. There are also indications that things are getting
worse for consumers. In particular:
Prices are rising faster than costs (see Profitability chapter)
Customer dissatisfaction is increasing (see Consumer Engagement chapter)
Switching rates are in decline (see Consumer Engagement chapter)
Competition between suppliers may be restricted in two ways:
Unilateral market power exists where an individual firm has the ability to
profitably raise prices above competitive levels (or reduce the value of its offer to
consumers in other ways) independently of the behaviour of rival firms.
Tacit coordination is where firms in the market can anticipate each other’s future
actions and can tacitly establish a coordinated course of action (such as to raise
prices above competitive levels) without communicating directly or sharing
information.
We have found that both are resulting in worse outcomes for consumers.
Unilateral Market Power: overview
4.1. Figure 17 below shows how prices have changed over time for different types
of energy tariff. Customers on single-fuel tariffs with their incumbent suppliers
typically pay the higher prices for their energy than most other customers.69 The
cheapest single-fuel standard credit offline tariffs (for both single-fuel tariffs, or for a
dual fuel tariff) have typically been around £60-90 per year less than the combined
cost of both equivalent single-fuel incumbent tariffs. Online deals are often (but not
always) less expensive. Consumers paying by standard credit, supplied separately by
both incumbents (for gas and electricity), have typically been able to save between
£200-£300 per year by switching to the best online tariffs.70
69 DECC estimate that around 2.8 million households are not connected to the gas network. These households cannot access dual-fuel tariffs. DECC, Sub-national estimates of households not connected to the gas network, 2012. https://www.gov.uk/government/publications/sub-national-estimates-of-households-not-connected-to-the-gas-network 70 We note that some social and environmental policy charges only apply to suppliers with more than 250,000 accounts.

State of the Market Assessment
41
Figure 17: Comparison of the prices of a selection of single-fuel and dual-
fuel bills
Source: Ofgem analysis using Energylinx data
4.2. The single-fuel segment of the market comprises at least 3.6 million gas
accounts and 8.1 million electricity accounts.71 It is characterised by large shares of
supply for the six largest suppliers in their incumbent regions72 (c.70 per cent on
average) and despite the savings available to those customers, there are low levels
of consumer switching. Incumbent shares of supply are typically lower (c.30 per
cent) in the dual fuel segment of the market and dual fuel customers may be more
likely to switch away from their incumbent supplier. The biggest six suppliers have
relatively small shares of supply in the online segment of the market where
customers are most active. This is the segment of the market where small suppliers
have been most successful at winning customers.
4.3. There appear to be some relatively competitive parts of the market and there
are good deals out there for those consumers that switch. However, prices have
71 Ofgem calculations based on data provided by suppliers for regular Ofgem market monitoring. All market share information presented in this chapter is based on account numbers provided by the six largest suppliers only. It does not include other suppliers’ customers. These figures are therefore not directly comparable with market share figures elsewhere in this document that represent the whole market. All customers taking gas and electricity supply from the same supplier are counted as dual fuel customers 72 The big six suppliers inherited a stock of customers when the regional electricity monopolies and British Gas were privatised. Many single fuel customers have remained with their incumbent suppliers.
£500
£600
£700
£800
£900
£1,000
£1,100
£1,200
£1,300
2008 2009 2010 2011 2012 2013
Avera
ge a
nnual bill
Combination of incumbents' single-fuel standard credit offline tariffs (gas and electricity)
Combination of cheapest single-fuel standard credit offline tariffs (gas and electricity, offered by the six largestsuppliers)Cheapest dual-fuel direct debit offline tariff (offered by the six largest suppliers)

State of the Market Assessment
42
risen across all segments and even in the relatively competitive parts of the market,
if competition is diminished elsewhere, consumers may not enjoy the full benefits of
competition, such as efficiency improvements and innovation.
4.4. Ofgem identified concerns over unilateral market power in the Energy Supply
Probe in 2008 (the Probe). Ofgem’s Retail Market Review (RMR) in 2011 also found
evidence that there remained a proportion of inactive consumers and that energy
suppliers were able to charge them higher prices.
4.5. We look at whether the six largest suppliers enjoy unilateral market power in
more detail below. There is evidence that they do so in some parts of the market.
Large legacy customer base: from the six largest suppliers’ point of view, a
relatively large proportion of their customer bases are ‘legacy customers’. On
average, 28 per cent of the customer base of electricity incumbents are single-
fuel customers in their incumbent regions and a further 20 per cent are dual fuel
customers in their incumbent regions. For Centrica – whose incumbent region is
national - 28 per cent of its customers are single fuel gas customers and a further
65 per cent are dual fuel customers. Over time the proportion of legacy
customers is declining, but very slowly. We also note that not all single-fuel
customers are legacy customers.
High shares of supply in incumbent regions: from the market point of view,
41 per cent of gas customers and 37 per cent of electricity customers are with
their incumbent supplier for that fuel. 73 This is mirrored in the fact that the six
largest suppliers have relatively high shares of supply in their incumbent regions
for single fuel tariffs, on average around 70 per cent for both electricity and gas.
Their shares of supply in their incumbent regions are lower for dual fuel (25-35
per cent) and online (from 20 per cent – for dual fuel tariffs to 40 per cent –for
single fuel gas tariffs).
Higher prices: customers that take single-fuel products from their incumbent
suppliers typically pay higher prices than customers on other types of tariff from
that supplier. In addition, although suppliers’ own regional price differentials have
narrowed,74 legacy customers can typically still make some savings by switching
to other suppliers for the same type of tariff (eg savings of up to 10 per cent by
switching to other single-fuel products offered by the biggest six suppliers).
Low levels of customer activity: despite incumbent customers typically paying
higher prices than other customers, these incumbent customers generally switch
less.
4.6. The evidence for unilateral market power is strongest in the supply of single-
fuel tariffs. It has been difficult to gauge in this assessment the extent to which it
applies in other segments of the market.
73 DECC Quarterly domestic energy customer numbers, tables 2.4.1 (electricity) and 2.5.1 (gas), https://www.gov.uk/government/statistical-data-sets/quarterly-domestic-energy-price-stastics, last update 19 December 2013, figures for September 2013. 74 This refers specifically to single-fuel electricity standard credit tariffs.

State of the Market Assessment
43
Tacit coordination: overview
4.7. We have also found some evidence that tacit coordination may restrict
competition and contribute to the outcomes that we observe. We discuss this theory
of harm and the available evidence in more detail below.
4.8. As part of the Probe in 2008, Ofgem noted that suppliers take account of
competitor positioning, likely future behaviour and reaction when setting retail prices
but that there was no evidence of explicit coordination between the biggest six
suppliers. As part of the RMR, Ofgem identified that many features of the energy
retail markets may make coordination possible. Ofgem also found evidence that
suggested that suppliers tended to pass on price rises more quickly when costs
increased than when costs fell.
4.9. We have updated some of the RMR work, and carried out some new analysis.
We have found that many of the features previously identified have become more
entrenched.
4.10. For firms to successfully find and maintain tacit coordination, several
conditions need to be in place. We find that many are in place and that there are no
features of the supply of energy that appear to exclude the possibility of a tacitly
coordinated outcome.
4.11. We also looked at how the biggest six suppliers behave. We found aspects of
their behaviour that are consistent with possible tacit coordination between them.
With the data available to us at this stage we cannot say precisely which segments of
the market and which tariffs are likely to be most affected by tacit coordination. But
we did observe the following:
The intensity of competition between the six largest suppliers appears to
have diminished. We found that the rate at which the big six suppliers are
winning new customers has declined over time and that the margins earned by
them in the supply of energy to consumers have increased.
Price announcements tend to be aligned. Our analysis of price
announcements by the six largest suppliers shows that their announcements
have generally been similar both in the timing and the magnitude of the price
change over a number of years. This pattern would appear to be becoming more
entrenched. The six largest suppliers are also announcing prices longer in
advance of the date on which they come into effect.
Price rises in excess of cost. Prices for a number of popular tariff types (dual
fuel offline tariffs) have risen substantially over the 2009-2014 period (24 per
cent). The scale of these price rises is larger than can be explained by increases
in costs. This has resulted in higher profits for all of the six largest suppliers.
There is more detail about the relationship between costs and profit in the
Profitability chapter at the end of this document.

State of the Market Assessment
44
There appears to be an asymmetry in how suppliers respond to changes
in costs. We found that suppliers pass on cost increases more fully and more
quickly than cost decreases. The asymmetry we found was greater than when
Ofgem performed a similar exercise in 2011.
Unilateral Market Power – in detail
4.12. In this section we look more closely at whether there is evidence of unilateral
market power. A firm with market power would be able to charge prices above
competitive levels, independently of its customers and rival firms. This could be by
raising prices, or by lowering the quality of their offering.
4.13. To examine the evidence for any such behaviour, we looked at several
indicators and found the following:
Incumbent suppliers: the large incumbent suppliers still have a large base of
legacy customers, who are less active than customers in other parts of the
market.
Market shares: in the single-fuel part of the market, incumbent suppliers still
have high customer shares in their incumbent regions. Their shares of customers
in other regions and on other tariffs are lower.
Prices and switching incentives: generally, legacy single-fuel customers with
their incumbent suppliers still have some incentive to switch to cheaper tariffs,
even by switching to other single-fuel tariffs offered by the largest six suppliers.
They can save a great deal more by choosing different types of tariff.
Customer activity: despite paying higher prices, incumbent customers switch
less than customers in other market segments.
Legacy customers
4.14. When the electricity supply companies were privatised, customer accounts
with the former publicly-owned suppliers were transferred to what we now refer to as
the ‘big six’, or companies that have subsequently been acquired by them. All
customers were supplied on single-fuel tariffs. Today, many remain on single-fuel
tariffs and have never actively engaged in the market.
4.15. In total, around 2.6 million customer accounts have single-fuel gas tariffs with
their incumbent supplier, while around 5.3 million electricity customer accounts have
single-fuel electricity tariffs with their incumbent supplier.75 The number of
customers on single-fuel tariffs with their legacy supplier can give us an idea of how
75 Ofgem calculations based on data provided by suppliers for regular Ofgem market monitoring. All market share information presented in this chapter is based on account numbers provided by the six largest suppliers only. It does not include other suppliers’ customers. These figures are therefore not directly comparable with market share figures elsewhere in this document that represent the whole market. All customers taking gas and electricity supply from the same supplier are counted as dual fuel customers.

State of the Market Assessment
45
many customers have never been active in the market. However, some of those
customers may have actively chosen to stay with that supplier, may have switched
away and back again, or may have inherited their supplier through a house move.
4.16. A relatively large proportion of customers are supplied by an incumbent. 41
per cent of all gas customers and 37 per cent of all electricity customers are with
their incumbent supplier for that fuel (including both single-fuel and dual fuel
customers).76 This is most pronounced for standard credit customers, of which 57
per cent and 44 per cent of gas and electricity customers are with their incumbent
supplier.77 62 per cent of all consumers report never having switched gas or
electricity supplier.78
4.17. From the incumbent suppliers’ perspective, a large proportion of their
customers are in their incumbent regions (Figure 18). On average, for the five
incumbent electricity suppliers, incumbent-region single-fuel customers comprise 28
per cent of their customer base. 28 per cent of Centrica’s customer base is single-
fuel gas customers.79 Unless these customers have actively chosen those tariffs over
others in the market (see below), perhaps out of preference for their supplier, this
suggests that these incumbent region single-fuel customers are relatively less active
than those in other segments of the market.
76 DECC Quarterly domestic energy customer numbers, tables 2.4.1 (electricity) and 2.5.1 (gas), https://www.gov.uk/government/statistical-data-sets/quarterly-domestic-energy-price-stastics, last update 19 December 2013, figures for September 2013. 77 As above. 78 Ipsos MORI, Customer Engagement with the Energy Market – Tracking Survey 2013, p.12 79 Ofgem calculations based on customer account data provided by the six largest suppliers for regular Ofgem market monitoring.

State of the Market Assessment
46
Figure 18: Composition of legacy electricity suppliers’ customer bases
Source: Ofgem calculations based on supplier customer account data submitted for
Ofgem’s regular market monitoring activities, as at July 2013
28%
20%
52%
Single-fuel electricity customers (allare in incumbent region)
Dual-fuel customers (all are inelectricity incumbent region)
Single-fuel gas cutomers and out ofregion dual fuel customers

State of the Market Assessment
47
Figure 19: Composition of Centrica’s customer base
Source: Ofgem calculations based on supplier customer account data submitted for
Ofgem’s regular market monitoring activities, as at July 2013
4.18. On average, 48 per cent of the electricity incumbents’ customer base is made
up of customers in their incumbent region. This is, on average, 28 per cent single
fuel electricity customers and 20 per cent dual fuel customers. Centrica’ customer
base is made up of 28 per cent single fuel gas customers, and 65 per cent dual fuel
customers.80 It is more difficult to infer information about customer activity from
suppliers’ dual fuel customer base, because every dual fuel customer has switched at
least one fuel once.
Shares of supply
4.19. 8.1 million customers have single-fuel electricity tariffs with the largest six
suppliers, and 3.6 million have single-fuel gas tariffs with the largest six suppliers.81
4.20. In all regions, the incumbent supplier has retained a persistently high (albeit
declining slowly; at 1-2 percentage points per year) share of customers on single-
fuel supply. On average, the electricity incumbents hold a 69 per cent share of
80 Ofgem calculations based on data provided by suppliers for regular Ofgem market monitoring. 81 Ofgem calculations based on data provided by suppliers for regular Ofgem market monitoring.
28%
65%
7%
Centrica single-fuel gas customers
Centrica dual-fuel customers
Centrica single-fuel electricitycustomers

State of the Market Assessment
48
supply for single-fuel electricity customers in their incumbent region. Centrica has a
72 per cent share of supply for single-fuel gas customers.82
4.21. We would expect any advantage that incumbent suppliers have to be less in
parts of the market other than in single-fuel supply. To compare, the regional
electricity incumbent suppliers and Centrica have considerably lower shares of supply
for dual fuel customers in their ‘incumbent’ region or fuel (25 per cent and 34 per
cent respectively).83
4.22. The online market offers a further benchmark for comparison, one less
affected by incumbency. Online tariffs were not available at the beginning of market
liberalisation, so we can say that customers choosing online tariffs have indicated an
active choice of supplier. Accordingly, we examine the largest six suppliers’ share of
the total ‘online’ customers. In both single-fuels and dual fuel parts of the market,
legacy suppliers have lower market shares. This reflects less incumbency advantage
in that part of the market (see below). The incumbents’ share of supply for online
tariffs is between 30 per cent for electricity incumbents and 50 per cent (for
Centrica).
4.23. As expected, the difference between online and offline incumbent shares is
less marked for dual fuel tariffs, with incumbent shares of supply (for electricity
incumbents in their incumbent regions) of just under 35 per cent for offline dual fuel
and around 22 per cent for the online equivalent.84 The changes in these figures over
the past three years are shown in the chart below.
82 Ibid. 83 Ibid. 84 Ibid.

State of the Market Assessment
49
Figure 20: Incumbents’ shares of online customers versus offline customers
(in their ‘home’ regions) 85
Source: Ofgem analysis using Energylinx data
Prices
4.24. We examined whether there is evidence that suppliers are able to charge
higher prices to their incumbent or less-active customers. This is one indication that
suppliers may have a degree of unilateral market power. First we looked at the prices
of single-fuel products.
4.25. As illustrated in the chart below, customers that take single-fuel tariffs from
their regional incumbent electricity supplier and Centrica (for gas) typically pay
higher prices than those with single-fuel tariffs from other suppliers. Single-fuel
customers with their incumbent supplier could still save money even without
switching to a different type of tariff. This is generally up to £40/yr on average
across the country (and considerably more in some regions).
4.26. Our analysis shows a similar picture in gas. Centrica, the incumbent gas
supplier, has consistently charged higher prices for standard credit single-fuel gas
than the average offering from the other five largest suppliers. Generally this
difference has been at least £40/yr.86
85 Here we take the ‘incumbent’ dual fuel supplier as the legacy electricity supplier in the relevant region. 86 Ofgem calculations based on energylinx pricing data.
0%
10%
20%
30%
40%
50%
60%
70%
80%
90%
100%
2010 2011 2012 2013
Share
of re
levant
mark
et
segm
ent
Incumbent dual fuel (offline) Incumbent dual fuel (online)
Incumbent single-fuel elec (offline) Incumbent single-fuel elec (online)
Incumbent single-fuel gas (offline) Incumbent single-fuel gas (online)

State of the Market Assessment
50
Figure 21: Savings available to single-fuel customers paying by standard
credit, from switching to the best equivalent offering from the largest six
suppliers (highest, average and lowest regional saving)
Source: Ofgem analysis using Energylinx data
4.27. We note that licence conditions have, over the period in question, affected
suppliers’ own price differentials across their regions and between different payment
methods:
Ofgem introduced two licence conditions (in effect from September 2009): one
which requires any difference in the terms and conditions as between payment
methods to be cost reflective (SLC27.2A), and one prohibiting discrimination
between different groups of customers in respect of the key terms and conditions
of supply (SLC25A). These licence conditions may have reduced some price
differentials, in particular SLC25A when this was active. Ofgem also published
guidelines outlining that objective having different terms and conditions for
supply could include cost reflectivity, geographical considerations, payment
methods, initial offers, competitive advantage, innovation and materiality.87
87 Ofgem, Guidelines on cost reflectivity between payment methods and the prohibition of undue discrimination in domestic gas and electricity supply contracts, August 2009, https://www.ofgem.gov.uk/ofgem-publications/85032/2-19-guidelinesoncostreflectivityandunduediscriminationinsupply.pdf
0%
5%
10%
15%
20%
25%
30%
2008 2009 2010 2011 2012 2013
Savin
g
Saving in region with the highest saving Saving in the region with lowest saving
Average saving across all regions

State of the Market Assessment
51
SLC25A lapsed in July 2012 and Ofgem decided not to reinsert the condition in
October 2012.88
Licence condition 27.2A remains in place, which together with SLC 27.1
implements paragraph 1(d) of Annex 1 to the Gas and Electricity Directives,
requiring that customers are offered a wide choice of payment methods, which do
not discriminate between customers.
4.28. The tendency for incumbent single-fuel suppliers to charge generally higher
prices for their standard credit tariffs than other large suppliers in those regions is
emphasised when potential savings in single-fuel gas and single-fuel electricity are
combined. Together, the best single-fuel tariffs have generally remained around
£100/yr cheaper than the sum of the two incumbents’ single-fuel gas and electricity
tariffs. This can be seen in the chart below.
Figure 22: Incumbent tariffs (single-fuel electricity incumbent tariff +
single-fuel gas incumbent tariff) compared against the sum of the cheapest
single-fuel gas and electricity tariffs offered by the large incumbent
suppliers
Source: Ofgem analysis using Energylinx data
88Ofgem, Decision on Standard Condition 25A in the Gas and Electricity Supply Licences, October 2012 https://www.ofgem.gov.uk/ofgem-publications/74952/decision-standard-condition-25a-gas-and-electricity-supply-licences.pdf
£0
£50
£100
£150
£200
£250
£300
£0
£200
£400
£600
£800
£1,000
£1,200
£1,400
2008 2009 2010 2011 2012 2013
Diffe
rence
Avera
ge a
nnual bill
Combination of incumbents’ single-fuel standard credit offline tariffs (gas and electricity) (LH axis)
Combination of the cheapest single-fuel standard credit offline tariffs (gas and electricity, offered by the six largest suppliers)
Difference between incumbent combination & best combination (RH axis)

State of the Market Assessment
52
4.29. Incumbent customers appear to generally pay higher prices for their energy
and we cannot explain those higher prices through cost differences or differences in
quality. We therefore find those price differentials to be consistent with suppliers
having a degree of unilateral market power in single-fuel standard credit supply in
their incumbent regions.
Customer activity
4.30. We also examined customer activity levels, which can indicate what higher
prices tell us about unilateral market power. Customer activity levels alone are
difficult to interpret. For example, in some highly competitive markets prices adjust
very quickly, so that consumers may not need to switch to get a better deal.
However, given the evidence on low customer satisfaction levels in energy, this does
not appear to apply in this market. These issues are explored further in Chapter 3.
4.31. To help overcome these difficulties in interpreting switching levels, we directly
compare customer switching in different parts of the market (where barriers to
switching, such as the switching process, are the same). We investigate customer
response by looking at switching rates, expressed as monthly customer losses as a
proportion of the total number of each supplier’s customer base.
4.32. As we might expect, we find that switching levels are significantly lower
among single-fuel customers with their incumbent supplier than single-fuel
customers who are not with their incumbent supplier (across all payment methods),
in both gas and electricity. However, given the price differentials we observe, and
that each group of customers faces the same switching process, we would not expect
switching rates to be lower. We think this indicates that single-fuel customers with
their incumbent supplier are less active in the market than single-fuel customers not
with their incumbent supplier (in both gas and electricity). The lower level of
switching among this group also indicates that it is less likely to contain large
numbers of legacy customers that have switched away from their incumbent supplier
and then returned.

State of the Market Assessment
53
Figure 23: Average legacy electricity supplier single-fuel electricity
customer switching in their incumbent regions versus legacy supplier
single-fuel electricity switching in other regions
Source: Ofgem analysis using Energylinx data
0.0%
0.5%
1.0%
1.5%
2.0%
2.5%
3.0%
3.5%
4.0%
2010 2011 2012 2013
churn
per
month
in m
ark
et
segm
ent
Incumbent monthly churn (simple average) Non-incumbent monthly churn (simple average)

State of the Market Assessment
54
Figure 24: Average Centrica single-fuel gas customer switching versus
single-fuel gas customer switching for other legacy suppliers
Source: Ofgem analysis of supplier data, based on the number of customer accounts
4.33. Comparisons of switching rates among the larger suppliers show that
generally customer switching is lowest among dual fuel customers with the largest
suppliers (compared to single-fuel customers with those suppliers). This reflects the
movement of customers over time from single-fuel tariffs to dual fuel tariffs, and
hampers comparison of switching between those parts of the market.
0%
1%
2%
3%
4%
5%
6%
7%
2010 2011 2012 2013
churn
per
month
in m
ark
et
segm
ent
Incumbent monthly churn (simple average) Non-incumbent monthly churn (simple average)

State of the Market Assessment
55
Figure 25: Overall switching rates in single-fuel electricity, single-fuel gas
and dual fuel
Source: Ofgem analysis of supplier data
4.34. A number of stakeholders have told us that the online segment of the market
is more competitive and that customers in this part of the market are more active.
Customer switching data appears to support this. The best online tariffs available in
the market (including non-legacy suppliers) have been consistently cheaper
(generally by at least £150) than the best dual fuel standard credit tariffs offered by
the legacy suppliers, as shown above. Some, but not all, of this difference is
accounted for by the difference in cost between standard credit and direct debit
tariffs. We do not have current information on the cost differences between direct
debit tariffs and online tariffs.
4.35. We therefore use the online part of the market as a comparator for the level
of switching in other parts of the market. In single-fuel supply the largest suppliers
face significantly higher customer switching for their online customer base than for
their standard tariff base.
0.0%
0.5%
1.0%
1.5%
2.0%
2.5%
3.0%
2010 2011 2012 2013
% c
hurn
per
month
in m
ark
et
segm
ent
Overall churn single-fuel elec Overall churn single-fuel gas Overall churn dual fuel

State of the Market Assessment
56
Figure 26: Single-fuel online customer churn versus single fuel standard
customer churn
Source: Ofgem analysis of supplier data
4.36. This pattern does not seem to repeat for the dual fuel customer base of the
largest suppliers, in which there is little difference in churn between standard
customers and online customers. As above, any customers switching between these
segments would distort this comparison.89
89Further, in some cases suppliers’ data on online customer accounts appears less reliable than data for their standard accounts.
0%
2%
4%
6%
8%
10%
12%
14%
2010 2011 2012 2013
churn
per
month
in m
ark
et
segm
ent
Single-fuel elec std tariff churn (%/mth) Single-fuel elec online tariff churn (%/mth)
Single-fuel gas std tariff churn (%/mth) Single-fuel gas online tariff churn (%/mth)

State of the Market Assessment
57
Figure 27: Largest suppliers’ churn for standard and online dual fuel
customers
Source: Ofgem analysis of supplier data
Other market segments
4.37. Other than single-fuel standard credit supply, there may be other market
segments where suppliers may have a degree of unilateral market power. In the time
available, we have not examined each of those segments in detail. Ofgem has
previously carried out work on those areas, as briefly summarised below.
4.38. Many customers pay using prepayment meters (16 per cent of electricity
customers and 15 per cent of gas customers).90 The Probe identified concerns with
the high premia for PPM and standard credit. We note that suppliers are subject to
licence condition SLC 27.2A, relating to price differentials between payment methods
(as described above). Ofgem is reviewing companies’ compliance with these
obligations and will report back on its findings in April.
4.39. Approximately three million electricity customers (around 10 per cent of the
market) have meters with fixed time-switching mechanisms, that separately record
consumption for two periods of the day. For these customers, all of the largest six
suppliers offer tariffs that charge different prices at different times of day (such as
‘Economy 7’ or ‘Economy 10’ tariffs). Consumer Futures have raised concerns that 38
90 DECC, Quarterly domestic energy price statistics, tables 2.4.2 (for electricity) and 2.5.2 (for gas), data from latest update at time of writing, refers to September 2013 https://www.gov.uk/government/statistical-data-sets/quarterly-domestic-energy-price-stastics
0.0%
0.5%
1.0%
1.5%
2.0%
2.5%
3.0%
2010 2011 2012 2013
% c
hurn
per
month
in m
ark
et
segm
ent
Average dual fuel offline churn (all largest suppliers, all regions)
Average dual fuel online churn (all largest suppliers, all regions)

State of the Market Assessment
58
per cent of Economy 7 customers do not have storage heating and hence may be on
the wrong sort of tariff.
4.40. Around 550,000 customers have dynamically-teleswitched tariffs, designed for
those with electric heating, typically with no access to mains gas. These tariffs have
lower rates overnight (and sometimes for particular periods of the day), but require
a specific meter to operate. In July 2013 Ofgem published an update for customers
on those tariffs. 91 The report noted the very high market share (over 90 per cent) in
North and South Scotland of the incumbents but concluded that despite some issues
identified in the report, dynamically-teleswitched tariffs generally compare
favourably with other tariffs in the analysis.92
Non-domestic market
4.41. The different features of the non-domestic market mean we are less
concerned about the possibility of unilateral market power. First, the supply market
is less concentrated than domestic (see Chapter 5).
4.42. Second, the prevalence of fixed-term contracts also leads us to be less
concerned about unilateral market power.93 These act as a natural trigger for
businesses to consider their options when the contract is coming to an end. As of
April 2013, 81 per cent94 of electricity meter points for micro-businesses were
supplied on fixed-term contracts. Currently, if a micro-business customer does not
negotiate a new contract or switch supplier at the end a fixed-term contract they can
be automatically rolled over onto a new (often higher-priced) contract for a
maximum of 12 months. Around a quarter of micro-businesses are on fixed-term
contracts that have been rolled over.95 However, this market is likely to change in
the near future, as five of the six largest suppliers have announced they will no
longer offer fixed-term automatic rollover contracts to their small business
customers.96
4.43. Third, third-party intermediaries (TPIs) represent an important route to
market for larger non-domestic consumers, helping them to find a suitable new
contract when they approach the end of their fixed-term agreement. Consumers and
other stakeholders have raised concerns about the conduct of some TPIs which led
Ofgem to develop proposals for regulation which were published in February 2014.97
91 Ofgem, The state of the market for customers with dynamically-teleswitched meters’, Ofgem, July 2013, https://www.ofgem.gov.uk/ofgem-publications/82288/state-market-customers-dynamically-teleswitched-meters.pdf 92 Ibid. 93 Ofgem has expressed concern about the potential harm caused by automatic contract rollovers that are often associated with fixed-term contracts in the non-domestic market. It has proposed initial remedies to improve communications that suppliers send to customers (and their timing) at the end of a fixed-term contract. 94 Para 1.2, Appendix 4, p40, Ofgem, Proposals for non-domestic automatic rollovers and contract renewals, February 2014, https://www.ofgem.gov.uk/ofgem-publications/86071/automaticrolloversconsultationfinal.pdf 95 Para 2.3, p11, Ibid. 96 Table 1.1 , p8, Ibid. 97 Ibid.
State of the Market Assessment
59
Tacit coordination: in detail
4.44. When a market is sufficiently stable and rival firms interact repeatedly, such
as through price announcements, they may be able to anticipate each other’s future
actions. They can then establish a coordinated course of action without
communicating directly. Firms do not have to behave this way all the time to affect a
market. For example, periods of tacit coordination may be interspersed with periods
of greater competition.
4.45. We have examined tacit coordination, rather than any explicit forms of
coordination which would fall to be considered under Chapter I prohibition of the
Competition Act 1998 and the prohibition set out in Article 101 of the Treaty of the
Functioning of the European Union. We have not received any information or
evidence during the course of this assessment which might have led us to consider
further whether there are any agreements or concerted practices between the parties
which may prevent, restrict or distort competition.
4.46. For any form of tacit coordination to be possible and sustainable, there needs
to be sufficient transparency of firms’ actions; each firm needs to find coordinating
more profitable than not coordinating; and the coordinated outcome has to be
unthreatened by potential new entry. Research suggests that the conditions most
conducive to coordination are: firm similarities, market transparency and relatively
stable demand and cost conditions.98
Conditions for coordination
4.47. To understand whether the right conditions for coordination exist, we looked
at whether the market shows signs of any of these characteristics,99 in accordance
with OFT guidance.100
4.48. In line with Ofgem’s assessment in RMR, we found that conditions for
coordination are prevalent in the supply markets for gas and electricity. In particular,
conditions exist that would allow suppliers to achieve, monitor and sustain
coordinated outcomes. We discuss these conditions in more detail below.
Firm symmetry: where there is symmetry between firms it is easier for them to
find a mutually profitable coordinated outcome and that outcome is likely to be
more stable. Firms will face similar incentives and will react to shocks in similar
ways. We note that the six large suppliers share a number of similarities: they
are all vertically integrated; their shares of supply at a national level are broadly
similar (although Centrica has a larger share of the supply of gas).
Transparency: when firms can observe each other’s behaviour it is easier for
them to establish a jointly profitable strategy and easier to maintain that strategy
98See European Commission, Assessment criteria for distinguishing between competitive and dominant oligopolies, Enterprise papers No. 6, 2001 (A report prepared by Europe Economics, London). 99 This list is not exhaustive and other market characteristics may also be relevant. 100 paragraphs 5.5 to 5.7 OFT 511, Market Investigation References Guidance about the making of references under Part 4 of the Enterprise Act, March 2006

State of the Market Assessment
60
because they can identify whether their rivals are following the coordinated
outcome. We think that the supply of energy is sufficiently transparent: the six
large suppliers regularly announce their pricing intentions and can easily see the
prices being offered to consumers by their rivals.
Market stability: market instability can sometimes disrupt a coordinated
outcome. For example, in a fast-growing market, firms might have greater
incentives to undercut their rivals to take advantage of the large number of new
customers entering the market. Where demand in a market is unstable, firms
may be uncertain about whether a loss of customers is due to their rival
undercutting them or because demand overall has fallen. We note that in the
supply of energy: market shares are relatively stable over time, demand overall
is fairly predictable and the smaller firms offer only a limited competitive threat
to the six largest suppliers.
Entry: an attempt to coordinate and raise prices (or reduce the value of the
customer offer in other ways) will not be successful if it leads firms outside the
market to enter on a sufficient scale to render the price rise unprofitable. As the
chapter on barriers to entry and expansion describes, the likelihood that a major
new entrant can materially disrupt the market is limited at this stage.
4.49. We also note several factors that might, in principle, undermine tacit
coordination. We do not believe that these factors are sufficient to preclude a
coordinated outcome. This is for the following reasons:
The difference in generation portfolios and capacity between the six large
suppliers could potentially make coordination more difficult if it caused them to
react differently to shocks or gave some firms an incentive to deviate from
coordinated behaviour.
There is some short-term volatility in demand for energy. This could disrupt
coordination, for example if a reduction in demand leads some of the suppliers to
suspect that one firm had deviated from coordination and cut its price to ‘steal’
customers from the other firms. But short-term fluctuations in demand are
largely driven by changes in the weather and so are both transparent to all firms
and at least to some extent predictable.
In the past, wholesale electricity and gas costs have been volatile. This could
disrupt coordination if these fluctuations affected firms in different ways and lead
to some having a strong incentive to deviate from the coordinated outcome. We
note that wholesale energy costs have been quite stable since 2008.
Notwithstanding the issues identified around market liquidity, wholesale energy
prices are relatively transparent, represent a significant proportion of suppliers’
costs and affect all of the six large suppliers in similar ways. It is not clear that a
movement in wholesale energy costs would cause one of them to behave
differently from the others.
Collective switching could disrupt a coordinated outcome if buyer groups were
large enough to exercise buyer power. However, collective switching is a new

State of the Market Assessment
61
development which is still too small-scale to provide a level of buyer power which
might be capable of disrupting a coordinated outcome.101
4.50. Although we believe that the conditions are in place for a tacitly coordinated
outcome in the supply of energy to consumers, this does not necessarily mean that
tacit coordination is happening. So we looked at the behaviour of the six biggest
energy suppliers and market outcomes for a better indication.
Supplier conduct
4.51. To judge how competition occurs in the retail energy markets we looked at:
Indicators of competitive intensity
Supplier pricing behaviour
o Price announcements
o Cost-pass through
Indicators of competitive intensity
4.52. An effective and vibrant competitive market is one where firms strive to
outperform each other on price, quality and innovation to attract and retain
customers. Where a firm is fighting hard to win new customers, we might expect this
to show up in its switching statistics and its margins. So an aggressive growth
strategy might result in lower margins as a result of low prices and high switching
rates as the low prices attract more new customers. In this context, the rates of
switching and margin information can indicate a firm’s competitive strategy relative
to its rivals.
4.53. We find that, apart from a spike in late 2013, switching rates have declined
overall and that the margins of the biggest six suppliers have increased. Some of this
decline is related to the withdrawal of doorstep selling.102 This may show that the
intensity of competition between the big six has declined overall. We think that the
spike in switching may have been caused in part by the extensive media and political
interest in the recent price rises, and cannot be sure that this is the start of a
sustained trend.
4.54. We also looked at the level of switching at the level of individual firms. Figures
8 and 9 below show the rate at which individual suppliers have been winning
customers over the same period. We note that the rate of customer acquisition for
the six large suppliers has declined and converged over the period, but that the small
suppliers have begun to win more customers.
101 For example The Big Switch organized by Which? resulted in 40,000 accounts being switched. 102 There have been several regulatory interventions in relation to sales and marketing of energy products over the last 15 years by way of enforcement action against suppliers (2000, 2002, 2009, and between 2010 and 2012). Npower, EDF, BG and SSE ended unsolicited doorstep selling of gas and electricity contracts in 2011 while E.ON and SP followed in 2012.

State of the Market Assessment
62
Figure 28: New gas customers as a proportion of all gas customers 2004 to
2013
Source: Xoserve information request
Note: in this figure, switching is defined as the number of the six largest suppliers’
gas customers who have switched to that supplier in that year, as percentage of all
gas customers. This is a different basis to the figures for switching in Chapter 3
0.0%
0.5%
1.0%
1.5%
2.0%
2.5%
3.0%
3.5%
4.0%
4.5%
5.0%
2004 2005 2006 2007 2008 2009 2010 2011 2012 2013
Smaller suppliers Centrica E.ON Npower SSE Scottish Power EDF

State of the Market Assessment
63
Figure 29: New electricity customers as a proportion of all electricity
customers 2004 to 2013.
Source: DNO information request
Note: in this figure, switching is defined as the number of the six largest electricity
suppliers’ customers who have switched to that supplier in that year, as percentage
of all electricity customers.
4.55. The figures show that switching rates experienced by the six largest suppliers
have been converging from about 2008 for both gas and electricity, and are now all
within a range of one percentage point.
4.56. One interpretation of these trends is that unlike small suppliers, the six largest
suppliers are not competing as hard as they did in the past to win customers from
each other. This is something we would expect to see in a market with tacit
coordination. Switching rates could also be low in a very competitive market where
most customers are happy with their suppliers. However, other evidence in this
report, including the evidence on complaints and increasing prices (as documented
below), does not suggest that this is the case.
4.57. We also note that retail profit margins of the six largest suppliers have
converged over the same period as illustrated below. This may be consistent with the
public announcements by these suppliers that they are targeting a five per cent
margin on sales. For example, on its website, Centrica says: ‘British Gas profit from
supplying energy to people at home has remained broadly flat, averaging five per
0%
1%
2%
3%
4%
5%
6%
7%
2004 2005 2006 2007 2008 2009 2010 2011 2012 2013
Small Suppliers Centrica E.ON Npower SSE Scottish Power EDF Energy

State of the Market Assessment
64
cent after tax over the past six years’, and that it believes this to be ‘a fair return
when compared to similar industries such as telecoms, where margins average ten
per cent.’103 SSE says its retail supply margin has averaged four per cent over the
last three years, and is targeting a margin of five per cent in the medium term.104
Figure 30: Domestic supply margins 2009 to 2012
Source: Consolidated Segmental Statements
4.58. This chart shows:
the overall industry domestic supply profit margin has increased from about 0.9
per cent in 2009 to just under 4.3 per cent in 2012;
the margins of the firm with the most profitable supply business (Centrica) have
been relatively stable over the period. Four of the other firms have seen an
improvement in their margins; and
there is only one supplier – EDF – whose supply profit margins are well below the
industry average in large part because of higher than average indirect costs. We
discuss this further in Chapter 6.
103 http://www.centrica.com/files/pdf/centrica_energy/key_facts_centrica_britishgas.pdf 104 http://www.sse.com/uploadedFiles/Controls/Lists/Press_releases/Press_releases/2013/SSE_Full-Year_Results2013.pdf
-10%
-8%
-6%
-4%
-2%
0%
2%
4%
6%
8%
10%
2009 2010 2011 2012
Aggregate Centrica E.ON EDF Npower SP SSE

State of the Market Assessment
65
Recent trends in prices
4.59. The chart below shows dual fuel customer price data for each supplier from
2004, the longest period for which the data is available. This price data is different
from average bill data shown elsewhere as it takes out the trend of decreasing
consumption to focus only on price changes.
Figure 31: Average dual fuel direct debit offline prices by supplier 2004 to
2013
Source: This chart displays UK average nominal prices of the biggest six suppliers’
annual standard direct debit dual fuel bill for the period between January 2004 and
December 2013. The monthly prices are sourced from Energylinx for a domestic
consumption level of 3300 kWhs of electricity and 16500 kWhs of gas per year
4.60. From this we can see a sustained long-term trend of increasing prices
punctuated by few periods when prices fell. The average price of standard dual fuel
direct debit tariffs increased by about 24 per cent over the five-year period 2009-
2013. We looked to see whether this scale of price rise might be justified by
increases in costs over the period. Our analysis of CSS data showed that between
2009 and 2012 unit revenues in the supply of energy to domestic customers by the
six largest suppliers increased by 16.9 per cent whereas unit total costs increased by
13 per cent.
Analysis of price announcements
4.61. Suppliers’ price announcements may improve efficiency in the market by
reducing customers’ search costs, and by allowing suppliers to benchmark their
0
200
400
600
800
1,000
1,200
1,400
1,600
2004 2005 2006 2007 2008 2009 2010 2011 2012 2013
£/c
usto
mer/
year
Centrica E.ON EDF Npower ScottishPower SSE

State of the Market Assessment
66
performance with their competitors’. However, they can also function as signals
through which suppliers can communicate their intentions towards price, and thereby
coordinate.
4.62. Many aspects of the price announcement behaviour described below are
consistent with how academic literature expects firms to behave in collusive
industries or with behaviours observed in past cases of coordination.
Changing prices in well-defined rounds of price changes in which all firms
participate has been found in a number of industries where there has been
coordination.105
The narrowing of the gap over time between the size of price announcements by
firms leading rounds of price changes and those who follow may indicate that
coordination is becoming more successful. Announced price changes of a similar
magnitude by leaders and followers feature in many collusive price leadership
models in the academic literature.106
The increasing speed with which firms adhere to price changes in a round may
also show that coordination is becoming more successful. The academic literature
has long recognised that in industries where firms tacitly or explicitly coordinate
pricing behaviour, faster adherence to price changes within a round signifies
more successful coordination.107
Growing lead times between announced price changes and ‘effective-by’ dates
may allow coordination among competitors, in that lead times for the effective
dates of public price announcements enable the firms to monitor acceptance of
the price increase and retract an announced increase that is heavily resisted by
buyers or might lead to big changes in market shares.108
4.63. We have considered how the price announcements by the six largest suppliers
compare against the above behaviours.
Suppliers’ pricing behaviour: price announcements in retail markets
4.64. There is considerable transparency on price changes in the retail markets. The
biggest six suppliers announce their price changes broadly around the same time and
price rises attract considerable public attention. While price changes tend to be
different for customers on different tariffs, headline announcements in the media
typically refer to a single, average figure for each fuel. Price announcements, then,
are a particularly informative measure, because through them, energy suppliers
105 Examples include “sorbets, monochloroacetic acid and organic peroxides, polyester staple, high pressure laminates, aminoacids, carbonless paper, cartonboard, and graphite electrodes, see Kovacic, William E., et al. "Plus factors and agreement in antitrust law." Mich. L. Rev. 110 (2011): 393. Page 396. 106 See eg Rotemberg, Julio J., and Garth Saloner. "Collusive price leadership." Journal of Industrial Economics 39.1 (1990): 93-111. Or D’Aspremont, Claude, et al. "On the stability of collusive price leadership." Canadian Journal of economics 16.1 (1983): 17-25. 107 See e.g. Stigler, George J. "The kinky oligopoly demand curve and rigid prices." The Journal of Political Economy 55.5 (1947): 432. 108 Kovacic, William E., et al. "Plus factors and agreement in antitrust law." Mich. L. Rev. 110 (2011): 393. Page 419

State of the Market Assessment
67
condense complex tariff adjustments in a single figure for gas and electricity that can
be monitored by customers and competitors, and to which both customers and
competitors can react.
4.65. In 2008, as part of the Probe, Ofgem saw evidence from internal company
documents that showed that suppliers took account of competitor positioning, likely
future behaviour and reaction when setting retail prices. In particular, decisions on
the timing and, on occasion, the size of any price adjustments was determined in
relation to the perceived market leaders in each region. Several firms’ business plans
stated that they wait until competitors have announced their price changes, not just
to avoid the adverse publicity of going first with a price rise, but to assess the extent
of their own price adjustment.
4.66. The chart below shows the pattern of suppliers’ price announcements between
2004 and 2014. For presentation purposes, we have averaged gas and electricity
price changes for each supplier. Red circles indicate price increases and white circles
indicate decreases. The size of the circle is proportionate to the size of the
announced price increase.
Figure 32: Average of gas and electricity price changes
Source: Analysis of public price announcements by the six largest suppliers.
Announced price changes represented above are arithmetic averages (ie percent
gas change plus percent electricity change divided by two). Firms generally
change both gas and electricity prices at the same time. No firm in the dataset
has increased prices in one fuel and decreased in the other. However, in three
out of four rounds of price decreases (January 2009, January 2010 and January
2012) all firms reduced prices on either electricity or gas, leaving the price of the
other fuel unchanged.

State of the Market Assessment
68
The chart refers to price changes as publicly announced by the six largest
suppliers. Companies generally only break down price changes by gas and
electricity. Price changes may affect customers in different regions or on different
tariffs differently.
4.67. It appears that from about 2006 onwards, price announcements start to take
place in identifiable rounds. Of the 16 price rounds, 12 were associated with price
increases (average over electricity and gas) while four were associated with price
decreases.
4.68. Our more detailed examination of the data suggests the following broad
trends around price announcements:
the announced price changes have become more similar in size between different
suppliers over time, although there has been no evidence of a single supplier
consistently taking the lead in announcing price changes, with others following
(see figure 33 below)
Prices charged by different suppliers appear to be strongly correlated over time.
We found that the correlation between firms’ price changes and price changes of
competitors that preceded the firm during the period of price announcements are
high – 0.93 for gas and 0.84 for electricity.
there has been an increase in time elapsed between a price change’s
announcement date and ‘effective-by’ date, which is partly explained by Ofgem’s
requirement that suppliers have to announce price rises at least 30 days before
they’re effective, to give consumers time to switch (see figure 34)
the time elapsed between individual price announcements within the same round
shows a decline until 2006, after which there is no clear increasing or decreasing
trend.

State of the Market Assessment
69
Figure 33: Average difference between price change by round leader and
follower’s price changes.
Source: Analysis of public price announcements by the six largest suppliers.
4.69. The chart above shows the average difference between the magnitude of price
announcements of ‘follower’ firms and the price announcement of the firm initiating
the round of price changes.109 It shows a declining trend over time. It should be
noted that:
The blue line shows the average difference of the magnitude of the followers’
price announcements from the magnitude of the leader’s price announcement.
The vertical black lines show the range of the announcements within that round,
measured as the difference from the magnitude of the leader’s price
announcement.
The data is in percentage points: so for example in round 5 (the round with the
greatest dispersion) one follower announced a price that was 10 percentage
points higher than the leader, and one 2 percentage points lower. On average in
round 5 the followers announced a price rise that was just over 4 percentage
points higher than the leader (or first mover).
109 Differences are in percentage points, so if the leader changed prices by 10 per cent and follower changed their prices by five per cent, the percentage point difference is five per cent
-6%
-4%
-2%
0%
2%
4%
6%
8%
10%
12%
1 2 3 4 5 6 7 8 9 10 11 12 13 14 15 16Per
cen
tage
pri
ce d
iffe
ren
ce (
aver
age;
ran
ge)
Round of price announcements

State of the Market Assessment
70
In round 16, four firms initially increased prices during October – November
2013, and then announced price decreases in December-January, following
changes to environmental levies. To account for this, in round 16 we summed the
announced price changes of companies that announced first price increases and
then announced price decrease.
Figure 34: Average time (in days) elapsed between announcement date and
‘effective by’ date110
Source: Analysis of public price announcements by the six largest suppliers.
110 Ofgem introduced a rule in April 2011, before round 13 which required suppliers to give their customers 30 days’ notice of any price rise.
0
10
20
30
40
50
60
1 2 3 4 5 6 7 8 9 10 11 12 13 14 15 16
Tim
e e
lapsed (
in d
ays)
Round of price announcements

State of the Market Assessment
71
Figure 35: Announced price changes: energy suppliers’ reaction times (in
days)
Source: Analysis of public price announcements by the six largest suppliers.
Average difference in days within each round between the price announcement of
each firm and the date of the preceding price announcement in that round.
4.70. It is important to note that there may be alternative explanations for why
these trends in price announcements have occurred. Products supplied are
undifferentiated, and a significant proportion of costs (such as wholesale energy
costs, environmental and social policy costs, and network charges) are similar
between suppliers. We look in more detail at supplier costs in the chapter on
profitability.
4.71. Media and political attention around price rises may also be encouraging
coordination of price announcements into identifiable rounds. This results in
coordinated timing of announcements without direct communication between the
firms. This may help explain why announcements have been made in quick
succession, although not the size of price changes.
Price announcements and underlying cost movements
4.72. We also looked at how the probability of a price announcement changes over
time to assess whether there was any evidence that might be consistent with
0
5
10
15
20
25
30
35
40
1 2 3 4 5 6 7 8 9 10 11 12 13 14 15 16
Avera
ge d
iffe
rence (
in d
ays)
Round of price announcements

State of the Market Assessment
72
coordination. In a competitive market we might expect the likelihood of a price
announcement to be related to accrued changes in demand and cost conditions since
the last price announcement. If demand and cost conditions do not change then we
would not expect prices to change. If large cost or demand changes have built up we
might expect a higher probability of a price announcement.
4.73. We collected data on changes in demand by looking at movements in average
temperatures111, we also used Ofgem SMI data on the suppliers’ wholesale costs. We
used this data to predict the probability that there would be a price announcement in
any one month. We found that accumulated changes in demand and cost do indeed
increase the probability that there will be a price announcement. However we also
found that there was a significant additional effect from the time elapsed since the
last price announcement, even once demand and cost movements have been taken
into account. This implies that there would be price announcements over time even if
demand and costs remained static.
4.74. This pattern may be consistent with coordination as firms move from
competitive prices towards the higher prices associated with a coordinated
equilibrium and we note that this pattern has been shown to be consistent with
coordinated behaviour in other industries112.
Suppliers’ pricing behaviour: asymmetric price response to cost changes
(‘rocket and feather’)
4.75. We carried out analysis to test whether energy prices rise more quickly in
response to increases in supplier costs, than they move downwards in response to
falling costs. This is often referred to as ‘rocket and feather’ analysis. In a
competitive market, we may expect cost changes to be passed through to consumers
promptly, irrespective of whether costs are increasing or falling.
4.76. There are many reasons why prices may shoot up (like a rocket) and fall
gradually (like a feather). Some of these may show a lack of effective competition
between suppliers, including tacit coordination, while others may not. We were told
that media attention around price rises might cause firms to delay making price
rises.
4.77. Ofgem looked at this in 2011 and found evidence that suggested that
customer energy bills respond more rapidly to rising supplier costs compared with
falling costs. We have updated Ofgem’s analysis using more recent data to assess
whether this asymmetry is still present.
4.78. For this exercise, we collected monthly pricing data113 for a representative
medium energy consumer114 on the most common dual fuel tariffs115 from January
111 Measured using the difference between current heating degree days and the long term average. 112See Robert C. Marshall, Leslie M. Marx, and Matthew E. Raiff (2008) 113 Source: Energylinx 114 A representative medium energy consumer is defines as a user requiring 3300 kWhs of electricity and 16500 kWhs of gas per year. 115 Dual Fuel Standard tariff with a Direct Debit payment method

State of the Market Assessment
73
2004 to December 2013 for the six largest suppliers in the retail market. The price
data is a national average of regional prices for the standard tariff and it has been
weighted by the market shares of each company.
4.79. The cost data includes Ofgem’s estimate of wholesale cost (SMI data) as well
as other relevant costs. The wholesale cost is calculated assuming a hedging strategy
of 18 months, reflecting a typical supplier’s hedging profile. It has been adapted to
assume constant consumption. Other costs include environmental costs (Community
Energy Saving Programme (CESP), Carbon Emission Reduction Target (CERT)/
Energy Efficiency Commitment, Energy Companies Obligation (ECO)), environmental
certificates (Renewable Obligation Certificate), network and balancing costs (network
charges, Balancing Services Use of System (BSUoS) and electricity imbalances costs)
and metering costs.
4.80. The chart below shows movements in supplier cost data and customer bill
data (as defined above) from 2004 onwards.
Figure 36 – Prices, costs and margins
Source: This chart displays UK average nominal prices of the biggest six suppliers’
annual dual fuel bill for the period between January 2004 and December 2013. The
monthly prices are sourced from Energylinx and calculated for a standard tariff with
monthly direct debit payment method for a domestic consumption level of 3300
kWhs of electricity and 16500 kWhs of gas per year. No adjustment has been made
for the observed trend of declining consumption, and “total cost” includes wholesale
costs and other costs (environmental and network costs) but does not include
-£200
£0
£200
£400
£600
£800
£1,000
£1,200
£1,400
2004 2005 2006 2007 2008 2009 2010 2011 2012 2013
£/c
usto
mer/
year
Retail price Total cost Gross Margin

State of the Market Assessment
74
operating costs (which amount to around £150 in 2012 in the Ofgem SMI). As a
result, the figures used in this analysis cannot be compared directly with Ofgem’s
published SMI data.
4.81. The cost data follows an upward trend over the long term. However, there are
occasions where costs are seen to fall, notably sizeable reductions in costs around
2007 and 2009. A closer inspection of the data shows the following:
total number of months in the sample – 120
number of months where we observe costs falling – 42
number of months where we observe prices falling - 39
4.82. The table below shows both changes in wholesale costs and changes in prices,
for a typical dual fuel customer, split by whether wholesale costs are rising or falling.
It examines whether there is a major difference between the change in prices
depending on whether wholesale costs are rising or falling.
Figure 37: Changes in wholesale costs and retail prices
Change in Wholesale Costs116 Change in Retail Prices117
Rising
Wholesale Costs
Falling Wholesale Costs
Rising Wholesale Costs
Falling Wholesale Costs
Average change (£/customer/year)
£ 10 £ 8 £13 £2
Std Deviation £ 7 £ 8 £26 £15
Observations118 73 45 74 45
T-test Pr(|T| > |t|) = 0.183 Pr(|T| > |t|) = 0.014***
T-test interpretation
There is no significant difference between the magnitude of the change in wholesale costs when they are rising compared to when they are falling
Wholesale cost rises are passed through significantly more than falls
*** p<0.01, ** p<0.05, * p<0.01
116 The cost data displays monthly wholesale cost for electricity and gas from Ofgem’s SMI Database for the period January 2004 and December 2013. The data is calculated assuming a hedging strategy of 18 months and it has been adapted to reflect the energy consumption for a medium user of dual fuel as for the price data. 117 The price data displays UK average nominal prices of the biggest six suppliers’ annual dual fuel bill for the period between January 2004 and December 2013. The monthly prices are sourced from Energylinx for a domestic consumption level of 3300 kWhs of electricity and 16500 kWhs of gas per year. The prices are calculated for a standard tariff with monthly direct debit payment method. 118 Wholesale cost data until November 2013, retail price data until December 2013.

State of the Market Assessment
75
4.83. The results show that between 2004 and 2013 the average monthly increase
in wholesale cost (£10) is not dramatically different from the average monthly
decrease of wholesale costs (£8) as indicated by the results.119 On the other hand,
during the same period, when wholesale costs increase, the average energy bill
increases by £13 compared to an average reduction of £2 when wholesale costs fall.
This result is statistically significant.
4.84. This simple test shows asymmetry in the response of retail prices to changes
in wholesale costs. This asymmetry has become more pronounced than when Ofgem
performed a similar exercise in 2011.120
4.85. To get a fuller picture of the asymmetry we performed an econometric
analysis of rocket and feather pricing using the so-called Error Correction Model
(ECM) which involves two steps. We first estimated the long run relationship between
retail prices and the suppliers’ costs. Then we tested the speed of adjustment to this
long run relationship in the presence of short-run changes in costs, and in particular
whether adjustments to cost rises were different from adjustments to cost
decreases.
4.86. We found that suppliers do not adjust their prices as quickly when costs fall
compared to when wholesale costs rise. We ran this analysis using a number of
different model specifications all of which showed this asymmetry.
119 We have also performed the same analysis comparing the average percentage increase in wholesale costs with the average percentage decrease and found that there is no significant difference between them. On the other hand, when comparing the average percentage increase in bills following an increase in wholesale costs with the average percentage decrease following a decrease of wholesale costs, we find the first changes to be significantly larger than the second one. 120 Do energy bills respond faster to rising costs than falling costs? - page 8, Ofgem 21 March 2011 www.ofgem.gov.uk/ofgem-publications/39712/priceasymmetry.pdf

State of the Market Assessment
76
5. Barriers to entry and expansion and
vertical integration
Chapter Summary
There are significant barriers to expansion in domestic energy supply. Despite high
levels of entry, new suppliers have collectively remained below one per cent market
share for most of the past decade, and no one supplier has achieved more than two
per cent. Many small suppliers have exited the market over that time.
There has been some pickup in growth since 2012 from a low base. Some of this
growth has arisen organically from customers switching away from six largest
suppliers to one of the 18 small suppliers currently in the market. More recently
Npower’s sale of licensee companies to Telecom Plus has boosted the collective share
of small suppliers to over 5 per cent121.
But even if small suppliers continued to acquire similar numbers of new domestic
customers, it would be some years before any of them could achieve the scale of one
of the big six suppliers.
In particular, small suppliers appear to face significant barriers to expansion in
winning customers, large proportions of whom are disengaged from the market.
Small suppliers face a further barrier in accessing the range of products they need in
the wholesale electricity market to hedge their positions, although Ofgem’s liquidity
reforms aim to address this. Accessing credit to fulfil extensive collateral
requirements can also be a significant barrier to entry and expansion for new and
smaller suppliers.
Barriers to entry and expansion
5.1. This section examines whether there are barriers to entry and expansion for
new suppliers seeking to enter or grow their market share in the retail energy
market.
Why are barriers to entry and expansion a problem for competition?
5.2. Competition will be effective and markets work well when firms are subject to
competitive constraints from other firms in the market or those that could readily
enter it.122 New entry can be a particularly effective form of competition. This is
because new firms can disrupt weak competition between incumbent firms with
potentially different business models, by bringing more efficient and more innovative
goods and services to consumers.
121 Based on meter point data provided by Electricity DNOs and Xoserve 122 See “Market Investigation References”, Office of Fair Trading, March 2006, paragraph 4.1

State of the Market Assessment
77
5.3. Barriers to entry can reduce the competitive constraint on firms when
combined with other features in a market such as a high degree of concentration
among suppliers, coordinated conduct, or a weak demand side.123
5.4. Even if entry is itself relatively easy, there may be other barriers which
prevent companies expanding and imposing the maximum possible constraint on
other firms. It is therefore important to understand the extent of barriers to
expansion – the presence of which can reduce competitive constraint on firms and
may lead to higher prices, worse service, reduced innovation and/or choice.
Findings: Barriers to entry
5.5. As shown in Figure 38, 24 new suppliers have entered the domestic energy
market since deregulation in 1998, albeit that some of these subsequently failed and
had their licence revoked by Ofgem or transferred to a larger entity.
5.6. In addition to the biggest six suppliers, there are currently 18 small suppliers
involved in domestic energy. Some of these companies have identified niches such as
environmentally conscious consumers, or have focused on consumers on certain
payment mechanisms. Most new firms have entered both the gas and electricity
markets, although some have entered gas only. Most also supply both domestic and
SME customers, but a number confine themselves to one or the other.
5.7. There has also been some entry by established non-energy retail brands which
is not shown in Figure 38. For example, Sainsbury’s and Marks and Spencer have
entered through white label or similar deals with one of the six largest companies.
123 For example where consumers are not engaged and where barriers to switching are high.

State of the Market Assessment
78
Figure 38 - Non-incumbent entry and exit to the GB domestic gas and
electricity markets
5.8. Discussions with small suppliers highlighted a number of fixed entry costs,
with developing IT systems for customer acquisitions, customer information, and
billing being the single biggest entry cost. Estimates ranged from £1-2 million for a
firm seeking to enter at relatively small scale, and £5-20 for firms seeking to acquire
a customer base of up to two million. However, it also seemed possible to enter with
even cheaper IT systems initially and scale these up with customer size.
Regulatory barriers to entry
5.9. Suppliers require a licence to start supplying energy in the domestic and SME
markets, and need to be able to comply with detailed industry codes. This process
can involve upfront costs – although Ofgem has taken steps to try to reduce these.
5.10. As an essential service and one where there are strong public policy
considerations around climate change and the need to maintain security of supply,
the energy industry is heavily regulated. All suppliers face the cost of monitoring
changes in government policy, regulation and industry code developments. While this
regulatory environment is ‘a cost of doing business’ applicable to all suppliers, the
costs of compliance are more of a burden for new entrants and smaller suppliers with
smaller customer bases over which to spread these costs. Smaller suppliers may also
ECOTRICITY
COUNTRY WIDE
CALORTEX
ATLANTIC ELECTRIC AND GAS
AMERADA HESS
CAMBRIDGE GAS
ENRON DIRECT
INDEPENDENT ENERGY
UTILITY LINK
GAS WEST
GOOD ENERGY
UTILITA UTILITA
ZEST4 ELECTRICITY
FIRST UTILITY
SPARK ENERGY
OVO ENERGY
CO-OPERATIVE ENERGY
GREEN ENERGY
iSUPPLY ENERGY
ECONOMY ENERGY
FLOW ENERGY
DALI GAS
GREEN STAR
ZOG
GNERGY
BETTER ENERGY
TELECOM PLUS UTILITY WAREHOUSE
Source: Ofgem
Electricity and gas
Gas only
Electricity only
1998 1999 2000 20132002 2003 2004 2005 2006 2007 2008 2009 2010 2011 201220011996 1997

State of the Market Assessment
79
have lower average margins than larger incumbent suppliers, since they do not have
a ‘sticky’ incumbent customer base.
5.11. Energy suppliers are also subject to self-regulation. Industry codes are
detailed multilateral agreements which include technical and commercial rules and
obligations that govern participation in the energy sectors.
5.12. In our discussions with smaller suppliers, a number raised the complexity of
regulation and the cost of compliance as a barrier to entry. One small supplier felt
complexity of regulation had trebled in the last five years and now represented a
major barrier to entry and expansion. Several suppliers also raised concerns over the
costs of complying with RMR initiatives.
5.13. Uncertainty about the future direction of energy policy and regulation may
also deter potential entrants. One supplier said that energy policy and regulation
creates uncertainty about costs. One potential entrant which had seriously
considered entering the domestic market in the last few years told us it was deterred
by both the complexity of regulation, the changing regulatory framework that applies
to domestic supply, and also the political risk.
Findings: Barriers to expansion
5.14. Of the 18 smaller suppliers currently in the domestic market, only four have
expanded to above 250,000124 customer accounts, including the sale of NPower’s
customers to Telecom Plus.125 A couple of the small suppliers have seen more rapid
growth in the past two years, however no individual supplier has exceeded a market
share of 2 per cent.126
5.15. For the overall market share of non-incumbents, it can be seen from Figure 3
and Figure 4 that smaller suppliers have had a persistently low share of both the
domestic gas and electricity retail market over the past decade. Before 2004, non-
incumbent suppliers also had a low market share accounting for about 0.5 per cent
of gas and electricity accounts since liberalisation.127 The persistence of these low
market shares is consistent with significant barriers to expansion.
5.16. From 2011-12, the share of domestic small suppliers started to grow from a
small base. In 2012 the market share (in electricity) of the small suppliers increased
by one percentage point to 2 per cent and by a further 3.2 percentage points in 2013
124 Assuming all customers buy both gas and electricity from the same supplier (i.e. dual fuel), suppliers would reach the ECO threshold of 250,000 domestic accounts with 125,000 customers, (gas and electricity count separately, so a dual fuel consumer will count as two accounts). In most case suppliers will have a minority of customers that are single fuel customers. 125 Trading as The Utility Warehouse. 126 Measured by retail electricity supply points. 127 Smaller Suppliers in the UK Domestic Electricity Market: Experience, Concerns and Policy Recommendations, Stephen Littlechild, 29 June 2005. The low average overall market share disguises the stronger growth of some smaller suppliers over this period who were subsequently bought by larger incumbents.

State of the Market Assessment
80
to 5.2 per cent128. This has very recently increased above 5 per cent in both
electricity and gas when including the sale of customers129 by NPower to Telecom
Plus in the context of a long-term supply agreement (see below). Many reasons have
been put forward by industry and commentators for this recent growth of small
suppliers, including:
Environmental and social policy costs: Since the beginning of 2013, small
suppliers with fewer than 250,000 domestic accounts have been exempt from the
Energy Company Obligation (ECO)130 and other environmental and social
obligations. The costs of these schemes have risen over the past years. They are
estimated to add around £90 to a dual fuel bill following the December 2013
reduction to the ECO scheme.131 The exemption gives small suppliers a cost and
price advantage, although the provision of energy efficiency services to
customers by the biggest six suppliers may confer an advantage in customer
loyalty and trust.
Relatively stable conditions in the wholesale electricity market: There
were two periods of volatility in wholesale electricity markets in 2005 and 2008.
Following the former, several smaller suppliers left the market. Since then,
wholesale energy prices have been more stable. This period of relative stability
may have reduced wholesale price risk for smaller suppliers.
Profile of recent price rises of the six largest suppliers: As shown in Figure
9 there was a spike in switching coinciding with the political and media focus on
the rounds of big the six largest suppliers’ price increases in the second half of
2013. Switching data indicates that non-incumbent suppliers have been large
beneficiaries of this spike. Of the switches that took place in the last two months
of 2013 27 per cent were to independent suppliers132. There has also been a fall
in customer trust in suppliers (see Chapter 3).
Sale of NPower customers: In November 2013, NPower announced the sale of
licensee companies to Telecom Plus, amounting at the time to 770,000 accounts
(or 1.6 per cent of domestic accounts133) which accounts for half the growth in
market share of the small suppliers in 2013. These customers had previously
been served under a white label arrangement with Npower.
5.17. While this recent expansion may be encouraging, we consider it unlikely that
this recent growth will lead to a supplier gaining the scale of one of the six largest
suppliers in the domestic market.
5.18. Small suppliers report that they face significant barriers to expansion in the
market. For this review, we met larger and smaller suppliers, attempted market
entrants, investors, academics, and consumer groups to understand their views.
128 Based on Meter Point Administration Number (MPAN) provided by Distribution Network Operators (DNOs) 129 Meter Point Administration Number (MPAN) data provided by Distribution Network Operators (DNOs) and gas supply point data provided by Xoserve 130 Energy Companies Obligation (‘ECO’) was introduced at the beginning of 2013. 131 Ofgem SMI analysis 132 Source: MPAN data provided by electricity DNOs 133 Based on Ofgem data for customer accounts December 2013.

State of the Market Assessment
81
They highlighted recurring problems which are persistently limiting entry, and, more
significantly, restricting expansion:
Low liquidity in the wholesale market
Credit and collateral requirements
Difficulties in persuading some customers to switch
Regulatory barriers to expansion
Limits to available interconnection capacity (see discussion under vertical
integration)
5.19. We discuss each in the next section, after we explain the position of small
suppliers in the wholesale electricity market.
5.20. The market for business customers is more competitive, overall, than the
domestic sector. There are more active suppliers and non-incumbent suppliers hold a
greater market share than in the domestic market. The non-domestic market can be
split into separate sub-markets based on the size of consumer, with different
suppliers active in each. For small business customers, which typically have non-half
hourly metered sites in electricity and non-daily metered sites in gas, non-
incumbent suppliers supply 8 per cent of electricity sites (15 per cent by volume) and
32 per cent of gas sites (66 per cent by volume).134 There may be some barriers
which are lower for suppliers active in the non-domestic market. For example, ECO
obligations do not apply to non-domestic customers accounts.
Small suppliers as buyers in the wholesale electricity market
5.21. New entrants have to date primarily entered the retail energy market as
stand-alone independent suppliers rather than vertically integrated entities with their
own generation arms like the large incumbent suppliers (see below). Many have
entered into long-term agreements with generators or third party intermediaries and
can access some of their energy requirements through contractual vertical
arrangements. But many smaller suppliers depend on the wholesale market for
supplies of energy for their customers.
5.22. Operating in the electricity wholesale market in particular presents two
challenges for small independent suppliers. Firstly, electricity cannot be stored and
electricity supplied over the grid has to balance demand at all times. Any supplier
that is out of balance will be exposed to the cash-out price, which can rise
significantly above the wholesale price. This means that suppliers need to accurately
predict their customers’ demand at all times. This can be difficult for a small supplier
with a new customer base or looking to expand its customer base. Suppliers also
need continuous access to a range of products (base, off-peak, and peak electricity)
over the near term and longer term in order to refine their supply position and
ensure it balances their changing demand forecasts. This may be more
straightforward for vertically integrated suppliers if they can rely on internal
generation to help them balance.135 Secondly, as a commodity, wholesale electricity
costs can be subject to significant fluctuations which cannot readily or immediately
134Datamonitor November 2013 135 The extent to which vertically integrated suppliers can do this will depend on the generation mix.

State of the Market Assessment
82
be passed through to customers. This presents significant risks for suppliers or
investors who may find their retail margin wiped out by an adverse movement in
wholesale costs. To manage this risk and to smooth out movements in retail prices,
suppliers seek to hedge their position by buying electricity from counterparties on
forward markets up to two or three years ahead. Successful hedging depends on
having access to forward energy products, counterparties willing to trade with small
suppliers, and access to capital to provide collateral for these hedges.
Liquidity in the wholesale electricity market
5.23. Wholesale electricity can be bought on power exchanges, or over-the-counter
(OTC) from a counterparty (a generator or intermediary). In GB the bulk is bought
OTC.
5.24. Liquidity can be defined as the ability to buy or sell a commodity or financial
instrument without causing a significant change in its price and without incurring
significant transaction costs. A liquid market provides both price discovery and
product availability. The liquidity of wholesale energy markets is important to both
potential and actual entrants.
5.25. A high-level measure of liquidity in commodity markets is the churn ratio. This
is the ratio of traded volume of a commodity to physical output or consumption of
the traded commodity. Measurement of churn allows comparison of levels of liquidity
across markets of different sizes and geographical areas, and between different
commodities. Liquid markets usually have churn ratios of several times the rate of
physical consumption.
5.26. Figure 4 shows that liquidity in the GB electricity market (as measured by
churn ratio) has fallen from a high of around 7 in 2002 to around 3 in 2013. One
possible reason for this was the increase in vertical integration in the mid-2000s
after acquisitions following the failure of Enron, Independent Energy and TXU, and
the withdrawal of a number of previously active market participants. More recently
the decline from 2009 has been attributed to the financial crisis previously the
largest independent generator in the GB market. Similar falls in exchange traded
volumes have occurred over the same period.
5.27. Liquidity in the GB electricity market is much lower than in the GB gas market,
which has a churn ratio typically in the range of 12-20136. While there is a low level
of vertical integration in the gas market compared to the electricity market (see
below) there are many other characteristics of this market which make it more liquid.
For example the GB gas market is a hub where around 60-70 per cent of all EU
trading takes place137 and as such has a large number of market participants who are
regularly active on a daily basis. Liquidity in the GB electricity market is also below
that in a number of other European countries. While volumes traded in the German
and Nordic wholesale markets have also fallen recently, they maintain higher churn
136 ICIS Heren, ICE, DUKES 137 European Commission Quarterly Report on European Gas Markets. Market Observatory for Energy, DG Energy, Volume 6, issue 2, Second quarter 2013, page 9

State of the Market Assessment
83
ratios than the GB market at 7 and 5 respectively138. The German market maintains
a higher level of churn than GB despite being dominated by four large vertically
integrated players.
5.28. Another common measure of liquidity is the bid-offer spread. This gives an
indication of the robustness of the price – a tight spread indicates that arbitrage
opportunities are being exhausted and gives market participants confidence that they
can buy and sell at a price that reflects the underlying supply and demand
conditions. In recent years electricity bid-offer spreads – in particular for peak
spreads – have been wide, indicating a lack of consensus on price. During 2013
electricity spreads in most products narrowed to their lowest since 2008, however
they remain wide compared to gas spreads.
5.29. The proportion of long-term forward peak and non-peak trading (in excess of
a year) seems to be particularly low in GB. Figure 40 shows the percentage of
volumes traded, across all electricity OTC baseload, off-peak and peak products by
period of delivery. It is apparent that the proportion of volumes of peak or off-peak
products traded further than one year out is low, and has declined since 2010. In
addition to (and a consequence of) their low availability, the bid-offer spreads on
these forward products can be wide, meaning that they are not a good guide to
future prices.
5.30. We also note that liquidity is at risk of falling further as a result of the
implementation of EU EMIR139 regulations. Several third party traders have recently
closed their electricity trading desks, citing this as a major factor.
138 ACER, Report on the influence of existing biffing zones on electricity markets http://www.acer.europa.eu/Official_documents/Acts_of_the_Agency/Publication/ACER%20Market%20Report%20on%20Bidding%20Zones%202014.pdf 139 European Market Infrastructure Regulation (EMIR) obliges central clearing for certain classes of over-the-counter derivatives.139 The EMIR is a European Union regulation and is designed to increase the stability of over-the-counter derivative markets across the EU. The main obligations introduced include central clearing, application of risk management techniques, reporting to trade repositories, application of organisational, conduct of business and prudential requirements for central counterparties and the application of requirements for Trade repositories, including the duty to make certain data available to the public and relevant authorities. One of the likely impacts will be to increase collateral requirements. For more information see https://www.esma.europa.eu/page/European-Market-Infrastructure-Regulation-EMIR.

State of the Market Assessment
84
Figure 39: Wholesale electricity: overall volumes traded and degree of churn
Source: DUKES, ICIS Heren, APX, N2EX, ICE
Figure 40: Percentage of volumes traded OTC by period of delivery
Source: ICIS Heren
0
2
4
6
8
10
0
500
1,000
1,500
2,000
2,500
2000 2001 2002 2003 2004 2005 2006 2007 2008 2009 2010 2011 2012 2013
Churn
TW
h
Total volume traded (TWh) Generation volume (TWh) Churn
Start of NETA
0%
10%
20%
30%
40%
50%
60%
70%
80%
90%
100%
Baseload Off-Peak Peak
Spot/prompt 2-12 months 13-24 months >24 months

State of the Market Assessment
85
5.31. The majority of the small suppliers we spoke to told us the lack of liquidity in
the wholesale market was one of the main barriers to expansion and was a risk to
their business. This is because it creates uncertainty over whether they can source
electricity products at competitive prices. As a result, many smaller suppliers have
entered into long-term agreements with generators or financial intermediaries.
Without such agreements they say it would be difficult to acquire the power they
need, particularly in terms of shaped products140. They feel this absence of
alternative sources to buy energy limits their options for growth.
5.32. In addition, small suppliers often need to offer low tariffs with low margins to
gain customers (see below). They also lack the balance sheet and diversification of
the large suppliers to withstand adverse changes in wholesale prices. It is therefore
important that smaller suppliers can ‘lock in’ their customer margins by fully hedging
along the curve against movement in wholesale prices. Low liquidity of forward
products can increase the exposure of small suppliers to adverse movements in
wholesale prices and increase the costs of hedging for smaller suppliers. This may
discourage entry and expansion, although the level of exposure will depend on the
supplier’s risk appetite.
Collateral requirements
5.33. As noted above, hedging is done by buying contracts for delivering electricity
or gas in the future, helping to reduce retail suppliers’ uncertainty about their future
wholesale costs. However, this creates the risk of a counterparty defaulting141 on a
trade between when the contract is agreed and when the power is delivered. If this
occurs then losses may arise from the difference between the market price at the
time of default and the contract price that was agreed.
5.34. A common method of mitigating this risk is through posting collateral. How
much collateral is required generally varies when the wholesale price changes
relative to the price agreed in the contract. When wholesale prices are more volatile,
greater collateral may be required since the potential losses are greater.
5.35. Collateral can be required in two ways. First as an initial margin to cover a
certain range of price movements, and second as a margin call142 following larger
price movements. The collateral required could be cash or other securities. During
the life of a contract, the price may swing above and below the contract price at
different times, and to different extents. A supplier will have lots of different
contracts for different time periods.
5.36. In addition to credit and collateral required to trade in the wholesale market,
there are other collateral requirements associated with being a supply company.
These mainly arise from using the transmission and distribution systems for gas and
140 A shaped product is a contract which specifies different amounts of electricity to be delivered at different times. A bespoke shaped product with half-hour granularity could specify a different volume for every half-hour period of the contracts duration. 141 A default could happen not only if the counterparty went out of business but also if the price moved in a way that made it attractive to renege on the contract. 142 Margin call refers to an additional collateral request arising from a change in wholesale prices because the current level of collateral is insufficient given the increased potential liability faced by a counterparty.

State of the Market Assessment
86
electricity,143 and from suppliers’ gas and electricity balancing costs144. There will
also be increasing collateral requirements from implementing Contracts for
Difference (CfDs)145 the Capacity Mechanism146 and the Smart Energy Code.147 These
wider credit and collateral arrangements differ in volumes of collateral required, as
well as how that collateral can be posted. These requirements are set out in relevant
industry codes148 which are governed by industry and existing large suppliers have a
strong level of influence. Some small suppliers have told us that these wider credit
and collateral requirements associated with being a supply company also act as a
barrier to expansion149 , as they affect small suppliers’ ability to price competitively.
They therefore act as a competitive constraint.
5.37. Cumulatively, a lot of working capital may be needed to meet all these
collateral requirements.
5.38. In principle, these might amount to normal costs of doing business in the
wholesale market and one might expect that efficient financial markets could supply
this capital. But for investors, small suppliers with limited credit history and weak
balance sheets may present a sufficient risk as to make that working capital either
unavailable or only available at an uneconomic rate. We therefore consider this to be
a critical barrier to expansion.
5.39. Several small suppliers told us that this is the main barrier to expansion they
face. Given the amount and unpredictability of working capital that could be tied up
by collateral requirements, some smaller suppliers have tried to find a way around
them. For example, Telecom Plus, trading as Utility Warehouse, has a 20-year
contract with Npower for services including energy.150 Others have arrangements
with financial intermediaries or upstream participants, who may have an equity stake
in the supply company. This can be a way of reducing collateral requirements, but is
not a route open to all small suppliers.
143 Suppliers, on behalf of consumers, are charged for the cost of the pipes and wires which transport energy to the end consumers. Broadly the charges are reflective of volumes of energy sold to end
consumers. 144 Suppliers are also charged for the costs of balancing the electricity and gas system. Broadly these costs are based on the volume of energy sold to consumers, the cost of balancing the system and the relative position of supply companies (ie whether they bought too little or too much energy compared to the actual usage by their customers). 145 CfDs is the Government‘s chosen mechanism to stimulate investment in low carbon technologies by providing greater certainty on the revenue streams. 146 The Capacity Mechanism is the Government’s chosen mechanism to insure against the risk of future black outs by providing financial incentives to ensure sufficient electricity capacity is available to meet demand. 147 The Smart Energy Code is a multi-party agreement which sets out how different entities involved in the end to end management of smart metering interact with each other. 148 Codes are multilateral agreements which set out the technical and commercial rules and obligations that govern participation in the energy sectors. Typically, network operators are obliged under their licences to put these codes in place. Each code is designed to be capable of modification with the network operators, the signatories to the code and, in some cases, Consumer Focus and other interested parties. 149 As part of this assessment we have sought the views of stakeholders but have not performed a detailed review of these requirements. 150 Utility Warehouse does not need to buy energy in the wholesale market as it has a bilateral arrangement with Npower to supply all its energy needs. NPower has a small (less than 0.5 per cent) equity stake in Telecom plus PLC.

State of the Market Assessment
87
5.40. Collateral requirements were not viewed as barriers to expansion by the larger
vertically integrated suppliers when we spoke with them in the context of this
assessment – a factor which seems to be related to their large balance sheets and
credit ratings (see below).
Difficulties in persuading customers to switch
5.41. None of the new suppliers, who do not have an incumbent customer base,
have achieved significant growth in the domestic market since 1996. Many small
suppliers viewed the lack of engagement from those consumers who have not
switched (or done so infrequently) as a barrier to expansion. We have already noted
a low level of consumer engagement overall in this market. Many consumers have
never switched from their incumbent supplier. Those that have not switched supplier
report that a median saving of £94151 on an annual bill would be needed to persuade
them to switch. Consumers also report barriers to switching, such as the complexity
of comparing tariffs and lack of trust in the switching process.
5.42. On top of this, energy is homogenous and it is difficult for new entrants to
differentiate themselves outside of niche customer groups (such as green energy).
Service quality, for example, may not be apparent at the point of sale, and some
elements of customer service (such as switching performance) depend on cross-
industry systems. As gas and electricity are essential, customers may be wary about
switching to a less known brand, despite low trust in their incumbent suppliers.
5.43. These factors are likely to act as barriers to entry and expansion, slowing the
speed at which new suppliers can grow in the market.
Regulatory barriers to expansion
5.44. Although it can be an important initial spur to entry, the small supplier
exemption from ECO may create a disincentive to expand. Small suppliers noted that
expanding beyond 250,000 domestic accounts requires careful strategic
consideration, since the benefit of the exemption tapers off sharply beyond this
threshold. Some argued that unlike the big six suppliers, they did not have a base of
‘sticky’ customers that would tolerate rising government charges without switching.
Reputational barriers
5.45. Potential new entrants we spoke to also raised the reputational risks
associated with being part of the industry. The ability to provide good customer
service in areas like switching are impacted by cross-industry processes. The high
level of political and media attention that the sector faces and the poor reputation
were seen as risks in using an existing valued brand in the energy market. A
consistent reason for not entering the market was the political environment
surrounding the energy market and the uncertainties surrounding the future of
policy.
151 Ipsos MORI, Customer Engagement with the Energy Market – Tracking Survey 2013

State of the Market Assessment
88
Vertical Integration
Vertical integration in GB electricity
5.46. A vertically integrated firm is one which owns or has a controlling interest in
activities at different levels of the supply chain within an industry. The largest energy
suppliers in Great Britain are all structured in a vertically integrated way.
Vertical integration across the supply chain
5.47. In electricity, all six of the large suppliers own generation assets split between
the different types of generation (see Figure 4 below). All six also have trading arms
that sit between their generation and supply businesses. These are usually
responsible for managing the portfolio of wholesale positions for the whole business
– trading both internally and externally generated power often on behalf of the
business overall. Two of the big six suppliers (ScottishPower and SSE) also own
transmission and distribution assets. These are run as ring-fenced, separate
businesses and so we do not consider them to be part of the vertically integrated
structure of interest in this assessment.
5.48. Vertical integration is less prevalent in the gas market. GB’s gas supply mix is
divided between four key sources: domestic production from the UK Continental
Shelf (UKCS), Norwegian production from the Norwegian Continental Shelf (NCS),
interconnector imports from Continental Europe, and global imports of liquefied
natural gas (LNG).152 The scope for the six biggest suppliers to vertically integrate
with upstream production is effectively restricted to UKCS and NCS. Only Centrica
(the largest gas supplier) has a notable direct stake, with approximately 12 per cent
of UKCS and approximately 2 per cent of NCS.153154 Importantly, this only equates to
a small fraction of total GB supply and is far from sufficient to meet its consumer
demand.
5.49. Given that vertical integration is limited in gas, this chapter is focused on
vertical integration in electricity.
Interconnection
5.50. Great Britain has physical electricity and gas interconnection with mainland
Europe and the island of Ireland. Interconnection affects consumers, suppliers and
generators on both sides of an interconnector. Interconnection can provide an
efficient signal for the location of generation, increase competition and lead to
reduced electricity bills.
152 Storage also helps ensure these supplies can be shifted in response to demand variations, be it short-term spikes or long-term swings from summer to winter. The ownership of storage capacity is relatively dispersed and two of the largest facilities are required to offer capacity to third parties on non-discriminatory terms. 153 Sources: National Grid, DECC and the Norwegian Petroleum Directorate. 154 Market shares will vary over time depending on market conditions, changes in field licenses and so on.

State of the Market Assessment
89
5.51. Access to generation outside of Great Britain increases competition in the
domestic wholesale market by offering suppliers additional choice. Cross border
trade allows for the use of the most efficient source of generation reducing the
overall cost of generation. This is predicated on market prices reflecting scarcity
between interconnected markets and physical flows across interconnectors going
towards markets with the highest price. This also supports security of supply.
Interconnection can also help with the integration and management of intermittent
generation and provide additional and potentially lower cost ancillary services for
system balancing.
5.52. Interconnection plays a central role in the realisation of a single European
Energy Market that the Third Package prescribes. The aim of the Third Package155 is
to further liberalise European energy markets and create a common set of market
rules for both the electricity and gas sectors.
5.53. There is 4000MW of installed electricity interconnection capacity between
Great Britain, mainland Europe and the island of Ireland through four
interconnectors.156 One cable on the Moyle interconnector is on a forced outage
reducing its available capacity to 250MW reducing total available capacity to
3750MW.157
5.54. In comparison to our European neighbours the overall level of
interconnectivity is still low. As a result of the potential gains from trade around
10000 MW of potential new interconnection projects are at various stages of
development158, with NEMO and Eleclink interconnectors being the most advanced.159
5.55. The GB gas market is physically connected via two interconnectors to
continental Europe and is also interconnected to Northern Ireland and the Republic of
Ireland.160 Interconnection with continental Europe means that there is a link
between domestic and European markets, i.e. gas flows vary with price and flow
from lower priced markets to higher priced markets.
5.56. If future developments occur as planned, interconnection has the potential to
improve competition in GB electricity markets. However, currently interconnection
capacity is too limited to act as a material competitive constraint.
155 The Third Package is EU legislation on European electricity and gas markets that entered into force on the 3rd September 2009. The purpose of the Third Package is to further liberalise European energy markets. DECC is primarily responsible for its transposition in Great Britain and had to do this by 3rd March 2011. The term “Third Package” refers to Directive 2009/73/EC of the European Parliament and of the Council of 13 July 2009 (Gas Directive) and Directive 2009/72/EC of the European Parliament and of the Council of 13 July 2009 (Electricity Directive), concerning common rules for the internal market in natural gas and electricity respectively. 156 England-France Interconnector (IFA) is a 2000MW high voltage direct current (HVDC) link between GB and France; The EirGrid East-West interconnector is a 500MW HVDC link between the Republic of Ireland and GB; The BritNed interconnector is a 1000MW HVDC link between the Netherlands and GB; The Moyle interconnector is a 500MW HVDC link that runs between Northern Ireland and GB. 157 http://www.eirgrid.com/media/Generation%20Capacity%20Statement%202014.pdf 158 https://www.ofgem.gov.uk/publications-and-updates/cap-and-floor-regime-application-project-nemo-impact-assessment 159 https://www.ofgem.gov.uk/publications-and-updates/request-eleclink-exemption-under-article-17-regulation-ec-7142009-gb-france-interconnector 160 Balgzand Bacton Interconnector from the Netherlands to GB; Interconnector UK from Belgium to GB; The Moffat interconnector between the island of Ireland, GB and the Isle of Man).

State of the Market Assessment
90
Vertical integration in electricity
5.57. Before competition was fully introduced into the retail energy markets in
1999, British Gas and the 14 regional regional Public Electricity Suppliers (PESs) had
a monopoly to supply all domestic gas and electricity consumers respectively in GB.
Since 2001, the GB electricity sector has become more vertically integrated, with the
largest six energy supply companies increasing their ownership of generation
capacity. Over the next five years the number of suppliers in the market fell to six as
a result of horizontal mergers. Some of these businesses also merged with
generation companies to create vertically-integrated groups.
5.58. Since 2000, generation capacity ownership by the biggest six suppliers has
increased from around 36 per cent161 to around 70 per cent in 2013162. This has
mainly been driven by acquisitions. In particular, there was a spate of takeovers of
independent generators following the collapse and insolvency of AES, Enron,
Independent Energy and TXU Europe in 2001 and 2002 when substantial volumes of
merchant163 generation capacity either exited the industry or were taken over by
vertically integrated companies. In 2009, EDF also acquired British Energy.
5.59. While all of the big six energy companies are vertically integrated, there are
differences between the structure of each one. For example, each group differs in the
number of legal entities, and the interaction and decision-making autonomy between
them. There are also differences in how they transfer costs and revenues between
them The big six suppliers also differ in the way their trading functions are set up
and their relationship with the upstream generation and downstream supply
activities.
5.60. There are other vertical arrangements in electricity supply that fall short of full
vertical integration but similar in many ways. Examples include long-term contracts
where companies take supply from generators. Tolling agreements164 also exist
among both the largest and some of the smaller energy supply and generation
companies. While such agreements will reduce the small suppliers’ dependence on
the liquidity of the wholesale market and potentially also reduce their collateral
requirements, long-term agreements do not fully replicate the benefits of the natural
hedge arising from being vertically integrated and the terms on offer might limit the
ability of the independent suppliers to expand profitably.
Net positions of the six largest suppliers
5.61. In addition to looking at ownership structures, the extent of vertical
integration can be measured as the ability to self-supply. As Figure 41 below shows,
161 Energy Supply Probe – Initial Findings https://www.ofgem.gov.uk/ofgem-publications/38437/energy-supply-probe-initial-findings-report.pdf 162 DUKES table 5.11 163 Merchant generation is a term used to refer to generators that operate in the market without a long term power purchase agreement or equivalent. Enron and TXU were imparting counterparties to these firms and the collapse of these firm has in part led to the consolidation of the generation market. 164 A tolling agreement is an agreement between the owner of a generation plant and a third party whereby the third party provides the resources which the generation plant turns into electricity before delivering it back to the third party.

State of the Market Assessment
91
this varies across the big six suppliers with only one of them theoretically having the
capability to self-supply all of their electricity sales. Figure 41 may underestimate
the degree to which the big six can self-supply. First, while it measures actual
generation output, the generation capacity will be larger. This reflects the fact that
not all generation plant is used all the time. Plus, in supplying large commercial
customers, suppliers often act as a broker for the customer who buys directly from
the wholesale market and bears the risk of changes in wholesale prices. Looking at
domestic supply only, all suppliers except Centrica would have the capacity to self-
supply for their domestic customer base. However, as noted later, they still have
good economic reasons to trade in the wholesale market (rather than self-supply).
Figure 41: Aggregate balance between GB electricity demand and supply for
the six largest energy supply companies for 2012 (TWh)
Source: Consolidated segmental statements, Datamonitor
The benefits of vertical integration (VI)
5.62. Vertically integrated group structures are common in many industries. Vertical
integration can often bring major efficiency benefits to firms which may be passed on
to consumers in the form of lower prices and better products, particularly if there is
strong competition downstream.
5.63. Given the changes in the structure of the GB electricity market, one would
expect there to be strong efficiency rationale for vertical integration. Many reasons
are cited and have been repeated to us by stakeholders regarding the benefits of
vertical integration. The main reasons include: lower collateral requirements; the
ability to better source energy in an illiquid electricity wholesale market; (the
22
27
84
42
18
35
-36
-29
-21-18 -17
-27-14.1
-1.9
63.0
24.4
1.1
7.8
-60
-40
-20
0
20
40
60
80
100
Centrica E.ON EDF RWE npower ScottishPower SSE
TW
h
Generation Domestic & SME Supply Net position (Domestic & SME only)

State of the Market Assessment
92
“natural hedge” provided by the ability to offset within group generation and
demand); and the potential for co-ordination of activities and economies of scope.
These are examined below.
Risk/natural hedge
5.64. An independent supplier may be more exposed to shifts in the value chain
than an integrated company. Whereas the vertically integrated supplier can absorb
shifts in up and downstream margins, which are partially or wholly offsetting, the
independent supplier model is exposed to the full impact of such shifts. In electricity,
such shifts can commonly occur as a result of changes in wholesale prices.
5.65. It is not clear how far vertical integration is necessary to achieve this sort of
hedge. In theory, suppliers or investors should be able to achieve a similar sort of
diversification eg through owning a portfolio of shares in generation or supply
businesses, or through other financial products. However this would also require a
large amount of capital, so equally may not be an option open to smaller suppliers.
Collateral requirements
5.66. We have already seen that participants in the wholesale market are usually
required to post collateral with a counterparty to insure them against the risk of
default resulting from changes in the underlying electricity price. The size of these
collateral requirements acts as a barrier to entry and expansion in the market.
5.67. Vertical integration is likely to reduce the amount of collateral companies are
required to post when buying and selling electricity when compared with non-
vertically integrated firms. This is for a number of reasons:
Vertically integrated firms may be able to make some direct trades internally
without the need to post collateral (or with much reduced collateral
requirements). The six largest suppliers differ in their approach to internal trades.
The fact that vertically integrated companies both buy and sell energy may mean
that the requirements to post collateral are, at least partially, offsetting. In other
words, having a smaller net position may enable the vertically integrated firm to
offset the collateral posted with it against the collateral it needs to post and
reduce its capital costs overall.
5.68. Most of the six largest suppliers have suggested that there are not particular
collateral benefits from VI. This is because the key to reducing collateral
requirements is creditworthiness, which is a balance sheet issue. For example, EDF
noted that where it trades bilaterally OTC with counterparties, it is afforded a
collateral-free credit line based on its investment grade credit rating. With the asset-
intensive nature of generation, vertically integrated firms are likely to have stronger
balance sheets and may as a result have better credit ratings than other market
participants.

State of the Market Assessment
93
5.69. In this respect, vertical integrated companies may also be able to provide
required collateral at a lower cost, insofar as vertical integration contributes to an
organisation’s creditworthiness. Some rating agencies have suggested that the
‘natural hedge’ that vertical integration provides against fluctuations in wholesale
prices could mean that rating agencies and other financial market players perceive
them as more resilient. Other factors, such as an organisation’s balance sheet, will
also contribute to a company’s creditworthiness.
Less dependence on liquid wholesale market (resulting in less liquidity)
5.70. A vertically integrated firm may be less dependent on the liquidity of the
wholesale market because it sources much of its electricity requirements internally or
has the option to do so. As noted in Figure 40 above, market liquidity is concentrated
on the nearer term and in standard baseload and (some) peak products. This can
mean it is difficult for smaller suppliers to access the products that they need –
particularly in the longer term. Smaller suppliers can also have difficulty accessing
nearer term products in the wholesale markets at the smaller units (‘clip sizes’) that
they need.
5.71. It is in this area that the independent suppliers we spoke to felt particularly
disadvantaged when compared with the larger suppliers. Smaller suppliers felt that
the vertical integration of the six largest energy suppliers meant they could rely on
internal generation for access to near-term and long-term products. As examined
below, to the extent that the six largest suppliers do rely on internal generation for
these products, this could also reduce how much they buy from the wholesale
market. This in turn may further reduce the liquidity of the wholesale market
resulting in a “vicious circle”.
Economies of scope
5.72. The six largest suppliers generally cited the same benefits of being vertically
integrated. These were: having a wide pool of industry expertise, and the co-
ordination activities across the supply chain. But not all of them agreed on the extent
to which these were beneficial.
The costs of vertical integration
5.73. In some circumstances, vertical integration may limit competition in a market
compared to a situation of no vertical relationships between upstream or
downstream suppliers. In particular, it may create barriers to entry or expansion to
the extent that non-integrated suppliers may find it more difficult to access inputs, or
routes to market.
5.74. The adverse effects of vertical integration are likely to be exacerbated when
there is limited competition in upstream or downstream markets (or both).
Does vertical integration reduce liquidity in the wholesale market?

State of the Market Assessment
94
5.75. We have been told that small suppliers have difficulties accessing the products
they need in the electricity wholesale market and that they see this as a barrier to
expansion.
5.76. One of the reasons for low levels of liquidity in the wholesale market may be
that vertically integrated companies tend to meet their own generation needs
themselves without needing to trade so extensively in the wholesale market. The
vertical acquisitions of the big six suppliers during the 2000s may be one reason for
the reduction in the churn ratio of the GB electricity market (see above).
5.77. As shown in Figure 40, most of the six largest suppliers have a reasonably
close match between their generation capacities and the demand from their domestic
customer base, and could in theory self-supply most of the generation needs of these
customers.
5.78. But there are many reasons that companies trade more than their net position
suggests. One of these is that a company’s output from its generation portfolio might
not match its supply requirements either in the volume of output, the generation
technology or the physical characteristics of the generation. In addition, electricity
cannot be stored and suppliers need to balance their supply and demand for
electricity in half-hour periods. Trading accounts for short-term unexpected
fluctuations in demand.
5.79. Figure 42 below shows the diversity in generation portfolios between the
biggest six suppliers. This will impact the extent of their ability to self-supply and
their incentives to do so. This is because they all have different mixes of baseload
(such as nuclear) and flexible (eg gas and oil) generation assets which have different
marginal costs. Optimising the cost of generation for any one period will require
trading.

State of the Market Assessment
95
Figure 42: 2013 electricity generation capacity of the six largest energy
companies by type (MW)
Source: DUKES table 5.11, OCGT abbreviates open cycle gas turbine, NPSHYD not
pumped storage hydro and CCGT combined cycle gas turbine
How much do the six largest suppliers trade?
5.80. To look more closely at the impact of vertical integration on trading in the GB
electricity market we collected information from each of the six largest energy
suppliers on their activity in each half hourly trading period for 2012 and 2013. This
information includes:165
The volume of generation output from the generation capacity owned by each
company
The volume of electricity each company purchased externally
The volume of electricity each company sold externally.
5.81. Our analysis of this data is in Figure 43 below. Values are reported for the
median half-hourly period. The table shows, for the median half-hourly period in
2012 and 2013 respectively:
The ratio between the amount of energy each company purchased externally and
the volume of generation it produced for that half-hour period
165 In the GB market electricity is traded for delivery within separate half-hourly periods.
0
2,000
4,000
6,000
8,000
10,000
12,000
14,000
Centrica E.On EDF Npower Scottish Power SSE
MW
CCGT Coal Gas Nuclear OCGT Oil Pumped Storage Renewable

State of the Market Assessment
96
The ratio between the amount of energy each company sold externally and the
volume of generation it produced for that half-hour period.
5.82. We note three points from the table:
First, although the biggest six suppliers have varying strategies, they all trade in
the market with all the others, apart from EDF buying and selling multiples of
their generation output. This reflects the activities of their trading arms in
optimising their positions in the wholesale market and suggests that they source
significant levels of electricity from the wholesale market. EDF said that the ‘long’
nature of its generation portfolio made churn based on generated volumes lower
by definition than for other vertically integrated companies. This was amplified by
the lack of flexibility of its nuclear plants.
Second, the average of these ratios (weighted by the generation output of the
biggest six suppliers) ranges between 2.2 and 2.8 in 2013. This is consistent with
an overall churn ratio of 3 in the GB electricity market and may suggest that the
volumes traded by the six largest suppliers affect the overall level of churn in the
market to a significant degree.
To the extent that overall churn ratios in the GB electricity market are low in
comparison to the GB gas wholesale market and other European markets, this,
based on the figures below, may be a consequence of the six biggest suppliers’
trading levels. We would however caution that it is not clear what is cause and
what is effect in this relationship.166
166 Further, the figures in Figure 43 could be driven by a number of different factors such as market shares in generation and retail markets.

State of the Market Assessment
97
Figure 43: External trading positions of the six largest energy companies167
Externally purchased volumes/Generation output (ratio)
Externally sold volumes/Generation output (ratio)
Median Median
2012
Centrica 3.9 1.2 EdF 0.8 1.0 E.ON 5.1 4.2 ScottishPower 2.5 2.2
SSE 3.9 3.4 Npower 3.8 3.7
Average weighted by big 6 Generation market share 2.8 2.5
2013 Centrica 3.8 1.5 EdF 0.6 0.9 E.ON 4.6 3.4 ScottishPower 1.8 1.6 SSE 4.2 3.9
Npower 3.4 3.2 Average weighted by
big 6 Generation market share 2.5 2.2
5.83. Views were mixed on whether the causes of low wholesale market liquidity
are linked to the vertical integration in the industry. The big six suppliers were
mainly of the view that levels of liquidity in the GB wholesale market were sufficient
and that the key drivers of wholesale market liquidity were unrelated to vertical
integration. These companies pointed to the fact that their businesses models and
the imbalance between their generation portfolios and retail demand meant that they
were required to trade into the market.
5.84. Of the smaller suppliers, many considered that the level of liquidity was low
and caused primarily by the vertical integration of the six largest companies. They
167 Data was provided by each company on electricity supplied, generation output, volumes of energy transferred internally and volume of energy purchased and sold by from external trading counterparties for each half hour trading period in the year. Each of the metric presented in Figure 43 were calculated for each half hour period and the median values are presented. The figures are not entirely comparable. SSE included the output from generation they do not own, but have responsibility for trading through a long term power purchase agreements in generation. This will increase the generation output and slightly reduces their ratios compared to the other companies. EDF have provided the energy they have traded in each half hour (some for delivery in that half hour but most for later delivery) rather than the energy that delivered in that half hour. Moreover, Centrica excluded generation under tolling agreements. The generation output from nuclear generation assets Centrica co-owns were added to the generation figures provided according to Centrica’s ownership share in these plants.

State of the Market Assessment
98
also thought that liquidity would be improved by limiting the degree of vertical
integration or self-supply.
5.85. Other parties gave mixed views too. One stakeholder suggested that the
degree of vertical integration was a prime cause of what it saw as very low levels of
GB electricity wholesale market liquidity. But one stakeholder suggested that levels
of liquidity in the electricity wholesale market were not driven by vertical integration,
but rather by other factors such as the number of trading participants and the
degree of political and regulatory uncertainty.
5.86. There does not seem to be a straightforward causal relationship between
vertical integration and self-supply and therefore reduced trading in wholesale
market. It is also difficult to distinguish between the causes and effects of low
liquidity. All of the big six suppliers have distinct trading functions and trade in the
wholesale market, despite having extensive generation capacity. But we conclude
that vertical integration does lead to a reduction in wholesale market liquidity. The
biggest six suppliers’ churn ratios are on average somewhat below the ratio for other
European wholesale markets, and well below overall churn ratios in the gas market.
This is consistent with the self-supply activity, which reduces liquidity in the
wholesale market overall. Having an internal generation arm to fall back on when
there are unexpected changes in demand means there is less incentive for the big six
companies to adjust their wholesale position so often. Low levels of liquidity could be
self-reinforcing as the poor availability of products and volatile prices that result
could increase incentives to self-supply.
The scope for suppliers raising their rivals’ costs
5.87. A vertically integrated firm could theoretically raise its rival retailers’ costs of
electricity, and thus weaken them as competitors, by acting in a way that leads to an
increase in prices in the electricity wholesale market (input foreclosure)168. This may
arise if a vertically integrated firm has market power in the wholesale market, and so
can either raise prices directly or withhold generation capacity to achieve price
increases.
5.88. In addition to the features of the market already discussed, there are
characteristics of electricity as a commodity, such as limited ability to store, a lack of
available substitutes and consumers’ low responsiveness to price in the short run
that might increase the scope for market power in electricity wholesale markets. At a
time of tight generation capacities, even small changes in generation output could
result in fairly large changes in wholesale prices. A generator whose capacity is
essential to cover total demand may have power over wholesale prices.
5.89. We performed a screening analysis to see if we could rule out that any of the
large integrated generators could withhold generation capacity to raise the wholesale
cost of rival electricity retailers. The results were inconclusive - from this analysis we
could not exclude that some of the large vertically integrated generators have some
168 We considered whether independent generators might be restricted from accessing electricity retailers as customers. We found no evidence for that and no concerns were raised with us regarding such customer foreclosure

State of the Market Assessment
99
power over price, but found no evidence that the capacity of any of them would be
required to meet total demand. It is important to note that, as part of the
assessment, we did not receive evidence suggesting that the six largest suppliers
have withheld generation capacity to raise wholesale prices and foreclose rivals.
5.90. Small suppliers have reported a reluctance to trade with the big six suppliers
on the wholesale markets. A number of them said that the wholesale market is
dependent on the willingness of the largest six companies to trade and this could be
withdrawn at any time. A number also complained that the wholesale prices of the
biggest six lacked transparency and were not confident that they reflected true
market forces. Ofgem’s liquidity reforms aim to address some of these concerns.
The costs and benefits of VI
5.91. In the time available for this assessment, we have not been able to examine
in depth the claimed benefits and reasons for vertical integration for the suppliers
and the implications for barriers to entry, and assess the net impact on consumers of
vertical integration overall.
5.92. But we are concerned that vertical integration may have a detrimental impact
on competition by imposing barriers to entry and expansion and by reducing liquidity
in the wholesale market. Weak competition also makes it less likely that any benefits
from vertical integration will flow down to consumers. Further detailed investigation
would judge how this detriment compares to the claimed benefits for the suppliers.

State of the Market Assessment
100
6. Profitability
Introduction
6.1. Poor outcomes for consumers can be an indication that competition is not
working well in a market. When competition authorities look at the competitiveness
of a market, profitability is often examined alongside other consumer outcomes, such
as quality, innovation, or customer responsiveness.169
A study of profitability is often
complementary to an examination of the features of the market that might be
restricting, distorting or preventing competition.
6.2. Prices that are above competitive levels is an obvious example of a poor
outcome for consumers. The question of whether prices are above competitive levels
can be considered in a number of ways including international price comparisons, an
analysis of economic profitability, and efficiency analysis. In this section, we focus on
profitability and efficiency.
6.3. The six largest energy suppliers are each vertically integrated, involved in
both the generation and supply of energy, as well as having trading activities that
interact with both businesses. In this study our focus is on supply businesses.
However given these inter-relationships and internal transactions assessing the
profitability of the supply business in isolation is not straightforward.
6.4. So, although our focus is on the profitability of the supply businesses, we also
look at these activities in the context of the entire vertically integrated businesses.
Profitability
6.5. In 2009, following the Probe, Ofgem introduced a licence condition requiring
the six largest energy companies to publish an annual report setting out financial
information relating, separately, to licensed supply and generation activities. Ofgem
introduced these consolidated segmental statements (CSS) to ensure that consumers
and other stakeholders have access to robust, useful and accessible information on
the costs and profits of the different segments of the large suppliers’ businesses.170
6.6. The CSS reports are not audited but have to be reconciled with audited group
accounts. The ease with which the CSS reports can be reconciled to segmental
information in audited group accounts varies by company depending on the degree
of disclosure in the audited accounts. However, Ofgem, its advisors and industry
analysts have reviewed the data. Ofgem’s advisors, BDO, concluded that it was not
possible to provide complete assurance on the segmented accounts. However, it said
it saw “no evidence… that profits are being unduly excluded from the CSS” and “no
169 See CC (Revised) – Guidelines for market investigations (2013), Market Outcomes. 170 Ofgem (2012) The Revenues, costs and profits of the large energy companies in 2012

State of the Market Assessment
101
evidence that would suggest that the CSS do not represent a true and fair view of
the split of profitability”.171
6.7. The transfer price of energy has an important influence on reported profits in
the supply business. In particular, deriving an objective transfer price for energy
requires a robust reference price. Ofgem is conducting a more in-depth assessment
of transfer pricing as part of a package of actions to improve the CSS172, and has
introduced liquidity reforms to make transfer prices more robust.
6.8. Even with complete accounting assurance, the allocation of costs between
different business segments remains, to some extent, subjective. For example, it is
not obvious when good wholesale energy trading performance should be realised as
lower costs to the supply business, higher revenues to the generation business or
profits in the trading business.
6.9. For these reasons it is important to look at both the profits of individual
segments as well as the overall profits of generation and supply together.
Trends in combined generation and supply EBIT
6.10. Figure 44 below shows the combined EBIT, or earnings before interest and
tax, of the generation and supply businesses of the six largest suppliers over the
period from FY09 to FY12. Over the period combined EBIT rose from £3.1 billion to
£3.7 billion. Whilst generation and non-domestic supply profits fell over this period,
this was more than offset by the increase in domestic energy supply EBIT, which
grew from £0.2 billion to £1.2 billion over the period.
171 BDO LLP Final Report, 16 January 2012 172 Ofgem, Actions to improve the transparency of energy company profits. 26 February 2014

State of the Market Assessment
102
Figure 44: six largest suppliers combined generation and supply EBIT
(FY09-FY12), consolidated EBIT (£m)
Source: Analysis of the six largest suppliers CSS.
6.11. The CSS accounts show that since 2009, the combined profits are more stable
than individual components. This is a feature of the market that Ofgem has noted
over a longer period in the Probe and RMR. This appears to reflect an inverse
relationship between generation and supply profitability in respect of wholesale price
volatility. When wholesale prices rise unexpectedly, retail profits are likely to come
under pressure particularly in the domestic sector where retail prices cannot be
adjusted instantaneously. However a sustained increase in wholesale prices will, all
things being equal, increase generation profits.
6.12. In the Probe, Ofgem noted that during times of sharply rising wholesale
electricity prices, it would expect the retail businesses to make lower margins. Ofgem
said that this was partly because the upstream businesses (generation, gas
production) act as a hedge over the short to medium term, and partly because, when
wholesale prices rise very quickly there are inevitably delays in passing higher costs
through to end customers. In order to understand this dynamic, Ofgem estimated
retail and generation business profitability for the six largest suppliers based on
publicly available data and assumptions about hedging strategies for gas, coal and
electricity.173
6.13. Based on this analysis, Ofgem concluded that estimated retail margins were
materially higher on average during 2000 to 2004 – at around 15 per cent of sales
on average. Ofgem noted that this was a period of lower and more stable wholesale
173 Energy Supply Probe, paragraphs 8.8 and 8.9
£233
£734 £681
£1,190£530
£861
£568
£410
£2,307
£1,385£2,288
£2,135
£3,070£2,980
£3,537
£3,735
£0
£500
£1,000
£1,500
£2,000
£2,500
£3,000
£3,500
£4,000
2009 2010 2011 2012
£ m
Domestic supply EBIT Non-domestic supply EBIT Generation EBIT

State of the Market Assessment
103
prices and consequently lower generation profits. A number of large non-vertically
integrated generation businesses went into receivership over this period. As
electricity and gas prices increased, supply margins were squeezed but by 2006 were
more than compensated for by higher generation profits.174
6.14. Ofgem estimated value chain profits for the domestic market at around £2 to
£2.5 billion between 2000 and 2004. It does not have any data for the non-domestic
market for that period. On the assumption that overall value chain profits would have
been higher if non-domestic generation and supply profits had been included, it is
possible that that overall value chain profitability has not risen to a material degree
between now and then. However there are significant uncertainties due to
differences in the data; that presented in Figure 4 is financial data provided by
companies whereas the historic figures presented in the value chain analysis in the
Probe were based on a theoretical model. Furthermore, the Probe did not model non-
domestic profits.
6.15. Although this analysis could be consistent with effective risk management in a
competitive market, it might also be indicative of pricing power in supply. If large
suppliers have pricing power in the supply market, they might be able to sustain
more stable returns across the value chain despite the inherent volatility of
generation market.
The profitability of supply
6.16. In this section we look further at the trends in supply profitability and the
drivers of this profitability. As before we use the available evidence in the CSS, which
covers the years 2009-2012 for the six largest suppliers.
6.17. We concentrated on the cost categories reported in the CSS.175 These are as
follows:
a. Energy costs. The weighted average cost of electricity (WACOE) and gas
(WACOG) account for the single largest cost item for supply businesses at around
60 per cent of total costs.
b. Other direct costs account for around 30 per cent of total costs and comprise
costs that are to some extent outside the companies’ control, such as social and
environmental obligations and network charges (including distribution and
transmission costs, which are set by Ofgem).
c. Indirect costs account for around 10 per cent of total costs, and relate to those
aspects of the cost base that supply companies have significant control over,
including IT, billing, marketing and bad debts (to some extent), as well as
depreciation and amortization.
174 Energy Supply Probe, paragraph 8.10 175 Based on further information on costs provided by the six largest suppliers in their responses to the VIR, we made minor adjustments to reclassify certain costs in FY09 from direct to indirect costs, to ensure consistency over the period.

State of the Market Assessment
104
6.18. Figure 45 below shows unit revenues and costs for the combined supply
business of the six largest suppliers, and shows gross profit and net profit (EBIT)
margins.
6.19. Unit revenues increased over the period, both in the domestic and non-
domestic sector, and in both gas and electricity, partly reflecting price rises but also
the reduction in energy consumption per consumer. Lower consumption will tend to
increase average unit revenues because of the impact of standing charges.
6.20. For the six largest suppliers as a whole, electricity gross margins per MWh are
up only slightly over the period, implying that price increases have broadly reflected
increased costs. In gas, by contrast, gross margins have more than doubled, and
now represent almost 20 per cent of revenues.
6.21. EBIT margins in electricity supply have declined year-on-year from 2.9 per
cent in FY09 to 1.7 per cent in FY12. However, EBIT margins in gas supply have
increased over the period from -0.4 per cent in FY09 to 7.1 per cent in FY12.
However, it is difficult to interpret the pattern of different margin trends for
electricity and gas supply due to the prevalence of dual-fuel tariffs in the domestic
market.
Figure 45: Combined Unit Revenues and Unit Costs (£ per MWh) and Gross
and EBIT Margins on Supply Big 6
(combined)
£/MWh
Electricity Supply Gas Supply
Combined Supply
2009 2010 2011 2012
2009 2010 2011 2012
2009 2010 2011 2012
Revenues 97.4 92.8 99.4 106.3
34.5 31.1 37.5 40.7
58.8 53.4 64.3 67.1
WACOE/G -63.4 -55.2 -58.0 -58.8
-22.8 -18.5 -20.7 -23.0
-38.5 -31.7 -36.8 -37.4
Other Direct
Costs -22.6 -25.9 -29.3 -35.7
-7.9 -6.7 -9.5 -9.5
-13.6 -13.6 -18.1 -20.1
Gross
Profit 11.4 11.7 12.2 11.8
3.8 6.0 7.3 8.2
6.7 8.0 9.4 9.6
All Indirect
Costs -8.6 -9.3 -9.8 -10.0
-3.9 -4.2 -5.6 -5.3
-5.7 -6.0 -7.4 -7.2
EBIT 2.8 2.4 2.4 1.8
-0.1 1.8 1.7 2.9
1.0 2.0 2.0 2.4
Gross
Margin (%) 11.7% 12.6% 12.2% 11.1%
11.0% 19.2% 19.5% 20.0%
11.5% 15.0% 14.6% 14.3%
EBIT Margin
(%) 2.9% 2.6% 2.4% 1.7%
-0.4% 5.8% 4.6% 7.1%
1.7% 3.8% 3.1% 3.6%
6.22. Figure 46 below sets out our calculation of EBIT margins for each of the six
largest suppliers for their combined electricity and gas supply businesses. This figure
illustrates differences in margins between firms and over time. Margins for Centrica
and SSE were higher and more stable over the period when compared against the
other major suppliers.

State of the Market Assessment
105
Figure 46: Six largest suppliers Combined Retail Business Electricity and Gas
Supply EBIT Margins (% of revenues)
Source: Analysis of the six largest suppliers CSS.
6.23. We also looked at domestic supply margins for electricity and gas, together
and separately. These are set out in Figures 47, 48 and 49.
5.5%
0.5%
-0.7%
-3.9%
3.9%
2.7%
7.8%
3.7%
0.5%
-1.4%
2.3%
5.0%
6.8%
3.3%
-0.9%
1.2%
0.1%
3.6%
6.6%
2.5%
-1.4%
2.9%
4.6%4.3%
-0.06
-0.04
-0.02
0
0.02
0.04
0.06
0.08
0.1
Centrica E.ON EDF Npower ScottishPower SSE
EBIT
Marg
in (
%)
2009 2010 2011 2012

State of the Market Assessment
106
Figure 47: Six largest suppliers’ Domestic Electricity and Gas Supply EBIT
Margins (% of revenues)
Source: Analysis of the six largest suppliers CSS.
7.6%
2.3%
-6.9%-7.5%
-2.6%
2.1%
8.9%
6.0%
-4.7%
-5.3%
0.5%
-0.2%
6.9%
5.8%
-1.8%
-4.8%
2.0%
-0.4%
6.6% 6.4%
3.6%
-3.0%
2.3%
4.5%
-10%
-8%
-6%
-4%
-2%
0%
2%
4%
6%
8%
10%
Centrica SSE Npower EDF E.ON ScottishPower
EBIT
Marg
in (
%)
2009 2010 2011 2012

State of the Market Assessment
107
Figure 48: Six largest suppliers’ Domestic Electricity Supply EBIT Margins
(% of revenues)
Source: Analysis of the six largest suppliers CSS.
7.9%
0.5%
-4.4%
-5.4%
4.2%
6.3%
5.4%
2.3%
-6.8%
-8.4%
-5.1%
5.7%
4.8%
6.6%
-2.6%
-1.9%
-8.6%
3.7%
-1.6%
5.3%
-2.4%
5.2%
2.5% 2.4%
-10%
-8%
-6%
-4%
-2%
0%
2%
4%
6%
8%
10%
Centrica E.ON EDF Npower SP SSE
EBIT
Marg
in (
%)
2009 2010 2011 2012

State of the Market Assessment
108
Figure 49: Six largest suppliers Domestic Gas Supply EBIT Margins (% of
revenues)
Source: Analysis of the six largest suppliers CSS.
6.24. In relation to the potential impact of dual-fuel pricing on our margin analysis,
a number of the six largest suppliers told us that in domestic supply, electricity and
gas margins should be looked at on a combined basis. Centrica told us that it had a
dual-fuel strategy, and that it had promoted its tariffs on the basis of low electricity
prices, which are then balanced out by relatively higher gas prices. Centrica
therefore considered that margins in domestic supply should be based on combining
both electricity and gas results.176 Scottish Power also told us that it tended to focus
on combined electricity and gas margins and the competitiveness of dual-fuel
tariffs.177 Finally, SSE told us that it constantly tried to balance margins on electricity
and gas to achieve 5 per cent in both.178
6.25. If we were to combine domestic electricity and domestic gas supply EBIT, to
reflect (to some extent) the prevalence of dual-fuel tariffs, then EBIT Margins in
combined domestic supply have increased over the period from 0.9 per cent in 2009
to 4.3 per cent in 2012. However, this is made up of a small decline in domestic
electricity margins (from 2.2 per cent to 1.8 per cent) and a significant increase in
domestic gas margins (from -0.3 per cent to 6.7 per cent). We note that the two
suppliers with the largest market share in domestic gas supply – Centrica and SSE –
both had margins in excess of 10 per cent in 2012.
176 Centrica meeting 177 Scottish Power meeting 178 SSE meeting
7.4%
-7.3%
-13.5%
-8.7%
-0.6%
-3.2%
10.6%
-2.0%-2.5%
-0.4%
6.3% 6.3%
8.1%
-5.4%
-9.0%
-1.6%
11.4%
8.6%
11.2%
-1.8%
-4.1%
1.7%
7.1%
11.4%
-15%
-10%
-5%
0%
5%
10%
15%
Centrica E.ON EDF Npower SP SSE
EB
IT
Marg
in (
%)
2009 2010 2011 2012

State of the Market Assessment
109
6.26. Within the non-domestic electricity and gas segment, EBIT margins were
stable over the period on a combined basis, although this disguises a trend of
increasing gas margins from -0.5 per cent in 2009 to 9.3 per cent in 2012, and a
small decline in non-domestic electricity margins.
6.27. We note that the pattern of declining margins on electricity and increasing
margins on gas continues the trend observed by Ofgem in the RMR. In the RMR,
Ofgem noted a shift in profitability from electricity to gas over the period 2005-2008,
which it considered reflected in part tariff rebalancing by suppliers following the
Probe.179 In relation to this, SSE told us that some changes were made in 2008 due
to the Probe as SSE's gas business was loss-making at that time and Ofgem’s
changes introduced an effective prohibition on cross-subsidisation.180
6.28. We examined the distribution of profit margins by supplier, shown in Figure
46. We noted a wide disparity in overall supply margins. For example, Centrica and
SSE had average EBIT margins over the period of 6.7 per cent and 3.9 per cent
respectively, whilst EDF and RWE reported average negative margins of -0.6 per cent
and -0.3 per cent respectively.
6.29. For both Centrica and SSE, gas supply contributed a higher proportion of total
profits than that of other suppliers. For example, in 2011 and 2012, gas EBIT
contributed 63 per cent and 98 per cent respectively to Centrica’s total supply EBIT;
and for SSE, gas EBIT contributed 62 per cent and 82 per cent respectively to its
total supply EBIT. These compare with Scottish Power, which had the next highest
gas EBIT contribution percentage of 54 per cent in FY12.
6.30. E.ON and Scottish Power exhibited average levels of EBIT margins over the
period, other than in isolated years. In FY09, E.ON’s EBIT was unusually low due to
losses in gas supply; and in FY11 Scottish Power’s EBIT was low because of an
unusually high WACOE.
6.31. We investigated the reasons for the losses reported by EDF and RWE in their
respective total supply business.
6.32. EDF reported EBIT losses in its supply business in FY09, FY11 and FY12. We
found that over this period EDF had below average Unit Revenues, as a result its
Gross Margin was lower than average. In addition, EDF reported higher than average
Unit Indirect Costs in domestic electricity and in domestic gas. We found that its
losses were due to a combination of lower than average prices and higher than
average indirect costs, with the result that it reported losses in both gas and
electricity supply. EDF told us that its losses, and those of RWE’s had been due to
higher operating costs. Both companies have had well-publicised challenges related
to the roll out of new customer information systems.
6.33. RWE reported total supply EBIT losses in FY09 and FY10. We found that over
this period RWE had average Unit Revenues, but above average WACOE and as a
179 The Retail Market Review, Appendix 9, paragraph 1.5 180 SSE hearing summary

State of the Market Assessment
110
result its Gross Margin was lower. In addition, RWE reported materially higher than
average Unit Indirect Costs in domestic electricity, as well as in both domestic and
non-domestic gas. We found that its losses were due to higher than average costs.
6.34. We considered whether the increases in overall supply margins over the
period FY09 – FY12 was due solely to RWE having improved its margin from a loss
making position. However our analysis indicates that all suppliers, other than EDF,
increased their supply margins between FY09 and FY12 to some extent.
Efficiency assessment
6.35. We considered trends in controllable costs (adjusting for the effect of inflation)
as a potential indicator of competition. In doing so, we are concerned with the
broader question of whether prices are above competitive levels. Inefficient firms
may not earn high profits but prices may nevertheless be above competitive levels.
We would expect costs to be driven down towards efficient levels over time after
competition is introduced in a well-functioning market.
6.36. In 2008, Ofgem noted a concern that the supplier with the highest operating
costs per account was spending 90 per cent more on each account than the supplier
with the lowest costs.181 It also noted that costs to serve had increased by 11 per
cent between 2005 and 2007. In 2012, the IPPR noted that the differential appeared
to have widened, indicating that competitive pressure was failing to drive
convergence in supplier costs, as should be expected according to economic
theory.182
6.37. We conducted an analysis based on information supplied to us by the six
largest suppliers as part of this assessment, combined with information supplied to
Ofgem as part of its 2011 RMR, to give a time series from 2005 to 2012. On a per
domestic customer basis, and adjusting for inflation, SSE has consistently had the
lowest costs and EDF and RWE the highest costs. The supplier with the highest costs
had total indirect costs that were 76 per cent higher than the supplier with the lowest
costs in 2012 and 32 per cent higher than the average for the six largest suppliers.
The variation in indirect costs among the major suppliers has remained significant
over time with little convergence in costs, as one might expect if competition were
driving down costs to the efficient level over time.
181 Ofgem, Energy Supply Probe – Summary of Initial Findings (2008) 182 See IPPR, The True Cost of Energy (2012), Section 2.3.1
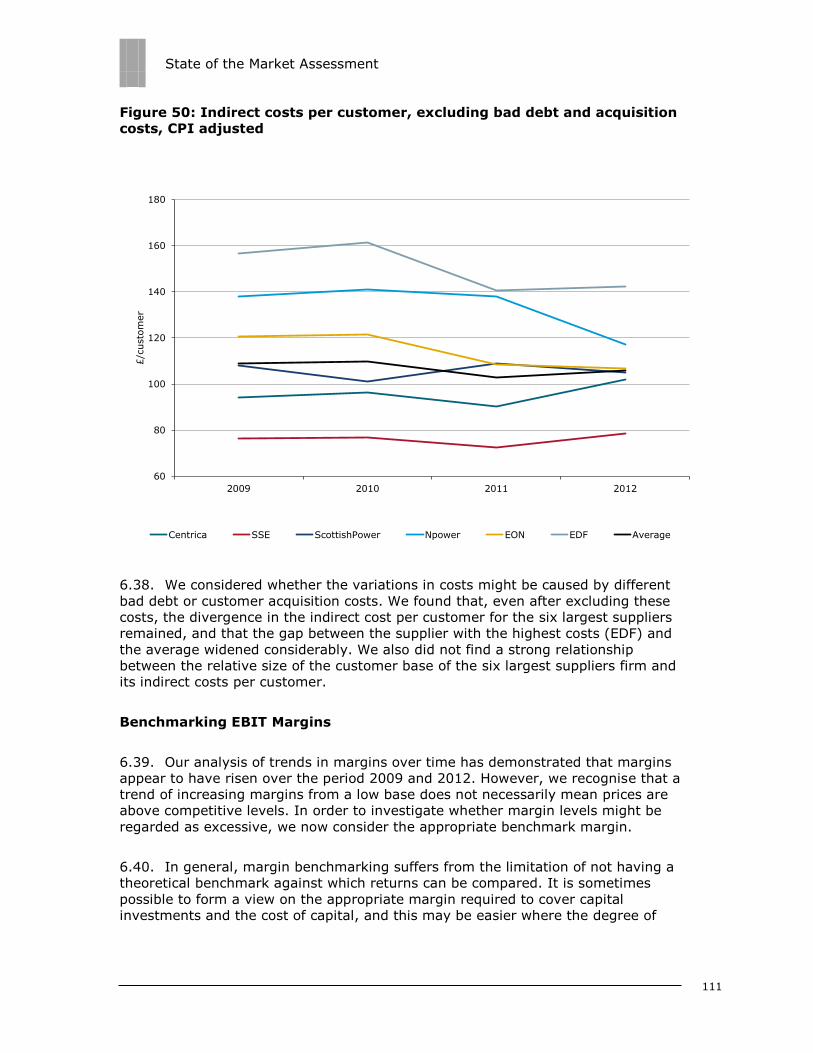
State of the Market Assessment
111
Figure 50: Indirect costs per customer, excluding bad debt and acquisition
costs, CPI adjusted
6.38. We considered whether the variations in costs might be caused by different
bad debt or customer acquisition costs. We found that, even after excluding these
costs, the divergence in the indirect cost per customer for the six largest suppliers
remained, and that the gap between the supplier with the highest costs (EDF) and
the average widened considerably. We also did not find a strong relationship
between the relative size of the customer base of the six largest suppliers firm and
its indirect costs per customer.
Benchmarking EBIT Margins
6.39. Our analysis of trends in margins over time has demonstrated that margins
appear to have risen over the period 2009 and 2012. However, we recognise that a
trend of increasing margins from a low base does not necessarily mean prices are
above competitive levels. In order to investigate whether margin levels might be
regarded as excessive, we now consider the appropriate benchmark margin.
6.40. In general, margin benchmarking suffers from the limitation of not having a
theoretical benchmark against which returns can be compared. It is sometimes
possible to form a view on the appropriate margin required to cover capital
investments and the cost of capital, and this may be easier where the degree of
60
80
100
120
140
160
180
2009 2010 2011 2012
£/c
usto
mer
Centrica SSE ScottishPower Npower EON EDF Average

State of the Market Assessment
112
capital investment is low. Indeed, this may be a desirable approach when considering
the appropriate return for a business with small amounts of capital employed.183
6.41. A further relevant consideration is the proportion of the retail price that is
controlled by the supply company. Taking the view that wholesale energy costs and
other direct costs are largely outside of the control of the supply business,184 this
leaves only around 10 per cent of the overall supply cost base within suppliers’ direct
control.
6.42. In this section we next consider what the six largest suppliers, Ofgem and
market commentators have said about energy retail margins in GB, based on
margins in other retail sectors, before setting out relevant precedents from other
regulatory decisions in paragraphs.
6.43. On its website, Centrica states that ‘British Gas profit from supplying energy
to people at home has remained broadly flat, averaging 5 per cent after tax over the
past six years’, and that it believes this to be ‘a fair return when compared to similar
industries such as telecoms, where margins average 10 per cent’.185 SSE has stated
that its retail margin has averaged 4 per cent over the last 3 years and is targeting a
margin of 5 per cent in the medium term.186
6.44. As part of the RMR, Ofgem benchmarked energy retail margins against a
number of sectors, focussing on supermarkets, high street retailers, and telecoms. It
found that average margins in energy supply over the period 2005 to 2010 had been
lower than in these sectors.187
6.45. Ofgem adjusted the generic retail benchmark for various differences in cost
structure and risk and performed a sensitivity analysis on the extent to which the
supplier was internally hedged (see Figure 51 below). It found that the average
energy retail margin earned between 2005 and 2010 was below the estimated
competitive benchmark of 3 per cent if fully internally hedged and between 7 and 9
per cent if no internal hedge.188
6.46. One of the six largest suppliers submitted a review it had commissioned of
retail businesses in Europe,189 using publicly available data. It found that for
companies in industries with relatively limited product differentiation, considered to
183 British Telecom plc: a report on a reference under Section 13 of the Telecommunications Act 1984 on the charges made by British Telecommunications plc for calls from its subscribers to phones connected to the networks Cellet and Vodafone. MMC, 21 January 1999. The MMC concluded (paragraph 2.113) that calculating a return on net assets employed was an unreliable basis for setting a reasonable return as the mean net assets employed in call activities are not only releatively small but they consisted for the most part of working capital items which could fluctuate considerably from year to year. 184 Centrica told us that it had limited control over transmission and distribution costs, including network costs and environmental costs (eg Renewable Obligation costs). Centrica - Appendix 1, Question 7 response – VIR https://www.ofgem.gov.uk/electricity/retail-market/monitoring-data-and-statistics/understanding-profits-big-energy-suppliers 185 Centrica Key Facts document 186 http://www.sse.com/uploadedFiles/Controls/Lists/Press_releases/Press_releases/2013/SSE_Full-Year_Results2013.pdf 187 See Appendix 9 of https://www.ofgem.gov.uk/ofgem-publications/39709/rmrappendices.pdf 188 ibid. Figure 4 189 Study carried out by Oxera for EDF

State of the Market Assessment
113
be closer to energy supply businesses, retail margins were generally in the range 0-4
per cent. Average returns were around 2-3 per cent, rising to 3-4 per cent for larger
businesses. Margins appeared to be higher where retail businesses were more
differentiated.
6.47. Another study in a research note by Morgan Stanley190 suggested median EBIT
margins for GB commodity retailers in 2012 of 4.8 per cent.
6.48. In the Probe191, Ofgem noted that in setting price controls in 1998, Offer and
Ofgas considered a margin on sales of 1.5 per cent to adequately reflect the
increased risks from the introduction of competition.
6.49. In its 1999 report on BT192 the MMC set a return on turnover of 1.5 per cent in
view of the very high proportion of turnover accounted for by “bought-in services”.
6.50. We note that regulated electricity and gas supply margins in Northern Ireland
are set at 1.7 per cent and 1.5 per cent of turnover respectively.193 Ofwat has
recently consulted on domestic and non-domestic water supply margins at 1.0 per
cent and 2.5 per cent of turnover respectively.194 While domestic supply is a price
regulated monopoly activity, some limited competition has been introduced into non-
domestic water supply. Earlier decisions for regulated monopolies such as that of the
MMC for supply in Northern Ireland in 1997,195 and its 1996 decision on Scottish
Hydro Electric196 set margins of just 0.5 per cent on turnover.
Figure 51: Margin benchmarking
Market Commentator Company / sector Proposed Margin
Monopolies and Mergers Commission
(1996/97)
Scottish Hydro/NI
Supply 0.5%
Ofwat (2014) Domestic water 1.0%
Utility Regulator Northern Ireland (2011) Phoenix Supply 1.5%
Utility Regulator Northern Ireland (2011) Power NI 1.7%
190 Morgan Stanley Research Europe – Utilities Report 23 October 2013 191 Energy Supply Probe, 6 October 2008, paragraph 8.19 192 http://webarchive.nationalarchives.gov.uk/20111202195250/http:/competition-
commission.org.uk/rep_pub/reports/1999/422bt.htm#full, paragraph 1.14 193 Power NI Price Control 2011-2013 Decision Paper October 2011 http://www.uregni.gov.uk/uploads/publications/Decision_Paper_for_Power_NI_Price_Control_V1_0.pdf 194 Ofwat: Setting price controls for 2015-20 – risk and reward guidance. http://www.ofwat.gov.uk/pricereview/pr14/gud_tec20140127riskreward.pdf 195 Utility Regulator Northern Ireland (Power NI) – 2011. http://webarchive.nationalarchives.gov.uk/20111202195250/http://competition-commission.org.uk/rep_pub/reports/1997/397northern.htm#summary 196 Scottish Hydro Electric plc: A report on a reference under section 12 of the Electricity Act 1989, Monopolies and Mergers Commission (1995) http://webarchive.nationalarchives.gov.uk/20111202195250/http:/competition-commission.org.uk/rep_pub/reports/1995/367scottish.htm

State of the Market Assessment
114
Market Commentator Company / sector Proposed Margin
Ofgem / Offer (1998) Energy retail 1.5%
Ofwat (2014) Non domestic water 2.5%
Ofgem RMR adjusted benchmark
analysis (2011)
Energy retail
3.0%
Study carried out by Oxera for EDF
(2014)
Energy retail
3.0%
Water Industry Commission Scotland
(2005)
Water
3.2%
Morgan Stanley Research Europe
Utilities Report (2013)
GB Commodity
Retailers 4.8%
6.51. We question the comparability of general retail to that of energy supply given
the large differences in cost structures. For example, general retail is likely to involve
significant investment in property and stock. A straightforward comparison with
another competitive sector with a similar cost and risk profile to that of the GB
energy supply sector is not obvious. Energy retail has some specific features that
may affect risk and thus the required margin. For example, a supplier is likely to face
a degree of risk due to exposure to wholesale energy price volatility and the
balancing market, particularly if it isn’t vertically integrated.
6.52. Whilst there have been a number of benchmarking analyses that have taken
place across European energy supply sectors, differences in costs arising from
different regulatory and tax regimes limit their usefulness.
6.53. We do not think that circumstances have changed materially since Ofgem
developed its benchmark in 2011 for RMR. As a result, for the purposes of this
analysis we will use this figure as being indicative of a reasonable return, whilst
noting the range presented by the other figures. We consider that a firm conclusion
regarding the appropriate margin for energy retail would involve a fuller review of
the inherent risks involved, similar in nature to the type of assessment that is
undertaken when assessing the cost of capital.
Supply business return on capital employed (ROCE)
Approach
6.54. A comparison of ROCE against a competitive benchmark return, such as the
weighted average cost of capital (WACC), can sometimes provide an indication of
whether prices are above competitive levels. On average and over time, we would
expect firms in a competitive market to earn no more than a ‘normal’ rate of profit.
In other words, the industry ROCE would be close to the appropriate opportunity cost

State of the Market Assessment
115
of capital. Evidence that firms comprising a substantial part of the market have
earned profits above the competitive level over a sustained period of time could
suggest the presence of entry barriers in the market or other limitations in the
competitive process.197 The extent to which the results of profitability analysis
indicate limitations in the competitive process may depend on both the size of the
gap between ROCE and WACC and the length of the period over which the gap
persists.
6.55. Since capital employed figures are not provided in the CSS reports, our
assessment is based on responses from the six largest suppliers to our voluntary
information request (VIR). We received capital employed figures for the supply
business from five of the six largest suppliers, with the exception of EDF.
Capital employed in supply
6.56. As we would expect from businesses with very few fixed assets, based on the
six largest suppliers responses to the VIR, we found that capital employed in the
supply business largely comprised of intangible assets, including goodwill, and net
working capital.
6.57. Goodwill accounted for very different proportions of each supplier’s capital
employed. These proportions ranged from zero to over 100 per cent. One supplier’s
capital employed figure was materially higher than that of other companies, and
there was no obvious reason for this.
6.58. Given these variations and the role of intangible assets, we question whether
these asset values represent a meaningful basis for assessing whether the ROCE is
consistent with a well-functioning competitive market.
6.59. For the purposes of our ROCE assessment, the inclusion of goodwill within
capital employed is problematic because it obscures the distinction between
underlying asset values and capital employed. It is often the residual balancing figure
between separable asset values and the purchase price paid in an acquisition or
merger. Its exclusion from the capital employed figures for some of the six largest
suppliers would result in a significant reduction in their capital employed, eg in the
case of E.ON, the exclusion of goodwill results in a negative capital employed figure
for its supply business.
6.60. The results of our analysis showed a wide variation in capital employed
figures. For some suppliers, the ROCE figures are high compared to any likely cost of
capital for supply, but the high degree of variability in these results and the obvious
issues around comparability of data mean we would place very limited reliance on
these results. We would need to conduct a fuller study of the composition of the
capital employed figures to ensure they are stated on an appropriate basis to be able
to form a view on ROCE for the supply business.
197 CC3 (Revised) Guidelines for Market Investigations, April 2013

State of the Market Assessment
116
Generation profitability
6.61. We considered the profitability of the generation segment of the six largest
suppliers. This is relevant given the vertically integrated nature of the six largest
suppliers and the potential for profits to be reported in different parts of the supply
chain.
6.62. We first make some general observations about profitability in the generation
segment, before discussing our analysis of ROCE.
6.63. Generation is capital intensive, therefore profit measures which do not take
account of capital investment have the potential to be misleading. EBIT margins
need to be sufficient to cover the cost of capital employed. Whilst trends in EBIT
margins can be informative, an Internal Rate of Return (IRR) or ROCE-type
calculations are likely to be more relevant for such industries.
6.64. The long asset life of power stations is a relevant factor because the historic
cost of construction may bear little relationship to the replacement cost. In such
cases, comparing earnings to historic asset values may give a misleading picture of
returns. One may observe high returns on capital because the asset was constructed
at a time when construction costs were relatively low and the technology less
advanced than today.
6.65. In the generation sector, the economics of wholesale market prices and the
merit order have the effect of raising the wholesale price of energy to the marginal
cost of the marginal plant needed to satisfy demand at a given point in time. A plant
lower down the merit order may thus be expected to achieve a price in excess of
marginal cost. The merit order will be influenced by the global commodity markets in
coal and gas, and may change over time. We discuss this further in paragraph 6.68.
ROCE analysis
6.66. Currently, Ofgem does not require supply companies to provide profit
measures in their CSS returns that take account of capital investment. We have
conducted a preliminary analysis of ROCE based on data that was available in the
timescale for this assessment. The analysis requires information on generation EBIT,
capital employed, and cost of capital. We discuss each of these categories in turn.
Generation EBIT
6.67. Ofgem requires companies to report EBIT for generation in their CSS. There
are some difficulties in interpreting the reported numbers. For example, the costs of
fuel required to run plants are not treated consistently by the six largest suppliers;
indeed not all companies include these costs in their generation business results.
BDO noted that this approach reflected differences in the generation business models

State of the Market Assessment
117
of the six largest suppliers.198 The impact of these arrangements within the
generation businesses of SSE, RWE and E.ON has been to give a return to the
generation business that is independent of the electricity volumes actually produced,
with the trading arm, or supply business, receiving the benefit or cost of market
movements. In the time available we have not been able to compile a consistent set
of EBIT figures for generation. We therefore have considerable reservations about
the conclusions that may be drawn for the above companies. See Figure 52 below.
Figure 52: Six largest suppliers’ Generation EBIT (£m)
Generation EBIT (£m)
2009 2010 2011 2012
Centrica £147 £226 £258 £291
E.ON £299 £71 £293 £173
EDF £1,131 £497 £843 £1,058
RWE £145 -£38 £168 £126
ScottishPower £161 £233 £260 £94
SSE £504 £507 £466 £392
Source: CSS. Note that in its response to the VIR, SSE adjusted the generation EBIT
presented in its FY09 and FY10 CSS upwards to account for its JV results which were
not included in the original published CSS reports.
6.68. Underlying commodity prices and plant efficiency, as well as build costs, will
heavily influence the economic profitability of different generation technologies. Coal-
fired generation is currently low cost due to low coal prices on international
commodity markets. Gas-fired generation is currently relatively high cost due to the
rise in international gas prices following the Fukushima accident and the closure of
Japan’s nuclear fleet. As a result, the average clean spark spread in 2013 was £2.4
MWh, significantly lower than the average clean dark spread of £17.9/MWh.199
Renewables have the lowest marginal cost and are thus prioritised before other
energy sources. However, they are intermittent and weather-dependent. Thus the
generation profitability of a company will be determined to an extent by the fuel mix
of its portfolio. Movements in wholesale commodity prices can be hedged by
generators through forward contracts and through entering into tolling agreements
whereby capacity is sold rather than output. In such an arrangement, the other party
to the agreement will typically bear the commodity price risk.
6.69. There are other sources of returns for generators including sales of energy on
the balancing market, fees for providing services in relation to balancing, and
198 In its January 2012 report, it stated that: (a) EBIT for SSE’s generation business is calculated based on capacity payments at fixed rates it receives for its generation plants, which is entirely unaffected by volumes actually produced’; (b) RWE models its generation business income as the sale of options over production to hedge output and therefore it presents its effective gross profit on generation rather than showing the sales value of the volumes produced and the costs of production; (c) whilst E.ON’s generation business reports fuel costs, its generation business has no interaction with the prompt or balancing markets. 199 Clean spreads represent the gross margin after purchasing gas (spark spread) or coal (dark spread) to produce the energy, and after purchasing the necessary carbon emission allowances. Figures taken from Cornwall Energy, Generator Returns and how they are made, February 2014

State of the Market Assessment
118
renewables certificates. We did not consider these other sources of income in our
analysis.200
Generation capital employed
6.70. In the limited time available for this assessment we have worked with “off the
shelf” financial data on capital employed. This is generally stated in company
accounts on a net book value (NBV) basis, reflecting the historic construction cost,
adjusted for depreciation201 and impairments.202
6.71. Tangible fixed assets, including generation plant and equipment, for the six
largest suppliers as a whole accounted for around 56 per cent of total capital
employed (around £18.5 billion out of total capital employed in generation of £33.1
billion) in 2012, with goodwill and net working capital accounting for the balance.
6.72. The six largest suppliers have differing mixtures of plant technology. All have
significant coal, oil and gas-fired capacity (collectively termed “thermal”), although
the mix varies according to supplier. EDF has significant nuclear capacity through its
ownership of British Energy, which it acquired in 2009.203 Other technologies include
hydro, wind, and bio-mass. A breakdown of generation capacity for the six largest
suppliers is shown in Chapter 5. This represents approximately 75 per cent204 of GB
generation capacity.
6.73. The technology has changed over time so that coal-fired and hydro plants
tend to date to the 1960’s or 1970’s. Nuclear plants were constructed between 1963
and 1988. Gas-fired plants tend to be more recent. There has been little major
investment in recent years, other than RWE’s investment in gas-fired plants in
Staythorpe and Pembroke, which began to operate in 2011 and 2012.
6.74. Figure 53 below shows the NBV of the generation plants for the six largest
suppliers in 2012. The total NBV was £18.5 billion, of which thermal represents £8
billion (44 per cent); nuclear £6 billion (33 per cent); and wind £3 billion (17 per
cent). Other technologies make up the remaining 5 per cent. We did not have a split
for thermal between gas and coal.
200 For further details see Cornwall Energy, Generator Returns and how they are made, February 2014 201 Depreciation is charged to reflect the use of the asset over its economic life. 202 Impairment reviews are conducted annually to ensure that the carrying value of assets is not overly high. It may result in a downwards adjustment. 203 Centrica has a 20% share in British Energy. This is not reflected in the chart.

State of the Market Assessment
119
Figure 53: NBV of Tangible Fixed Assets of the six largest suppliers’
generation plants (2012) by plant type
Source: Six largest suppliers’ VIR responses
Cost of capital
6.75. We asked the six largest suppliers to provide us with estimates for the cost of
capital for their generation business. The reported range was between 7 and 10 per
cent, although companies gave estimates on differing bases (pre-tax, post-tax, and
real, nominal). Some of the cited rates were target returns or hurdle rates used for
internal investment appraisals.
6.76. Further information would be required in order to estimate the WACC on a
consistent basis, and to establish the appropriateness of the underlying assumptions.
However, for the purposes of this assessment we have assumed a WACC of 7 per
cent (pre-tax, nominal) would not be unreasonable for a preliminary assessment of
this nature.
ROCE calculations
6.77. Figure 54 below sets out the generation business ROCE calculations based on
the reported NBV of capital employed, adjusted for goodwill.205 EDF did not provide
capital employed data for years prior to 2012; therefore the ROCE calculations for
2009 to 2011 exclude this firm. Figures for 2012 are those for all six companies.
205 The exclusion of goodwill makes little difference to the capital employed figures for the generation segment, due to the high value of physical capital employed.
17.4%
44.2%
0.6%
33.1%
4.8%
0.1% 0.1%
Wind Thermal Biomas Nuclear Hydro Oil Other

State of the Market Assessment
120
Figure 54: Generation ROCE (adjusted EBIT) average across the six largest
suppliers
Source: Six largest suppliers VIR responses. ROCE for 2009 to 2011 exclude EDF
given no capital employed data.
6.78. Average industry ROCE ranged between 6 and 9 per cent over the period.
Between suppliers there was considerable variation between the highest ROCE of 13
per cent and the lowest of -1.4 per cent. There was no discernable upwards or
downwards trend over the period.
6.79. Based on these calculations the average ROCE of 7 per cent over the period
implies that the generation sector is covering its cost of capital but no more.
However, as for supply ROCE we are unable to place any more than limited weight
on this result as we have not established the reliability of the EBIT and capital
employed figures underlying these calculations.
-4%
-2%
0%
2%
4%
6%
8%
10%
12%
14%
16%
2009 2010 2011 2012
Retu
rn o
n c
apital em
plo
yed (
RO
CE)
Average