Embed Size (px)
Citation preview
© 2009 Experian Information Solutions, Inc. All rights reserved. Experian and the marks used herein are service marks or registered trademarks of Experian Information Solutions, Inc. Other product and company names mentioned herein may be the trademarks of their respective owners. No part of this copyrighted work may be reproduced, modified,or distributed in any form or manner without the prior written permission of Experian Information Solutions, Inc.
State of the Automotive Finance MarketThird Quarter 2009
Melinda Zabritski, Director of Automotive Credit

2© 2009 Experian Information Solutions, Inc. All rights reserved.
Presentation Overview
Third quarter 2009 Automotive Finance Market Overview► All open automotive loans by risk tier► Automotive loan delinquencies► Source: Experian-Oliver Wyman Market Intelligence Reports. For more
information, please visit www.marketintelligencereports.comAutomotive Financing in the third quarter of 2009► Financing by geography► New versus Used vehicles► Top Lender report► Loan characteristics► Source: Experian Automotive
National Vehicle Database sourced from DMV title registrations. For more information, please visit www.autocount.com
Risk TiersCategory Scorex
PLUSSMVantageScore
Super Prime 740+ 801 – 990
Prime 680 – 739 701 – 800
Nonprime 620 – 679 641 – 700
Subprime 550 – 619 601 – 640
Deep Subprime <550 501 - 600

© 2009 Experian Information Solutions, Inc. All rights reserved. 3
Automotive Finance MarketHow has the market been changing?
-0.09%
2.25%
0.35%
-3.74%
-1.33%
-5%
-4%
-3%
-2%
-1%
0%
1%
2%
3%
Super Prime Prime Nonprime Subprime Deep Subprime
Change in Risk Distribution from 3Q2008
37.0%37.0%37.9%
23.9%23.4%23.8%
15.3%15.2%15.1%
8.8%9.1%9.0%
15.1%15.3%14.2%
0%
10%
20%
30%
40%
50%
60%
70%
80%
90%
100%
3Q093Q083Q07
Risk Distribution of Open Auto Loans
Super Prime Prime Nonprime Subprime Deep Subprime
Source: Experian-Oliver Wyman Market Intelligence Reports
© 2009 Experian Information Solutions, Inc. All rights reserved. 4
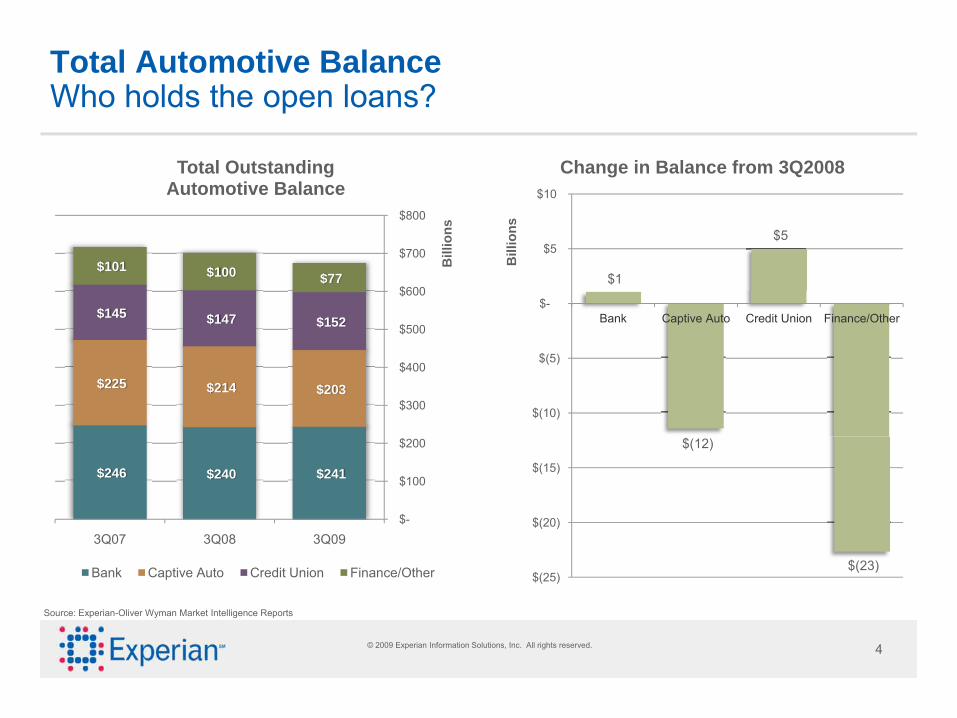
Total Automotive BalanceWho holds the open loans?
$241 $240 $246
$203 $214 $225
$152 $147 $145
$77 $100 $101
$-
$100
$200
$300
$400
$500
$600
$700
$800
3Q093Q083Q07
Bill
ions
Total Outstanding Automotive Balance
Bank Captive Auto Credit Union Finance/Other
$1
$(12)
$5
$(23)$(25)
$(20)
$(15)
$(10)
$(5)
$-
$5
$10
Bank Captive Auto Credit Union Finance/Other
Bill
ions
Change in Balance from 3Q2008
Source: Experian-Oliver Wyman Market Intelligence Reports

© 2009 Experian Information Solutions, Inc. All rights reserved. 5
Recent Automotive Delinquency: 30 Day DelinquencyHow are automotive loans performing?
2.18%
3.04%
1.43%
6.19%
2.86%2.52%
3.24%
1.65%
6.55%
3.14%3.07%3.52%
1.72%
6.55%
3.32%
0%
1%
2%
3%
4%
5%
6%
7%
Banks Captive Auto Credit Union Finance/Other TOTAL
30 Day Delinquency
3Q07 3Q08 3Q09
5.8%
-0.1%
8.7%
4.5%
21.7%
Source: Experian-Oliver Wyman Market Intelligence Reports

© 2009 Experian Information Solutions, Inc. All rights reserved. 6
0.65% 0.60%
0.38%
1.96%
0.77%0.77%
0.59%0.42%
2.02%
0.84%0.89%0.77%
0.49%
2.33%
0.95%
0.00%
0.50%
1.00%
1.50%
2.00%
2.50%
Bank Captive Auto Credit Union Finance/Other TOTAL
60 Day Delinquency
3Q07 3Q08 3Q09
Recent Automotive Delinquency: 60 Day DelinquencyHow are automotive loans performing?
14.5% 13.4%29.2%
16.7%
15.5%
Source: Experian-Oliver Wyman Market Intelligence Reports

© 2009 Experian Information Solutions, Inc. All rights reserved. 7
Recent 30 and 60 Day Automotive DelinquencyWhat’s at stake?
$7,104
$2,026
$6,913
$1,524
$2,472
$687
$5,286
$1,803
$-
$5,000
$10,000
$15,000
$20,000
$25,000
30 Day Delinquency 60 Day Delinquency
Mill
ions
Balance of 3Q2009 Delinquent Auto Loans
Bank Captive Auto Credit Union Finance/Other
$995
$141
$332 $281
$138 $124
$(1,550)
$(147)$(85)
$400
$(2,000)
$(1,500)
$(1,000)
$(500)
$-
$500
$1,000
$1,500
30 Day Delinquency 60 Day Delinquency
Mill
ions
Change in Delinquency from 3Q2008
Bank Captive Auto Credit Union Finance/Other TOTAL
Source: Experian-Oliver Wyman Market Intelligence Reports
© 2009 Experian Information Solutions, Inc. All rights reserved. 8
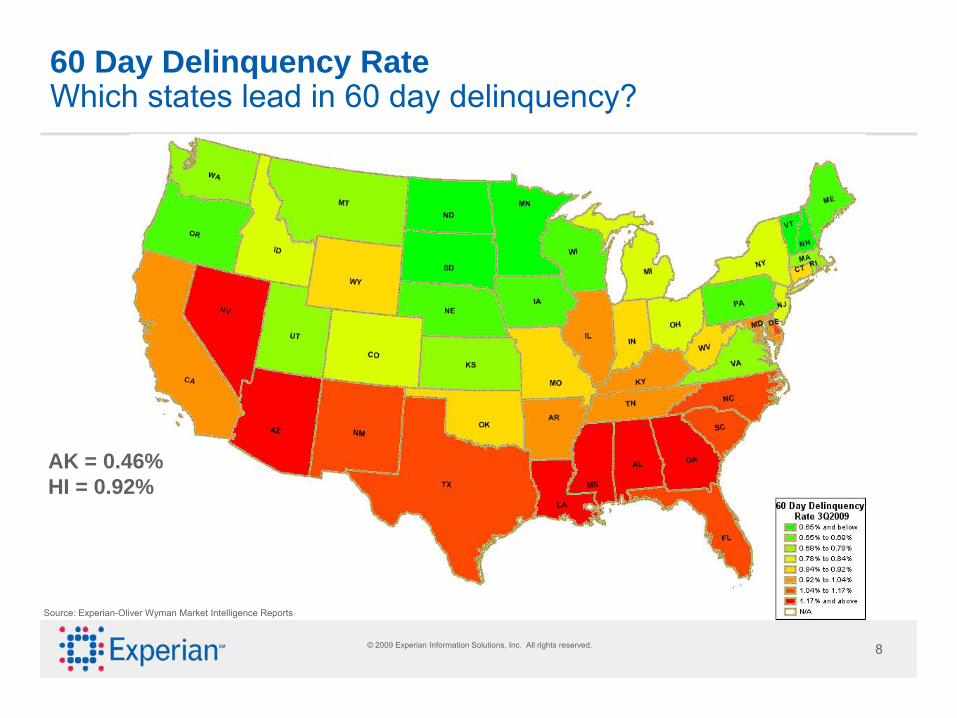
60 Day Delinquency Rate Which states lead in 60 day delinquency?
Source: Experian-Oliver Wyman Market Intelligence Reports
AK = 0.46%HI = 0.92%
© 2009 Experian Information Solutions, Inc. All rights reserved. 9
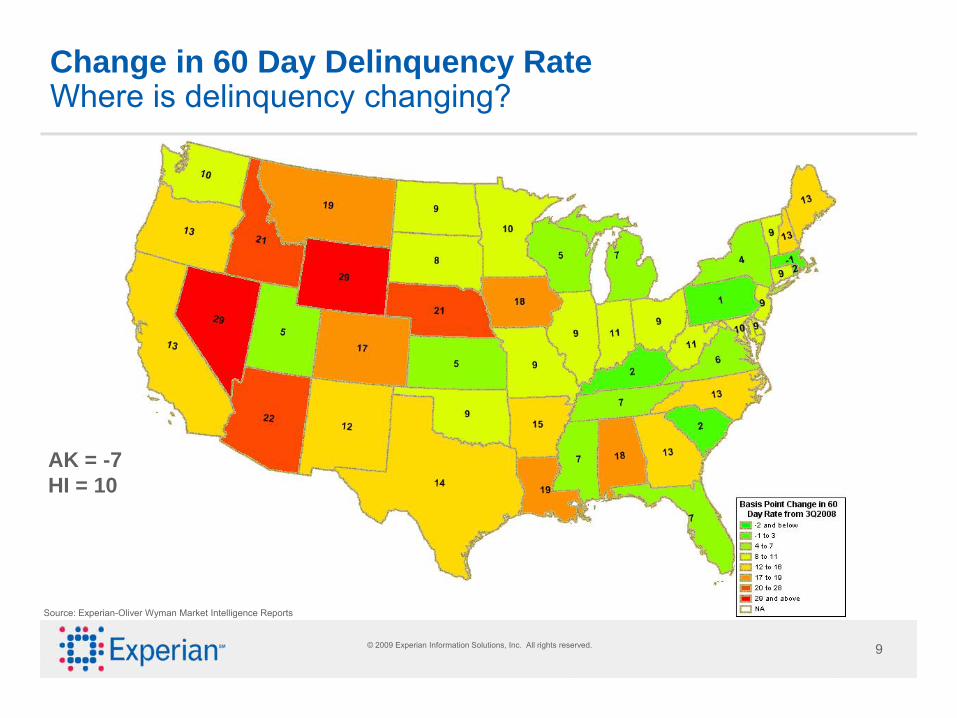
Change in 60 Day Delinquency Rate Where is delinquency changing?
Source: Experian-Oliver Wyman Market Intelligence Reports
AK = -7HI = 10

© 2009 Experian Information Solutions, Inc. All rights reserved. 10
AUTOMOTIVE FINANCINGTHIRD QUARTER 2009

© 2009 Experian Information Solutions, Inc. All rights reserved. 11
Average Credit Score on New Vehicles Financed 3Q2009Which states have higher credit scores?
Source: Experian Automotive

© 2009 Experian Information Solutions, Inc. All rights reserved. 12
Average Credit Score on Used Vehicles Financed 3Q2009Which states have higher credit scores?
Source: Experian Automotive

© 2009 Experian Information Solutions, Inc. All rights reserved. 13
Quarterly Financing for New and Used VehiclesHow has credit changed for new and used financing?
14.4%
-3.3%
-12.8%
-21.0%
-12.6%
-25%
-20%
-15%
-10%
-5%
0%
5%
10%
15%
20%
Super Prime
Prime Nonprime Subprime Deep Subprime
Change in Vehicle Financing from 3Q2008
52.71%46.06%42.84%
13.29%13.74%
13.76%
12.15%13.94%
14.48%
10.55%13.34%15.32%
11.29%12.92%13.60%
0%
10%
20%
30%
40%
50%
60%
70%
80%
90%
100%
3Q20093Q20083Q2007
Vehicle Financing by Credit Tier
Super Prime Prime Nonprime Subprime Deep Subprime
Source: Experian Automotive

© 2009 Experian Information Solutions, Inc. All rights reserved. 14
Quarterly Financing for New and Used VehiclesHow has financing on vehicles changed?
42.08% 39.24% 35.64% 38.90% 41.17% 36.28% 31.85% 36.02%42.77%
57.92% 60.76% 64.36% 61.10% 58.83% 63.72% 68.15% 63.98%57.23%
0%
10%
20%
30%
40%
50%
60%
70%
80%
90%
100%
3Q2007 4Q2007 1Q2008 2Q2008 3Q2008 4Q2008 1Q2009 2Q2009 3Q2009
Market Share by Vehicle Type
New Used
-2.72%
3.89%

© 2009 Experian Information Solutions, Inc. All rights reserved. 15
Credit Scores on Vehicle FinancingHow have scores changed?
749 749 753 755762 766
773 774 775
663 661653
668 670 668661
677684
580
600
620
640
660
680
700
720
740
760
780
800
3Q2007 4Q2007 1Q2008 2Q2008 3Q2008 4Q2008 1Q2009 2Q2009 3Q2009
Average Credit Score
New Score Used Score
14
13

© 2009 Experian Information Solutions, Inc. All rights reserved. 16
Quarterly Financing for New and Used VehiclesHow has credit changed for new and used financing?
Super Prime
Prime
Nonprime
Subprime
Deep Subprime
Source: Experian Automotive
69.88%63.15%58.51%
13.21%14.45%14.52%
9.79%12.05%12.75%5.66%7.98%10.29%1.46%2.37%3.93%
0%
20%
40%
60%
80%
100%
3Q20093Q20083Q2007
New Vehicle Financing
39.89%34.11%31.46%
13.35%13.25%13.20%
13.92%15.26%15.73%
14.20%17.09%18.98%
18.64%20.29%20.63%
0%
20%
40%
60%
80%
100%
3Q20093Q20083Q2007
Used Vehicle Financing
10.7%
-8.6%-18.8%
-29.1%-38.3%
16.9%
0.8%
-8.7%-16.9% -8.1%
-50%-40%-30%-20%-10%
0%10%20%
Super Prime Prime Nonprime Subprime Deep Subprime
Change in Vehicle Financing from 2Q2008
CHANGE - NEW CHANGE - USED

© 2009 Experian Information Solutions, Inc. All rights reserved. 17
Used Car Financing by Dealer TypeHow is financing changing by dealer type?
Source: Experian Automotive
30.85%30.10%27.62%
69.15%69.90%72.38%
0%
10%
20%
30%
40%
50%
60%
70%
80%
90%
100%
3Q20093Q20083Q2007
Used Vehicle Financing by Dealer Type
Independent Used Franchise Used
612605606
716
698685
540
560
580
600
620
640
660
680
700
720
740
3Q20093Q20083Q2007
Average Credit Scores on Used Vehicle Financing
Independent Used Franchise Used
-1.07
2.50%
18
7

© 2009 Experian Information Solutions, Inc. All rights reserved. 18
Credit Distribution by Dealer TypeHow has dealer type changed by credit mix?
48.03%
21.62%
15.22%
9.18%
14.64%
12.31%
12.46%
18.09%
9.64%
38.81%
0%
10%
20%
30%
40%
50%
60%
70%
80%
90%
100%
Franchise Used Independent Used
Used Vehicle Risk Distributionby Dealer Type
Super Prime Prime Nonprime Subprime Deep Subprime
18.34%
1.09%
-10.15%
-23.11%
-2.73%
13.41%
1.39%
-4.14%
-5.54%
-2.73%
-30%
-25%
-20%
-15%
-10%
-5%
0%
5%
10%
15%
20%
25%
Super Prime Prime Nonprime Subprime Deep Subprime
Change in Used Financing from 3Q2008
Franchise Change Independent Change
Source: Experian Automotive

© 2009 Experian Information Solutions, Inc. All rights reserved. 19
Top 20 Lenders by Market ShareWho gained or lost share?
7.2% 6.3% 5.0% 4.6% 3.6% 3.3% 2.3% 1.9% 1.7% 1.4% 1.4% 1.2% 1.1% 0.9% 0.9% 0.8% 0.7% 0.7% 0.7% 0.6%
93.3%
8.4%
41.1%
-19.6%-25.3%-21.1%
7.1% 12.4%
36.0%
-12.8%
81.3%
48.2%
21.5%
-30.6%
77.6%
10.5%
29.6%
-9.3%
12.1%
121.4%
-40%
-20%
0%
20%
40%
60%
80%
100%
120%
140%
0%
1%
2%
3%
4%
5%
6%
7%
8%
Top 20 Lenders By Market Share: Total Loan
3Q2009 Share Change in Share from 3Q08
Source: Experian Automotive

© 2009 Experian Information Solutions, Inc. All rights reserved. 20
Top 20 New Lenders by Market ShareWho gained or lost share on New Vehicle Financing?
11.2% 11.1% 9.1% 7.1% 6.9% 3.9% 3.7% 3.3% 2.0% 1.8% 1.6% 1.5% 1.5% 1.3% 1.2% 1.2% 1.2% 1.1% 1.0% 1.0%
10.1%
129.5%
-5.0%-12.0%
-32.3%
103.1%
65.6%
-23.0%
51.9%
75.2%
113.0%
-8.4% -9.1%
84.5%
103.3%
-22.0%-2.5%
35.9%34.2%20.3%
-60%
-40%
-20%
0%
20%
40%
60%
80%
100%
120%
140%
0%
2%
4%
6%
8%
10%
12%
Top 20 New Lenders by Market Share
3Q09 Share Change in Share from 3Q08
Source: Experian Automotive

© 2009 Experian Information Solutions, Inc. All rights reserved. 21
Top 20 Used Lenders by Market ShareWho gained or lost share on Used Vehicle Financing?
5.7% 4.5% 3.0% 1.8% 1.6% 1.3% 1.2% 1.2% 1.2% 1.1% 1.1% 1.1% 1.0% 1.0% 0.9% 0.9% 0.8% 0.8% 0.7% 0.6%
24.6%
50.7%
0.7%7.0%
-51.2%
-2.2%
67.6%
-29.7%
64.3%
-1.8%9.1%
34.2%
6.4%
-21.1%-20.5%
19.4%
36.8%42.6%
-5.5%
-49.6%
-60%
-40%
-20%
0%
20%
40%
60%
80%
0%
1%
2%
3%
4%
5%
6%
7%
Top 20 Used Auto Lenders by Market Share
3Q09 Share Change in Share from 3Q08
Source: Experian Automotive

© 2009 Experian Information Solutions, Inc. All rights reserved. 22
Top 20 Subprime/Nonprime LendersWho’s winning in the high risk space?
6.9% 5.7% 5.6% 5.5% 3.7% 3.7% 2.9% 2.1% 1.5% 1.2% 1.1% 0.9% 0.9% 0.9% 0.9% 0.8% 0.6% 0.5% 0.5% 0.5%
298.42%
505.38%
270.96%
461.93%
150.09%
259.42%231.32%
305.69%
115.13%
402.96%
114.90%
511.63%
430.36%
209.14%168.12%
445.21%
-28.05%
437.89%
292.05%
-100%
0%
100%
200%
300%
400%
500%
600%
0%
1%
2%
3%
4%
5%
6%
7%
8%
Top 20 Subprime/Nonprime Lenders
3Q09 Share Change in Share from 3Q08
6000+%
Source: Experian Automotive

© 2009 Experian Information Solutions, Inc. All rights reserved. 23
Vehicle Financing and Credit ScoresHow has financing changed by credit score?
• High risk segments experiencing greater shifts in amount financed
• Deep Subprime decreased $1,976 on New financing
• Subprime decreased $1,376 on Used financing• Deep Subprime finance on average $8,545 more on
New loans than Used• Super Prime Used financing experienced the only
increase ($114)
$22,317 $23,555 $24,759 $25,307 $23,750
$20,341 $21,561 $22,936 $23,688 $22,623
$10,000
$15,000
$20,000
$25,000
$30,000
Deep Subprime
Subprime Nonprime Prime Super Prime
Average Amount Financed on New Vehicles
3Q2008 3Q2009
$13,076
$15,020$15,832
$16,734 $16,871
$11,796
$13,644$14,855
$16,223
$16,986
$10,000
$12,000
$14,000
$16,000
$18,000
Deep Subprime
Subprime Nonprime Prime Super Prime
Average Amount Financed on Used Vehicles
3Q2008 3Q2009
-$1,976 -$1,994-$1,824
-$1,619
-$1,128-$1,280 -$1,376-$977
-$511
$114
-$2,500
-$2,000
-$1,500
-$1,000
-$500
$
$500
Deep Subprime
Subprime Nonprime Prime Super Prime
Change in Average Amount Financed
CHANGE - NEW CHANGE - USED
Source: Experian Automotive

© 2009 Experian Information Solutions, Inc. All rights reserved. 24
Vehicle Payments and Credit ScoresHow has monthly payment change by credit score?
• Average monthly payments decreased for all risk segments except Super Prime Used financing (up $3)
• Greatest decreases in New payments were seen in the higher risk segments
• At most a $10 difference is seen across New payments by risk while Used payments show more differentiation
$465 $462$455 $450
$444
$431 $428 $424 $423 $421
$400$410$420$430$440$450$460$470
Deep Subprime
Subprime Nonprime Prime Super Prime
Average Monthly Payment on New Vehicles
3Q2008 3Q2009
$355 $352
$335$330 $331
$343$334
$320$325
$334
$300
$310
$320
$330
$340
$350
$360
Deep Subprime
Subprime Nonprime Prime Super Prime
Average Monthly Payment on Used Vehicles
3Q2008 3Q2009
-$34 -$34-$31
-$26-$23
-$12-$18
-$15
-$6
$3
-$40-$35-$30-$25-$20-$15-$10-$5
$$5
Deep Subprime
Subprime Nonprime Prime Super Prime
Change in Average Monthly Payment
CHANGE - NEW CHANGE - USED
Source: Experian Automotive

© 2009 Experian Information Solutions, Inc. All rights reserved. 25
Interest Rate and Credit ScoresHow does rate change by credit score?
• Highest rates are seen in the highest risk segments• Rates increased in higher risk segments• Nonprime Used financing experienced the greatest
decrease in rates (27 bps)• Used rates are 173-225 bps higher than New rates
within the same risk segment
13.49%
11.21%
8.18%6.28%
4.88%
14.00%
11.42%
8.16%6.24%
4.80%
4%
6%
8%
10%
12%
14%
16%
Deep Subprime
Subprime Nonprime Prime Super Prime
Average Rate on New Vehicles
3Q2008 3Q2009
16.04%14.31%
10.91%
8.48%6.63%
16.25%
14.24%
10.64%
8.32%6.54%
5%
7%
9%
11%
13%
15%
17%
Deep Subprime
Subprime Nonprime Prime Super Prime
Average Rate on Used Vehicles
3Q2008 3Q2009
51
21
(2) (4) (8)
21
(6)(27)
(16) (9)(40)
(20)
-
20
40
60
Deep Subprime
Subprime Nonprime Prime Super Prime
Change in Average Rate(Basis Points)
CHANGE - NEW CHANGE - USED
Source: Experian Automotive

© 2009 Experian Information Solutions, Inc. All rights reserved. 26
Vehicle Term and Credit ScoresHow has term change by credit score?
• Steady drop in term across all risk segments for both New and Used financing
• High risk Used financing saw significant decreases in term (-4.29 months in Deep Subprime)
• Super Prime New loans average 1.8 months longer term than Used; Deep Subprime average 20.4 months shorter on Used than New loans
68.21 68.69 67.9266.74
61.43
67.36 67.76 66.9065.67
60.88
56
58
60
62
64
66
68
70
Deep Subprime
Subprime Nonprime Prime Super Prime
Average Term on New Vehicles
3Q2008 3Q2009
51.2559.04 60.49 61.48 59.54
46.9655.53 58.48 60.09 59.08
0
10
20
30
40
50
60
70
Deep Subprime
Subprime Nonprime Prime Super Prime
Average Term on Used Vehicles
3Q2008 3Q2009
(0.85) (0.94) (1.03) (1.07)(0.55)
(4.29)
(3.52)
(2.01)(1.39)
(0.46)
(5.00)(4.50)(4.00)(3.50)(3.00)(2.50)(2.00)(1.50)(1.00)(0.50)
-Deep
SubprimeSubprime Nonprime Prime Super Prime
Change in Average Term
CHANGE - NEW CHANGE - USED
Source: Experian Automotive

© 2009 Experian Information Solutions, Inc. All rights reserved. 27
Third Quarter 2009 In Summary
Relatively steady credit quality in year-over-year comparisonOverall balances have declined to just over $673 billion (-4%)Steady increase in delinquency rates and balances with 30-day balances decreasingNew originations dominating in the Prime+ market (66%) up 10%► Scores on both new and used vehicles continue to increase► Over 83% of new buyers are prime+► Over 53% of used buyers are prime+
Used financing dipped in year-over-year comparisonFinanced amounts and monthly payments dropped year-over-yearRates adjusted by risk while terms decreased in all risk segments

© 2009 Experian Information Solutions, Inc. All rights reserved. 28
Questions?
Thank you for attending our Web seminar

© 2009 Experian Information Solutions, Inc. All rights reserved. 29© 2009 Experian Information Solutions, Inc. All rights reserved.Experian Public.