Embed Size (px)
Citation preview

General rights Copyright and moral rights for the publications made accessible in the public portal are retained by the authors and/or other copyright owners and it is a condition of accessing publications that users recognise and abide by the legal requirements associated with these rights.
Users may download and print one copy of any publication from the public portal for the purpose of private study or research.
You may not further distribute the material or use it for any profit-making activity or commercial gain
You may freely distribute the URL identifying the publication in the public portal If you believe that this document breaches copyright please contact us providing details, and we will remove access to the work immediately and investigate your claim.
Downloaded from orbit.dtu.dk on: May 05, 2020
State of the Art Smart Grid Laboratories - A Survey about Software UseRTLabOS D1.2
Heussen, Kai; Gehrke, Oliver
Publication date:2014
Document VersionPublisher's PDF, also known as Version of record
Link back to DTU Orbit
Citation (APA):Heussen, K., & Gehrke, O. (2014). State of the Art Smart Grid Laboratories - A Survey about Software Use:RTLabOS D1.2. Technical University of Denmark, Department of Electrical Engineering.
State of the Art Smart Grid Laboratories
- A Survey about Software Use
RTLabOS D1.2
Kai Heussen and Oliver Gehrke
November 2014

State of the Art Smart Grid Laboratories - A Survey about Software Use
Report RTLabOS Phase I: D1.2
2014
By
Kai Heussen and Oliver Gehrke
Based on questionnaire developed in collaboration with Evgenia Dmitrova
Copyright: Reproduction of this publication in whole or in part must include the
customary bibliographic citation, including author attribution, report title,
etc.
Cover illustration: Anna Magdalena Kosek
Published by: Department of Electrical Engineering, Elektrovej
Request report from: www.dtu.dk


Preface
In the course of over a year, we have researched, structured and formulated the software needs
of smart grid laboratories. With the aim to identify central common needs and requirements to
support a “next generation” of Smart Grid laboratories, we held international workshops, carried
out exploratory feasibility studies, structured our ideas into formal use cases and carried out
surveys.
Intended as a State of the Art assessment, this report is among the first conceived in the
project. The survey questionnaire was motivated by questions raised in the first RTLabOS
workshop and our first structuring of the domain in the report “D1.1 Domain Study”. It quickly
came clear that establishing a “state of the art” in a field that is so broad and under such rapid
development was a fool’s errand; instead, this report offers a qualitative study of actual
developments and focus areas in Smart Grid laboratories. The study can be viewed as a
snapshot of the different characteristics exhibited by a selected range of smart grid laboratories
with a focus on ‘system testing’. With the small number of participants, the diversity of focus
areas and resources, and the rapid development of the labs investigated, we focused on
summarizing information combining “statistical” evidence from the survey with qualitative insight
gained from interviews.
In hindsight, most valuable, we find anecdotal evidence of the different scientific and
commercial value propositions and development paths and that come with interpretations of the
term “smart grid laboratory”.
Last, not least, I should mention all those who have made this survey possible by filling out the
extensive questionnaire and responding to my questions:
Filip Andrén, Roland Bründlinger and Thomas Strasser, SmartEST Lab, AIT
Maxime Baudette, Muhammad Shoaib Almas and Luigi Vanfretti, SmarTSLab, KTH
Lars Nordström, PSMIX, KTH
Holger Kley and Oliver Pacific, InteGrid Lab, Spirae
Sami Repo, Smart Grid Lab, TU Tampere
Bryan Palmintier and Ben Kroposki, ESIF, NREL
Oliver Gehrke and Henrik Bindner, PowerLabDK SYSLAB, DTU
Chresten Træholt and Arne Hejde Nielsen, PowerLabDK Electric Lab, DTU
Qiuwei Wu, PowerLabDK Intelligent Control Lab, DTU
Lea Lohse and Jacob Østergaard, PowerLabDK, DTU
I would like to thank all for their patient collaboration and insightful comments-
Copenhagen, November 2014
Kai Heussen
Assistant Professor
Project Leader of RTLabOS Phase I
DTU Electrical Engineering

Content
1. Overview and Characterization of Participating Smart Grid Laboratories .......................... 7
2. Individual Laboratory Profiles ............................................................................................ 10
2.1 AIT SmartEST Lab .......................................................................................................................... 10
2.2 KTH – SmartTSLab and PSMIX ...................................................................................................... 10
2.3 CSU & Spirae - InteGrid Test and Development Laboratory (InteGrid Lab) ................................... 12
2.4 Technical University of Tampere – Smart Grid Lab ......................................................................... 12
2.5 NREL – Energy Systems Integration Facility (ESIF) ....................................................................... 13
2.6 DTU – PowerLabDK ........................................................................................................................ 14
3. Focus and Activity Areas ................................................................................................... 16
3.1 Prioritized activity types during design and lab use ......................................................................... 16
3.2 Research Focus Areas .................................................................................................................... 17
4. Software Competences and Tools .................................................................................... 19
4.1 Strategic Software competences ..................................................................................................... 19
4.2 Simulation tools and Programming.................................................................................................. 21
5. Lab Operation and Software Support ................................................................................ 23
5.1 Data acquisition and lab monitoring ................................................................................................ 23
5.2 Custom control in the lab ................................................................................................................. 25
5.3 Advanced lab management tools .................................................................................................... 27
5.4 Simulation, Co-Simulation, HIL........................................................................................................ 30
5.5 Coordination, information sharing and formal barriers ..................................................................... 32
6. Conclusion ......................................................................................................................... 35
6.1 Main results ..................................................................................................................................... 35
6.2 Specific insights............................................................................................................................... 35
6.3 Possible future work ........................................................................................................................ 36
References .................................................................................................................................. 38
A Appendix A Survey Questionnaire .............................................................................................. 39
7
1. Overview and Characterization of Participating Smart Grid Laboratories
The labs participating in this survey cover a wide area of applications and funding scales. All
labs can be said to support “system testing” in the sense of the RTLabOS project, but only a
subset also supports component tests.
The labs selected who have participated in the survey are:
AIT, SmartEST Lab (Research Institute, certified test laboratory, Austria)
KTH (University, Sweden):
o SmarTSLab (Deparment of Electric Power Systems)
o PSMIX Power System Management with Related Information eXchange
(Deparment of Industrial Information & Control Systems)
NREL, Energy Systems Integration Facility (Research Institute, Colorado, US)
TUT, Smart Grid Lab (University, Finland)
CSU & Spirae, InteGrid Lab (co-owned by university and company - Colorado, US)
DTU, PowerLabDK (University, Denmark)
o SYSLAB
o Intelligent Control Lab & Electric Lab
To indicate the ambition scale of each laboratory, we provided categories for the (logarithmic)
scale of initial and cumulative investments into the lab:
Category I II III IV V
Investment € / US$ 10.000 100.000 1.000.000 10.000.000 100.000.000
All participating labs were of at least category II, of which several have cumulated to cat. III.
While several labs have been funded in a range of 10 Million €, NREL’s ESIF stands out with
around 100 Million € invested.
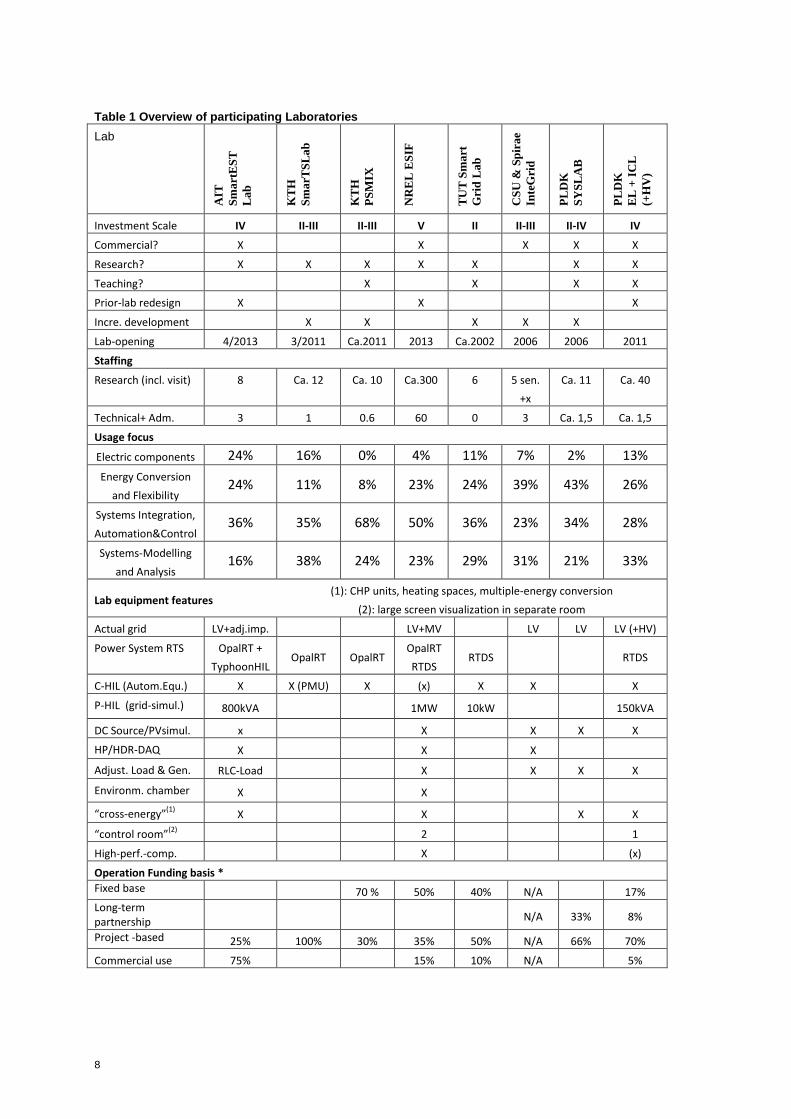
A number of factors characterizing the participating labs are summarized in Table 1. From these
overview criteria we can draw some preliminary insights:
Larger labs and labs that support commercial use employ more technical staff:
o In research labs only 5-20% of staff are technical/administrative
o In commercial labs the 20-40% of staff are technical/administrative
Funding models vary greatly among labs;
o project-based funding is most common
o concentration on either fixed base funding or returns from commercial use are
specific for smaller and focused labs with either teaching or commercial focus
Combining research and commercial lab use is a common model; on the contrary,
combination of teaching with commercial use is hardly seen
Power system real-time simulators (PS-RTS) are the most common asset;
o commercial use is only common if combined with power hardware in the loop
(PHIL) equipment – expensive labs;
o commercial automation testing is also feasible without PS-RTS (InteGrid)
8
Table 1 Overview of participating Laboratories
Lab
AIT
Sm
art
ES
T
La
b
KT
H
Sm
arT
SL
ab
KT
H
PS
MIX
NR
EL
ES
IF
TU
T S
ma
rt
Gri
d L
ab
CS
U &
Sp
ira
e
Inte
Gri
d
PL
DK
SY
SL
AB
PL
DK
EL
+ I
CL
(+H
V)
Investment Scale IV II-III II-III V II II-III II-IV IV
Commercial? X X X X X
Research? X X X X X X X
Teaching? X X X X
Prior-lab redesign X X X
Incre. development X X X X X
Lab-opening 4/2013 3/2011 Ca.2011 2013 Ca.2002 2006 2006 2011
Staffing
Research (incl. visit) 8 Ca. 12 Ca. 10 Ca.300 6 5 sen.
+x
Ca. 11 Ca. 40
Technical+ Adm. 3 1 0.6 60 0 3 Ca. 1,5 Ca. 1,5
Usage focus
Electric components 24% 16% 0% 4% 11% 7% 2% 13%
Energy Conversion
and Flexibility 24% 11% 8% 23% 24% 39% 43% 26%
Systems Integration,
Automation&Control 36% 35% 68% 50% 36% 23% 34% 28%
Systems-Modelling
and Analysis 16% 38% 24% 23% 29% 31% 21% 33%
Lab equipment features (1): CHP units, heating spaces, multiple-energy conversion
(2): large screen visualization in separate room
Actual grid LV+adj.imp. LV+MV LV LV LV (+HV)
Power System RTS OpalRT +
TyphoonHIL OpalRT OpalRT
OpalRT
RTDS RTDS RTDS
C-HIL (Autom.Equ.) X X (PMU) X (x) X X X
P-HIL (grid-simul.) 800kVA 1MW 10kW 150kVA
DC Source/PVsimul. x X X X X
HP/HDR-DAQ X X X
Adjust. Load & Gen. RLC-Load X X X X
Environm. chamber X X
“cross-energy”(1)
X X X X
“control room”(2)
2 1
High-perf.-comp. X (x)
Operation Funding basis *
Fixed base 70 % 50% 40% N/A 17%
Long-term partnership N/A 33% 8%
Project -based 25% 100% 30% 35% 50% N/A 66% 70%
Commercial use 75% 15% 10% N/A 5%

9
From these initial values most significant and apparent differentiation is the hardware lab (HW-
lab) vs. the simulation lab (Sim-lab):
o HW-lab: work on actual electric components and grids; simulation is secondary
Opt. 1: “emulation” of infeed and load via controllable sinks & sources
InteGrid, SYSLAB
Opt. 2: “closed loop PHIL” use of PS-RTS with ‘grid simulator’ (inverter)
SmartEST, ESIF, TUT, PLDK-ICL+EL
Sophisticated DAQ equipment is available in all commercial labs
SmartEST, ESIF, InteGrid
o Sim-lab: replaces electric current with a real-time simulator; hardware is at
most control hardware (C-HIL).
PSMIX, SmarTSLab, TUT, PLDK-ICL
o Due to its scale, ESIF combines both types of labs and adds high-performance
computing (HPC);
PLDK ICL+EL has a scale to combine the two as well; lacking
sophisticated DAQ infrastructure and HPC.
The distinctions identified here find deeper elaboration in the reflections of Chapter 3 “Focus
and Activity Areas”.
Finally, it should be remarked that this survey aims to characterize the activities in a smart grid
lab (SG) in relation to lab features, software use and staff competences. In this sense, we aim
to characterize the labs as ecosystems including
Physical installations of a lab (as reported above)
Software for managing, operating and interfacing with the lab
Software and control systems tested by means of lab experiments
Software used by researchers in context of preparing
Staff associated with a lab
(primarily technical and research staff directly in contact with the physical lab)
Activities (research, testing, etc.) in context of the lab, both directly associated with
experiments and for preparation and processing of results
With responses from about eight labs, and considering the large number of factors taken into
account, we should view the following results as anecdotal evidence and can only expect to
draw conclusions in a qualitative sense.

10
2. Individual Laboratory Profiles
The laboratories participating in this survey are characterized in the following by providing a
short context as well as fey focus areas, design philosophy and key features as stated in the
survey response.
2.1 AIT SmartEST Lab
AIT's SmartEST Lab was conceived as a re-design of an earlier inverter testing facility at a
30kW scale which operated as test and research lab for distributed generators for about 10
years; the over 30x increase in inverter scale was enabled by a significant investment and
meets current industry demands for testing and validation.
As key focus areas, SmartEST Lab works on
1. Research/development/testing of network devices and components of distributed
generation
2. DER components system integration & system control/automation
3. P-HIL-based DER inverter system integration research.
The design philosophy is formulated as:
Freely configurable AC LV grid for component and integration tests with flexible and configurable components (i.e., laboratory grids (test grids), adjustable loads, grid and PV simulator)
The key features of the SmartEST Lab are:
1. Advanced testing infrastructure for Distributed Energy Resources up to about 1
MVA power rating
2. Full power LV grid and PV array simulation
3. Hardware-in-the-loop testing possibilities (incl. power-hardware-in-the-loop)
2.2 KTH – SmartTSLab and PSMIX
At KTH we talked to two different labs which were established between 2010 and 2011 and with
an initial internal funding in range of II and have been build up in context of a local research
group. Yet, despite technical similarities their focus, approach and funding model are very
different. While the driver for both labs has been a specific identified research gap, their fields
are quite different and are thus treated separately in the following.
2.2.1 Department of Electric Power Systems - SmarTSLab
Located in the Power Systems department, the SmarTSLab is designed for tackling genuine
power system stability issues. It was built from scratch as test-bench for interfacing power
system real-time simulations with monitoring, control and protection equipment as well as the
necessary ICT systems. The controlled lab environment provides a platform for closed loop
testing of system integration of PMUs and PMU-based technologies.

11
As key focus areas, SmarTSLab aims for
1. real-time system health monitoring
2. control techniques for system health and performance optimization
3. Wide area protection
The key features of the SmarTSLab are:
1. RTS-HIL for PMU applications
2. IEC61850 compliance for protection
3. custom software libraries for PMU integration
In summary, SmarTSLab provides a versatile platform to develop and test the full infrastructure
of advanced PMU-based power system stability, protection and decision support systems.
Correspondingly, SmartTSlab has collaborations with several utilities, vendors and universities.
2.2.2 Dept. of Industrial Information & Control Systems - PSMIX - Power System Management with Related Information eXchange
Located in the Department of Industrial Information & Control Systems, the PSMIX lab focusses
on software and interoperability. The laboratory platform has been optimized to allow
distribution of controllers and at the same time mimicking as much as possible industrial
architectures for control systems; i.e. including real hardware devices for measurement,
protection and control to which prototype distributed controllers can interface.
Aiming to support activities related to System Integration of industrial equipment, SCADA
software and architectures, the key focus areas are:
1. Distributed control schemes
2. Cyber physical systems, interdependence of Power and ICT
3. Control system architectures
As a redesign, PSMIX is based on two earlier teaching facilities: one distributed control platform
for Railway train operation built and one basic SCADA system laboratory for simple power
system remote control applications,both developed for teaching. The main learning carried
forward from these systems were the teaching module that could to some extent be reused.
From a technology perspective some limited parts of instrumentation and communication
devices could be used in the new platform.
The key features of the PSMIX are:
1. Hardware in the loop for automation equipment
2. Real-time integration of power and ICT system
3. Ease of configuration
It should be noted, that this is the only lab in the survey which was designed to also support
teaching in the field. This aspect is related also in the funding, which has a significant fixed
operational funding contribution from the university.

12
As of now, PSMIX does not collaborate with utilities, but with several vendors and scientific
partners.
2.3 CSU & Spirae - InteGrid Test and Development Laboratory (InteGrid Lab)
The InteGrid lab is located inside a larger lab of Colorado State University (CSU) and is co-
owned and operated by CSU and Spirae.
Intended as a scaled-down test bed for testing control in the context of a Danish distribution
grid, the InteGrid lab was designed with the flexibility to grow to include additional asset types
and control scenarios.
Even though it is a small lab, it started with a high ambition level with respect to the effective
support of the control systems development and deployment process: from green field to
demonstration of control concepts with natural gas reciprocating engines and Danish style wind
turbines in 7.5 months with a budget of $500k.
Instead of real-time simulators and P-HIL setups with, the lab works with real electric machines.
Design focus areas have been:
1. Development and testing of coordinated microgrid controls
2. Development and testing of asset level controllers. (“Asset” includes such items as
generators, load banks, etc.)
3. Commercial and publically funded demonstrations.
While in design, testing and validation, time series acquisition, and demonstration have been in
focus, in actual use its capability to support controller development and deployment has proven
more important than time series acquisition in general.
The key features of the InteGrid lab are:
1. Wind turbine and solar simulators to mimic real-world wind and solar transients
2. Bumpless islanding/resynchronization of microgrid with 1 s load profiles
3. Interconnect license that allows power export of up to 2 MW
Collaborations include several utilities, vendors, universities, and public sector entities.
2.4 Technical University of Tampere – Smart Grid Lab
The Smart Grid Lab at TU Tampere (TUT SGL) has grown incrementally with a central piece
being the RTDS power system real-time simulator. While the strong power system analysis
focus by means of real-time simulation is comparable to KTH SmarTSlab, it is distinct with
capabilities of Power-HIL simulation and that research activities are rather focused on
distribution systems.
In the lab design the guiding ideas have been: Interoperability at function level ; focus on
controls; study interactions of controls & markets.
The focus areas of the lab activities are:
1. Congestion management in Distribution grids
2. Automation development

13
3. Home automation & grid interaction
The most distinguished capabilities of the lab:
1. RTDS with PHIL
2. Advanced distribution automation & Real-time communication
3. Home automation
For the operation of the TUT SGL, it has shown that while demonstration has been prioritized
along with testing and validation over controller development and deployment, this last activity
has proven the most important in practice. Collaborations include utilities, vendors, and
scientific entities. In particular, a TUT internal cross-department collaboration with an industrial
automation department helps providing software for system integration at a service level.
The TUT is currently undergoing an investment program, where the lab will have stronger
hardware based focus. Components are PV emulator, EV, stationary batteries. Also more
commercial IEDs and communication equipment will be purchased.
2.5 NREL – Energy Systems Integration Facility (ESIF)
The ESIF facility has a lone leading position as the only ‘Category V’ lab. With its mere scale it
covers the activities of other labs, but it also includes many researchers and activities outside
the power system scope, who utilize the multi-energy systems capacities and the
supercomputing centre for e.g. climate research. Funded and owned by DOE, it is operated by
NREL – Alliance for Sustainable Energy (MRI & Batelle). More information on the facilities is
found in [1].
A prior lab at NREL that provided some experience for the design of ESIF was the DER-test
facility (DERTF), which enabled electrical testing of distributed energy resources and grid
interactions to some extent. Compared to DERTF, ESIF represents a shift in focus from
component (DERs) to energy system testing, along with a roughly 100-fold increase in
investment scale (driven by: a scale-up of the inverter (grid interface); addition of thermal and
fuel-based energy forms, as well a world-scale high-performance computing facility).
The top three focus areas of the lab may be summarized as:
1. Energy systems integration and interoperability across energy forms and data
2. Facilitating industrial development of cross-energy solutions
3. High-performance computing, data analysis and visualization
Top three most distinguished capabilities of the lab:
1. MW-scale system testing with 1MW grid-simulator
2. Interconnectability of labs across energy (electricity, thermal, fuels & data)
3. HPC facility
Collaborations include several utilities, vendors, universities, and public sector entities.
NREL also includes other associated labs, the DERTF mentioned above, a thermal test facility
(TTF), a vehicle testing and integration facility (VTIF) and a renewed MW-scale wind turbine test
facility (NWTC), which has been considered for comparison; however, while a very advanced

14
facility with 5MW P-HIL ‘controllable grid interface’, the focus of the NWTF is component-
oriented and thus not suited for the scope of this work.
Cross-site integration of lab & simulation facilities, e.g. between the NWTC and ESIF is
considered for future activities.
2.6 DTU – PowerLabDK
At DTU Center for Electric Power and Energy, the PowerLabDK facilities encompass several
originally independent laboratories: the Bornholm Island Power system, Electric Lab, High
Power Lab, High Voltage Lab, Intelligent Control Lab, Nordic Electric Vehicle Interoperability
Center (NEVIC), PowerFlexHouse, Power Student Lab, and SYSLAB.
Of these labs, three have been identified as relevant for system testing in the sense of this
research:
SYSLAB (located on Risø campus);
Intelligent Control Lab (ICL; Lyngby campus), and
Electric Lab (EL; Lyngby campus)
ICL and EL are integrated via a professional ABB SCADA system, which also supervises the
local High-voltage Lab (HV) and integrates data from the Bornholm island power system.
Electric lab and HV lab are electrically interconnected (configurable), furthermore the ICL and
EL can be integrated via a P-HIL setup. The PowerFlexHouse, HV-lab and the Bornholm power
system are potentially relevant for system testing, but have been excluded from the further
analysis here, as the core activities at present go beyond the scope of this report.
While the potential and vision for PowerLabDK (PLDK) clearly offer perspectives of further
integration of the laboratories, at the time of analysis, the coupling across facilities was less
significant in the ongoing activities, such that we could use the opportunity to gain insight into
characteristic features by looking at the three labs separately where it was helpful, and
otherwise at combining them where it was meaningful.
2.6.1 SYSLAB
Building upon an earlier test facility for Wind/Diesel isolated power systems, SYSLAB has been
conceived as a laboratory for testing new control concepts in power systems, with a special
focus on distributed and decentralized control. A significant part of the development work has
been invested in a software platform which allows independent as well as interconnected
operation of all power system components without enforcing a particular control topology.
The electrical backbone of SYSLAB is a 400V distribution grid which, after multiple extensions,
currently counts 16 busbars and covers an area of almost 1km². The topology of the grid can be
chosen with exceptional flexibility, allowing feeder lengths up to several kilometers. A wide
range of different DER - conventional and renewable generation, storage and various types of
load - are connected in different parts of the distribution grid. Each DER is equipped with a
dedicated computing node on which the SYSLAB software platform executes and on which
custom controllers can be deployed.
In the design, key focus areas have been
1. (Supervisory) control concepts for power grid applications
2. Integration of renewables (Wind, PV)
3. DER components with "smart grid features"

15
In recent years, SYSLAB has grown to integrate a test center for electrical vehicles and
charging infrastructure as well as three smart buildings (a small office building and two
residential buildings) which, in addition to their role as components in SYSLAB, can be used as
standalone facilities for research in building automation and flexible demand.
The top three most distinguished capabilities of SYSLAB are:
1. Distributed control platform (one instance per DER)
2. Complex distribution network with variable topology
3. A wide spectrum of DER technologies including smart buildings
Due to its deep integration with the DER, the SYSLAB ICT platform is used both for lab-
supervision and monitoring (as Lab SCADA or “LabOS”; cf. RTLabOS Use Case reports [2]) as
well as a platform for control software deployment.
SYSLAB has ongoing collaborations with several utilities, vendors, and scientific partners.
2.6.2 Intelligent Control Lab and Electric Lab (ICL+EL)
The PLDK Intelligent Control Lab and Electric Lab on DTU Lyngby campus offer unique
capabilities, combining significant power system real-time simulation resources, and a
professional SCADA system, in the ICL with a configurable lab grid, which allows, e.g. to
connect the 150kVA 4-quadrant power amplifier with one or several of the 22 lab cells.
The labs were designed and build in a first development step which was partly inspired by local
experience with an earlier lab, but to a large extend also on a study of existing power system
labs, an analysis of technical needs and market development.
The labs are currently undergoing a second development step in which is beyond the scope of
this report.
The key focus areas of the combined EL + ICL labs have been identified as:
1. Power system stability and operation
2. Active Distribution Networks operation & management
3. Flexible generation & demand components adaptation to smart grid
From experience in lab operation, at least for the electric lab, it proved that experimentation and
the acquisition of time series for further analysis has been of primary importance as opposed to
demonstration & system integration, as considered in the design phase. Testing & validation is
a key activity for both labs, in practice as considered during design.
The combined top three most distinguished capabilities of PLDK ICL+EL are:
1. RTDS real-time simulators with 10 racks (for simulating up to 480 nodes)
2. A 150kVA 4 quadrant power amplifier in a flexible lab grid (400V) with 22 Lab cells
3. A full scale control room with ABB Network Manager SCADA, and IBM Blade Center

16
3. Focus and Activity Areas
The most characteristic driver for laboratory design should be the activities performed in its daily
operation. Naturally, the can be a shift between the activities anticipated and prioritized in the
lab design phase and those which dominate during lab operation. We considered two main
approaches to characterizing this activity: 1. Activity types and 2. Research Focus areas.
3.1 Prioritized activity types during design and lab use
The first characterization is based on activity types as identified in RTLabOS report D1.1 [3],
identifying ten types of activities. We asked the participants to reflect upon and identify the top
three the priorities during design phase as well as the top usage activities in the past 3 years.
Table 2 summarizes and highlights the results.
Table 2 Summary of prioritized activity focus during design and actual lab use
We interpret the sum of the occurrences as “intensity” or overall importance. If there has been a
difference in priority between intention and actual use, this is indicated by the “Change” value.
The top two activities are clearly “Demonstration” and “Testing and validation”. Next in
importance are “Experimentation”, “Controller development and deployment” and “System
integration”. We observe that “Controller development and deployment” as well as
“Demonstration” proved to be more important than expected during the design stage.
“Experimentation”, in general, and “System Integration” are common, but not as much shared;
comparing across labs these two activities are mostly mutually exclusive, and in sum also
significantly less relevant than expected. An explanation may be that both “System Integration”
and “Experimentation” as activity focus both require a longer experience with the lab system
infrastructure.
Further, “Models development” and “Time series acquisition” have been activities of higher
relevance than expected whereas “Teaching” and “Maintenance and monitoring of equipment”
have not been in focus of actual lab activities.
Activity Classification
Focus
during
design
In Focus
during
actual use
Sum
Change,
incl. rank
change
Demonstration 4 6 10 4
Experimentation 4 3 7 -2
Testing and validation 8 7 15 0
Models development 1 2 3 1
Decision support and tool development 1 1 2 0 Maintenance and monitoring of equipment 0 0 0 0 Controller development and deployment 3 4 7 1
System Integration 4 2 6 -2
Time series acquisition 1 2 3 1
Teaching 1 0 1 -1

17
3.2 Research Focus Areas
Secondly, we asked the participants to indicate the activity level in the lab within specific
technical areas, in Q15 (of Part I of questionnaire, cf. Appendix A). the following table shows the
aggregated results for the four categories.
Based on clustering of labs by assets into “Hardware” (HW) and “Simulation” (SIM) labs, we get
the following impression of the research topics addressed in the labs (by category):
1. Electric Components related challenges are primarily
a. In HW-labs: power electronics (SmartEST; ESIF), electric machines (InteGrid)
b. In ‘simulation labs’: electric transients & HVDC (SmarTSLab)
2. Energy conversion and flexibility
a. Wind power: Mostly via simulation; exceptions: SYSLAB (kW-scale wind
turbines); InteGrid (emulated HW via controlled Diesel gen)
b. PV technology: focus on HW: inverter testing and incl. panel emulation via DC
c. EVs and Energy Storage: Mostly in HW with actual components
d. Buildings, thermal loads & cross-energy management is currently mostly
addressed by HW-labs
3. Systems integration, Automation & Control
a. Protection systems: clearly preference for SIM-labs (classic C-HIL case)
b. Interoperability: Is relevant for all labs; yet, only a work focus for PSMIX & ESIF
c. Distributed automation & Controls design
This subject is a key area for all participating labs without exception
4. Systems Modeling & Analysis
Is ‘key business’ in relation to system experiments; there is little variation across most
labs; what can be observed:
a. SmartEST lab has less focus here; SmarTSlab marks the other end.
b. “DER-grid interactions”, “Isolated power systems” and “stochastic behavior”
are more of interest to HW labs.
c. Diagnostic methods and monitoring are not a focus activity area, except for
the SmartTSLab; yet all labs consider its relevance at least sporadically.
Among the HW labs, we observe a differentiation between ‘classical’ electric labs in that the
focus shifts from electrical testing to energy-flexibility and cross-energy system integration (e.g.
thermal and battery energy storage). Labs with a strong focus on energy flexibility this is trade
this off for reduced activity in electric component testing.
Simulation labs primarily focus on systems modelling and analysis, as well as systems
integration and control. Also here, a focus on either one of those two focus areas is observed
between System Integration (PSMIX & TUT) and Modelling & Analysis (SmarTSlab and PLDK
ICL).
SmartEST SmarTSLab PSMIX TUT InteGrid ESIF PLDK SYSLAB PLDK ICL PLDK EL
Electric
components 24% 16% 0% 4% 11% 7% 2% 7% 20%
Energy Conversion
and Flexibility 24% 11% 8% 23% 24% 39% 43% 21% 32%
Systems
Integration, 36% 35% 68% 50% 36% 23% 34% 26% 30%
Systems-Modeling
and Analysis 16% 38% 24% 23% 29% 31% 21% 47% 19%

18
Figure 1 Clustering of activity focus areas.
These observations are strongly guided by intuition on the research subject areas and
understanding of the lab activities. Figure 1 illustrates the evidence clusters the labs into these
three “strategic” profiles:
1. Energy System Integration & Flexibility Lab (InteGrid. ESIF, PLDK SYSLAB)
2. Electric & Electronic Systems Lab (SmartEST, PLDK EL)
3. Simulation Lab (SmartTSLab, PSMIX, TUT, PLDK ICL)
One factor driving the research focus is naturally the scale of a lab: to contribute to research in
several academic disciplines requires active research in each discipline, which can only be
achieved by a larger scale. The alternative, achieving interdisciplinary results relevant for a
given application requires a special, application-driven culture.
Whether these profiles will prevail as natural focus areas, or if a strategic convergence across
profiles is possible is unclear from the limited available data.
19
4. Software Competences and Tools
In this chapter direct software aspects, including software competences, simulation tools and
programming languages.
4.1 Strategic Software competences
The level of software competence is decisive for the flexibility with regard to handling less
mature (research-level) software and to adapt or advance it to new research purposes.
Mature software supports a user in carrying out a focus activity; it requires a relatively stable
methodological or application focus for the software not to require further development.
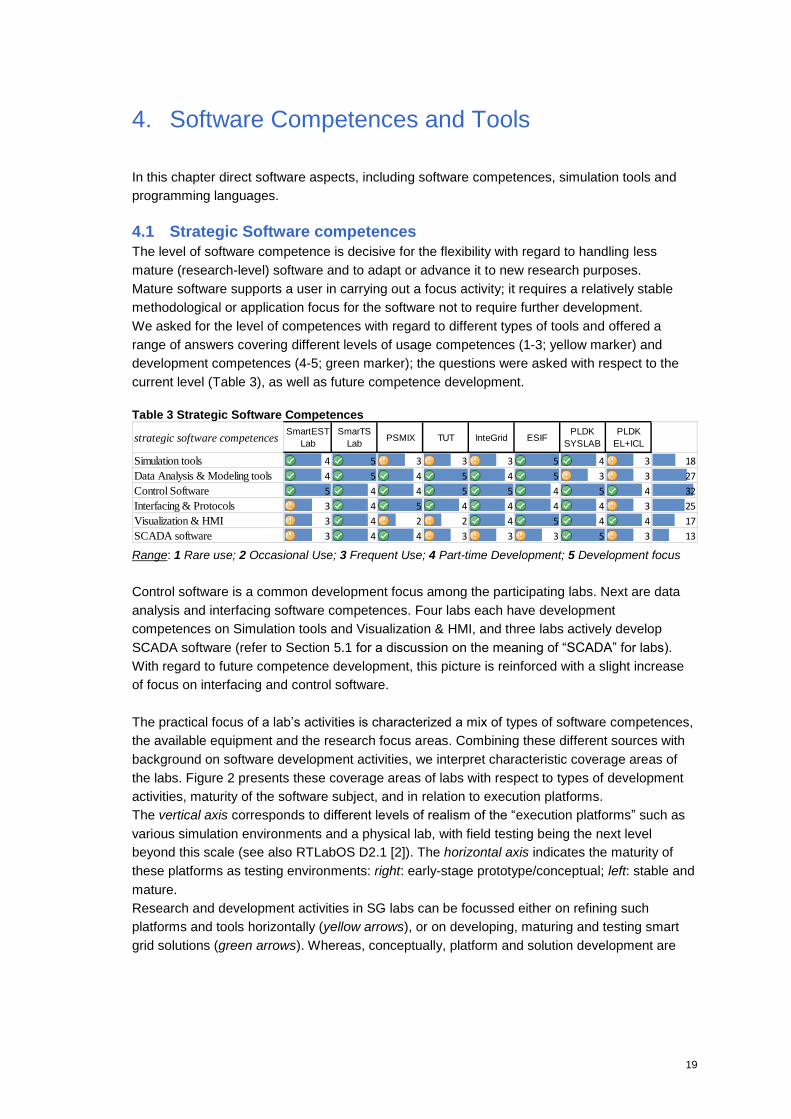
We asked for the level of competences with regard to different types of tools and offered a
range of answers covering different levels of usage competences (1-3; yellow marker) and
development competences (4-5; green marker); the questions were asked with respect to the
current level (Table 3), as well as future competence development.
Table 3 Strategic Software Competences
Range: 1 Rare use; 2 Occasional Use; 3 Frequent Use; 4 Part-time Development; 5 Development focus
Control software is a common development focus among the participating labs. Next are data
analysis and interfacing software competences. Four labs each have development
competences on Simulation tools and Visualization & HMI, and three labs actively develop
SCADA software (refer to Section 5.1 for a discussion on the meaning of “SCADA” for labs).
With regard to future competence development, this picture is reinforced with a slight increase
of focus on interfacing and control software.
The practical focus of a lab’s activities is characterized a mix of types of software competences,
the available equipment and the research focus areas. Combining these different sources with
background on software development activities, we interpret characteristic coverage areas of
the labs. Figure 2 presents these coverage areas of labs with respect to types of development
activities, maturity of the software subject, and in relation to execution platforms.
The vertical axis corresponds to different levels of realism of the “execution platforms” such as
various simulation environments and a physical lab, with field testing being the next level
beyond this scale (see also RTLabOS D2.1 [2]). The horizontal axis indicates the maturity of
these platforms as testing environments: right: early-stage prototype/conceptual; left: stable and
mature.
Research and development activities in SG labs can be focussed either on refining such
platforms and tools horizontally (yellow arrows), or on developing, maturing and testing smart
grid solutions (green arrows). Whereas, conceptually, platform and solution development are
strategic software competencesSmartEST
Lab
SmarTS
LabPSMIX TUT InteGrid ESIF
PLDK
SYSLAB
PLDK
EL+ICL
Simulation tools 4 5 3 3 3 5 4 3 18
Data Analysis & Modeling tools 4 5 4 5 4 5 3 3 27
Control Software 5 4 4 5 5 4 5 4 32
Interfacing & Protocols 3 4 5 4 4 4 4 3 25
Visualization & HMI 3 4 2 2 4 5 4 4 17
SCADA software 3 4 4 3 3 3 5 3 13

20
completely separate activities, in practice they cannot be fundamentally separated: smart grid
research labs evolve both the smart grid solutions and the labs’ testing capabilities.
Figure 2 Association of software competences with application-oriented (green) and software
domain-oriented (yellow) development streams. (*) indicates that InteGrid Lab and SYSLAB do not
include real-time simulation facilities.
Yellow arrows represent platform development and green arrows represent application-oriented
development (from left to right: Visualization & Support System Development, Controller Design,
Validation & Deployment, Distributed Controller Development, and Automation Software
Development. The increasing angle relates to increasing software-orientation of the related
work. Each ellipse represents one lab, where the color coding is based on the three lab
stereotypes illustrated in Figure 1 (red, green and blue). Here PLDK ICL+EL are clustered
together as blue/green. The location, extent and size of the bubbles reflect focus area, relation
to development streams, and overall competence level, respectively. Note that this illustration is
naturally oversimplified, and the ellipse is not be the appropriate geometry in all cases.
For simulation labs (blue), the focus & competence areas fan out strongly with horizontal and
Data Handling, Communications & Protocol Development
Simulation Software Development
Stability of Lab ICT platform
Exec
uti
on
Pla
tfo
rm
Development prototype
Stable Architecture, adaptable connectors
Stable Platform,Interface adaptation
Stable Platform w/fixed interfacing options
Dis
trib
uted
Con
trol
ler D
evel
opm
ent
ESIF
Co
nce
pt
Sim
ula
tio
nC
o-S
imu
lati
on
Lab Lab Software Development
Rea
l-ti
me
(Co
-) S
imu
lati
on
Co
ntr
olle
r D
esig
n, V
alid
atio
n &
Dep
loym
ent
Coupling & Model-management Software Dev.
Vis
ual
izat
ion
& S
up
po
rt S
yste
m D
eve
lop
me
nt
Automation Softw
are Development
PSMIX
SmarTSlab
PLDKSYSLAB*
SmartEST Lab
TUT SGL
PLDK ICL+EL
InteGrid*

21
vertical activities; electric labs (green) are associated primarily with vertical development and
energy system flexibility labs (red) tend to more diagonal.
4.2 Simulation tools and Programming
Next to the lab, the main working tool for researchers is either a simulation tool, to analyse data
or prepare & design solutions that are later tested in the lab, or a programming language and
platform.
4.2.1 Simulation and Models
A short list of the most common simulation tools in use by the labs is provided in Table 1. The
most common simulation tools are Matlab, R, PowerFactory and LabView.
Table 4 Simulation tools by lab.
*) ESIF could not reply with reference to too large a staff base. LabView, however is in use in the lab.
Matlab and R are general purpose tools which offer a scripting environment, so they can be
used for controller prototyping. Most other common tools are power system simulation tools.
The more platform development-focussed labs, such as SYSLAB, InteGrid, and PSMIX tend to
use the smaller number of domain-specific (Power System) simulation tools. An explanation
could be that, by limiting the number of tools, interfacing requirements are also limited.
LabView and DSPACE are not primarily simulation tools, but offer direct interfacing between
desktop simulation and lab environments. In particular labs with a focus on systems integration
and automation software development use such tools less (SYSLAB, PSMIX); also InteGrid
uses LabView primarily for controlling the ‘simulation’ and ‘monitoring’ aspects of their
experiments, not as software / controller deployment platform.
Simulation Tool SmartEST SmarTSLab PSMIX TUT InteGrid ESIFPLDK
SYSLAB
PLDK
ICL+ELSUM
Power Factory x x x x x 5
RSCAD x x 2
PSS/E x x x 3
PSCAD x x x 3
GridLab-D x 1
OpenDSS x 1
PowerWorld x 1
Eurostag x 1
Matlab x x x x x x 6
MatPower/PSAT/SimPowerSystems x x x x 4
Simulink/eMegasim x x 2
other Matlab LF x 1
GAMS x 1
LabView x x x x* x 5
DSPACE x x 2
R (statistics) x x x x 4
Other 1 3 1 0 0 0 2 1 8
sum/lab 7 11 6 7 4 1 6 8

22
4.2.2 Programming Languages and Platforms
Programming languages are fundamental to development, and shared languages are one key
enabler of information sharing in the lab (as with simulation tools). Table 5 summarizes the
programming languages reported in the survey.
Surprisingly, the two labs with the most ‘system development’ focus in their competences also
are those with the smallest number of programming languages reported (SYSLAB & PSMIX).
On the other hand, commercial development at Spirae (in context of InteGrid) reports the
largest number of programming languages in use, followed by SmarTSLab.
The number of different programming languages seems to be higher the more ‘engineering’-
practical and applied the focus is; in contrast, consensus on programming languages is useful
for developing larger systems.
The most common languages are Java, LabView and C(++), followed by Python and Matlab.
IEC-based and PLC programming languages only occur in commercial labs (SmartEST and
InteGrid).
Table 5 Programming Languages by Lab
SmartEST SmarTSLab PSMIX InteGrid
PLDK
SYSLAB
PLDK
ICL+EL SUM
Java x
x
x x 4
C#
x
x
x 3
Matlab
x
x x 3
R
x x
2
PowerFactory DSL/DPL
x
x 2
LabView x x
x
x 4
Python
x
x x
3
C(++) x x
x
x 4
Perl
x
x
2
SQL
x
x 2
IEC61499 or 61131 x
x
2
other 2 2
2
1 6
Sum: 6 9 1 10 4 8
Table 6 Development tools
Table 6 presents results from six labs (excl. ESIF and TUT). There is almost consensus on usage of Eclipse (except Spirae / InteGrid), generally a strong variability and no dominant result.

23
For code management, only one sharing tool is typically chosen, but no consensus on across labs is observed.
5. Lab Operation and Software Support
This chapter is dedicated to the many ways in which software influences the operations in a
laboratory. Two main aspects with respect to software are
a) the domain in which the software applies. b) the competences of the person working with the software (user or developer)
For orientation, we can generally distinguish software used in a horizontal fashion- between
humans (H2H) and between machines (M2M), and, especially in a lab, in a vertical fashion:
between human and machines (H2M). These different types of relations can also be associated
with different types of software tasks.
Knowledge___
Information___________
Data
Machine 1 Machine 2
Human A Human BH2H
M2M
H2
M
M2
H
Figure 3 The three relations discussed in this chapter: M2M, H2H, H2M.
Another principle seems to govern the diversity or alignment with respect to software tools: With respect to alignment of tools and sharing of information:
top-down decision and obligation, versus
bottom-up appearance of coordinated behaviour.
In Sections 5.1 to 5.4, we focus on software in support of lab operations and development, whereas Sections 5.5 is focussed on human coordination and knowledge sharing.
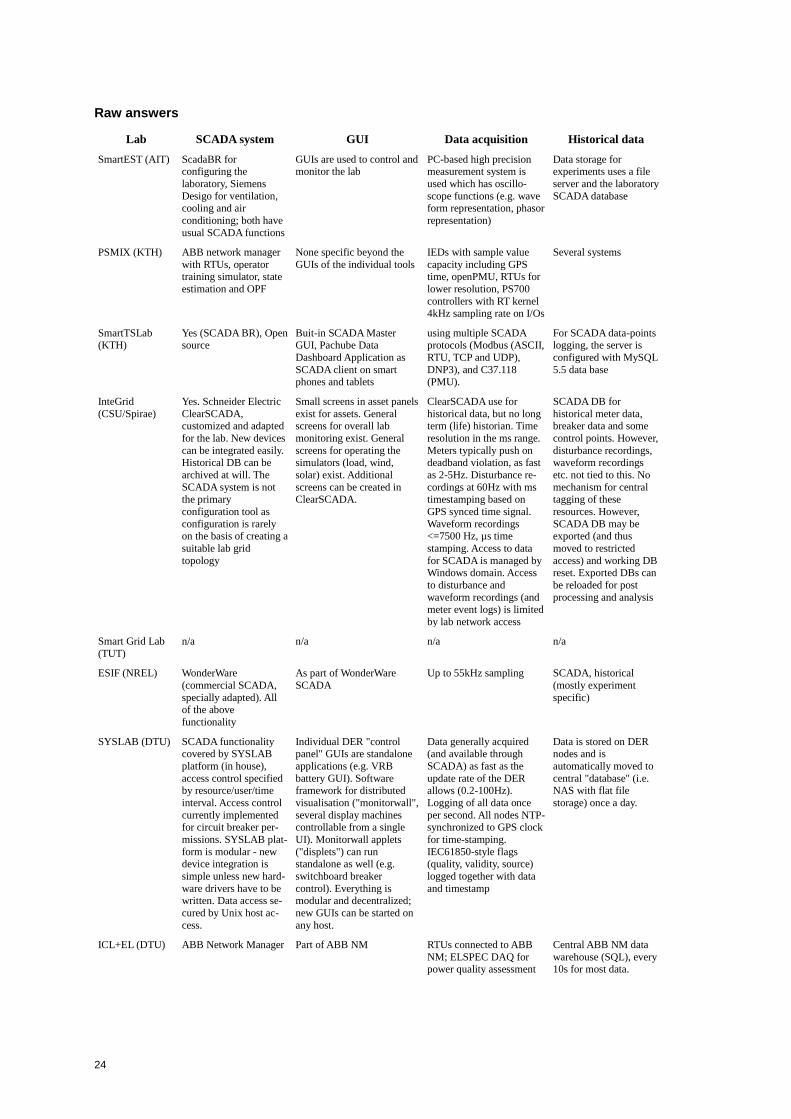
5.1 Data acquisition and lab monitoring
Four questions in the questionnaire are related to data acquisition and monitoring functionality,
i.e. the kind of functionality commonly summarized as SCADA (Supervisory control and data
acquisition):
Is there a dedicated SCADA system for the lab? What features does it have?
GUIs for monitoring and lab management
Please describe the features of your data acquisition infrastructure
How is historical data stored in your lab?
The replies are collected in the following table. From the answers given by the participating
laboratories it became evident that the terminology in these questions is not precise; some of
the terms are used in different ways depending on context.
24
Raw answers
Lab SCADA system GUI Data acquisition Historical data
SmartEST (AIT) ScadaBR for configuring the
laboratory, Siemens
Desigo for ventilation, cooling and air
conditioning; both have
usual SCADA functions
GUIs are used to control and monitor the lab
PC-based high precision measurement system is
used which has oscillo-
scope functions (e.g. wave form representation, phasor
representation)
Data storage for experiments uses a file
server and the laboratory
SCADA database
PSMIX (KTH) ABB network manager
with RTUs, operator training simulator, state
estimation and OPF
None specific beyond the
GUIs of the individual tools
IEDs with sample value
capacity including GPS time, openPMU, RTUs for
lower resolution, PS700
controllers with RT kernel
4kHz sampling rate on I/Os
Several systems
SmartTSLab (KTH)
Yes (SCADA BR), Open source
Buit-in SCADA Master GUI, Pachube Data
Dashboard Application as
SCADA client on smart phones and tablets
using multiple SCADA protocols (Modbus (ASCII,
RTU, TCP and UDP),
DNP3), and C37.118 (PMU).
For SCADA data-points logging, the server is
configured with MySQL
5.5 data base
InteGrid
(CSU/Spirae)
Yes. Schneider Electric
ClearSCADA, customized and adapted
for the lab. New devices
can be integrated easily. Historical DB can be
archived at will. The
SCADA system is not the primary
configuration tool as
configuration is rarely on the basis of creating a
suitable lab grid
topology
Small screens in asset panels
exist for assets. General screens for overall lab
monitoring exist. General
screens for operating the simulators (load, wind,
solar) exist. Additional
screens can be created in ClearSCADA.
ClearSCADA use for
historical data, but no long term (life) historian. Time
resolution in the ms range.
Meters typically push on deadband violation, as fast
as 2-5Hz. Disturbance re-
cordings at 60Hz with ms timestamping based on
GPS synced time signal.
Waveform recordings <=7500 Hz, µs time
stamping. Access to data
for SCADA is managed by Windows domain. Access
to disturbance and
waveform recordings (and meter event logs) is limited
by lab network access
SCADA DB for
historical meter data, breaker data and some
control points. However,
disturbance recordings, waveform recordings
etc. not tied to this. No
mechanism for central tagging of these
resources. However,
SCADA DB may be exported (and thus
moved to restricted
access) and working DB reset. Exported DBs can
be reloaded for post
processing and analysis
Smart Grid Lab
(TUT)
n/a n/a n/a n/a
ESIF (NREL) WonderWare
(commercial SCADA,
specially adapted). All of the above
functionality
As part of WonderWare
SCADA
Up to 55kHz sampling SCADA, historical
(mostly experiment
specific)
SYSLAB (DTU) SCADA functionality covered by SYSLAB
platform (in house),
access control specified by resource/user/time
interval. Access control
currently implemented for circuit breaker per-
missions. SYSLAB plat-
form is modular - new device integration is
simple unless new hard-
ware drivers have to be written. Data access se-
cured by Unix host ac-
cess.
Individual DER "control panel" GUIs are standalone
applications (e.g. VRB
battery GUI). Software framework for distributed
visualisation ("monitorwall",
several display machines controllable from a single
UI). Monitorwall applets
("displets") can run standalone as well (e.g.
switchboard breaker
control). Everything is modular and decentralized;
new GUIs can be started on
any host.
Data generally acquired (and available through
SCADA) as fast as the
update rate of the DER allows (0.2-100Hz).
Logging of all data once
per second. All nodes NTP-synchronized to GPS clock
for time-stamping.
IEC61850-style flags (quality, validity, source)
logged together with data
and timestamp
Data is stored on DER nodes and is
automatically moved to
central "database" (i.e. NAS with flat file
storage) once a day.
ICL+EL (DTU) ABB Network Manager Part of ABB NM RTUs connected to ABB
NM; ELSPEC DAQ for power quality assessment
Central ABB NM data
warehouse (SQL), every 10s for most data.

25
In particular, one term interpreted differently is SCADA, which may refer to
A. (In a general context): an abstract infrastructure for collecting data from a physical system
(possibly a remote and/or distributed system) and distributing control signals back to said
physical system. The SCADA concept in general does not prescribe or exclude a particular
system architecture (centralized vs. hierarchical vs. peer-to-peer), a particular distribution of
master, slave, client or server roles, or a particular type of automated control or human
intervention.
B. (In a power systems context): An integrated software and hardware solution which includes
remote (slave) units, a central (master) processor, a human-machine interface (HMI) and
databases for storing live and historical data. This definition is narrower than the previous
one and implicitly linked to the architecture and functionality of commercially available
SCADA systems as they are found e.g. in utility control centers.
C. (In a facility management context): Synonymous with a building automation system, often
focused on HVAC aspects of building management.
In context of the smart grid labs, there are two main uses of the word SCADA: one refers to a
system for monitoring and management of the lab as a whole (A.), or specific software for
subsystems (C.). SG labs also contribute to development of utility level power system SCADA
software (in sense of B.); therefore the reported installations are meant to either i) operate the
lab, or ii) present a test-beds for SCADA solutions development (such operator support systems
or PMU data infrastructure); or iii) mimic actual utility installations as a whole. In many cases
several apply.
To avoid this ambivalent terminology, in the following we refer to LabSCADA or “LabOS” if the
object in focus is a system with scope toward the lab (i.e. A.i and A.ii). This notion is further
developed in RTLabOS D2.1 [2].
It is noted that two SCADA systems are mentioned twice:
The commercial ABB Network Manager (PSMIX and PLDK ICL+EL)
The open source SCADA BR (SmartEST and SmarTSLab)
A further (statistical) evaluation beyond the compilation of the raw answers does not seem
meaningful.
5.2 Custom control in the lab
Five questions in the questionnaire are related to the use of a laboratory for testing controllers
and control algorithms:
1. Is remote control possible? How?
2. Is there an API for remote closed-loop control?
3. What infrastructure do you have to deploy controllers onto your lab equipment?
4. Does your lab offer standardized functionality to deploy controllers onto devices?
5. Is this (deployment) mechanism based on a particular standard?
Whether at the component or the system level, smart grid research aims at developing
improved ways of controlling the power system or its parts. For this reason, the ability to test
new control algorithms, systems and architectures is a design motivation in all smart grid
laboratories, although the scope and extent to which this capability is required varies.

26
Three general scenarios can be distinguished:
a. Installation of third-party equipment with an embedded controller (e.g. as device under
test)
b. Remote control of lab equipment via an API.
c. Deployment of custom controllers on existing hardware equipment in the lab
Scenario a. does not necessarily require integration with laboratory software; therefore
Scenarios b. and c. are the most relevant in the lab software context.
Raw answers
Lab Remote control Remote API Controller deployment Standardized
controller
deployment
SmartEST
(AIT)
Depends on the test
case; SmartEST is
used for component
and system tests
mostly from partners
and customers
Depends on the test
case; SmartEST is used
for component and
system tests mostly
from partners and
customers
n/a Depends on the test
case;
For some experiments
IEC 61850 and IEC
61499 are used
PSMIX (KTH) For parts yes (COPA-
DATA XENON is used
for remote access and
visualisation)
OPC-UA interface to
remote sites for
ARISTO power system
simulator is in test stage
Virtual machines as
backup, remote logins to
access systems
None
SmartTSLab
(KTH)
Via remote desktop
(dangerous when we
have amplifiers in the
loop)
No, but we do it from
Opal's RT-Lab,
however, if there is a
failure in the device, the
simulation can't be
repeated until someone
fixes/resets the device
National Instruments
CRIO platforms. New
ABB UNITROL
(excitation and PSS) but
we have just started
with it
No, only NI CRIO
platform
InteGrid
(CSU/Spirae)
Yes, via lab SCADA
and Spirae BlueFin
It's on the BlueFin
roadmap. Right now it's
not public
Yes, via Spirae BlueFin.
At the lowest levels,
PLCs can theoretically
be reprogrammed using
IsaGraf from a
networked machine
Yes (usage) at both
the device and the
coordinating levels.
No (particular
standard) but we hope
to make the APIs for
area controls public
Smart Grid Lab
(TUT)
n/a n/a n/a n/a
ESIF (NREL) n/a n/a none specific n/a
SYSLAB
(DTU)
Remote access via
network bridging, data
push server,
blackboard server or
tunneling
Proprietary API as part
of the SYSLAB
platform, various
options
Manual deployment on
each node (usually by
checking out source
code from version
control). Limited
scripting support for
semiautomatic
deployment
No
ICL+EL (DTU) Yes, but only from
within lab IP network.
None specific; some via
RESTful services; data
reading from ABB NM
via OPC-DA
n/a n/a

27
5.3 Advanced lab management tools
Four questions in the questionnaire are related to automating the management of experiment
configurations, permissions and experiment data:
Are dedicated services available in your lab that simplify merging of data from different
sources?
What tools are available and actually used in your lab to reserve experiment space and
equipment, lock access to breakers?
Is it possible to unify these permissions under a single experiment access 'tag'?
Consider advanced configuration management as outlined in the 'domain study' report.
Which features does your lab support already?
The questionnaire allowed for free text answers which are compiled in the following table.
Raw answers
Lab Data merging Experiment booking Tagging Configuration
management
SmartEST (AIT) Not at the moment Shared calendar; only
authorized persons are
able to operate the lab
Depends on the
kind of
experiment/test
Currently the
configuration is done
manually but there are
some plans to have a
higher automation
degree (but not yet
implemented)
PSMIX (KTH) Previous use of XML
Spy tools for model
merging, currently
Enterprise Architect for
meta-model mapping
None ? None
SmartTSLab
(KTH)
None so far We use a booking "board"
using Trello
No None in reality - we are
quite primitive and don't
have any resources to
get organized. It's more
of a "survival mode".
InteGrid
(CSU/Spirae)
No. It's build-your-own Calendar managed by lab
supervisor
No such system
exists.
Under Bluefin platform,
asset and system control
parameters can be
stored in a single file.
Smart Grid Lab
(TUT)
n/a n/a n/a n/a
ESIF (NREL) n/a n/a Yes - in
Wonderware.
n/a
SYSLAB (DTU) Basic helper scripts for
access/query of the
history database / NAS
storage
Access control system
(web interface) for breaker
reservations. Currently
mainly used to keep
SYSLAB and the NEVIC
center from stepping on
each other's feet.
no Recording of breaker
configuration, storage
together with timeseries
data.
ICL+EL (DTU) n/a n/a n/a n/a
Due of the broad range of laboratory types involved in the survey, due to differences in
interpreting the survey questions, and because the sample size for each type is small, a direct
statistical evaluation of the answers has not been considered meaningful. Instead, it was
chosen to develop a six-step scale for each question in order to be able to categorize the

28
answers according to their level of automation. This process inevitably adds some subjectivity,
and not all survey answers can be matched to the scale categories without information losses.
Data merging
Smart grid laboratories are complex environments which usually integrate equipment from a
variety of manufacturers. Data collected from these different sources during an experiment is
heterogenous with respect to time resolution, precision, quality and other factors. Some data
sources may generate nonperiodic events, others will produce time series data. Some data may
be collected in short, high-resolution bursts (e.g. event recorders), other data will have lower
resolution but cover the experiment period continuously.
After an experiment, there is often a requirement to consolidate this heterogenous collection of
data by merging: The timing of time series and events may need to be synchronized, or low-
quality data may be replaced by high-quality data from a different source. If an aspect of the
system can be observed through more than one data source, it may be possible to validate the
data through redundancy.
If this process is not automated, it can be very tedious, and the quality and/or consistency of the
outcome may depend on who performs it.
We have defined the following six levels of data merging automation:
1. No automation
2. Documented manual procedures to achieve consistent quality
3. Standalone software ("scripts") to help with certain aspects of data merging such as
format conversion or timestamp-based merging
4. Automatic acquisition of data into a single, unified database, with a global data model
and consistent time stamping
5. Like 4), but with support for manually triggered fusion of e.g. high-quality and low-quality
sources
6. Like 4), but with fully automated fusion of separate data sources
The distribution of answers from the questionnaire is as follows:
Level 1 2 3 4 5 6
Count 3 1 1 0 0 0
Experiment booking
In most cases, smart grid laboratories are multi-user environments. Usually it is desirable to be
able to run more than one experiment at a time, for example if long-term testing of a power
component uses a small number of assets but does not require the rest of the lab.
As in any shared resource environment, access and use of lab components have to be
coordinated in order to prevent disruption of experiments by e.g. sending conflicting control
signals to an energy resource, or by de-energizing parts of the power system that are in use by
an experiment. This coordination can be done manually, usually through an established

29
procedure, or by different levels of automation which may prevent human error, particularly in
systems with many assets.
We have defined the following six levels of experiment booking automation:
1. No procedure or system in place
2. Manual procedures, e.g. involving a shared calendar
3. Dedicated booking system which allows some level of granularity in selecting which
parts/resources in the lab are being reserved
4. Like 3), but integrated with a lab-level access control system, for example keycard
access to doors or login to control computers
5. Like 3), but integrated with the a system controlling access at the circuit-breaker level,
i.e. which parts of the lab can be (de-)energized or coupled together
6. Like 3), but full integration with the LabOS system [2] in order to directly manage access
to all controllable lab assets.
The distribution of answers from the questionnaire is as follows:
Level 1 2 3 4 5 6
Count 1 3 0 1 0 0
Configuration management
While the survey shows that smart grid laboratories may follow very different concepts and
cover different domains of smart grid technology, they are frequently characterized by
integrating devices of different type and from different manufacturers. Many of these devices
are configurable and have a large configuration space; examples include DER such as diesel
generator sets or wind turbines whose controllers each may have hundreds of configuration
parameters. Other examples may be advanced networking equipment or software in embedded
systems.
In addition to these software configured devices, labs often allow for manual changes to their
physical configuration as part of an experiment. Common cases are the installation of a device
under test, or the connection of a mobile apparatus, for example a load bank or an electric
vehicle which can be grid-connected in more than one location of a power grid.
When treating the lab as an integrated system, the lab configuration space is the sum of all
device configuration spaces and manual configuration changes. Not all elements in the
configuration space have an impact on the outcome of an experiment; configuration
management is the tracking, recording and manipulation of those elements which do have an
impact. In order to understand the conditions under which an experiment was performed, and in
order to make experiments repeatable, the lab configuration which was active during the
experiment must be known. For large laboratories, this configuration can easily contain
thousands of parameters; it is therefore desirable to have an automated system to help with
recording and/or deployment of a particular configuration.
We have defined the following six levels of configuration management automation:
1. No capability/no procedure
2. Manual procedure exists

30
3. Machine-aided (i.e. not fully automated) recording of configurations possible
4. Automated recording of configurations possible
5. Partly automated recording, deployment and restoration of configurations possible
6. Fully automated recording, deployment and restoration of configurations possible
The distribution of answers from the questionnaire is as follows:
Level 1 2 3 4 5 6
Count 4 1 0 0 0 0
5.4 Simulation, Co-Simulation, HIL
Three questions in the questionnaire are related to different aspects of simulation capabilities in
connection with the laboratories:
How would you qualify the relationship between controllers used in simulation and those
deployed on equipment?
Does your lab provide Hardware-in-the-loop facilities? Of which type?
What types of co-simulation can be performed in your lab?
The questionnaire allowed for free text answers which are compiled in the following table. As in
the previous section, it was chosen to develop a six-step scale for each question in order to be
able to categorize the answers according to their level of automation.
Raw answers
Lab Controller exchange HIL Co-simulation
SmartEST (AIT) Both concepts are applied
"needs adaptation &
redesign" or "same code"
Yes, power-hardware-in-the-
loop and controller-
hardware-in-the-loop
Co-simulation of power
systems, automation
approaches and communication
networks/protocols
PSMIX (KTH) needs adaptation Yes, direct connection at
physical interface, emulated
communication network.
Analog I/O connection to
power system alternately
using 61850-90-2 SV
streams or GOOSE messages
Power-ICT
SmartTSLab (KTH) Simulated controllers would
need some adaptation
depending on model
Yes, PMUs, relays,
amplifiers and NI CRIO
controllers
Opal-RT has a system called
Orchestral. For offline we use
the FMI standard under
Modelica tools and under
Matlab using FMI toolbox.
InteGrid
(CSU/Spirae)
Same code Yes, co-simulation BlueFin controls can be
deployed against PowerFactory
simulations.
Smart Grid Lab
(TUT)
n/a PHIL (1-3MW ?) n/a
ESIF (NREL) n/a PHIL (1MW?) n/a
SYSLAB (DTU) Needs adaptation and
redesign
Remote control of
components can be
individually integrated into
other software using the
SYSLAB component API
Currently only supported as
hacks
ICL+EL (DTU) n/a n/a n/a

31
Exchange of controllers between simulated and physical components
A common challenge when trying to replicate a laboratory environment in simulation or vice
versa (for example to validate a simulation with a lab experiment, or to use simulation for
replicating a lab experiment at a larger scale) is due to different runtime environments for
controllers. Because controllers and control algorithms are a central research focus in the field
of smart grids, the testing of new controllers is a common task in smart grid laboratories. Unlike
e.g. physical models of DER components which can be validated once between simulation and
lab and do not commonly change, ensuring identical behaviour between simulated and lab-
deployed controllers is more difficult.
The fewer steps are necessary to share controller code between simulation and lab
implementation, and the higher the portion of the source code that can be shared, the fewer
resources need to be spent on time-consuming validation of identical controller behaviour and
the fewer errors can be made in the porting/exchanging process.
We have defined the following six levels of controller exchange capability:
1. No capability
2. Manual process
3. Controller container (no recompilation)
4. Automated deployment
5. Cross-deployment of purpose-built controllers
6. Cross-deployment of generic controllers
The distribution of answers from the questionnaire is as follows:
Level 1 2 3 4 5 6
Count 1 3 1 0 0 0
HIL capabilities
Hardware-in-the-loop (HIL) capability is very relevant for smart grid laboratories in a number of
scenarios: Testing of components, testing of controllers and the upscaling of experiments
beyond the compexity of the laboratory hardware by simulating parts of the grid are all common
uses of HIL.
Two general HIL types are commonly distinguished in this context: Power-hardware-in-the-loop
(PHIL) inserts a device under test into a simulated environment (e.g. represented by a line
voltage and frequency) while controller-hardware-in-the-loop (CHIL) simulates a system of
controllable devices represented by sensor readings and actuator outputs to a physical
controller.
We have defined the following six levels of hardware-in-the-loop capability:
1. No capability
2. Generally possible, but all integration has to be done manually on a case-by-case basis
3. Standalone software ("scripts") to set up PHIL and/or CHIL
4. GUI for manual setup of PHIL and/or CHIL

32
5. GUI for initiating automatic setup of PHIL and/or CHIL
6. Seamless integration of laboratory and simulator
The distribution of answers from the questionnaire is as follows:
Level 1 2 3 4 5 6
Count 0 0 3 1 0 0
Co-simulation capabilities
While co-simulation tools and technology are typically separated from a physical laboratory,
many of the technological issues are very similar to those encountered in hardware-in-the-loop
(HIL) setups: Co-simulation can be seen as simulator-in-the-loop between different simulation
tools. Issues of time synchronization and/or artificial time, the exchange or sharing of controllers
between simulation tools and communication between simulators are related to their
counterparts in HIL.
We have defined the following six levels of co-simulation capability:
1. No capability
2. Generally possible, but all integration has to be done manually on a case-by-case basis
3. Some integration between isolated simulators
4. Cosimulation of power and control
5. Cosimulation of power, control and communication
6. Cosimulation of power, control and communication with complete lab models
The distribution of answers from the questionnaire is as follows:
Level 1 2 3 4 5 6
Count 0 1 1 1 2 0
5.5 Coordination, information sharing and formal barriers
A high share of informal cooperation is essential in labs. Yet, informal knowledge sharing and
coordination is limited due to a number of factors:
The larger a lab gets, the less likely relevant information will diffuse automatically,
Lab safety standards require a degree of formality,
Structured resource booking systems and approval processes in larger labs,
Intellectual property concerns.
In this section we discuss the application of top-down principles such as rules or formal
procedures in the lab context of
Intellectual property handling,
Lab safety and experiments execution,
Lab booking for experiments, and
Information sharing, e.g. for project management & tools.

33
Introducing formal procedures is tedious and creates some overhead that complicates lab
operations. On the other hand, once there are strictly formal procedures and structured
information these are more easily facilitated by software. There is a resulting trade-of between
scalability and flexible and agile lab operations.
To shed light on this trade-off, Questions 20.1, 20.2 and 21 address formal procedures,
intellectual property and information sharing. Finally, in Part II of the Questionnaire, we inquired
about tools in use to software in use to support those activities in Q6.1-6.3.
5.5.1 Intellectual Property and Sharing
Intellectual property protection is a natural concern, for both research and commercial labs.
We inquired the sharing policies with respect do data, models, and software.
Data
In the electric power systems domain, data is often concerned with privacy, so if data is
acquired via non-disclosure agreements, this data is not easily shared.
In this study, the sharing approaches in two groups:
a. as commercial lab (SmartEST, InteGrid) data is shared against fees.
b. research labs (here: SmarTS Lab, PSMIX, ESIF, SYSLAB) generally share data with
collaborators; in some cases only under NDA, in other cases fully open.
Models
The distribution with respect to sharing of models is similar to that of data. We observe a slightly
more restrictive use of models, where also some research labs tend to inquire fees (e.g. ESIF:
more open about data, more likely to require fees for models), and some commercial labs do
not share models externally at all. This may be because data is often more easily generated,
whereas models result from a dedicated effort and can become a competitive element, both in
research and commercial activities.
Software
Software development can be a core research activity as well as the commercial selling point.
The split into research & commercial labs also applies to software. One should not, however,
that ESIF is on average more restrictive about sharing software than about data.
5.5.2 Formal Procedures
The application of formal procedures for handling specific activities can apply to several
activities in the lab. The formal approach is typically employed to satisfy some strict legal
requirements and responsibilities, but they may also be considered a way of streamlining
common activities and facilitating economic bookkeeping.
Addressing the topics,
a. Safety in the lab, b. Booking of lab for experiments, c. Experiment execution,
we asked survey participants to consider the following levels of formality:
1. No Formal Procedure;
2. Informal knowledge with go-to persons
34
3. Dedicated staff roles
4. Forms facilitating a semi-formal process
5. Strictly formal procedure
For HW labs, electric safety is very important, and the most regulated activity (scoring 3 or 5,
with average 4; with 5 for commercial labs). Naturally, in simulation labs safety is less of an
issue and there is simply informal exchange.
Lab booking for experiments is either facilitated by a form (4) or, less formal, by a dedicated
responsible (3). Only in one case strictly formal booking procedure is applied.
Experiment execution follows a strict procedure in InteGrid lab, whereas most labs a have less
structured approach with either dedicated staff roles (in most of the hardware labs), and
informal go-to persons at the remaining four respondents.
5.5.3 Internal Information Sharing and Coordination
Information sharing is natural in direct personal collaboration, but when the lab complexity
increases and more staff uses a lab, direct communication can become an overhead. On the
other hand, writing a manual for every single step in the lab seems overkill – too much work.
How do the participating labs balance these conflicting needs? We asked for knowledge sharing with respect to software and hardware referring to
a. Operation manuals and functional description, i.e. the ‘original’ documentation, b. “How-to know-how” – for tacit knowledge e.g. for operating a lab-specific setup.
For a. the range of choices was: (1) It’s hard, it could be anywhere; (2) just ask the right person; (3) “Once you get a feel for it, there is a kind of system”; (4) Strictly organized, structured folders; (5) Search engine enabled. Here, the diversity of practices is significant. All answers from (1) to (4) appear, with (2) being most common. Comparing the replies for software vs. hardware, the answers are mostly the same.
For b. the formality of enforcing information sharing is when code comments and documentation
writing are part of common practice (here: 3 and higher). For software only one lab claims a
common practice here, whereas for hardware it is common practice for three labs. For software,
installation routines and wizards often simplify the need for know-how exchange (four labs).
Almost all labs at some point had manuals written, but view those as outdated. Internal information sharing with respect to models, data and code is, again, handled quite
differently. The range (1) some people use external file sharing tools (e.g. dropbox); (2) a central drive network exists; (3) shared folders are strictly organized and typed; (4) common file types are in use and deviations are documented; (5) standard information models are employed / usually a conversion tool is provided for application formats
Code is here most likely to be shared systematically (>3). Models are only shared systematically
(3) in one case. Data is shared systematically in a central location in two cases.
In question we inquired about software coordination tools, e.g. for project management and
development tasks. One lab uses “Trello” as an online tool for lab coordination, other two other
labs refer to Outlook & One Note.

35
6. Conclusion
Summarizing the survey outcomes, we will first look at the main results, then discuss some
specific insights, and finally look toward possible continuation on the basis of these results.
6.1 Main results
This survey investigated nine smart grid laboratories, six of which outside DTU and three labs
under the umbrella of PowerLabDK. This, statistically, small number of labs, allowed to study
and characterize each in more depth. The labs represented a wide spectrum of labs, including
recently established, some grown over several years, different scales of investment (from ca.
10.000€ to 100 Million€), and including both labs with primarily commercial and a primarily
research focus. For each lab a case story was developed, including design objective, resources,
staff, research focus & software aspect. All-in-all, this characterization went the typical focus on
technical resources. As a result, we gained an understanding of ‘What is a smart grid lab?’
As there clearly is not a single definition doing justice to all the labs, we invite the reader to
browse through Chapters 1 and 2.
In Chapters 3 and 4, we further identified stereotypical lab profiles studying the relations
between infrastructure, focus area, and software competence. The results are illustrated in
Figure 1, p. 18 and Figure 2, p. 20. For software competence, it shows that for most
participating labs, the level of software competence was generally very high: five of eight labs
perform active software development in at least four of six categories; all in at least two
categories. Development, however, can have with very different outcome foci (e.g. application-
oriented or platform oriented). Some common tools and an indicative connection between tools
and focus areas have been observed; but the large variety of replies and the small data basis
do not allow for strong conclusions here.
Some part of the survey could be based on self-ranking based pre-established ranking
indicators; other parts were necessarily more open and free-text. As analysis result, in Chapter
5, new ranking criteria have been established and applied to the available data. These new
indicators together with the ones provided in the survey may serve as foundation for further
studies.
6.2 Specific insights
At the outset of this survey, it was anticipated that some harmonization could be visible and
established across labs with respect to:
programming languages,
information sharing,
modeling & simulation tools, and
control interfaces.
However, apart from some expected or obvious overlaps in simulation tools, programming
languages, or standards re-surfacing in different contexts, (e.g. IEC 61850, OPC-DA, OPC-UA,
Modbus, CIM), not a single one of these can be said to be commonly adopted.
Further, ‘adoption’ for standards is often only partial (e.g. only the information model or only the
communication protocol) and adoption does not appear to be systematically organized.
According to some comments, more organized forms are
a) very project dependent, and

36
b) driven by engineering focus and applications needs - which differ greatly among labs.
This is surprising on the first glance, as, for example, many would have suspected a wide-
spread adoption of IEC61850. While this is generally the case for the European labs, the
adoption is often only partial.
One explanation may be that full adoption of standards requires significant development efforts
(also as part of an open source initiative), or integration of commercial protocol stacks. With the
diverse needs and focus areas of the labs investigated, such adoption may only occur if either
a) commercial testing requirements are driving the development, or b) coordinated user groups
form across labs (or industry). Diversity of programming languages (Java vs. C(++)/C# silos)
and tools may also be a barrier for such a community to emerge.
Some further observations:
It is common practice to ‘wrap’ low-level process control (e.g. device-level) into a
locally preferred protocol
Visualization and operator support (e.g. experiments with actual operators), though
supported by many, seems a complex use cases and is hardly practiced by SG labs
Clearly, several types of ‘system testing’ are practiced, in particular “hardware based”
and “simulation based” testing are both common.
For example, InteGrid Lab performs integration tests on hardware that could in part also be
performed on real-time simulators. On the other hand, co-simulation has been surprisingly
common practice across labs, and seems to be on the rise as the most important trend in ‘lab
software’. A common focus is development and testing of control systems, which are an
important driver for testing due to need for closed-loop dynamics.
Finally, some common “pains” across labs are:
a) Information sharing internally difficult to organize, often due to quick growth
b) Establishing norms internally vs. growth and flexibility
c) Reproducibility of tests is difficult as configurations are complex
d) Common data formats are desirable for model exchange
These pains can be viewed as potential drivers for future initiatives on lab software.
6.3 Possible future work
With focus on lab support software, this survey has been a new initiative in the context of smart
grid labs. Several follow-up options could be thought of, including
a larger, statistical, survey based on the developed capability classifications for (e.g. via DERlab or ISGAN networks), where further characterization should be more specific w.r.t. use case requirements (e.g. development, validation & demonstration)
o use cases to map capabilities to testing needs; o to use the data as foundation for a SG lab capability model & map
Initiate collaboration to facilitate (co-)simulation-based development across labs o Extent to definitions and requirements for simulation-based testing
Extended initiatives on exchanging experiences and developing strategic roadmaps for convergence of tools or co-development open source tools can be applied.
Identify potential strategic convergence of current lab stereotypes, e.g. via use cases that require the combined features of electric, simulation, and energy flexibility labs.

37
Such convergence may only be achieved in a larger lab where several of the focus areas are
strongly represented1, along with multi-disciplinary competences and cross-disciplinary
projects.
Finally, it can be noted that the three labs studied within PowerLabDK PLDK cover all of the
three profiles. Here it will be interesting to observe how the balance between application focus
(ICL+EL) vs. platform development focus (SYSLAB) will evolve, and whether the future
combined use cases requiring the combination of labs will evolve out of current structures.
1 Apart from NREL’s ESIF, which combines such capabilities in a national lab, a university laboratory not present in this
study (E.ON Energy Research Center at RWTH Aachen University) presents a case where infrastructure and
independent research disciplines have been assembled in the same context.

38
References
[1] B. Kroposki, D. Mooney, T. Markel and B. Lundstrom, “Energy systems integration facilities
at the national renewable energy laboratory,” in IEEE Energytech, IEEE, 2012.
[2] K. Heussen, A. Thavlov and A. Kosek, "D2.1 - Use Cases for Laboratory Software
Infrastructure - Outline of Smart Grid Lab Software Requirements," Department of Electrical
Engineering, DTU, Kongens Lyngby, 2014.
[3] A. M. Kosek and K. Heussen, "D1.1 - The Requirements Domain for Laboratory Software
Infrastructure," Department of Electrical Engineering, DTU, Kongens Lyngby, 2013.

39
A Appendix A Survey Questionnaire
Authors: Kai Heussen and Evgenia Dmitrova

RTLabOS: Phase I Deliverable 1.2: Survey Questionnaire T1: State of The Art
SURVEY QUESTIONAIRE This questionnaire aims to collect background and technical information about participating laboratories. The structure and background concepts of this survey have been outlined in the accompanying document “Domain Study” (RTLabOS Deliverable 1.1).
A summary evaluation of this survey’s results will lead to a publically available report; a revision opportunity will be given to the survey participants before publication. If agreed, the full survey contents will be shared among participating laboratories.
Contact information
Organization & Laboratory (in the following ’the Lab’):
Contacts (persons filling out questionnaire and authorization responsible):
[ ] I agree to share the information provided in the following with other participating laboratories.
____________________________________(authorization responsible)
Page 1 / 14

RTLabOS: Phase I Deliverable 1.2: Survey Questionnaire T1: State of The Art
PART I: Users and the Laboratory Environment
A) Lab Stakeholders & Ownership
Q1. Who is funding / owning / operating the Lab?
Funding:
Owning:
Operating:
Q2. Which stakeholders participate in Steering Committee / Advisory Board?
If possible group stakeholders into (Utility/ Governmental / Commercial / Academic) Steering Committee:
Board of advisors:
B) Lab-Establishment
Q3. When was the lab established?
Funding Agreement:
Opening:
Q4. Classify the establishment process:
( ) incremental extension of an existing lab ( ) new facility based on new design ( ) re-design of a prior facility ( ) other: _____________________________
Q5. Indicate the scale of the laboratory of investment costs
Here the question is about scales rather than absolute numbers. Encircle the range.
Initial investment (Eur / US $): 10.000 100.000 1.000.000 10.000.000 100.000.000
Total (cumulative investment): 10.000 100.000 1.000.000 10.000.000 100.000.000
Q6. Qualify the essential drivers for the lab establishment:
<_____> Identified gap in research field <_____> Identified gap in commercial testing needs <_____> Lighthouse project as national priority area (attracting international attention) <_____> General Government Policy <_____> Commercial Interests
Q7. Please describe the key design objectives of the laboratory
Page 2 / 14

RTLabOS: Phase I Deliverable 1.2: Survey Questionnaire T1: State of The Art
Q7.1. Key applications/activities to be supported by lab (e.g. Commercial testing & certification, research in systems / control, etc.; these activity categories are further defined in Section 2.2 of the “Domain Study”):
Please prioritize the first 3 activities in terms of their relevance in consideration during the design.
<_____> Demonstration <_____> Experimentation <_____> Testing and validation <_____> Models development <_____> Decision support and tool development <_____> Maintenance and monitoring of equipment <_____> Controller development and deployment <_____> System Integration <_____> Time series acquisition
Q7.2. List the top three specific key focus areas of the lab:
1.
2.
3.
Q8. Could you describe the design philosophy in a few words?
Q9. Please qualify the ambition level (e.g. scope of competitiveness) during the design:
Q10. Has there been a precursor to this Lab, i.e. is it a design evolution of a prior lab?
__yes __ no
Q10.1. If yes, please explain the evolution in terms of equipment and functionality:
C) Actual Lab Use
Q11. Users & Staffing:
Please quantify the number of staff (on average):
Page 3 / 14

RTLabOS: Phase I Deliverable 1.2: Survey Questionnaire T1: State of The Art
• PhD Students: • PostDocs: • Senior Scientific staff: • Visiting Researchers: • Technical Staff (incl. operation & maintenance): • Administrative Staff:
Q12. Please quantify the operation cost (excluding staff) of the laboratory:
Maintenance:
Other Operation costs:
Q13. Funding Sources of Staff and Operating costs Please associate an approximate percentage value with each category:
< > Fixed base funding < > Long-term partnership based funding < > Project -based funding (public) < > Return from commercial use of lab < > Other funding source: .
Q14. Activities & Types of Experiments
Please prioritize the top 3 activities in terms of their relevance in actual lab use. (Scope: last 3 years)
<_____> Demonstration <_____> Experimentation <_____> Testing and validation <_____> Models development <_____> Decision support and tool development <_____> Maintenance and monitoring of equipment <_____> Controller development and deployment <_____> System Integration <_____> Time series acquisition
Q15. Topical diversity of Projects
For the following topical areas indicate the current level of project activity associated with the lab. (Scope: last 3 years) Activity Range: 0 none; 1 sporadic; 2 occasional; 3 regular; 4 frequent; 5 continuously
Electric components <_____> Electric materials and aging <_____> High voltage engineering, electric transients, lightning protection <_____> Power electronics and drives
Page 4 / 14

RTLabOS: Phase I Deliverable 1.2: Survey Questionnaire T1: State of The Art
<_____> Electric machines <_____> EMC <_____> HVDC
Energy Conversion and Flexibility <_____> Energy storage <_____> PV technology <_____> Wind power technology <_____> EV technology <_____> Intelligent buildings and building automation <_____> Thermodynamics and thermal energy systems
Systems Integration, Automation & Controls <_____> Protection & Protection systems <_____> Interoperability <_____> (Distributed) Automation <_____> Controls Design
Systems-Modeling and Analysis <_____> Power System Stability <_____> Isolated Power Systems <_____> Stochastic behavior and methods for power systems <_____> Diagnostic methods and monitoring
Q16. External Users & Collaboration
In which field do you have collaborations with respect to actual lab activity? Please provide indicative numbers and names collaborators if possible.
<___> Utilities: <___> Vendors: <___> Scientific: <___> Public Sector: <___> Other: :
D) Hardware / Overall Lab setup
Q17. Hardware Data Sheet
Please supply a ‘data sheet’ of your lab, stating relevant facts about the technical equipment, including electrical infrastructure, energy conversion units, communication networks, data acquisition infrastructure and major computing hardware, including possible data concentrators.
(please attach a data sheet if available, and use space below for comments:)
Page 5 / 14

RTLabOS: Phase I Deliverable 1.2: Survey Questionnaire T1: State of The Art
Q18. List the top three most distinguished capabilities of the lab:
1. 2. 3.
E) Other Factors
Q19. Strategic Software Competence Q19.1. How strong are your staff software competences today? Range: 0 N/A; 1 Rare use; 2 Occasional Use; 3 Frequent Use; 4 Part-time Development; 5 Development focus Please use the left column for this reply.
<___|___> Simulation tools <___|___> SCADA software <___|___> Control Software <___|___> Visualization & HMI <___|___> Interfacing & Protocols <___|___> Data Analysis & Modeling tools <___|___> OTHER: . Q19.2. Do you plan to recruit / develop further competences within the next 3 years?
__ Yes __ No (if yes, please use 2nd column in above list)
Q20. Procedures & Policies Q20.1. With respect to lab use, to what extent do you have formal procedures to cover the following
issues?
Range: 0 N/A; 1 No Formal Procedure; 2 Informal knowledge w/go-to persons; 3 Dedicated Staff Roles; 4 Forms with semi-formal process; 5 Strictly formalized procedure
<___> Safety <___> Booking & Reservation <___> Experiment Setup & Conclusion
Q20.2. With respect to intellectual property of the lab (data, software and models), what is your general policy regulating exchange with external parties?
Range: 0 N/A; 1 Only internal use; 2 against fees; 3 under NDA; 4 Sharing with Collaborators (barter-basis); 5 Open to anyone (av ailable online)
<___> Data <___> Models
Page 6 / 14

RTLabOS: Phase I Deliverable 1.2: Survey Questionnaire T1: State of The Art
<___> Software
Q20.3. For the IP aspects marked between 1-3, please indicate if there are established/formal procedures to initiate the exchange.
Q21. Documentation Q21.1. Functional Descriptions & Operation Manuals (official documentation):
Is it generally easy to find out what (Software/Hardware) is available in your lab the Specs? Is there some systematic organization of the information?
Range: 0 N/A (it’s easy, there’s only a few documents, ev eryone knows, all in one place); 1 It’s hard, it could be anywhere; 2 just ask the right person; 3 “Once you get a feel for it, there is a kind of system”; 4 Strictly organized, Structured folders; 5 Search engine enabl ed
<___> for Software <___> for Hardware
Q21.2. How-to-Know-How (internal knowledge-sharing about how to perform lab-activities):
For common lab tasks, do you have written checklists, how-to manuals or other kinds of instructions to guide new users: (I’ve read the manual, but still don’t know what to do…)
Range: 0 N/A (Come on, you’re an engineer!); 1 just ask the right person; 2 for some things someone once wrote a how-to manual (it’s outdated); 3 It’s common practice to contribute to written documentation (e.g. no code without comments); 5 ‘software wizards’ / ‘assistance robots’
<___> Software <___> Hardware (Data sheet)
Page 7 / 14

RTLabOS: Phase I Deliverable 1.2: Survey Questionnaire T1: State of The Art
PART II: Core Software Functions
This part of the survey is aimed at understanding the existing lab software infrastructure. Lab software is not easily thought of as an infrastructure, but, possibly more appropriate, as a zoo – or a djungle. A taxonomy of lab software has been provided in the “Domain Study” (RTLabOS Deliverable 1.1; Section 3: Software tools). The following questions aim to collect and index the most relevant software species and identify their contribution to the laboratory software ecosystem.
Questions include both multiple choice and open fields.
A) Analysis and Development Tools
Q1. Simulation Software Q1.1. Which (modeling, simulation & calculation) software are used in your lab? (multiple ticks
possible)
Power Factory Eurostag LabView RSCAD ETAP Matlab PSS/E Mathematica R (statistics) PSpice Maple PSCAD SAS Other tools,
please list below. Q1.2. Are licenses usually available to all employees? How are licensed managed? Is there a central
license server for software licenses? Q1.3. Open source software: Is there a local preference regarding open source tools? Does your lab
contribute to OS developments? Please provide examples.
Q2. Model Types Q2.1. What types of Models are in use in your lab? (e.g. thermal models, power system models (transient, dynamic, power flow), forecast, …) Q2.2. Are there conventions on the model data types to be used? Which? (i.e. CIM would be a common standard, but can hardly be used for all simulation programs)
Page 8 / 14

RTLabOS: Phase I Deliverable 1.2: Survey Questionnaire T1: State of The Art
Q2.3. Model Management: Is sharing of models across the lab common? How is it organized? (i.e. is there central repository of folder structure, even a database? How are NDA aspects addressed?) Q2.4. Model development: Are models developed systematically in the lab context? What type of
models? Is model development driven by lab-related measurements? Q2.5. Is there a policy or practice regarding sharing of models externally? Q3. Data Storage, Extraction and Handling Q3.1. Which are the common data types in use? Please list more specific types where possible
< > time series from measurements: < > GIS data: < > market price data: < > forecast & meteorological data: < > other data:
Q3.2. Is there a central storage facility for time series data? What type? Q3.3. What other types of data are common that have been missed here?
Q4. Objects of Development Q4.1. What types of Controls and Algorithms are developed in you lab?
(consider control applications and layer) Q4.2. Is simulation software developed in your lab? What kind?
Page 9 / 14

RTLabOS: Phase I Deliverable 1.2: Survey Questionnaire T1: State of The Art
Q4.3. Decision Support and Visualization: Is there dedicated research and development into decision support and visualization that integrates with the lab? Please indicate scope.
Q5. Development Environment Q5.1. Programming Languages: Which languages are commonly used in your lab? Q5.2. Development Environments: Which Development environments are most used? (If there is a split, please estimate the proportions)
< > Visual Studio & .Net < > Eclipse < > other:
Q5.3. Code Management: What forms of internal code sharing are common in your lab? Is there a general policy / preferred method?
e.g. from simple file based sharing (or Dropbox ) to various forms of versioning systems ( CVS / SVN / Mercurial / Git, etc. )
Q6. Knowledge Sharing Q6.1. How is information access and sharing enabled in your lab? Please qualify how information sharing is organized.
Range: 0 N/A; 1 some people use external file sharing tools (e.g. dropbox); 2 a central drive network exists; 3 shared folders are strictly organizated and typed; 4 common file types are in use and deviations are documented; 5 standard information models are employed / usually a conversion tool is provided for application formats
< > Models < > Other data < > Code / development files < > Experiment configuration data
Page 10 / 14

RTLabOS: Phase I Deliverable 1.2: Survey Questionnaire T1: State of The Art
Q6.2. Are tools in use for Document Management? For which documents are they used? How are NDA
(non-disclosure agreement) aspects handled? Q6.3. Which collaboration & coordination tools are in use? (e.g. Outlook Exchange /shared calendar, Online project Management tools (Kanban, Podio, ..), Issue-tracking tools, …)
B) Lab-Related Software
Q7. Is there a dedicated SCADA system for the Lab? What features does it have? Please cover aspects such as: commercial (incl. brand) / open source; degree of tailoring & in-house
development; granularity of user access; features for locking configurations for experiments; flexibility to integrate new devices; how is data access secured/structured
Q8. GUIs for monitoring and lab management Please describe the types of GUIs that are in use for Lab management; are there dedicated GUIs for
supervising experiments? How are new GUIs set up? Q9. Data aquisition and storage infrastructure Q9.1. Please describe the features of your Data Acquisition infrastructure. Aspects: time resolutions; time stamping; types of measurements; life data vs. historians (e.g. in case of Power Quality recording); data access
Q9.2. Data Hosting & Storage: How is historical data stored in your lab? Is there a central database for all data or are there several systems? Can data be ‘tagged’ for specific experiments? (e.g. as “restricted access”) Q10. Equipment and components control What infrastructure do you have to deploy controllers onto your lab equipment?
Page 11 / 14

RTLabOS: Phase I Deliverable 1.2: Survey Questionnaire T1: State of The Art
C) Additional Tools and Advanced System Integration
The questions in this category are all open questions. If availability of related capabilities is available the respondent is requested to provide a free-text reply. Please refer to the “Domain Study” document for clarifications on the question topics.
Q11. Co-simulation and HIL coupling and interconnection Q11.1. Does your Lab provide Hardware-in-the loop facilities? Of which type? Q11.2. What types of co-simulation can be performed in you lab? Q12. Remote access to equipment and simulation Q12.1. Can data and time series of equipment in the lab be accessed remotely? Are visualizations
supported? What platform is used for this purpose? Q12.2. Is remote control possible? How? Q12.3. Is there an API for remote closed-loop control? Based on what technology / standards? Q13. Data merging tools Q13.1. Are dedicated services available in your lab that simplify merging of data from different
sources? Q14. Experiment booking and permissions
Page 12 / 14

RTLabOS: Phase I Deliverable 1.2: Survey Questionnaire T1: State of The Art
Q14.1. What tools are available and actually used in your lab to reserve experiment space and equipment, lock access to breakers?
Q14.2. Is it possible to unify these permissions under a single experiment access ‘tag’? Q15. Platform for deploying and testing controls Q15.1. Does your lab offer standardized functionality to deploy controllers onto devices? Q15.2. Is this mechanism based on a particular standard? Q15.3. Is the mechanism in use? What percentage of possible users actually empoy the mechanism? Q15.4. Is there an infrastructure that integrates development and testing of controls in simulations
that can be (seamlessly) integrated with a deployment on laboratory equimpment? How does it work? What are the elements of this toolchain?
Q16. Advanced configuration management
Configuration, Controls & Configuration Data Management
Q17. Software Interoperability and Interface Standards
Q17.1. Does your lab encourage use of standardized data exchange protocols? Indicate for different layers.
Page 13 / 14

RTLabOS: Phase I Deliverable 1.2: Survey Questionnaire T1: State of The Art
Level 1: Process & Components
Level 2: (Distributed) Process Control
Level 3: SCADA (DA, Supervision and Visualization)
Level 4: Service Layer
(Level 5: System Engineering / Planning )
Q17.2. System Integration: With respect to integration of new software / components, do you have shared principles for alignment?
Range:
1 everything ad-hoc 3 shared principles & patterns 5 following strict architecture
Page 14 / 14

![Smart Grid Laboratories Inventory 2018 · the European DSOs (grid characteristics and smart grid dimension) [7]. The assessment framework for the identification of Smart Grid Projects](https://img.pdfslide.us/doc/110x75/5ed2dcaea079355bb26d9ed5/smart-grid-laboratories-inventory-2018-the-european-dsos-grid-characteristics-and.jpg)


![Smart Grid Laboratories Inventory 2016 - Europa · for the identification of Smart Grid Projects of Common Interest (PCI) [4], and the Cost Benefit Analysis of Smart Grid Projects](https://img.pdfslide.us/doc/110x75/5f87de09559f9076a1599691/smart-grid-laboratories-inventory-2016-europa-for-the-identification-of-smart.jpg)