Embed Size (px)
Citation preview

1
SOAR on Containment Thermalhydraulics andHydrogen Distribution
Prepared by an OECD/NEA Group of Experts
(June 1999)
2
TABLE OF CONTENTS
Page
FOREWORD 4
EXECUTIVE SUMMARY 5
1. INTRODUCTION 13
1.1 References 15
2. RELEVANT TECHNICAL ASPECTS AND KEY 16REQUIREMENTS
2.1 Introduction 162.2 Design-basis Accident versus Severe Accident 162.3 Influence of Containment Types 172.4 Containment Thermalhydraulics Event Loads 222.5 Accident Mitigation 252.6 Use of Computer Codes in Decision-making 262.7 Summary 272.8 References 28
3. PHENOMENA 29
3.1 Introduction 293.2 Containment Phenomena Identification 313.3 Containment Phenomena Ranking 353.4 References 44
4. RECENT EXPERIMENTAL ACTIVITIES 46
4.1 Introduction 464.2 Integrated Effects—Natural Convection and H2 Distribution 544.3 Separate Effects—Plume Behaviour 934.4 Recombiner Experiments 1004.5 Summary of Experimental Conclusions 1044.6 References 107
5. CODE DEVELOPMENT AND APPLICATION ACTIVITIES 114
5.1 Introduction 1145.2 Background 1155.3 Computer Code Types and Recent Development 1185.4 Code Applications 1265.5 Simulation Uncertainties 1765.6 Conclusions and Recommendations for Future Applications 1845.7 References 188

3
TABLE OF CONTENTS (concluded)
Page
6. REMAINING UNCERTAINTIES DERIVED FROMEXPERIMENTAL AND ANALYTICAL EXPERIENCE 192
6.1 General Remarks 1926.2 Analytical Modelling Features 1936.3 Implications of Scaling 1976.4 Initial and Boundary Conditions 1996.5 Sensitivity Analyses 1996.6 Conclusions and Recommendations 2016.7 References 201
7. CONCLUSIONS AND RECOMMENDATIONS 203
LIST OF AUTHORS 207
LIST OF ABBREVIATIONS 208
APPENDIX A: CODE DESCRIPTIONS 210
A.1 Lumped-parameter Codes 210A.2 Field Codes 249A.3 References 256
APPENDIX B: OTHER CODE APPLICATIONS 267
B.1 E11.2 benchmark [1] 267B.2 E11.4 benchmark [1] 272B.3 NUPEC M-4-3, M-8-1, and M-8-2 Tests [4,5] 272B.4 PHEBUS-FPT0 283B.5 NUPEC Experiments M-2-2 [4] (relevant separate-effects test) 286B.6 Acknowledgements 287B.7 References 287
LIST OF AUTHORS 289
LIST OF ABBREVIATIONS 290
4
FOREWORD
In 1994, CSNI’s Principal Working Group on the Confinement of Accidental Radioactive Releases(PWG4) and its Task Group on Severe Accident Phenomena in Containment (SAC) identified a needfor a state-of-the-art report (SOAR), to bring together what had been learnt from several InternationalStandard Problem (ISP) exercises regarding the predictive capability of codes, as well as the need fora discussion of the codes’ adequacy (or inadequacy) for plant applications.
The NEA Committee on the Safety of Nuclear Installations (CSNI) endorsed the PWG4’s proposal toprepare a SOAR. Prof. Dr. H. Karwat agreed to take the lead in this effort, with financial supportfrom the OECD. A small Writing Group was set up; its members are listed in the Annex.
The Writing Group met twice in 1996, twice in 1997, and once in 1998. Lead Authors wereappointed for the various chapters of the report. The final version was endorsed by the SAC, PWG4and CSNI respectively in March 1998, September 1998 and December 1998.
The CSNI expresses its gratitude to the various governments and organizations that madeexperimental and analytical data available for the preparation of the report as well as for theresources—time, staff, effort and money—devoted to this substantial piece of work.
The Committee particularly thanks the AECL for assuming the task of editing the final version of thereport. This work required a high level of technical competence and a rigorous check of the accuracyand consistency of the text. Special thanks are due to Mr. G. Koroll and Mr. M. Krause who wentbeyond the call of duty to ensure the high quality of the final report, and to Ms. A. Soonawala whodid an excellent job in improving the language, the coherence, and the presentation and layout of thechapters.

5
EXECUTIVE SUMMARY
During the course of severe accidents in water-cooled nuclear power plants, large amounts ofhydrogen could be generated and released into the containment. The formation of hydrogeninevitably accompanies any core degradation process. The problem may be amplified by the less-likely core-concrete interaction during a subsequent basemat erosion. The integrity of thecontainment could be challenged by certain hydrogen combustion modes if no mitigative measureswere available. International consensus is that a detailed knowledge of containmentthermalhydraulics is necessary to analyse the effectiveness of hydrogen mitigation methods, eventhough, at present, there are no generally accepted requirements for this purpose. During the lastdecade, considerable international efforts have been undertaken to better understand the associatedproblems by executing a large number of experiments and subjecting the test results to extensiveanalytical assessment.
The CSNI Principal Working Group 4 at its meeting in September 1995 proposed to CSNI to draft astate-of-the-art-report (SOAR) on "Containment Thermalhydraulics and Hydrogen Distribution."CSNI had endorsed the preparation of such a SOAR at its November 1995 meeting.
The mandate for this SOAR can be best illustrated by several guiding questions that had been raisedand discussed during earlier meetings of PWG4 and its Task Group on Severe Accident Phenomenain Containment (SAC):
• What had been learnt from recent International Standard Problem (ISP) exercises oncontainment thermalhydraulics and hydrogen distribution?
• What could be concluded about the codes’ abilities to predict the containment thermal
behaviour from ISPs and from other related tests for plant application? • How should remaining uncertainties be best handled? • What more needs to be done, if anything?
Consequently, the main objectives of this SOAR are
1. to assess the current capabilities to make relevant predictions for the plant assessment ofexisting and future containments with respect to pressure, temperature and gasconcentration-distribution inside the containment under severe accident conditions; and
2. to address strengths and weaknesses of analytical methods realized in codes that are in use
to predict the effectiveness of a chosen mitigation technique (e.g., lumped-parametercodes or three-dimensional (3D) field codes) or both taking into account importantsimulation uncertainties.
In addressing these objectives, available accident management actions and their possible feedback oncontainment phenomena (e.g., stratification, etc.) should be kept in mind to avoid a purely academicevaluation.
In face of ongoing activities within PWG4 in assessing the SOAR on turbulent combustion anddeflagration-to-detonation transition (DDT), the consequences of highly transient combustion events
6
on mass and energy distribution inside the containment will not be treated here. On the other hand,mitigation measures resulting in a slow change of pressure and local temperature-and gas-distributionwill be addressed, e.g., the effect of passive autocatalytic recombiners (PARs) on natural-convectionevents. Experiments and analyses serving the study of physico-chemical phenomena of autocatalyticprocesses inside the PAR—e.g., concerning component qualification of PARs or the selection ofcatalytic materials—remain outside the scope of this report.
Traditionally, containments of water-cooled power reactors have been designed to withstand themechanical and thermal consequences of a spectrum of anticipated loss-of-coolant accidents(LOCAs). The design-basis accident (DBA) scenarios, which cover a range of postulated ruptures ofprimary or secondary coolant lines up to the large-diameter main recirculation line, have beeninternationally adopted to support the specification for the design and the safety assessment of mostengineered safety systems. Typical DBA short- and medium-term phenomena and processes havebeen evaluated in detail in two earlier SOARs.
CSNI-Report 126 was drafted to assess the relevant fundamental and confirmatory research projectsconducted in context with the design of western pressure suppression system containments forboiling-water reactors (BWRs) between 1975 and 1985. CSNI Report 166—addressing relevantfundamental and confirmatory research projects conducted between 1975 and 1985, in support of thedesign of large dry full-pressure containments of pressurized-water reactors (PWRs)—was publishedin December 1989. Phenomena associated with the local compartment pressurization and with theglobal containment pressurization process were considered, to allow the safe design of thecontainment once the rules and guidelines issued by the licensing authorities are observed.Qualitative comparisons of pretest predictions with large-scale test data indicated sufficient safetymargins to warrant a reliable design of the containment system. Code validation work and, inparticular, results of the ISP activities supported this qualitative conclusion. No further researchwork was deemed necessary at that moment, with respect to phenomena associated with the DBAconcept.
Little new information has become available with respect to DBA-oriented experimental activitiessince that time. ISP 23 was the last ISP exercise confirming findings of earlier studies. Taking intoaccount the conservative principles of the containment design procedures, the conclusions andrecommendations of both of the preceding SOARs remain fully valid.
The radiological consequences and probabilities of severe accident scenarios have been evaluated inthe frame of risk studies. For such scenarios, the preservation of the containment integrity is ofutmost importance. In specific, the release of hydrogen poses a particular threat to the containmentas for nearly all severe accident sequences it may lead to a dangerous combustion load if it remainsunmitigated. Other processes like high-pressure core-melt ejection into the lower plenum, core-meltinteractions with water or a core-melt penetrating the containment basemat may also threaten thecontainment integrity under certain conditions of severe accidents. Some thermalhydraulic aspects ofsuch events were recently discussed in the SOAR on High-Pressure Melt Ejection (HPME) andDirect Containment Heating (DCH) (1996) and in the technical note on Ex-Vessel Core Melt DebrisCoolability and Steam Explosions (1996).
Large amounts of hydrogen could be generated and released into the containment during the courseof severe accidents in water-cooled nuclear power plants (NPPs). The formation of hydrogeninevitably accompanies any core degradation process. It poses a particular threat to the containmentbecause for nearly all anticipated severe accident sequences, it may lead to a dangerous combustionload if it remains unmitigated. Gas transport and mixing within the containment free volume are

7
important thermalhydraulic phenomena in this context. Considerable international efforts have beenundertaken to better understand long-term containment thermalhydraulics by conducting a largenumber of experiments and then subjecting the test results to extensive analytical assessment.Progress in this area has been assessed keeping in mind the available hydrogen mitigation concepts,including the use of deliberate ignition, the installation of passive autocatalytic recombiners (PARs),pre-or post-inerting the free containment volume and early venting. Each method has specificadvantages and problems, which are largely dependent on the thermalhydraulic conditions of thecontainment atmosphere and on the type of containment. Although most pressure suppressionsystem containments of BWRs are permanently inerted during normal operation, hydrogen mitigationis activated in large dry containments of PWRs only in case a severe accident has occurred. Anumber of thermalhydraulic codes are in use to analyse the plant behaviour and estimate theeffectiveness of mitigation procedures under such conditions.
To ensure the validity of codes, the PIRT (phenomena identification and ranking table) evaluationmethodology has been developed to identify and assign importance to various phenomena occurringin safety-relevant components, in this case, the containment. The PIRT method establishes a stronglinkage between an experimental program—code validation, in general—and containment accidentanalyses. The identification process proceeds without reference to a particular code or modellingcapability, drawing on a physical interpretation of processes that are known to occur in current andadvanced light-water reactors (LWRs) during postulated reactor accidents. Within the framework ofthis report, PIRT has been introduced to identify the main phenomena and processes dominating thethermalhydraulic containment behaviour associated with some hydrogen mitigation techniques, suchas recombination and gas dilution schemes. In this sense, several processes—in particular, the gas–steam–air distribution, mixing and long-term pressurization—have been addressed. Important threatto the containment integrity has been attributed to certain hydrogen combustion modes, to the directcontainment heating (DCH) processes (not treated here in detail) and to late gradual pressurizationcaused by corium cooling and sump evaporation, whatever applies. An exemplary PIRT ranking hasbeen generated to illustrate the general importance of specific phenomena, independent of selectedmitigation techniques and independent of containment types. The example shows the interrelationbetween the phenomena and those measurable or predictable parameters or both that govern theprocesses. Focusing on subsequent combustion modes, the gas–steam composition distribution hasbeen identified as a leading parameter characterizing atmospheric mixing and gas transport prior toignition. This parameter becomes obvious from the high ranking (H) attributed to most of theassociated phenomena (Table 3.3.4-1). Other phenomena are indirectly influential depending onnatural convection and gas distribution, e.g., condensation and heat transfer to structural surfaces.Phenomena and processes occurring as a result of deliberate ignition are not included here. Theeffect of combustion on gas distribution involves a complicated combination of phenomena alreadyidentified and some additional ones. Such processes and phenomena, as combustion-drivenredistribution of gases, are considered to be outside the scope of this report.
National and international research efforts have been conducted to understand the containmentbehaviour under severe accident conditions. A considerable experimental database has beengenerated by integral model experiments at various scales. Specific interest was devoted to long-lasting natural-convection experiments including mixing and thermal stratification. Test facilitiescover a wide range of volumes between approximately 21 m3 (VICTORIA) and 11 300 m3 (HDRContainment). Undivided as well as compartmentalized test facilities were studied. Relative to full-size prototype plants, volumetric scaling ranged from 1/3500 (VICTORIA) to 1/5 (HDR). Oneexperiment (HDR test T31.5) served as a concluding experiment under DBA-typical conditions;many others were especially devoted to the investigation of severe accident typical conditions.

8
Unlike the planning and interpreting of DBA-related containment experiments, it is not possible toattribute "conservatisms" to the results of experiments simulating anticipated severe accidentscenarios or to the way in which experiments were conducted. Such experiments are mainlyperformed to provide a "best-estimate" understanding of the dominating phenomena. In this sense,their results are intended to be compared with "best-estimate" analytical simulations. Directtranslation or interpretation of results as the expected behaviour of a full-size prototype plant is notadmissible because of a practically unlimited variance of possible combinations of anticipated systemmalfunctions and because of possible scale-dependent distortions of governing processes studied inmany test facilities.
Some qualitative observations were assessed and correlated with reported test conditions, asindicated by Table 4.1-3 in Chapter 4. The reader who is interested in details is referred to theoriginal reports referenced at the end of each section.
Most experiments discussed in this report have been based on the “time-preserving”, but “geometryscaled-down”, principles. Therefore, even if distortions from initial and boundary conditions couldbe avoided through careful operation of tests, the scale and geometry of the particular facilityintroduce distortions of some phenomena, leading to over- or under-emphasis of certain phenomenaover other phenomena. For example, the absence of long-term heat sinks (thick concrete structures)in some test facilities would not sustain the phenomenon of buoyancy–wall interaction (regional) inthe long term. Conversely, the large height-to-diameter ratio of the HDR containment would tend tooveremphasize this phenomenon, as compared with the height-to-diameter ratio of a nuclear reactorcontainment. Such distortions must be carefully considered when making statements with respect tohow accurately a nuclear facility is represented by a particular experiment.
In summary, a number of experiments were performed during the last decade to investigate the long-term behaviour of containments. Most of the 23 experiments listed in Table 4.1-3 addressedphenomena associated with integral mixing processes in containments. An impressive range ofvolumetric scale, various compartment configurations, and accident conditions were studied.Although more tests may be performed in the future to fulfill technical needs, the tests conductedhitherto provide a reasonable database for current lumped-parameter code validation. Manyexperiments are well documented, and information has been made available to the nuclearcommunity.
However, some restrictions with respect to the suitability of experiments for code validation purposeshave also been seen. Available pressure and temperature sensors, in general, yield reliable data forcomparison with corresponding analytical results. Other parameters like local steam condensationrates, gas concentrations, and low flow velocities in open rooms typically indicating buoyancy-drivenplume formation are difficult to measure, are limited in number and are burdened with largeruncertainties. Detailed validation of sophisticated analytical simulation models—e.g., based on fieldcodes—suffers from this restriction. Continuing development of measurement techniques along withsome supplementary separate-effects tests (SETs) would be desirable to improve the situation.
Most large-scale integral experimental programs have been terminated. Some new SETs have beeninitiated or are under construction. Whiteshell Laboratories (Canada) have recently started a newlarge-scale separate-effects gas-mixing test program, which may complement the existing database inthis area. The planning of a new French mitigation and stratification test program, MISTRA, isproceeding. Other ongoing SETs programs are focusing on thermal effects of recombiners and theirefficiency, thereby complementing the growing database in this field as well.
9
Critical dialogues between experimenters and analysts, in particular in the framework of future ISPexercises are recommended, to identify experimental shortcomings in an early phase. Uncertaininitial conditions and transient boundary conditions of experiments as well as experienced errorbands of applied sensors will be the more important items of such dialogues.
Progress has also been noted in the development of the more recent codes, as demonstrated by ISPrecalculations. Several lumped-parameter codes have been improved or have been newly developed,thereby replacing earlier versions that were available in only rudimentary form during the early1980s, when risk studies were intensified. The new versions of the codes allow a more detailedinsight into processes governing various scenarios of interest, specifically the highly importantbuoyancy–stratification phenomena identified by the PIRT method. Much attention has been devotedto distribution calculations, eventually serving as basis for a prediction of hydrogen combustionconsequences.
Multidimensional finite-element field codes have been further developed. These codes providesolutions of the Navier-Stokes equations for multicomponent gas flow and allow fine-griddiscretization of the free containment volume. Various physical subroutines have been added, e.g.,improved routines for heat exchange with confining structures including condensation film trackingmodels, combustion models for hydrogen burns etc. However, application of field codes is adeveloping methodology requiring a great deal of experience, further validation efforts, and the proofof the codes’ predictive reliability, especially for full-plant analysis.
Four large integral tests served as basis for ISPs; one of them (ISP 23) was devoted to a DBA-typicallarge-break loss-of-coolant accident (LBLOCA) situation. ISP 23 can be considered as an essentiallink between the dynamic short-term events that circumscribe the DBA scenarios and the long-lastingnatural-convection-driven thermalhydraulic conditions characteristic of many severe accidentscenarios. The underlying HDR experiment T31.5 demonstrated that even a LBLOCA may causestarting conditions for natural-convection processes that temporarily lead to thermal stratification.Subsequent large-scale HDR-distribution tests confirmed the interrelation between the location of apreceding primary coolant release and the possibility for thermal stratification of the containmentatmosphere limiting overall mixing processes when hydrogen is released afterwards.
International Standard Problem 35, based on NUPEC-experiment M-7-1, demonstrated the effect ofan activated spray system on containment internal mixing. Other NUPEC experiments showedsomewhat different results under modified test conditions. It should be noted that these NUPECexperiments were performed with atypical containment internal steel structures that have only smallheat capacities if compared to normally applied concrete structures. This observation must be takeninto account when the general relevance of the test results has to be evaluated.
As mentioned, lumped-parameter codes homogenize the properties of a fluid within a given controlvolume. In general, this property amplifies overmixing tendencies observed in many lumped-parameter code analyses when based on coarse nodalization concepts. Field codes like GASFLOWhave shown certain advantages compared to some lumped-parameter codes for re-analyses of HDR-based gas distribution experiments because they allow complex geometric structures of a test rig orof a nuclear containment to be more closely simulated in setting up or adjusting an adopted meshgrid, which may involve 10 000 to 100 000 computational cells. Transition from lumped-parametercodes to field codes or a combination of both types is considered as a future option if accurate andreliable gas distribution predictions are needed as initial conditions for the simulation of a subsequentcombustion process. Information submitted for this report indicates some advantages of these codescompared to some lumped-parameter codes in conjunction with post-test analyses of experiments
10
where flow stratification occurred. Optimized task-oriented strategies on how to utilize 3D fieldcodes are under development. Only available computer capacity and computing time would restrictthe refinement in spatial discretization.
Numerous reports on thermalhydraulic code application exercises have been assessed. Mostimportant are the contributions to ISP activities and the conclusions drawn from these activities. TheISPs have been very useful to identify code deficiencies and code-user problems. Moreover, theyalso provide a well-documented database for benchmarking further code improvements.
Similar to data obtained from other integral experiments, the utilization of former ISP experimentsfor 3D code validation is somewhat restricted because local measurements of prime variables areoften not available, especially in regions within jet and plume boundaries where high spatialresolution is required (e.g., with respect to local mixing and jet disintegration). Clearly, field codeapplications have been rare, in part, because of the limited suitability of past ISPs for field codevalidation. An assessment of field codes, as a component to an analytical simulation model (ASM)of a containment, is pending subject to validation of a number of modelling and applicationapproaches: Examples are the appropriate low Reynolds number for turbulence closure equations;techniques to reduce mesh-size requirements, such as fractional mesh areas for matching flow pathareas; and the use or lack of body-fitting meshing schemes. Recommendations for futureexperiments and selection of future ISPs should take into account the appropriateness of theexperiment for field code validation, including the availability of local measurements for primevariables.
Additionally, it has been pointed out that code validation for both lumped-parameter and field codessuffers from questionable attempts to resolve dominating or governing processes and phenomena’sinteractions for ISPs and other integral experiments. This difficult task, involving identification andquantification (addressed in both Chapters 4 and 5) is of course complicated by a lack ofcomplementary separate-phenomena testing, especially for mixing and transport processes and, asnoted, prime variable measurements. The concern here, as related to code application, is thatunanswered questions concerning the complexities of processes and interactions weaken the positionthat integral test comparisons and inferences from those comparisons are not overly influenced bycompensating errors. A lack of knowledge in this area could result in potentially wrong ormisleading conclusions on code validation. Consequently, it has been recommended that future ISPsbe directed more toward separate phenomena and phenomena-interacting studies.
Main sources of remaining uncertainties for the analysis of containment internal processes have beenaddressed. The initial conditions and the boundary conditions under which integral experiments hadbeen performed have been mentioned above. Limited experience in translating geometrical facts oftest rigs into proper task-oriented nodalization concepts has been noted. Applicability andcompatibility of empirical relationships for heat transfer coefficients and flow resistance factors incombination with chosen thermalhydraulic and structural nodalization concepts representing thegeometrical facts of the simulated object have been addressed. Other uncertainties are related to thescalability of processed empirical correlation in combination with the chosen nodalization of thesimulated object. Similar questions remain to be answered for lumped-parameter codes as well as forfuture field code applications.
These factors will remain influential for nuclear plant simulations as well. The boundary conditionsfor code applications to NPPs are closely related to the variety of accident scenarios of interest. In-vessel processes and anticipated malfunctions of plant components determine such scenarios withconsiderable variability and uncertainty. One has to anticipate that thermalhydraulic plant analyses

11
will be more burdened with uncertain boundary conditions than will analyses of experimental events.Appropriate and relevant sensitivity analyses for major code applications may help to quantify thevariance of code results for the particular scenarios of interest.
Useful conclusions concerning the applicability of containment thermalhydraulics and hydrogendistribution codes to reactor plant systems may not be possible without addressing the technicaldesign tasks to be supported by such code predictions. Gas distribution calculations are needed togenerate the initial conditions of a subsequent combustion process. Boundaries between the differentcombustion modes deduced from experimental data are characterized by narrow gas concentrationbandwidths, in particular in the presence of turbulence-generating obstacles, as is evident fromrelevant literature. Hence defining the safety margins for a combustion process inside a containmentwould require having to satisfy certain accuracy demands for the preceding gas distributioncalculations, in particular if limits for combustion modes are approached. Accumulated codeapplication evidence leads to the observation that some lumped-parameter codes would not currentlysatisfy the accuracy requirements necessary for coupling to combustion codes. More developmentand more task-oriented code application experience would be necessary. Reliable gas distributioncalculations also serve to analyse the effects of hydrogen mitigation systems like PARs or apostinertization system. Recombiners become local heat sources interacting with convective flowpatterns inside the containment, once the hydrogen concentration at the inlet to the recombinersreaches the threshold values for catalytic activation. In this case, the spatial distribution of selectedrecombiner positions will be influential on the analytical simulation model to allow the simulation ofrecombiner interactions with the containment atmosphere. The present capabilities of lumped-parameter codes may satisfy the desirable levels of accuracy as long as predicted recombinertemperatures remain below self-ignition thresholds and the hydrogen concentrations remain wellbelow values leading to accelerated flames. Several code applications dealt with the recalculation ofintegral recombiner experiments studying the influence of recombiners on containmentthermalhydraulics.
Recommendations on future work, to sharpen the analytical tools, must be carefully evaluated againstthe possibilities to improve available measurement techniques and to develop innovativemeasurement techniques to make optimal use of decreasing funding. Certain supplementaryexperimental activities have recently been started. Even if—because of funding restrictions—onlylimited progress is expected in the execution and continuation of these experimental programs in thenear future, these programs will shed more light on the reasons for existing simulation uncertaintiesand are, therefore, heavily recommended. Moreover, the quality and reliability of new experimentaldata may profit from earlier experience, and some earlier shortcomings in generating and processingnew experimental data may be avoidable.
It has been recommended that a general phenomena-oriented containment code validation matrix beestablished to support future code application practice and validation. Such a matrix would be bestbased on existing integral or separate-effects test data, starting with DBA-oriented experiments andcontinuing with experiments typical for severe accident scenarios. In this context, the suitability ofthe instrumentation of the experiments to be selected addressing particular phenomena must beevaluated within a first step. Information on existing error bands for available measured data shouldbe established and documented. Integral and separate-effects tests should be distinguished, andinformation on adopted scaling principles of the selected experiments should be given. Specificattention should be devoted to experiments suitable for validation of future field codes. Some testsdescribed in the report addressing also phenomena other than integral mixing will increase the valueof a future containment code validation matrix. Finally, also providing opportunities for predictivepretest simulations should be encouraged. Concerning the application of lumped-parameter, as well

12
as of field codes, it is highly recommended that existing guidelines be improved for code users whoare not engaged in code development. The guidelines should more rigorously inform the code usersabout the accumulated code application experience, in particular about experience obtained withinthe framework of ISP activities and should more clearly indicate the rules and limits for thephysically and numerically justified use of thermalhydraulic codes.
In concluding, the following observations have been made:
• The current capabilities of analytical tools (e.g., the lumped-parameter codes) to makerelevant predictions of the pressure history of a containment and the correspondingaverage steam content are satisfactory. Predictions of the gas distribution withincontainments in case of hydrogen release into existing or future containments may beconsidered as satisfactory for analysing hydrogen mitigation procedures for which safetymargins are sufficiently large to preclude significant accumulations of sensitive mixtures.Gas distribution predictions needed to serve as initial basis for subsequent combustionanalyses would require more reliable high local resolution. This requirement iscontingent upon the combustion mode to be investigated; in particular, for diffusionflames and DDT, these modes require better local predictions of relevant initialconditions.
• Codes derived on basis of the lumped-parameter approach have shown their application
limits, in particular through a number of ISP exercises. If predictive accuracies arelimited, appropriate sensitivity analyses should be performed for plant-specific analyses.Also the prediction of slow containment pressurization caused by decay heat transportedfrom the core or from a released core-melt, up to the threshold for venting may beperformed reliably with lumped-parameter codes if computational margins of the ASMresults are carefully assessed.
• Recent applications of improved lumped-parameter codes for treating gas distributions,
specifically cases of global and regional stratifications, have indicated good success, asdemonstrated in ISP recalculations and other integral test comparisons. However, thedetermination of consistency and of new limits of the various techniques used, includingboth the numerical and physical modelling methods, need further investigation, e.g., anexpanded base of test comparisons, analysis, and documentation.
• Field codes may be the preferred analytical methodology to predict gas concentration
distributions with the necessary spatial resolution to eventually serve as basis for analysesof energetic combustion modes, e.g., turbulent combustion and DDT. Considerablevalidation and accumulation of code application experience are considered necessarybefore these tools could be reliably used for plant analyses.
• OECD-sponsored ISP activities have been fruitful in identifying code application
problems and in amplifying the contacts between the experimental and analytical workingcommunities. To foster further code development and validation, ISP activities should becontinued. This recommendation of course requires competent laboratories and researchcentres to perform necessary tests and offer corresponding results to the nuclearcommunity. Integral- as well as separate-effects tests will be needed. In the future, thesuitability of experiments proposed as ISP bases should be more carefully assessed than inthe past before they are adopted.

13
1. INTRODUCTION
During the course of severe accidents in water-cooled nuclear power plants, large amounts ofhydrogen could be generated and released into the containment. The formation of hydrogeninevitably accompanies any core degradation process. The problem may be amplified by the less-likely core-concrete interaction during a subsequent basemat erosion. The integrity of thecontainment could be challenged by certain hydrogen combustion modes if no mitigative measureswere available. International consensus is that a detailed knowledge of containmentthermalhydraulics is necessary to analyse the effectiveness of hydrogen mitigation methods, eventhough, at present, there are no generally accepted requirements for this purpose. In this context, theprediction of the local distribution of hydrogen, steam, and air inside the containment is a key issue.Considerable international efforts have been undertaken to better understand the associatedphenomena by conducting a large number of experiments and then subjecting the test results toextensive analytical assessment.
The rates and quantities of hydrogen produced and the location of its release into the containmentdepend on a variety of conditions largely independent of each other (accident scenarios, the coredegradation progress, the unavailability of engineered safeguards, etc.) and also independent of thereactor type, thereby rendering it very difficult to cover all possible configurations of assumptionsand conditions by a limited number of relevant experiments and by the associated code applicationstrategies validated on that basis. Consequently, experiments can, in general, be performed at only areduced scale and under certain operational limitations. The availability of validated codes isessential to correctly interpret the general applicability of the hitherto accumulated knowledge oncontainment thermalhydraulics under severe accident conditions and to quantify and further reducethe uncertainties of predicted thermalhydraulic containment parameters.
Within the framework of the CSNI Principal Working Group 4 (PWG4) the adequacy of existingcodes for plant applications in this area has been discussed for quite some time. Nonuniformopinions on this matter have been expressed, with respect to the needs for further developments. Atits meeting in September 1995, PWG4 proposed to the CSNI to draft a state-of-the-art report (SOAR)on "Containment Thermalhydraulics and Hydrogen Distribution". The CSNI endorsed thepreparation of such a SOAR at its November 1995 meeting.
The mandate for this SOAR can be best illustrated by several guiding questions that were raised anddiscussed during earlier meetings of PWG4 and its Task Group on Severe Accident Phenomena inContainment (SAC):
• What had been learnt from recent International Standard Problem (ISP) exercises oncontainment thermalhydraulic and hydrogen distribution?
• What could be concluded about the codes’ abilities to predict the containment thermal
behaviour from ISPs and from other related tests for plant application? • How should remaining uncertainties be best handled? • What more needs to be done, if anything?

14
Consequently, the main objectives of this SOAR are
1. to assess the current capabilities to make predictions for the plant assessment of existingand future containments with respect to pressure, temperature and gas concentration-distribution inside the containment under severe accident conditions; and
2. to address strengths and weaknesses of analytical methods realized in codes that are in use
to predict hydrogen distribution within a containment (e.g., lumped-parameter codes orthree-dimensional (3D) field codes or both) and to evaluate important sources ofsimulation uncertainties.
To avoid a purely academic evaluation, in addressing these objectives, available hydrogen mitigationtechniques and their possible feedback on containment phenomena (e.g., mixing, stratification, etc.)should be kept in mind.
In face of ongoing activities within PWG4 in assessing the SOAR on turbulent combustion anddeflagration-to-detonation transition (DDT), the consequences of highly transient combustion eventson mass and energy distribution inside the containment will not be treated here. On the other hand,mitigation measures resulting in a slow change of pressure and local temperature-and-gas distributionwill be addressed, e.g., the effect of passive autocatalytic recombiners (PARs) on natural-convectionevents. Experiments and analyses serving the study of physico-chemical phenomena of autocatalyticprocesses inside the PAR—e.g., concerning component qualification of PAR or the selection ofcatalytic materials—remain outside the scope of this report.
The report is structured into several parts. Chapter 2 on Relevant Technical Aspects and KeyRequirements provides a brief description of relevant hydrogen mitigation techniques (with leadauthors J.P. L´Heriteau and J. Bardelay). Chapter 3 describes phenomena relevant to containmentthermalhydraulics and hydrogen distribution under severe accident conditions and evaluates theadvantage of phenomena’s identification and ranking tables (PIRTs) to streamline the assessment ofthe available experimental and analytical research activities (with lead author J. Tills). Chapter 4assesses more Recent Experimental Activities investigating the mentioned phenomena and evaluatingthe suitability of experimental results obtained from various test rigs to serve for code validationpurposes and eventually derive the need for further experiments in the near future (lead authors areM. Krause and G.W. Koroll). Relevant experimental works, preferably for phenomena ranked highin Chapter 3, are described and assessed. Specific attention is devoted to the experimental boundaryconditions and scaling effects. Code Development and Application Activities are discussed inChapter 5, where specific attention is devoted to the findings obtained from the comparisons of coderesults with the aforementioned experiments, and in specific from the ISP activities. In addition,recommendations focusing on the applicability of different types of codes to serve as basis for theselection and design of particular mitigation techniques are derived (lead authors are H. Tezuka, Y.Kiso and J. Tills). Finally, in Chapter 6 Remaining Uncertainties Derived from Experimental andAnalytical Experience, evaluated from existing experimental and analytical evidence, are discussedwith specific focus on code application for containments of nuclear power plants (NPPs), to supportsubsequent general recommendations and the conclusions drawn for necessary or desirable futureresearch activities (lead author is H. Karwat).
Information to be processed was sorted within the framework of this report. Information andfindings, described and discussed in detail in freely available reports, were preferably processed(Category 1), followed by information with limited availability, e.g., through multilateral exchangeagreements (Category 2). Proprietary or commercial information if deemed important enough(Category 3) is mentioned briefly in spite of strict limitations on its availability.

15
Wherever applicable reference should be made to relevant CSNI reports, a considerable number ofsuch documents prepared by various CSNI groups has been specifically recommended forconsideration on the occasion of the first meeting of the Writing Group NEA/SEN/SIN/WG4(96)5.Another important source of information was the presentations given at the OECD Workshop on theImplementation of Hydrogen Mitigation Techniques held in Winnipeg, Canada in May 1996. Mostrecently, new SOARs became available on High Pressure Melt Ejection (HPME) and DirectContainment Heating (DCH) as well as on Severe Accident Management Implementation, which mayserve as demarcation lines for the present assessment to avoid repeating too many details.
Hence the main focus is on natural buoyancy-driven gas-and-steam distribution processes inside acontainment system and the associated heat exchange with internal and external structures of thecontainment. However, pressure and temperature evolution are also of interest. The traditionaldesign-basis accident (DBA)-related phenomena are discussed to a very limited extent with respect toimportant findings obtained more recently. Former SOARs on Pressure Suppression Systems (forboiling-water reactors, BWRs) and Containments for Pressurized-Water Reactors (PWRs),addressing the design bases of the containments [1,2], served as inception for this assessment as wellas did other earlier reports evaluating general hydrogen mitigation issues (e.g., References 3 to 5).
The lead authors have volunteered on the occasion of the Writing Group’s first meeting in Cologne(Germany) on March 1, 1996, to collect information and take responsibilities for drafting the chaptersfor which they felt they had the required technical competence. Subsequent meetings of the WritingGroup were held at the OECD-NEA headquarters in Paris on September 24 and 25 in 1996, at GRSin Garching (Germany) from January 28 to 30 in 1997, at FZK Karlsruhe (Germany) from April 28 to30 in 1997, and at Fontenay-aux-Roses (France) from January 14 to 16 in 1998. A final meeting ofsome lead authors took place in Cologne (Germany) on June 20, 1998, to incorporate comments andrevisions proposed by some members of the Task Group on SAC in connection with its meeting inMarch 1998.
1.1 References
1. Pressure Suppression Systems, A State of the Art Report, CSNI Report No. 126,October 1986.
2. Containments for Pressurized Water Reactors, A State of the Art Report, CSNI ReportNo. 166, December 1989.
3. Commission of the European Communities, Hydrogen Behaviour and Mitigation inWater-Cooled Nuclear Power Reactors, Proc. of a Workshop held in Brussels(Belgium) from 4 to 8 March, 1991, EUR Report No. 14039en, 1992.
4. Commission of the European Communities, Hydrogen in Water-Cooled Nuclear PowerReactors, Final Report, EUR 14037en, Luxembourg, 1992.
5. Flame Acceleration and Transition to Detonation in Hydrogen/Air Diluent Mixtures,State-of-the-Art-Report by an NEA Group of Experts, NEA/CSNI/R(92)3, January,1992.
16
2. RELEVANT TECHNICAL ASPECTS AND KEY REQUIREMENTS
2.1 Introduction
Chapter 2 defines the safety approach to solve problems relative to the third barrier, the reactorcontainment. The major question is the containment response to thermalhydraulic transients and thehydrogen risk problem. It is important to keep in mind that the final objective in preserving theintegrity of the containment is to avoid uncontrolled release of fission products in the environment.
This chapter discusses
• some aspects concerning DBAs vs. severe accidents, • influence of containment types, • containment thermalhydraulics and events loads, and • accident prevention and mitigation.
The reader will find in Chapter 3 the major physical phenomena that have an effect on the calculationof thermalhydraulics of the containment.
Reactor designs and national safety requirements may differ from country to country. For example,in case of a severe accident in France, the acceptable fission-product release to the environment isevaluated according to the possibility
• to evacuate the population in a region of 5 km around the plant, and • to confine the population between 5 and 10 km around the plant.
The consequence of the differences in design and safety requirements is that each country has aglobal safety approach that is different for operating plants and for future plants.
2.2 Design-basis Accident versus Severe Accident
The thermalhydraulic behaviour of the atmosphere containment is controlled to:
• keep the containment integrity that may be threatened and impaired by anoverpressurization after the fast depressurization of primary or secondary circuit (loss-of-coolant accident (LOCA) or steam-line break accident) or molten core-concreteinteraction (MCCI) or hydrogen-air deflagration. These dynamic loads are evaluated asstatic loads.
• know all physical variables influencing radioactive transfer inside the reactor building and
peripheral buildings as well as environmental releases. For instance, these variables aretemperature gradients, condensation flow rates, and leak rates.

17
• evaluate and quantify the consequences for thermalhydraulic variables of theimplementation of mitigation devices for present reactors (e.g., spray system, ventingsystem) or future reactors (PARs, core catchers).
Historically, the DBA concept is used to determine parameters for safety systems in the licensingprocess. Variables such as design pressures are conservatively calculated with safety margins. Thesevalues are obtained with a rough global geometrical description of the reactor building and by the useof global heat transfer correlations, concerning, for instance, the condensation flow rate; they werewell suited, and the uncertainties were consistent with the knowledge of the primary-circuit LOCA.
The objective of realistic accident scenario calculation, essentially beyond DBAs, was to obtain thebest-estimate calculation, without any safety margin in order to evaluate the risk. Probabilistic safetyassessment (PSA) concludes this risk evaluation. Any accident management procedure or anymitigation device implementation will be quantified in this risk evaluation and only taken intoaccount if it significantly reduces this risk.
2.3 Influence of Containment Types
2.3.1 Operating Reactors
There are many types of containment around the world. Consequently, the discussion that followswill be limited to the most important types. The different containment types of current reactors anddifferent safety systems are described in Reference 1 (pages 15 to 17) and in Reference 2 (pages 4 to19). We will review the principal features that are of interest to this SOAR and also add informationon the VVER (voda vodynoy energiticheskie reactor) containment safety systems.
PWR
It is possible to distinguish 4 types of PWRs:
• Large dry containments that are divided into 3 types of structures:
− post-tensioned, pre-stressed concrete with or without a liner, with or without asecondary containment;
− deformed-bar reinforced concrete, with or without liner with or without a secondary
containment; and − steel, with or without a secondary containment.
These containments are designed for a pressure of about 0.43 MPa up to 0.63 MPa, with aspecified small leakage of the order of 0.1%, up to 1% volume per day at design pressure.The free volume is typically 70 000 m3.
• Ice condenser containments:
In this type of reactor, the steam is condensed by the ice, which melts, and the residualuncondensable gases emerge into the upper part of the containment. The design pressureis relatively low, 0.18 MPa. The free volume is typically 34 000 m3.

18
• Subatmospheric containments that are a minor variation of the large dry type. • Pressurized heavy-water reactor (PHWR)
The PHWR concept is basically a large dry containment combined with a large-capacitydousing system to reduce the maximum pressure during and after a LOCA. The designpressure is 0.14 MPag (gauge pressure). The free volume is typically 48 000 m3.
All these containments have internal concrete structures.
The important systems that influence the behaviour of the thermalhydraulics of the atmosphere of thecontainment are
• the heat removal system that prevents the containment from overpressurization by decayheat. Such systems are either independent spray systems, fan coolers or combined spraysystems and an emergency core-cooling system (ECCS) or only a highly redundant ECCS(avoiding long-term steam formation after refill of the reactor pressure vessel).
• the control system that isolates the containment and continuously monitors the reactor
building containment atmosphere and automatically closes the dampers and valvesprovided for automatic isolation of the containment.
• the ventilation systems and filters that maintain the pressure inside the containment below
that of the surrounding atmosphere and treat the ventilated gas so as to minimize therelease of any toxic material.
• the system that treats hydrogen produced during beyond-DBA or a severe accident. The
hydrogen-treating systems, when operating, can mix the combustible gas within thecontainment (e.g., spray, fan coolers) and can reduce the concentration of combustible gasusing various mitigative measures, as discussed below.
Some additional systems have been set up in case of an accident that exceeds a DBA, in particular
• venting systems that prevent late overpressurization failure, and • igniters and recombiners that can reduce the hydrogen concentration.
Not all the PWRs have these additional systems. These systems and the associated procedures aredeveloped in Section 2.6.2.
BWR
Boiling-water reactors have pressure suppression containments that can differ slightly but are basedon design principles similar to those of the PWR. The volume of this containment can be smallerthan that of a PWR. They do not have secondary-side steam generators. These reactors have a largeheat sink inside the containment to condense steam released through safety and relief valves duringreactor isolation events and during transients; in case of a LOCA, the released steam will becondensed in large water-cooled downcomer pipes.

19
The following are particular features of the BWR concept:
• the “wet well”, which is a large capacity suppression pool situated inside the primarycontainment structure. Above this pool is a leak-tight gas space.
• the “dry well”, which is a pressure-retaining structure surrounding the reactor coolant
system. • a vent system that connects the dry well gas space to the wet well below the suppression
pool surface.
Most small-volume BWR containments are inerted during operation. Some Mk III BWRcontainments are equipped with igniters above the water pool inside the wet well.
Other features are common to PWRs, particularly in the framework of safety.
VVER
There are 3 types of VVER pressurized reactors:
• VVER 440/230 (9 plants): The pressure boundary has reinforced concrete walls partiallycoated with outer or inner liners. Overpressure is released through flaps to theenvironment.
• VVER 440/213 (14 plants): This reactor has a bubble condenser containment, reinforced
concrete walls, with inner and outer liners. As is the case for BWR containments,pressurization after a LOCA is limited by steam removal through the water trays of thebubble condenser system.
• VVER 1000 (20 plants): This reactor has a full-pressure containment, with an inner liner
and reinforced concrete walls.
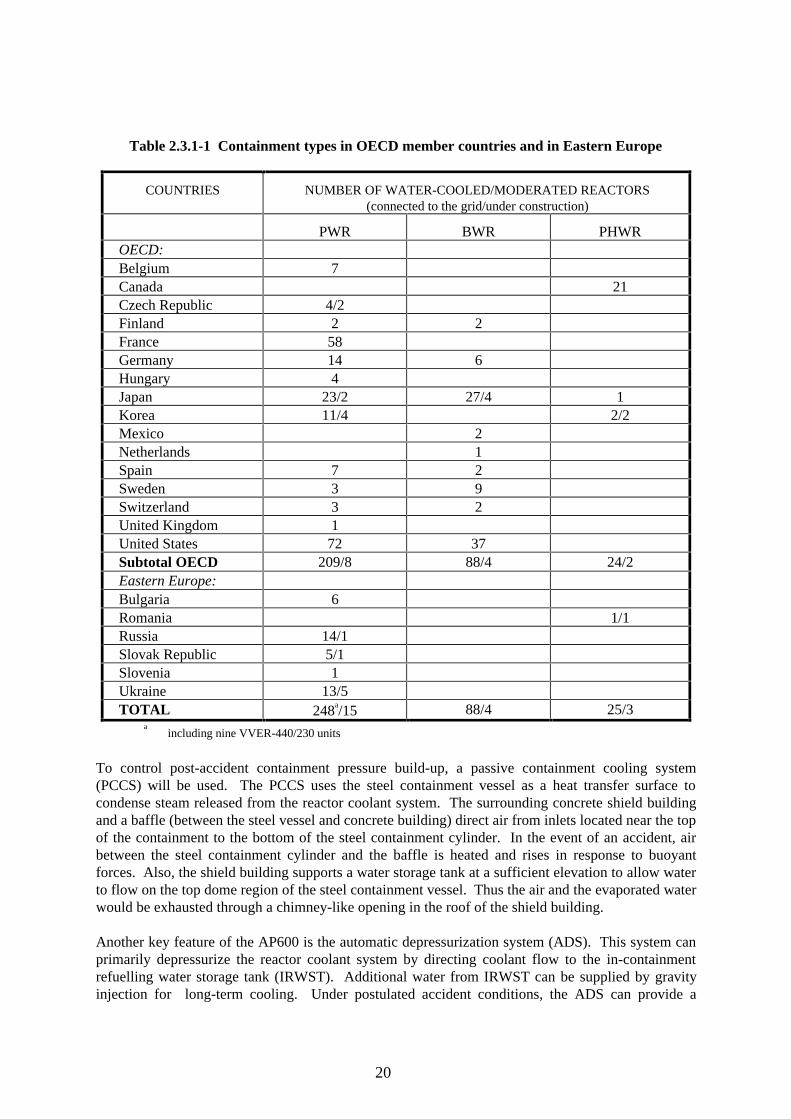
Table 2.3.1-1 summarizes the containment types in OECD member countries and in Eastern Europe.
2.3.2 Future Reactors
The new NPPs will consider severe accident phenomena at the plant design stage. These newconcepts are currently under discussion.
AP600
The AP600 is Westinghouse’s next-generation nuclear plant employing passive systems technologyto enhance safety and plant simplicity. The AP600 is based on Westinghouse’s existing two-looplight-water reactor. The safety system functionality of the AP600 relies on gravity drain systems andnatural circulation. Active containment safety systems for DBAs are incorporated in existing largedry PWR plants but are not included in this new design. Also, related to the reactor coolant system,conventional active pumping systems will not be relied on to respond to a postulated accident.
20
Table 2.3.1-1 Containment types in OECD member countries and in Eastern Europe
COUNTRIES NUMBER OF WATER-COOLED/MODERATED REACTORS(connected to the grid/under construction)
PWR BWR PHWROECD:Belgium 7Canada 21Czech Republic 4/2Finland 2 2France 58Germany 14 6Hungary 4Japan 23/2 27/4 1Korea 11/4 2/2Mexico 2Netherlands 1Spain 7 2Sweden 3 9Switzerland 3 2United Kingdom 1United States 72 37Subtotal OECD 209/8 88/4 24/2Eastern Europe:Bulgaria 6Romania 1/1Russia 14/1Slovak Republic 5/1Slovenia 1Ukraine 13/5TOTAL 248a/15 88/4 25/3
aincluding nine VVER-440/230 units
To control post-accident containment pressure build-up, a passive containment cooling system(PCCS) will be used. The PCCS uses the steel containment vessel as a heat transfer surface tocondense steam released from the reactor coolant system. The surrounding concrete shield buildingand a baffle (between the steel vessel and concrete building) direct air from inlets located near the topof the containment to the bottom of the steel containment cylinder. In the event of an accident, airbetween the steel containment cylinder and the baffle is heated and rises in response to buoyantforces. Also, the shield building supports a water storage tank at a sufficient elevation to allow waterto flow on the top dome region of the steel containment vessel. Thus the air and the evaporated waterwould be exhausted through a chimney-like opening in the roof of the shield building.
Another key feature of the AP600 is the automatic depressurization system (ADS). This system canprimarily depressurize the reactor coolant system by directing coolant flow to the in-containmentrefuelling water storage tank (IRWST). Additional water from IRWST can be supplied by gravityinjection for long-term cooling. Under postulated accident conditions, the ADS can provide a

21
potential challenge to the containment by directing the steam-hydrogen mixture from a degraded corethrough the IRWST, whereby the steam is condensed in the pool hydrogen is released locally.Hydrogen igniters and PARs are incorporated in the AP600 design to mitigate the consequence ofhydrogen releases inside containment.
European PWR
The European Pressurized-water Reactor (EPWR) Project aims at defining a product that can be builtin France and in Germany and be accepted by the safety authorities of both countries. The adoptedprocedure for the definition of such a new generation of units is to derive the design of these unitsfrom the design of existing plants in an “evolutionary” way, taking into account the operatingexperience, the in-depth studies and PSA conducted for such units while considering the introductionof new features, especially as regards the prevention of severe accidents and the mitigation of theirconsequences. The defence-in-depth on a deterministic basis remains the fundamental principle, withthe view to ensure protection of the workers and of the public.
• In the safety demonstration, single initiating events have to be “excluded” or “resolved”.
That is to say that single initiating events can be only “excluded” if design and operationprovisions have been taken so that it can be demonstrated that it is possible to “practicallyeliminate” this type of accident situation. For example, sequences with large earlyreleases have to be “excluded”; low-pressure core-melt ejection has to be “resolved”; anda probabilistic approach is sufficient to “practically eliminate” an event.
• The objective is to “practically eliminate” an accident that could lead to large early
releases. The implications of this objective concerning the “out-of-vessel” consequencesare the following:
− Accident sequences involving containment bypass have to be “practically eliminated”
by design provisions and also by preventing failures. − The high-pressure reactor core meltdown situations must be “excluded” by
preventative measures. − Global hydrogen detonations and steam explosions inside and outside the vessel,
which may threaten the containment integrity, must be “practically eliminated”.
• The objective of a significant reduction in the release of radioactive substances implies asubstantial improvement in the containment function. In the framework of this SOAR, wewill focus on the following points:
− The advantages and the disadvantages of a spray system inside the containment must
be carefully examined; the advantages are linked to the fact that it allows lowering thepressure inside the containment building and the radioactive aerosols concentrationsinside the containment; the disadvantages are linked to the fact that it diminishes thequantity of steam that has an inerting effect with respect to hydrogen explosion risksinside the containment building;
− The residual heat must be removed from the containment building without a venting
device; for this function, a last-resort system, preferably passive, must be installedinside the containment building;

22
− The containment building must be designed so as to withstand a global deflagration ofthe amount of hydrogen that could be contained in this building in the course of coremeltdown accidents and a representative fast deflagration. Besides, provisions mustbe taken with respect to local detonations and to possibilities of DDTs that mightjeopardize the containment building and its internal structures. Limitation of theconcentrations of combustible gases by design of internal structures, use of catalyticdevices, and igniters have to be considered; inertization of the containment is analternate way;
− The penetration of the basemat of the containment building by a corium must be
avoided; the use of a core-catcher can be a solution.
2.4 Containment Thermalhydraulics Event Loads
2.4.1 Design-basis and Long-term Overpressurization
The different containment thermalhydraulic loads used for the design of the containment have beendescribed in Reference 2 (pages 38-40). We will repeat some of the principal features.
The containment structure of current reactors is generally designed to be capable of withstanding,without loss of function, the pressure and temperature conditions resulting from a basic designscenario. The containment structure is also intended to maintain its functional integrity in the longterm after an accident.
The containment design bases cover the following parameters:
• the temperature and pressure conditions in the containment that are due to a spectrum ofpostulated primary-system rupture and secondary-sides steam and feedwater line breaks;
• the maximum external overpressure to which the containment may be subject because of
the inadvertent operation of containment sprays or the air return fans for the ice condensercontainment;
• the effectiveness of passive and active heat removal mechanisms; • the pressure conditions within subcompartments that act on system component and
supports because of high-energy line breaks; and • for the ice condenser containment, the design provision and proposed surveillance
programs have to ensure that the ice condenser will remain operable for all plant operatingconditions.
To cover inaccuracies and uncertainties, conservative assumptions are used in the containment designanalysis and a margin between calculated peak pressure and design pressure is taken into account.
In case of a severe accident, the following thermalhydraulics loads must be taken into account:

23
• the pressurization caused by to the presence of radioactive materials inside thecontainment (decay heat), non-condensable gas generation, and metal-water reactions;
• the molten core-concrete interactions (MCCIs). Molten core material may erode the
concrete basemat while producing hydrogen and other non-condensable gases, therebythreatening containment integrity;
• the long-term effect after stabilization of the accident in particular in terms of long-term
temperature and humidity effects; and • the pressurization caused by continual release of steam.
In CSNI Report 166 [2]—which addresses the design basis for large full-pressure containments ofPWRs—the following conclusions and recommendations that refer to relevant basis andconfirmatory research projects, conducted during the preceding decade 1975-1985, have been drawn.
An experimental database has been generated focusing primarily on DBA-associated phenomena.Dynamically, the large-break loss-of-coolant accident (LBLOCA) causes the most challenging loadconditions to be taken into account within licensing procedures. Much effort has been devoted to thedevelopment of computer codes that can predict the characteristic load conditions. The codes alsohelp to understand the observed experimental results and, vice versa, analytical simulation models(ASMs) based on these codes have been validated by the generated experimental database.
Phenomena associated with the local compartment pressurization and with the global containmentpressurization process are sufficiently well understood to allow the safe design of the containmentonce the rules and guidelines issued by the licensing authorities are observed. Qualitativecomparisons of pre-test predictions with large-scale test data indicate that safety margins requiredwithin the regulatory guidelines are, in general, sufficient to warrant a reliable design of thecontainment system. Code validation work and, in particular, results of the ISP activities allow thisqualitative conclusion. No further research work seems to be necessary in the future for this area.
On the other hand, long-lasting processes, which may dominate the long-term behaviour of acontainment after termination of a blowdown process, are less well understood. Phenomena such asnatural convection, heat exchange with structures, and the formation of a temperature stratificationinside the containment are generally predicted with large uncertainty margins. This problem has notbeen too much of a concern for the design and licensing of plants, rather than for the assessment ofphenomena dominating the results of risk analyses. For this area, additional research work has beenconsidered necessary to improve the basis for predicting long-lasting containment internal processesand phenomena, in particular the hydrogen distribution.
Corresponding work performed since CSNI Report 166 has been summarized and will be addressedin the subsequent sections of this report.
2.4.2 Energetic Events
The potential contributors that could lead to early containment failure and consequently large earlyradionuclide releases are energetic events such as hydrogen combustion, steam explosion, directcontainment heating.

24
2.4.2.1 Hydrogen combustion
In case of a severe accident, generation and combustion of large quantities of hydrogen pose an earlychallenge to the containment building.
The in-vessel hydrogen generation depends on the different scenarios. The ex-vessel hydrogenproduction is the result of the reaction between ex-vessel metallic core debris and steam just aftermelt-through, later the result of an MCCI and, in the long term, the radiolysis of sump water.
Significant hydrogen concentration could be reached locally in a short time, leading to a flammablegas mixture, but because of the presence of high steam concentrations, hydrogen burn may beprevented. If the atmosphere is undergoing rapid condensation—e.g., by spray initiation—apotentially detonable mixture could form rapidly in case of a high concentration of hydrogen.
Hydrogen produced during a severe accident could burn close to the hydrogen source or could mixwith the containment atmosphere and burn if flammable concentrations are attained and ignitionsources are available (e.g., igniters, accidental sparks from electric equipment). If oxygen andignition sources are present in the vicinity of the release, the hydrogen will ignite, and it could burnas a standing flame at the release location, which is possible over a large range of jet exit diameters,jet velocities, and environmental conditions. The hydrogen that will not burn close to the source willmix with steam and air and will be transported in the containment building to increase global or localconcentrations and to create possibly flammable conditions. If ignited at high-enough hydrogenconcentration, the mixture could burn as a deflagration, creating a transient pressure and temperaturethat could possibly challenge the containment integrity and equipment. In regions of higherhydrogen concentration and under special geometric conditions, an accelerated flame or even a localdetonation may occur, which would produce higher dynamic loads than a deflagration would andwould pose a more serious threat to equipment and structures. Should either occur in spite of its lowprobability, a global detonation—occurring after prolonged and extensive accumulation of hydrogenin the containment atmosphere—would be a major threat to containment integrity.
The large uncertainties concerning production and distribution of hydrogen are taken in account inrisk studies. The residual risk is limited by procedure for active actions limiting the probability of anaccident or by implementation of post-accidental mitigative actions. The improvement in theknowledge of phenomena concerning the transition from deflagration to detonation and consequencesof combustion in inhomogeneous atmosphere has its counterpart in the development of structuralmechanic codes.
2.4.2.2 Direct containment heating
This term refers to a series of physico-chemical processes that accompany the ejection of molten coredebris from a reactor vessel under high pressure. If a large fraction of the ejected molten core debrisis dispersed into the containment as fine particles, a substantial portion of the stored heat can bequickly exchanged between the debris and the atmosphere. Heat can be eventually generated bychemical exchange between core debris and atmosphere and also combustion of previouslyaccumulated hydrogen. Consequently, the containment pressure rises. The importance of thisphenomenon principally depends on the reactor cavity geometry, the mass of dispersed materials, andthe initial pressure in the vessel.
The DCH has been the subject of a recent CSNI report [3], and it will not be discussed here.

25
2.4.2.3 Steam explosion
The possible reaction between molten fuel and water could lead to a high energetic steam explosion.This term refers to a phenomenon in which molten fuel slumping in a water pool rapidly fragmentsand transfers its energy almost instantaneously to the coolant, resulting in rapid steam generation,shock waves, and possible mechanical damage.
2.5 Accident Mitigation
Accident prevention and mitigation and accident management depend on the type of reactor and thesafety rules that are applied. Examples of country-specific approaches can be found in theImplementing of Severe Accident Management in Nuclear Power Plants [4].
Regarding techniques of hydrogen mitigation, the established principles are mainly based onhydrogen removal or dilution to non-flammable or to less-sensitive mixtures. Existing mitigationsystems include igniters, PARs, inertization, and containment filtered venting. They have theirspecific advantages and drawbacks.
2.5.1 Igniters
Igniters have been well established as a method of preventing damaging burns in NPPs by ensuringignition near the limits of flammability. Availability of power to the igniters is required for theirfunction. Igniters are at predetermined, fixed locations, and care must to be taken in selectingadequate locations, in a manner that is independent of the accident scenario. Special considerationmust be given to situations of hydrogen accumulation as a result of temporary steam-inertedconditions. However, in a detailed geometry of a specific reactor containment, compartmentoptimum placement may differ in different scenarios. Engineering judgement, combined with studyof the gas transport, mixing and stratification as well as studies of combustion behaviour, isnecessary to ensure that igniters are placed at the best locations and that spark igniters are placed soas to optimize spark frequency. To assist these studies, lumped-parameter as well as detailed fieldcodes are available. Igniter initiation could be done either automatically or through operator actionin the control room on the basis of available hydrogen measurements.
2.5.2 Passive Autocatalytic Recombiners
Passive autocatalytic recombiners are devices that recombine the hydrogen present in thecontainment without a need for external power or operator action. The practical installed capacitiesin a large containment building are on order of 100 kg/h made up by 20 to 60 PARs (depending onPAR unit size); these PARs accommodate a wide range of release scenarios but do not match themaximum possible hydrogen release rates produced in the worst cases. Passive autocatalyticrecombiners are already being implemented in some plants (e.g., in Belgium) as a means to improvesafety margins for hydrogen combustion in severe accident situations.
The installation of PARs is highly influenced by geometric and operational constraints. Access tomaintenance should remain free and PARs must be accessible for periodic surveillance. Therefore,engineering judgement is essential in defining the location of the PARs. For future plants, locationsof hydrogen mitigation systems may be optimized at the design stage. In the absence of engineeringjudgement, detailed code calculations would have to address a large number of hydrogen releaselocations and release rates, and would inevitably indicate PAR locations that are not feasible from anoperational standpoint. Nonetheless, calculations can provide quantitative assessment of the

26
effectiveness of the selected locations. On the other hand, calculations and experiments show thatthe exact location of a PAR in a compartment is not critical for its performance. The strongconvection created by a working PAR effectively mixes the atmosphere.
Passive autocatalytic recombiners are seen as a promising alternative to thermal recombiners forDBA hydrogen and are under active investigation to resolve particular questions in that application.
2.5.3 Post-accident Inert Gas Injection
Post-accident injection is a technique to avoid burning loads. Post-accident inertization, underreview for reactor application, is a concept that involves injection of an inert gas such as CO2 influidized or gaseous form into containment to inert the gas mixture. Another concept is post-accidentdilution by injecting an inert gas like CO2; it was further demonstrated through tests conducted in afull-scale mock-up of the injection equipment. The former concept prevents a burn, whereas thelatter limits the additional partial pressure build-up by only injecting enough inert gas to precludeturbulent flame acceleration. This latter concept would be used in combination with anothertechnique such as igniters or PARs, as discussed above. Although both concepts were shown to befeasible, no practical installation has been reported up to now. Engineering work is needed to dealwith interfacing problems (such as thermal shock, additional large penetration through thecontainment wall for liquid CO2 injection, effective gas distribution inside the containment (for bothconcepts), etc.). A disadvantage of these concepts could be the more complicated initiationprocedure in the absence of automatic initiation because the timing is critical. This places anadditional burden on operating staff to perform this accident management function, compared toigniters or PARs, which are supposed to require no operator action. An advantage of these conceptscould be the reported low costs for multiple-unit application.
2.6 Use of Computer Codes in Decision-making
Thermalhydraulic containment codes are involved in the decision-making process. The use ofcontainment thermalhydraulics codes allows the prediction of containment loading, associated withstructural mechanics codes, and the source term associated with aerosol or chemical codes. Thelicensing process includes the entire safety analysis issue, from the initiating event to theconsequences to the environment; recommendations are made regarding the feedback of informationcoming from the operating plants; the utilities have to provide all the information concerning theirstrategy in the course of a postulated accident. The DBA covers a large class of events, and after theThree Mile Island (TMI) accident, new guidelines and procedures were implemented after they wereagreed upon by the authorities.
When implementing new mitigative devices, codes are an adequate evaluation tool, to define theguidelines and the key system measurements for active safety systems. Severe accidents may arisefrom non-operability of safety systems that are dimensioned conservatively for DBAs. For severeaccidents having large hydrogen release, there is an important local aspect. Large uncertainties existin hydrogen release initiating events. The ignition may occur in any location where the localconcentration leads to combustion. Consequence from combustion on containment loading is clearlydependent on the initial hydrogen distribution. Codes are used in best-estimate calculations, avoidingconservatism, because combustion risk depends on local hydrogen distributions rather than on globalconcentration.
Codes are of primary importance when defining the timing of the accident and the containmentfailure mode. The authorities will agree when the procedures proposed by utilities prove that it is

27
always possible to drive the plant towards a controlled stable state. Uncertainties relative to theseprocedures are in some cases not dependent on thermalhydraulics and hydrogen distributioninformation.
2.7 Summary
The technical aspects of containment thermalhydraulics as it relates to design-basis and severeaccident loads as well as that of accident mitigation strategies are summarized in this chapter. Ineffect, the chapter lays the foundation for subsequent discussions in this report, in particular, those onphenomena ranking (Chapter 3), recent experiments (Chapter 4), code analysis (Chapter 5), anduncertainties (Chapter 6).
The containments of water-cooled reactors are designed to withstand an overpressurization after aDBA. Thermalhydraulic codes are used to calculate or predict containment loading from DBAevents such as a LOCA, steam-line breaks, etc., in the licensing process. Historically, the PIRT hasbeen used in DBA analysis to rank and prioritize important phenomena, scaled experiments havebeen conducted to investigate the phenomena and to develop analytical models, and the resultantthermalhydraulic codes have been used to investigate plant behaviour. Thermalhydraulic variablesdescribing the containment behaviour such as pressure, temperature, etc., are conservativelycalculated in the DBA analysis to allow for sufficient safety margins and for the results used todetermine parameters for safety systems.
The objective of severe accident analysis, essentially beyond DBAs, is to obtain best-estimatecalculations to evaluate the risk. After the TMI Unit 2 event, an increased emphasis was placed onunderstanding various severe accident issues including core degradation phenomena, melt relocationto reactor pressure vessel lower head, consequent lower head failure, and various ex-vesselphenomena (MCCI, DCH, steam explosions, hydrogen combustion, etc.). Experimental research wasinitiated for this purpose, and codes were developed to evaluate the associated risk. Because thesevere accident phenomena are more complex and are less understood than are the DBA phenomena,there are uncertainties associated with the severe accident codes. Nevertheless, these codes are usedby licensing authorities and licensees for plant thermalhydraulic calculations under severe accidentconditions.
The codes are also used, in some instances, as a confirmatory tool to support engineering judgementfor determining the efficacy of accident management strategies or for designing accident preventionand mitigation measures. These measures, in the context of the hydrogen combustion issue, includepre-inerting (for most small-volume containments such as BWR Mark I and Mark II, Siemens 69),deliberate ignition (ice condensers, many PHWRs, and some BWR Mark III units), recombination(e.g., use of PARs), or simply, efficient hydrogen dilution in a large dry containment with highultimate strength capability. The reliability and effectiveness of these mitigation measures maydemand, in some cases, a more accurate assessment of location and source rate of produced hydrogenas well as a reliable prediction of gas–steam–air distribution. A reduction of uncertainties in codepredictions is required to achieve this goal.
28
2.8 References
1. Pressure Suppression Systems, A State of the Art Report, CSNI Report No. 126,October, 1986.
2. Containments for Pressurized Water Reactors, A State of the Art Report, CSNI ReportNo. 166, December, 1989.
3. High-Pressure Melt Ejection (HPME) and Direct Containment Heating (DCH), CSNIReport NEA/CSNI/R(96)25, December, 1995.
4. Implementing Severe Accident Management in Nuclear Power Plants, CSNI SeniorGroup of Experts - SESAM Discussion Report, November, 1996.

29
3. PHENOMENA
3.1 Introduction
An assessment of gas distribution and containment loads, especially in response to mitigativeprocedures, is an important part of every country’s nuclear safety program. These programs relyheavily on analytical and experimental methods to investigate a spectrum of possible accidentprogressions and containment behaviour. It is paramount to these programs that limited resources befocused on efforts to accurately model the most important phenomena associated with events thatmay lead to containment failure. With an emphasis on containment, the accident types considered arethose low-probability accidents that progress to a core-damage state, with both fuel and reactorcoolant system boundaries compromised. These types of accidents are generally referred to as severeor beyond DBAs. In such accidents, the integrity of the containment building, regardless of damage,is the criterion for a successful design; in contrast, for the DBA, success is measured in terms of anundamaged core and a containment capable of being reused. Containment loads for a severe accidentcan be several times greater than those occurring during a DBA, and the threats posed to thecontainment may involve energetic events that take place ex-vessel—examples are hydrogendeflagrations or detonations or both. A review of containment thermalhydraulics for DBAs has beendiscussed in previous OECD reports [1,2].
This chapter reviews phenomena important to the assessment of containment loads during the mostcritical time expected for the potential releases of airborne radioactivity from the containment to theenvironment. The discussion is abbreviated yet focused on those phenomena that need to beunderstood (experiments) and on predictions (codes) in order to assess the severity of extremecontainment loadings. Although the general discussion is applicable to all types of containments(PWR, BWR, PHWR, or the more recent advanced light-water reactor, ALWR), emphasis is placedon the most common type, the large dry PWR containment.
Severe accident experiments are impractical to test in full-scale containments. Therefore, computercodes must be used to evaluate loads and containment function. To ensure the validity of thesecodes, regulatory agencies have adopted an evaluation methodology to demonstrate code scalability,accuracy, and uncertainty [3]. One feature in this evaluation method is the concept of a PIRT(phenomena identification and ranking table). PIRT or PIRT-like processes have been demonstratedby many countries as essential for defining key activities in their safety programs [4-8]. The PIRTfunctions both as a resource management tool and as a formal procedural method that prioritizesengineering tasks. All PIRTs have a common basis, which is to address plant behaviour in thecontext of identifying the relative importance of systems, components, processes, and phenomenadriving the plant performance. We have adopted the PIRT-like formalism here as an organizationaltool to help us present the state of knowledge for the more important containment phenomenaaffecting thermalhydraulics and gas distribution. This chapter presents a general containmentphenomena identification table that applies for most plant types. The PIRT discussed, however, isillustrative with the ranking of phenomena limited to one of the more common types ofcontainments, the PWR large dry containment. Many of the table results are transferable to otherplant types, though with limited modifications.
The conceptual use of the PIRT, adapted from Wilson [9], is shown in Figure 3.1-1. Althoughcontainment performance is the basis for the PIRT development, there are three adjunct functions thatreflect how the research programs develop. These developments are further described and are

30
PRIMARY ADJUNCT FUNCTION USE
Figure 3.1-1 Conceptual use of PIRT [9]. PIRTs have one primary and three adjunct functionsdepending on context of use
reviewed in the chapters that follow in this report. The adjunct objectives are to provide guidance inestablishing the requirements in the following programs:
1. separate- and integral-effects testing (SETs, IETs) in experimental programs where theobjective is to help ensure that the experimental data fully reflect what may be expected inthe containment;
2. code development and improvement where the objective is to help ensure that the code iscapable of modelling the containment behaviour; and
3. code uncertainty quantification where the objective is to help ensure that the variouscontributors to uncertainty are identified and treated in a manner appropriate to theirimportance to containment behaviour and, thus, to the overall uncertainty.
ContainmentPerformance
Indicator
SET and IETExperimental
Guidance
CodeDevelopment
Guidance
CodeUncertainty
Guidance

31
Chapter 4, on recent experimental activities, summarizes the first objective. The experimentsdescribed in this chapter were conducted to provide a database for code assessment, mainly forphenomena identified as having the highest importance. Likewise, the code development andapplication activities discussed in Chapter 5 are focused to show that high-importance phenomena areaccurately modelled. Finally, critical uncertainties derived from experimental and analyticalexperiences are considered in Chapter 6.
In the next two sections of this chapter, the phenomena identification table for a containment ispresented in detail and is then extended to include ranking. The ranking criteria are derived from thebasic regulatory requirements discussed in Chapter 2. The process of ranking is determined by expertjudgement and engineering experience. Most of the experience has been obtained in observation ofexperiments, in studies performed to analyse experiments, and in projects involving plant-specificsevere accident analyses. These analyses have included baseline and sensitivity calculations. Mostof the analytical studies involving experiments and plants have been completed using the codesdescribed in Chapter 5.
3.2 Containment Phenomena Identification
To establish a strong linkage between an experimental program, code validation, and containmentaccident analyses, it is important that we identify and assign importance to various phenomenaoccurring within the containment. Phenomena is defined to include all potentially dominantprocesses, events, and characteristics involving containment components (atmosphere, structures, andpools). Once the identification process has been accomplished, criteria are established based on setsof regulatory requirements (Chapter 2) and are used to rank the importance of each phenomenon.The ranking helps researchers focus their experimental and code validation programs in what hasbeen called an efficient and sufficient manner [9].
The purpose of this section is to first identify and describe various containment phenomena takingplace during a severe accident. In the next section, a ranking of the phenomena is provided for anaccident scenario that poses a potentially high threat to containment integrity. The ranking table isdeveloped as an illustrative example, where it is also assumed that the accident will be initiated by aLOCA in a PWR containment. Other plant types (BWR, PHWR, and ALWR) with differentinitiating events (anticipated transient without scram or station blackout) will include phenomena thatwill vary only slightly from those listed. Tables that describe thermalhydraulic and hydrogendistribution processes will be somewhat dependent on reactor and containment type; however, the listof processes and phenomena in these cases will also have more similarities to the list given here thandifferences.
Phenomena identified in this report do include phenomena associated with some hydrogen mitigationtechniques, such as recombination and gas dilution schemes; but, phenomena occurring as the resultof the operation of hydrogen igniters are not included. As an example, the recombination processthat by a chemical reaction produces a local heat source may also induce buoyant plumes andregional circulation currents; these resulting phenomena are already described under the atmosphericmixing and transport process category. Combustion events (diffusion flames, deflagrations,detonations) are not considered, although it is recognized that such events may affect the behaviourof gas distributions within the containment. The effect of combustion on gas distribution involves acomplicated combination of the phenomena identified here and some additional ones. Suchprocesses, as combustion-driven redistribution of gases, are considered to be outside the scope of thisreport.

32
The identification process proceeds without reference to codes or modelling capability, drawing on aphysical interpretation of processes that are judged to occur in current and ALWRs during postulatedreactor accidents.
To provide some structure to the discussion of key phenomena and to eliminate redundant entries inthe identification table, phenomena are grouped by containment component and process—these arethe first two columns in the “generic” phenomena identification table presented as Table 3.2-1. Thedefinition of these components and the description of the processes and phenomena are discussed inthe subsections that follow. Detailed descriptions of phenomena are given in Appendix A.
3.2.1 Components
A component is a generalized type of geometry and composition that encompasses a broad groupingof phenomena. A component is distinguished by a volume with a general type of physicalcomposition and its boundaries (surfaces) across which the exchange of mass and energy occursbetween volumes. The general composition classes within the containment are gases, liquids, andsolids. Energy and mass exchanges may take place within a volume (as a source or sink or asexchanges between the constituents within a volume), at the surfaces between volumes, or betweenthe depth of a volume and a surface or the depth of another volume (emitting or absorbing thermaland gamma radiation).
There are three key components in a PWR dry containment: atmosphere, structure, and pool. Allcontainment codes have models to represent these basic components, and most of the experimentaland validation efforts described in this report investigate phenomena associated with thesecomponents. Usually, describing an atmosphere refers to a region inside the containment building;however, it can also refer to the normal earth atmosphere external to the containment. Theconstituents of an atmosphere are predominantly gases, although two-phase mixtures, liquid droplets,and solid particles may be present during a transient. The constituents of a pool are predominantlyliquids, although two-phase mixtures, gas bubbles and solid particles may be present during atransient. In certain cases one component may transform into another component; for example, waterruns onto a structure (dry floor) forming a pool, or a pool is drained away leaving a structure.
The three key components are defined as follows:
• Atmosphere. The open volume or free flow volume for gases. It excludes an existingpool of water or a pool of water that may form during an accident.
• Structure. A solid material that communicates with the containment atmosphere or poolthrough a surface. It may be an exterior wall or floor that forms the containment systemboundary, an interior wall that divides the containment into subcompartments orotherwise forms a barrier to the flow of gases, and another solid barrier that consumesinterior space, such as a pipe or other fixture.
• Pool. A volume of water that lies on a floor
Communication between components is through their surfaces. A surface is an interface between thecontainment atmosphere and a structure, between the containment atmosphere and a pool or betweena pool and a structure. A surface includes the boundary layers of air and of water that condenses on asolid surface, through which heat and mass transfer occur.

33
Table 3.2-1 Phenomena for containment thermalhydraulic and hydrogen distributionsduring design-basis and severe accidents.
Component Process PhenomenaAtmosphere:
pressurization/ multicomponent gas compression/expansiondepressurization aerosol mass and energy exchange
spray mass and energy exchangevolume displacement/pool filling or drainingatmosphere cooling by fan-cooler
mixing jet-plume gas interaction/entrainment (localized)(intracompartment) buoyancy/stratification (regional)
buoyancy/wall interaction (regional)diffusion (turbulent)spray dynamicsfan dynamics
transport(intercompartment)
buoyancy
form and friction lossesaerosol couplingliquid water carryover
Structure:interior heat transfer one-dimensional transient conduction
two- or three-dimensional transient conductionmass transfer outgassing (concrete)
surface (solid andfilm)
sensible heat transfer spray/aerosol deposition or impingement
free convectionforced/mixed convectionradiation (structure to atmosphere)radiation (structure to structure)liquid film resistanceliquid film advection
latent heat and mass transfer(condensation/evaporation)
free convection
forced/mixed convectiontransport (film flow) liquid film advection
interfacial shear (film/gas interaction)Pool:
mixing buoyancy/stratificationbubble dynamics
transport filling and drainingdisplacement (pressure driven)
Pool:interior heat transfer convection (flooded structures)
boiling (flooded corium layers)steam condensation (bubbles)
surface sensible heat transfer free convectionforced/mixed convectionspray/aerosol deposition
latent heat and mass transfer(condensation/evaporation)
free convection
forced/mixed convection
34
Note that the reactor primary coolant system (PCS) is not a component in a containment but that itforms a boundary condition for the containment. A break in the PCS during a LOCA is the majorsource of water and hydrogen flowing into the containment during an accident.
All containment codes have models to represent these basic components, and most of theexperimental and validation efforts described in this report investigate phenomena associated withthese components. When all the components are designed into an experimental program, the testingprogram is considered to be integral. Tests limited to one component (or phenomenon within acomponent) are generally referred to as SETs. In the phenomena identification listing shown inTable 3.2-1, the components are listed in the first column.
3.2.2 Processes
Phenomena can be further classified by the main processes occurring within the containment. In thesecond column of Table 3.2-1, five categories of processes are defined:
1. pressurization/depressurization 2. mixing 3. transport 4. heat transfer 5. mass transfer
Pressurization is the process where the atmosphere pressure changes by means other than as a resultof energy or mass exchange with structures or pools. In this process the atmospheric boundaries areconsidered adiabatic. Rapid blowdowns into the containment are an example of a pressurizationprocess. Depressurization can occur during the expansion of gases when the containment boundary isbreached. Such a condition may be the result of a planned action, in the case of containment ventingschemes or the result of structure failure. Additionally, depressurization can also take place as aresult of some exchange taking place within the atmosphere, as in the case of energy and massexchange with containment sprays.
Mixing is a process where separate fluids with distinguishable characteristics tend to come togetherto form a fluid with a single characteristic. Mixing is an intracompartment process, whereas transportis an inter-compartment process. Mixing includes all phenomena that affect the mixing processoccurring within a single open compartment or room. The characteristics can be temperature orconstituent concentration. For instance, when hydrogen is injected into a mixture of air and steam,the incoming gas stream mixes with the surrounding atmosphere. If the mixing process proceeds tocompletion, a uniform composition of hydrogen, air, and steam will be created. However, in manycases the mixing process is incomplete for a substantial time period and during this time period theatmosphere is considered to be in an unmixed state. If mixing does not proceed to completion, butflow stagnates, then a stratified condition will be created.
Transport is a process where fluids or aerosols move from one defined region to another. Transportusually refers to movement between compartments, such as convection loops that develop between aseries of coupled compartments or the flow of liquids between various compartments. Transport mayoccur between components within a compartment, such as between pools, or from structures to pools.

35
And, transport may also occur for a single component, as in the case of the flow of liquids alongwalls.
The most commonly investigated processes within containments are those involving heat and masstransfer. These exchange processes take place both within and at the boundaries of components. Fora solid component, the interior process is conduction. For a fluid component, the interior processesusually are convection but can include conduction and diffusion under certain circumstances.Aerosols and sprays can exchange energy and mass with the atmosphere through evaporation orcondensation or through sensible heat transfer; however, because aerosols and sprays are consideredpart of the atmosphere, these exchanges are grouped under the pressurization–depressurizationprocess. Condensation and evaporation also are important processes at the interface between theatmosphere and the other components: structure and pool. Condensation and evaporation areclassified as a combination of mass and latent energy transfer processes. The exchange of energywithout an accompanying exchange of mass is classified as a sensible energy transfer process.
3.2.3 Phenomena
In many physical processes, a number of phenomena can be involved. Therefore, dissection of aprocess, like mixing, will indicate an overlapping of various phenomena where boundaries aredifficult to distinguish; however, each process can usually be identified, and in most situationsobservations of the process can reveal one or two phenomenon that dominate. As previously noted,the phenomenon definition is a broad one that includes characteristics and events as well asphenomenological processes. Also, it should be realized that the chosen level of detail used inidentifying phenomena associated with a process will often be a judgement based on our currentability to differentiate phenomena with the instrumentation commonly found in both integral- andseparate-effects testing, in fundamental experiments, and according to the details of the modelling.(Tests limited to specific, local phenomena are called fundamental experiments.)
Phenomena can be characterized by reference to safety equipment or a device if the phenomena arespecific to that equipment and not otherwise described in a process group. For example, fan coolingand dynamics, spray mass and energy exchange, and spray dynamics are phenomena specificallyassociated with safety equipment and are not considered in other basic phenomena descriptions.
In the last column of Table 3.2-1 are listed the phenomena that affect containment thermalhydraulicsand hydrogen gas distributions, grouped according to containment component and process. Adescription of each phenomenon is given in Appendix A. Phenomena are ranked in the section thatfollows according to their relative importance in affecting containment loads (pressure andtemperature), and gas-mixture compositions.
3.3 Containment Phenomena Ranking
The phenomenon identification described in Section 3.2 has been completed for all phases of apotential accident, applying mainly to PWR or PHWR large dry containments; through the inclusionof a generic pool component, the list of phenomena extends to include BWR containments. Throughthe ranking process, the complete list of phenomena is reduced depending on the specifics of theplant type, scenario, and phase of the accident. Because the experiments and code applicationsdiscussed in this report are directed primarily towards a PWR-like plant, the ranking process will alsoassume that the containment type is a PWR. To develop a ranking that is not too specific to anaccident scenario, a more general approach is used to establish and identify the critical accidentphase.

36
3.3.1 Accident Scenario and Phase Definition
It is realized that most accident scenarios (LBLOCAs, small-break LOCAs (SBLOCAs) and stationblackouts) are characterized, from the standpoint of the containment, as LOCA-type accidents, wherethe release of a portion of the primary and ECCS coolant initially pressurizes (conditions) thecontainment prior to the release of hydrogen. A “generic” containment scenario for a severe accidentmay be described using a threat matrix that identifies levels of potential threats to containmentintegrity. An example threat matrix is shown in Table 3.3-1.
The classification of threats is defined in terms of whether possible containment failure is eitherearly, delayed, or late depending on the time that containment failure pressure is exceeded. The timereference is based on the most critical time for potential release of airborne radioactivity from a failedcontainment; that time is when, during the accident progression, the reactor vessel is breached andlarge quantities of radioactive material are lofted into the containment atmosphere. In variousassessments to public risk [10,11] and other plant PSAs [12], containment failure modes described asearly, delayed, and late are used. These studies have shown that the greatest public risk occurs forthe early failure mode (set off by double lines in Table 3.3-1). As a result, careful assessment ofcontainment loading is required during this accident period, and therefore this period has received themost inspection by analysts using containment codes. The early failure mode is composed of anumber of separate accident phases (reactor coolant system (RCS) depressurization, restricted core-cooling, core damage, and vessel breach). Shown in Table 3.3-1 are the threat levels associated witheach accident phase (L-low, M-moderate, H-high).
Low-level threats include those containment conditions where the maximum pressures aresignificantly (factor of 2 to 3) below the failure pressure of the containment, in the range of thecontainment design pressure; medium threats occur when the containment pressure is above thedesign pressure such that some permanent damage to the containment can be expected, even thoughpressures are still much less than the containment failure pressure; and, high threats are those wherethe containment failure pressure is nearly approached (approximately within 5% to 10% of failurepressure) or is exceeded. The sources of these threats are listed in the table. Accident managementor mitigation procedures and equipment are presented under the heading “threat management.” Eachcountry has developed an accident management program; summaries of these programs can be foundin the OECD report on Implementing Severe Accident Management in Nuclear Power Plants [13].
During the early failure mode, there are two accident phases that have events considered to be a high-level threat to containment integrity: the core damage phase includes events associated withhydrogen deflagrations or detonations; and, the vessel breach phase for a pressurized system includesthe threat resulting from a DCH event. In the case of the latter, the OECD has recently reported onthe state-of-the-art for DCH events[14]; therefore, the vessel breach phase of early failure will not becovered here. During the core-damage phase, the core is uncovered and hydrogen is generated by aclad–steam reaction. Because the primary coolant system boundary has failed (LOCA-type event),hydrogen (with steam) is released into the containment. This report primarily addresses this phase ofan accident, as indicated by the shaded region in Table 3.3-1. Although the report does notemphasize phenomena occurring in those accident phases prior to core damage (RCSdepressurization and restricted core-cooling), it is understood that processes in those earlier phasesmust be taken into account in order to establish boundary conditions for subsequent phases; in fact, amistaken understanding of early phenomena can lead to threat levels being poorly calculated.
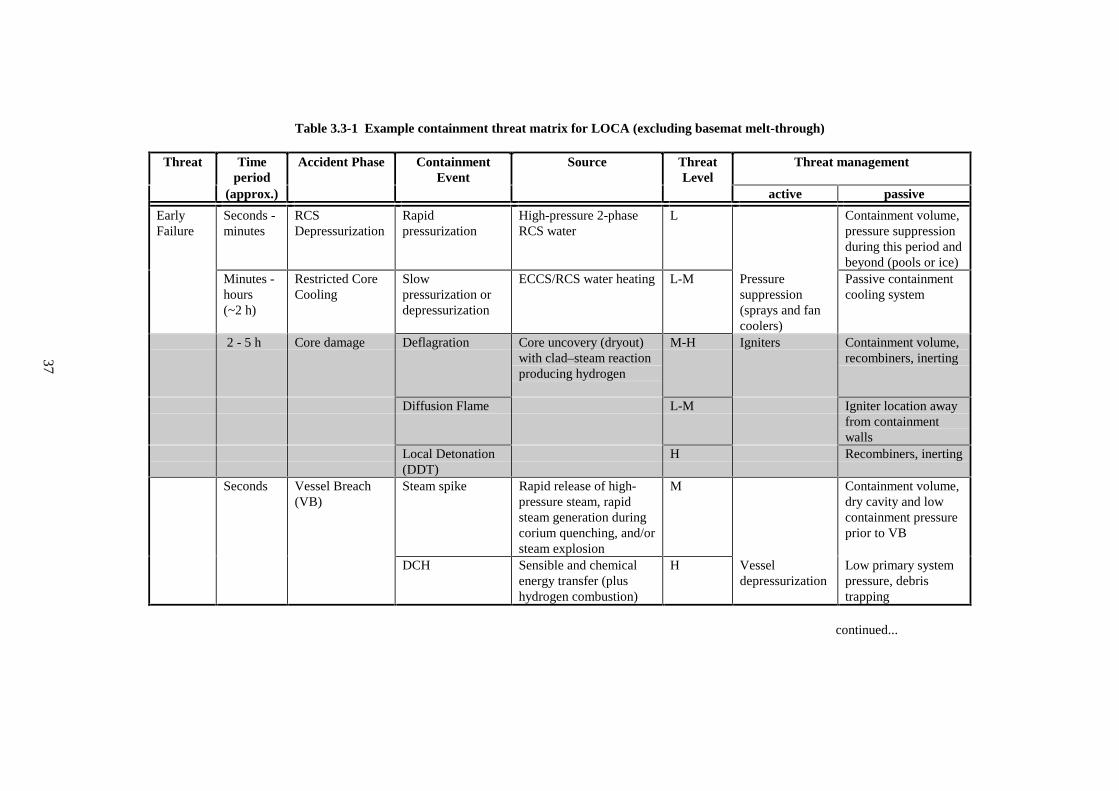
Table 3.3-1 Example containment threat matrix for LOCA (excluding basemat melt-through)
Threat Timeperiod
Accident Phase ContainmentEvent
Source ThreatLevel
Threat management
(approx.) active passive
EarlyFailure
Seconds -minutes
RCSDepressurization
Rapidpressurization
High-pressure 2-phaseRCS water
L Containment volume,pressure suppressionduring this period andbeyond (pools or ice)
Minutes -hours(~2 h)
Restricted CoreCooling
Slowpressurization ordepressurization
ECCS/RCS water heating L-M Pressuresuppression(sprays and fancoolers)
Passive containmentcooling system
2 - 5 h Core damage Deflagration Core uncovery (dryout)with clad–steam reactionproducing hydrogen
M-H Igniters Containment volume,recombiners, inerting
Diffusion Flame L-M Igniter location awayfrom containmentwalls
Local Detonation(DDT)
H Recombiners, inerting
Seconds Vessel Breach(VB)
Steam spike Rapid release of high-pressure steam, rapidsteam generation duringcorium quenching, and/orsteam explosion
M Containment volume,dry cavity and lowcontainment pressureprior to VB
DCH Sensible and chemicalenergy transfer (plushydrogen combustion)
H Vesseldepressurization
Low primary systempressure, debristrapping
continued...
37

Table 3.3-1 (concluded)
Threat Timeperiod
AccidentPhase
Event Source ThreatLevel
Threat management
(Approx.) active passiveDelayedFailure
5 - 10 h Core-ConcreteInteraction(CCI) withoxidation ofmetals
Deflagration additional oxidation ofmetals in thecorium/concreteinteraction creatinghydrogen
M-H Igniters Containment volume,recombiners, inerting
Local Detonation(DDT)
H Recombiners, inerting
LateFailure
10 h todays
Decayheating
Gradualpressurization
Boil-off of sump fromcorium cooling and sumpevaporation
H Sump cooling,fan coolers,sprays, andventing
Passive containmentcooling systems
Outgassing of bound andevaporable water fromconcrete walls at hightemperature
M-H
Noncondensable gasgeneration from Core-Concrete Interaction
L
38

39
3.3.2 Ranking Criteria
The PIRT process requires a primary evaluation criterion that will be used to judge the relativeimportance of phenomena and processes for the containment behaviour of interest. In the accidentphase considered here, the containment behaviour that is of interest involves an assessment ofatmospheric conditions prior to hydrogen combustion. Combustion studies have shown that the peakpressures during hydrogen deflagration and large-scale detonations are dependent on the atmosphericconditions in the containment just prior to the event [15,16]. These conditions include pressure,temperature, and the steam-air-hydrogen concentrations. Pressure is a global parameter, whereastemperature and gas-species concentrations are regional or local indicators of containment conditions.A criteria for ranking phenomena and processes, therefore, extends beyond the hydrogen limitsspecified in regulatory guidelines, noted in Chapter 2, to a broader set of criteria that includespressure, temperature and gas-mixture composition as the important initial conditions for combustion.The experimental database, described in Chapter 4, reveals that these are the prime quantitiesmeasured in many integral tests. Therefore, we evaluate local phenomena and processes according totheir importance in affecting these global, regional or local conditions within the containment.
3.3.3 Ranking Components and Phenomena Importance
Ranking is based on subjective decisions regarding the importance of phenomena and processes inrelation to the criteria set. The ranking is dependent on expert opinion and engineering judgement.The process is aided by review of the experimental database and various analytical efforts involvingplant and test facility analyses that include reference and sensitivity calculations. In establishing aranking scale, it is common practice to evaluate the criterion using a scale of low, medium or high.The low, medium, and high ranks have definitions that correspond to the intended uses [9]. For thethree PIRT objectives that are of concern here, these definitions are as follows:
1. Experimental Guidance:
• Low = Phenomenon should be exhibited, but accurate measurement and prototypicalityare of low importance.
• Medium = Phenomenon should be exhibited; measurements may be derived;
prototypicality may be somewhat compromised. • High = Phenomenon should be explicitly exhibited and well measured; phenomenon
should be prototypical. 2. Code Development:
• Low = Phenomena have a small effect on the primary parameter of interest. Phenomenashould be represented in the code, but almost any model will be sufficient.
• Medium = Phenomena have a moderate influence on the primary parameter of interest.
Phenomena should be well modelled; accuracy may be somewhat compromised. • High = Phenomena have a dominant effect on the primary parameter of interest.
Phenomena should be explicitly and accurately modelled.

40
3. Code Uncertainty:
• Low = Combined uncertainty of phenomena may be determined in a bounding fashion ormay be eliminated, when justified.
• Medium = Phenomena should be evaluated to determine if uncertainty should be treated
individually as are high ranks or in a combined manner as are low ranks. • High = Phenomena uncertainty should be individually determined and then combined
statistically with other uncertainty sources.
3.3.4 Phenomenon Identification and Ranking Table
Shown in Table 3.3.4-1 is an illustrative PIRT for a PWR large dry containment during the core-damage phase of a severe accident. (An exception to the category of PWRs considered in Table3.3.4-1 is the German PWR design that includes an annulus gap region surrounding the containmentshell.) Because the key parameters selected for the ranking process depend to some extent on priorphases of the accident, some consideration of conditioning prior to the core-damage phase is requiredand is, therefore, implicitly included in the ranking shown in Table 3.3.4-1. A more extensive PIRTanalysis would include all accident phases.
Note that localized mixing phenomena occurring in or near a jet or plume resulting from an injectionare ranked low. This choice is a reflection of the lack of either experimental or analyticalconfirmation that within the jet/plume boundaries’ combustion ignition conditions occur. The highconcentration of steam present in the injection source, along with the large uncertainties associatedwith injection type (orientation and break size) and surrounding geometry, makes any rankingjudgement difficult to rationalize. More research in the area of local mixing processes, however, mayprovide the information that will alter this ranking; this ranking is indicated by the conditional (H)ranking given this phenomenon.
Some additional points are to be made with regard to the outcome and rationale behind the rankingfor regional mixing processes. The low ranking of phenomena influencing containment pressurereflects past experiences (analytical studies) showing that local and regional mixing processes are ofminimal importance for global energy balancing during a core-damage phase, a phase typicallycharacterized as a period of low steam injection rates. Mixing processes, resulting frombuoyancy/stratification (regional) phenomena, however, may give rise to regional stratifications thatcan be highly important in determining temperature and concentration gradients that affect conditionsimportant to hydrogen combustion.
The variations in phenomena ranking for global (pressure), regional, and local parameters aredependent partly on the relative importance that a parameter represents as an initial condition forhydrogen combustion. The pressure parameter, for instance, is included because it represents a basevalue that the pressure increment resulting from a potential combustion event is added to determinethe peak pressure. Generally, local and regional gas-mixing patterns do not significantly affect thesepressures because the areas of nonuniform mixing that influence atmospheric energy transfers, andtherefore pressure, are confined to small portions of the containment. During the core-damage phaseof the accident, where the containment injection sources are relatively small and prolonged, pressurevariations within the containment are insignificant. In contrast, mixing processes can causetemperature and gas compositions to vary considerably within regions of the containment andespecially between regions above and below source injections. The initiation and severity of
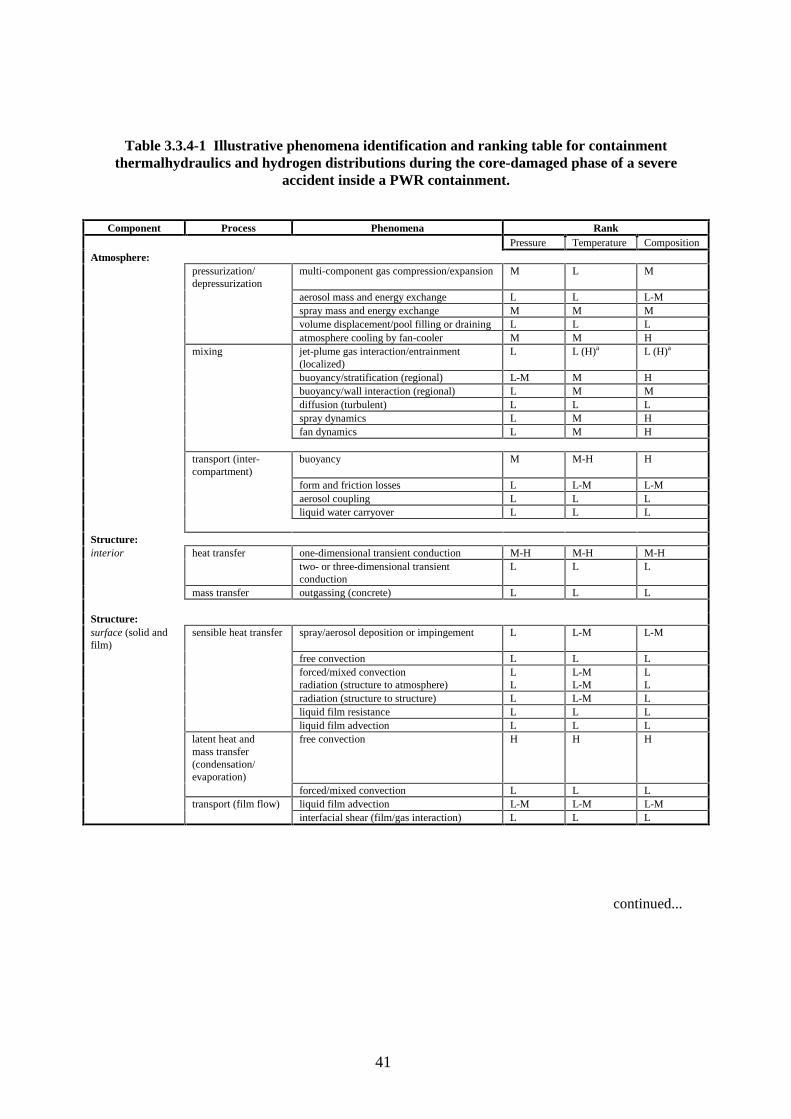
41
Table 3.3.4-1 Illustrative phenomena identification and ranking table for containmentthermalhydraulics and hydrogen distributions during the core-damaged phase of a severe
accident inside a PWR containment.
Component Process Phenomena RankPressure Temperature Composition
Atmosphere:pressurization/depressurization
multi-component gas compression/expansion M L M
aerosol mass and energy exchange L L L-Mspray mass and energy exchange M M Mvolume displacement/pool filling or draining L L Latmosphere cooling by fan-cooler M M H
mixing jet-plume gas interaction/entrainment(localized)
L L (H)a L (H)a
buoyancy/stratification (regional) L-M M Hbuoyancy/wall interaction (regional) L M Mdiffusion (turbulent) L L Lspray dynamics L M Hfan dynamics L M H
transport (inter-compartment)
buoyancy M M-H H
form and friction losses L L-M L-Maerosol coupling L L Lliquid water carryover L L L
Structure:interior heat transfer one-dimensional transient conduction M-H M-H M-H
two- or three-dimensional transientconduction
L L L
mass transfer outgassing (concrete) L L L
Structure:surface (solid andfilm)
sensible heat transfer spray/aerosol deposition or impingement L L-M L-M
free convection L L Lforced/mixed convection L L-M Lradiation (structure to atmosphere) L L-M Lradiation (structure to structure) L L-M Lliquid film resistance L L Lliquid film advection L L L
latent heat andmass transfer(condensation/evaporation)
free convection H H H
forced/mixed convection L L Ltransport (film flow) liquid film advection L-M L-M L-M
interfacial shear (film/gas interaction) L L L
continued...

42
Table 3.3.4-1 (concluded)
Component Process Phenomena RankPressure Temperature Composition
Pool:mixing buoyancy/stratification L L-M L
bubble dynamics L L Ltransport filling and draining L L-M L-M
displacement (pressure driven) L L L
interior heat transfer convection (flooded structures) L L-M Lboiling L L Lsteam condensation (bubbles) b b b
Pool:surface sensible heat transfer free convection L L L
forced/mixed convection L L Laerosol/spray deposition L L L
latent heat and masstransfer
free convection L L-M L-M
forced/mixed convection L L L
a The high ranking of this phenomenon is conditional, depending on the characterization of the injection, containmentconditions, and whether the phenomenon (thermal plume) is being generated by recombination. If the injection compositionis such that concentrations within the plume approach detonation conditions (or conditions favourable for DDT), then theranking should be high. Generally, the jet/plume represents a very small fraction of the containment volume and high steamand/or low air concentrations within the injection source preclude local combustion. Thermal plumes and buoyancy-drivenflows resulting from recombination may receive a high ranking, depending on the size of the room where the recombiner islocated and on the location of the recombiner in the room.
b Not applicable for this accident phase or reactor type (may apply for BWR type)
combustion events can be somewhat sensitive to temperature variations and very sensitive tocompositional variations. For these reasons, buoyancy/stratification phenomena affecting regionaltemperatures, and even more so compositions, are considered to have a medium and high importance,respectively.
In a somewhat similar outcome, transport processes are considered to have only a medium effect oncontainment pressure during this accident phase but a higher effect on temperature, and gasconcentrations. The upgrading to medium for pressure, for transport processes, is the result of arealization that inter-compartment mixing extends over a larger volume of the containment than doregional mixing processes. As the entire containment volume begins to mix, pressure varies asatmospheric energy is transferred to cold structures now being continually exposed to high steamconcentrations. As discussed in Chapters 4 and 5, there are numerous experimental and analyticalstudies of mixing phenomena associated with multiple compartment containments having nearprototypical configurations (relative compartment volumes, connections, and heat sink mock-ups).These studies have been undertaken to increase our understanding of convection patterns that occurduring severe accident conditions and to improve our predictive capabilities for transport processes.
For the active mitigation processes such as sprays and fan coolers, there can be a significant influenceon both global, regional, and local conditions within the containment. These processes, if presentduring the core-damage phase of the accident, may dominate as the most important phenomena andprocesses affecting conditions for hydrogen combustion. In many severe accident analyses, ACpower is unavailable, and as a result sprays and fan coolers are not functioning. In some cases ACpower may be restored. Bringing these safety features back into operation may initiate a combustion
43
event by the process of de-inertization. The inclusion of engineering safety features in the PIRThighlights their importance for consideration in severe accidents, especially when AC power may berestored at an inopportune moment.
Under the category of surface heat transfer processes, those phenomena responsible for sensible heattransfer are considered to have a low ranking because the amount of energy transfer associated withthis exchange is generally insignificant compared with the latent energy transfers from condensationand evaporation. A number of features are associated with the latent heat and mass transfer process:gas-phase resistance; condensate film resistance; and, film advection. The PIRT shows that theenergy transfers associated with presence of the film are insignificant and that the governingphenomenon for condensation (or evaporation) is gas-phase resistance, which is dependent on theconvection regime. Further, during the core-damage phase, forced circulation patterns within thecontainment are minor with respect to free convection flows that determine gas-species boundarylayers near most heat-conducting structures. Free convection flow processes are, therefore, mostimportant for latent heat transfers. The large energy exchanges associated with these transfersobviously have a major effect on energy balances (pressure) and on other key parameters such astemperature and concentrations. Gas compositions are affected by these potentially large transferssince the steam concentration in the containment atmosphere is directly affected by such processes.Especially near cold walls, condensation on surfaces can de-inert regions, producing local regions ofhigh hydrogen concentrations and driving local convections. This potentially critical condition isreflected in a high ranking given to the mass transfer processes and a medium ranking for two-phasethermodynamics associated with the pressurization process that determines the state ofmulticomponent gas mixtures.
3.3.5 Implications of Rankings
The main implication for these rankings are that experiments require explicit instrumentation tomeasure regional temperatures and compositions and that attention to prototypical conditions for thecore-damage phase should be maintained in order to investigate regional and inter-compartmentmixing patterns. Beyond the obvious prototypical geometrical requirements are the requirements toprecondition the containment (pressure, water vapour concentration, structure temperature) prior tothe hydrogen–steam injection and provide injection rates that are properly scaled. Because inter-compartment mixing by buoyancy can be of high importance, compartment temperature and velocitymeasurements at major flow path junctions should be measured. Since mass transfer by condensationis the most important mass and energy transfer process, wall surface instrumentation should be usedto determine heat flux, condensate amount, and atmospheric temperature near the surface. Velocitymeasurements near the surface should be included, if possible, to confirm that the convection regimeis free convection.
Code development programs need to focus on models that can predict regional stratification, mixing,and inter-compartment transport that are due to buoyancy-driven forces. Models for free convectionmass transfer should be developed using methods that ensure a high degree of accuracy. Thesemethods may be verified by SETs. Models developed through these efforts must be suitable for beingscaled up to full-scale containments.
The most likely areas for critical uncertainty analysis are the modelling methods for predictingregional stratification, mixing, and inter-compartment gas transport. Lumped-parameter codes havebeen criticized for their approximate modelling methods in these areas. These criticisms have led tothe emergence of improved computing techniques for these codes and the introduction of alternativecodes that use finite-difference approximations to the Navier-Stokes equations with turbulent closuremodels and advanced numerics. These finite-difference codes are, in principle, capable of accurately

44
resolving detailed mixing patterns dependent on buoyancy, momentum, and free surface shear forces.Code development and assessment efforts for lumped-parameter and finite-difference codes arecurrently being pursued by a number of organizations (see Chapter 5).
3.4 References
1. Pressure Suppression System Containments, CSNI Report No. 126, October, 1986.
2. Containment for Pressurized Water Reactors, CSNI Report No. 166, December, 1989.
3. B.E. Boyack et al., Quantifying Reactor Safety Margins, Part 1: An Overview of theCode Scaling, Applicability, and Uncertainty Evaluation Methodology, NuclearEngineering and Design, Vol. 119, 1990, 1-15.
4. L.M. Shotkin, Development and Assessment of U.S. Nuclear Regulatory CommissionThermal-Hydraulic System Codes, Nuclear Technology, Vol. 116, 1996, 231-244.
5. H. Glaeser et al., Uncertainty and Sensitivity Analysis of a Post-ExperimentCalculation in Thermal Hydraulics, SMIRT-12, Post Conference Seminar No. 15,Heidelberg, Germany, 1993.
6. E. Hoffer, “The GRS Programme Package for Uncertainty and Sensitivity Analysis,”Proc. of the Seminar on Methods and Codes for Assessing the Off-Site Consequencesof Nuclear Accidents, EUR 13013, Commission of the European Communities, 1990.
7. K.J. Holmstrom et al., Status of Code Uncertainty Evaluation Methodologies, Proc. ofthe International Conference on New Trends in Nuclear System Thermohydraulics,Pisa, Italy, 1994.
8. G.E. Wilson et al., Use of PIRT Process in Research Related to Design Certification ofthe AP600 Advanced Passive LWR, International Conference on Nuclear Engineering,Vol. 2, ASME, 1996.
9. G.E. Wilson and B.E. Boyack, The Role of the PIRT Process in Identifying CodeImprovements and Executing Code Development, OECD Meeting, Annapolis, MD,November 5-8, 1996.
10. US Nuclear Regulatory Commission, Severe Accident Risk: An Assessment of FiveUS Nuclear Power Plants, US Nuclear Regulatory Commission Report, NUREG-1150,1990.
11. Gesellschaft fur Reaktorsicherheit (Ed.), Deutsche Risikostudie Kernkraftwerke -Phase B [German RFSK Study on Nuclear Stations - Phase B] (Verlag TUV Rheinland,1990, 64.
12. M. Khatib-Rahbar et al., Insights and Comparisons of the Level-2 Results of RecentProbabilistic Safety Analyses, Nuclear Engineering and Design, Vol. 162, 1996,175-203.

45
13. Implementing Severe Accident Management in Nuclear Power Plants, report by theOECD Senior Group of Experts on Severe Accident Management, 1996.
14. High-Pressure Melt Ejection (HPME) and Direct Containment Heating (DCH),OCDE/GD(96)194, NEA/CSNI/R(96)25 , December, 1996.
15. S.R. Tieszen, Effect of Initial Conditions on Combustion Generated Loads, NuclearEngineering and Design, Vol. 140, 1993, 81-94.
16. W. Breitung, Conservative Estimates for Dynamic Containment Loads from HydrogenCombustions, Nuclear Engineering and Design, Vol. 140, 1993, 95-109.

46
4. RECENT EXPERIMENTAL ACTIVITIES
4.1 Introduction
The experimental work described in this chapter represents the international effort put forth over the last 10years to extend the knowledge and understanding of containment behaviour from the DBA conditions [1] tomore challenging severe accident conditions. It covers data over a wide range of scale, test conditions, andphenomena affecting containment thermalhydraulics and hydrogen distribution. It is, as such, the bestinternationally available database for severe accident containment behaviour code validation. Since computercodes are used to simulate containment behavior during a severe accident, without availability of data from realaccidents, they must be validated against relevant experiments to warrant reliable predictions.
Whereas Chapter 5 discusses the modelling of particular experiments (the successes and failures of codes topredict or replicate experimental results), this chapter describes the facilities available and specific testsperformed recently. Table 4.1-1 lists the major experimental facilities with data on scale, overall dimensions,compartmentalization, typical problems and extent of instrumentation. Table 4.1-2 puts the experimentaldimensions in perspective with typical dimensions of PWR containments, to give a quantitative basis for scalingassessment. Table 4.1-3 summarizes the relevant experiments that have been performed and that are describedin more detail in this chapter. These experiments, in general, provide good data, relevant for containmentthermalhydraulics and hydrogen mixing and are useful for code validation. Most facilities, as long as they arestill in operation, could also serve for future experiments to address 3D code validation, experimental andmodelling uncertainties, scaling issues, and effects of mitigation measures—all were identified as issuesrequiring more work in a recent OECD workshop on hydrogen mitigation [2].
Containment phenomena, listed and discussed in Chapter 3, are cross-referenced to internationally availableexperiments, mostly integrated tests, in Table 4.1-4. This table is a first attempt at compiling a phenomena-based validation matrix for containment thermalhydraulics and hydrogen distribution in containment similar tothe test facility cross-reference matrices presented in Reference 3 for primary-heat-transport system (PHTS)analysis. It must be considered in conjunction with Table 3.3.4-1 (example PIRT) to assess the completenessand quality of the internationally available experimental data that address the most important phenomena forpredicting containment thermalhydraulics and hydrogen distribution (before mitigation measures) during thecore-damaged phase of a PWR severe accident. As such, only those phenomena that received a “high” or“medium” ranking in the illustrative PIRT, Table 3.3.4-1 presented in Chapter 3, are repeated in Table 4.1-4.Data from proprietary experiments are not included in this table. A qualitative assessment has been made of thedegree of suitability of the experimental data for code validation purposes using a four-tiered ranking:
0 - Not Present - The phenomenon is not present in any of the tests, or its presence is unknown (entryin table is blank).
1 - Present - The phenomenon is present in some or all tests, but its effect on the test results isinsignificant or was not observed or both.
2 - Significant - The phenomenon is present in some or all tests, and its effect on the test results issignificant and can be confirmed through indirect measurements (at least qualitatively or as atrend).

47
Table 4.1-1 Major experimental facilities
Facility Type/Intended Scalea
(status)Configurationb/Size/Typical Problems
Instrumentationc
HDR decommissioned steel PWRcontainment with external spray(decommissioned in 1995)
MC (~70), 11 300 m3 fullheight, about 1/3 of volume inopen dome
very complex containment,uncertain heat losses, largesurface/volume ratio
gas concentration gastemperature structure temp. +heat transfer velocity
BMC ~1/5 scale concrete model ofBiblis PWR containment withconcrete internal walls (to bedecommissioned in 1997)
MC (9)640 m3, 9-m height
air leakage via concrete cracks
gas concentrationgas temperaturestructure temp. + heat transfervelocity
NUPEC ¼ scale insulated steel model ofJapanese PWR with steelinternal partitions (to bedecommissioned)
MC (25-26)1300 m3
only short-term heat sinks
gas concentration (29-30)gas temperature (34)structure temperature (146)velocity (10)
HEDL 3/10 scale model of US icecondenser containment withwooden internal partition
MC (2)852 m3, 20.3-m height
gas concentrationtemperature
PHEBUS generic steel vessel, part ofintegrated core/PHTS/containment facility(currently in use)
SC14.5 m3, 5.7-m height
only one gas sampling line
H2 and O2 concentrations (1)gas temperature (25)sump temperature (4)structure temperaturescondensation rates
VICTORIA 1/15 scale model of Loviisa ICcontainment with dummyinternal structures (currently inuse)
MC (~5)21 m3, 4.6-m height
gas concentration (10)temperature (~300)flow visualization
WL 3 cubic unobstructed volumesconcrete walls (1000 m3 only)steel vessel and vented steelcompartment (recombiner tests)(all currently in use)
SC or MC (2)0.03, 5.8, 1000 m3 (mixing)10.7, 120 m3 (recombiner)no specific scale, rectangular
gas concentration (10)gas temperature and humiditystructure temperatureflow visualization, video
AP600 PCCSTest Facility
1/8 scale model of AP600 steelshell PWR containment
SC or MC (4)88 m3, 6.1-m height
gas concentration (2-6)gas temperature (8 movable)wall temperature (156)velocity (5)
MISTRA steel vessel can be subdivided(under construction)
~90 m3, 7-m heightcontrolled boundary conditionsSOA instrumentation
designed for 3D code’stemperature velocity (severalmethods) concentration (massspect.) condensation rates(local)
Notes: a Scales refer to linear scale 1/x, volumetric scale found by 1/x3
b MC - multicompartment (# rooms), SC - single compartmentc All facilities have at lease one pressure measurement.

Table 4.1-2 Dimensions and scaling parameters of typical PWRs (approximate) and experimental facilities
Containment Type Experimental Facility
GermanPWR
USPWR
JapanesePWR
FrenchPWR
CANDU6
HDR NUPEC BMC PHEBUS HEDL Victoria WL AP600PCCS
Mistra
Shape a S C C C C C C C C C C R C C
Type b, Pressure c
(kPa(a))S, 530 L,
420-520L, ~500 C, 530 C, 225 S, 600 S, 150 C, ~250 S, ~200 S, S, ~300 C, - S, S,
~600
Volume (m3) 70000 77000 72900 73050 48000 11300 1310 640 10 850 21 1000 88 90
Height (m) 56 64 65 63 46 60 17.4 9.0 5.7 20.3 4.6 11 6.1 7
Diameter (m) 56 43 43 44 41.7 20.7 10.8 12.0 1.8 7.6 3.1 10.3*8.2 4.6 4
Dome shape d H E H E E H H F E E F E E
Dome vol. (m3) e 41000 ~60000 52000 ~47000 ~27000 4800 930 ~260 10 ~650 ~12 1000 ~70 90
# Compartments 120 20 ~25 ~50 ~20 ~70 25 9 1 2 ~5 1-10 1-4 1-10
LT heat sink S/Vratiof (m2/m3)
0.82 0.25 0.25 ? 0.40 0.88 0.0 1.75 0.0 0.0 0.0 0.6 0.0 0.0
Notes: a spherical (S), cylindrical (C), rectangular (R)b type of pressure boundary: concrete (C), steel (S), steel-lined concrete (L), none (-)c design pressure for reactors, typical max. test pressure for experimentsd hemispherical (H), elliptical (E), flat (F)e refers to open area above “operating deck”f long-term heat sink’s surface-to-volume ratio (concrete and steel-clad concrete walls only)
48
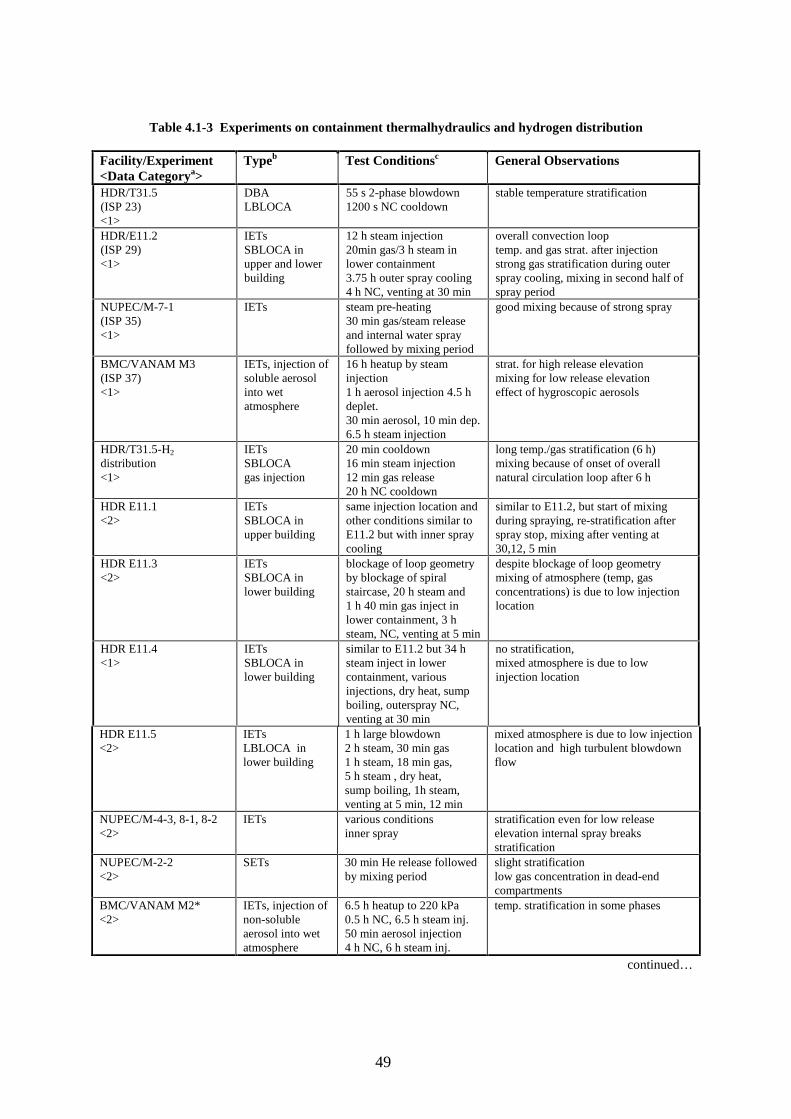
49
Table 4.1-3 Experiments on containment thermalhydraulics and hydrogen distribution
Facility/Experiment<Data Categorya>
Typeb Test Conditionsc General Observations
HDR/T31.5(ISP 23)<1>
DBALBLOCA
55 s 2-phase blowdown1200 s NC cooldown
stable temperature stratification
HDR/E11.2(ISP 29)<1>
IETsSBLOCA inupper and lowerbuilding
12 h steam injection20min gas/3 h steam inlower containment3.75 h outer spray cooling4 h NC, venting at 30 min
overall convection looptemp. and gas strat. after injectionstrong gas stratification during outerspray cooling, mixing in second half ofspray period
NUPEC/M-7-1(ISP 35)<1>
IETs steam pre-heating30 min gas/steam releaseand internal water sprayfollowed by mixing period
good mixing because of strong spray
BMC/VANAM M3(ISP 37)<1>
IETs, injection ofsoluble aerosolinto wetatmosphere
16 h heatup by steaminjection1 h aerosol injection 4.5 hdeplet.30 min aerosol, 10 min dep.6.5 h steam injection
strat. for high release elevationmixing for low release elevationeffect of hygroscopic aerosols
HDR/T31.5-H2
distribution<1>
IETsSBLOCAgas injection
20 min cooldown16 min steam injection12 min gas release20 h NC cooldown
long temp./gas stratification (6 h)mixing because of onset of overallnatural circulation loop after 6 h
HDR E11.1<2>
IETsSBLOCA inupper building
same injection location andother conditions similar toE11.2 but with inner spraycooling
similar to E11.2, but start of mixingduring spraying, re-stratification afterspray stop, mixing after venting at30,12, 5 min
HDR E11.3<2>
IETsSBLOCA inlower building
blockage of loop geometryby blockage of spiralstaircase, 20 h steam and1 h 40 min gas inject inlower containment, 3 hsteam, NC, venting at 5 min
despite blockage of loop geometrymixing of atmosphere (temp, gasconcentrations) is due to low injectionlocation
HDR E11.4<1>
IETsSBLOCA inlower building
similar to E11.2 but 34 hsteam inject in lowercontainment, variousinjections, dry heat, sumpboiling, outerspray NC,venting at 30 min
no stratification,mixed atmosphere is due to lowinjection location
HDR E11.5<2>
IETsLBLOCA inlower building
1 h large blowdown2 h steam, 30 min gas1 h steam, 18 min gas,5 h steam , dry heat,sump boiling, 1h steam,venting at 5 min, 12 min
mixed atmosphere is due to low injectionlocation and high turbulent blowdownflow
NUPEC/M-4-3, 8-1, 8-2<2>
IETs various conditionsinner spray
stratification even for low releaseelevation internal spray breaksstratification
NUPEC/M-2-2<2>
SETs 30 min He release followedby mixing period
slight stratificationlow gas concentration in dead-endcompartments
BMC/VANAM M2*<2>
IETs, injection ofnon-solubleaerosol into wetatmosphere
6.5 h heatup to 220 kPa0.5 h NC, 6.5 h steam inj.50 min aerosol injection4 h NC, 6 h steam inj.
temp. stratification in some phases
continued…
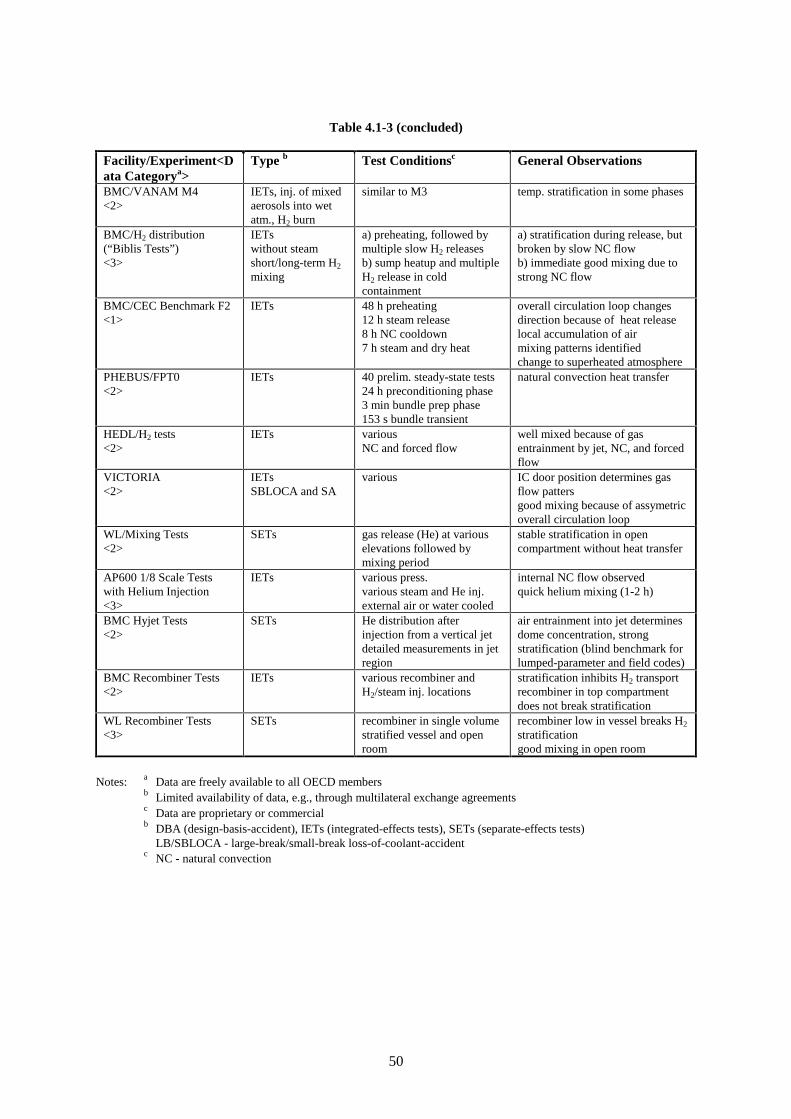
50
Table 4.1-3 (concluded)
Facility/Experiment<Data Categorya>
Type b Test Conditionsc General Observations
BMC/VANAM M4<2>
IETs, inj. of mixedaerosols into wetatm., H2 burn
similar to M3 temp. stratification in some phases
BMC/H2 distribution(“Biblis Tests”)<3>
IETswithout steamshort/long-term H2mixing
a) preheating, followed bymultiple slow H2 releasesb) sump heatup and multipleH2 release in coldcontainment
a) stratification during release, butbroken by slow NC flowb) immediate good mixing due tostrong NC flow
BMC/CEC Benchmark F2<1>
IETs 48 h preheating12 h steam release8 h NC cooldown7 h steam and dry heat
overall circulation loop changesdirection because of heat releaselocal accumulation of airmixing patterns identifiedchange to superheated atmosphere
PHEBUS/FPT0<2>
IETs 40 prelim. steady-state tests24 h preconditioning phase3 min bundle prep phase153 s bundle transient
natural convection heat transfer
HEDL/H2 tests<2>
IETs variousNC and forced flow
well mixed because of gasentrainment by jet, NC, and forcedflow
VICTORIA<2>
IETsSBLOCA and SA
various IC door position determines gasflow pattersgood mixing because of assymetricoverall circulation loop
WL/Mixing Tests<2>
SETs gas release (He) at variouselevations followed bymixing period
stable stratification in opencompartment without heat transfer
AP600 1/8 Scale Testswith Helium Injection<3>
IETs various press.various steam and He inj.external air or water cooled
internal NC flow observedquick helium mixing (1-2 h)
BMC Hyjet Tests<2>
SETs He distribution afterinjection from a vertical jetdetailed measurements in jetregion
air entrainment into jet determinesdome concentration, strongstratification (blind benchmark forlumped-parameter and field codes)
BMC Recombiner Tests<2>
IETs various recombiner andH2/steam inj. locations
stratification inhibits H2 transportrecombiner in top compartmentdoes not break stratification
WL Recombiner Tests<3>
SETs recombiner in single volumestratified vessel and openroom
recombiner low in vessel breaks H2
stratificationgood mixing in open room
Notes: a Data are freely available to all OECD membersb Limited availability of data, e.g., through multilateral exchange agreementsc Data are proprietary or commercialb DBA (design-basis-accident), IETs (integrated-effects tests), SETs (separate-effects tests)
LB/SBLOCA - large-break/small-break loss-of-coolant-accidentc NC - natural convection
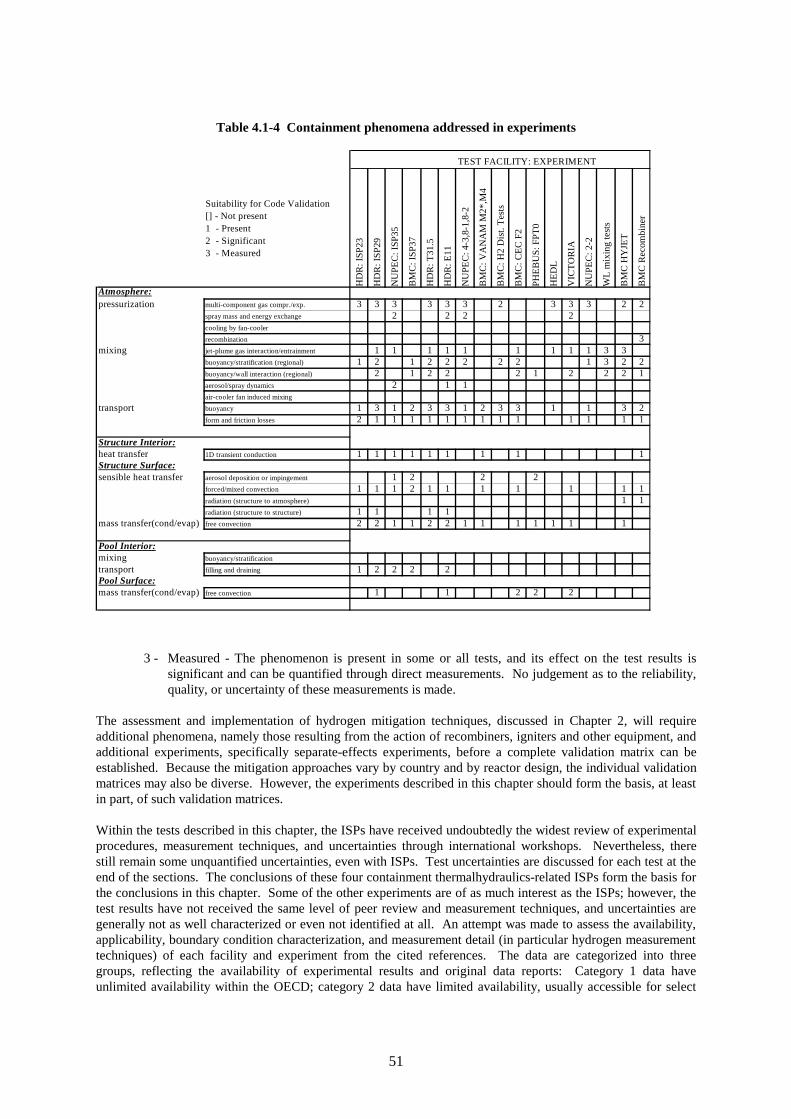
51
Table 4.1-4 Containment phenomena addressed in experiments
TEST FACILITY: EXPERIMENT
Suitability for Code Validation [] - Not present 1 - Present 2 - Significant 3 - Measured
HD
R: I
SP23
HD
R: I
SP29
NU
PEC
: ISP
35
BM
C: I
SP37
HD
R: T
31.5
HD
R: E
11
NU
PEC
: 4-3
,8-1
,8-2
BM
C: V
AN
AM
M2*
,M4
BM
C: H
2 D
ist.
Tes
ts
BM
C: C
EC
F2
PHE
BU
S: F
PT0
HE
DL
VIC
TO
RIA
NU
PEC
: 2-2
WL
mix
ing
test
s
BM
C H
YJE
T
BM
C R
ecom
bine
r
Atmosphere:pressurization multi-component gas compr./exp. 3 3 3 3 3 3 2 3 3 3 2 2
spray mass and energy exchange 2 2 2 2cooling by fan-cooler
recombination 3mixing jet-plume gas interaction/entrainment 1 1 1 1 1 1 1 1 1 3 3
buoyancy/stratification (regional) 1 2 1 2 2 2 2 2 1 3 2 2buoyancy/wall interaction (regional) 2 1 2 2 2 1 2 2 2 1aerosol/spray dynamics 2 1 1air-cooler fan induced mixing
transport buoyancy 1 3 1 2 3 3 1 2 3 3 1 1 3 2form and friction losses 2 1 1 1 1 1 1 1 1 1 1 1 1 1
Structure Interior:heat transfer 1D transient conduction 1 1 1 1 1 1 1 1 1Structure Surface:sensible heat transfer aerosol deposition or impingement 1 2 2 2
forced/mixed convection 1 1 1 2 1 1 1 1 1 1 1radiation (structure to atmosphere) 1 1radiation (structure to structure) 1 1 1 1
mass transfer(cond/evap) free convection 2 2 1 1 2 2 1 1 1 1 1 1 1
Pool Interior:mixing buoyancy/stratification
transport filling and draining 1 2 2 2 2Pool Surface:mass transfer(cond/evap) free convection 1 1 2 2 2
3 - Measured - The phenomenon is present in some or all tests, and its effect on the test results issignificant and can be quantified through direct measurements. No judgement as to the reliability,quality, or uncertainty of these measurements is made.
The assessment and implementation of hydrogen mitigation techniques, discussed in Chapter 2, will requireadditional phenomena, namely those resulting from the action of recombiners, igniters and other equipment, andadditional experiments, specifically separate-effects experiments, before a complete validation matrix can beestablished. Because the mitigation approaches vary by country and by reactor design, the individual validationmatrices may also be diverse. However, the experiments described in this chapter should form the basis, at leastin part, of such validation matrices.
Within the tests described in this chapter, the ISPs have received undoubtedly the widest review of experimentalprocedures, measurement techniques, and uncertainties through international workshops. Nevertheless, therestill remain some unquantified uncertainties, even with ISPs. Test uncertainties are discussed for each test at theend of the sections. The conclusions of these four containment thermalhydraulics-related ISPs form the basis forthe conclusions in this chapter. Some of the other experiments are of as much interest as the ISPs; however, thetest results have not received the same level of peer review and measurement techniques, and uncertainties aregenerally not as well characterized or even not identified at all. An attempt was made to assess the availability,applicability, boundary condition characterization, and measurement detail (in particular hydrogen measurementtechniques) of each facility and experiment from the cited references. The data are categorized into threegroups, reflecting the availability of experimental results and original data reports: Category 1 data haveunlimited availability within the OECD; category 2 data have limited availability, usually accessible for select
52
countries through multilateral information exchange agreements; and category 3 data are proprietary to certaincountries or companies, with original data not available, but published results are generally available. Table 4.1-2. shows these categories. The conclusions of this chapter are mainly based on category 1 and 2 data. Category3 data are mentioned, because of unique features in these tests, but they are excluded from the draft validationmatrix because of the unavailability of original data, which is a necessary requirement for code validation.
4.1.1 Scaling and Requirements for Extrapolation
Scaling problems and associated complicating factors are discussed in earlier SOARs on PWR [1] and BWR [4]containment technology. In these SOARs, the discussion focused on implications for important DBA-orientedphenomena. Apart from highly transient processes accompanying the high-pressure core-melt ejection process,most other severe accident scenarios under discussion in this SOAR are characterized as long-lasting natural-convection processes. They are mainly affected by the preceding deposition of energy in confining structures,which determines the distribution of heat sources and heat sinks for the subsequent period of interest. Thusmodelling heat exchange between the containment fluid and the structures is an essential requirement.
The interpretation and extrapolation of experimental results ask for a commitment to an appropriate simulationmodel. Traditionally, one would attempt to perform a rigorous dimensional analysis of the involved phenomenaand processes. One important dimensionless static similarity parameter group for long-lasting natural convectionis the Froude number, which correlates the buoyancy effects with the kinetic energy of the fluid and is relatedto the available geodetic elevation. However, the assessment of interrelated similarity requirementsshows that, for transient processes, it is practically impossible to satisfy the necessary preservation of the largenumber of dimensional parameter groups simultaneously. Generating time constants and Π-groups, whichreduce the number of dimensional groups, is an attractive approach for scaling facilities and accident transients.However, the method is complicated because of the variety of processes and the transient aspect of the problemwhere the relative importance of the phenomena may vary throughout an accident. Although useful for planningtests—that is, in providing insight into how and what types of phenomena should be preserved in scaled tests—these time constants and Π-groups still depend on a knowledge of transient boundary conditions (i.e., pressure,temperature, and gas concentration) in full-scale containments. Hence the only viable tool to correlate the resultsof transient experiments to the expected behaviour of a full-size prototype plant consists of a proven ASM.
Ideally, a code should be available that has been validated against a larger number of experiments executed atdifferent levels of scale, providing general experience in code application. “Experience in code application”implies the choice of options and the strategy to discretize the simulated object, which together constitute the“ASM”. The space discretization concept (nodalization in the lumped-parameter approach) and the necessarydegree of detail of heat exchange with confining structures inside and outside are of specific importance fornatural-convection processes. Transport of condensate may also be influential for certain simulations.Numerous comparisons between experimental and analytical results are essential to obtain code applicationexperience. Dimensional analysis and similarity considerations are complementary elements to indicate forwhich parameters and phenomena physical similarity is to be expected for experiments performed at differentscales and for the analytical models simulating these experiments [5].
The simulation of a variety of small-scale experiments may require modelling approaches that differ from thosefor a prototype simulation because certain empirical correlations have a limited validity range for codeapplication [6]. To minimize such restrictions, it is necessary to prove the validity of the code applicationempiricism for various scales by appropriate validation calculations. If larger-scale experiments are missing, amechanistic model containing all parameters that influence the physical processes allows more consistentextrapolations than empirical correlations do. Moreover, compensating errors in combination with suchempirical correlations can lead to wrong extrapolation results. To avoid such effects, a full set of variablesmeasured during the experiments needs to be compared with the calculated results and checked for consistency.The more experimental parameters are measured, the less unknown boundary conditions give way forcompensating errors in the validation calculations.
Of particular importance for downscaled integral model experiments is a correct quantification of heat losses,which may influence the course of any experiment. With geometric similarity between model and experiment, a

53
linear scale reduction of 1/x would result in a surface area reduction of 1/x2 and a volume reduction of 1/x3. Thecorresponding increase in the surface-to-volume ratio of a model would then be equal to x. The increase of thisratio will directly cause an increased heat exchange between the fluid and the confining structures. If a relevantsimulation of the prototype would require a test to be run at high-temperature conditions (e.g., the simulation ofparticular severe accident scenarios), significant distortions of the measured thermodynamic parameters wouldoccur, if not otherwise compensated. However, geometric similarity is generally not preserved anyway. At themost, typical arrangements of compartments and components may be attempted. Therefore, a careful assessmentof the entire modelling concept adopted for containment test facilities should be performed to estimate possibledistortions of the experimental measurements. This assessment must also include the geodetic elevationextension of the containment test facility, which directly determines buoyancy-driven convection processes.Moreover, the operating conditions chosen to execute the experiments are important characteristics of eachexperiment.
The general scaling principle adopted in performing integral experiments related to ECC and PCS transients canbe characterized as a time-preserving approach in determining the operating conditions of a test rig [7]. Time-preserving operation means an attempt to allow transient two-phase exchange processes or chemical processes todevelop at the same rate as they would be expected to occur in a full-size plant. Time-preserving operationspecifically requires the boundary conditions for mass and energy addition to be determined proportional to theselected scale reduction of the experimental fluid volume and in consistence with the conditions expected for theprototype. Generally, it is anticipated that the properties of the involved components of the fluid (e.g., steam, airand water) are preserved. If model fluids with different properties are employed, additional complicating factorsfor the interpretation of the test results are introduced. An approach similar to testing ECCS-related phenomenahas been applied for DBA-oriented integrated containment experiments and, for some tests, has been associatedwith severe accident scenarios [1]. For this approach, mass-and-energy addition rates scaled proportional to thevolume scale ratio are chosen as test conditions.
Accepting this scaling concept for integral experiments, it is indispensable to characterize the availablecontainment test facilities with respect to the involved experimental volume in terms of a volumetric scalingratio. This ratio is in general related to a particular reference plant. Moreover, because most tests of interesthere include natural-convection processes, it is also very important to characterize the facility with respect to itssurface-to-volume ratio and its geodetic elevation ratio relative to the prototype. The third importantinformation item to be summarized is the specified operating conditions of a test, attempting to preserve thesequence of events expected for the prototype. Hence chosen mass and energy addition functions should beknown for each test and assessed relative to the prototype plant assumptions. The tables in the preceding sectiongive an overview of these important scaling parameters for the experiments discussed in this report.
Depending on the extent and the quality of instrumentation, it may be directly possible to monitor and quantifycertain phenomena important for the evolution of an experiment. Hence it is informative for a given test toindicate what the goal of the experiment was and which phenomena may have dominated the experiment inparticular. As an example, a test may have been run with specific emphasis to study the effect of spray-coolingthe containment atmosphere (ISP 35). Collecting this information from test descriptions will facilitate thedevelopment of a phenomena- and scaling-oriented code validation matrix.
Separate-effects tests are sometimes performed to study individual or localized phenomena or processesexpected to occur in an integral (or systems) experiment. Such tests also may serve to characterize the behaviourof components, e.g., the chemical reaction potential of a recombiner. Interactions with other components orphenomena are either imposed as given boundary conditions derived from integral or systems experiments, orthey are completely neglected to study fundamental properties not necessarily covering the expected parameterrange of a containment under accident conditions. Scaling of SETs is not problematic once sufficient knowledgeof the operating conditions to which they will be subjected is available. Parametric variations may cover a widefield of operating conditions. Typical examples of SETs are heat transfer test rigs, test rigs for the study of flowresistance of orifices, basic recombiner efficiency tests, or separated aerosol deposition studies in a quietatmosphere. Separate-effects tests in general also serve the development of particular subroutines implementedwithin containment codes.
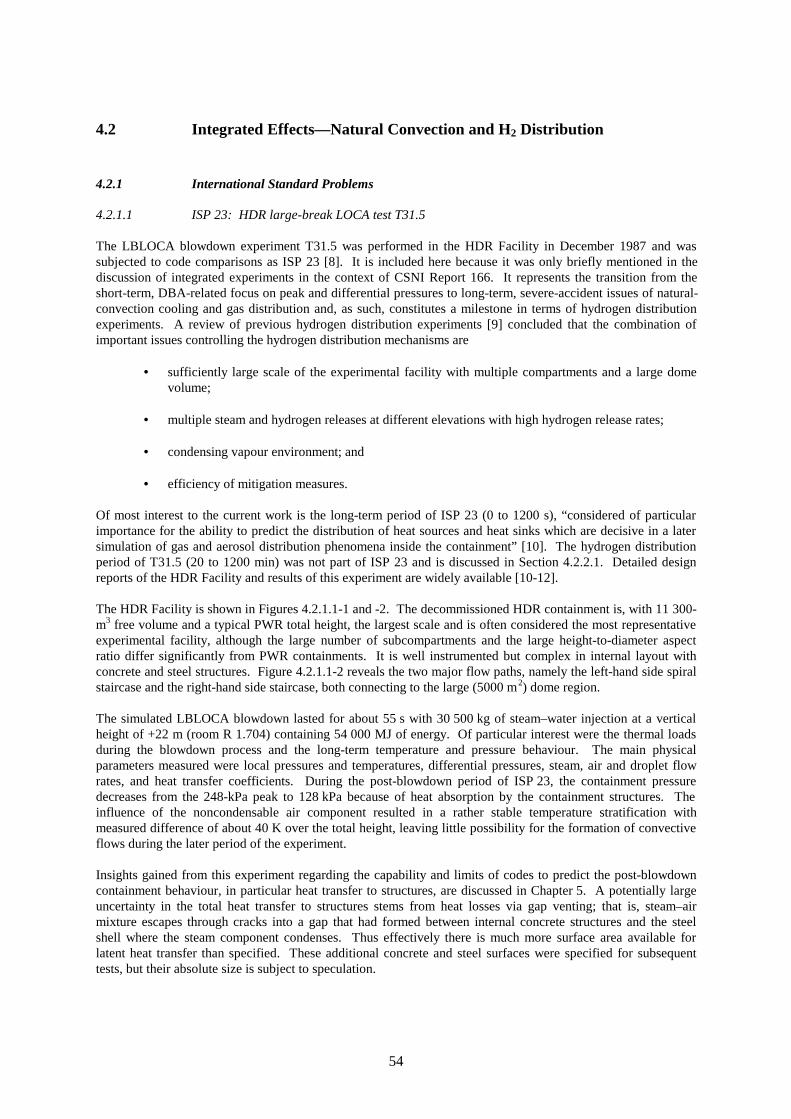
54
4.2 Integrated Effects—Natural Convection and H2 Distribution
4.2.1 International Standard Problems
4.2.1.1 ISP 23: HDR large-break LOCA test T31.5
The LBLOCA blowdown experiment T31.5 was performed in the HDR Facility in December 1987 and wassubjected to code comparisons as ISP 23 [8]. It is included here because it was only briefly mentioned in thediscussion of integrated experiments in the context of CSNI Report 166. It represents the transition from theshort-term, DBA-related focus on peak and differential pressures to long-term, severe-accident issues of natural-convection cooling and gas distribution and, as such, constitutes a milestone in terms of hydrogen distributionexperiments. A review of previous hydrogen distribution experiments [9] concluded that the combination ofimportant issues controlling the hydrogen distribution mechanisms are
• sufficiently large scale of the experimental facility with multiple compartments and a large domevolume;
• multiple steam and hydrogen releases at different elevations with high hydrogen release rates; • condensing vapour environment; and • efficiency of mitigation measures.
Of most interest to the current work is the long-term period of ISP 23 (0 to 1200 s), “considered of particularimportance for the ability to predict the distribution of heat sources and heat sinks which are decisive in a latersimulation of gas and aerosol distribution phenomena inside the containment” [10]. The hydrogen distributionperiod of T31.5 (20 to 1200 min) was not part of ISP 23 and is discussed in Section 4.2.2.1. Detailed designreports of the HDR Facility and results of this experiment are widely available [10-12].
The HDR Facility is shown in Figures 4.2.1.1-1 and -2. The decommissioned HDR containment is, with 11 300-m3 free volume and a typical PWR total height, the largest scale and is often considered the most representativeexperimental facility, although the large number of subcompartments and the large height-to-diameter aspectratio differ significantly from PWR containments. It is well instrumented but complex in internal layout withconcrete and steel structures. Figure 4.2.1.1-2 reveals the two major flow paths, namely the left-hand side spiralstaircase and the right-hand side staircase, both connecting to the large (5000 m2) dome region.
The simulated LBLOCA blowdown lasted for about 55 s with 30 500 kg of steam–water injection at a verticalheight of +22 m (room R 1.704) containing 54 000 MJ of energy. Of particular interest were the thermal loadsduring the blowdown process and the long-term temperature and pressure behaviour. The main physicalparameters measured were local pressures and temperatures, differential pressures, steam, air and droplet flowrates, and heat transfer coefficients. During the post-blowdown period of ISP 23, the containment pressuredecreases from the 248-kPa peak to 128 kPa because of heat absorption by the containment structures. Theinfluence of the noncondensable air component resulted in a rather stable temperature stratification withmeasured difference of about 40 K over the total height, leaving little possibility for the formation of convectiveflows during the later period of the experiment.
Insights gained from this experiment regarding the capability and limits of codes to predict the post-blowdowncontainment behaviour, in particular heat transfer to structures, are discussed in Chapter 5. A potentially largeuncertainty in the total heat transfer to structures stems from heat losses via gap venting; that is, steam–airmixture escapes through cracks into a gap that had formed between internal concrete structures and the steelshell where the steam component condenses. Thus effectively there is much more surface area available forlatent heat transfer than specified. These additional concrete and steel surfaces were specified for subsequenttests, but their absolute size is subject to speculation.

55
Figure 4.2.1.1-1 Elevation view of the HDR containment, 0º-180º section

56
Figure 4.2.1.1-2 Elevation view of the HDR containment, 90º-270º section

57
An important experimental recommendation from this test was the application of traceable gases in future tests.This application should compensate existing problems with the interpretation of local temperature measurementsas an indication of natural-convection flows and gas-mixing processes. The transient measurement of gasconcentrations throughout a multicompartment containment is a better and more direct indication of gastransport (mixing) processes than is the measurement of the temperature field, and, also, serves as an additionalparameter for code comparison. Other recommendations—unanimously accepted by all participants—were (1)that another ISP focusing on DBA-related questions was not required, (2) that code application experience beimproved within PSA through the execution of another ISP focusing mainly on long-lasting natural-convectioneffects, and (3) that post-test analysis of this and former ISPs be continued to generate code applicationexperience. The establishment of a containment code validation matrix should be a high-priority task, includingthe ISP-related experiments.
4.2.1.2 ISP 29: HDR small-break LOCA and H2 distribution test E11.2
Participants of ISP 23 and the subsequent hydrogen distribution phase of T31.5 analyses identified a strong needfor more experimental evidence for long-lasting processes and recommended the execution of an appropriateISP, focusing on a typical SBLOCA with up to 24 h of natural-convection phenomena. The simulatedunmitigated SBLOCA experiment E11.2 was performed in the HDR Facility as part of a series of hydrogendistribution tests (see Section 4.2.2.1) in 1989 and was chosen to serve as the basis for ISP 29 [13] with thefollowing objectives:
• determine the temperature distribution during the entire transient, • study the distribution of energy during and after the SBLOCA phase, and • measure the steam, air, and hydrogen distribution within the containment atmosphere under severe
accident conditions initiated by a SBLOCA.
From a phenomenological viewpoint, experiment E11.2 may be subdivided into three phases: (1) a 12-h steaminjection at a 17.5-m elevation provided a preconditioning heatup of the containment, to a certain extentsimulating the energy release rates of a unmitigated SBLOCA; (2) a hydrogen injection into the same room,representative of a risk-relevant core-melt scenario (volume scaled), immediately followed by another steaminjection at a low elevation, intended to be representative of a slow sump evaporation; and (3) a naturalcooldown period, enhanced by an external water cooling spray. Details of the test procedure, data acquisitionand errors, and detailed results are widely available [13-16]. A dedicated report, addressing the experimentaluncertainties and error compensations [17] underlines the need for much higher accuracy in measurements forlong-term containment phenomena, as compared to DBA-oriented experiments.
Initial “blind post-test prediction” results revealed significant errors in the experiments overall energy balance.Subsequent investigation showed that a calibration error of the steam-line mass flow measurement and energyextraction by the instrument cooling system had caused a reduction of the net total enthalpy input rate intocontainment by about 30% to 50% from the originally specified values. This finding largely explains the reasonsfor the deviations between blind calculations and measured data reported in Reference 18. Uncertainties relatedto heat losses via gap venting (see ISP 23) also apply in this test; this is the main shortcoming of this complicatedfacility.
During the heatup phase of ISP 29 the injected steam, being lighter than the ambient air, rises and displaces theair to the lower elevations. Thus at the end of the heatup phase, a strong stable vertical temperature gradient of90 K and steam concentration gradient, varying from 5% at the bottom to 70% at the top of containment, isestablished. The subsequently injected light gas stratifies in a consistent manner reaching concentrations near16% at the top of the dome, with almost no light gas penetrating below the injection elevation. This light-gasstratification is not broken by the immediately following low-elevation steam release. The observed equalizationof the containment steam concentration during the light-gas and low-elevation steam releases (apparent break-upof stratification) is due to the combination of high-elevation steam being displaced by the light gas, followed bythe low-elevation steam addition, resulting in an almost-uniform steam concentration of around 30% before the

58
natural cooldown period. It is not an indication of an overall convective flow being established, which would beexpected to break the hydrogen stratification as well.
Of most significance are the hydrogen and steam concentration behaviour during the external spray cooling (t =965 to 1085 min) on top of the steel dome, shown in Figures 4.2.1.2-1 and -2, respectively, for variouselevations. Vigorous steam condensation on the inside of the steel dome results in a drastic reduction in steamconcentration and a corresponding spike in the hydrogen concentration (25%) within a time period of 30 min.This mechanism for light-gas enrichment is different from the buoyancy-induced stratification during the light-gas and lower steam injection phase. The steam condensation in the dome also causes a temporary upflow in themain staircase, as indicated by the dip in measured hydrogen concentration at the 31-m level. In the late phaseof this test, the hydrogen stratification remains fairly stable, decreasing only slightly over a period of 7 h bydiffusion.
The following recommendations were unanimously accepted by all participants:
• To complement long-term integrated containment behaviour, further research should be conductedusing some separate-effects studies.
• One area could be an investigation of the behaviour and determination of flow loss coefficients for
large area flow junctions under low-flow conditions typical for containment systems. This problemis also of importance if users of lumped-parameter codes attempt to subdivide large free volumes(e.g., the dome compartment of a PWR) into a number of fictitious subvolumes, interconnected bydifficult-to-specify flow junctions.
• A small study should be devoted to assess the thermal properties of commercial concrete in
dependence of the concrete composition, the amount and structuring of inserted rebar, and concretehumidity.
• To assess the importance and understanding of the experiment E11.2, it was recommended that the
entire series of hydrogen distribution experiments executed in the framework of the HDR researchproject be evaluated.
• To select another experiment, possibly a simpler one, as a basis for a future ISP to allow
monitoring of code improvement results. It would be useful to have another ISP based on asequence with the injection of gas and steam located in the upper part of a containment building,allowing again the possibility of a thermally stratified containment atmosphere.

59
Figure 4.2.1.2-1 Gas concentration along staircase, Test E11.2
Figure 4.2.1.2-2 Steam concentration along staircase, Test E11.2

60
4.2.1.3 ISP 35: NUPEC H2 mixing and distribution test M-7-1
NUPEC’s hydrogen mixing and distribution test, M-7-1, was conducted as a part of the Proving Test on theReliability for Reactor Containment Vessel Project [19,20], sponsored by the Ministry of International Trade &Industry of Japan (MITI). Test M-7-1 was performed and accepted as ISP 35 in 1992 [21,22]. The final reporton the test and the blind and open analyses from 12 participating organizations were released in 1994 [23]. Areport on code uncertainty evaluation of ISP 35 simulations, based on the fast Fourier transform, is also available[24].
The NUPEC model containment at the Tadotsu Engineering Laboratory, shown schematically in Figures 4.2.1.3-1 and 4.2.1.3-2, consists of a one-quarter linearly scaled PWR dry, insulated steel containment vessel with a freevolume of 1300 m3. It has 25 subcompartments, separated by steel partitions, including a large dome with 70%of the total free volume and an internal containment spray system, reflecting a simplified four-loop JapanesePWR containment [25].
The purpose of the hydrogen mixing and distribution test, part of the program to evaluate containment integrity,was to investigate hydrogen distribution phenomena in a model containment and to validate analysis codes. Themain characteristic of test M-7-1 was a direct containment spray cooling during steam and light gas injection.For safety reasons, helium gas was used as a hydrogen simulant. The main items of study in the test werenatural-convection effects, effect of steam release and spray water, and effects of break and sensor locations.The test parameters were based on scaling considerations as follows:
1. Total helium volume was scaled by containment volume (1/64) from the quantity of hydrogenreleased because of the 100% Zr-H2O reaction in a four-loop Japanese PWR.
2. Helium and steam release rates were scaled by containment volume (1/64) of actual release rates.
The release rate profiles were stylized: The helium flow was ramped from 0 to 30 g/s over 15 minand back to 0 over another 15 min for a total release of 27 kg; the initial steam flow was 0.08 kg/s,decreasing to 0.03 kg/s at 30 min for a total release of 99 kg.
3. Spray water release rate was scaled by area (1/16), not by volume, from the actual release rate in a
four-loop Japanese PWR. A constant flow rate of 70 m3/h (19.4 kg/s) was used over 30 min.Spray nozzles were of the same type as those used in the real containment.
Measurements of gas concentration (29 locations, typically at the centre of each compartment, but five locationsin the dome (four across a horizontal plane and one above), using gas chromatography), temperatures (34 withincompartments and 146 on structures, using thermocouples), and inter-compartment flow rates (10 locations,using hot-wire wind gauges) were detailed and—except for the flowmeters—were well suited for lumped- ordistributed-parameter analysis. Measurement uncertainties consist mainly of random instrument errors becausesystematic errors (biases) are believed to be removed by the calibrations conducted before each experiment. Thestandard deviations of the measurements are 0.2°C for temperatures and 1079 Pa for dome pressure. Thestandard deviation for helium concentration is 1% of the measured value plus 0.002 vol %, based on drylaboratory calibration; the steam volume error must be considered in addition to derive the total heliumconcentration error in the containment vessel. Mass and energy balances were documented and showed goodagreement between measured and calculated (based on inlet flows) values [26].

61
Figure 4.2.1.3-1 Inner structure layout of the NUPEC model containment vessel

62
Figure 4.2.1.3-2 Scale and components of the NUPEC model containment vessel
Test conditions—along with other NUPEC tests, discussed later—are shown in Table 4.2.1.3-1. (In this table,test conditions for tests M-8-1 and M-8-2 are not based on anticipated accident sequences in Japan but wereselected for comparison with ISP 29 in which stratification occurred. The probability of PWR loss-of-coolantaccident sequence without spray action (M-8-1 conditions) is negligibly small, about 10-8 per reactor-year,according to Japanese Level 1 PSA. Even if it was to occur, a spray system can promote the hydrogen-mixingcharacteristics, as described in Section 4.2.2.2. In addition, the probability of the failure of the upper part of thepressurizer, the initiating event in test M-8-1, is estimated to be one order of magnitude less than that of the otherpart of the primary circuit because the length of the piping is comparatively short.)
After a long steam preheating phase, which heated the containment vessel to 70°C, the 30-min steam–helium andsimultaneous water spray injection was conducted and measurements were taken until 120 min. Because well-mixed conditions were quickly obtained after the 30-min steam–helium and simultaneous water spray injection,the test phase of interest was only about 40 min in test M-7-1. All measurements and modelling results in ISP 35were presented for this 40-min time frame [23]. This is a rather short time period in view of severe accidentscenarios, compared to the HDR tests, resulting from the use of steel internal structures (short-term heat sinks)rather than the concrete structures (long-term heat sinks) predominant in the HDR and Battelle ModelContainment (BMC) Facilities. Figure 4.2.1.3-3 gives the helium concentration transients in all compartments,showing that only the release room CV 8 and the immediately upstream rooms CV 15 and 21 have a significantlyhigher helium concentration during the release period than the remainder of the containment, including the largedome, which is always well mixed. Immediately after the release, all rooms come to the same concentration ofabout 13%. Chapter 5 discusses the modelling results of these experiments.

63
Table 4.2.1.3-1 NUPEC experimental program: test conditions [27]
Item M-7-1 M-4-3 M-8-1a M-8-2a M-2-2
Initial system pressure
Initial atmospheric gas andstructure temperature
~140 kPa
~70°C
101 kPa
room temp.
101 kPa
room temp.
~140 kPa
~70°C
101 kPa
room temp.
Supply GasHelium temperatureHelium flow rateSteam temperatureSteam flow Rate
15°C0~0.03 kg/s
160°C0.08~0.03 kg/s
15°C0.03 kg/s
160°C0.33 kg/s
15°C0.03 kg/s
160°C0.33 kg/s
15°C0~0.03 kg/s
160°C0.08~0.03 kg/s
15°C0.03 kg/s
--
Gas discharge location
Gas discharge duration
SG foundation(CV 8)30 min
SG foundation(CV 8)30 min
Pressurizer(CV 22)30 min
Pressurizer(CV 22)30 min
SG foundation(CV 8)30 min
Containment SprayWater temperatureFlow RateDuration
40°C19.4 kg/s30 min
- - 40°C19.4 kg/s30 min
-
a Conditions not based on anticipated plant sequence in Japan (The occurrence probability of PWR LOCA sequenceswithout spray action is negligibly small, about 10-8/reactor-year, according to Japan’s level 1 PSA. In addition, thefailure probability of the initial event of test M-8-1 is very small.
Figure 4.2.1.3-3 Helium concentration in the model containment vessel (Test M-7-1)
In general, the code results of these experiments showed that important parameters including heat balances, heattransfer coefficients, flow loss coefficients and stratification need further study to understand the mixing process.The following critical recommendations were made:

64
1. Future experiments on hydrogen mixing need careful specification, namely mass and energybalance, factors such as humidity, water temperature and mass in each compartment, and structuretemperature distributions. Efforts should be made to ensure that sufficient data are available tocalculate energy balances, as well as their errors and uncertainty.
2. Future experiments will require better instrumentation, especially for gas mass flow rates between
compartments (to calculate flow branching). In test M-7-1, these measurements were unreliablebecause of the wet conditions.
3. The area-scaled water spray flow dominated the mixing pattern to a high degree. Volumetric
scaling would be preferred to better simulate the heat transfer quantity between the atmosphere andthe droplets. Further experiments that more accurately reflect power plant conditions arerecommended.
4. A construction of a hydrogen mixing code validation matrix, building on experience from ISP 29
(low mixing) and ISP-35 (high mixing) and including future, more representative (scenariooriented) tests, is recommended.
4.2.1.4 ISP 37: Coupled Thermalhydraulic and aerosol test VANAM M3 (M2*, M4)
Although the VANAM M3 experiment was primarily an aerosol test, it also included thermalhydraulic aspectsand is, therefore, included here. The “open” ISP 37 VANAM M3 test deals with containment thermalhydraulicsand aerosol behaviour with steam and aerosol release into the containment focusing on an unmitigated severeLWR accident with core meltdown [28,29]. The containment and aerosol behaviour experiment, VANAM M3,was selected as an experimental comparison basis. The main phenomena investigated are the thermal behaviourof a multicompartment containment, e.g., pressure, temperature and the distribution and depletion of a solubleaerosol.
The VANAM M3 experiment was performed in the Battelle Model Containment (BMC) Test Facility [30],shown in Figures 4.2.1.4-1 and -2. Through steam and aerosol injection lines (cavity R3 and pressurizercompartment R5), the atmospheric conditions were adjusted to attempt to simulate the selected severe accidentsequence with pressurizer relief valve discharge. However, to compensate for the large leakage rate of the BMCFacility (>100% per day), air injections during several phases of the experiment led to reactor untypicalconditions. Because of the large uncertainty associated with this leakage, this test, as well as other long-termelevated pressure tests in the BMC, may not be well suited for code validation, unless very detailed, completeexperimental data and discussion are considered.
Nevertheless, this experiment provides data for the following processes:
• long-term natural convection; • changes in natural convection flows and amplitude caused by cooldown processes and different
injection locations;• thermal stratification, atmospheric saturation, and superheating; • redistribution of noncondensable gases; • heat transfer at different elevations, local condensation effects; • sump temperature and depth; and • dry and wet aerosol multicompartment distribution and depletion.
The experiment may be subdivided into six phases:

65
1. a 17-h facility heatup phase with steam injection into pressurizer compartment R5, keepingpressure at a nominal value of 125 kPa;
2. a first NaOH aerosol release phase of 1 h into pressurizer compartment R5; 3. a 4.5-h dry aerosol depletion phase;4. a second aerosol release phase of 0.44 h into pressurizer compartment R5; 5. a 2-h mixing phase by steam injection into cavity R3 with wet aerosol depletion; and 6. a 5-h wet depletion phase with steam injection into pressurizer compartment R5.
A comprehensive measurement system recorded the time histories of pressure, temperature distribution,humidity, sump level, atmospheric flow velocity, local aerosol concentration and depletion and aerosol size. Inaddition, from specific measurements, local wall heat transfer coefficients can be determined.
The measurement error, which is important for the comparison of analytical and experimental errors, is in mostcases very low, e.g., ±2 kPa for pressure, ±1.4 K for temperature, and ±0.2 m/s for velocity. For dry aerosolconcentration, the error lies between 12% and 30%. For heat transfer coefficient, droplet concentration, andhumidity only qualitative data could be obtained. Pressure and temperature measurements indicatepredominantly saturated conditions. More detailed information is contained in References 29 to 32. The largestthermalhydraulic uncertainty resides with the leakage rate and its distribution from the BMC; the overall leakagewas not measured directly but was quantified indirectly from a mass balance that estimated total air mass. GRS’calculations indicated that the uncertainty is around 10% [31].
The experiments—M2*, M3 and M4—were performed under the same geometric and thermalhydraulicconditions. The differences, which in this context are of no interest, are due to the use of different types ofaerosols (insoluble, soluble, mixed aerosols).

66
Figure 4.2.1.4-1 Battelle model containment, vertical section and dimensions

67
Figure 4.2.1.4-2 Battelle Model Containment room layout

68
4.2.2 Other Integrated Experiments
4.2.2.1 HDR experiments T31.5 and E11.1-5—gas distribution tests
The LBLOCA blowdown experiment and the subsequent hydrogen distribution experiment T31.5 [33-35] wereperformed in the HDR Facility in December 1987. The facility is described in Section 4.2.1.1 and is shown inFigures 4.2.1.1-1 and -2.
The blowdown lasted for about 55 s with 30 500 kg of steam–water injection, with a total energy content of54 000 MJ. The post-blowdown phase (ISP 23) of this test, discussed in Section 4.2.1.1, established the initialconditions for the subsequent hydrogen distribution test phase. A sequential steam release of about 2 kg/s from20 to 35 min and 15% H2/85% He gas-mixture release of about 0.2 kg/s from 35 to 47 min occurred in the samecompartment as did the LOCA blowdown. A total of 46 atmospheric temperature sensors, 11 pairs ofinside/outside steel shell surface temperature sensors and 16 hydrogen concentration sensors (catalytic principle)were used. Figures 4.2.2.1-1 and -2 show the measured gas concentrations above and below the injection,respectively. Note that the figures show the hydrogen concentrations; to obtain the gas-mixture volumetricconcentration, the curves are divided by 0.15, giving a peak H2/He concentration of 13.3 vol %. A build-up ofhydrogen in the upper region of the dome is indicated, resulting in a substantial concentration gradient over thedome height, which lasts for over 6 h. The onset of the subsequent homogenization is directly correlated withthe onset of a global natural-circulation flow, as indicated by small fluctuating velocity measurements—in theorder of 0.1 m/s—in the two staircases. This is the most remarkable result of experiment T31.5.
On the basis of experience gained from T31.5 with respect to experimental measurement andcomputational aspects, a complete, major test group E11 was designed and performed in theframework of the HDR Safety Program Phase III during 1989. The complete test seriesconsisted of a total of eight different experiments with five major experiments, E11.1 throughE11.5. Whereas the scoping experiment T31.5 was DBA oriented as the majority of allprevious HDR blowdown experiments, the E11 experiments were geared towards small breakLOCA induced/controlled containment atmosphere conditions. Only test E11.5 providedagain HDR-typical large LOCA initial containment conditions. The experiments covered anumber of different conditions such as axially different injection position of steam and gasmixture (85% He/15% H2 was used for safety reasons), multiple injections of gas mixtures andsteam into different compartments, internal and external spray (on top of dome), boiling sumpsimulation, “dry” energy addition and venting measures at three different axial positions [36].
Special attention was given to the completeness, accuracy and reliability of instrumentation, especiallywith respect to local H2 concentrations and steam–air concentrations. Forty-five H2 sensors wereapplied throughout the facility with the same number of steam–air concentration sensors, andthermocouples in their immediate vicinity. In addition, velocities and structural temperatures weremeasured inside the containment as well as throughout the annular gap between the steel shell andsecondary concrete.
The various test objectives and conditions are depicted in Figures 4.2.2.1-3 to 5. Tests E11.1 and 2simulate the beginning of the core-melt progress in the reactor pressure vessel (RPV), assuming thathydrogen is released in the upper part of the containment (+23 m). Test E11.3 examines the influenceof plant geometry on the hydrogen distribution process by blocking the spiral staircase. Besides this,the break location was moved for test E11.3-5 to the lower containment region. For tests E11.4 and 5,the additional hydrogen production resulting from core–concrete interaction is considered and sumpboiling is simulated [35]. The vast volume of experimental data can be extracted from originalreferences [18,37-40]; only the major results are summarized here.
Tests E11.1 to Ell.5 showed that during accidents with small leaks, at medium or high elevation, pronounced andsustained temperature stratifications occurred. The relative stable separation into “warm” (above the break) and“cold” (below the break) zones caused equally stable hydrogen stratifications, with an increased concentration inthe dome and lesser concentrations in the lower regions. Only for temperature differences of less than 10 K did

69
a slow equalization of the hydrogen distribution occur by natural convection. The accident managementmeasures examined (internal and external spray, venting) impaired these stratifications after some time delay.
Figure 4.2.2.1-1 Measured hydrogen concentration above break, test T31.5(to obtain concentration of He/H2 gas, divide by 0.15)

70
Figure 4.2.2.1-2 Measured hydrogen concentration below break, test T31.5(to obtain concentration of He/H2 gas, divide by 0.15)

71
Figure 4.2.2.1-3 Tests sequence, E11.1 and E11.2

72
Figure 4.2.2.1-4 Tests sequence, E11.3 and E11.4

73
Figure 4.2.2.1-5 Test sequence, E11.5
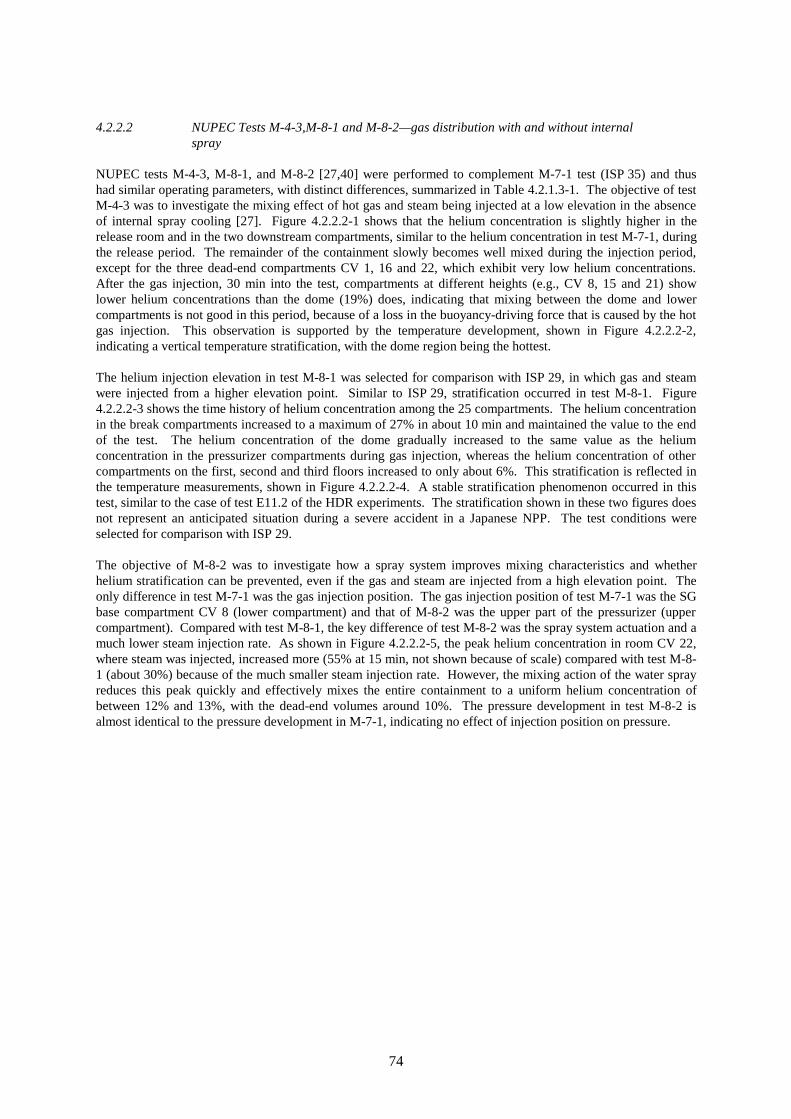
74
4.2.2.2 NUPEC Tests M-4-3,M-8-1 and M-8-2—gas distribution with and without internalspray
NUPEC tests M-4-3, M-8-1, and M-8-2 [27,40] were performed to complement M-7-1 test (ISP 35) and thushad similar operating parameters, with distinct differences, summarized in Table 4.2.1.3-1. The objective of testM-4-3 was to investigate the mixing effect of hot gas and steam being injected at a low elevation in the absenceof internal spray cooling [27]. Figure 4.2.2.2-1 shows that the helium concentration is slightly higher in therelease room and in the two downstream compartments, similar to the helium concentration in test M-7-1, duringthe release period. The remainder of the containment slowly becomes well mixed during the injection period,except for the three dead-end compartments CV 1, 16 and 22, which exhibit very low helium concentrations.After the gas injection, 30 min into the test, compartments at different heights (e.g., CV 8, 15 and 21) showlower helium concentrations than the dome (19%) does, indicating that mixing between the dome and lowercompartments is not good in this period, because of a loss in the buoyancy-driving force that is caused by the hotgas injection. This observation is supported by the temperature development, shown in Figure 4.2.2.2-2,indicating a vertical temperature stratification, with the dome region being the hottest.
The helium injection elevation in test M-8-1 was selected for comparison with ISP 29, in which gas and steamwere injected from a higher elevation point. Similar to ISP 29, stratification occurred in test M-8-1. Figure4.2.2.2-3 shows the time history of helium concentration among the 25 compartments. The helium concentrationin the break compartments increased to a maximum of 27% in about 10 min and maintained the value to the endof the test. The helium concentration of the dome gradually increased to the same value as the heliumconcentration in the pressurizer compartments during gas injection, whereas the helium concentration of othercompartments on the first, second and third floors increased to only about 6%. This stratification is reflected inthe temperature measurements, shown in Figure 4.2.2.2-4. A stable stratification phenomenon occurred in thistest, similar to the case of test E11.2 of the HDR experiments. The stratification shown in these two figures doesnot represent an anticipated situation during a severe accident in a Japanese NPP. The test conditions wereselected for comparison with ISP 29.
The objective of M-8-2 was to investigate how a spray system improves mixing characteristics and whetherhelium stratification can be prevented, even if the gas and steam are injected from a high elevation point. Theonly difference in test M-7-1 was the gas injection position. The gas injection position of test M-7-1 was the SGbase compartment CV 8 (lower compartment) and that of M-8-2 was the upper part of the pressurizer (uppercompartment). Compared with test M-8-1, the key difference of test M-8-2 was the spray system actuation and amuch lower steam injection rate. As shown in Figure 4.2.2.2-5, the peak helium concentration in room CV 22,where steam was injected, increased more (55% at 15 min, not shown because of scale) compared with test M-8-1 (about 30%) because of the much smaller steam injection rate. However, the mixing action of the water sprayreduces this peak quickly and effectively mixes the entire containment to a uniform helium concentration ofbetween 12% and 13%, with the dead-end volumes around 10%. The pressure development in test M-8-2 isalmost identical to the pressure development in M-7-1, indicating no effect of injection position on pressure.

75
Figure 4.2.2.2-1 Helium concentrations in test M-4-3
Figure 4.2.2.2-2 Gas temperatures in test M-4-3

76
Figure 4.2.2.2-3 Helium concentrations in test M-8-1*
Figure 4.2.2.2-4 Gas temperatures in test M-8-1*
*Note: The stratification shown in these figures (Test M-8-1) does not represent an anticipated situation during a severeaccident in a Japanese NPP. The test conditions were selected for comparison with HDR experiments.

77
Figure 4.2.2.2-5 Helium concentrations in test M-8-2
4.2.2.3 VANAM test M2
The VANAM M2 experiment [41,42] should be mentioned in addition to VANAM M3 (see Section 4.2.1.4)because it differs in the compartment connections and the pressure level during the heatup phase. The dataprovided are for the same processes as in the block of tests M2*, M3 and M4. Test M3 differs in geometry:compartments R1 and R3 are coupled via a large opening, and the two junctions between R1-R6 and R1-R8 areclosed. Therefore, the convection loops are different in test M3, and the stratification in the inner compartmentsis weaker. The phases of test VANAM M2 are as follows:
1. 6.5-h heatup to 250 kPa by injection of steam into pressurizer compartment R5, 0.5-h cooldown to 200 kPa without any injection, 6.5-h heatup by steam injection, pressure kept at 200 kPa; 2. 50-min aerosol release phase coupled with hot air injection into pressurizer compartment R5; 3. 4-h aerosol depletion and natural cool down phase; 4. 2-h mixing phase by steam injection into pressurizer compartment R3 with wet aerosol depletion;
and 5. 4-h steam injection into pressurizer compartment R5 with wet aerosol depletion.
Together, experiments VANAM M2 and M3 give a good opportunity to compare analytical models that describethe formation of convection loops with measured results.
4.2.2.4 CEC Thermalhydraulic benchmark—BMC Test F2
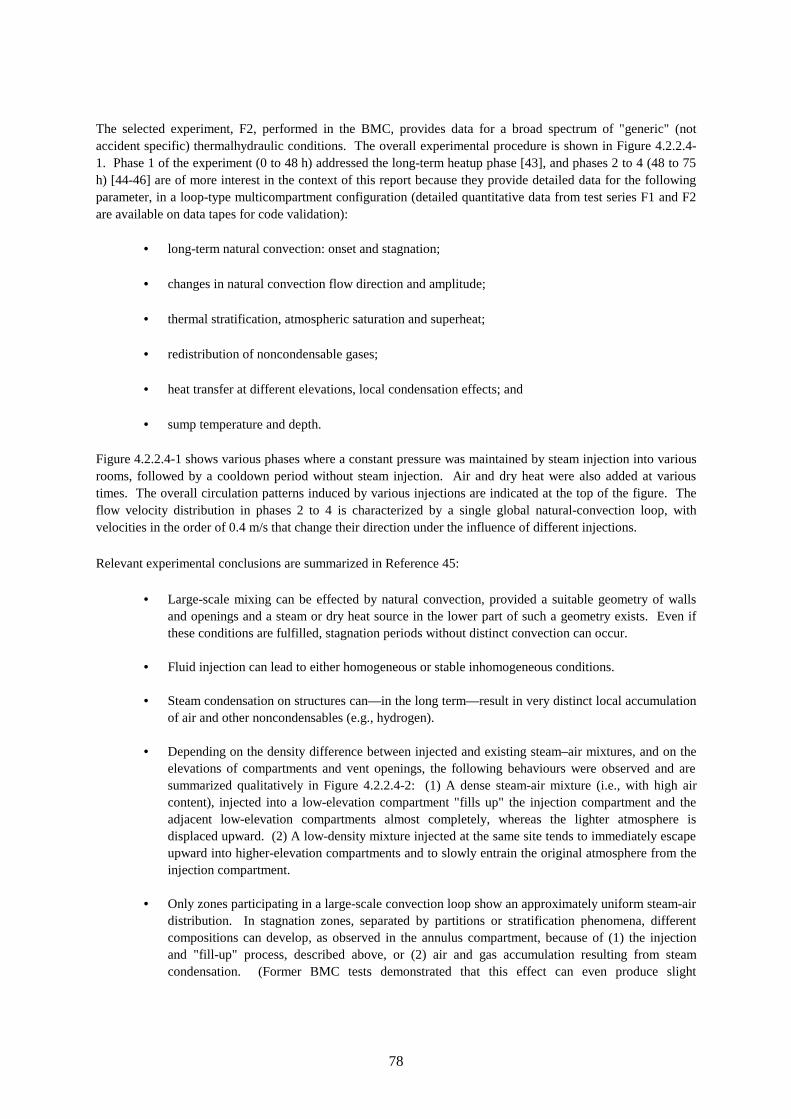
78
The selected experiment, F2, performed in the BMC, provides data for a broad spectrum of "generic" (notaccident specific) thermalhydraulic conditions. The overall experimental procedure is shown in Figure 4.2.2.4-1. Phase 1 of the experiment (0 to 48 h) addressed the long-term heatup phase [43], and phases 2 to 4 (48 to 75h) [44-46] are of more interest in the context of this report because they provide detailed data for the followingparameter, in a loop-type multicompartment configuration (detailed quantitative data from test series F1 and F2are available on data tapes for code validation):
• long-term natural convection: onset and stagnation; • changes in natural convection flow direction and amplitude; • thermal stratification, atmospheric saturation and superheat; • redistribution of noncondensable gases; • heat transfer at different elevations, local condensation effects; and • sump temperature and depth.
Figure 4.2.2.4-1 shows various phases where a constant pressure was maintained by steam injection into variousrooms, followed by a cooldown period without steam injection. Air and dry heat were also added at varioustimes. The overall circulation patterns induced by various injections are indicated at the top of the figure. Theflow velocity distribution in phases 2 to 4 is characterized by a single global natural-convection loop, withvelocities in the order of 0.4 m/s that change their direction under the influence of different injections.
Relevant experimental conclusions are summarized in Reference 45:
• Large-scale mixing can be effected by natural convection, provided a suitable geometry of wallsand openings and a steam or dry heat source in the lower part of such a geometry exists. Even ifthese conditions are fulfilled, stagnation periods without distinct convection can occur.
• Fluid injection can lead to either homogeneous or stable inhomogeneous conditions. • Steam condensation on structures can—in the long term—result in very distinct local accumulation
of air and other noncondensables (e.g., hydrogen). • Depending on the density difference between injected and existing steam–air mixtures, and on the
elevations of compartments and vent openings, the following behaviours were observed and aresummarized qualitatively in Figure 4.2.2.4-2: (1) A dense steam-air mixture (i.e., with high aircontent), injected into a low-elevation compartment "fills up" the injection compartment and theadjacent low-elevation compartments almost completely, whereas the lighter atmosphere isdisplaced upward. (2) A low-density mixture injected at the same site tends to immediately escapeupward into higher-elevation compartments and to slowly entrain the original atmosphere from theinjection compartment.
• Only zones participating in a large-scale convection loop show an approximately uniform steam-air
distribution. In stagnation zones, separated by partitions or stratification phenomena, differentcompositions can develop, as observed in the annulus compartment, because of (1) the injectionand "fill-up" process, described above, or (2) air and gas accumulation resulting from steamcondensation. (Former BMC tests demonstrated that this effect can even produce slight

79
stratification in a single-volume geometry within a period of a few hours without steam injection,after a long homogenization phase.)
An interesting result regarding leakage flows is that steam component of leakage flow should be neglected in themodelling of experiments because its energy is not released into the environment but into the containment wall.
Figure 4.2.2.4-1 Time history of CEC benchmark boundary conditions and observed flow loops
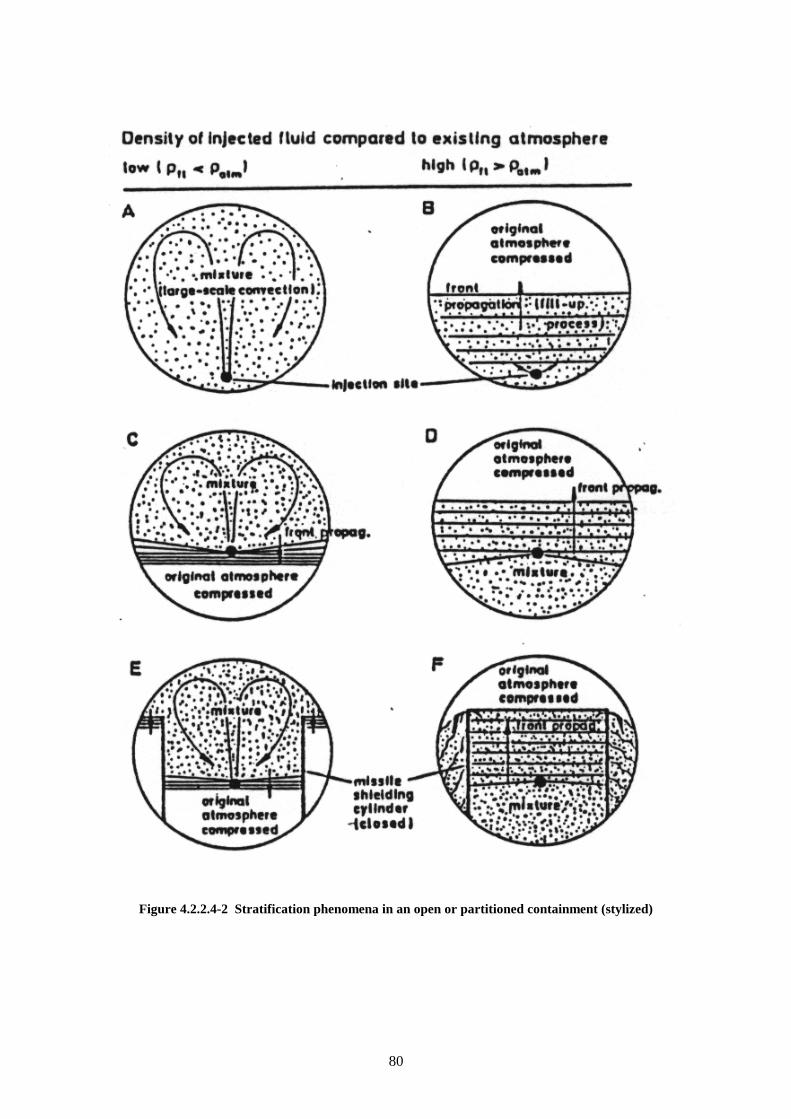
80
Figure 4.2.2.4-2 Stratification phenomena in an open or partitioned containment (stylized)
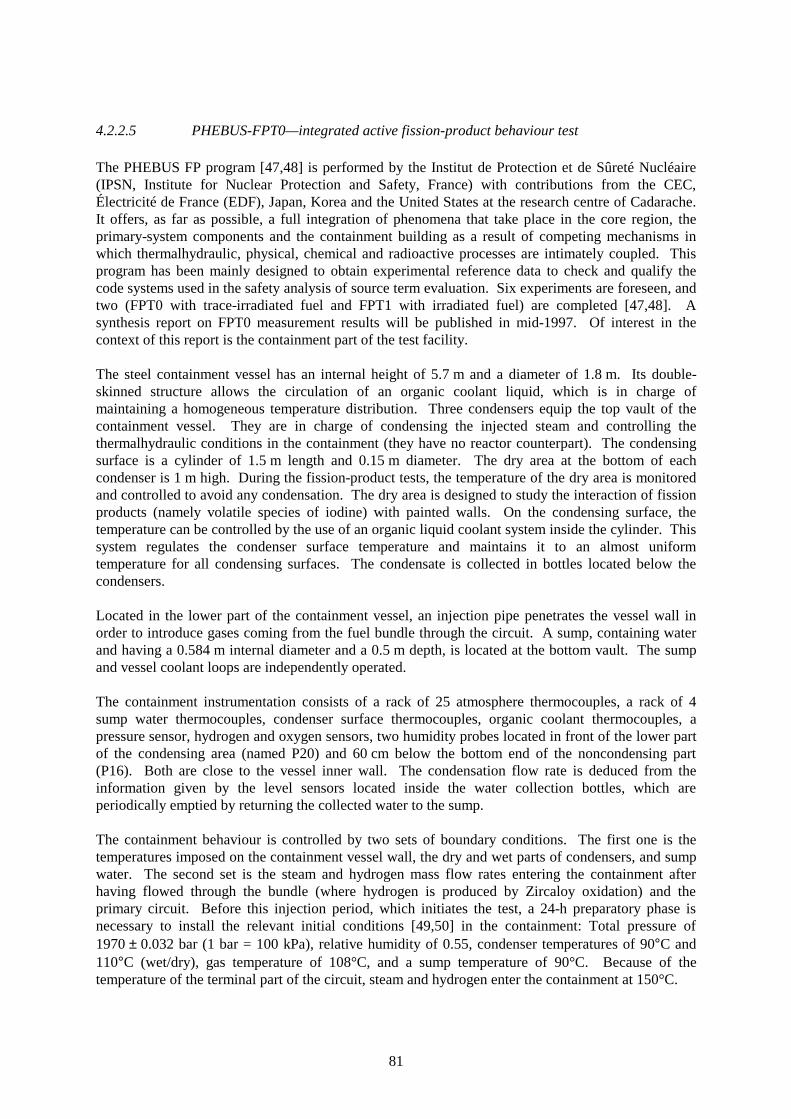
81
4.2.2.5 PHEBUS-FPT0—integrated active fission-product behaviour test
The PHEBUS FP program [47,48] is performed by the Institut de Protection et de Sûreté Nucléaire(IPSN, Institute for Nuclear Protection and Safety, France) with contributions from the CEC,Électricité de France (EDF), Japan, Korea and the United States at the research centre of Cadarache.It offers, as far as possible, a full integration of phenomena that take place in the core region, theprimary-system components and the containment building as a result of competing mechanisms inwhich thermalhydraulic, physical, chemical and radioactive processes are intimately coupled. Thisprogram has been mainly designed to obtain experimental reference data to check and qualify thecode systems used in the safety analysis of source term evaluation. Six experiments are foreseen, andtwo (FPT0 with trace-irradiated fuel and FPT1 with irradiated fuel) are completed [47,48]. Asynthesis report on FPT0 measurement results will be published in mid-1997. Of interest in thecontext of this report is the containment part of the test facility.
The steel containment vessel has an internal height of 5.7 m and a diameter of 1.8 m. Its double-skinned structure allows the circulation of an organic coolant liquid, which is in charge ofmaintaining a homogeneous temperature distribution. Three condensers equip the top vault of thecontainment vessel. They are in charge of condensing the injected steam and controlling thethermalhydraulic conditions in the containment (they have no reactor counterpart). The condensingsurface is a cylinder of 1.5 m length and 0.15 m diameter. The dry area at the bottom of eachcondenser is 1 m high. During the fission-product tests, the temperature of the dry area is monitoredand controlled to avoid any condensation. The dry area is designed to study the interaction of fissionproducts (namely volatile species of iodine) with painted walls. On the condensing surface, thetemperature can be controlled by the use of an organic liquid coolant system inside the cylinder. Thissystem regulates the condenser surface temperature and maintains it to an almost uniformtemperature for all condensing surfaces. The condensate is collected in bottles located below thecondensers.
Located in the lower part of the containment vessel, an injection pipe penetrates the vessel wall inorder to introduce gases coming from the fuel bundle through the circuit. A sump, containing waterand having a 0.584 m internal diameter and a 0.5 m depth, is located at the bottom vault. The sumpand vessel coolant loops are independently operated.
The containment instrumentation consists of a rack of 25 atmosphere thermocouples, a rack of 4sump water thermocouples, condenser surface thermocouples, organic coolant thermocouples, apressure sensor, hydrogen and oxygen sensors, two humidity probes located in front of the lower partof the condensing area (named P20) and 60 cm below the bottom end of the noncondensing part(P16). Both are close to the vessel inner wall. The condensation flow rate is deduced from theinformation given by the level sensors located inside the water collection bottles, which areperiodically emptied by returning the collected water to the sump.
The containment behaviour is controlled by two sets of boundary conditions. The first one is thetemperatures imposed on the containment vessel wall, the dry and wet parts of condensers, and sumpwater. The second set is the steam and hydrogen mass flow rates entering the containment afterhaving flowed through the bundle (where hydrogen is produced by Zircaloy oxidation) and theprimary circuit. Before this injection period, which initiates the test, a 24-h preparatory phase isnecessary to install the relevant initial conditions [49,50] in the containment: Total pressure of1970 ± 0.032 bar (1 bar = 100 kPa), relative humidity of 0.55, condenser temperatures of 90°C and110°C (wet/dry), gas temperature of 108°C, and a sump temperature of 90°C. Because of thetemperature of the terminal part of the circuit, steam and hydrogen enter the containment at 150°C.

82
Just 10 min before the gas injection, the wet condenser coolant temperature is decreased from the90°C value down to 74°C during a 31-min period and is then maintained at this value for the durationof the test. Regarding the containment behaviour when gases are entering this component, it isdivided into two phases corresponding to the bundle transient: a bundle preparatory phase and abundle transient. The mass flow rates to the containment [49] during these phases are summarized inTable 4.2.2.5-1.
Table 4.2.2.5-1 PHEBUS FPT0 containment injection rates [51]
MASS FLOW RATES TO CONTAINMENT
Bundle Preparatory Phase Bundle Transient
Steam (g/s) 0 0.5 0.5-3a 3 1.07b 3 3-1.5a 1.5
H2 (g/s) 0 0 0 0 0.21c 0 0 0
Duration (s) 46 113 16 14 7 28 38 66
a linear variationb Variation of the steam mass flow rate from 3 to 1.07 g, as a result of Zircaloy oxidation
(Zr + 2 H2O → ZrO2 + 2 H2) is deduced from the above indicated hydrogen flow rate.c average value deduced from hydrogen production over a 7-min-production period
Before the FPT0 test, several kinds of tests were conducted, such as 2 sump evaporation tests, testssimulating the loss of temperature control on containment walls, and thermal tests without steaminjection. The main part of this program was 40 thermalhydraulic steady states with constant steaminjection, thus offering a systematic experimental study of condensation in the geometry of thePHEBUS containment.
In addition to the thermalhydraulic conditions—such as the average gas temperature (Tgas),condenser surface temperature, and sump water average temperature—the average humidity ratioswere measured. The condenser mass condensation rates were also measured for 25 cases belongingto the 3 series.
These experiments have been used to test the three different condensation models—Chilton-Colburn,Collier, and Uchida—on steady-state conditions. Lumped-parameter analysis, using the JERICHOcode) [52,53] indicated that the Chilton-Colburn and Collier correlations are justified for the natural-convection-driven condensation heat transfer conditions that precede hydrogen release, but theUchida correlation is nonconservative, giving a lower-than-measured pressure. However, during thephase that follows the hydrogen injection, the predicted condensation flow rate is more reduced thanthe flow rate in the experiment. It is postulated that, in the experiment, hydrogen had stratified in theupper part of the vessel, but no measurements (only one sampling line) sustain this hypothesis.
The second test, FPT1, was run from July 20 to July 26 in 1996. It was identical to test FPT0, but thefuel was irradiated. The facility was identical to that of the FPT0 test, but the condenser was a littlewarmer than the FPT0 condenser (consequently the humidity level was higher). Improvements weremade concerning the determination of volatile iodine fraction, mass balance, and the chemicalspeciation. The work on the experimental results is ongoing.

83
The aim of the FPT4 test is the study of low volatile fission products and transuranian release from adebris bed. The fission-product chemistry in the containment will be limited because no structuralmaterials aerosols will be present, and because the fuel will not be re-irradiated (no short-life fission-product release). Consequently, it is proposed that the containment be suppressed in order to studythe effect of a molten pool formation on the fission-product release (FPT4S option). This test wouldbe run in 1999.
If the FPT4S option is chosen, the FPT2 test could be run during the same year. The objectives ofthis test are to obtain a degradation under starvation conditions and to study iodine behaviour usingan evaporating sump. These objectives will be completed by the study of the effects of the presenceof boric acid and the spray.
Test FPT5 is not completely defined today. The aim of this test is to observe the effect of a globaloxidization of the bundle. This bundle could be without a control rod.
4.2.2.6 HEDL stratification tests
The Containment System Test Facility (CSTF) is part of the Hanford Engineering DevelopmentLaboratory (HEDL). The experimental program was designed to study mixing of hydrogen bynatural and forced convection in a scaled-down compartment of a PWR ice condenser containment(linear scaling of 0.3) [54]. The facility is shown in Figure 4.2.2.6-1, where the sensor locations areindicated by stars. The CSTF vessel is a fibreglass-insulated, 1.69-cm-thick carbon steel cylinderwith 1.93-cm-thick dished heads. Overall vessel height is 20.3 m, with the cylindrical portion being16.5 m. Inside diameter is 7.62 m, for a total enclosed volume of 852 m3.
As shown in Figure 4.2.2.6-1, a well-instrumented annular test compartment with an inside diameterof 3.05 m and a height of 4.72 m is constructed with plywood and corrugated steel in the lower partof the vessel. Radial partitions close off a 60° sector of the annulus to give a volume of 151 m3. Theupper compartment, with a total height of 14.74 m, is unobstructed and has only one sensor locationnear its centre. A blower-and-vent system provides air recirculation between the two compartmentsby taking in air (or whatever combination of gases that are present) at the centre of the vessel in theupper compartment and discharging it to four vents suspended from the outside wall of the lower testcompartment. Twenty-four outflow vents, slotted cylindrical ducts suspended from the ceiling, aredistributed around the outer wall to allow return flow to the upper compartment. The tests werestarted from initial conditions by starting the recirculation blower, then opening the steam sourcevalve and adjusting it to the desired rate. After a short time, in the order of a minute, the hydrogensource is started.
Data for 11 tests are reported in Reference 55. The first four tests determined the separate andcombined effects of natural and forced recirculation on gas mixing in the test compartment with nosteam or source gas release. The remaining seven tests were hydrogen (1) or helium (6) mixing tests,using 3” nozzles at two different locations and orientations for the gas injection, under natural- andforced-recirculation conditions. The principal findings of the experiments are as follows:
• The compartment was well mixed, with maximum gas concentration differences of 3%by volume when the blowers were operational.
• Gas entrainment by the high velocity jet was the dominant mixing process during the
release period.

84
• Helium was an acceptable substitute for hydrogen. • Mixing characteristics were not strongly dependent on the orientation of the release jet.
The tests without forced circulation (HM-1 and 2) showed the largest gas stratification of up to 7.5%difference in helium concentration within the test compartment. This stratification occurred after theinjection period and resulted from the combination of steam condensation and the absence of activemixing mechanisms (injection jet or recirculation fans). Although deemed non-prototypic of icecondenser containment conditions, these tests are of interest to the area of long-term hydrogendistribution in a PWR severe accident. Unfortunately, the upper compartment was poorlyinstrumented, and any possible gas stratification that occurred there would have been missed by thetest measurements.
Figure 4.2.2.6-1 The CSTF vessel at HEDL
4.2.2.7 VICTORIA gas-mixing experiments—ice condenser containment circulation
The VICTORIA facility was constructed at the IVO Hydraulic Laboratory in Finland for studying icecontainment thermalhydraulics during SBLOCAs and severe accidents [56-58]. An important goalwas to support development of a new hydrogen management strategy for the Loviisa NPP (a VVER-440 reactor with ice condenser containment) in Finland.
The facility, shown in Figure 4.2.2.7-1, is a scale model of the Loviisa ice condenser containment,with a linear scaling factor of 1/15. The height of the vessel is thus 4.6 m and the diameter is 3.14 m.The free volume of the vessel is approximately 21 m3. The vessel was designed to withstand anoverpressure of 2 bar(g) (1 bar = 100 kPa). The model and the Loviisa ice condenser containmentsare geometrically similar. Concrete structures of the containment are also made of concrete in thescale model. All the large steel equipment inside the containment—i.e., primary circuit piping, steamgenerators, pressurizer, and pressure vessel—is modelled as dummy elements in the model

85
compartment. The Loviisa ice condenser containment is a double containment in which the pressureboundary of the containment is the free-standing cylindrical pressure vessel with a dome inside thesecondary containment. In the experimental vessel, the secondary containment is the pressureboundary. The model containment was insulated from all sides to minimize heat losses to theenvironment.
One could select from six different release locations when simulating the energy and gas release intothe lower compartment. Steam, water, and helium were released through a common adjustablenozzle. The ice condenser was built so that one of the ice condenser sections at a time could bemoved into or out from the model. Ice condenser lower inlet, intermediate deck, and top deck doorsand bypasses are modelled. The containment internal and external spray systems were also modelled.The external spray system is the long-term residual heat removal system in a severe accident, coolingthe containment through the dome steel shell.
Temperatures were measured inside the vessel at about 300 points (in air space, structures and icecondensers). Relative humidities were measured at 10 different locations. Total pressure, pressuredifferences between compartments, and water level height were also measured.
Helium was used as a hydrogen simulant. Helium concentrations in the VICTORIA vessel weremeasured using a new technique, an instrument called SPARTA (spark transient analyzer). Themethod being applied in SPARTA is based on emission spectroscopy, where a high-voltage spark iscreated between two electrodes in a gas mixture. The instrument and its different modes of operationare described in detail in Reference 59. Some applications and sampling arrangements are describedin References 60 and 61. In most experiments, helium concentrations were measured at 10 differentlocations. Local vertical flow velocities were measured at the ice condenser outlets in the uppercompartment with a fibreoptic laser Doppler anemometer system.
The experimental program consisted of three phases. In the first test phase in 1990-1992, icecondenser thermalhydraulics and ice-melting behaviour in SBLOCA scenarios were studied. Thesecond test phase (1993) consisted of experiments for validation of containment dome externalspraying heat transfer models. The third test phase, in 1994-1995, dealt with experiments designed tosupport hydrogen management strategy development for Loviisa (convective loop flow experimentsand hydrogen distribution experiments). Of particular interest were the global convective flowpatterns in the containment, as a consequence of forcing open the ice condenser doors during theexperiment, and the helium transport and mixing under these flow conditions.
The main results of the first test phase were that the ice tended to melt from the top downwards in allSBLOCAs and that the position of the ice condenser doors largely determined ice-melting behaviourand gas flow patterns in the vessel. The results of the second phase were used to validate heattransfer models applied when designing the dome external spraying system for long-term residualheat removal for the Loviisa NPP.
Findings from the third phase are discussed in References 60 and 61. The experiments indicated thata global convective loop flow developed (with forced-open ice condenser doors), with one icecondenser in upflow and the other one in downflow, even with an initially symmetric iceconfiguration. This circulation loop tended to be quite effective in mixing the injected helium withvolumes participating in the circulation. Mixing above the ice condenser outlet level in the uppercompartment was seen to be very effective in all experiments. This well-mixed region correspondedto about half of the upper compartment volume.

86
Figure 4.2.2.7-1 VICTORIA model of ice condenser containment
4.2.2.8 BMC long-term H2-mixing experiments (Biblis tests)
Verification experiments on hydrogen mixing by inherent natural convection in the short and longterm (up to 100 d) after a LBLOCA in the Biblis reactor were performed in the Battelle ModelContainment [62]. The goal of these experiments was to demonstrate the initiation and stability of anoverall natural-convection circulation under conditions of adverse temperature stratificationconditions (short term) and small favourable temperature differences (long term). The Bibliscontainment is represented by the rotationally symmetric BMC, with an inner region consisting of asump and a vertical chain of rooms, open to the dome region, and an outer annular region, also opento the dome and connected to the inner region by relatively restrictive openings near the floor.Temperature and velocity measurements were performed along the proposed circulation loop, in

87
addition to concentration measurements of injected hydrogen, to determine the convective flows intwo different test conditions.
In the short-term phase, an initial adverse temperature stratification exists, caused by preferentialheatup of the upper regions of containment from the break, which was generated in the BMCexperiments, as shown in Figure 4.2.2.8-1. Hydrogen measurements (Figure 4.2.2.8-2) show thatgood mixing is nevertheless obtained after about 30 min after each hydrogen injection phase. Duringthe hydrogen releases the sump temperature is above the atmospheric temperature; thus acombination of sump evaporation and the buoyancy of the injected hydrogen itself would contributeto an overall circulation with upflow in the centre and downflow in the annulus. Therefore, onecannot really talk about an “adverse temperature gradient” during the hydrogen injection phases.Velocities in this test were below the sensitivity of the turbine flowmeters.
In the long-term phase (several days after the LOCA) the atmospheric temperature is cooler than thesump temperature because of heat removal by the concrete structures. Measurements of flowvelocity, temperature, and hydrogen concentrations for this test are shown in Figures 4.2.2.8-3 to -5respectively. Clearly, the relatively high sump temperature drives a fast and effective convection (0.6to 0.8 m/s), which mixes the injected hydrogen almost instantly, despite the small (1 to 3 K)temperature difference between the centre and annular region. Peaks observed in the velocitymeasurements correspond to the hydrogen injection periods, showing the beneficial effect of theadded buoyancy on the convective flow. Excellent radial symmetry is maintained in these tests.
Although one might question the representation of actual short- and long-term (100 h) conditions of asevere accident in these relatively short experiments, these tests provide useful data for assessinghydrogen distribution under a range of boundary conditions. The simultaneous measurements ofconcentration, temperature and flow velocity in the long-term test, along with the well-knowncharacteristics of the facility, should prove useful for code validation, provided original detailed datacan be made available.
Figure 4.2.2.8-1 BMC temperatures during the “short-term phase” test

88
Figure 4.2.2.8-2 BMC H2 concentrations during the “short-term phase” test
Figure 4.2.2.8-3 BMC recirculation velocities during the “long-term phase” test

89
Figure 4.2.2.8-4 BMC temperatures during the “long-term phase” test
Figure 4.2.2.8-5 BMC H2 concentrations during the “long-term phase” test
90
4.2.2.9 MISTRA gas-mixing experiments (planned)
The MISTRA programme (MItigation and STRAtification) is part of the French R&D programmerelative to potential severe accidents that could occur in a PWR. It concerns, more particularly, theproblem of mastering the hydrogen risk with respect to the integrity of the containment, whose role isto prevent any release of radioactivity to the environment.
An arising international consensus is that improvement in nuclear reactor safety implies a betteraccountability of hydrogen risk in a severe accident. Therefore the prediction of local hydrogenconcentration becomes a key issue. This prediction, which is usually obtained with the lumped-parameter approach, is not always satisfactory. It is for this reason that during the past few yearsfield characteristic-finite-difference (CFD) codes, designed for containment thermalhydraulics, havebeen developed throughout the world (e.g., GASFLOW, GOTHIC, TONUS, etc.).
The use of multidimensional codes requires that they first be experimentally validated. The modelsused for the containment are conventionally set up from analytical experiments (examples given),concerning the following aspects: the structure of the flow (jet, plume, stratification, etc.),condensation in the presence of noncondensable gases, the spray-flow interaction, the combustion ofhydrogen, the recombiners, and the aerosol releases.
The correlations established from these experiments are more or less dependent on the experimentalconditions and cannot be simply extended to complex configurations (scaling effect). Moreover,these experiments may only validate separate physical phenomena. Thus more global experimentsare needed to validate the coupling of models.
Experiments have also been conducted for many years throughout the world to characterizecontainment behaviour in severe accident conditions. Analytical experiments have only addressedseparate effects without involving coupling, mid-global experiments have been performed to validatecooling concepts, and global experiments were originally designed to verify lumped-parameter codes.
The analysis made in France by the Commissariat à l’Énergie Atomique (CEA) concluded that thereis a need for a medium-scale experimental device (100 m3 vessel) specially designed to verifymultidimensional thermalhydraulic codes so as to obtain multidimensional measurements(temperature, velocity, concentration) and establish a link between separate-effects and globalexperiments by introducing step-by-step physical phenomena and their couplings. Existingexperiments are not well suited to the validation of multidimensional codes for the following reasons:
- They provide an insufficient spatial distribution of the measurement points in eachvolume and particularly in the dome.
- The facilities with thermally insulated steel walls, on which little condensation occurs,are not representative of the French PWR, whose containment is made of concrete.
- In facilities with concrete walls, the energy stored in the walls is preponderant, becauseof the important thermal capacity of the walls. This stored energy leads to a largeuncertainty in the gas behaviour, especially since the surface/volume ratio of the testfacility is higher than that of a PWR. Having concrete walls, therefore, gives excessiveimportance to the condensation phenomenon. Then, very important and unrealistic steaminjections would be necessary to simulate the pressure rise, and this modification wouldchange the nature of the flow.

91
- Finally, the measurements performed in these experiments are more oriented toward theconsequences (pressure, mean concentrations) than towards the causes (temperatures,velocities and fluxes at the wall).
In the MISTRA experiment, the wall temperature conditions will be imposed, thereby avoiding theproblems of similarity conditions on thermal inertia of walls and surface/volume ratio.
Moreover, the temperature being the primary variable both for the computations and themeasurements, it is better to impose boundary temperature conditions rather than flux conditions forthe validation of codes. It is then possible to simulate, with a scale reduction, different scenarios anddifferent containments in a same facility.
To summarize, the main objective of the MISTRA programme is to establish a relationship betweenelementary experiments and global experiments in order to validate the multidimensional codes, thusfulfilling a need in the international programs.
The MISTRA facility comprises
- an external insulated containment of about 90 m3 (height ≈7 m, diameter ≈4 m) designedfor a pressure of 5 bars and a temperature of 150°C;
- a sump equipped with a heater to simulate the vaporization of water caused by thepresence of fission products in the sump, or to the spraying of the core-melt;
- a temperature-regulated internal envelope simulates the containment walls;
- compartmented internal structures with regulated temperatures are intended to simulatethe containments internal compartments;
- a spray device, for an injection of helium and an injection of steam;
- heat exchanger intended to simulate the condensers that are possibly used in a PWRcontainment as a means of pressure and temperature reduction; and
- the different temperature regulation circuits.
The internal partitions are modular: according to the type of test, it will be possible to install or toremove modules. Two types of measurements will be performed:
- integrated measurements to evaluate pressure, mean flow rate between compartments,mean thermal flux on a wall, condensed flux, etc.;
- local measurements of velocity, temperature, concentration of gases, thermal fluxes, etc.,to reconstitute the different flow fields to be used in the validation of multidimensionalcodes.
The instrumentation will be suited to each type of test and will take into account the presence ofsteam and mist. Pressure, temperature, heat flux, concentration, velocity, condensation rate, relativehumidity, and suspended water mass (mist) will be measured.

92
The program proposal, which has been set up for the purpose of model validation, defines
a. a gradation in the physical phenomena representation, from isolated phenomena up tocoupled phenomena. For instance, the following series of tests will possibly be conducted:
- injection of a noncondensable light gas having the same density as steam,
- injection of steam without condensation,
- injection of steam with wall condensation or bulk condensation, and
- injection of steam and helium with wall condensation and spray.
b. a two-step progression is planned to spread out the overall investment:
First step: containment with thermally insulated external walls
In this configuration, some important thermalhydraulic phenomena such as natural convection,stratification, and mitigation effects are studied. Although not all similarity conditions are met, itwill be possible to assess the influence of mitigation systems (spray, condensers) in realisticconditions. Indeed, when these systems are in operation, wall condensation becomes negligible.
Second step: containment with temperature-controlled walls
In this configuration, the similarity conditions are met because the evolution in time of the differentwall temperatures can be imposed.
The experimental facility is expected to be in operation for the period 1998-2002.
The main features of the MISTRA Facility are as follows: temperatures are imposed by sectors onthe walls, instrumentation can validate the multidimensional codes by enabling field mappingmeasurements, a modular design (modification of internal dispositions) that allows an easyutilization, and a typical test duration is 1 d.
A first MISTRA workshop was organized, at the end of 1996, in France (CEA, Saclay) in which theprogram was presented in detail and where a benchmark exercise was proposed for field codes, inpreparation for one of the first tests. This exercise, which will be fully specified by late 1998, is alsoopen to organizations that could not attend the Saclay meeting.
4.3 Separate Effects—Plume Behaviour
4.3.1 NUPEC Experiment M-2-2—Gas Distribution in Model Containment
NUPEC Test M-2-2 was performed in NUPEC’s one-quarter linear-scaled model containment,described in Section 4.2.1.3 [27,63]. The objective of this test was to investigate only light-gasinjection effect on the natural circulation phenomena in a containment vessel, for comparison withthe M-4-3 test (described in Section 4.2.2.2) in which helium gas and hot steam were injectedsimultaneously. Test conditions are summarized in Table 4.2.1.3-1 of Section 4.2.1.3. The injectionlocation was at a low elevation in the steam generator foundation compartment CV 8, and a constant

93
helium gas flow rate was used for the test period of 30 min. The injected gas temperature was nearlythe same as that of the containment atmosphere, so that thermal effects were minimized.
Figure 4.3.1-1 shows the helium concentration transient in each compartment. Because there was notemperature difference between injected helium and the atmosphere, the driving forces for the naturalcirculation in the containment were the momentum of the injected gas and its buoyancy. Therefore, aless-well-mixed environment was observed compared with that of the M-4-3 test results. Thecompartments—CV 8, 15 and 21, which included the helium gas release compartment—exhibitedhigher concentrations than the remaining compartments during the gas injection. The dead-end andcomplex-shaped compartments—CV 16, 22 and 1—registered remarkably lower concentrations thanthe other compartments. A slight concentration stratification was observed.
Figure 4.3.1-1 Helium concentrations in test M-2-2
4.3.2 Whiteshell Liquid and Gas-mixing Tests
In an attempt to establish simple scaling parameters for hydrogen mixing under the influence ofbuoyancy-, jet momentum-, and fan-induced mixing, small-scale tests were performed in whichhelium was injected into a 1.8-m cubic air-filled enclosure, shown schematically in Figure 4.3.2-1,and saltwater was injected into a geometrically similar, scaled-down (0.3 m), freshwater-filledenclosure [64-66]. This study purposely neglected heat transfer and multiphase effects to simplifythe scaling problem of a containment, presented in Section 4.1.1. Experimental results indicated thatthe additional complicating factor of using fluids with different properties (specifically the densityratio) was insignificant. A set of scaling laws, which preserve Fr and Gr, was developed andconfirmed by the experiments, showing that the buoyant-jet mixing is not dominated by a singlescaling parameter. However, it was also shown that jet- and fan-induced mixing dispersed the fluidsquickly to form a well-mixed atmosphere, rendering the concentration measurements insensitive tochanges in Fr and Gr. A plume model was developed [67], using these results, showing that buoyant

94
gas plumes spread significantly faster than did pure thermal plumes of comparative densitydifference, resulting in faster homogenization of the atmosphere.
Further tests on helium–air mixing, with improved concentration measurements, were performed toassess the GOTHIC code’s 3D modelling of gas mixing for a buoyant jet [68]. Tests with slowbottom, side, and top injection showed that stable concentration gradients (stratification) persist in anundivided enclosure and in a vertically divided enclosure in the absence of fan- or jet-momentuminduced mixing. This program is ongoing, and tests are currently performed in a former shieldedloop room (“C-Bubble”) of the decommissioned WR-1 reactor at the Whiteshell Laboratories [69].The gas-mixing facility is a large (1000 m3) rectangular enclosure, with 45-cm reinforced concretewalls, shown in Figure 4.3.2-2. Similar to the smaller-scale facilities, it has 10 moveable heliumconcentration probes and flow visualization capability. In the first series of tests, helium was injectedinto air at various elevations with different momentum to evaluate the mixing resulting from a largebuoyant gas plume. As an example, with a jet velocity of 14.3 m/s, injected vertically near the floor,the plume-centre concentration decreases rapidly from 55% (0.6 m above the break) to 5% (3 mabove the break) and less than 2% near the ceiling. This dilution is due to turbulent entrainment ofthe surrounding air and results in a well-mixed top half of the compartment. No helium is detected inthe bottom half during the test period of 10 min.
Tests planned for the near future will include the effects of obstructions, jet momentum, jet elevationand orientation, presence of steam, air cooler action, etc. on the mixing process. The facility has asimple geometry and well-characterized boundary conditions; its instrumentation is intended to giveconcentration and temperature field information for generic 3D code validation.
Figure 4.3.2-1 WL small-scale gas mixing enclosure, showing probe locations
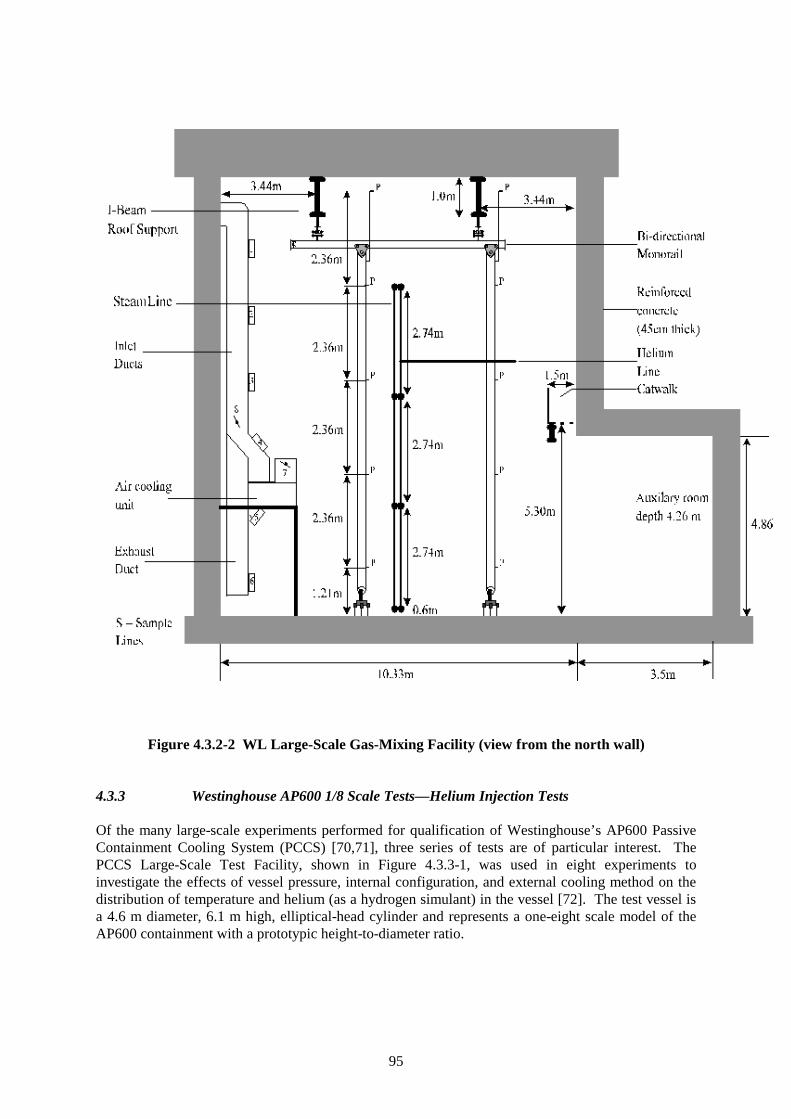
95
Figure 4.3.2-2 WL Large-Scale Gas-Mixing Facility (view from the north wall)
4.3.3 Westinghouse AP600 1/8 Scale Tests—Helium Injection Tests
Of the many large-scale experiments performed for qualification of Westinghouse’s AP600 PassiveContainment Cooling System (PCCS) [70,71], three series of tests are of particular interest. ThePCCS Large-Scale Test Facility, shown in Figure 4.3.3-1, was used in eight experiments toinvestigate the effects of vessel pressure, internal configuration, and external cooling method on thedistribution of temperature and helium (as a hydrogen simulant) in the vessel [72]. The test vessel isa 4.6 m diameter, 6.1 m high, elliptical-head cylinder and represents a one-eight scale model of theAP600 containment with a prototypic height-to-diameter ratio.
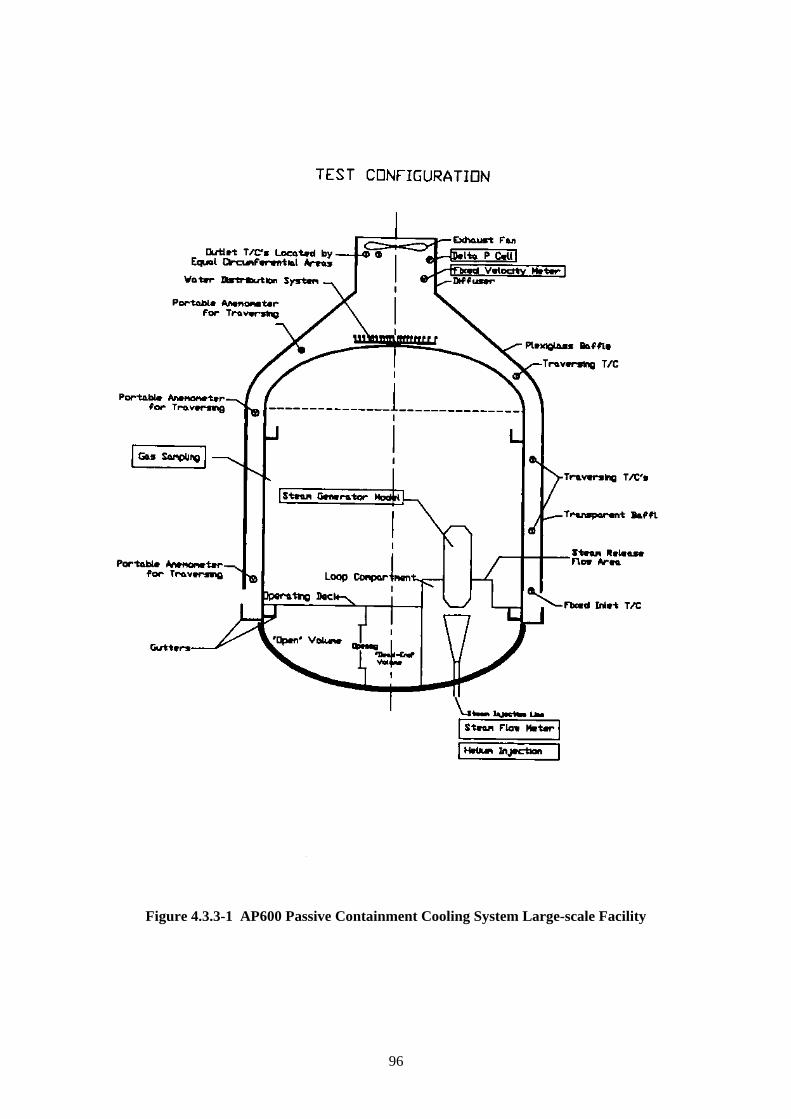
96
Figure 4.3.3-1 AP600 Passive Containment Cooling System Large-scale Facility

97
Tests with and without internal compartments and heat sinks were performed with high- and low-velocity steam and with helium injection periods. Internal temperature and helium concentrationdistributions were measured by sensors mounted approximately 25 mm from the inside of the testvessel wall and on movable racks throughout the inside of the vessel, but were reported as averagedvertical profiles in Reference 72. Anemometers were used in two of the tests to measure internalvelocities in the dome and near-wall regions.
The system was at steady-state conditions (steam injection rate equals condensation, and constantpressure) when approximately 15 mole percent of helium was injected through the steam line.Results presented in Reference 72 show initial stratification periods of about 1 h for external air-cooled and 2 h for external water-cooled tests. The faster redistribution (mixing) in the wet tests isrationalized with more vigorous convective motions inside the vessel because of larger surface heatremoval.
4.3.4 BMC Hyjet Experiments
The Hyjet experiments were a series of eight helium or helium–steam jet injection tests, performed inthe BMC Facility [73]. Helium was used as a hydrogen simulant. Three nozzle diameters (30, 95and 300 mm) were used to obtain jet velocities ranging from 0.4 m/s (purely buoyant plume) to730 m/s (momentum-dominated jet). Figure 4.3.4-1 depicts the jet location in the BMC Facility. Theprimary objective of this series of tests was to investigate, in detail, the gas-mixing process in therelease region on a meaningful scale under a range of conditions; in particular the mixing of the H2-rich released fluid with the air-rich ambient atmosphere, which could lead to dangerous mixtures, wasinvestigated.
Figure 4.3.4-1 Location of jet in BMC vessel

98
Instrumentation of these tests was extensive near the released jet, to facilitate comparison withdetailed CFD code calculations but not detailed enough to resolve the full concentration profile of thejet. It was more sparse in the remaining compartments. One cannot, therefore, consider thisarrangement as a full 3D instrumentation of the facility, but the resolution in the releasecompartments is adequate for a detailed 3D assessment of the mixing process. Measurement of the(dried atmosphere) helium concentration was done using 32 conductivity probes, which werecalibrated before and after each test; the probes were remotely located, thereby resulting in a 30-sdelay time. The measured data were corrected to account for steam content of the containmentatmosphere, by using the relative humidity measurements. Along with conventional measurements ofatmosphere and structure temperatures, the convective flows between rooms of the containment weremeasured using turbine anemometers with direction indication. This approach allowed thequantitative evaluation of the overall convection loop and the air–steam entrainment flows into therelease compartments (R5 and R6) using mass balances.
The released helium–steam jet entrains the surrounding atmosphere, thereby reducing the gasconcentration along its axis. The mixing ratio was determined by two methods, one employing themeasures axial concentrations in the jet, the second using the mass balance over the release rooms.Both lead to the same conclusions: (1) although a higher release velocity increases the mixing ratio,the confining walls and the throttling through the inflow openings restrict the dilution to well belowwhat is expected for a free jet; (2) small release velocities can lead to a stratified containmentatmosphere away from the release compartment, and this stratified condition reduced the mixing ratiofor subsequent tests; (3) doubling the density difference between the jet and the atmosphere did notaffect the mixing behaviour.
In general, the injection of pure helium into a stagnant or slightly convective “dry” atmosphere leadsto stagnant, stratified conditions, with up to 16% helium in the dome and very little in the lowerregions, despite the low injection location and the potential for convective loops through the roomchains. However, with a 40% steam atmosphere, significant convection flows exist prior to thehelium–steam injection; these flows promote gas mixing and diminish concentration differences thatexist during the injection period.
By considering the helium deflagration regimes, the following recommendations were made. In thearea of the helium release point, zones of dangerous helium–steam–air mixtures can develop bymixing of released helium–steam fluid with the existing air–steam atmosphere. The size of thesezones can be minimized under the following conditions: (1) high steam content in the released andambient mixtures, (2) release within a compartment of not too large a volume and with sufficientlylarge inlet and outlet flow cross-sections, and (3) high flow velocity of the released fluid (momentum-dominated jet). The two latter conditions result in high entrainment of the H2 lean ambientatmosphere by the H2-rich jet; the Hyjet tests showed jet entrainment factors up to 20. In most Hyjetexperiments, a marked stratification developed with a high gas volume fraction in the uppercontainment regions, and very small gas volume fractions in the lower zones. However, as long asintensive premixing occurred in the release region, the development of dangerous mixturecompositions in the containment dome could be avoided.

99
4.4 Recombiner Experiments
4.4.1 Battelle Recombiner Qualification Tests
Three types of recombiner designs were tested in multicompartment configurations in the BMCvessel: the NIS design (palladium-plated hydrophobic porous plates), the Siemens design (platinum-plated hydrophobic stainless steel plates), and a smaller recombiner prototype. Results with respectto recombiner performance are summarized in Reference 74, and details on a scaled-down Siemensprototype recombiner qualification (G-tests) are given in Reference 75, and the NIS design inReference 76. Measured flow velocities in the recombiner modules were between 0.5 and 1 m/s,indicating a significant momentum source and thus influence on containment thermalhydraulics underfree-convective conditions, which are expected in the long term after a severe accident. Observationsin the BMC vessel with all recombiner modules showed a global convection loop as a result of thebuoyant recombiner exhaust gases.
Tests Gx4 to Gx7 [75] investigated the performance and effect of a catalytic recombiner in amulticompartment geometry (5 inner rooms of the BMC) under conditions of stratified andhomogeneous steam–air–hydrogen atmospheres. With the recombiner installed in an elevated room,the hydrogen injection was varied between low- and high-elevation compartments. Injection ratesrepresented twice the expected long-term hydrogen release rate (scaled down by volume) in a typicalGerman PWR. Test results showed a dependence of the vertical mixing of hydrogen in theatmosphere to the existing density stratification. Whereas the horizontal mixing was intensive in alltests, vertical transport of hydrogen is often (not in test Gx4) inhibited by a stratified atmosphere, andthus mixing is delayed. Tests Gx5 and Gx7 had high-density stratification (up to 7% differencebetween upper and lower rooms in test Gx7) and showed a strongly de-coupled behaviour betweentop and bottom compartments, no matter whether hydrogen was injected into a top or a bottomcompartment. With the recombiner in a top compartment and hydrogen injection into the samecompartment, nearly no hydrogen was transported into the lower compartments; however, whenhydrogen was injected into a lower compartment, the local ignition limit was reached within 1 h,whereas the recombiner in the elevated compartment saw only little hydrogen. The vertical hydrogenconcentration gradient was stable, and hydrogen removal in the lower rooms (i.e., vertical mixing)was only achieved slowly (~15 h), and only after steam injection was stopped, allowing a naturalcooldown of the atmosphere and structures.
Tests reported in Reference 76 are similar, with a similar objective, namely to demonstrate theperformance of a catalytic recombiner (NIS design) in a multicompartment configuration of the BMCvessel. Results concentrate on recombiner performance parameters rather than on the effect oncontainment thermalhydraulics and hydrogen distribution, but an additional contribution from thiswork is the inclusion of all rooms of the BMC vessel, including the dome and annular ring volume,which were excluded in tests described in Reference 75.
4.4.2 Whiteshell Recombiner Qualification Tests
Along with determining the performance parameters of the AECL-developed recombiner undernatural-convective conditions, its effect on the mixing of gases in its vicinity was measured in highlystratified but isothermal, hydrogen–air atmospheres inside a 10-m3 cylindrical pressure vessel [77].The stable hydrogen concentration gradient was broken within a few minutes after startup of the
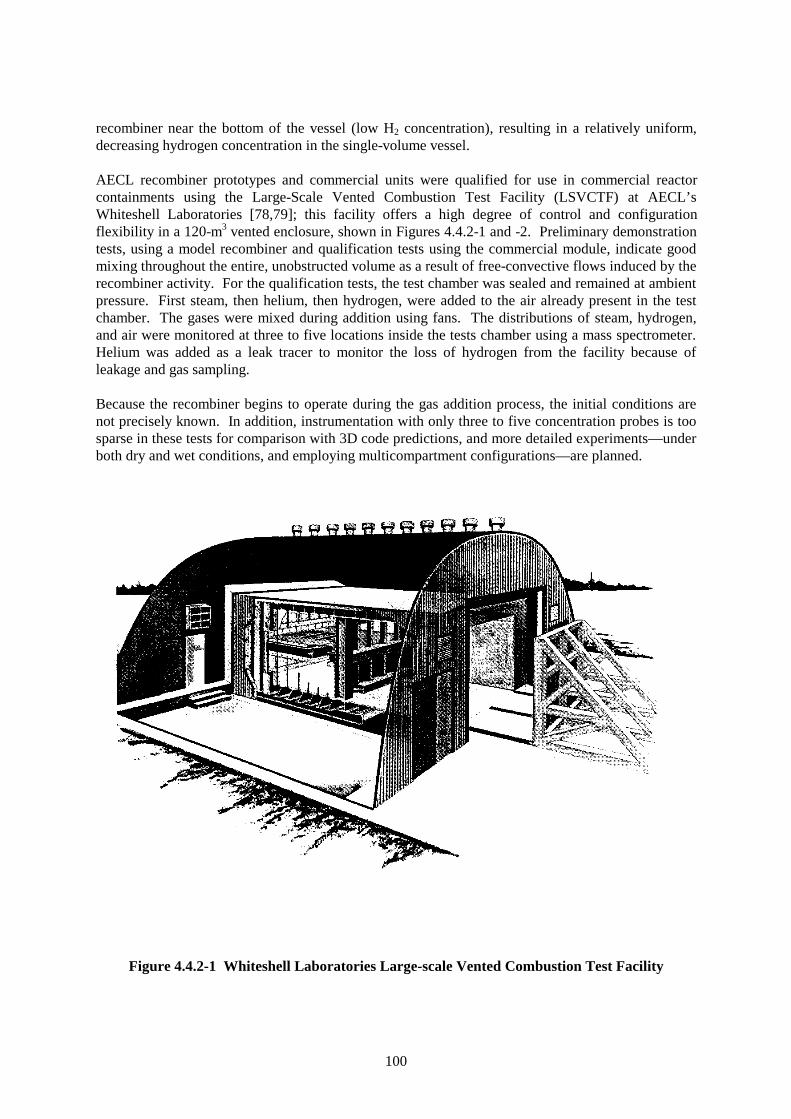
100
recombiner near the bottom of the vessel (low H2 concentration), resulting in a relatively uniform,decreasing hydrogen concentration in the single-volume vessel.
AECL recombiner prototypes and commercial units were qualified for use in commercial reactorcontainments using the Large-Scale Vented Combustion Test Facility (LSVCTF) at AECL’sWhiteshell Laboratories [78,79]; this facility offers a high degree of control and configurationflexibility in a 120-m3 vented enclosure, shown in Figures 4.4.2-1 and -2. Preliminary demonstrationtests, using a model recombiner and qualification tests using the commercial module, indicate goodmixing throughout the entire, unobstructed volume as a result of free-convective flows induced by therecombiner activity. For the qualification tests, the test chamber was sealed and remained at ambientpressure. First steam, then helium, then hydrogen, were added to the air already present in the testchamber. The gases were mixed during addition using fans. The distributions of steam, hydrogen,and air were monitored at three to five locations inside the tests chamber using a mass spectrometer.Helium was added as a leak tracer to monitor the loss of hydrogen from the facility because ofleakage and gas sampling.
Because the recombiner begins to operate during the gas addition process, the initial conditions arenot precisely known. In addition, instrumentation with only three to five concentration probes is toosparse in these tests for comparison with 3D code predictions, and more detailed experiments—underboth dry and wet conditions, and employing multicompartment configurations—are planned.
Figure 4.4.2-1 Whiteshell Laboratories Large-scale Vented Combustion Test Facility
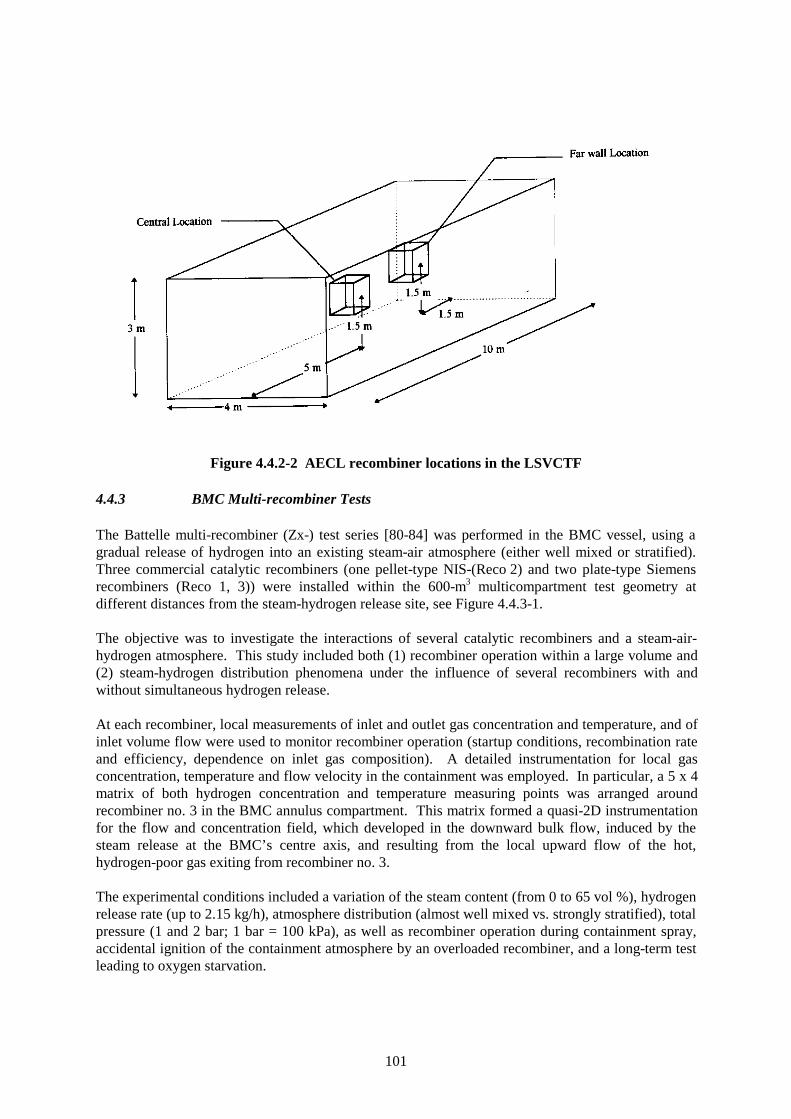
101
Figure 4.4.2-2 AECL recombiner locations in the LSVCTF
4.4.3 BMC Multi-recombiner Tests
The Battelle multi-recombiner (Zx-) test series [80-84] was performed in the BMC vessel, using agradual release of hydrogen into an existing steam-air atmosphere (either well mixed or stratified).Three commercial catalytic recombiners (one pellet-type NIS-(Reco 2) and two plate-type Siemensrecombiners (Reco 1, 3)) were installed within the 600-m3 multicompartment test geometry atdifferent distances from the steam-hydrogen release site, see Figure 4.4.3-1.
The objective was to investigate the interactions of several catalytic recombiners and a steam-air-hydrogen atmosphere. This study included both (1) recombiner operation within a large volume and(2) steam-hydrogen distribution phenomena under the influence of several recombiners with andwithout simultaneous hydrogen release.
At each recombiner, local measurements of inlet and outlet gas concentration and temperature, and ofinlet volume flow were used to monitor recombiner operation (startup conditions, recombination rateand efficiency, dependence on inlet gas composition). A detailed instrumentation for local gasconcentration, temperature and flow velocity in the containment was employed. In particular, a 5 x 4matrix of both hydrogen concentration and temperature measuring points was arranged aroundrecombiner no. 3 in the BMC annulus compartment. This matrix formed a quasi-2D instrumentationfor the flow and concentration field, which developed in the downward bulk flow, induced by thesteam release at the BMC’s centre axis, and resulting from the local upward flow of the hot,hydrogen-poor gas exiting from recombiner no. 3.
The experimental conditions included a variation of the steam content (from 0 to 65 vol %), hydrogenrelease rate (up to 2.15 kg/h), atmosphere distribution (almost well mixed vs. strongly stratified), totalpressure (1 and 2 bar; 1 bar = 100 kPa), as well as recombiner operation during containment spray,accidental ignition of the containment atmosphere by an overloaded recombiner, and a long-term testleading to oxygen starvation.

102
4.4.3.2 Findings from the local measurements at the recombiners
Influence of containment atmosphere distribution and flow regimeOutside atmosphere temperature stratification affects the chimney effect within the recombiner, andreduces volume flow and recombination rate. To a smaller extent, volume flow through therecombiner is also influenced by outside bulk flow.
Accidental ignition by an overloaded recombinerIn general, test conditions had been chosen for which no ignition could be expected (sufficiently lowhydrogen concentration or high steam content). However, during one of the multi-recombinerexperiments performed with a stratified atmosphere, a small additional hydrogen release at the lowerrelease point (Figure 4.4.3-1) into a locally air-rich atmosphere led to a certain accumulation ofhydrogen (7.6 vol % H2, at 13 vol % steam) in the neighbourhood of the release site and recombinerno. 1. As a result, the recombiner became overloaded, its catalyst heated up excessively, and ignitedthe adjacent hydrogen-rich zone. Subsequently, a flame propagated upwards and was quenched afterentering into the steam-rich containment dome. The combustion process, a benign deflagration,caused a very moderate pressure transient, and more importantly, a global revolution of the initiallystratified containment atmosphere. The recombiner remained undamaged.
Hydrogen recombination during containment sprayingSpraying was started with the recombiners operating. The recorded data suggest an increase ratherthan a reduction of recombiner volume flow and recombination rate by the spray.
4.4.3.3 Findings from the containment atmosphere data
Development of a well-mixed or a stratified containment atmosphereSteam release at a central close-to-bottom position induced a buoyancy-driven ascendant flow withinthe central compartment to the dome and a descending flow in the adjacent outer annulus. The ventopenings between the lower zones of the annulus and central compartment limited the backflow andthus the degree of homogeneity of the resulting almost well-mixed atmosphere. In contrast, steamrelease at the upper site (of Figure 4.4.3-1) led to a steam-rich, mixed atmosphere only in the domecompartment, whereas an air-rich, cold atmosphere remained in the lower containment zones.Subsequent hydrogen release (at the same locations as steam) led to an almost uniform hydrogendistribution in a well-mixed atmosphere. In a stratified atmosphere, it resulted in hydrogenaccumulation in the upper steam-rich zone for the short term; in the long term, after termination ofgas injection, hydrogen migrated to the lower cold areas.
Stability of a stratified atmosphereOnce established, the stratified steam-air atmosphere was very stable, aided by the thermal inertia ofthe adjacent concrete structures. In steady state, a stratified atmosphere is characterized by acontinuous weak steam flow from the upper steam release point to the cold concrete structures mainlylocated at a low elevation. This continuous steam flow entrains a certain portion of noncondensables,hydrogen and air, which, after condensation of the steam at the cold structures, accumulate in thelower containment zones. As a consequence (1) the steam-air stratification is stabilized, and (2) thehydrogen distribution gradient slowly becomes inverted.
Effect of recombiner operation on atmosphere stratificationThe measured data revealed only a gradual breakup of an existing atmosphere stratification by the hotexhaust gas of a recombiner. It is expected that this effect will be more marked in a full-size plantbecause of its higher ratio of containment volume (and recombiner capacity) to concrete structuresurface area.

103
Effect of containment spray on atmosphere distributionSpraying in the annulus compartment effected strong cooling and very efficient mixing of thestratified atmosphere. A global convection developed, which included also containment zones notdirectly hit by the spray water.
Figure 4.4.3-1 Configuration of the BMC for the Zx series multi-recombiner tests
4.5 Summary of Experimental Conclusions
The conclusions drawn from recent experimental activities are based primarily on experiences gainedand recommendations made in the framework of ISP exercises (category 1), complemented byimportant findings from other integrated experiments and SETs on plume behaviour (category 1 and2). This ranking reflects the level of international peer review, availability of documentation, andcharacterization of measurement uncertainties. Although other experiments have generally beencarefully performed and analyzed, ISP exercises have shown that often post-test code calculation canreveal unexpected experimental errors and uncertainties, leading to a better understanding of the testfacility in question (e.g., HDR vessel “gap venting” and overall energy balance).
The need to use tracer gases to assess hydrogen behaviour in a containment instead of relying ontemperature and humidity measurement was already realized in ISP 23, and applied during the long-term period of T31.5 and in the following E11 series of HDR hydrogen distribution tests. Forty-fiveH2 sensors were applied throughout the HDR facility with the same number of steam–air
104
concentration sensors, and thermocouples in their immediate vicinity. The transient measurement ofgas concentrations throughout a multicompartment containment is a better and more direct indicationof gas transport (mixing) processes than the measurement of the temperature field and also serves asan additional parameter for code comparison. This recommendation was further supported byanalysis of separate-effects helium-in-air plume behaviour experiments showing that buoyant gasplumes spread significantly faster than did pure thermal plumes of comparative density difference,resulting in faster homogenization of the atmosphere. Most experiments used helium or a highlydilute hydrogen–helium mixture, for safety reasons, as a hydrogen simulant—or deuterium in the caseof heavy-water-cooled reactors (CANDU). Because the molecular weight and thermal properties ofhelium and hydrogen are very similar (those of helium and deuterium are almost identical), theirmixing behaviour in air or air–steam mixtures is expected to be very similar. This similarity has beendemonstrated in the HEDL stratification tests.
The measurement techniques for hydrogen (or helium as a simulant) have progressed from usingcatalytic sensors with a relatively high measurement uncertainty, especially when measuring a dilute15% hydrogen–85% helium mixture, to highly accurate gas sampling devices, based on massspectrometry or gas chromatography, that can measure various gas components simultaneously. Thiscapability has allowed the use of pure helium in recent experiments. As with all sampling methods,the effect of steam, which is usually condensed out before the sensor, must be accurately accountedfor it typically represents the largest uncertainty with this type of measurement. To overcome thisproblem, helium concentrations in the VICTORIA vessel were measured with a new technique. Themethod being applied in SPARTA (spark transient analyzer) is based on emission spectroscopy,where a high-voltage spark is created between two electrodes in a gas mixture. High accuracy isclaimed for mass spectrometry and emission spectroscopy methods.
Whereas temperature measurements are generally adequate using the traditional method ofthermocouples, attempts to measure the typically low flow velocities have often failed or have veryhigh uncertainties. Turbine flowmeters have a relatively high startup threshold and are dependent onthe a priori knowledge of flow direction. The hot-wire flowmeters used in ISP 35 proved unreliablein the wet conditions. A laser Doppler anemometer system has the potential of measuring smallvelocities in any direction, but they rely on particles being present in the flow (droplets, aerosols,smoke) and may require expensive fibre optics (like those used in the VICTORIA tests) to “see” thedesired measurement location. The recent Hyjet experimental series reported good success in usingturbine flowmeters with direction indicators to measure flow rates through openings between roomsdown to 0.2 m/s. No successful measurement of low flow velocities in open rooms has been foundthus far. It is expected that such measurements will rely on flow-visualization techniques, which canbe quantified by image analysis, in the near future.
The number and location of measurement points in ISPs and most other integrated experiments werewell suited for lumped-parameter code analyses. As such, typically one or very few measurementlocations per room (temperature, concentration, humidity) and a few more surface measurementlocations (e.g., for temperatures and heat transfer rates) were available. Attempts at measuring localvelocities, very important for gas distribution code validation, have generally failed, including in thelast two ISPs.
Except for HMS in ISP 23 and WGOTHIC in ISP 35, no field codes participated in the ISP exercises,but some ISPs were re-analyzed in some cases with field codes, such as GASFLOW providing usefulresults. However, it cannot be said that they serve well as a proper validation base for these codes.All ISP exercises were complicated and limited in detail in the specification of boundary conditionsand uncertainties by experimental ability. A perpetual recommendation from ISPs was the desire forbetter characterization of thermal boundary conditions and specification of energy balances and their

105
errors and uncertainties. This point has improved throughout the ISPs with the NUPEC Facility inISP 35 being a much simpler and better specified vessel than HDR. Shortcomings in the BMC vessel(large unknown leakage) required scenario non-typical test interventions, namely air injection phases,representing somewhat a step back in facility “quality” in ISP history. Nevertheless, ISPs have animportant place in a code validation matrix for both, lumped-parameter and field codes, but can onlybe considered for code validation after SETs (individual phenomena) have been successfullysimulated and scaling issues addressed.
Since the use of field codes in containment analysis is increasing internationally, but all ISPs oncontainment thermalhydraulics were primarily modelled by lumped-parameter codes, there is a needto select an ISP exercise, or at least an international numerical benchmark exercise, specificallydesigned for field code comparisons. Such an experiment could not be as complicated as previousISPs because the need for field-oriented instrumentation and boundary condition specification wouldlead to an unmanageable volume of data. On the other hand, a meaningful scale must be maintained,because important phenomena (such as buoyancy-induced gas mixing and heat transfer) are scale-dependent. Planned tests in the new Large-scale Gas-mixing Facility at the Whiteshell Laboratoriesor the MISTRA Facility have such objectives and are possible candidates for such exercises withinthe next few years. The important phenomenon of gas mixing near buoyant and momentum-dominated jets has been investigated recently by the BMC Hyjet tests, providing detailedmeasurements for field code evaluation. A benchmark exercise on one of these tests (JX7) includedthree field codes (CFX, GASFLOW, GOTHIC), and more such benchmarks are recommended toincrease the validation base of field codes for plant analysis.
The scaling issue is as important for integral tests as for SETs, to correctly represent importantphenomena. For example, the use of area scaling of the water spray in ISP 35 resulted in anunrealistic domination of the spray-induced gas-mixing phenomena, thus “drowning” otherphenomena, which are dominant in the other NUPEC gas distribution experiments. Two otherNUPEC tests of the same series used volume-scaled sprays (4 times less water flow), but the resultsare not available for this report. Clearly, a volume-scaling is preferred for any mass additions tocontainment.
Most experiments discussed in this chapter adopted the “time-preserving”, but “geometry scaled-down” scaling principles. Therefore, even if distortions from initial and boundary conditions andfrom event sequences can be avoided through careful design and operation of the tests, the scale andgeometry of the particular facility invariably introduce distortions in certain phenomena. Thesedistortions can lead to over- or under-emphasis of certain phenomena over others. For example, theabsence of long-term heat sinks (thick concrete structures) in some test facilities would not sustainthe phenomenon of buoyancy/wall interaction (regional) in the long term. Conversely, the largeheight-to-diameter ratio of the HDR containment would tend to overemphasize this phenomenon, ascompared to a nuclear reactor containment. Such distortions must be carefully considered whenmaking statements with respect to how well test facilities and particular experiments representreactors. Since these distortions cannot be altogether avoided in integrated- or separate-effects tests,the analysis method (including codes) must account for them by (a) a sufficiently detailed resolutionof the geometry, (b) using appropriate correlations, and (c) having been validated against test resultsobtained under similar conditions in a different facility.
From the point of view of experimental evidence and validation data for important phenomena, thetests discussed herein provide plenty of data for some, but only limited data for other phenomena, asdepicted in Table 4.1-4. Multicomponent gas compression/expansion and the effect of sprays onmass and energy content of a system are generally well characterized in all tests through reliablepressure and temperature measurements. Buoyancy effects on gas mixing and gas transport have

106
been observed and discussed in detail for the HDR tests in particular and other integrated- andseparate-effects tests. Basic heat transfer and flow resistance phenomena are best addressed in basicseparate-effects experiments, and the mostly integrated tests discussed herein often provide indirectvalidation data for these phenomena; that is, the individual phenomena are not clearlydistinguishable, and therefore have limited suitability for code validation. One major limitation is theinability to measure flow velocities accurately in a complex test facility.
Extensive international work in the area of hydrogen mitigation places further tasks on codecapabilities and thus on their validation. Despite the large number of relevant experiments describedin this chapter, the recent OECD Workshop on the Implementation of Hydrogen MitigationTechniques, held in Winnipeg, Canada, in 1996, identified “the need for further well-defined, well-instrumented, large-scale hydrogen-mixing experiments to validate codes, resolve uncertainties, andto characterize the performance and effects of hydrogen mitigation measures”. This ongoing needreflects the iterative nature of code validation and the sometimes conflicting requirements ofexperimental relevance (complexities of a severe accident in a real containment) and phenomenaresolution (sufficient and accurate measurements for phenomena and to define boundary conditions).This recommendation is supported to a certain extent by the experimental evidence presented in thischapter; on the other hand, significant advances have been made both in experimental techniques andin resolution of issues in containment thermalhydraulics and hydrogen distribution (at leastqualitatively).
4.6 References
1. OECD, Containments for Pressurized Water Reactors, CSNI Report 166, December,1989.
2. Proceedings of the OECD/NEA/CSNI Workshop on the Implementation of Hydrogen
Mitigation Techniques, Winnipeg, Canada, May 13-15, 1996, CSNI ReportNEA/CSNI/R(96)8, 1996.
3. OECD, Separate Effects Test Matrix for Thermal-Hydraulic Code Validation,
OECD/GD(94)82, September, 1993. 4. Pressure Suppression Systems, CSNI Report No. 126, October, 1986. 5. Karwat, H., Scaling and Extrapolation of Hydrogen Distribution Experiments, Nuclear
Engineering and Design, Vol. 104 (1987), 285-294. 6. H. Karwat, Elaboration of a Guideline for Counterpart Testing of Integral Loop
Systems, CEC-Report EUR 6540 EN, 1988. 7. Thermalhydraulics of Emergency Core Cooling in Light Water Reactors, CSNI-Report
No. 161, October, 1989. 8. H. Karwat, International Standard Problem ISP-23: Rupture of a Large-Diameter Pipe
within the HDR Containment, CSNI Report 160, Vols. 1 and 2, December, 1989. 9. L. Wolf and L. Valencia, Results of the Preliminary Hydrogen Distribution Experiment
at HDR and Future Experiments for Phase III, 16th Water Reactor Safety InformationMeeting, Gaithersburg, MD, October, 1988.

107
10. M. Schall and L.Valencia , Data Compilation on the HDR-Containment for Input Data
Processing for Pre-Test Calculations, PHDR Report 3.279/82, January, 1982. 11. OECD Standard Problem ISP-23: Rupture of a Large-Diameter Pipe within the HDR
Containment - Specification, April, 1988. 12. H. Wenzel et al., Versuchsprotokoll: Blowdown and Wasserstoffverteilungs-
Versuchsgruppe CON Versuch T31.5 [Test protocol: Blowdown and hydrogendistribution test series CON test T31.5], PHDR Working Reports 3.520/88 and3.524/88, February, 1988.
13. H. Karwat, International Standard Problem ISP-29: Distribution of Hydrogen within
the HDR Containment under Severe Accident Conditions, CSNI ReportNEA/CSNI/R(93)4, February, 1993.
14. H. Karwat, OECD International Standard Problem ISP-29: Distribution of Hydrogen
within the HDR Containment under Severe Accident Conditions - Task Specification,Rev.4, July, 1991.
15. L. Valencia and L. Wolf, Preliminary Design Report: Hydrogen Distribution
Experiments E11.1 - E11.5, PHDR Working Report 10.003/89, March, 1989. 16. H. Wenzel, Versuchsprotokoll - Wasserstoffverteilungs-Versuche HDR
Versuchsgruppe CON, Versuch E11.2, [Test protocol: Hydrogen distribution testsHDR test series CON, test E11.2], PHDR Working Report 10.010/89, 1989.
17. H. Wenzel, Quality Considerations of Major Direct and Indirect Measured Quantities
During the Experiments of Test-Group E11, PHDR Working Report 10.025/91, June,1991.
18. L. Wolf and L. Valencia, Results of the PHDR Computational Benchmark Exercise on
Hydrogen Distribution Experiments E11.2 and E11.4, CEC Workshop on HydrogenBehaviour and Mitigation in Water-Cooled Nuclear Power Reactors, Brussels,Belgium, 1991 March 4-8, EUR14039, 1991.
19. K. Takumi, et al., Proving Test on the Reliability for Reactor Containment Vessel,
Hydrogen Mixing and Distribution Test, Proc. of a Workshop on Hydrogen Behaviourand Mitigation in Water-Cooled Nuclear Power Reactors, Brussels, Belgium,March 4-8, 1991, 96-101.
20. K. Takumi and A. Nonaka, Overview of NUPEC Containment Integrity Project, 5th
Workshop on Containment Integrity for Nuclear Power Plants, Washington, D.C., 1992May 12-14, 367-380.
21. NUPEC, Specification of ISP-35: NUPEC’s Hydrogen Mixing and Distribution Test -
Test M-7-1, ISP35-027 Rev.1, May, 1993. 22. NUPEC, Questions and Answers on ISP-35, NUPEC’s Hydrogen Mixing and
Distribution Test - Test M-7-1, ISP35-036, 1993.

108
23. NUPEC, Final Comparison report on ISP-35: NUPEC Hydrogen Mixing andDistribution Test (Test M-7-1), CSNI Report NEA/CSNI/R(94)29, December, 1994.
24. M. Leonardi et al., ISP-35 on NUPEC M-7-1 Test: Evaluation of Codes Accuracy,
University of Pisa Report, DCMN-RL663(94), 1994. 25. NUPEC, Status Report on Proving Tests on Reliability of Nuclear Power Facilities,
1994, (public report in Japanese). 26. K. Takumi et al., Results of Recent NUPEC Hydrogen Related Tests, 21st Water
Reactor Safety Information Meeting, Bethesda, MD, 1993 October 25-27, 525-542. 27. NUPEC, Hydrogen Mixing and Distribution Tests M-2-2, M-4-3, M-7-1, M-8-1,
M-8-2, May 1997 (available upon request), Extracted from Proving Test on theReliability for Reactor Containment Vessel, NUPEC Report 1990 and 1991.
28. OECD, International Standard Problem 37 Comparison Report (Final Draft),
November, 1996. 29. M. Firnhaber et al., International Standard Problem ISP37 - VANAM M3: A Multi-
Compartment Aerosol Depletion Test with Hygroscopic Aerosol Material, ComparisonReport, OECD/CSNI Report (to be published).
30. T. Kanzleiter, VANAM Multi-Compartment Aerosol Depletion Test M3 with Soluble
Aerosol Material, BMFT Report BIeV-R67.098-304, July, 1993. 31. M. Firnhaber et al., Specification of the ISP37, VANAM M3: A Multi-Compartment
Aerosol Depletion Test with Hygroscopic Aerosol Material, GRS Report, April, 1995. 32. U. Behrens et al., Specification of Experiments on Aerosol Behaviour within a Multi-
Compartment Containment and on Filtered Venting Systems. Final Report, BMFTReport BIeV-R-66.849-1, May, 1988.
33. L. Wolf and L. Valencia, Experimental Results of the Preliminary HDR-Hydrogen
Distribution Test T31.5, 4th Int’l Topical Meeting on Nuclear ReactorThermalhydraulics (NURETH-4), Karlsruhe, Germany, October 10-13, 1989, 967-973.
34. L. Wolf and L. Valencia, Hydrogen Mixing Experiments in the HDR-Facility, 17th
Water Reactor Safety Information Meeting, Rockville, MD, October 23-25, 1989, 159-183.
35. L. Valencia and L. Wolf, Overview of First Results on H2-Distribution Tests at the
Large-Scale HDR Facility, 2nd Int’l Conf. on Containment Design and Operation,Toronto, Canada, 1990.
36. L. Valencia and L. Wolf, Experimental Results of the Large-Scale HDR Hydrogen
Mixing Experiments E11.2 and E11.4, CEC Workshop on Hydrogen Behaviour andMitigation in Water-Cooled Nuclear Power Reactors, Brussels, Belgium, March 4-8,1991, EUR 14039.

109
37. L. Valencia and L. Wolf, Large-Scale HDR Hydrogen Mixing Experiments - TestGroup E11, 18th Water Reactor Safety Information Meeting, Rockville, MD, October22-24, 1990.
38. L. Valencia and L. Wolf, Design Report: Hydrogen Distribution Experiments E11.1-
E11.5, PHDR-10.004/89, PHDR-10.009/89 to 10.015/89, 1989. 39. H. Wenzel, Versuchsprotokoll - Wasserstoffverteilungs-Versuche HDR
Versuchsgruppe CON, Versuch E11.4 (Data Report) [Test protocol: Hydrogendistribution tests HDR test series CON, test E11.4], PHDR Working Report 10.013/89,August, 1989 (in German).
40. J. Ogata et al., NUPEC’s Large-Scale Hydrogen Mixing Test in a Reactor Containment
(1) Hydrogen Mixing and Distribution Test, 3rd JSME/ASME Joint InternationalConference on Nuclear Engineering, April, 1995, Kyoto, Japan, 1995, 1149-1154.
41. T. Kanzleiter et al., The VANAM Experiments M1 and M2 - Test Results and Multi-
Compartment Analysis, 1991 European Aerosol Conference, Karlsruhe, Germany,September 16-20, 1991, S697-S700.
42. T. Kanzleiter, VANAM Multi-Compartment Aerosol Depletion Test M2, BMFT
Report BF-R 67.098-302, June, 1991 (in German, available upon special agreementwith BMBF).
43. K. Fischer, M. Schall and L. Wolf, CEC Thermalhydraulic Benchmark Exercise on
FIPLOC Verification Experiment F2 in Battelle Model Containment Long-TermHeatup Phase. Results for Phase 1, EUR Report EUR-13588, 1991.
44. K. Fischer, M. Schall, and L. Wolf, CEC Thermalhydraulic Benchmark Exercise on
FIPLOC Verification Experiment F2 in Battelle Model Containment. ExperimentalPhases 2, 3 and 4. Results of Comparisons, EUR Report EUR-14454, 1993.
45. T. Kanzleiter and B. Ruppert, Long-term Thermalhydraulic Experiments in a Multi-
compartment Containment, Proc. of the Int'l ENS/ANS Conference on Thermal ReactorSafety, Avignon, France, October 2-7, 1988, 2183-2192.
46. T. Kanzleiter, FIPLOC-Verifikations experimente, Final Report [FIPLOC Verification
Experiments, Final Report], BIeV-R66.614-01, Battelle Frankfurt, March, 1988(available upon special agreement with BMFT).
47. P. Von der Hardt et al., The PHEBUS FP Severe Accident Experimental Program,
Nuclear Safety, Vol. 35, No. 2, 1995, 187-205. 48. W. Krisher and M. Rubinstein, The PHEBUS Fission Product Project, Elsevier
Applied Science, 1992. 49. A. Mailliat and A. Jones, Final Test Protocol for the PHEBUS FP Test FPT-0,
Technical Note SEMAR 93/03, April, 1993. 50. A. Mailliat et al., The Calculation Program to Prepare the First PHEBUS FP Test,
Technical Note SEMAR 92/80, November, 1992.

110
51. C. Gonnier, Preliminary Results of the First PHEBUS FP Test (FPT0), CSARP
Meeting, Washington, D.C., 1994. 52. P. Spitz et al., A Review of some PHEBUS Fission Product Containment
Thermalhydraulic Results and their Application to JERICHO Assessment, Proc. of theInternational Conference on New Trends in Nuclear System Thermalhydraulics, Pisa,Italy, May 30-June 2, 1994.
53. P. Spitz et al., Analysis of the PHEBUS FPT0 Containment Thermalhydraulics with the
JERICHO and TRIO-VF Codes, Nuclear Engineering and Design, Vol. 166, No. 3,1996, 413-426.
54. G.R. Bloom and S.W. Claybrook, Standard Problems on Hydrogen Mixing and
Distribution, Westinghouse Hanford Company, Richland, WA, 1982. 55. G.R. Bloom et al., Hydrogen Mixing and Distribution in Containment Atmospheres,
EPRI NP-2669, 1983. 56. O. Hongisto and H. Tuomisto, Experimental Verification of the Loviisa Ice Condenser
Containment Transient Operation in Reactor Accidents, ANS International TopicalMeeting on Safety of Thermal Reactors, Portland, OR, July 21-25, 1991.
57. O. Hongisto, K. Lammila and H. Toumisto, VICTORIA Experiments for Hydrogen
Distribution in an Ice Condenser Containment, 20th Water Reactor Safety InformationMeeting, Bethesda, MD, October 21-23, 1992, 229-242.
58. O. Hongisto, H. Toumisto and P. Lundstroem, Hydrogen Distribution Experiments for
Loviisa Ice Condenser Containment, Hydrogen Behaviour and Mitigation in Water-Cooled Nuclear Reactors, Brussels, Belgium, March 4-8, 1991, 65-73.
59. P. Lundström et al., Local/Instant Measurement of Helium Concentrations in a Gaseous
Atmosphere, Proc. of the International Conference on New Trends in Nuclear SystemThermalhydraulics (Vol. II), Pisa, Italy, May 30-June 2, 1994.
60. P. Lundstroem, O. Hongisto and T. Theofanous, Hydrogen Behaviour in Ice Condenser
Containments, 7th International Meeting on Nuclear Reactor Thermalhydraulics(NURETH-7), Saratoga, NY, September 10-15, 1995, 1535-1554.
61. P. Lundstroem et al., Experimental Studies of Hydrogen Behavior in Ice Condenser
Containments, OECD Workshop on the Implementation of Hydrogen MitigationTechniques, Winnipeg, Canada, May 13-15, 1996.
62. K. Petersen, Hydrogen Mixing by Natural Convection in PWR Containments, ATW,
Atomwirtschaft, Atomtechnik Vol. 39: 11, November, 1994, 758-761 (in German). 63. NUPEC, Status Report on Proving Tests on Reliability of Nuclear Power Facilities,
1991, (public report in Japanese).

111
64. H. Chiang and S. Jones, Simulating the Mixing of Helium and Air by Mixing Saltwaterand Freshwater in a Scaled Enclosure, Nuclear Engineering and Design, Vol. 143:1,August, 1993, 55-67.
65. C. Chan and S. Jones, Gas Mixing under the Influence of Thermal-Dynamic Parameters
such as Buoyancy, Jet Momentum and Fan-Induced Convection, 3rd InternationalConference. on Containment Design and Operation, Toronto, Canada, October 19-21,1994.
66. C. Chan and S. Jones, Simulating the Mixing of Helium and Air by Mixing Saltwater
and Freshwater in a Scaled Enclosure Containing a Baffle Plate, Transactions ofAmerican Nuclear Society Annual Meeting, Vol. 65, Boston, MA, 1992, 310-311.
67. R.K. Kumar, H.W. Chiang and F. Kalos, Entrainment and Mixing in Vertical Buoyant
Light-Gas Plumes, ASME PD-Vol. 66, 1995. 68. M. Krause et al., Hydrogen Distribution Studies Relevant to CANDU Containments,
Proc. of the 19th CNS Simulation Symposium, Hamilton, Canada, October 16-17,1995.
69. C. Chan, and S. Jones, Gas Mixing Experiments in a Large Enclosure, CNA/CNS
Annual Conference, Toronto, Canada, June 8-11, 1997. 70. R.F. Wright et al., Heavy-Water Reactor Facility Large-Scale Containment Cooling
Test Program, Trans. ANS Vol. 66, 1992, 306. 71. T. Van de Venne et al., The Westinghouse AP600 Passive Containment Cooling Test
Analysis Program, ANP International Conference on Design and Safety of AdvancedNuclear Power Plants, 1992.
72. F.E. Peters, A.T. Pieczynski and M.D. Carelli, Advanced PWR Containment Cooling
Experimental Program, Proc. of International Conference on New Trends in NuclearSystems Thermalhydraulics, Proc. Vol. 2, Pisa, Italy, May 30-June 2, 1994, 37-43.
73. T. Kanzleiter, et al., HYJET-/PACOS-Versuche im Modell Containment
[HYJET/PACOS Tests in the Model Containment], Battelle Report BF-R40.075-01,Data Reports: BF-R40.075-31 to -33, December, 1996 (in German).
74. T. Kanzleiter and M. Seidler, Catalytic Recombiners for Hydrogen Removal in Major
Reactor Accidents, ATW, Atomwirtschaft, Atomtechnik Vol. 40:6, June, 1995, 392-396 (in German).
75. T. Kanzleiter, Experiments on the Efficacy of Hydrogen Mitigation Methods within a
Multi-Compartment Containment Geometry. Final Report, BMFT Reports BIev-R-67.036-01 and 02, November, 1991 (in German).
76. U. Behrens et al., Experiments on the Behaviour of the Full-scale NIS-designed
Catalyst Module under Various Conditions in the Model Containment, Battelle Reportfor the Rheinisch-Westfälisches Elektrizitätswerk AG, June, 1991.

112
77. G.W. Koroll et al., Catalytic Hydrogen Recombination for Nuclear Containments,ICHMT Seminar on Heat and Mass Transfer in Severe Reactor Accidents, Cesme,Turkey, May 21-26, 1995.
78. W.A. DeWit et al., Hydrogen Recombiner Development at AECL, Proc. of the
OECD/NEA/CSNI Workshop on the Implementation of Hydrogen MitigationTechniques, Winnipeg, MB, May 12-16, 1996, CSN Report NEA/CSNI/R(96)8, 1996.
79. J. Loesel-Sitar et al., Large-Scale Vented Combustion Test Facility at AECL-WL:
Description and Preliminary Test Results, Proc. of the OECD/NEA/CSNI Workshopon the Implementation of Hydrogen Mitigation Techniques, Winnipeg, MB, May 12-16, 1996, CSN Report NEA/CSNI/R(96)8, 1996.
80. M. Heitsch et al., Hydrogen Mitigation by Catalytic Recombination in the Projects
HYMI and VOASM, FISA-97 Symposium on EU Research on Severe Accidents,Luxembourg, 17-19 November, 1997.
81. T. Kanzleiter, Wasserstoff-Verteilungs- und -Abbauversuche in einem Mehrraum-
Containment mit mehreren katalytischen Rekombinatoren [Hydrogen distribution andremoval tests in a multi-compartment containment with multiple catalyticrecombiners], Jahrestagung Kerntechnik ’98, Munchen, May 26-28, 1998 (in German).
82. T. Kanzleiter, Multiple Hydrogen Recombiner Experiments Performed in the Battelle
Model Containment, Multi-Reco Experiments ZxO2 and ZxO5, Battelle Report BF-R40.084-01 for BMBF and EC-DG XII, March, 1997.
83. T. Kanzleiter, Multiple Hydrogen Recombiner Experiments Performed in the Battelle
Model Containment, Multi-Reco Experiments ZxO3 and ZxO4, Battelle Report BF-V68.405-02/CONT-VOAOSM(97)-DOO5 for EC-DG XII, November, 1997.
84. T. Kanzleiter, Multiple Hydrogen Recombiner Experiments Performed in the Battelle
Model Containment, Multi-Reco Experiment ZxO8, Battelle Report BF-V68.405-01/CONT-VOASM(97)-P001 for EC-DG XII, April, 1997.

113
5. CODE DEVELOPMENT AND APPLICATION ACTIVITIES
5.1 Introduction
This chapter describes the efforts made over the last decade to develop codes and code applicationsfor thermalhydraulic and gas-distribution analysis in reactor containments. International efforts incomputer code development and verification in the area of severe accidents have led to betterunderstanding and more accurate predictions of thermalhydraulic and gas-distribution phenomena.
International standard problem exercises, organized by the OECD and described in Chapter 4, havebeen conducted specifically for code verification purposes where the main goal is to increaseconfidence in the validity and accuracy of codes used in assessing the safety of nuclear installations.Because no severe accident data for operating NPPs can be obtained and because full-scaleprototypical experiments are not feasible, accident simulations using containment codes are vital toour nuclear safety programmes. Reliance on codes necessitates that a carefully designed plan ofverification exercises be formulated to prove simulation accuracy and to quantify uncertainties insimulations.
Codes are required to obtain calculation results in support of a variety of safety and containmentloads analyses. Within the scope of these analyses, there are requirements of (1) applicability, (2)reliability, and (3) economics. Code applicability is, of course, the most important requirement. It isjudged by whether the code has the ability to reproduce the physical phenomena or if the employedempirical data are relevant for the range of parameters to be analysed. Installed physical models,accumulated experience for code application, and code-user experience become issues.
Code reliability can be generally judged by assessing the accuracy of a code prediction. Even if theanalytical algorithm gives an accurate mathematical solution, a prediction of thermalhydraulicbehaviour has inevitable uncertainties that come from simplifications or lack of physical modellingand empirical input parameters. Qualitative and quantitative comparisons with data are indicationsof the code’s ability to predict thermalhydraulic phenomena in a containment. As long as a codeverification is conducted by assessments of experiments, simulation uncertainties must be discussedin terms of the contributing components, that is, code, user, and experimental uncertainties. Whereasthe uncertainties of experiments such as measurement errors are briefly discussed in Chapter 4, thischapter discusses how various uncertainties affect our perception of overall code uncertainty.
Economics is certainly an additional requirement where the problem set-up and computation periodsare required to be reasonably short when simulating severe accident phenomena in a containment.Therefore, severe accident analysis codes often employ simple physics models and approximategeometrical modelling for the containment. Reactor safety, however, should not be jeopardized byunreliable and, eventually, wrong predictions of plant behaviour only because analytical predictionsare required to be cheap. Some sense of reasonableness must be exercised in this regard. Oneadditional hope is that code predictions will always be supported by well thought-out sensitivityanalyses to identify potentially erroneous results. Yet in at least a few cases economical concernsmay be put aside in favour of more detailed and costly code calculations. The economical concernsfoster a two-tier approach where the industry develops and validates both approximate and detailedcode types; these codes are often referred to as lumped-parameter and field codes, respectively.Assuming that the economical requirements are principally satisfied for severe accident analysis, we

114
focus on the applicability and reliability of the codes through the code verification process inChapter 5.
Experimental analyses are discussed herein mainly for ISP exercises. Since ISP participantscontribute calculations by a variety of international codes, and some participants use the same code,an ISP has the merit of clarifying the variety of code applicability and reliability, and user-inducedeffect on a single computer code. Moreover, because certain computer codes are continuouslyapplied in ISP exercises, the progress of code development can be seen by the iteration between codedevelopments and applications.
Phenomena ranked highly in the PIRTs (Table 3.3.4-1 in Chapter 3, Phenomena) are used asreference phenomena to discuss code reliability and to give a quantitative judgement of theagreement between experimental and calculation results. The key indicators of these phenomena arepressure, atmosphere temperature, and gas concentration distribution as a function of time.Comparative assessments for codes and data using these indicators are the focus of this chapter.
In this chapter, Section 5.2 describes the background of the code requirements, assessments, and roleof ISP exercises. In Section 5.3, the codes developed for severe accident simulations are listed anddescribed according to code type—lumped-parameter or field code. In this section, generaladvantages and disadvantages of each type of code are discussed, with more detailed descriptions ofeach code provided in Appendix A. Code applications are discussed in Section 5.4 mainly on thebasis of four ISP exercises that specifically address issues of containment thermalhydraulics and gasdistribution under severe accident conditions. For each ISP, the conclusions of the final comparisonreport are summarized and critically assessed, and other complementary experimental efforts are alsodiscussed. When documentation of a re-analysis is available, these analyses are also discussed toindicate progress in code development and user insight. Additional information on other codeapplications is provided in Appendix B. Section 5.5 reviews and presents some examples ofsimulation uncertainties realized through the ISP and similar comparative exercises. To concludethis chapter, Section 5.6 presents some general conclusions concerning ISP results, along withrecommendations for additional experiments and ISP exercises.
5.2 Background
5.2.1 Code Requirements and Usage
In past decades, containment analysis codes have been utilized for DBA analysis where the emphasiswas on sizing and assessing safety design features of the plant. The typical approach for addressingcode uncertainty was to rely on conservative estimates for code input and models. Within the lastdecade, there has been an effort to extend the class of containment analyses to severe accidents and toreplace conservative containment analysis with “best-estimate” code calculations (see Section 5.3.1for a definition of best-estimate codes). The intended use of the code results has also changed froma design emphasis to one where calculations are used to identify plant system vulnerability (PSA,IPE, etc.), to evaluate severe accident management strategies—which include various mitigationmethods—and to determine initial and boundary conditions for various severe accident events, suchas hydrogen combustion. Codes are being used in some of these applications simply to gain anappreciation and understanding of severe accident behaviour for a variety of accident scenarios; thisapproach often requires many sensitivity calculations. In these instances the requirements on codeaccuracy are relaxed and uncertainties in parameters of 20% to 40%, which are greater than typicalexperiment measurement accuracies, may be accepted as long as trends in key variables like pressure,temperature, and gas composition are still predicted. A more difficult situation arises from

115
applications where the codes are needed to predict initial and boundary conditions for combustionevents, such as in the case of deliberate and random ignition of hydrogen. For these applications,code accuracies for gas distributions needed in the evaluation of ignition concepts approachmeasurement accuracies in sensitive regions (10% to 15% dry hydrogen concentrations), and areviewed, from a technical standpoint, as a goal for code accuracy. Mitigation concepts likerecombination, where the hydrogen injection rates are low and the concentrations are also well belowthe sensitive region, may not require such high accuracy. Therefore, combustion event modellingappears to dominate the requirements, and these events are primarily those involving acceleratedflames, DDT, and detonations.
These requirements become the background against which codes are assessed for adequacy. Whatmay be considered acceptable for one application may not be acceptable for another; a type of code(lumped-parameter or field code) may be perfectly suitable for one application but unsuitable foranother. For example, a lumped-parameter code may be very well suited for evaluation of systemvulnerability (PSA, etc.) but limited in its suitability for predicting the detailed progression of acombustion event. The issue of what is adequate or acceptable for an application must be addressed,therefore, by organizations responsible for protecting the public from improbable radiologicalreleases from a containment. As code usage varies, the practical requirements on code accuracy willalso change.
5.2.2 Code Assessments
In assessing code reliability, a primary evaluation criterion is established, and from the criterion a setof primary quantities is derived, which must be compared to experimental measurements. InChapter 3 a set of three parameters was defined for ranking the importance of various phenomena(pressure, temperature, and gas concentration). These quantities were chosen because (1) they arekey variables mentioned in the overall licensing requirements summarized in Chapter 2, and (2) theyare representative quantities that characterized phenomena judged to be important. Beyond thePIRT-type evaluation parameters, however, is another set of primary quantities that are of interest inhelping to establish confidence in phenomena modelling accuracy. Some of these quantities arestructure temperature, heat transfer coefficients, heat fluxes, and local gas velocity.
One step in the process of establishing code reliability is to require an accuracy range for primary andother quantities of importance for an application. When these ranges are determined, an assessmentmay be made—based on results of experimental comparisons—as to whether a code will predictquantities within this range. Specification of a practical accuracy range is one of the more difficultsteps in the process of determining code reliability and should be determined before a judgement ismade on whether a code can be used reliably for a containment safety problem. The discussion ofcountry-specific technical requirements in Chapter 2 gave some indication of the problem withrespect to accuracy ranges. The reader will recall that the subject of ranges or margin of error wasnot mentioned in that chapter. Such an omission is a reflection of the difficulty in putting downrequirements for accuracy where the specifics of the application are themselves either uncertain or sobroadly based.
Therefore, specific issues, related to code reliability, are really not addressed in this report becausethose issues must be considered within an application where key parameter accuracy requirementsare known. However, what is addressed here are the more general considerations related to codeapplicability, reliability, and the state-of-the-art phenomenological modelling assessments,assessments based on the adjunct uses of the illustrative PIRT discussed in Chapter 3. As noted inChapter 4, the discussion of phenomenological modelling proceeds based on the highly ranked
116
phenomena identified in Table 3.3.4-1. We noted in Chapter 3, three guidelines for highly rankedphenomena:
1. Experimental guideline: A phenomenon should be explicitly exhibited and well measured; Aphenomenon should be prototypical.
2. Code development guideline: A phenomenon has a dominant effect on the primary
parameter of interest (pressure, temperature, gas concentration). Phenomena should beexplicitly and accurately modelled.
3. Code uncertainty: Phenomena uncertainty should be individually determined and then
combined with other uncertainty sources.
A listing of highly ranked phenomena, identified in Table 3.3.4-1, is cross-referenced in Table 4.1-4to various thermalhydraulic and gas-distribution experiments.
In Section 5.4, a comparative analysis is presented for a selected set of containment analysis codes.The applications are critically reviewed in this section using the guidelines presented above.International standard problems are chosen for this comparative analysis exercise because theyprovide a good representation of the state-of-the-art knowledge in experiment, code development,and simulation uncertainty assessment. Other experiments, described in Chapter 4, are also of valuefor providing guidance on code development and uncertainty; however, these experiments generallyhave limited distribution (Category 2 and 3) and code participation (one or two codes is represented);as a consequence, only brief summaries of some these tests are presented, as complements to ISPswithin the chapter’s discussion, or are included separately in Appendix B. International standardproblems, on the other hand, have unlimited distribution (Category 1), a large representation of codesand code types, and are designed to address general concerns regarding code performance forthermalhydraulic and hydrogen distributions. The following brief review of the role and proceduresof ISPs, followed with ISP set-ups and the framework for conclusions and recommendations arediscussed later in Section 5.6.
5.2.3 OECD International Standard Problems: Experiment Based
International standard problems, four of which are discussed in next subsection, provide a visiblyorganized and managed approach to code assessment. The potential benefits of this type of anapproach to code assessment are significant since they reflect on the underlying rationale of open andwell-documented discussions within a community of nuclear code developers and analysts, acommunity seeking a set of tools that can be used in a proficient manner to guarantee public safety.Divergent views or understandings concerning the complexities of various phenomenon interactionsare given a forum where technical arguments and judgements are aired. Most important is thatindividual code performance is documented at a specific point in time, that the performance ofvarious codes is summarized, and that discussions surrounding the reasons for performance (good orbad) are noted. The ISPs provide progress markers in a code’s development history. These markersare in the form of comparison reports through which the public can judge the minimal risk claimscoming from the nuclear safety programmes of the OECD countries.
The ISPs ideally are chosen through a screening process that rules out experiments where initial andboundary conditions are uncertain and where an insufficient number of primary quantities necessaryfor phenomena characterization are measured. Various meetings and workshops are often held todiscuss the adequacy of an experiment and the form of the ISP specification. Participating

117
organizations select the code(s) and the analyst(s) who will perform the calculations. Results of thesecode exercises are provided to the sponsoring organization that, in turn, documents the codecomparisons with the experiment data. Typically, a follow-up workshop is held by participants todiscuss the results of the code comparisons. Organizations are given an opportunity to makepresentations, which are included in the final report on the ISP. Unfortunately, shortcomings in codemodelling cannot often be understood or corrected within the time frame of an ISP reporting period.In these cases, the ISP becomes a vehicle for further investigation and later reporting byorganizations (specifically code developers). In this sense, the ISPs become living benchmarks thatare continually revisited for evaluations of adjustments to code models, new insights or both from thecode users.
International standard problems are intended to present a broad (international) picture of the state-of-the-art approach in containment safety analysis. The ideals of the ISPs are realized to various extentsfor each specific problem. Compromises, a reality in many complex programmes, are also a part ofISPs, and this concern is demonstrated with the ISPs presented here; however, the overall success inthe OECD programme of code assessment is revealed in the significant role that these ISPscontinually play in the ongoing code development and assessment programmes of the variousmember countries. Section 5.4 highlights the accomplishments within four ISPs for identifying codeperformance (state-of-the-art) in the area of containment thermalhydraulics and hydrogendistributions. The section also deals critically with these exercises in terms of lessons learned, theneed for additional ISPs, and improvements that will have to be made in future ISPs, to make themeven more useful for demonstrating our analytical capabilities in the area of containment safety.
5.3 Computer Code Types And Recent Development
Design-basis accident analysis codes have been utilized for design and safety analysis for severaldecades, and the code application experiences have been accumulated in parallel with theadvancement of nuclear power plant technology. On the contrary, in many countries, thedevelopment of severe accident analysis codes has not progressed as far as has the development ofDBA analysis codes, which started in the mid-1980s.
Reflecting now on severe accident scenarios, various phenomena that had not been considered inDBAs were hypothesized to occur, and new models were introduced into the severe accident analysiscodes. The typical phenomena for severe accidents are core degradation, pressure vessel melt-through, MCCI, steam explosion, DCH, and hydrogen deflagration/detonation. Fission products andaerosol behaviours as well as thermalhydraulic behaviour in a containment vessel are simulated in anintegrated fashion in most severe accident analysis codes.
In the code development process, simpler physics models and calculation methods were preferred inorder to simulate various and complex severe accident phenomena over a long time period and toconduct the calculation within a limited period. Therefore, from the early stage of the codedevelopment, lumped-parameter methods had been applied as a calculation method used for most ofsevere accident analysis codes. With continuing developments in hardware, advancements that haveproduced faster and less-expensive computers, and with new numerical techniques developed, othercodes have been developed that, in principle, provide a better approximation of local containmentphenomena through more detailed physical modelling; these codes are referred to as engineering fieldcodes.
The severe accident analysis and field codes have been modified and improved, by conductinganalyses of relevant experiments some of which are described in Chapter 4, and models (e.g.,

118
correlations) have been added and modified to handle the installation of the accident managementequipment—such as sprays, fan coolers, and recombiners—which sometimes inducesthermalhydraulic mixing processes in the containment vessel. It is recognized that participation ofboth categories of codes (lumped-parameter and field codes) in ISPs and other experimentalprogrammes have added to the general experience base for users that is needed for the successfulapplication of these codes.
5.3.1 Definition of Code Types
Computer codes for analyses of thermalhydraulic behaviour and hydrogen distribution in a reactorcontainment vessel are divided here into two types. The definition of each code type is presentedbelow. Taken together, however, both types are representative of best-estimate codes and are used toconstruct a best-estimate simulation of a severe accident scenario. The term best estimate applies toan approach where code input, models, options, and conditions are prepared or developed with noknown bias toward conservatism. In this respect, each of the code types defined here is applied tocalculate, in a best-estimate manner, containment accident progression and thermalhydraulicresponse. (Of course, with specific choices of options and input, conservative results may also becalculated; in fact, such choices are often made in the case of poorly understood phenomena.) Thecomparisons between code results and data are, therefore, based on a one-to-one comparison withoutcredit for conservative assumptions in the simulation model. This approach is consistent with thenature of severe accident safety analyses and can be contrasted with the conservative approach usedfor DBA, and other licensing work, that emphasizes design rather than failure thresholds.
5.3.1.1 Lumped-parameter codes
For safety assessments of nuclear power plants, there are computer codes that cover all aspects of in-vessel and ex-vessel severe accident phenomena including reactor coolant system and containmentthermalhydraulic response, core heatup, core degradation and relocation, fission-product release andtransport, direct containment heating, etc. These codes (MELCOR and MAAP4 are examples) arecalled integrated codes or system codes, and most integrated codes usually have simplified physicalmodels and simplified conservation equations. Another type of integrated code treats only ex-vesselphenomena and is, therefore, more specialized and is often developed with more detailed modellingof certain ex-vessel processes (CONTAIN and RALOC are examples).
In most countries, these integrated codes are widely used as design/safety evaluation codes fornuclear reactor containment systems and are typically applied in licensing procedures forcontainment integrity and for applications in risk studies such as in Level-2 PSAs.
Another way that these integrated codes are commonly classified, and distinguished in this report,concerns the manner in which the continuum of fluid properties within various control volumeswithin the containment is approximated. Integrated codes are often referred to as lumped-parameter codes because the codes are based on the fundamental assumption that within a chosenvolume, called a control volume, spatial differences of thermalhydraulic variables—like fluid density,concentration, and temperature—are neglected while only the time-dependent behaviour isrepresented in conservation equations that describe containment transport processes. In this type ofapproximation, compartments within a containment are built up multidimensionally by "controlvolumes and flow paths". Each flow path connects two control volumes specified by user input data.A control volume is allowed to have an arbitrary number of flow paths. A momentum equation isdefined for each flow path, and energy and mass conservation equations are defined in each controlvolume. The resulting set of conservation equations, without space dependency, is a set of ordinarydifferential equations that must be solved using well-established numerical methods.
119
In these lumped-parameter codes, energy and mass are transported through the flow paths, from onecontrol volume to another, in response to the solutions of the momentum equations defined in eachflow path. However, because each momentum equation is only one dimensional (note that amomentum equation is defined in the flow path that has only one dimension, "from-to"), and becausethere is no momentum associated with a control volume, multidimensional effects associated withadvection of momentum cannot be calculated.
5.3.1.2 Field codes
In addition to lumped-parameter codes is a class of codes, referred to here as engineering field codeswhere spatial variation of fluid properties is locally taken into account and a momentum equation issolved at a number of discrete points that represent a finite control volume. Conservation equationsfor mass, energy, and momentum are developed on the basis of partial differential equations wheretrends in spatial variations of calculated properties are accounted for inside a control volume. Toavoid extrapolations over too great a distance, these code types require a large number of controlvolumes to simulate the detailed behaviour of a thermalhydraulic system.
One noted difference, in relation to the lumped-parameter code, is that the momentum equation in thefield code is derived as a multidimensional equation, considering transfers from the connected controlvolumes and accounting for the advection of momentum between volumes. Moreover, field codesallow for the calculation of the viscosity divergence term in the Navier-Stokes equations by finite-difference methods. Therefore, field codes have, in principle, a method for predicting in-homogeneous gas concentration and gas temperatures within a free volume where shear stress withinthe gas flows is important. Such a capability does not exist with lumped-parameter codes. However,closure relationships for turbulence modelling are needed to apply these field equations, and theserelationships are often only approximately known and must be verified for the flow regime. Inaddition, these field codes, like the lumped-parameter codes, do not calculate the boundary layersalong structure boundaries; therefore, atmosphere-to-structure mass and energy-exchange predictionsrequire engineering correlations similar to those used in lumped-parameter codes.
Development of 3D field codes has recently been started to accommodate specific thermalhydraulicphenomena such as in-homogeneous gas concentration distributions of which prediction would bedifficult for a lumped-parameter analysis code. Recent applications in this area (see Appendix B)indicate some of the capabilities that these codes have for predicting complex and localized thermal-hydraulic phenomena. However, until just recently, field codes have been applied less frequentlybecause there are few experiments for field code validation, and also only a relatively small group ofanalysts is trained in the use of these codes.
5.3.2 General Advantages and Disadvantages of Each Code Type
5.3.2.1 Lumped-parameter codes
The main focus for lumped-parameter codes has been for integrated containment analysis. Integratedanalysis requires an assessment that involves a coupling of phenomena important for containmentloads and source term analyses. A lumped-parameter code that is also characterized as an integratedcode, therefore, includes a number of interacting models; some of these models include atmosphericthermalhydraulics, aerosol behaviour, fission-product transport and decay (including steamevaporation and superheating from fission-product heating), events (DCH and hydrogen combustion),core–concrete interactions, engineering safety features, pressure suppression, and water distribution.Because the lumped-parameter codes may include so many of the phenomena believed to be
120
important for containment response in a variety of reactor types (PWRs, BWRs, PHWRs andALWRs), lumped-parameter codes are valued for their utility in performing probabilistic riskassessments (PRAs) and PSAs. Typically, these studies require a large number of scenario andsensitivity calculations. Most of the severe accident applications are characterized by a best-estimateapproach to phenomena modelling, and, because of their fast-running and extensive range of ex-vessel models, the codes are often used for the best-estimate calculations of delayed or late-timecontainment failures. The codes have also been traditionally used for DBA licensing calculationswhere a conservative containment load prediction is ensured by the selection of conservative ratherthan best-estimate thermalhydraulic models, options, and input parameters. Listed below are some ofthe advantages and disadvantages of lumped-parameter codes.
Advantages of the lumped-parameter code type are as follows:
• modest input set-up requirements using containment data that are readily available; • relatively fast-running (economical) on a variety of platforms (mainframes, PCs, and
workstations); • structured so that integrated models can be readily incorporated—using simple models to predict
complex physical processes, such as global/regional gas-mixing behaviour; and • mature computation technique, with a large validation base, and, extensive user community,
representing a considerable resource of experience. Disadvantages of the lumped-parameter code type are as follows: • current inability to predict some of the details of local/regional gas mixing (lack of detailed
entrainment modelling for jets, plumes, and shear layers; lack of momentum convectionmodelling);
• molecular/turbulent diffusion modelling is generally lacking; and, • limited capability for predicting compartment flow velocities that could be used in mixed
convective heat and mass transfer correlations to improve on the containment loads prediction. 5.3.2.2 Field codes Field codes focus on predicting local/regional parameters (e.g., concentrations, velocities, andtemperatures). They represent a first principle approach to containment modelling and, because oftheir limited capability for full containment analysis, are mainly complementary to the more widelyused lumped-parameter codes. However, because of the advancement of numerical methods andbecause of the dramatic increases in computer performance/cost ratio, field codes are becoming ofpractical use, rather than being developmental analysis tools. A list of some advantages anddisadvantages of the field codes follows. Advantages of the field code type are as follows: • predicts local/regional steam–gas concentrations that could be important in determining the
spatial progression of certain hydrogen combustion events and the details related to an evaluationof hydrogen mitigation strategies;

121
• provides a prediction capability for determining primary and secondary flow patterns that could
improve on models for heat and mass transfer; therefore, they may be used to predict containmentloads with a higher degree of local accuracy;
• enables the prediction of the tight coupling between transport and combustion processes; • adaptable for estimating counter-current flows in large flow paths; and • useful for benchmarking lumped-parameter thermalhydraulic model simplifications. Disadvantages of the field code type are as follows: • protracted input set-up times and long computational times that typically require a mainframe
computer; • ability to perform parametric sensitivity studies is limited because of long running times; • general requirements to demonstrate spatial convergence of the 3D model; • potential user and numerical distortions can be amplified; • containment configurations are complex (numerous structural/equipment components) and the
effect of geometrical simplifications on predicted results could be significant; • validation base is limited (turbulence modelling uncertain); • mesh size near heat structures is dependent on the empirical heat and mass transfer correlation
used (mesh size greater than boundary layer required for consistency); and • user community is extremely small, having a limited amount of experience with full containment-
type calculations. 5.3.3 Recent Development in Code Types Recent code development relevant to thermalhydraulics in a reactor containment vessel is devoted tomodelling more detailed phenomena in order to obtain better predictions and to decreaseuncertainties that are inevitably included in calculation results. Codes listed below are used in OECDmember countries in licensing procedures or in severe accident analyses of nuclear power plants or inboth: Code type Code Lumped Parameter CONTAIN, MELCOR, GOTHIC, FUMO, MAAP, RALOC, FIPLOC,
WAVCO Field GASFLOW, INSPAT/CV, CFX-F3D, TONUS Tables 5.3.3-1 and 5.3.3-2 summarize the status of recent lumped-parameter code development andsimulated new aspects respectively. Table 5.3.3-3 shows the status of recent development of fieldcodes. Recent code development of each code is described in Appendix A.

122
According to Table 5.3.3-2, new simulated aspects in recent code development are roughly dividedinto three categories; thermalhydraulics, hydrogen burning/hydrogen recombiner, and fission-product/aerosol behaviour. Simulated new aspects are in the area of hydrodynamics modelling, suchas reverse/counter/critical flow, which is observed in a large flow path, stratification modellingmethods, and combinations of lumped and distributed volumes. All these aspects indicate thenecessity of more microscopic prediction of physical phenomena in one open volume because of theextension of the severe accident analysis to include hydrogen combustion and recombination. Thefollowing are major simulated aspects in recent containment code improvements(see Table 5.3.3-2and Appendix A for detailed information). • counter flow (or reverse/critical flow) and buoyancy modelling (CONTAIN, MELCOR, MAAP,
RALOC); • film flow modelling on structure walls (CONTAIN, GOTHIC, RALOC); • non-equilibrium of phases (CONTAIN, MELCOR, GOTHIC, RALOC); • simulation of in-homogeneous gas/temperature distributions in open volumes (CONTAIN,
GOTHIC, FUMO, MAAP); • K - ε turbulence (GOTHIC); and • combination of lumped-parameter and distributed volumes (GOTHIC).
Table 5.3.3-1 Recent code development (lumped-parameter codes)
Code Name Code Versionor Year
Developing Organization (Country) DocumentationReference No.
1. CONTAIN 1.12W (1993)2.0 (1997)
SNL/NRC (USA)SNL/NRC (USA)
[1][2]
2. MELCOR 1.8.3 (1994)1.8.4 (1997)
SNL/NRC (USA)SNL/NRC (USA)
[1][3]
3. GOTHICa 3.4e (1993)5.0 (1995)
NAI/EPRI (USA)NAI/EPRI (USA)
[4][5]
4. FUMO 1992 DCMN Pisa University (Italy) [6]5. MAAP 1994 EPRI/FAI [7]6. RALOC 4.0 (1996) GRS (Germany) [8-10]7. FIPLOC 3.0 (1996) GRS (Germany) [11]8. WAVCO (1998, 1996) Siemens/KWU (Germany) [12]
a The GOTHIC code may be used as a field code in a finite-difference fashion (distributed parameter);however, most comparisons discussed in this report are for the code used in its more common lumped-parameter mode.

123
Table 5.3.3-2 Simulated new aspects and items for lumped-parameter codes
Code name and CodeVersion/Year
Simulated new aspects and items
1. CONTAIN 2.0 (1997) -Flow path restructuring-Film flow on wall structures-Energy and mass conservation tracking-Hybrid flow solver-Nonideal equation of state for water-Fission-product Library-HECTR 1.8 hydrogen burn model
2. MELCOR 1.8.4 (1997) -Fission-product chemical reactions with surfaces-Hygroscopic aerosol behaviour model-Flow blockage model for PWRs-Boron carbide-steam reactions model-Reverse flow (dT/dz) modelling-Larson-Miller creep rupture model-Pool Scrubbing modelling
3. GOTHIC 3.4e (1993) -Graphical pre-and post-processor-Combination of lumped and distributed volumes-3D Cartesian mesh for distributed nodes-3-phase, multi-component (vapour and noncondensable gases,water, drops) with solution of conservation equations and thermalnonequilibrium-Ice phase for ice-condenser containmentsNon-equilibrium of phases-2-phase flow regime maps, critical flow
4. GOTHIC 5.0 (1995) -Mixing length turbulence model-Heat transfer to 1D structures and film flow on walls-User-selectable heat transfer and condensation correlations-Engineering component models: fans, heat exchanger, pumps,valves, spray nozzles, heaters/coolers, tripsSame as GOTHIC 3.4e plus-K - ε turbulence-HECTR 1.5 hydrogen burn model for lumped nodes-Hydrogen recombiner model (forced convection and PAR)-Distributed hydrogen burn model for distributed volumes-Flexible, user-definable control functions
5. FUMO -Hydrogen burn model-Hydrogen and steam distribution inside a large control nodehydrogen recombiner model-Corium-water interaction-External spray system and other engineering componentssimplified primary system models for AP-600 and SBWR-Mechanistic condensation model-Passive containment heat exchanger
continued…

124
Table 5.3.3-2 Simulated new aspects and items for lumped-parameter codes (concluded)
Code name and CodeVersion/Year
Simulated new aspects and items
6. MAAP -Generalized containment nodalization scheme-Sub-nodal models for thermal and gas stratification-Hydrogen combustion and burning-Condensation of steam on walls and metal equipment-Aerosol generation with transport and deposition-Condensation of steam on spray droplet surfaces-Counter-current flow in a vertical flow path-Models for passive heat removal systems-Heat, gases–and fission produces released from corium–concreteinteraction
7. RALOC MOD4 (1996) -Water filmflow down vertical walls within dynamic change of heat transfer-Non-ideal equation of state, for steam, water, noncondensablegases-Thermal non-equilibrium-H2-combustion model DECOR-Heat and mass transfer correlation improved, user-selectable-No limitations in discretization of 1D heat conduction structures-Heat conduction, capacity = f(temperature)-Equation for mass flow rate user-selectable (unsteady,incomprehensive, steady, comprehensive, steady, incomprehensive-Critical flow-Water, carryover-Flexible modelling of inertia-effected junctions-Improved water drainage and sump balance_engineering component models; valves, fans, pump systems,cooler/heater, rupture discs, flaps, doors-H2-recombiner (3 types of PAR and thermal)-Analysis simulation ATLAS use for graphical visualization )off-,on-line)-Pressure suppression system module with 1D hydrodynamics forpool and condensation oscillations
8. FIPLOC 3.0 (1996) -Condensation onto insoluble and hygroscopic aerosols; particlegrowth by the moving grid-technique-Fission-product decay releases into gas and structures because ofbeta and gamma radiations-Integration of the iodine model IMPAIR-Integration of the pool scrubbing Model SPARC-B

125
Table 5.3.3-3 Recent code development (field codes)
Code Name Code Version or year DevelopingOrganization
(Country)
Documentation/Reference No.
1. GASFLOW 2.1 (1998) FZK (Germany)LANL/NRC (USA)
[13]
2. INSPAT/CV NUPEC (Japan) [14,15]3. CFX-F3D 4.1 (1995) CFD-Services, Harwell
Laboratory, UK[16]
4. TONUSa IPSN (France) [17]
a The TONUS code has many features in common with other lumped-parameter codes where a containment is describedusing a number of interconnected compartments; however, the code is also described as a multi-dimensional code inthat is solves the Navier-Stokes equations with turbulence modelling over a number of meshes. In this sense, the codehas been listed as a field code although a more precise classification would be to place the code in a category betweenlumped and field codes.
5.4 Code Applications
Codes are applied to simulate accidents in a reactor containment for a variety of end purposes such aslicensing, safety equipment or containment design, accident management, and risk analysis—forstudying and identifying system vulnerability. For each of these applications, a central question isposed: How accurately does the simulation model reflect what is occurring in the accident? To findan answer to such a question, codes are applied in another venue that involves test facilities andexperiments, where code results are directly compared with measured quantities (pressure,temperature, and gas concentrations). When a number of codes and code types are applied to a singletest, these applications are referred to as comparative studies. How well the codes and users of thosecodes do in each application provides us with an impression of how simulation accuracy may beprojected to an actual plant accident analysis and, therefore, provides us with an answer to thequestion posed above.
Four ISP exercises relevant to thermalhydraulic and hydrogen distribution in a containment aredescribed in this section:
Exercise Name Facility /Experiment Description
ISP 23 HDR/T31.5 LBLOCA with natural cooldownISP 29 HDR/E11.2 SBLOCA, long-term gas distributionISP 35 NUPEC/M-7-1 Gas distribution with containment spraysISP 37 BMC/VANAM M-3 Gas distribution with aerosol injection
Table 5.4-1 shows the code application matrix for lumped-parameter and field codes that wereintroduced in Section 5.3, and are described in detail in Appendix A. One important point to bemade with this application matrix is that there has been a significant disparity between the number oflumped-parameter and field code applications in ISP exercises. Field codes have had less visibility inthe past partly because some of the experiments were not well suited to field code validation becauseof the length of the required calculational period. Their limited use in this regard is, therefore,

126
127
reflected in the ISPs described below. However, the GASFLOW/HMS code has had some exposureto ISP involvement and associated validation with complementary experimental exercises. Theseefforts are, therefore, discussed in this section in relation to the appropriate ISP heading. Validationefforts for some of the other field codes are even more limited, and the reader is encouraged toconsult Appendix A for additional information.
Each ISP is summarized below and is critically discussed. Published re-analyses of the ISPs—notpart of the ISP comparison reports—are also included to give a sense of the progress made by codedevelopers and users of various codes. In addition, some complementary exercises are also describedin order to present a more complete picture of validation efforts in the general topical area treated bythe ISP.
5.4.1 ISP 23 HDR/T31.5 (LBLOCA with natural cooldown)
This ISP exercise [18,19] involved 15 international institutions, using 17 different codes to perform"blind" predictive calculations (Table 5.4.1-1). Of particular interest were the thermal loads expectedduring the process of a large blowdown and the long-term temperature and pressure behaviourafterwards. The predictions were requested as best-estimate simulations, to allow the comparisonwith the measured reality of an experiment.
The experiment, referred to as T31.5, was performed in the large, 11 300-m3 HDR containment. Formore details, see Chapter 4 (Section 4.2.2) and References 20 to 22 of this chapter.
The analyses were requested for the following time intervals:
1. 0 < t < 5-s short-term local pressurization,
2. 0 < t < 50-s midrange period for global pressure build-up and temperature evolution, and
3. 0 < t < 1200-s long-term cooling and natural-convection period.
The third period (0 < t < 1200 s) was considered to be of particular importance for the ability topredict the distribution of heat sources and heat sinks, which were decisive for a later simulation of adistribution of light gas that was injected at 1200 s. The simulation of this gas distribution was notpart of the ISP, but was analyzed by many of the ISP participants as part of a separate T31.5 blind-benchmark exercise. Results of this benchmark are discussed in this section to the extent that theyhighlight some of the important ISP conclusions concerning the ability of the participants and codesto predict containment stratification conditions.
The first two time-interval analyses are important for evaluating capabilities to predict RCSdepressurization effects on the containment, which is the first accident phase in the threat matrixpresented in Table 3.2-1. Since this report concentrates on a later phase, core damage, which is thepost-blowdown period when long-term cooling and natural-convection phenomena begin todominate, only the third period will be discussed here.
5.4.1.1 Comparison of experimental results and calculation [20-22]
The long-term range predictions focused on the post-blowdown behaviour of the containmentatmosphere and structures. Disregarding the prediction by one participant (caused by input error) thescatter of predicted absolute containment pressures at the end of the prediction period ranges between

128
Table 5.4.1-1 Participants and codes for ISP 23
Codes Participating Institution Country RangePRESCON2 AECL Canada 0-5
0-500-1200
CATEM7PARE08
EDF. Septen France 0-50-1200
RALOC GRS Germany 0-50-500-1200
DIF5WAVCO
KWUa Germany 0-50-500-122
RELAP4/MOD6 BARCb India 0-50-500-1200
ARIANNA Pisa University Italy 0-50-500-1200
CONTEMPT4/MOD5 ETSII Spain 0-50-500-1200
HECTR 1.5 Studsvik Sweden 0-50-50withdrawn
CLAPTRAP2CLAPTRAP1
UKAEAd United Kingdom 0-50-1200
TMD NNC United Kingdom 0-50-1200
CONTEMPT4/MOD5 CEGBe United Kingdom 0-50-500-1200
HMS LANL USA 0-50-500-1200
MELCOR SNL USA 0-50-500-1200
CONTAIN 1.1 SNL USA 0-50-500-1200
HECTR SNL USA 0-50-500-1200
Post-test analysis (results received after closure date)CONTAIN 1.1 ECNf NetherlandsGRUYER-2 CEA France 0-5
0-500-1200
CONTAIN 1.1 JAERIg Japan 0-50-500-1200
aKWU KraftwerksunionbBARC Bhabha Atomic Research Centre (Bombay)cETSII Escuela Tecnica Superior de Ingenieros IndustrialesdUKAEA United Kingdom Atomic Energy Authority (London)eCEGB Central Electricity Generating BoardfECN Stichting Energieonderzoek Centrum Nederland (Netherlands Energy Research Foundation)gJAERI Japan Atomic Energy Research Institute (Tokyo)
129
0.179 MPa and 0.116 MPa (between 90% and 137% of the measured value of 0.128 MPa). Thisrange of prediction is indicative of the integral capabilities of all involved codes to simulate well theoverall heat absorption by the containment structures during the post-blowdown period.
More insight into the problem of providing a correct analysis of the post-blowdown atmosphericconditions inside the containment atmosphere was obtained from an assessment of the temperaturepredictions. A pronounced stable temperature stratification can be recognized from the measureddifference of roughly 40 K between the lowest and highest temperature sensors processed within thiscomparison. Most participants submitted the predictions of the atmospheric conditions inside thecontainment. However, only a minority of the participants reported heat flux and heat transfercoefficients that provided a more detailed understanding of heat exchange processes between theatmosphere and adjacent structures and the evolution of convective flows.
Depending on the location for which the temperature predictions have been made, the deviationsbetween locally measured and predicted temperatures differ, but they are of comparable magnitude.The deviations amount up to values of +30 K and show a decreasing tendency towards the end of theprediction period and are somewhat smaller for the dome compartment (1.1004) and the breakcompartment (1.704). Qualitatively seen predictions with more sophisticated nodalization conceptsshowed somewhat smaller scatter of calculations than those with more simplified nodalizationconcepts.
Only a minority of participants attempted to predict other locally specified parameters such as thetemperature response of concrete, the steel shell and associated heat transfer coefficients, or theconvection velocities measured by turbo flowmeters.
In general, only the participants with sophisticated models suitable for long-term range predictionssubmitted calculated results. Codes utilized for these predictions were RALOC, HECTR, ARIANNA,MELCOR and CONTAIN, besides the 3D code HMS. This is the group of codes that shouldpreferably be used to simulate the hydrogen distribution during severe accident scenarios.
5.4.1.2 Overall assessment of the results
Although the overall quality of the pressure prediction, Figure 5.4.1.2-1, may be ranked as reasonablygood, the assessment of the predicted natural-convection behaviour and the observed temperaturestratification is rather difficult. Only a limited number of measured atmospheric or structuretemperatures were requested for the analytical prediction. Out of these, again, only a small part wasprocessed by comparative plots. Thus the basis for assessment was rather small. On the other hand,even an increased number of temperature comparisons would not be enough to judge about anadequate simulation of the generated temperature stratification. The predictions of the temperaturedistribution throughout the containment suffered from the shortcomings of the codes to accuratelysimulate local and overall non-equilibrium effects existing between the gas–steam phase and thelocally deposited or condensed water.
The simulation of the heat exchange process between the containment atmosphere and the structureswas an important element of judgement, which was again hampered by certain questions regardingthe compatibility of temperature and heat transfer comparisons. Concerning natural-convectionflows, questions had been raised as to whether the available temperature measurements could form asufficient basis for a conclusion with respect to the analytical simulation capabilities.

130
A synopsis of all long-term range predictions (pressures, temperature distributions, local heat transfercoefficients, and local velocity measurements) nevertheless gives a consistent picture. The scatter oftemperature predictions corresponds to the shortcomings in the prediction of heat transfercoefficients and transport processes and vice versa. Except for the early phase immediately after theblowdown, a stable temperature distribution existed leaving little possibility for the formation ofconvective flows during the latter period of the experiment. Thus far, most of the submittedcalculations obviously predict higher-than-measured local flow rates. A review of many of theparticipants’ predictions of temperature indicated a tendency of the lumped-parameter codes topredict overmixing of the containment steam–gas mixture so that temperatures were underpredictedin the upper containment and overpredicted in the lower regions of the containment, Figures 5.4.1.2-2and 5.4.1.2-3.
In this respect, the discussion of the submitted predictions was of utmost importance for theconsecutive hydrogen distribution part of experiment T31.5. As expected, the predicted distributionof gas concentrations was closely linked to the quality of predictions of the natural-convectionphenomena observed for this standard problem. For example, the overmixing tendency observedwith lumped-parameter codes for the temperature predictions was even more apparent with the lightgas predictions performed in the benchmark exercise, Figures 5.4.1.2-4 and 5.4.1.2-5.
With respect to the field code predictions, there appeared to be problem in the code’s ability topredict gas temperatures, especially in the vicinity of the breakroom, Figure 5.4.1.2-6. In the short-term period, the code also had difficulty in predicting pressure differentials between compartments.
Figure 5.4.1.2-1 Containment pressure comparisons for selected lumped-parameter and fieldcode for ISP 23

131
Figure 5.4.1.2-2 Temperature comparison for the upper containment showing theunderprediction by lumped-parameter codes
Figure 5.4.1.2-3 Temperature comparison showing the overprediction by lumped-parametercodes

132
Figure 5.4.1.2-4 Light gas comparisons for T31.5 in the upper containment showing theunderprediction by lumped-parameter codes

133
Figure 5.4.1.2-5 Light gas comparisons for the lower containment showing theoverpredictions of the lumped-parameter codes

134
Figure 5.4.1.2-6 Temperature prediction for the field code HMS (MMM) showing thelate time overprediction in the breakroom
As with most ISPs, participants had the opportunity to perform post-test analyses of the experimentwithin the framework of the formal ISP exercise. The discussion of the results of the additional post-test analyses confirmed the preliminary assessment of the submitted blind pre-test predictions,especially with respect to the lumped-parameter codes predicting overmixing of the containmentgases. Additional problems were addressed:
• Most post-test analyses attempted to improve the temperature predictions for various elevations.The analytical simulation of the heat exchange between the fluid and the structure is a decisiveelement in getting a correct temperature distribution over the height of the HDR containment.
• Buoyancy-driven natural-convection flows may have been influenced by an existing flow split.
Two convection circuits have been assumed to prevail during the long-term range period (thisassumption was confirmed during the later discussion of the measured hydrogen concentrationsof the consecutive hydrogen distribution experiment).
• Some participants experienced the need to analyse numerical convergence with respect to the
thickness of heat-exchanging containment structures. • The importance of a correct simulation of the preceding blowdown event for an improved
simulation of the later natural-convection processes has been recognized by several participantsduring their post-test analyses.
• Many participants dealt with the sensitivity of long-term calculations with respect to the applied
fluid dynamic nodalization schemes. Certain minimum requirements for the simulation of

135
natural-convection circuits should be kept in mind, to avoid the generation of nodalizationconcepts that are totally inappropriate for this purpose.
5.4.1.3 Discussion Compared with predictions of earlier DBA-type ISP exercises, the scatter between predictions andthe measured parameters did not decrease. It was concluded that a certain saturation (i.e., limitation)in the state-of-the-art predictive accuracy to describe the traditional DBA effects had been reached.Any further increase in the accuracy and reliability of code predictions would require a number ofSETS in various fields to investigate in detail water transport and flow-resistance phenomenaoccurring in the vicinity of the assumed coolant line rupture location in the short-term phase. Suchdetailed studies cannot be performed on basis of large integral tests but would require morefundamental research. The analysis of the long-term behaviour of the containment after termination of the blowdownprocess suffers from the limited capability to simulate the distribution of energy and the heatexchange between the containment atmosphere and the containment structures. The temperatureevolution of the sump water and the associated condensate distribution throughout the containmentmay also be addressed as important processes requiring improvements in the analytical simulation. 5.4.1.4 Reasons for modelling limitations The overall picture of the exercise is indicative of the modelling limitations in terms of achievablepredictive accuracy of the kind of simulations in the ISP. There are several reasons for suchlimitations: • Computer codes simulating the containment pressurization process require input parameters that
are empirical in nature and must be derived from relevant experiments. Such parameters aregiven as correlations or simple factors describing the water droplet carryover, the flow resistancebetween adjacent compartments, and the interrelation of both complex phenomena with theadopted nodalization concept for the given structural facts.
• Also, the 3D thermalhydraulic code HMS was applied with a finite-difference mesh arrangement
too coarse for a proper simulation of flow-resistance effects, in particular for the compartment ofrupture. A much more refined grid would be necessary to capture the highly transient local floweffects without a need for fine-tuning. Otherwise, empirical fits similar to the simulationconcepts for local flow resistance within the lumped-parameter codes are required.
• As the empiricism has mostly been derived from small scale-experiments an effect of scaling
effects on large-size reactor predictions cannot be excluded. • Code users seldom exchange or share their code application experience with the involved
experts.
The observed scatter of the deviations between the required best-estimate predictions and themeasurements has some relevance also for the use of the codes in licensing procedures. It continuesto justify the instructions laid down within the rules and requirements of national licensingprocedures to warrant the conservatism of calculated results used in the design decisions and safetyassessments. It is concluded that great care must be exercised if rules and guidelines allow theincorporation of the experimental evidence obtained from experimental facilities.

136
5.4.1.5 Re-calculations
The lumped-parameter predictions of ISP 23 demonstrated an apparent common fault of these typesof codes; that is, a tendency to predict overmixing of containment gases during post-blowdownperiods when stratification conditions existed, thereby preventing convective mixing. InternationalStandard Problem 23 and the benchmark exercise quantified this tendency through temperature andlight gas distribution comparisons, respectively. For whatever reasons, perhaps because the ISP stillshowed that general trends seemed to be predicted, no ideas (short of undefended input modification)for improvement of modelling were evident at the time, or because anticipation and preparation forISP 29 diverted resources, lumped-parameter re-calculations were not reported for this ISP after thecomparison report was written.
However, in the case of the field code HMS, which clearly had a problem with temperaturepredictions and flow splits, the situation was different. The severe prediction faults indicated by ISPcomparisons appeared to point to a number of modelling shortcomings and errors. This problem waslater confirmed by the code developer, and a re-calculation of the ISP and benchmark exercise wascompleted [23]. At the time of the re-calculation, extensive model development precipitated a codename change; the field code HMS with model improvements became GASFLOW. The re-calculation, described below, was performed using the GASFLOW code.
In the GASFLOW re-calculation of test T31.5, the cylindrical 3D geometry model for the HDRfacility was refined relative to the original geometry model from the HMS analysis of the ISP. Thedome region was more finely discretized by introducing 8 additional axial segments, and the annulusbetween the steel and the concrete shell was simulated by 2 meshes instead of 1 mesh, to allowcountercurrent flow in this region. The number of meshes in azimuthal direction was maintained at24. In total 12 300 computational cells were applied for this refined model of the HDR containment,relative to the 8800 applied in the original HMS analysis. The more refined grid was considered tobe necessary, to capture the highly transient local flow effects without the need for fine-tuning.
The new model distributed the specified steel and concrete surfaces for the ISP applying the full 3Dinformation from an inspection of the containment, together with the HDR project staff. In the oldmodel, these were only homogeneously matched in each axial plane to the project specified surfaces.Fractional mesh areas were calculated at over 80 locations and were used to exactly match theproject-specified overflow openings.
Modelling of film vaporization consistent with modelling of the film condensation was important fordetermining the temperatures of the thin steel structures that heated up rapidly during the initial 50-sblowdown. It was found that these structures could only cool properly when a film vaporization wasaccounted for during the rapid pressure decrease after the blowdown. The earlier restriction toconvective heat transfer for gas temperatures below saturation left these structures on a too hightemperature level after the initial blowdown (this could explain much of the overprediction oftemperatures in the ISP comparisons). Bulk vaporization and condensation were also neglected inthe early HMS simulations; this vaporization is simulated in GASFLOW with the homogeneousequilibrium two-phase model. This model brings the gas temperatures of steam–air mixtures intoequilibrium with the saturation values.
The use of small surface nodes (0.01 cm) on the concrete structures and a dynamic mesh expansionfor the heat conduction inside the structures was a newly implemented option for the structure

137
simulation. This option was applied for the T31.5 re-analysis and was very important for theprediction of correct surface temperatures of the concrete surfaces that control steam condensation.
The re-analysis of test T31.5 with GASFLOW gave results that were in very good agreement with theexperimental data [23]. Not only pressure and temperature transients were in good agreement, butthe model also predicted the natural circulation with the right flow direction, which was not the casein the early HMS calculations. This improvement in flow was attributed to the exact specification ofthe overflow openings by use of fractional mesh areas.
The calculated light gas volume fractions in the re-analysis nearly matched the test data in the domeregion, Figure 5.4.1.5-1. A comparison of other gas sensor locations near the region of the steepconcentration gradients and below, shown also in Figure 5.4.1.5-1, appeared to indicate thatGASFLOW captured the stratification effect in the test reasonably well.
A slow mixing and homogenization of the stratified gas (time > 1 h) observed in the benchmarkexercise was not simulated with GASFLOW because of the high computation cost of the 3Dsimulation. The gas-diffusion mechanism believed to be responsible for the slow homogenizationcould therefore not be analysed, even though the GASFLOW code includes modelling for thisphenomenon. It should be pointed out, however, that the homogenization after about 6 h was blindlycalculated with the RALOC code [24].
5.4.2 ISP 29 HDR/E11.2 (Long-term gas distribution experiment)
International Standard Problem 29 was an "open" (results known) standard problem with 10participants from 8 countries using 7 different code versions (Table 5.4.2-1). For more detailedinformation see Reference 25.
Table 5.4.2-1 Participants in the International Standard Problem ISP-29(HDR Experiment E11.2)
Country Institution Code-Version IdentificationFinland VTT, Helsinki CONTAIN 1.12 AGermany 1 Battelle, Frankfurt GOTHIC BGermany 2 GRS, Köln RALOC CItaly University of Pisa FUMO DJapan JAERI, Tokaimura CONTAIN 1.11 ENetherlands ECN, Petten CONTAIN 1.12 FSweden Studsvik, Nykoeping CONTAIN 1.11 GUnited Kingdom 1 AEE, Winfrith CONTAIN 1.11 (UK) HUnited Kingdom 2 AEA, Technology MELCOR JUSA SNL CONTAIN 1.12 K
The execution of experiment E11.2 is described in detail by a test protocol [26,27]. From thephenomenological point of view, experiment E11.2 may be subdivided into 3 distinct phases: thecontainment heatup phase, the hydrogen gas-release phase immediately coupled to the second low-elevation steam release, and a cooldown period enhanced by outer spraying on the steel shell.

138
Figure 5.4.1.5-1 Light gas concentration comparisons for the GASFLOW calculationsfor HDR test T31.5

139
The main interest of the ISP 29 concentrated on containment internal natural convection flows, heatabsorption processes by structure and gas distribution. Of particular interest was the "light gas"distribution phase (15% hydrogen and 85% helium) [28]. The spraying on the outer steel shell withinner condensation represents a phase where hydrogen is enriched primarily as a result of thecondensation process. Surface condensation is a highly ranked phenomenon for predicting gasconcentrations (see Table 3.3.4-1) and therefore is simulated in all containment analyses. It wasinvestigated in ISP 29, however, under conditions that are not representative of the enrichment effectin prototypic containments because external spraying is not a typical pressure-suppression method.
5.4.2.1 Comparison of experimental results and calculations
Containment Pressure
In terms of containment overpressure, deviations between measured and calculated values of thesubmissions in a band of roughly +10 kPa to 20 kPa at a pressure of 160 kPa and -20 kPa atmaximum pressure of about 200 kPa—see Figure 5.4.2.1-1, (except 2 contributions)—may be notedup to the moment the containment cooling process started at about 975 min. After this time, thedeviations become somewhat smaller.
The global pressurization of the containment may be considered as the important indicator of theenergy status of the free atmosphere inside the containment. Thus far, the result was indicative ofgeneral shortcomings of the overall energy balance for some analytical simulation models (ASM).An ASM includes the influence of the code model itself and of the code users on the choice ofnodalization and code options. The mentioned shortcomings must be identified in more detail shouldany progress in the long-term application of these codes and how they are used be the next goal forimprovement in work.
Temperatures of the containment atmosphere:
With respect to the simulation of the conditioning period—the heatup phase ended at approximately700 min—it is evident that in simulating experiment E11.2 too much energy was transferred into thelower sections of the containment [29]. This overestimation can be seen from the calculated andmeasured temperature transient in the lower and upper containment, Figures 5.4.2.1-2 and 5.4.2.1-3.A few of the calculated temperature transients for the 6 m, the 12 m, and the 16.5 m elevation werecloser to the measured transients. But the general trend of the overestimation of the atmospherictemperatures in the lower sections of the containment and the corresponding underestimation athigher elevations is easily to be recognized from all contributions. This observation means that thetemperature stratification that existed within the HDR containment during the experiment E11.2 atthe beginning of the "light gas" injection period was not correctly simulated by most ASMs. Thistrend of underestimating an existing temperature stratification was only changed at the moment whenthe second late steam injection in the lower section of the containment was started at about 740 mininto the experimental transient. After initiating the late steam injection, the heatup of the lowercontainment section took place. The upper sections of the containment were mixed with the low-temperature atmosphere from the middle elevations pushed upwards by the lower-section steamrelease.
Gas concentrations:
The transient evaluation of gas concentrations had been compared with measurements taken from alarge number of sensors positioned at various elevations within the containment. In assessing the

140
results of the comparisons, Figure 5.4.2.1-4, it is evident that after starting the "light gas" injection at740 min all the ASMs simulated, as in the heatup phase, too much convection into the medium andlower regions of the containment, thereby drastically increasing the computed gas concentrationsbelow the 17.5-m elevation of the gas-release location contrary to the measured evidence. Incompensation, calculated gas concentrations are considerably lower than the measured concentrationtransients at the higher elevations. Only in the middle section in the vicinity of the gas-releaseelevation, the calculated gas concentration transients were somewhat similar to all the measuredtransients. From the results, it was evident that too much gas was mixed into the lower section of thecontainment that, on the other hand, was lacking within the upper regions. Obviously, the sametrends as those observed for the transient temperature and steam concentration simulations dominatedthe calculated gas concentration process in comparison with the measured evidence.
During the time that the lower steam was injected into the containment, the gas concentration in theupper containment, 48-m elevation, was observed to increase from 12% to 16% over an approximate200-min time period, Figure 5.4.2.1-5. Evidently, the injected steam in the lower containment waseffectively pushing light gas into the upper dome region. Unfortunately, most of the codes did notpredict this important trend because of the strong tendency to overmix gases. This inability to predictan increase in gas enrichment was considered to be a serious fault of the lumped-parameter codecalculations.
Steam Concentrations
The predictions of gas-concentration distributions aim for an assessment of the flammability status ofthe containment atmosphere. The presence of steam in a post-LOCA atmosphere inside thecontainment is an important factor too. It is influential on the mode of combustion and, if steamconcentrations are large enough, they even inhibit flammability. Hence the comparison of measuredversus calculated steam concentration transients is of similar safety relevance as is the comparison ofgas concentrations.
Again, large discrepancies between measured and calculated steam concentrations were evident, asshown in Figure 5.4.2.1-6. In particular, during the "conditioning period" much more steam transportinto the lower elevations of the containment had been simulated than what had actually occurred.These tendencies continued to influence the results also for the period of "light gas" injection anddistribution. Even, if we find reasonable agreement between calculations and measurements (e.g., forthe conditioning phase in the lower elevations) for certain sensors the same calculations show evenmore disagreement for other sensors (e.g., results generated with the same ASM for the higherelevations). Overall, it must be concluded that calculated steam concentrations, as well as gasconcentrations, could not be considered as a reliable basis should they serve for a subsequentprediction of an expected combustion mode.
Containment sump temperatures
From the sump temperature measurements it can be concluded that water collected within the sumpobviously was cooled down very efficiently by the cold structures of the lower containment whenreaching the sump.
The comparison between calculated and measured sump temperatures showed that several codes donot correctly model the cooldown of the condensate when reaching the sump level. Problems may beassociated with the analytical treatment of the thermal non-equilibrium between the atmospheric andthe liquid phases.

141
Condensation rates
Only two submissions attempted to present calculated condensation rates in comparison with tworates derived from measurements. These comparisons showed that these two submissions(CONTAIN - KKK and FUMO - DDD) significantly underestimated the shell wall condensation rate,Figure 5.4.2.1-7.
The period of water spray on the outside of the steel shell
Particular interest has been expressed for a detailed comparison of the gas concentration transientsfor the period of outer spraying. The local steam concentrations are considerably reduced bycondensation on the inside of the externally cooled steel shell dome.
The gas-concentration transients were compared for the period between 950 min and 1300 min (whenmost simulations were terminated). Not all submissions covered this time period. All thecomparative plots—for example, Figure 5.4.2.1-8, showing gas concentrations as well as thecomparisons of the steam concentrations—indicated that during the period of external spray cooling,serious simulation problems existed. The safety relevance of these observations was a matter ofdiscussion for the final workshop.
Many of the typical PWR containments have installed an internal water spray cooling system toprovide long-term pressure reduction within a containment. The findings of this exercise, however,have been obtained from an experiment with external spray cooling. Direct transference of theanalytical simulation model for this type of cooling to current plants cannot be made, as mentionedpreviously, because of the non-typical aspect of the process; however, the phenomena representedduring the external spraying period are of general interest for understanding the interactions betweencondensation and mixing processes, that is, when rich steam–air mixtures come into contact withcold surfaces.
5.4.2.2 Discussion
Both the ISP 23 exercise as well as the supplementary PHDR-organized code comparison exercise onthe hydrogen distribution scoping experiment were performed as "blind" post-test predictions. Incontrast, ISP 29 was an "open" post-test analyses of HDR experiment E11.2, the results of whichwere known to the participants in detail. One would have expected to see calculated results in closeragreement with the measured evidence. The achieved agreement (or disagreement) may beconsidered as the best-possible results obtained by the adopted analytical simulation models at thattime.
One specific item of the experiment, not typical for full-size plant behaviour, was the comparativelylarge portion of energy extracted during the experiment by the instrument cooling system. Itcomplicated the analytical simulation procedure. Sensitivity studies confirmed the improvementsbetween calculated and measured global pressure transients if instrument cooling was taken intoaccount. Several experts involved in the exercise questioned the effect of locally extracted energyfrom the instrument cooling lines; the removal of an uncertain amount of energy locally wasconsidered relevant for some shortcomings in calculated temperatures and gas-concentrationdistributions. On the other hand, resulting improvements in calculated and measured localtemperature and gas-concentration transients are not easy to assess in general. Taking into accountadditional local cooling within high-temperature areas might even have amplified calculatedconvective flow rates, thereby promoting mixing of the atmosphere. For future exercises, should

142
they be based on experiments with similar cooling problems, a more detailed background informationon this experimental item would be helpful.
Compared with the results submitted within the framework of the "pretest" predictions for test E11.2the results of the post-test analyses (ISP 29) showed a reasonable agreement between the calculatedand the measured overall pressure transients. This improvement was essentially related to theapplication of a realistic energy input function for the "post-test" analyses taking into account alsothe instrument cooling. 1
The overall containment pressure may be considered as being indicative for the overall energy statusof the containment atmosphere. For some contributions the margin of uncertainties(maximum +30 kPa to 20 kPa deviation from the measured value) of the involved ASMs cannot beconsidered as a satisfactory result of a best-possible post-test analysis. Other ASMs reached a betteragreement.
The margins for the observed local temperature simulations consistently indicated energy distributionproblems within the containment atmosphere. The comparison of calculated with measuredatmosphere temperatures and of the gas concentrations demonstrated that for this experiment toomuch energy-and-gas transport was simulated to have occurred within the HDR containment.Thermal non-equilibrium between the containment atmosphere and condensate formed oncontainment internal structures may have amplified the simulation difficulties.
The calculated gas-concentration distribution as another process-determining parameter relevant forthe safety issue of this exercise showed relatively large deviations from the measured transientparameters. Taking into account that the exercise was specified as an "open post-test" analysis ofwell-known measured data, the workshop discussed extensively the qualification of the lumped-parameter codes for these types of phenomena. It was concluded that, at that moment, ASMs basedon the lumped-parameter approach were considered as inaccurate to describe the PHDR experimentE11.2, which was essentially governed by buoyancy-driven natural-convection processes and a highdegree of thermal stratification [29].
Having this consideration in view, the workshop participants extensively discussed possible reasonsthat could have led to the observed analytical deficiencies. Several processes were identified asdeserving closer considerations before overall improvements of the ASMs might be expected. Thelong-term absorption of energy by relatively cold containment structures and the associatedprediction of long-acting heat sources and heat sinks, as well as the predictability of the temperatureof the sump water collected during the experiment, were the main objects of the discussions.
An important feature of the experiment was the conditioning phase. The interrelations between thesteam release periods and the hydrogen release period were discussed as being a relevantphenomenological sequence of events.
1 A E11.2 benchmark exercise was performed using a steam injection mass rate that was in error byapproximately 30% and without specification of the instrument cooling effect. Participants in this exercisepredicted containment pressures that were significantly higher than those measured because of the specifiedlarger energy injection and unspecified instrument cooling effect. Scatter in the results were also quite large,prompting further studies of user induced variations. Results of these studies were documented in a report [30]and in conference papers [29,31]. Many of the case studies involving user impact were repeated within thescope of the ISP 29 exercise as sensitivity calculations; therefore, the results of the benchmark exercise are notdiscussed here, but the reader is referred to the references listed at the end of this chapter and to a more detaileddiscussion in Appendix B.
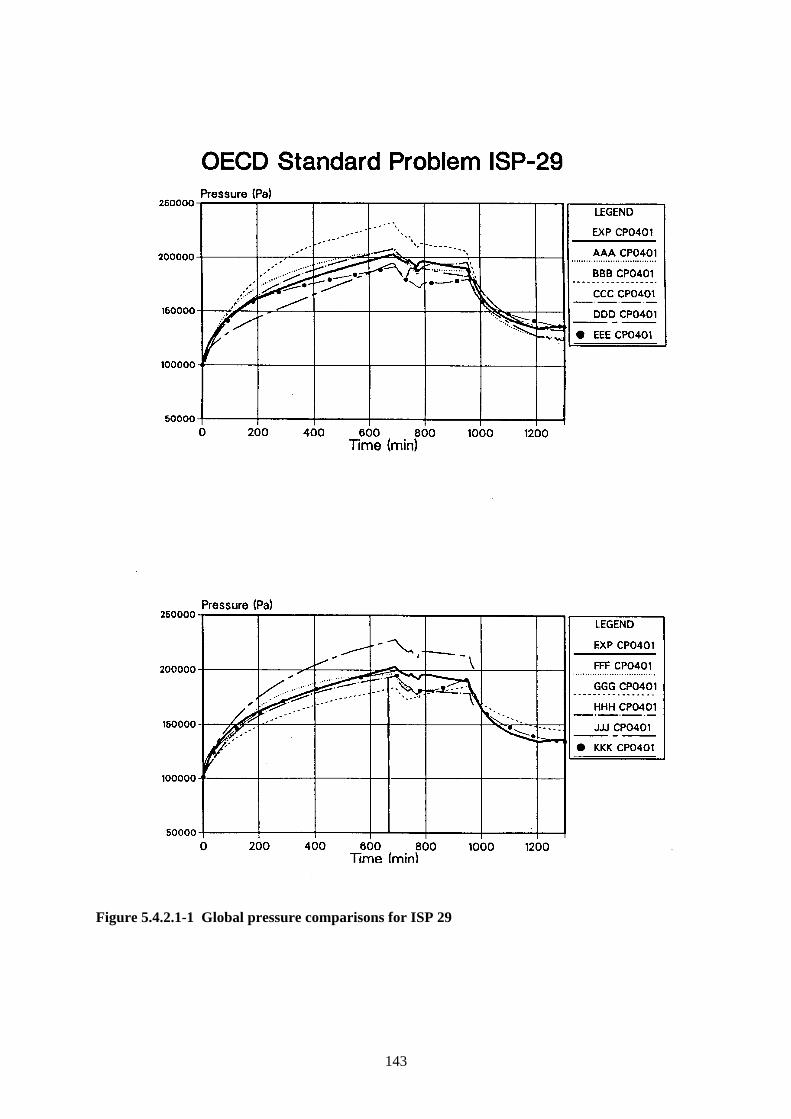
143
Figure 5.4.2.1-1 Global pressure comparisons for ISP 29

144
Figure 5.4.2.1-2 Temperature comparisons in the lower containment for ISP 29

145
Figure 5.4.2.1-3 Temperature comparisons in the upper dome for ISP 29
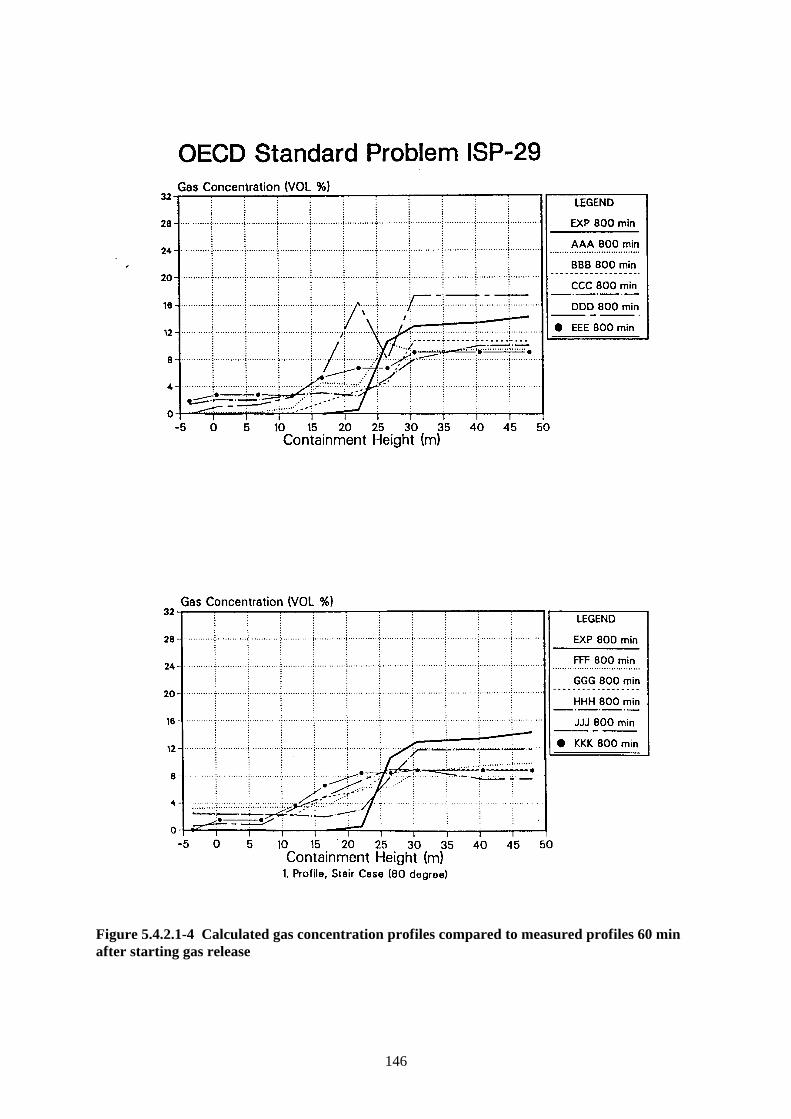
146
Figure 5.4.2.1-4 Calculated gas concentration profiles compared to measured profiles 60 minafter starting gas release

147
Figure 5.4.2.1-5 Gas concentration comparisons during the low steam injection period

148
Figure 5.4.2.1-6 Steam concentration comparisons in the lower containment

149
Figure 5.4.2.1-7 Calculated and compared wall condensations rates for ISP 29

150
Figure 5.4.2.1-8 Gas concentration comparison at two locations in the upper dome of thecontainment

151
The influence of nodalization schemes on the ability of existing lumped-parameter codes to makeaccurate predictions required further considerations. More reliable code-user guidelines should bemade available to the code users, to minimize the potential for wrong user decisions when setting upASMs. There is no value in code users applying input data that deviate from the given facts of theapparatus to be simulated without full physical or engineering justification. This requirement aimedat the reduction of virtual flow areas resulting from the fictitious subdivision of the large containmentdome volume and on flow loss coefficients, which had been modified far beyond the marginsexperienced and documented within the relevant engineering literature.
Merits and limits of a transition from the use of lumped-parameter codes to finite-element methods(FEMs) or to 3D thermalhydraulic codes were discussed. The reasons for the difficulties encounteredwith this exercise may be due to the physical phenomena (plumes, temperature inversion etc.) thatare not included in the standard lumped-parameter codes or, indeed, it may be that the specificationof some boundary conditions is still uncertain. Hence any firm recommendation to abandon lumped-parameter codes was considered to be premature at the time of the workshop.
5.4.2.3 Re-calculations, post-test analysis, and other calculations
The reported problems that lumped-parameter codes had in predicting stratification profiles in theISP 23 and test T31.5 benchmark exercise were noted as being even more severe in ISP 29. Bothexperiments T31.5 and E11.2 involved mid-elevation injections, and the stratification interfacedeveloped just below the injection location. In another benchmark exercise [29], for test E11.4, thesteam and gas injections were located in the lower containment. These injections resulted in a nearhomogeneous mixture of steam and gas in the containment. As would be expected, the lumped-parameter codes did significantly better in predicting steam–gas mixture concentrations for this testcompared with test E11.2, as shown in Figure 5.4.2.3-1. Some of the details of this exercise can befound in Reference 29 and in Appendix B. However, even with the apparent successes in the E11.4benchmark, a number of developers of lumped-parameter codes felt the need to re-assess the fluidflow modelling in their codes. In addition, test E11.2 provided an opportunity to again look atalternative simulation models; this suggestion involved the engineering field code, GASFLOW.International Standard Problem 29, specifically test E11.2, therefore became a proving test for codepredictions of hydrogen distribution where inter- and intra-compartment mixing phenomena wereknown to be important.
5.4.2.4 Lumped-parameter codes
Lumped-parameter sensitivity studies, some of which were reported in the appendix to the ISP finalreport, investigated a number of the suggested possible reasons for the difficulties encountered inpredicting the E11.2 stratifications and mixing phenomena. These investigations includednodalization, flow-path resistance modelling, and test specification uncertainties (like the instrumentcooling system). None of these studies resulted in a defendable fix to the problem that the lumped-parameter codes were having with predicting stratifications.
Code developers began to further investigate what could be reasons for the code’s inability to predictstable stratifications. Three code development efforts are documented in this area, involving thecodes CONTAIN, MAAP, and FUMO.

152
Figure 5.4.2.3-1 Gas concentration comparisons in the upper containment during the gasrelease for the E11.4 benchmark exercise

153
In the case of the CONTAIN code, a new hybrid flow solver was developed [32] to treat fullydeveloped stable stratifications (A fully developed stratification is one in which the conditions areessentially well mixed above the injection point but stratified with respect to regions below theinjection point [30].) This analysis was accomplished by including a new gravitational headformulation for the treatment of stratified flows. The new formulation, termed the hybridformulation or hybrid flow solver, extends the predictive capability of the code to include fullydeveloped, stably stratified conditions that form in a containment as a result of a heat source orbuoyant gas injection. Details of the hydrid flow model and the demonstrated improvements in thepredictive capabilities for test E11.2 and other stratified tests are discussed in detail in Reference 32.As a consequence of this new formulation, the code is now able to correctly calculate the gradualincrease in the upper dome gas concentration during the low steam injection and the rapid increaseafter the external spray cooling of the HDR dome, Figure 5.4.2.4-1.
The MAAP code was not a participant in the ISP 29 exercise but was a participant in an E11.2 blind-benchmark exercise that preceded the ISP [29-31]. In the re-calculation of the E11.2 test, using theMAAP4 code [33], stratification modelling was enabled by using a subnodal physics model, invokedby user input [31]. The subnodal physics model allows modelling the penetration of a stratificationinterface in the vertical direction within a lumped-parameter node using static head differences. Inaddition, algebraic expressions, derived to describe gaseous plumes rise and dilution caused byentrainment, have also been added to the code. As indicated by the comparison of the light gasconcentrations for test E11.2, the MAAP modelling appears to calculate well the gradual and rapidgas concentration increase in the HDR upper dome, Figure 5.4.2.4-2, as a result of being able topredict thermal and gas concentration stratifications observed in the containment.
The FUMO code now also includes a stratification model [34]. This model is organized in twotemporal phases: in the first one the buoyancy mass flow towards the upper zone of an analysed node(each lumped-parameter node is divided into n vertical zones) is described and, in the second one, thehomogenization of the gas and steam concentrations, resulting from the diffusion process towards thelower zone, is simulated. Shown in Figure 5.4.2.4-3 is the comparison of the new and old FUMOcalculations during the gradual and rapid gas concentrations rises for test E11.2.
5.4.2.5 Field code
The field code GASFLOW is the only 3D code that has been used to calculate HDR test E11.2. Thiscode was not included as a participant in the ISP 29 exercise, but an earlier version of the code,HMS, was a participant in the ISP 23 exercise. A total of 12 300 computational cells was applied forthis geometry. This complex representation of the HDR Facility represents a significantaccomplishment and time commitment to the detailed modelling of this facility, an effort that builton previous HDR modelling efforts conducted with HMS, as reported for ISP 23. In addition, itshould be noted that the GASFLOW calculations here took advantage of an accumulated knowledgebase on the E11.2 test, which was not available to participants in ISP 29: this knowledge baseincluded information on flow junctions and heat sink availability [35] and other parameter studiesthat showed the relative importance of various geometrical model features for improved comparisonswith measurements. The 3D model results for the light gas, gradual and rapid increase—the sameperiod calculated for the lumped-parameter codes—is shown in Figure 5.4.2.5-1. The GASFLOWsimulation of hydrogen enrichment because of condensation enhanced by the spray cooling effect isalso in good agreement with test data (as also observed with the CONTAIN and MAAP codes, inparticular). Secondary circulation, identified in the GASFLOW calculation, was suggested as one ofthe contributors to this observed enrichment process.

154
Figure 5.4.2.4-1 Gas concentrations comparisons for the ISP 29 showing the improvementusing the CONTAIN hybrid flow solver [32]
Figure 5.4.2.4-2 Gas concentration comparisons in the upper containment for the MAAP4 codeusing the subnodal physics model [33]

155
Figure 5.4.2.4-3 Gas concentration comparisons for the FUMO code using a stratificationmodel
Figure 5.4.2.5-1 Gas concentration comparisons for test E11.2 using the field code, GASFLOW

156
5.4.3 ISP 35 NUPEC/M-7-1 (Gas distribution with containment sprays)
Twelve organizations from ten countries used eight codes to participate in a blind-test analysis ofcontainment pressure, gas temperature, and concentrations of helium, which were measured within asteel containment. After conducting the blind analysis, the M-7-1 test was re-analyzed as an openproblem by 17 organizations including the original 12. Codes, used in the ISP 35 exercise are shownin Table 5.4.3-1 for the blind, delayed post-, and open post-ISP analyses. Major findings in the blindexercise of ISP 35 are summarized in Table 5.4.3-2.
5.4.3.1 Comparisons of experimental results and calculations
Analytical predictions of the containment vessel helium concentration distributions, gas temperaturedistributions, and pressure as a function of time show reasonable agreement with experimental data.
Helium concentration distributions
During the experiment, the large water flow rate of the dome spray produced a well-mixedenvironment within the containment vessel. Only three compartments (CV 8, 15, and 21), includingthe helium mixture gas injection compartment and those associated with the main upward flow path,exhibited concentrations higher than those of the remaining compartments. These threecompartments registered concentrations of up to 16% before falling back to the 12% equilibriumlevel. The other compartments exhibited a steady build-up of helium gas, towards a finalconcentration level at around 12%. These tendencies of concentration distributions were generallywell predicted by all participants.
Natural-circulation behaviour in the containment vessel was also well predicted during helium gasinjection. A narrow distribution range in concentration, which indicates a well-mixed gas mixturebecause of natural circulation, was observed in the experiment. Some codes (RALOC, FUMO)predicted a wide distribution range in concentrations (Predicted distribution range widths were 2 to 5times greater than those of the experiments. See row 3 of Table 5.4.3-2 (c ). This indicated thatthose codes distributed too much of the helium to the upper regions of the containment vessel,resulting in lower concentrations at lower elevations. Other codes predicted a narrow range ofconcentrations close to the experimental data.
The helium concentrations in the dome compartment (CV 25) and gas injection compartment, as wellas the three compartments associated with the main upward flow path, were very well predicted by allcodes, both quantitatively and qualitatively—except for a few codes. Figures 5.4.3.1-1 andFigure 5.4.3.1-2 show comparisons of the calculation results of all participating codes versus theexperimental results as a function of time, in the dome and in the gas injection compartmentrespectively.
The maximum helium concentrations, which were observed in the gas injection compartment (CV 8)and in the associated two compartments (CV 15 and 21) above, were also very well predicted, thoughthe calculation results show an underestimation by 2 to 4 vol % of helium concentration at around thepeak point, as shown in Figure 5.4.3.1-2). This tendency to underestimate might be attributed to acalculated uniform concentration in a non-uniform gas concentration compartment in which thechimney phenomenon caused by hot gas injection is observed.

157
Table 5.4.3-1 Participants and codes for ISP 35 (Note that the post-analysis list of participantsincludes only participants for the delayed contributions to the blind exercise. Essentially, allparticipants in the exercise made contributions to an open problem, completed after the ISPresults were released (C).)
(a) Blind Analysis
Participating Organization Computer Code Country
TRACTEBEL MELCOR 1.8.2 BelgiumAEA NNC Ltd. CONTAIN 1.12
COMPACTUnited Kingdom
University of Pisa FUMO ItalyJRC, Ispra CONTAIN 1.12 CECPSI WAVCO SwitzerlandGRS RALOC GermanyIVO RALOC FinlandKEMA MAAP 4.0 NetherlandsUSNRC/SNLUSDOE/Westinghouse
CONTAIN 1.12WGOTHIC 1.0
United States of America
JAERI/MRI CONTAIN 1.12 Japan
(b) Post-analysis
Participating Organization Computer Code Country
CEA/IPSN/DPEI JERICO FranceKINS CONTAIN 1.12 KoreaNUPEC/CSDMHIHITACHI
MELCOR 1.8.2MAPHY-BURNCONTAIN 1.10
Japan
( c) Open Post-ISP Analysis
Participating Organization Computer Code Country
AEA CONTAIN 1.12 United KingdomJAERI CONTAIN 1.12 JapanJRC CONTAIN 1.12 ItalySNL CONTAIN 1.12 United States of AmericaGRS RALOC 2.2 GermanyIVO RALOC 2.2 FinlandPISA FUMO ItalyKEMA MAAP 4.0 NetherlandsNNC COMPACT United KingdomWestinghouse WGOTHIC 1.0 United States of AmericaIPSN JERICO FranceKINS CONTAIN 1.12 KoreaMHI MAPHY-BURN JapanHITACHI CONTAIN 1.12 JapanNUPEC MELCOR 1.8.2 Japan

158
Table 5.4.3-2 Major comparison results of ISP 35
(a) Containment pressureStage Phenomena in the Experiment Code Predictability
1. 0 - 10 min <Rapid pressure drop>because of spray cooling effect tothe atmosphere
<Overestimated> because of-over-prediction of the spraycooling effect-lack of the spray water distributionto the containment vessel walls
2. 10 - 30 min <Gradual pressure rise>because of the hot gas injectioninto the Containment Vessel
<Well predicted>
3. 30 - min (after spray shower andhot gas injection stopped)
<Continual pressure rise>:due to heat release from thecontainment Vessel walls
<Overestimated> because of-insufficient cooling of thecontainment vessel walls duringspray activation period-large heat release from thecontainment vessel walls to thedome atmosphere
(b) Gas temperature distribution in the containment vesselPhenomena in the Experiment Code predictability
<Significant temperature increase in the threecompartments: CV 8, 15, 21>
<Well predicted>
<Small temperature rise in the maximum temperaturepoint because of rapid gas mixing and spray effect>
<less temperature rise> because oftoo much gas mixing and spray effect
<Indication of stratification in the containment vessel>:∆ T(BOT/MOT/EOT) = 5/10/5°Cnote:∆T: temperature distribution range widthBOT: beginning of the test period (at t = 0 s)MOT: middle of the test period (at t = 15 min)EOT: end of the test period (at t = 30 min)cf: flow resistance coefficient
<Well-predicted group>:∆ T(BOT/MOT/EOT) = 5/10/10°Cdue to good spray modelling,: appropriate cf distribution<Unsuccessful prediction group>: ∆ T(BOT/MOT/EOT) = 5/15∼20/15∼20°Cbecause of limited spray modelling
(c) Helium concentration distribution in the containment vesselPhenomena in the Experiment Code predictability
<Three high He concentration compartments in themain upward flow path: compartments CV 8, 15, 21>
<Well predicted>
<He peak concentration> <Underestimated> because of too much gas mixingeffect
<Indication of stratification in the containment vessel(except compartments CV 8, 15, 21)>:∆ C(BOT/MOT/EOT) = 0/4/2 vol %note:∆C: He concentration distribution range widthBOT: beginning of the test period (at t = 0 s)MOT: middle of the test period (at t = 15 min)EOT: end of the test period (at t = 30 min)cf: flow resistance coefficient
<Well-predicted group>∆ C(BOT/MOT/EOT) = 0/3∼5/2∼4 vol %because of appropriate cf distribution
<Unsuccessful prediction group>:∆ C(BOT/MOT/EOT) = 0/8∼12/6∼10 vol %because of too much He accumulation in the upperregions of the containment vessel
<Steadily and uniform concentration increase andgradual concentration conversion after helium gasinjection stopped>
<Well predicted>

159
Figure 5.4.3.1-1 Helium concentration comparisons for the dome compartment (CV 25)
Figure 5.4.3.1-2 Helium concentration comparisons for the gas injection compartment (CV 8)
160
Gas temperature distributions
The gas temperatures in the containment vessel were decreased rapidly by the containment spraywater, though there was, at the beginning, a significant temperature increase in the hot gas injectioncompartment (CV 8) and its two associated compartments (CV 15 and 21) described above. Allcompartments recorded temperatures in a narrow range, the width being approximately from 5°C to10°C during the test period. This observation means that gas in the containment vessel was wellmixed and cooled by natural circulation and spray droplets.
In general, all codes predicted well the tendency of the temperature distributions. However, in somecodes, because of limited spray modelling, or because of inappropriate net flow loss coefficients orbecause of containment vessel noding, a rather wide range in the temperature distribution, as muchas 15°C to 20°C, was observed.
In the case of the maximum gas temperature, measured in the injection compartment, a rapid butsmall temperature rise was observed. The temperature increase was only 7°C. Most codes predictedthis increase but with a magnitude of less than 3°C. An explanation is that the local temperature in acompartment can be detected by a sensor, whereas lumped-parameter codes calculate the averagetemperature of the compartment.
Containment wall temperatures
The experimental conditions resulted in a large temperature drop of the containment surface wall; thissurface was probably impinged upon by the spray droplets or the heat transfer on it was enhanced bythe spray-induced turbulent flow or both. Few calculated results show the full temperature decreaseof the containment wall.
Gas flow rates
In the M-7-1 test, no experimental data of the gas flow rate in the containment vessel were obtainedbecause the flow-velocity measuring instruments were not available in a wet environment. Therefore,the results of the calculation were used in explaining the helium concentration distributions in thecontainment vessel.
A remarkably large upward gas flow rate, the chimney phenomenon, of which the magnitude was 10times greater than that of the injected mixture gas flow rate, was obtained in the main flow pathsassociated with the mixture gas injection compartment during the gas injection period. This findingsupports the hypothesis that a large amount of air flowed into the main flow path from the adjacentcompartments by the "plume effect". All codes calculated the chimney phenomenon, though therewas a slight difference in magnitude among the results of the various codes. A rapid heliumconcentration increase in the three compartments associated with the main flow path could beexplained by this chimney phenomenon.
A relatively large branching flow from the main upward flow path to an adjacent compartment wasalso observed in most of the codes during the gas injection period. Codes that calculated this largebranching flow overestimated the helium concentration in the adjacent compartment. A few codeusers who adjusted flow resistance coefficients, which is a user-specified input, calculated much lessbranching flow and better predicted the helium concentration in the compartment than the others.

161
Containment dome pressure
The dome pressure transient is divided into three stages: two stages during gas injection and sprayactivation periods and one stage after gas injection and spray shower were terminated. In the firststage (0 to l0 min), a rapid pressure drop caused by the spray shower was observed. All codesoverestimated this pressure drop tendency because of an overestimated spray cooling effect in thecontainment vessel. Some codes failed to distribute spray water to the containment vessel walls.
In the second stage (l0 to 30 min), a gradual pressure rise resulting from hot gas accumulation wasobserved. This phenomenon was well predicted by all codes.
Because of heat release from the containment vessel wall to the inside atmosphere, the pressure riseduring the third stage (after 30 min, when the spray was turned off) continued even after gas injectionstopped. All codes predicted this phenomenon; however, the pressure increase rate was alwaysoverestimated. The overestimation indicates that codes calculated a large heat return from thecontainment vessel wall, which was apparently otherwise compensated for by the earlier spray effect.
5.4.3.2 Discussion
A number of observations were well predicted in this experiment: the helium concentration in thedome compartment; the helium concentration in three compartments (CV 8, 15, and 21) associatedwith the main upward flow path; and the dome pressure transient behaviour. Yet discrepancies werealso noted. For instance, there were calculational problems in predicting the helium concentration inthe dead-end (CV 16) compartment and in predicting the dome wall temperatures.
Figure 5.4.3.2-1 shows the helium concentration transient in the dead-end compartment from both thecalculations of all participating codes and the experimental results. The discrepancies were attributedmainly to two modelling and to one experimental concern. For the modelling concerns, the followingpoints were mentioned: an inability to model counterflow in one flow path; and insufficientmodelling of sprays that enhance not only atmosphere and wall cooling but also the naturalcirculation in the containment vessel. The experimental concern related to whether the measuredconcentration in the complex-shaped, dead-end compartment was representative of the compartmentgas mixture concentration or whether a better representation could have been made if more detectorswould have been used.
In summary, the participants found qualitative agreement in modelling the dominant parameters ofhydrogen mixing. However, from a quantitative view point, discrepancies were observed betweencalculated and experimental results. Since the spray shower enhanced the natural circulation in thecontainment vessel, the helium concentrations in almost all of the compartments in the containmentvessel were very well predicted. There were discrepancies in concentrations calculated for the dead-end and complex-shaped compartments; however, because of the very low concentrations in thesecompartments and the small volume of these compartments, these discrepancies did not influence thehelium distributions in other regions of the containment vessel. The mentioned discrepancy in thedome wall temperature also did not appear to influence the helium distributions in the containmentvessel during the test period. It was apparent that user experience with noding schemes and flowresistance influenced the results of the calculations. The observation indicated that a user’sknowledge can lead to better agreement with experimental results.

162
Figure 5.4.3.2-1 Helium concentration comparisons for the dead-end compartment (CV 16)
Post-analysis and other calculations
Since most of the helium concentrations were already well predicted in the blind exercises, therewere only minimal improvements in the-open test calculations for test M-7-1, described in theappendix to the ISP [36]. However, other tests in the NUPEC series of light gas releases were usedfor other post-test exercises and for further analytical study. Details of some of the post-test analysesperformed with the CONTAIN and MELCOR codes for tests M-4-3, M-8-1, and M-8-2 are presentedin Section B.3 of Appendix B. Test M-8-1 was an especially interesting complement test totest M-7-1. Whereas test M-7-1 (ISP 35) had a low release point for helium, test M-8-1 had a releasepoint in the middle elevation of the containment. In addition, test M-8-1 had no sprays to mix thecontainment gases. The higher release point and no sprays resulted in a classical, stable, fullydeveloped stratification. Helium concentration predictions using the CONTAIN code, with andwithout a hybrid flow solver, were compared in Reference 32 with helium measurements taken in thefacility. The calculations obtained with the hybrid flow solver indicated a significant improvementusing the recently developed new flow solver method compared with the old way of calculatingstratification conditions within a containment, as shown in Figure 5.4.3.3-1. The results appearencouraging for predicting this category of stratification.
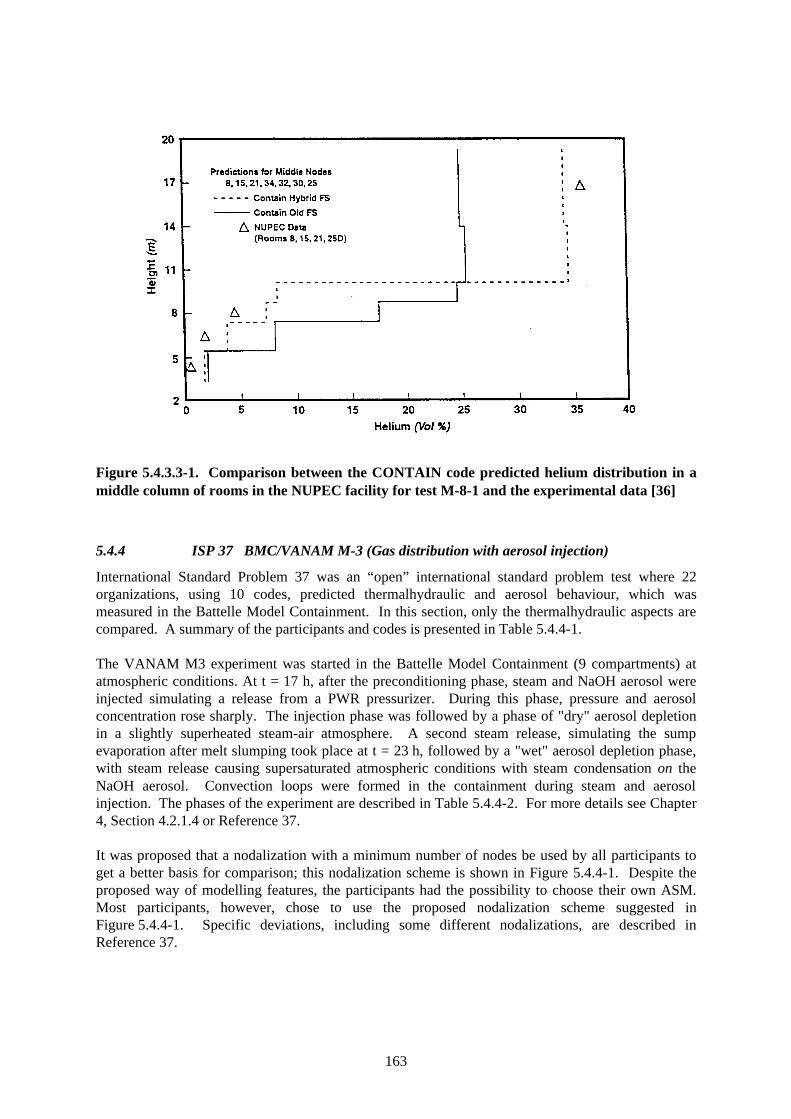
163
Figure 5.4.3.3-1. Comparison between the CONTAIN code predicted helium distribution in amiddle column of rooms in the NUPEC facility for test M-8-1 and the experimental data [36]
5.4.4 ISP 37 BMC/VANAM M-3 (Gas distribution with aerosol injection)
International Standard Problem 37 was an “open” international standard problem test where 22organizations, using 10 codes, predicted thermalhydraulic and aerosol behaviour, which wasmeasured in the Battelle Model Containment. In this section, only the thermalhydraulic aspects arecompared. A summary of the participants and codes is presented in Table 5.4.4-1.
The VANAM M3 experiment was started in the Battelle Model Containment (9 compartments) atatmospheric conditions. At t = 17 h, after the preconditioning phase, steam and NaOH aerosol wereinjected simulating a release from a PWR pressurizer. During this phase, pressure and aerosolconcentration rose sharply. The injection phase was followed by a phase of "dry" aerosol depletionin a slightly superheated steam-air atmosphere. A second steam release, simulating the sumpevaporation after melt slumping took place at t = 23 h, followed by a "wet" aerosol depletion phase,with steam release causing supersaturated atmospheric conditions with steam condensation on theNaOH aerosol. Convection loops were formed in the containment during steam and aerosolinjection. The phases of the experiment are described in Table 5.4.4-2. For more details see Chapter4, Section 4.2.1.4 or Reference 37.
It was proposed that a nodalization with a minimum number of nodes be used by all participants toget a better basis for comparison; this nodalization scheme is shown in Figure 5.4.4-1. Despite theproposed way of modelling features, the participants had the possibility to choose their own ASM.Most participants, however, chose to use the proposed nodalization scheme suggested inFigure 5.4.4-1. Specific deviations, including some different nodalizations, are described inReference 37.

164
Table 5.4.4-1 Participants and codes for ISP37
Code ParticipatingInstitution
ISP 37Abbreviation
ThermalHydraulic
Results
AerosolResults
CONTAIN CIEMATECNKurchatov Inst.VUJEFZK
CIEMATECNKI-CONVUJE-CONFZK
SpainNetherlandsRussiaSlovakiaGermany
xxxxx
xxxxx
MELCOR CTN-UPMENEAKAERIKurchatov Inst.NUPECRuss. Acad. of Sci.SNLStudsvik Eco SafeVUJERussian Institute ofAtomic Reactor
CTNENEAKAERIKI-MELNUP-MELRASSNLSTUVUJE-MELRIAR
SpainItalyKoreaRussiaJapanRussiaUSASwedenSlovakiaRussia
xxxxxxxxxx
xxxxxxxxx
FIPLOC IPSN/GRSGRS/IPSNIFEIFEJRC
IPSN/GRS/FsGRS/IPSN-FeIFE-1IFE-2FRC
France/GermanyGermany/FranceGermanyGermanyEuropeanCommunity
xxx
x
xxx
x
RALOCGOTHICFUMOECART
MACRESMOSAICREMOVAL
GRS/IPSNBattelleUniversity of PisaUniversity ofPisa/ENELNUPECIKEJAERI
GRS/IPSN-ReBattelleUPISENEL
NUP-MaIKEJAERI
Germany/FranceGermanyItalyItaly
JapanGermanyJapan
xxxx x
x
xx
Table 5.4.4-2 Test phases for VANAM M-3
TestPhase
Time Period(h)
Description Comment
I 1.13 - 17.2 Facility heatup Initial air removalre-injection of air at end of period
II 17.2 - 18.23 First aerosol release Steam–air carrier gasIII 18.23 - 22.7 Dry aerosol depletion No injectionIV 22.7 - 23.14 Second aerosol release Steam/air carrier gasV 23.14 - 25.26 Wet aerosol depletion First 10 min no injection
Steam released into R3VI 25.26 - 30 Further wet aerosol depletion Steam released into R5

165

166
5.4.4.1 Comparison between experimental results and calculations
Because of the large number of submitted results, a reference calculation was chosen for each codegroup, which best matches the following criteria:
- simulation of the atmospheric stratification,
- use of the specified input, and
- agreement with the experimental flow velocities.
The selected reference calculations are:
Code ParticipantCONTAIN CIEMATMELCOR NUPEC-MELFIPLOC/RALOC GRS/IPSNGOTHICa BattelleFUMOa UPISA
aOnly one calculation was done with GOTHIC and FUMO.
The comparison of the data was done in two ways: first, between the experiment and the referencecalculations of the different codes; and second, between the experiment and those calculations usingthe same code. The aim of the comparisons between the calculations using the same code was toidentify a code-typical behaviour and to explain deviations between the calculations. This procedurewas followed, in particular, with the pressure data.
Containment pressure
The containment pressure of the reference calculation of each code followed the experimental curvefairly closely and showed the same trends, Figure 5.4.4.1-1. The maximum deviation from theexperiment, of about 0.35 bar (1 bar = 100 kPa) was within the uncertainty band given by theexperimental boundary conditions and the proposed nodalization. The deviations between thecalculations using the same code are caused by differences such as modelling of whether steamleakage occurred or not, air masses, sump temperatures, environmental temperatures, condensationheat transfer models and nodalization. An example of the type of variations noted for a single codeapplication is shown in Figure 5.4.4.1-2 for the CONTAIN code. Because of the uncertainties of theexperimental boundary conditions, the quality of the pressure comparison is reduced.
Gas Temperatures
The local atmospheric temperatures depend on the local air–steam distribution that, in turn, isinfluenced mainly by convection and stratification in the different compartments. Most of thecalculated dome temperatures were close to the experimental data. They lay in a band ofapproximately 10°C above the experimental data. Larger deviations had their reasons in specificmodelling assumptions that did not fit the problem well.
The low temperature in compartment R3 was one indication of thermal stratification between theatmosphere of the upper and lower compartments. Calculations, which simulate the stratification

167
(FIPLOC and RALOC results, are shown in Figure 5.4.4.1-3; CONTAIN results are shown inFigure 5.4.4.1-4), followed the experimental temperature behaviour in compartment R3, but theothers had a too high temperature. As was the case in the pressure comparisons significant variationswere noted for single codes; for example, shown in Figure 5.4.4.1-5 are the comparisons betweenmeasured and calculated temperatures in compartment R3 for the MELCOR code.
The experimental measurements showed that compartment R6 was severely stratified (TATMR628 >TATMR6 > TATMR605), where TATMR628 is near the top of compartment R6 and TATR605 isnear the bottom), Figure 5.4.4.1-6. In a number of the predictions, the temperature TATMR6 (nearthe centre elevation) is significantly overpredicted. Therefore, while the temperature in compartmentR3 could be qualitatively predicted, other temperatures—reflecting stratification—could not bepredicted with the same degree of accuracy.
Flow velocities
The tendency of the atmospheric flow velocities was calculated correctly where stratification andmixing were in agreement with the experiment.
Humidity
Only a qualitative comparison was possible since the experimental measurements have a largeuncertainty. FIPLOC and MELCOR reference calculations calculated the atmospheric conditions forthe dome throughout the complete experiment quite well; however, they underpredicted thesuperheating in the dome. CONTAIN reference calculation calculated superheated conditions in thedome instead of saturation. The CONTAIN calculation by ECN matched the humidity much better.This agreement was due to the use of different dry heat transfer models. The codes using thermalnon-equilibrium did not give better humidity results than those using equilibrium.
Sump level and temperature
The sump level was influenced by many experimental boundary conditions and by analyticalassumptions. Therefore, a direct comparison of experimental and analytical results with generalconclusions was not possible.
The experimental sump temperature, which had a steep gradient from surface to bottom, wasmeasured in the lower part of the sump. All reference calculations gave a higher sump temperaturethan that measured. FIPLOC and RALOC results were relatively close to the measurement, andMELCOR and CONTAIN are generally somewhat higher. Reasons for the too high analyticaltemperatures were the coupling between the atmosphere and the sump and the too high condensatetemperature. While in the FIPLOC calculations only a connection by heat conductors existed, thecoupling in MELCOR led to a too high heat transfer because of a rough nodalization, and thisresulted in a too high sump temperature.
Heat transfer to structures
The heat transfer can be judged by structure temperatures, wall condensation rates, and heat flow.Results with correct steam air distributions calculate the wall condensation rates in good agreementwith the measured data; for example, shown in Figure 5.4.4.1-7 for the GOTHIC code are the goodcomparisons of wall condensation rates. This more or less qualitative comparison for the GOTHICcode, and similar results for other codes, gave the impression that the heat transfer to the structures

168
Figure 5.4.4.1-1 Containment pressure for ISP 37 (Reference calculations)
Figure 5.4.4.1-2 ISP 37 Containment pressure predictions for the CONTAIN code

169
Figure 5.4.4.1-3 Temperature in compartment R3 (FIPLOC/RALOC)
Figure 5.4.4.1-4 Temperature in compartment R3 (CONTAIN)
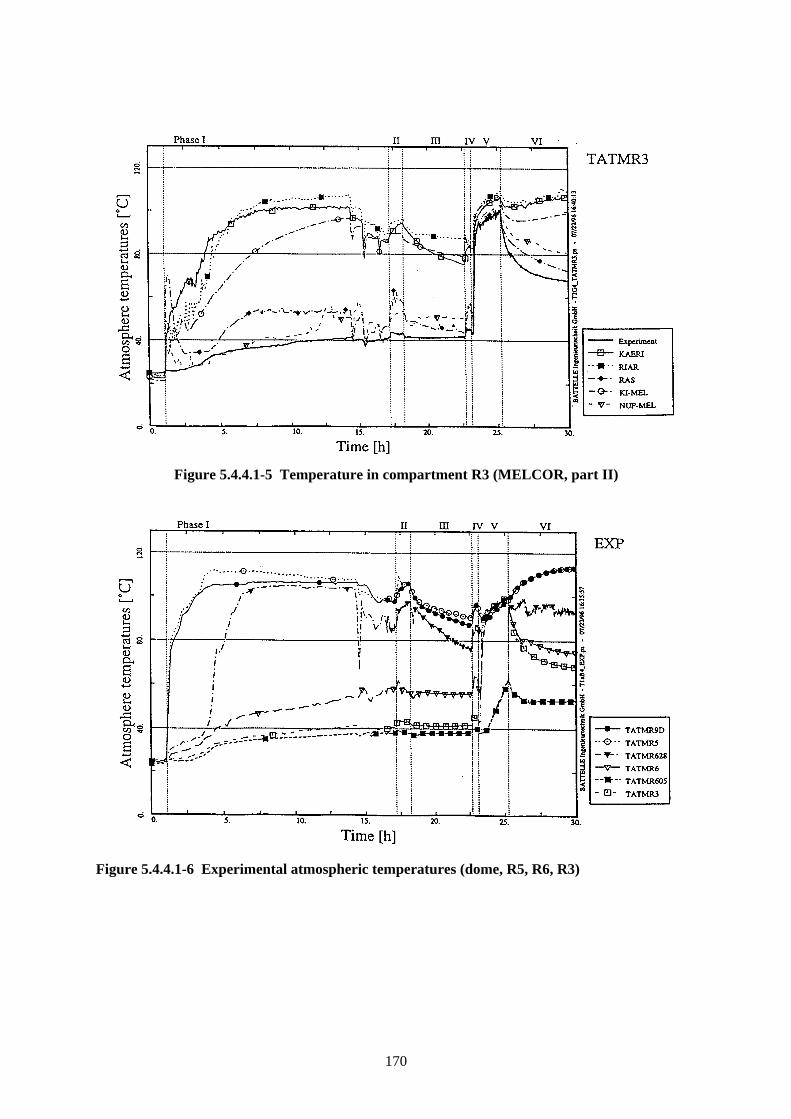
170
Figure 5.4.4.1-5 Temperature in compartment R3 (MELCOR, part II)
Figure 5.4.4.1-6 Experimental atmospheric temperatures (dome, R5, R6, R3)

171
Figure 5.4.4.1-7 Wall condensation rate calculated by GOTHIC
was quite well modelled by most of the codes. Differences in modelling the heat transfer—e.g., toorough a nodalization or neglect of a wall coating—were responsible for some of the observedpressure differences in the various submittals.
5.4.4.2 Discussion
International Standard Problem 37 demonstrated that the codes were able to calculate thethermalhydraulic containment behaviour in general with reasonable accuracy, given the rather largeexperimental uncertainties concerning facility leakage rates. The containment pressure was predictedquite well with a maximum deviation within the range of the given rather large experimentaluncertainty. The quality of the pressure comparison could no doubt be reduced through a reductionin the uncertainties of the experimental boundary conditions.
As noted, depending on the steam and aerosol injection, two convection loops developed in thecontainment; the upper loop was due to injection into compartment R5 and the overall loop was dueto injection in compartment R3. The other compartments (i.e., annulus R9, dead-end compartmentR4) and, depending on the location of the injection, the lower compartments (R3, R6, R8)temporarily stayed stratified. All calculations simulated both the upper convection loop (upper outercompartments, dome) and the overall convection loop (inner and outer compartments, dome) as well,but not all calculations simulated the atmospheric stratification between the dome and the annulus.Calculations without stratification in the annulus used unfavourable changes from the proposednodalization (e.g., parallel flow path between dome and annulus).
The simulation of the stratification between the upper compartments (R5, R7) and the lowercompartments (R3, R6, R8) was more difficult than in the annulus because the proposed nodalizationallowed both stratification and mixing as well. Stratification between the upper containment and the
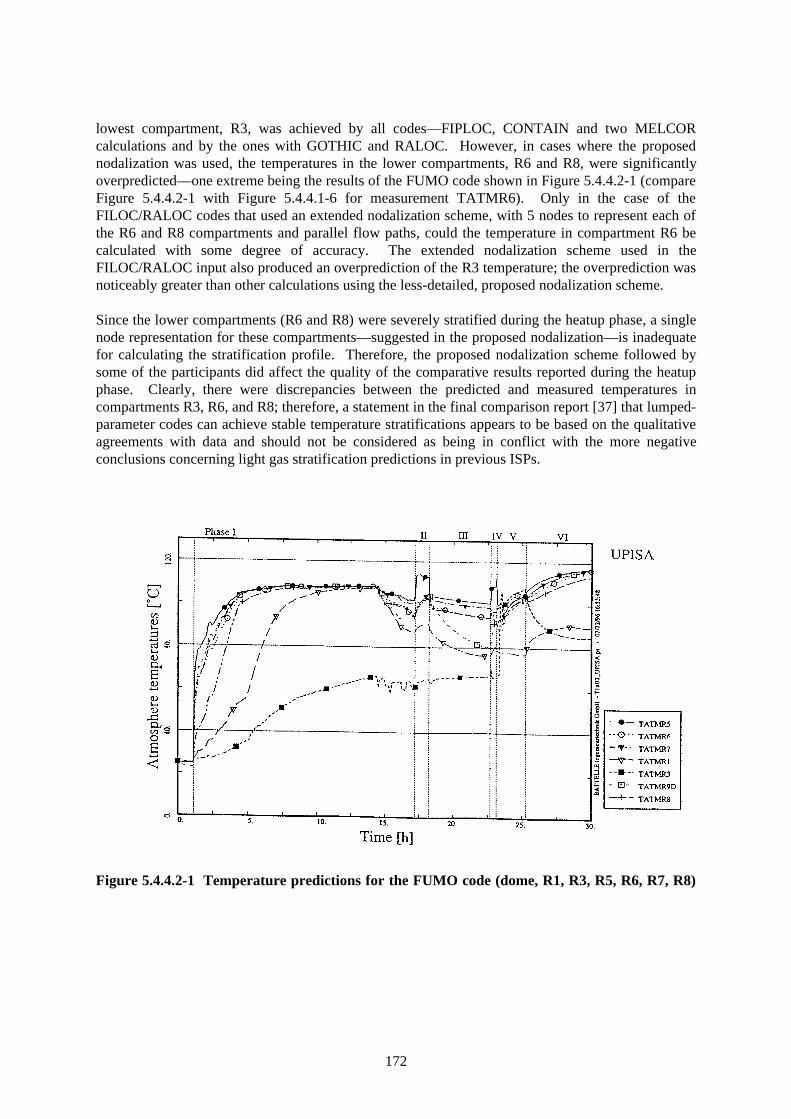
172
lowest compartment, R3, was achieved by all codes—FIPLOC, CONTAIN and two MELCORcalculations and by the ones with GOTHIC and RALOC. However, in cases where the proposednodalization was used, the temperatures in the lower compartments, R6 and R8, were significantlyoverpredicted—one extreme being the results of the FUMO code shown in Figure 5.4.4.2-1 (compareFigure 5.4.4.2-1 with Figure 5.4.4.1-6 for measurement TATMR6). Only in the case of theFILOC/RALOC codes that used an extended nodalization scheme, with 5 nodes to represent each ofthe R6 and R8 compartments and parallel flow paths, could the temperature in compartment R6 becalculated with some degree of accuracy. The extended nodalization scheme used in theFILOC/RALOC input also produced an overprediction of the R3 temperature; the overprediction wasnoticeably greater than other calculations using the less-detailed, proposed nodalization scheme.
Since the lower compartments (R6 and R8) were severely stratified during the heatup phase, a singlenode representation for these compartments—suggested in the proposed nodalization—is inadequatefor calculating the stratification profile. Therefore, the proposed nodalization scheme followed bysome of the participants did affect the quality of the comparative results reported during the heatupphase. Clearly, there were discrepancies between the predicted and measured temperatures incompartments R3, R6, and R8; therefore, a statement in the final comparison report [37] that lumped-parameter codes can achieve stable temperature stratifications appears to be based on the qualitativeagreements with data and should not be considered as being in conflict with the more negativeconclusions concerning light gas stratification predictions in previous ISPs.
Figure 5.4.4.2-1 Temperature predictions for the FUMO code (dome, R1, R3, R5, R6, R7, R8)

173
5.4.4.3 Post-test and other test analyses (Hyjet Series—JX7)
International Standard Problem 37 is one of the more recently completed ISPs. Subsequent analyses,either with the recently improved lumped-parameter codes or with the field codes have not yet beenattempted, but will probably be considered by various organizations—especially those codedevelopment organizations that would like to see more consistent performance from their respectivecodes.
The wide range of results reported by users using the same code demonstrates the need for userguidance or training of participants both in the use of the codes and in modelling facilities such as theBMC. Such guidance and training require a thorough evaluation of the reasons for the scatter in thevarious code results. This need suggests that reviews and re-calculations of this most recent ISPmay be available in the near future.
Additional results showing some of the abilities and limitations of lumped parameter-and field codesto predict stratification, were noted in the recently completed blind post-test analysis of the BattelleHyjet test JX7 [38]. Test JX7 from this Hyjet series was set up as a blind benchmark by BattelleIngenieurtechnik [38] and was analyzed using two lumped-parameter codes developed in Germany—RALOC and WAVCO—along with the GOTHIC code and two field codes—CFX and GASFLOW.The GOTHIC model consisted of a combination of distributed (field) and lumped-parametervolumes. The test, simulating stratification resulting from a vertical jet injection into compartmentR6 (passing through R5 to the dome), was of short duration (~750 s, nozzle diameter was 95 mm,injection velocity was 42 m/s, injection time was 190 s) so that some of problems associated withISP 37 (preheating procedures, heat transfer, and leakage) were minimized. Light gas concentrationpredictions throughout the BMC Facility were compared with measurements. The five codes werecompared for their predictive capabilities, as shown in Figure 5.4.4.3-1 for the whole experiment andin Table 5.4.4.3-1 only for a specific time point. All codes demonstrated a capability to predictstratification in the containment; however, both RALOC and WAVCO codes showed a tendency toovermix the containment light gas, predicting slightly more light gas in the lower containment andless gas in the upper containment. The GOTHIC code, which was applied using a combination ofdiscrete meshes with CFD modelling in the dome and in rooms R6 and R5, and with lumped-parameter nodes for the remaining rooms, showed a slight improvement in the calculated hydrogenprofile compared with the other lumped-parameter codes. The field codes, on the other hand,predicted a more severe stratification profile, which was in better agreement with the measurementscompared with either of the lumped-parameter codes. The tendency of lumped-parameter codes topredict overmixing of light gas injections is consistent with other ISP conclusions regarding lumped-parameter codes. Field codes show some improvement over these lumped-parameter codes in termsof the ability to calculate stratification; this observation is also consistent with conclusions of thepost-test analysis of ISPs 23 and 29 using the field code, GASFLOW, as noted in Sections 5.4.1 and5.4.2. Additional analyses of this test with other lumped-parameter codes—such as CONTAIN,MAAP and FUMO—that now have improved stratification modelling would, of course, be aninteresting exercise (see Section 5.6)

174
Figure 5.4.4.3-1 Results of the JX7 distribution benchmark
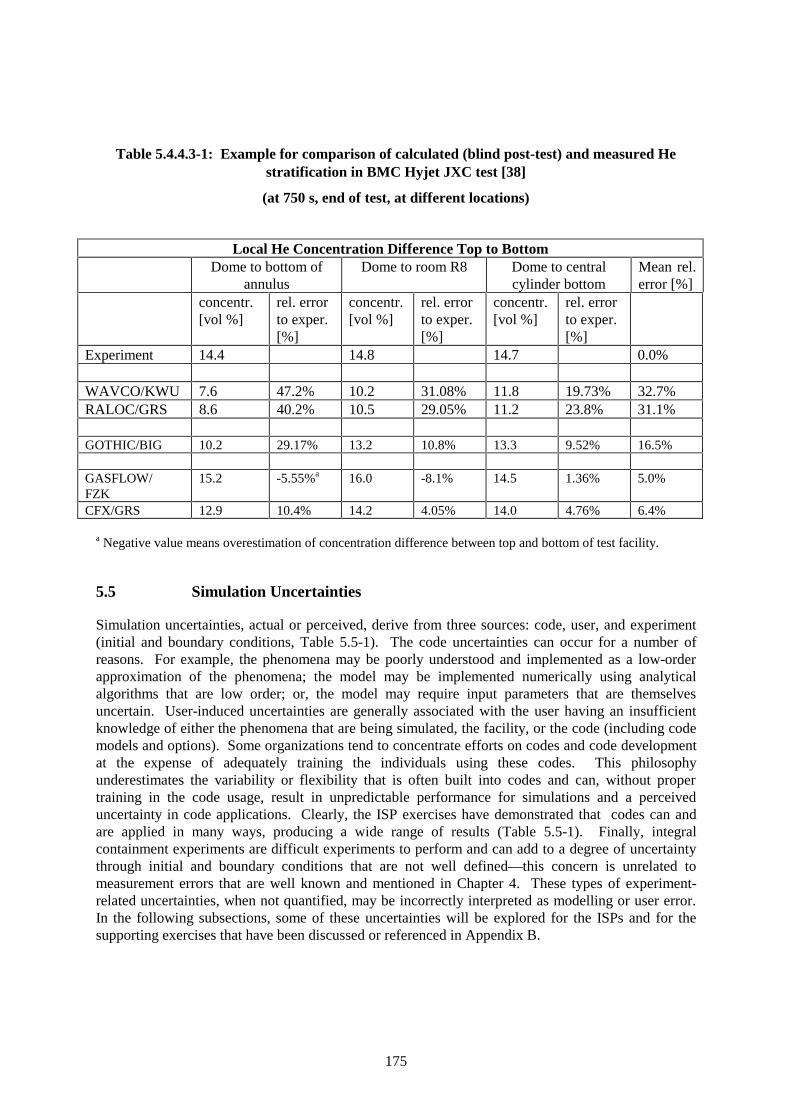
175
Table 5.4.4.3-1: Example for comparison of calculated (blind post-test) and measured Hestratification in BMC Hyjet JXC test [38]
(at 750 s, end of test, at different locations)
Local He Concentration Difference Top to BottomDome to bottom of
annulusDome to room R8 Dome to central
cylinder bottomMean rel.error [%]
concentr.[vol %]
rel. errorto exper.[%]
concentr.[vol %]
rel. errorto exper.[%]
concentr.[vol %]
rel. errorto exper.[%]
Experiment 14.4 14.8 14.7 0.0%
WAVCO/KWU 7.6 47.2% 10.2 31.08% 11.8 19.73% 32.7%RALOC/GRS 8.6 40.2% 10.5 29.05% 11.2 23.8% 31.1%
GOTHIC/BIG 10.2 29.17% 13.2 10.8% 13.3 9.52% 16.5%
GASFLOW/FZK
15.2 -5.55%a 16.0 -8.1% 14.5 1.36% 5.0%
CFX/GRS 12.9 10.4% 14.2 4.05% 14.0 4.76% 6.4%
a Negative value means overestimation of concentration difference between top and bottom of test facility.
5.5 Simulation Uncertainties
Simulation uncertainties, actual or perceived, derive from three sources: code, user, and experiment(initial and boundary conditions, Table 5.5-1). The code uncertainties can occur for a number ofreasons. For example, the phenomena may be poorly understood and implemented as a low-orderapproximation of the phenomena; the model may be implemented numerically using analyticalalgorithms that are low order; or, the model may require input parameters that are themselvesuncertain. User-induced uncertainties are generally associated with the user having an insufficientknowledge of either the phenomena that are being simulated, the facility, or the code (including codemodels and options). Some organizations tend to concentrate efforts on codes and code developmentat the expense of adequately training the individuals using these codes. This philosophyunderestimates the variability or flexibility that is often built into codes and can, without propertraining in the code usage, result in unpredictable performance for simulations and a perceiveduncertainty in code applications. Clearly, the ISP exercises have demonstrated that codes can andare applied in many ways, producing a wide range of results (Table 5.5-1). Finally, integralcontainment experiments are difficult experiments to perform and can add to a degree of uncertaintythrough initial and boundary conditions that are not well defined—this concern is unrelated tomeasurement errors that are well known and mentioned in Chapter 4. These types of experiment-related uncertainties, when not quantified, may be incorrectly interpreted as modelling or user error.In the following subsections, some of these uncertainties will be explored for the ISPs and for thesupporting exercises that have been discussed or referenced in Appendix B.

176
Table 5.5-1. Sources of actual and perceived code uncertainties for ISPs and related exercises
ISP Exercise Modelling User ExperimentISP 23 Transport (buoyancy, form
and frictional losses)
Transport—energy modelmissing (film advection,condensate/atmospheremodel)
Mass transfer, two-phaseatmosphere modelling
Range of experience basedon similar tests incomplicated facility
Heat transfer coefficient(HTC) and velocitymeasurement uncertaintynot quantified
Limited data comparisonlocations and poorpresentation of long-termresults for mass and energyexchange
ISP 29 Transport (buoyancy)
Mixing(buoyancy/stratification inregions)
Mixing modelimprovements need furthervalidation
Large degree of freedomassociated with uncertainboundary condition (BC)treatment
Attempts to use non-physical parameters toobtain agreement
BC uncertainty (facilityconfig., material properties,instrument coolingdistribution)
HTC and velocityuncertainty not quantified(oscillations noted)
ISP 35 Spraydynamics/impingementmodels missing
Non-mechanistic treatmentof spraydynamics/parameterselection
No structure mass or heattransfer, steam conc., orvelocity measurements
Specification errors forpreheating and resultsprocessing
ISP 37 Transport (buoyancy)
Mixing(buoyancy/stratification)
Range of experience basedon knowledge of facilityand experience procedureand code
Nodalization coarseness
BC uncertainty (facilityleakage distribution)
Limited and uncertain massexchange and velocitymeasurements selected
A summary of the sources of simulation uncertainties for the various ISPs, and related experimentalseries and benchmarks is presented in Table 5.5-1. Some of the areas of uncertainties are furtherdescribed below. Uncertainty items should be clarified one by one independently when conductingcode verification; however, results of calculations are an outcome of the combination of these items.Therefore, in code verification work, it is important to choose an analytical condition in which theseitems are as independent as possible. The assessment of SETs is important to this point of view,whereas the assessments of ISP exercises, which are IETs, include the interdependency effects in theuncertainties.
5.5.1 Code
To address code uncertainties, we choose to rely on our previous discussion concerning importantphenomena, the illustrative PIRT (Table 3.3.4-1) described in Chapter 3, to focus our attention onthree important processes that affect our success in predicting containment pressure, temperature, andgas concentration within a containment. Those processes are mixing, transport, and surface mass and

177
heat transfer. Although we make a distinction between mixing and transport in deriving the PIRTtable, these two processes are discussed here as one item.
5.5.1.1 Mixing and transport
In ISPs 23, 29, and 37, general trends were observed for the lumped-parameter codes: the codes,taken as a code type, tended to overmix stratified layers of air–steam–gas mixtures. When theinjection location was low so that the constituents mixed rapidly and uniformly, these codes providedgood predictions of transient loads (pressure and temperature) and light gas concentrations, forexample, in the E11.4 benchmark exercise. However, when the injections were elevated, so that astratification interface formed just below the injection, the codes—without exception—gave resultsthat either underpredicted (above the injection) or overpredicted (below the injection) concentrationsof steam and light gas. New models have been proposed and applied to highly stratified tests such asE11.2 and NUPEC M-8-1, showing significant improvement in predictions for these cases. Theimproved models have been referred to under a number of titles: hybrid flow solver, subnodal physicsmodel, and stratification model. They each appear to represent a different approach for solving theproblem associated with overmixing stratified layers of gases in either a regional or global sense.Confidence in the various independent approaches to such a common code modelling problem isperceived to be lacking at this time, without additional comparative analyses and blind testing.
Of course, a discussion of modelling mixing phenomena presupposes that one knows what thedominating phenomena responsible for the various observations in the tests are: Do we know whatphenomenon is primarily responsible, or are there complexities not yet understood? In fact, it maynot be entirely clear in these tests what the dominating mixing phenomena are and what thesecondary phenomena are. This uncertainty is due partly to the lack of instrumentation that couldmeasure dynamic prime quantities like path and free stream gas velocities, and accurate wall massand heat transfer. In the case of the E11.2 experiment, for example, there have been ongoingdiscussions between those individuals using one of the improved lumped-parameter codes and a fieldcode user; the discussions have centred around a disagreement on the dominating phenomenaresponsible for the light gas enrichment in the HDR upper dome during the external spray period.First impressions would tend to suggest that a field code analysis of the experiment should be able touncover, at least, the dominating phenomena. However, there are also modelling uncertaintiesassociated with field codes when applied to large and complex containment geometries—mostapparent for the only field code (GASFLOW) applied to this experiment is the inability to model thecurvature of the dome and to accurately, with validated models, represent secondary flow patternsusing coarse nodalizations. Clearly, for this test more investigation into the role of secondarycirculation patterns may be warranted; however, one must also put into perspective this issue anddebate whether it arises from a severe test condition not representative of prototypical containmentsor accident conditions, as noted previously in Section 5.4.2.
The issue related to code uncertainties regarding mixing and transport is not currently resolved.Some would suggest that lumped-parameter codes, by their very nature, cannot address this modellingconcern. Yet the results of the new improved models in predicting stratification profiles are showingpromise, and further investigation is encouraged. Likewise, additional exercises tailored specificallyfor field code applications are needed to resolve whether these codes are able to accurately simulatethe details of mixing and transport processes, given the acknowledged uncertainties in code types thatdo not use boundary-fitting mesh points, and generally lack a database to support various closureequations (for example, the low Reynolds number K − ε model equation).
178
5.5.1.2 Mass and heat transfer
Another area of modelling uncertainty concerns the transfers of mass and heat transfer betweenatmosphere and structures, and the coupling between this process and the mixing process discussedabove. The topic has been mentioned in every ISP exercise; in some ISPs it was specifically noted asa probable reason for discrepancies between predicted and calculated gas concentrations. Mostcodes, lumped-parameter and field codes, have adopted a mechanistic approach to modelling massand energy transfers (as opposed to the purely empirical approach; for example, the Uchidacorrelational method). These models are generally based on a heat and mass transfer analogy. Mostcodes have relied on separate-effects testing to verify that the analogy methodology producesaccurate results (~10% to 20% variation), providing that the heat transfer correlation is known withsimilar accuracy. A problem with this modelling method is that it is often difficult in complex andlarge-scale geometries to know the heat transfer correlation accurately. In most instances associatedwith post-blowdown events, as the ones being considered in this report, natural convection dominatesas the primary phenomenon responsible for mass and heat transfer. However, there are someinstances where the convection may be in a mixed (forced/natural) or forced convection regime. Inthese cases, even if the convection pattern is known, the correlations for turbulent convective massand heat transfer can be uncertain, especially if the flow regime is in the mixed convection regionwhere there is little experimental data to support modelling methods. The concern over theapplicability of the heat transfer correlations for turbulent mixed convection conditions applies toboth lumped-parameter and field codes.
For ISP 35, it has been noted that the sprays may have created strong circulation currents along thewalls of the containment and that these currents may have been responsible for the enhanced heat andmass transfer. To account for mass and heat transfers to the containment walls when sprays areoperating, it would be necessary to calculate these strong circulation currents. So far, with theapplied lumped-parameter and field codes, this estimation ability is out of scope for the codes—ingeneral, spray dynamical models with droplet drag are lacking in all of these codes. Anothersuggested reason for the enhanced wall heat and mass transfer was a water film produced by spraysthat influenced heat transfer to the walls. In any case, however, it remains to be proven that thisapparent enhancement of the heat and mass transfer process on nonprototypical walls—steel, shelland partitions—that occurs during spray activation is relevant for predicting containment loads(pressure and temperature) or gas distributions in typical plants.
5.5.2 User
User-induced sensitivities are difficult uncertainties to characterize because they often are unrelatedto the user’s code knowledge but arise from misunderstandings and associated errors made inrepresenting the actual experimental procedure or the facility itself. These uncertainties of courseshould not be considered part of the code uncertainty proper, but they appear often, are poorlydistinguished, and are therefore typically discussed in the general category, code uncertainty.International Standard Problem 37 provides a good example of the extent to which users can affect aprediction of both containment loads and gas distributions. In the case of the CONTAIN andMELCOR codes, there were no less than 15 participants responsible for a wide range of predictedresults. In a number of these cases, the reasons for the variations in the results were due to how theuser chose to represent the boundary conditions of the experiment (air extraction or injection orfacility leakage) or whether certain features of the containment were represented at all—as forexample, the surface coating of the walls.
In some instances, the user will have had extensive experience with both the experimental procedureof the ISP test and the geometrical model because of previous participation in similar modelling

179
exercises for that facility. In other cases, the ISP exercise represents the first time a user applies aspecific code and the first time a user models a facility, as in the case of ISP 37. As a result, therecan be an expected range of predictions not associated with code errors but rather with theinexperience of the participant.
One of the more often-mentioned sources of user-induced uncertainty has to do with the choice ofnodalization used to model the geometry of a facility or containment, an important part of thegeometrical model development. In some instances, using only a few nodes to model a region canresult in an apparent improvement of the results (for instance, in cases where overmixing needs to berestricted for dead end compartments), and in other cases additional nodes provide a significantimprovement in the simulation. Not all cases that show improvement in the predictions with addednodes, however, are due to an improved accuracy; rather, in some cases the additional nodes result ina more favourable placement of a calculational node in relation to the measurement location. Ingeneral, this apparent improvement as a result of a variation in nodalization to better approximatelocal measurement is typically ignored in discussions of data comparisons.
Problems encountered with a choice of a nodalization schemes for a buoyancy-driven containmentscenario can often be avoided by noting a few points based on observations of an ISP and othermixing and transport tests: (1) stratification profiles tend to be one dimensional in the verticaldirection, even with an asymmetric injection; (2) stratification interfaces tend to develop just belowinjection sources; (3) regions above an injection source tend to be well mixed shortly after the start ofa slow injection (minimal plume effect); and (4) strong injections tend to mix the entire containment,that is, regions above and below the injection location. In addition, known variations of severevertical surface mass and heat transfers require representation by appropriate nodalizations so thatvertical density gradients can be represented. In general, lumped-parameter codes are best suited tocases where individual compartments are represented as physical nodes; one exception to thisstatement is compartments having large vertical dimensions where improved stratification modelsmay also be applied with user guidance.
The ISPs offer a number of examples of nodalization schemes that, after further analysis, could havebeen improved with simple modification. For example, some users have modelled the containmentoperational region (for example, the large open region above the operation floor in the HDR Facility)with a single node while including many nodes to model the compartmental regions below deck.When there are natural-circulation currents that mix in the open region with hotter, less dense gasesrising from below the operation floor, these gases may not mix sufficiently with only a single noderepresentation of such a large open region. In these cases, the region should have been divided sothat circulation patterns can be established. The user does not necessarily have to know beforehandwhat those circulation patterns are, or the magnitudes of the circulation flows, but should haveenough experience to avoid nodalizations that preclude possible circulation patterns. If the user isunsure even about possible patterns, guidance in this area could be helped with an application of afield code to the problem.
In most cases, the question of nodalization can be addressed through sensitivity calculations where anumber of nodalization schemes are tried until some type of convergence in the results is obtained.Unfortunately, time constraints can preclude studies of this type, and marginal predictions result.However, these results may not be associated with the code or code type; rather, this is a case of user-induced uncertainty that could be remedied with added care taken in modelling the facility. Shown inFigure 5.5.2-1 is an example of one HDR nodalization scheme used to calculate test E11.2 thatrepresents a marginal scheme. The one-node operation region is especially inappropriate for testE11.2 because during the spray period only the upper dome region of this volume is cooled byexternal sprays. The rapid cooling of the upper dome region induces mixing in the upper dome

180
Figure 5.5.2-1 Example nodalization of HDR Facility for ISP 29. The single node (#25) used torepresent the open region above operation deck is not adequate for representing mixingprocesses in the upper dome region during external spray period (sprays directed on upperdome shell only)

181
region, and this mixing may not extend to the lower regions above the operation deck. A one-noderepresentation of this whole region (upper dome and cylindrical operation region) is inadequate.
For the three facilities (HDR, NUPEC, and BMC) used in the four ISPs, the user was given thedescription of the facility, divided into either suggested or implied nodalizations. Many usersassimilated these databases directly as a chosen nodalization scheme without doing sensitivity studiesbefore making their submittals. In a number of cases, nodalization sensitivity studies were completedonly after the ISP predictions were submitted.
5.5.3 Experiment (facility, conditions, and measurements)
As noted, the illustrative PIRT table in Chapter 3 (Table 3.3.4-1) indicates that gas mixing andtransport, and mass and energy transfer processes are highly ranked for containment loads and gasdistribution predictions. From an experimental standpoint, that means that the experiment should bedesigned to ensure that accurate measurements are made of these processes. Unfortunately, thefacilities—to various degrees—impose uncertain boundary conditions that limit accurate predictions,and measurements of prime quantities are either lacking or the measurement accuracy is unknown.Additionally, communication between experimenters and those responsible for relating theexperimental procedure and methods for code output processing can also be a source of uncertainty.Some noteworthy examples are discussed below.
5.5.3.1 HDR facility—ISPs 23 and 29
Large-scale integral testing facilities for containment phenomena are expensive facilities to build;consequently, already-existing facilities are attractive alternatives. In the case of the HDR Facility, adecommissioned containment became a test facility to be used for a variety of safety testing,including shake tests for earthquake analyses and numerous steam blowdown tests.
The HDR Facility was, without much doubt, the most complicated containment facility to describeand characterize of any ISP exercise. In addition, the auxiliary uses of the facility for safety testingcaused variations in boundary conditions that could not be accurately described. For example, therepeated steam blowdown testing damaged the surface painting on concrete allowing somepenetration of water into the structures during long-term exposures, as in test E11.2. The uptake ofwater into the structures is believed to have changed the thermal properties of the structure. Theextent of the property variation during testing is unknown. Shaker testing is thought to have damagedthe insulation separating the containment inner concrete wall and outer steel shell. Damage of thissort could have also affected the long-term heat transfer behaviour of the facility, and therefore thepressure predictions. While some damage to insulation has been confirmed, the extent of the damagehas not been confirmed and, therefore, remains an uncertainty. These facility conditions are oftencited, by participants, as probable causes for discrepancies in the prediction of long-term total energybalances. The facility’s conditions, however, are not believed to have substantially affected gasdistribution predictions.
In the conclusions reached in the ISPs 23 and 29 comparison reports, there have been repeatedreferences to possible simulation uncertainties in the exchange of mass and energy between theatmosphere and structures being responsible for poorly predicted gas distributions. Unfortunately,the accuracy of the measurement of condensation heat transfer in the HDR Facility (α blocks) is notreported and is probably not known. For this reason perhaps, condensation heat transfer comparisonshave not been emphasized in either ISP 23 or in 29. In fact, accurate condensation heat transfermeasurements are lacking for each ISP. Therefore, these ISPs cannot be referenced as suitable forquantitative validation of condensation heat transfer modelling in an integrated testing environment.

182
Instead, condensation model validation is left for separate-effects testing, where validation evidencedoes exist. However, good integral validation of the condensation modelling is currently lacking;therefore, phenomenon coupling between mass and heat transfer processes with transport and mixingprocesses is not well studied.
Mixing and transport of gases can be inferred from gas concentration measurements, and less so fromlocal temperature measurements. The HDR tests were groundbreaking examples of goodinstrumentation for gas concentration and temperatures, and therefore are regarded as importantvalidation tests for gas distribution modelling. However, gas motion as measured using velocitysensors has been problematical, as with most containment tests, due primarily to limiting accuracythresholds and sensitivity of the instrumentation to the wet conditions. As a result, gas circulationmeasurement has been limited to approximate data to infer gross flow looping; detailed quantitativemeasurements are lacking.
One of the more often-mentioned problems with ISP 29 has been the instrument cooling system thatextracted a substantial amount of energy from the containment atmosphere. The uncertainty analysisof the total energy extraction rate was quite approximate and may be partly responsible for aperceived underprediction of containment pressure early in the test sequence. More importantly forgas distribution predictions, the distribution of the cooling system energy extraction rates was notmeasured. This unknown extraction distribution represents an uncertainty in the test boundaryconditions that is difficult to quantify and adds to a list of boundary condition uncertainties thatundoubtedly affected gas distribution predictions.
5.5.3.2 NUPEC Facility—ISP 35
The NUPEC Facility was designed as a facility in which simulated accident scenarios in a scaledPWR containment could be conducted for short periods (30 min)2. NUPEC testing was originallyshort-term testing. Therefore, long-term heat sinks, such as concrete, were left out of the design, andthis unusual aspect of the facility, compared with concrete-type facilities, limits its usefulness forlong-term gas distribution studies where the distributions can be affected by atmosphere and structuremass and energy exchanges. Additionally, gas velocity measurements in the facility were unavailablefor conditions of high humidity. Detailed gas-mixing modelling validation is therefore limited withthis ISP and with other supporting NUPEC tests.
Although the facility testing was typically designed for short-duration testing, preheating andconditioning periods of longer duration were needed, and there were some uncertainties associatedwith the energy balances during these prolonged periods. Uncertainties in the preheating stage, ofcourse, affect the initial conditions for the actual testing, and this point has been mentioned in theISP 35 comparison report. In addition, enhanced heat transfer by spray-induced circulation currentsand droplet impingement—causing a water film on walls—have been suggested as reasons fordiscrepancies in pressure, gas and wall temperature predictions and measurements. Unfortunately,without wall heat transfer instrumentation these conjectures could not be verified, except from thepressure and atmospheric temperature histories; therefore, this uncertainty in the experiment couldnot be addressed because of a lack of wall instrumentation.
In the ISP 35 test, sprays introduced mixing currents in the open regions, causing these regions to beuniformly mixed. The sprays were believed to have generated locally high gas velocity flows near
2 In Japan, there are several containments with internal steel structures. The NUPEC Facility design was initiallyintended to model such types of containments—reactor power is lower in these plants than others having aconcrete structure design.

183
the exterior wall surfaces of these regions. Such high velocities could explain some discrepanciesnoted in predicted wall temperatures for codes that could not predict these velocities. In this instant,had gas velocity measurements been available, these measurements could have provided the physicalevidence for some claims concerning the cause of the discrepancies, thereby reducing an apparentcode uncertainty.
An example of the a type of uncertainty resulting from mis-communication occurred in ISP 35. In theinitial specification of ISP 35, an error in the location of the preheating injection resulted inerroneous preheating calculations; this was later corrected after NUPEC was asked to review thetesting procedures before ISP results were submitted. Another example concerned procedures forcode processing. Code results had to be processed to give comparable concentrations, because gasconcentrations were reported from a “dry basis”. The ISP equation specification for making thisconversion was incorrectly formulated; this error was not discovered before the ISP test results werereleased because of its low steam concentration; other tests in the NUPEC series tests, such as M-8-1,have been recently corrected, but early reports of comparisons contain this processing error.
5.5.3.3 BMC facility—ISP 37
The BMC Facility has been used as a test facility for a number of tests reported in this chapter. Othertests conducted in this facility are listed in Chapter 4, some of which are also described inAppendix B. This facility has a relatively high leakage rate compared with leakage rates of otherfacilities, like the HDR and NUPEC facilities that have steel shell enclosures. The leakage rate forthe facility is, of course dependent, on the pressure differential between the facility and theenvironment; this differential varies during each pressurized test. As a result, the facility leakage isdifficult to characterize for long-term experiments, and has been often cited as a boundary conditionuncertainty for validation of simulation modelling. Although there have been attempts to quantify thetotal leakage rates for the facility, the distribution of the leakages throughout the facility is still anunknown. During long-term testing, this degree of experimental uncertainty can affect pressure andgas concentration distributions calculations. Sensitivity analyses that indicate the effect of variousleakage rates and distribution assumptions on reported pressure and concentration calculation aregenerally lacking.
In a number of BMC tests, a conditioning procedure is followed that involves purging and injectingair into the facility. This procedure, which is nonprototypical of accident events, adds to thecomplication and boundary condition uncertainty that users must consider in developing andreporting results of their simulation modelling. In the case of ISP 37, some participants incorrectlymodelled or neglected the air purging and injections’ portions of the test and therefore calculatedtotal air masses that were in error and that affected the pressure calculations. The purging andinjection procedure is intended to alter the steam distribution in the containment; this conditioningprocedure requires some specific modelling experience for this facility. It is, therefore, difficult toinfer from application comparisons what are code modelling uncertainties versus what areuncertainties caused by unknown boundary conditions, or boundary conditions incorrectlyapproximated by users unfamiliar with testing in this facility.
5.6 Conclusions and Recommendations for Future Applications
A variety of containment codes and code types have been described in this section, and results ofsome well-known ISPs for studying containment thermalhydraulics and hydrogen distributions withassociated code predictions have been discussed. In addition, post-test analyses and complementarycode applications of a similar nature have also been briefly mentioned. Finally, sources of simulation
184
uncertainties have been discussed from the standpoint of code, user, and experimental uncertainty.Progress in the area of code development was noted, especially with respect to code predictions ofhydrogen distributions during severe-accident-like conditions when containment threats caused bydeflagration/detonations are high.
5.6.1 International Standard Problems
Some conclusions related to the past and current usage of ISPs are as follows:
• International standard problem exercises have identified in a quantitative manner apotentially serious problem associated with lumped-parameter codes; that is, the codes tendto overmix light gas stratification mixtures, even with more detailed nodalizations.
• In the one case where a field code participated in an ISP, specifically ISP 23, coding andmodelling faults were revealed.
• Reports on ISPs and other complementary testing are being continually used in codevalidation studies and as a source of data to support the improvement of both lumped-parameter and field code modelling.
The overmixing problem with lumped-parameter codes is currently being addressed with modellingimprovements and validation with the re-calculation of ISPs. The improvements in stratificationmodelling have been encouraging but still require additional verification, especially with newgeometries under blind-test conditions. Field code development has continued with supporting post-test calculations of previous ISP tests like T31.5 and E11.2. To acquire additional confidence in fieldcode applications (especially for full containment and accident scenario simulation) will require newISPs designed for integrated effects with specially designed high-resolution 3D instrumentation. TheISPs discussed in this report are of marginal value for validating the current class of engineering fieldcodes because of the coarseness of the data; however, lack of fine resolution data is not seen as areason to suggest that these codes are not useful tools for containment analyses. Field codes may beused to provide added insight into phenomenon not measured or coarsely measured in past ISPs; andnew ISP exercises, with more refined measurements will hopefully be available to provide additionalvalidation of these code types.
High-ranking phenomena and associated modelling problems, as identified in ISP exercises, wereclearly evident because trends in key parameters, such as pressure, temperature, and concentrations,were incorrectly predicted. However, not all test comparisons reveal problems through a missedprediction of trends. In such cases, modelling uncertainties are more difficult to identify and requirehigh-quality measurements of parameters other than the three variables compared here. As field codeusage extends to more containment applications, and the need for more precise predictions increases(required for predicting combustion event loadings), the measurement parameter list will also expand,and the need for more accurate measurements will be emphasized. The quality of some of themeasurements in past ISPs has been insufficient for validating code models to accuracies much lessthan 10% to 20%. For most applications involving field codes, required measurements are lacking orare reported with such large uncertainties that the data are not very usable. Clearly, the next series ofISPs must be viewed with added concern for an expanded set of measurement quantities (e.g., gasvelocity and wall mass transfers) and improved accuracy.
In reviewing the effect of specifications for an ISP on the usefulness of that exercise, we have learnedthat experimenters need assistance from analytical support staff to avoid mis-information, omission,and errors. When this assistance is either not available or is not seriously considered in developing
185
those specifications, there is a high risk that the usefulness of the code comparison exercise will becompromised by a series of perceived code uncertainties (e.g., ISP 29). Alternately, there should be ajoint effort by both experimenters and analysts to reduce initial and boundary condition uncertainties.
5.6.2 High-ranking Phenomenon Predictions
Three processes were identified in Chapter 3 as high-ranking processes: gas mixing, gas transport,mass and heat transfer. In a variety of experiments, mainly associated with ISP exercises or in studiescomplementary to the ISP, the general behaviour of containment thermalhydraulics and light gasdistributions was investigated. One aspect of test simulation observed in these tests was that theglobal containment response to an injection of steam–gas mixtures, as measured by pressure, is notvery sensitive to the degree of simulation error measured for mixture distributions and expected forcontainment analyses. Clearly, large variations in mixture distributions as a result of variations in theinjection location can produce varying pressure responses. Analytical simulation models reviewed inSection 5.4 for ISP 29 (E11.2) and the complementary test E11.4 provided examples of how pressureresponse to various injection elevations can be calculated with good accuracy using lumped-parameter codes. In this regard, it was also learned that stratifications are difficult to introduce wheneither the injection source is located low in the containment or when engineering safety systems likesprays are operating. The most severe stratifications are developed in initially stagnant atmospheresfor scenarios where the injection point is elevated and the injection rate is low. In these cases, astratification interface develops just below the injection point. For the tests reviewed here, thestratifications tended also to be nearly one dimensional without many variations along the horizontal,regardless of compartment boundaries, provided circulation paths exist. This general picture suggeststhat codes based on a lumped-parameter modelling method, may be suited to this type of lower-orderdimensional phenomenon. However, apparent modelling deficiencies have been noted in ISPcomparison exercises such that the lumped-parameter models are suspect for accurate stratificationcalculations, especially when the injections are elevated, the rates are low or of short duration orboth. Recent development by a number of independent organizations, however, has produced codemodelling improvements for predicting stratifications, and these have been noted as promising but inneed of further investigation.
An alternative solution method for predicting gas distributions is represented by the relatively recentemergence of field code applications to severe accident scenarios. Field codes have generally beenable to calculate gas distributions with better accuracy then some lumped-parameter codes undernatural-convection conditions where mixing and transport flows are quite small. Cross-comparisonexercises with the more recently improved lumped-parameter codes, discussed above, are just gettingunderway; although, since full containment and complete scenario transients are generally lacking forfield codes, the comparisons are limited in scope to nonprototypical experiments that may limitconclusions with respect to NPP containment analyses. Some code users have viewed the lumped-parameter and field codes as competitive solution methods; however, most analysts believe that fieldcodes can be useful supplements for benchmarking the more approximate flow computationscalculated with lumped-parameter codes. The most likely applications for each code type willcontinue in the near future along the lines of risk management, accident management strategy andlicensing for the lumped-parameter codes, and hydrogen mitigation design (recombiners and igniterlocations) for the field codes. In this breakdown, direct competition between code types may notmaterialize. For similar applications in the more distant future, these code types may be ultilized in acomplementary fashion to great advantage.
In the area of mass and heat transfer, ISPs have not provided convincing evidence that the models ineither lumped-parameter or field codes are accurate under integral testing—this appears to be a faultof the measurement techniques applied in these tests. Additional separate-effects testing and
186
improved measurement techniques for integral tests will be needed to directly confirm the accuracyranges of these models under severe accident conditions. At present, the models, however, arebelieved to be reasonably accurate (20% to 40%), and indications that these models are limiting formore accurate gas distribution predictions (~5% to 10%) are inconclusive.
For local temperature calculations, many of the conclusions regarding gas distribution predictionsalso apply. However, there is some indication from the ISPs 23 and 29 that energy exchange betweenthe atmosphere and condensate film draining or condensate droplets draining into lower regions ofthe containment affects gas temperatures in these regions. Models for this low-to-medium-rankedphenomenon (Table 3.3.4-1 - Condensate–liquid film/condensate droplet heat transfer) are generallylacking in both code types (except for the RALOC code, which includes modelling in this area).
It should be noted that direct investigation of phenomena modelling or prediction is really notpossible through comparisons between code and measured pressure, temperature, and gasconcentrations. The reason is that the phenomenon is often best described with other primequantities that are considerably more difficult to measure like gas velocity, mass and heat fluxes. Inaddition, the integral testing involves extremely complicated coupling between various processes;therefore, being able to isolate dominant two-phase mixing and transport processes from otherprocesses that occur locally, near structure surfaces has not been possible. A recently proposed testfacility and programme—MISTRA—is, however, designed to help identify dominant phenomena andthe coupling between various phenomena. It is anticipated that much useful information may beobtained through this hydrogen mitigation and stratification testing program, especially for blindvalidation calculations with field codes.
Looking back at the ISPs that have been reviewed, it becomes all too apparent that every ISP hasinvolved a rather complicated integral test and that there has been a lack of separate-phenomenatesting within the ISP framework. This oversight is especially true for highly important processes ofmixing and transport, where competing effects from surface heat and mass transfer, engineeringsafety features, or mitigation devices have prevented a thorough evaluation of our modelling abilities.Evaluations may be considered to have begun with the ISPs reviewed; yet the assessments areincomplete with respect to a detailed assessment needed for a phenomena model ranking, wherehighly important phenomena are simulated with high-accuracy models. To the degree thatquantitative modelling assessment (i.e., ranking) is needed to establish confidence in our analyticalsimulation modelling, our task to ensure that we have reliable codes is not complete. Additionalefforts, especially for mixing and transport process modelling and assessment, should be consideredfor a separate-effects testing programme. Our database, one that is widely available and welldocumented, is largely lacking for regional mixing and gas transport processes. Criticisms like this,of course, should be put into the context of the demonstrative successes that we have already realizedto date through the ISP structure for integral testing; now, added requirements to refine our predictiveability for severe accidents in a licensing and severe accident management environment encouragescode developers, analysts, and programme managers to step back from the complicated testingprogrammes, focusing instead on providing more ISPs that are conceptually simpler within a shorterperiod, less costly to conduct, and that emphasize phenomena and phenomena interactionassessment.
5.6.3 User-Community Impact
It is often difficult to remember that codes, no matter how well written and validated, are only toolsin the hands of individuals that direct their use. No code of the complexity required for containmentanalysis can be run as a “blackbox”. As in all occupations, the well-designed tool used by anunskilled person can produce no better results than a more marginal tool in the hands of a skilled
187
person. User participation in ISPs, with the workshops that invite the exchange of knowledge, isperhaps one of the least-appreciated aspects of these exercises by those outside a select group ofparticipants. A dilemma arises in this regard, however. When code comparisons are reportedregardless of the user’s code experience (or skill), misleading impressions concerning applicationmay be suggested about a code or about a specific modelling approach. Some of the moreknowledgeable individuals on a code’s usage are the developers; unfortunately, code biasing can tiltthis advantage into something of a disadvantage for validation, even without intent. The solutionwould appear to partition the intended usages of the ISP exercise into two categories: validation andtraining. Comparison reports would be separated by some criterion that distinguishes the variousexperiences of the user for a specific code or code type; something of this type was attempted for theISP 37 exercise.
International standard problem exercises are emphasized in this report because they represent awidely disseminated and, in most cases, well-documented experimental basis on which to exercise acode and report findings. Reductions in the code development budgets in many organizations willundoubtedly mean that fewer code choices are available for safety analyses, with more organizationsrelying on a select group of codes for their containment analyses. The widespread use of some codeslike CONTAIN and MELCOR, with numerous individuals and countries applying them, indicates adirection in how tools may develop and be applied in the future, including field codes like CFX andGASFLOW. For instance, more emphasis is currently being place on graphical user interfaces(GUIs) to make these tools more user-friendly, that is, helping to extend use outside the developmentstaff. Organizations are now expending more funds for application and less for development. As aresult, consolidation of validation and training programmes seems more likely in the future, with therole of ISPs becoming more integrated into the nuclear safety programmes of all OECD countries.Recognizing this trend and supporting its proficient usage will be a challenge for all members of theOECD community.
5.7 References
1. E. Hontanon et al., Transport Phenomena in the Containment. State of the Art Models inMELCOR and CONTAIN Codes, Madrid, July, 1996.
2. K.K. Murata et al., Code Manual for CONTAIN 2.O: A Computer Code for NuclearReactor Containment Analysis, NUREG/CR-6533, Sandia National Laboratories,Albuquerque, NM., December, l997.
3. NUREG/CR-6119, MELCOR Computer Code Manuals, Rev.1, SNL to be published in
1998.
4. T.L. George et al., GOTHIC Containment Analysis Package Technical/User Manual,Version 3.4e, EPRI Report, RP3048-1, 1993.
5. T.L. George et al., GOTHIC Containment Analysis Package Technical/User Manual,Version 5.0, EPRI Report, RP4444-1, 1995.
6. F. Oriolo et al., FUMO Code Manual - Volume 1: System Models, DCMN Pisa
University Report RL 533 (92), 1992.

188
7. MAAP User’s Manual: Code Structure and Theory, EPRI, 1994.
8. W. Klein-Hessling et al., RALOC MOD 4.0 cycle AE User Manual, Gesellschaft furReaktorsicherheit (GRS in BH).
9. B. Schwinges, W. Klein-Hessling, M. Heitsch and B. Huttermann, Weiterentwicklungund Verifikation des Rechenprogramms RALOC [Further development and verificationof the code RALOC], GRS, GRS-A-2185, November, 1994.
10. B. Schwinges, M. Heitsch, W. Klein-Hessling, S. Arndt and B. Huttermann,Weiterentwicklung und Validierung des modifizierten Rechenprogramms RALOC[Further development and validation of the modified code RALOC],GRS, GRS-A-2422,December, 1996.
11. G. Weber et al., Benutzerhandbuch fur FIPLOC 3.0, Teil 1: Modellbeschreibung undAnwendungshilfen, Teil 2:Input Description [User Manual for FIPLOC 3.0, Part 1:Model description and application guidelines, Part 2: Input Description], GRS-A-2417,October, 1996.
12. G. Presser, The Multicompartment code WAVCO, Kerntechnik, Vol. 53, No 1, 1988,47-52.
13. GASFLOW 2.1 Code Manual, to be published.
14. R. Takahashi et al., Development of Advanced Fluid-Dynamic Analysis Code, α-FLOW,The 2nd ICHMT International Forum on Expert Systems and Computer Simulation inEnergy Engineering, 1992.
15. Numerical Method for Thermal-Hydraulics in Containment Vessels under SevereAccident Conditions-Spray Induced Circulation and Hydrogen Concentrations,NUPEC/INS Report M95-10, 1996 (in Japanese).
16. CFX-F3D(Version 4.1) User Manual, CFD-Services, Harwell Laboratory, UK, 1996.
17. H. Paillere et al., Development of Hydrogen Distribution and Combustion Models for theMulti-Dimensional / Lumped Parameter Code TONUS, NURETH-8 Meeting, Kyoto,October, 1997.
18. ISP-23, Rupture of a Large Diameter Pipe in the HDR-Containment, Vol. 1, OECD-NEA, CSNI Report No. 160, December, 1989.
19. ISP-23, Rupture of a Large Diameter Pipe in the HDR-Containment, Vol. 2, OECD-NEA, CSNI Report No. 160, December, 1989.
20. M. Schall and L. Valencia, Date Compilation on the HDR-Containment for Input DataProcessing for Pre-test Calculations PHDR, Report No. 3.279/82, January, 1982.
21. H.H. Wenzel et al., Versuchsprotokoll: Blowdown and Wasserstoffverteilungs-
Versuchsgruppe CON Versuch T31.5 [Test protocol: Blowdown and hydrogendistribution tests series CON, test T31.5], PHDR Working Reports 3.520/88 and3.524/88, February, 1988.
22. OECD Standard Problem ISP23, Rupture of a Large-diameter Pipe within the HDR-Containment Specification, April, 1987 (last revision 4/88).
189
23. P. Royl and J. Travis, Analysis of HDR Test T31.5 with GASFLOW, PSF-Bericht 3202,Forschungszentrum Karlsruhe November, 1994.
24. B. Schwinges, B. Huttermann and J. Rohde, Validierung des RALOC Programms anhandvon HDR Wasserstoff- und Brandexperimenten, HDR Statusbericht [Validation of theRALOC program with HDR hydrogen and burn experiments, HDR status report],Kernforschungszentrum Karlsruhe, Arbeitsbericht 05.46/89, December 13, 1989.
25. OECD Standard Problem, OECD-CSNI-ISP-29: Distribution of Hydrogen within theHDR-Containment under Severe Accident Conditions, August, 1992, Final comparisonreport, Vols. 1 and 2, NEA/CSNI R(93)4, February, 1993.
26. L. Valencia and L. Wolf, Hydrogen Distribution Experiments E11.1-E11.5, PreliminaryDesign Report, PHDR-Working Report No. 10.003/89, March, 1989.
27. H.H. Wenzel et al., Versuchsprotokoll - Wasserstoffverteilungs-Versuche HDR-Versuchsgruppe CON, Versuch E11.2 [Test protocol - Hydrogen distribution tests HDRtest series CON, test E11.2], PHDR Arbeitsbericht No. 10.010/89, 1989.
28. H. Karwat, OECD Standard Problem ISP-29: Distribution of Hydrogen within HDR-Containment under Severe Accident Conditions, Task Specification, (4. Revision 7/91).April, 1990
29. L. Wolf, and L.Valencia, Results of the PHDR Computational Benchmark Exercise onHydrogen Distribution Experiments E11.2 and E11.4, Proc. Workshop on HydrogenBehavior and Mitigation, Brussels, 4/8, EUR 14039en, March, 1991, 81-95.
30. H. Holzbauer, L. Wolf, and T. Cron, Evaluation of Experimental and Analytical Resultsof the HDR Hydrogen Distribution Experiments, Auswertebericht Versuche E11.0-6,Technischer Fachbericht PHDR 117-94 (Cat 2), February,1994.
31. L. Wolf et al., Comparison between HDR H2-Distribution Experiments E11.2 and E11.4,Proc. 19th Water Reactor Safety Information Meeting, Bethesda, USA, October, 1991,NUREG/CP-0119, Vol. 2, April, 1992, 1239-168.
32. K.K. Murata and D.W. Stamps, Development and Assessment of the CONTAIN HybridFlow Solver, SAND96-2792, Sandia National Laboratories, Albuquerque, New Mexico,November, 1996.
33. S.J. Lee et al., Benchmark of the HDR E11.2 Containment Hydrogen Mixing Experimentusing the MAAP4 Code, Conference paper, American Nuclear Society 1997 WinterMeeting, Albuquerque, New Mexico, 1997.
34. A. Manfredini, M. Mazzini, F. Oriolo and S. Paci, FUMO Code Manual Volume 1:Systems Models, Pisa University, DCMN Report RL 533 (92). OECD/GD(95)29, FinalComparison Report on ISP-35: NUPEC Hydrogen Mixing and Distribution Test (Test M-7-l), December, 1994.
35. B. Huttermann and B. Schwinges, Supplements and Corrections to HDR SystemDescription and External Steam Supply for E11 Test Series, (collected and specified byGRS), Technical note, GRS, Cologne, April, 1997.
36. OECD/GD(95)29, Final Comparison Report on ISP-35: NUPEC Hydrogen Mixing and
Distribution Test (Test M-7-l), December, 199437. M. Firnhaber, T. Kanzleiter, S.Schwarz and G. Weber, International Standard Problem
37 VANAM M3 - A Multi Compartment Aerosol Depletion Test with HygroscopicAerosol Material, Comparison Report, December 1996, NEA/CSNI/R(96) 26,OECD/GD(97)16, GRS-137, Committee on the Safety of Nuclear Installations, OECDNuclear Energy Agency, France, 1996.

190
38. T. Kanzleiter, H. Holzbauer, K. Fisher, M. Geiss and W. Hafner, Hyjet Pacos Versucheim Modellcontainment, Abschlussbericht [Hyjet Pacos tests in the model containment,final report], Bundesministerium fur Bildung Wissenschaft, Forschung und Technologie,Förderkennzeichen 15NU0962, Battelle Ingenieurtechnik, BF-R40.075-01, December,1996.
191
6. REMAINING UNCERTAINTIES DERIVED FROMEXPERIMENTAL AND ANALYTICAL EXPERIENCE
6.1 General Remarks
As shown in the preceding sections of this report, a considerable number of experiments wereperformed in a variety of test rigs. A large amount of data was generated and stored. These datapartially served as a comparison basis to an even larger number of analytical simulations of selectedexperiments. Several reports on code application exercises were assessed within the framework ofthis SOAR. Some conclusions have been drawn from ISP activities and from a number of analysesof other experiments. Especially, ISPs have been very useful in identifying code deficiencies andcode application problems.
Uncertainties in containment thermalhydraulics and hydrogen distribution phenomena may bederived from a number of sources. On the experimental side, there are uncertainties associated withmeasured parameters, e.g., temperature pressure, gas concentration etc. Moreover, there areuncertainties derived with parameters, i.e., parameters not directly measured but derived from basicmeasurements. Examples are the heat transfer coefficients, flow resistance factors etc. On theanalytical or computational side, uncertainties are associated with analytical models, specification ofinput parameters based on knowledge of initial and boundary conditions and on user effects,particularly in terms of choice of user-defined parameters and the choice of a computational scheme(nodalization scheme). Finally, there are uncertainties associated with the scaling issue, i.e., that ofextrapolating the results of a scaled experiment (either integral or specific phenomena oriented) to aprototypic reactor case.
Evidently, not all of these uncertainties require the same degree of resolution. Some uncertaintiescan be effectively dealt with by performing a reasonably large number of sensitivity analyses using alumped-parameter code. Yet the treatment of other uncertainties may require the use of a validatedfield code. However, development and assessment of field codes, for more accurately modellingphysical phenomena, require an additional experimental database consisting of separate-effects andintegral experiments. The PIRT process serves as a useful role in this respect by ranking phenomenathat are important with regard to containment thermalhydraulics and hydrogen distribution, and, in sodoing, it provides a perspective on uncertainties with regard to their significance and recommendedmethods of resolution. As stated in Chapter 3, the phenomena ranked high in the PIRT process arebuoyancy-driven transport, mixing and stratification, natural convection, and transient conduction(one dimensional). In the following sections of this chapter, remaining uncertainties are discussed inrelation to these phenomena.
Differences between experimental and calculated results in the ISP exercises were, in many cases,significant, indicating deficiencies in both analytical and experimental techniques. Efforts toanalytically evaluate dominating processes and phenomena in containment experiments were oftenfrustrated by remaining uncertainties that involve variations in the choice of code input (e.g.,nodalization, correlations for heat and mass transfer, etc.) and the specification of initial andboundary conditions. The experimental evaluation has also been problematic because of limitationsof available measurement techniques, too large or uncertain error bands of measured data, andconditioning and operating problems of test rigs. Progress in the development of advancedmeasurement techniques was slower than was progress in the development of more sophisticatedthermalhydraulic codes. Important calculated parameters such as flow velocities or surfacecondensation rates cannot be compared with relevant measurements because sensors are either not
192
available, or they may seriously alter the local thermalhydraulic flow conditions. However, not allidentified shortcomings are of equal importance for the variety of possible code applications. Thisview is largely related to the envisaged mitigative processes or devices that are supported by thepredictive analytical simulation.
Specific phenomena have been addressed that govern containment thermalhydraulics, in particularthe gas transport, mixing and long-term pressurization, which are characteristic features of thecontainment behaviour under severe accident conditions. An exemplary PIRT ranking illuminatesthe general interactions of specific phenomena with important processes independent of containmenttypes but including the effects of PARs, one important mitigation device currently under discussion.The PIRT table shows the interrelation between the phenomena and the components on one side andthose parameters (pressure, temperature, gas- composition) characterizing the state of thecontainment system.
Certain conclusions have been derived from Chapters 4 and 5 concerning the usefulness and furthercontinuation of the ISP activity and concerning the necessity of more detailed future experiments.What could be concluded from these findings about the current ability of the thermalhydraulic codesto predict the thermalhydraulic behaviour of NPP containments under severe accident conditions?How accurate and reliable are code predictions for plant applications and what are the main sourcesof uncertainties?
6.2 Analytical Modelling Features
Any conclusions about the applicability of the results of containment thermalhydraulics andhydrogen distribution experiments to reactor plant systems should not be drawn without extensivelydiscussing the scaling implications. Some general remarks on designing scaled experimental testfacilities are given in Section 4.1.1 of this report. As discussed in Section 4.4.1, extrapolation ofexperimental observations to prototype reactor conditions will always be required and should be donewith caution. A common tool is supposed to exist to help understand the characteristic behaviour oftest rigs and of the prototype as well. A validated code is considered as such a tool, serving as anidealized scaling and extrapolation procedure through sophisticated system modelling. In thiscontext, the general applicability of the analytical simulation concepts hitherto proven by the ISPexercises and by subsequent code applications to several other experiments has been anticipated.
The PIRT evaluation suggests that certain phenomenological models should be of first-order quality.There would be a significant advantage for simplified parametric codes and integrated codes if theirmodels would be benchmarked for certain separable phenomena as first order for plant analyses.Usage of validated field codes for such benchmarking is of practical interest. Basic experiments suchas MISTRA may offer basic data needed to perform the first step, i.e., a convincing validation offield codes for certain high-ranked phenomena. Benchmarking some lumped-parameter codesagainst a validated field code may also provide an attractive contribution for defending theapplication of lumped-parameter codes. With reduced funding in mind, it may not be possible toconduct large-scale HDR-type tests in the future, but partial validation by means of field codebenchmarking could be supportive.
An assessment of existing predictive code uncertainties may best be illustrated by the structure andthe main components of an ASM. Figure 6.2-1 recalls the fundamentals of the analytical simulationprocedure based on a given code. The provided set of conservation and constitutive equations, anadopted nodalization of the geometric model, the activated available code options together form theASM. The initial and boundary conditions of the object to be simulated are essential elements of the
193
ASM. It is, in fact, the entire ASM concept that is tested by comparing experimental parametertrends with calculated transients, e.g., in the framework of an ISP exercise.
The conservation equations for mass, energy, and momentum form the generally valid basis for anumber of differential equations. Depending on the degree of sophistication, conservation equationsare derived separately for the gas, steam, and liquid phases, coupled by closure equations thatdescribe the interactions between the considered phases. Lumped-parameter codes are based on thefundamental assumption that within a chosen balance volume, often termed as control volume,spatial differences of the considered variables are not of interest. The averaged variables are onlytime-dependent, resulting in a set of ordinary differential equations (ODEs). In field codes, spatialvariation of properties inside a balance volume is taken into account by introducing higher-orderspatial derivatives for mass, momentum, and energy. Thus a set of partial differential equations(PDEs) for each component and each phase is generated within a balance volume, here termed "meshpoint". Closure equations are necessary as well to describe interactions between phases. Numericalsolution procedures for ODEs differ considerably from those needed for PDEs.
The processed closure equations and other empirical correlations—e.g., for the determination ofsurface heat transfer coefficients or of local flow resistance factors—in general have only a limitedvalidity range, primarily depending on the experimental background from which they have beenderived. Hence one has to expect that without certain adjustments such correlations are not equallysuitable for all imaginable dimensions of simulated objects. The scalability of applied empiricalcorrelations is an open issue in transient two-phase flow (see for example, References 1 and 2).
The implementation of equations describing phenomenological processes requires assessments of acode’s analytical limits; that is, to what degree of accuracy are the modelled processes described byboth the equations and the numerical algorithms used to apply those equations for predictingcontainment events. These assessments assume that the user or the initial and boundary conditionswill have a minimum effect. The limits are broadly referred as being zero- or first-order modellingapproaches. As an example, simplified parametric codes (sometimes also called computationaltools), intended for use in specific PSA applications, are based on simple parametric models thatattempt to interpolate between points for which parameter values have been determined by moresophisticated analytical concepts. Other examples are the integrated PSA codes used for fast-runningroutine applications. Integrated codes, in general, employ simplified versions of sophisticated codesin order to run with reasonable computation time; for example, a simplified containment model iscoupled to a simplified primary system model to take into account the interaction between theprimary system thermalhydraulic transients and those inside the containment. Such ASMs may beclassified as zero-order modelling approaches, demonstrating global interrelations of involvedprocesses. They can be benchmarked against the results of sophisticated models, first-ordermodelling approaches, which simulate important phenomena in a best-estimate (as realistic aspossible) manner, validated through comparisons to relevant experiments. Examples have beendescribed in a more

194
Figure 6.2-1. Basic components defining an analytical simulation model (ASM)

195
recent OECD report on "Level 2 PSA Methodology and Severe Accident Management" [3], whichthe reader may consult.
Nodalization of technical systems such as the experimental test facilities or the compartmentalizedcontainment of a nuclear power plant is a decisive step when using a code. It requires experience inmodelling of complicated systems and often necessitates appropriate compromises. Nodalization, orspace discretization, provides the translation of the given geometric-model data on the fluid-dynamicand the structural properties of the simulated object into an information form amenable to thenumerical code calculation. Geometric-model data are normally deduced from drawings and shouldbe supported by details obtained from visual observation (plant walk-throughs) of the object, as forexample, exercised on occasion of some re-analyses of HDR-based ISP tests. Rather crude generalarrangement drawings often may not be entirely suitable for geometrical modelling because theysometimes disclose details that will contribute to inaccuracies of the analytical simulation. Pathwaysfor condensate drainage, additional surfaces for condensate formation, local water collection (smallsumps) may be disregarded, although important for an accurate NPP containment modelling.
Adopted nodalization is also closely linked to the estimation of relevant flow resistance factors orrelationships to properly characterize junctions connecting chosen subvolumes of the simulatedobject. This criterion is, in particular, difficult for users of lumped-parameter codes when large freecontainment volumes have to be subdivided into smaller balance volumes to facilitate the simulationof a convective flow pattern inside such volumes. Moreover, several other empirical correlations—e.g., the surface heat transfer correlations or phase exchange correlations—require localthermalhydraulic flow properties, modified or derived from volume-averaging lumped-parametercode calculations as input information.
To some extent, the user also can select offered code options, which are often explicitly or inherentlyinterrelated with the decisions on the spatial resolution of the thermalhydraulic system to besimulated. Practically no difference exists for users of lumped-parameter codes or field codes in thisrespect. Thus it remains a challenging task for the code user to make the appropriate decisions onhow to nodalize a given technical object, be it a test facility or a nuclear reactor containment.
The sensitivity of calculations to the adopted modelling concept became evident from gasconcentration calculations submitted in the framework of ISP exercises when several participantsused the same code for their predictions but with quite different modelling approaches. As to beexpected, more or less arbitrary modifications of flow resistance factors in combination with variednodalization schemes resulted in considerably different spatial gas distributions, however withoutproviding a reasonable physical justification for the adopted modifications. Clearly, for plantapplications such practice may cause remarkable uncertainties. At least, the nodalization should notremain at the unlimited disposition of the code user. Better basic guidance on how to use and apply acode as a tool to support design decisions should primarily focus on the demonstration of numericalconvergence of a calculation with respect to the spatial resolution. Variation of nodalization schemesin order to modify a result into a desired direction without physical or convergence-relatedjustification should be severely restricted.

196
6.3 Implications of Scaling
International standard problems and many other code validation efforts have been based on scaledexperiments. From experience with ECCS codes, it is evident that the ability of codes to satisfyobvious scaling requirements largely depends on the scaling ability of the empirical relationshipsbuilt into the codes and their interdependencies with a chosen nodalization concept [4-6].
Many code users have accumulated experience on how to optimize the necessary user decisions inapplying the code for successful predictions or recalculations of experimental events in variousscaled test rigs. Success usually means the ASM has been applied with a minimum deviationbetween calculated and measured parameters comparing either the time functions or singular valuesat certain points in time for specific events. However, an assessment of existing scale dependenciesof applied nodalization schemes in combination with other code options has never been performedfor these containment analyses. Buoyancy-driven gas flow and water condensate drainage flowmodelling are of particular interest here.
To illustrate this point, Figure 6.3-1. shows in scale a comparison of the dimensions of various testfacilities and of a prototype nuclear reactor containment. Of particular importance for buoyancy-driven natural-convection flows are the vertical extensions. It is easy to realize that experimentaldata on global convective flows obtained from small facilities may not be representative for largerobjects. Moreover, it might be realized that geometric similarity is by no means maintained.Additionally, the effects of self-heating of airborne radioactive fission products on buoyancy-drivenflows inside the containment cannot be studied experimentally, although they might be influential[7]. Will then a simulation strategy successfully applied for a particular test facility be representativefor other cases of code application, in specific for prototype plant applications?
An interesting step for an answer would be an attempt to conduct a series of counterpart tests atreduced but different geometrical scales and at thermalhydraulic conditions most close to theconditions expected in a real plant accident. Such counterpart tests would be characterized by severalbasic requirements :
• availability of test rigs at various scales with comparably sophisticated measurementtechniques and designed under a common scaling philosophy;
• identical test goals (e.g., the same type of scenario should be studied by the involved
partners); • similar testing conditions should be headed for and specified, allowing presumed
dominating phenomena neither to be suppressed nor overpronounced during anexperiment.
If modelled by a well-streamlined ASM, a counterpart test series would at least allow an estimate ofthe degree to which that the ASMs satisfy scale-up requirements [8-9]. Unfortunately, for the timebeing, larger test facilities suitable for far-reaching counterpart test activities are not available.Former facilities, such as HDR Facility and the BMC, have been dismantled. However, someforthcoming facilities should be screened—with respect to size, typicality in compartmentalization(in lieu of missing geometric similarity!) and available vertical extension to allow natural convectionto eventually develop—to become candidates for counterpart testing.

197
Figure 6.3-1. Scale comparison of test facilities with prototype containment

198
6.4 Initial and Boundary Conditions
Regarding the testing conditions for the prediction of local gas composition transients, the locationand strength of steam and hydrogen sources into the containment test facility are dominatingboundary conditions. Of equal importance for test facilities as well as for the nuclear power plantcontainments are the initial conditions, which are determined by the accident phase preceding ahydrogen release and the associated distribution process for long-lasting severe accident events.During the early phase of a LOCA, the temperature distribution is generated on structural surfacesand within the free volume of the containment. Even inverse temperature stratification has beenobserved during this phase. Hence, in most ISP studies, specific attention has been drawn to theconditioning procedures to which the test rigs were subject before the intended experiments actuallystarted. Uncertainties resulting from the experimental conditioning procedure, have been quoted asmajor contributors to observed differences between calculated and measured parameter trends forsome ISP exercises (e.g., the ISP 29 and the ISP 35 test). Indeed, the ISP specifications for theexperimental blowdown events for ISPs 23 and ISP 29 required intensive and time-consuminganalytical studies, supported by the available pressure vessel blowdown instrumentation, to clarifyimportant input information for ISP participants to the best-possible extent compensating foruncertainties or even errors in mass- and energy-flux measurements.
The prediction of the plant behaviour likewise would require a reliable commitment to the boundaryconditions anticipated for the severe accident scenarios to be analysed. Each experiment is normallycarefully prepared, its mode of operation is specified in detail, and the beginning of the test is at thediscretion of the experimenter. In contrast to the situation for experiments, the problem to specifyrelevant boundary conditions for the accident simulation is more difficult for a NPP. In particular, itis not possible to localize the most unfavourable point of an anticipated hydrogen–steam release.Consequently, a variety of accident scenarios must be covered. Level 2 PSA studies can help toidentify the most important scenarios, correlate them to specific release locations, and thus reduce thenumber of cases to be analytically simulated in detail.
Risk studies have provided a wide range of possible steam release rates in combination withhydrogen formation rates expected from a degraded core. More recent research has been conductedinto the processes resulting from late-phase quenching of a degraded core. The mechanismsgoverning these effects are not yet well understood, and more studies are needed to establish adatabase suitable for the development of applicable simulation models for degraded core quenching[10]. Hitherto available empirical versions of such models resulted in considerable underestimationof experimentally observed hydrogen production rates. Assumed rates for the release of a hydrogen–steam mixture into a NPP containment for the time being must be considered as a boundary conditionwith much greater associated uncertainty ranges than ever before experienced for correspondingpredictions of experimental events.
6.5 Sensitivity Analyses
As the preceding discussion has indicated, several factors may contribute to uncertainties andinaccuracies accompanying the prediction of the containment thermalhydraulic behaviour undersevere accident conditions. In general, uncertainty analyses attempt to quantify the effects of theincompleteness of the code models in combination with the uncertainties of the model inputparameters simultaneously estimating the possible effect of phenomena or processes that have not yetbeen studied in detail. Several methods have been developed to generate uncertainty statements forsafety-relevant parameters of thermalhydraulic analyses of primary coolant systems (see, forexample, References 1, 11 and 12). Methods have been developed and are discussed for best-
199
estimate code calculations of primary-system transients of NPPs; experience in these methodologiesis still growing. Depending on the selected method, uncertainty statements may differ in quality andthe effort involved may be large, varying from method to method. Sometimes, expert judgement isconsulted to close existing gaps where analytical uncertainty assessment is not on hand.
Similar uncertainty assessment procedures have not yet been established for best-estimatecontainment analyses. The database of severe-accident-related containment experiments is relativelysmall if compared to that of primary coolant system behaviour. The less-known scale-up capabilitiesof the available analytical simulation models may be another reason delaying the application of thesemethods in the area of containment analyses at present time.
In Section 5.5, the experience in code applications to the recalculation of experiments was evaluated.Differences between calculated and measured parameters were assessed with respect to achievablenumerical accuracies or existing simulation uncertainties, or both, for these experiments. They arepartially related to the analytical limits of the applied codes, partially to the use of the code, and tosome extent to the uncertainties of the available initial and boundary conditions of the experiments.As a next step, it will be necessary to quantify the individual contributions to the simulationuncertainty, in particular that of analytical model limits of the involved code. This is a difficult taskfor the future, requiring considerable efforts to be successful. Subsequently, an appropriatemethodology will be developed to interpret identified sources of uncertainties of the analyticalsimulation of experiments for their effect on thermalhydraulic plant analyses.
For the time being, the potential of a numerical sensitivity study may be utilized to assess theanticipated or expected margins of results calculated with an ASM for NPPs and to identify theirmain contributors. A reasonable sensitivity study for an adopted analytical simulation model willtake into account deviations from given nominal initial and boundary conditions, variations of someoptional code parameters (e.g., correlations for heat transfer and flow resistance factors), andpossibly a modification of the adopted nodalization concept.
However, some limitations must be observed. Modifications of nodalization and the correspondingvariation of code options must remain physically reasonable; for example, heat transfer coefficientsmay only be varied within established application limits. With respect to the input boundaryconditions of an ASM, the variation of source functions characterizing steam and hydrogen releaseinto the containment must cover the known and anticipated bandwidths of these functions. Locationand timing of a release, being scenario-dependent, have a strong effect on calculated gasconcentration distribution (an important safety-relevant parameter) and should be varied so as tocover the scenarios of interest.
In summary, a reasonable sensitivity analysis can provide an insight into the dependencies ofrequired containment analyses regarding the applied analytical simulation strategies and thereliability of the needed code input. It can identify areas where existing uncertainties of input datamust be improved. It also helps in the recognition of the effect that various analytical limitsintroduce into the computational analysis of the containment behaviour. Essentially, the extent of anappropriate sensitivity analysis will depend on the safety question that a code calculation is supposedto support, e.g., through the determination of suitable margins.

200
6.6 Conclusions and Recommendations
Meaningful quantification of the uncertainties associated with the application of thermalhydrauliccodes for plant analyses is complex. Based on comparisons of calculated physical parameters withtest results, some findings have emerged from Chapter 5 with respect to the analysis of experiments.Because of scale-related influences, a cautious approach should be adopted when using thesefindings, concerning the reliability of an ASM-based approach to scaled experiments, as grounds foran assessment of model performance in applications involving NPP containment safety. Certainly,available thermalhydraulic codes will continue to be used to analyse the plant behaviour under severeaccident conditions. For the time being, general conclusions about the predictive accuracy of codesfor the plant application are difficult to derive from the findings of Chapter 5. The uncertainty ofthermalhydraulic plant behaviour predictions will be large, in particular because of the uncertaintiesassociated with the relevant boundary conditions. Whenever major code applications serve toanalyse the thermalhydraulic effect of mitigation procedures for nuclear power reactor containments,they should be accompanied by appropriate and relevant sensitivity analyses if safety margins have tobe quantified. The results of code applications may indicate the expected computational margins ofsuch predictive analyses.
Regardless of the above-mentioned problem to improve the boundary conditions for severe accidentplant analyses, conducting a carefully planned counterpart test activity, as illustrated in Section 6.3,might be an important step forward. This step could shed some more light on the scalability of theapplied simulation concepts for thermalhydraulic processes inside the containment. Currently, thisevidence is scarce.
6.7 References:
1. A. Forge et al., Review Study on Uncertainty Methods for Thermal-hydraulic ComputerCodes, Final Report, Study Contr. Nos. ETSN-0046-F and ETSN-0047-D, EuropeanCommission, EUR 15364 EN, February, 1993.
2. H. Karwat, Elaboration of a Guideline for Counterpart Testing of Integral Loop Systems,Nuclear Science and Technology, CEC Publication, EUR 6540 EN, Luxembourg 1988.
3. NEA/CSNI, Level 2 PSA Methodology and Severe Accident Management, Reportprepared by the CNRA Working Group on Inspection Practices (WGIP),OCDE/GD(97)198, 1997.
4. N. Zuber et al., Evaluation of Scale-up Capabilities of Best-estimate Codes, NuclearEngineering and Design, Vol. 119, 1990, 97-109.
5. G. Yadigaroglu, Comments on Quantifying Reactor Safety Margins, NuclearEngineering and Design, Vol. 132, 1992, 425-429.
6. G. Petrangeli, Comments on Quantifying Reactor Safety Margins, Nuclear Engineeringand Design, Vol. 132, 1992, 419-422.
7. NEA/CSNI, Physical and Chemical Characteristics of Aerosols in the Containment,Report of a Group of Experts, NEA/CSNI/R(93)7, February, 1993.
201
8. H. Karwat, Scaling and Extrapolation of Hydrogen Distribution Experiments, NuclearEngineering and Design, Vol. 104, 1987, 285-294.
9. H. Karwat, The Importance of Natural Circulation inside Nuclear Containments, Proc.Eurotherm Seminar Nr.19 Natural Circulation in Industrial Application, Pisa, October,1990, 75-87.
10. NEA-CSNI, Degraded Core Quench: A Status Report, OECD /GD (97) 5, August, 1996.
11. A.J. Wickett and G. Yadigaroglu, Uncertainty Analysis Methods, Report of a CSNIWorkshop London, March, 1994, Vols. 1 and 2, NEA/CSNI/R(94)20 Parts 1 and 2, 1994.
12. S.N. Aksan, F. D´Auria and H. Städtke, User Effects on the Transient System CodeCalculations, Final Report, NEA/CSNI/R(94)35, January, 1995.
202
7. CONCLUSIONS AND RECOMMENDATIONS
Containments of water-cooled power reactors traditionally have been designed to withstand themechanical and thermal consequences of a spectrum of postulated LOCAs. The DBA scenarios,which cover a range of ruptures of primary- or secondary-coolant lines up to the large-diameter mainrecirculation line, have been internationally adopted to support the specification for the design andthe safety assessment of nearly all engineered safety systems. Design-basis-accident-typical long-and medium-term phenomena and processes were evaluated in detail in two earlier SOARs, namelyCSNI Report No. 126 on Pressure Suppression System Containments for Boiling Water Reactors andCSNI Report No. 166 on Containments of Pressurized Water Reactors. Little new information hasbecome available in this field since that time. International Standard Problem 23 was the last activityconfirming findings of earlier studies. Taking into account the conservative principles of thecontainment design procedures we find that the conclusions and recommendations of these reportsremain fully valid.
Risk studies are now used to demonstrate the radiological consequences of severe accident scenarios,which by definition are not covered by the existing reactor safety systems. For such low-probabilityscenarios, the preservation of the containment integrity is of utmost importance. In particular, therelease of hydrogen poses a particular threat to the containment because for nearly all severe accidentsequences if left unmitigated it may lead to a dangerous combustion load. Gas transport and mixingwithin the containment free volume are important thermalhydraulic phenomena in this context.Other processes such as core-melt ejection into the lower plenum, core-melt interactions with water,or a core-melt penetrating the containment basemat may also threaten the containment integrity undercertain conditions of severe accidents. The phenomenological understanding and the effect of theseprocesses on containment thermalhydraulics have recently been addressed in special reports.
National and international research efforts have been conducted to understand containmentthermalhydraulics under severe accident conditions. A considerable experimental database has beengenerated by integral model experiments at various scales. Specific interest was devoted to long-lasting natural-convection experiments, including mixing and thermal stratification. Numerousexperiments were performed during the last decade to investigate the long-term thermalhydraulicbehaviour of containments. Most of the 25 experiments listed in Table 4.1-3 addressed phenomenaassociated with integral mixing processes in containments. An impressive range of volumetric scale,various compartment configurations, and accident conditions were studied.
Although more tests may be performed in the future to fulfil technical needs, the tests conductedhitherto provide a reasonable database for current lumped-parameter code validation. Manyexperiments are well documented, and information has been made available to the nuclearcommunity.
Some restrictions with respect to the suitability for code validation purposes have also been noted.Available pressure and temperature sensors in general yield reliable data for comparison withcorresponding analytical results. Other parameters such as local steam condensation rates, gasconcentrations, and low flow velocities in open rooms typically indicating buoyancy-driven plumeformation are difficult to measure, are limited in number, and are burdened with larger uncertainties.
Considerable progress has been noted in more recent code developments, as also demonstrated byISP recalculations. Several lumped-parameter codes have been improved or have been newlydeveloped replacing earlier versions that were available in only rudimentary form during the early1980s, when risk studies were intensified. The new code versions allow a more detailed insight into

203
processes governing various scenarios of interest, specifically the highly importantbuoyancy/stratification phenomena identified in Chapter 3. Much attention has been devoted todistribution calculations eventually serving as basis for a prediction of hydrogen combustionconsequences.
Multidimensional finite-element field codes have been further developed. These codes providesolutions of the Navier-Stokes equations for multicomponent gas flow and allow fine-griddiscretization of the free containment volume. Various physical subroutines have been added, e.g.,improved routines for heat exchange with confining structures including condensation film trackingmodels, combustion models for hydrogen burns etc. However, application of field codes is adeveloping methodology requiring a great deal of experience, further validation efforts and the proofof their predictive reliability, especially for full-plant analysis. On the other hand, detailed validationof sophisticated analytical simulation models—e.g., based on field codes—hitherto suffers fromrestrictions mentioned above with respect to available measurement techniques.
Risk studies interrelate anticipated malfunctions of well-designed safety systems e.g., hydrogenmitigation systems, with various severe accident scenarios and quantify the probabilities of suchevents. A large amount of work has been performed to better understand thermalhydraulics ofcontainments under these severe accident scenarios. Transient hydrogen distribution within thecontainment is an essential process for the analysis of available hydrogen mitigation systems such as
• the application of igniters, • the use of catalytic recombiners, • the installation of pre- or post-inerting systems, and • the activation of venting systems.
The selected hydrogen mitigation technique should work reliably under a variety of postulatedconditions, its efficiency should be predictable and assessed in view of the existing ultimate loadcapabilities of the containment system as part of the risk study.
Thermalhydraulic codes provide the necessary tools to analyse the efficiency and reliability ofavailable hydrogen mitigation systems. Unfortunately, because of a limited understanding of allinvolved phenomena, processes and phenomena–process interactions, code predictions areaccompanied by some inaccuracies and uncertainties as is evident from the assessment of most recentexperimental and analytical experience. Without additional research work, these uncertainties aredifficult to quantify and to reduce.
Major reasons for uncertainties associated with the analysis of containment internal buoyancy-drivenflows have been discussed. Applicability and compatibility of empirical relationships for heattransfer coefficients and flow resistance factors, in combination with chosen thermalhydraulic andstructural nodalization concepts representing the geometrical facts of the simulated object, wereaddressed in Chapter 6. Other uncertainties are related to the scalability of processed empiricalcorrelations. The initial conditions and the boundary conditions under which integral experimentshad been performed are considered as additional sources of difficulties experienced in numericalsimulations.
204
Recommendations on future work to improve the analytical tools must be carefully evaluated againstthe possibilities to improve available measurement techniques or to develop innovative measurementtechniques to make optimal use of decreasing funding. Certain supplementary experimentalactivities have recently been started, as indicated in Chapter 4 of this report. Even if because offunding restrictions, only limited progress is expected in the execution and continuation of theseexperimental programs they will shed more light into the reasons for existing uncertainties and aretherefore strongly recommended. The quality and reliability of new experimental data may profitfrom earlier experience, and some shortcomings may be avoidable in generating and processing newexperimental data.
Ongoing code development and validation work will utilize these data in the near future.International co-operation within the framework of the OECD-sponsored ISP program will certainlyamplify the collaboration between experimental and analytical research laboratories on a broad level.Hence the submission of useful proposals for new ISPs should be encouraged, as well as theparticipation of analysts on a wide international level. However, a more rigorous assessment of thesuitability of the proposals to be submitted is necessary. A critical evaluation of the experimentalboundary conditions and of the installed measurement techniques is recommended for future ISPselections. CSNI Report No 17 provides a valid guideline for the necessary improvements.
In this context, it is recommended that a general phenomena-oriented containment code validationmatrix be established to support future code application practice and validation. Such a matrix wouldbe best based on existing IETs or SET data, starting with DBA-oriented experiments and continuingwith experiments typical for severe accident scenarios. Table 4.1-4 may serve as a valuable initiator.In particular, the suitability of the instrumentation of the experiments to be selected addressingparticular phenomena must be evaluated within a first step. Information on existing error bands foravailable measured data should be established and documented. Integrated- and separate-effects testsshould be distinguished, and information on adopted scaling principles should be given. Specificattention should be devoted to experiments suitable for future field code validation. Some tests,described in this report, addressing also phenomena other than integral mixing, will increase thevalue of a future containment code validation matrix.
Concerning the application of lumped-parameter codes, as well as of field codes, it is highlyrecommended that existing guidelines for users of codes not engaged in code development beimproved. The guidelines should more rigorously inform users of the accumulated applicationexperience, in particular that obtained within the framework of ISP activities, and more clearlyindicate the rules and limits for the physically and numerically justified generation of ASMs withthermalhydraulic codes.
Concluding this SOAR with respect to its main objectives, the following observations have beenmade:
• The current capabilities of analytical tools (e.g., the lumped-parameter codes) to makerelevant predictions of the pressure history of a containment and the correspondingaverage steam content are satisfactory. Predictions of the gas distribution withincontainments in case of hydrogen release into existing or future containments may beconsidered as satisfactory for analysing hydrogen mitigation procedures for which safetymargins are sufficiently large to preclude significant accumulations of sensitive mixtures.Gas distribution predictions needed to serve as initial basis for subsequent combustionanalyses would require more reliable high local resolution. This requirement iscontingent upon the combustion mode to be investigated, particularly for diffusion

205
flames and DDT, these modes require better local predictions of relevant initialconditions.
• Codes derived on the basis of the lumped-parameter approach have shown theirapplication limits, in particular through a number of ISP exercises. If predictiveaccuracies are limited, appropriate sensitivity analyses should be performed for plant-specific analyses. Also the prediction of slow containment pressurization caused bydecay heat transported from the core or from a released core-melt, up to the threshold forventing may be performed reliably with lumped-parameter codes if computationalmargins of the ASM results are carefully assessed.
• Recent applications of improved lumped-parameter codes for treating gas distributions,
specifically cases of global and regional stratifications, have indicated good success, asdemonstrated in ISP recalculations and other integrated test comparisons. However, thedetermination of consistency and limits of new techniques, including both the numericaland physical modelling methods, needs further investigation, e.g., an expanded base oftest comparisons, analysis, and documentation.
• Field codes may be the preferred analytical methodology to predict gas concentration
distributions with the necessary spatial resolution to eventually serve as basis foranalyses of energetic combustion modes, e.g., turbulent combustion and DDT.Considerable validation and accumulation of code application experience are considerednecessary before these tools can be reliably used for plant analyses.
OECD-sponsored ISP activities have been fruitful in identifying code application problems and inamplifying the contacts between the experimental and analytical working communities. To fosterfurther code development and validation, ISP activities should be continued. This recommendation,of course, requires competent laboratories and research centres to perform necessary tests and offertheir results to the nuclear community. Integrated- as well as separate-effects tests will be needed. Inthe future, the suitability of experiments proposed as ISP bases should be more carefully assessedthan they were in the past before they are adopted.

206
LIST OF AUTHORS
Prof. Dr. Helmut Karwat (Chairman)
Mr. Joël Bardelay (IPSN, France)
Mr. Takashi Hashimoto (NUPEC, Japan)
Mr. Grant W. Koroll (AECL–WL, Canada)
Mr. Matt Krause (AECL–WL, Canada)
Dr. Jean-Pierre L’Hériteau (IPSN, France)
Ms. Petra Lundström (IVO, Finland)
Mr. Allen Notafrancesco (USNRC, USA)
Dr. Peter Royl (FZK, Germany)
Mr. Bernd Schwinges (GRS, Germany)
Ms. Hiroko Tezuka (NUPEC, Japan)
Mr. Jack Tills (JTA, USA)
Secretariat:
Dr. Jacques Royen (OECD/NEA)

207
LIST OF ABBREVIATIONS
Abbrev: Explanation:
ALWR ADVANCED LIGHT-WATER REACTOR
ASM ANALYTICAL SIMULATION MODEL
ATWS ANTICIPATED TRANSIENTS WITHOUT SCRAM
BARC BHABHA ATOMIC RESEARCH CENTRE (BOMBAY)
BMC BATTELLE MODEL CONTAINMENT
BWR BOILING-WATER REACTOR
CEA COMMISSARIAT À L`ÉNERGIE ATOMIQUE
CEC COMMISSION OF THE EUROPEAN COMMUNITIES
CEGB CENTRAL ELECTRICITY GENERATING BOARD
CFD COMPUTATIONAL FLUID DYNAMICS
CSNI COMMITTEE ON THE SAFETY OF NUCLEAR INSTALLATIONS
DBA DESIGN-BASIS ACCIDENT
DCH DIRECT CONTAINMENT HEATING
DDT DEFLAGRATION-DETONATION TRANSITION
DCMN DEPARTMENT OF MECHANICAL AND NUCLEAR CONSTRUCTION
(Pisa University, Italy)
ECCS EMERGENCY CORE-COOLING SYSTEM
ECN STICHTING ENERGIEONDERZOEK CENTRUM NEDERLAND
(Netherlands Energy Research Foundation)
EDF ÉLECTRICITÉ DE FRANCE
EPRI ELECTRIC POWER RESEARCH INSTITUTE
ETSII ESCUELA TECNICA SUPERIOR DE INGENIEROS INDUSTRIALES
FAI FAUSKE & ASSOCIATES, INC.
GE GENERAL ELECTRIC
GPR GROUPE PERMANENT DES REACTEURS (FRANCE)
GRS GESELLSCHAFT FÜR ANLAGEN- UND REAKTORSICHERHEIT
(Company for System and Reactor Safety)
HDR DECOMMISSIONED HIGH-TEMPERATURE REACTOR PLANT
HEDL HANFORD ENGINEERING DEVELOPMENT LABORATORY
HPME HIGH-PRESSURE CORE-MELT EJECTION
IET INTEGRATED-EFFECTS TEST

208
IPSN INSTITUT DE PROTECTION ET DE SÛRÉTE NUCLÉAIRE (Institute
for Nuclear Protection and Safety)
ISP INTERNATIONAL STANDARD PROBLEM
JAERI JAPAN ATOMIC ENERGY RESEARCH INSTITUTE (TOKYO)
KWU KRAFTWERKSUNION
LANL LOS ALAMOS NATIONAL LABORATORY
LBLOCA LARGE-BREAK LOSS-OF-COOLANT ACCIDENT
LOCA LOSS-OF-COOLANT ACCIDENT
LWR LIGHT-WATER REACTOR
MCCI MOLTEN CORE-CONCRETE INTERACTION
NAI NUMERICAL APPLICATIONS INC.
NEA NUCLEAR ENERGY AGENCY (OF OECD)
NPP NUCLEAR POWER PLANT
NUPEC NUCLEAR POWER ENGINEERING CORPORATION
ODE ORDINARY DIFFERENTIAL EQUATION
OECD ORGANISATION FOR ECONOMIC COOPERATION AND DEVELOPMENT
PAR PASSIVE AUTOCATALYTIC RECOMBINER
PDE PARTIAL DIFFERENTIAL EQUATION
PHWR PRESSURIZED HEAVY-WATER REACTOR
PIRT PHENOMENA IDENTIFICATION AND RANKING TABLE
PRA PROBABILISTIC RISK ASSESSMENT
PSA PROBABILISTIC SAFETY ANALYSIS
PWR PRESSURIZED-WATER REACTOR
RSK REAKTORSICHERHEITSKOMMISSION (GERMANY)
SAC SEVERE ACCIDENT PHENOMENA IN CONTAINMENT (Task Group)
SBLOCA SMALL-BREAK LOSS-OF-COOLANT ACCIDENT
SET SEPARATE-(OR SINGLE) EFFECTS TEST
SNL SANDIA NATIONAL LABORATORIES
SOAR STATE-OF-THE-ART REPORT
UKAEA UNITED KINGDON ATOMIC ENERGY AUTHORITY (LONDON)
USDOE UNITED STATES DEPARTMENT OF ENERGY
USNRC UNITED STATES NUCLEAR REGULATORY COMMISSION
VVER VODA VODYNOY ENERGITICHESKIE REACTOR(soviet-designed pressurized water reactor)
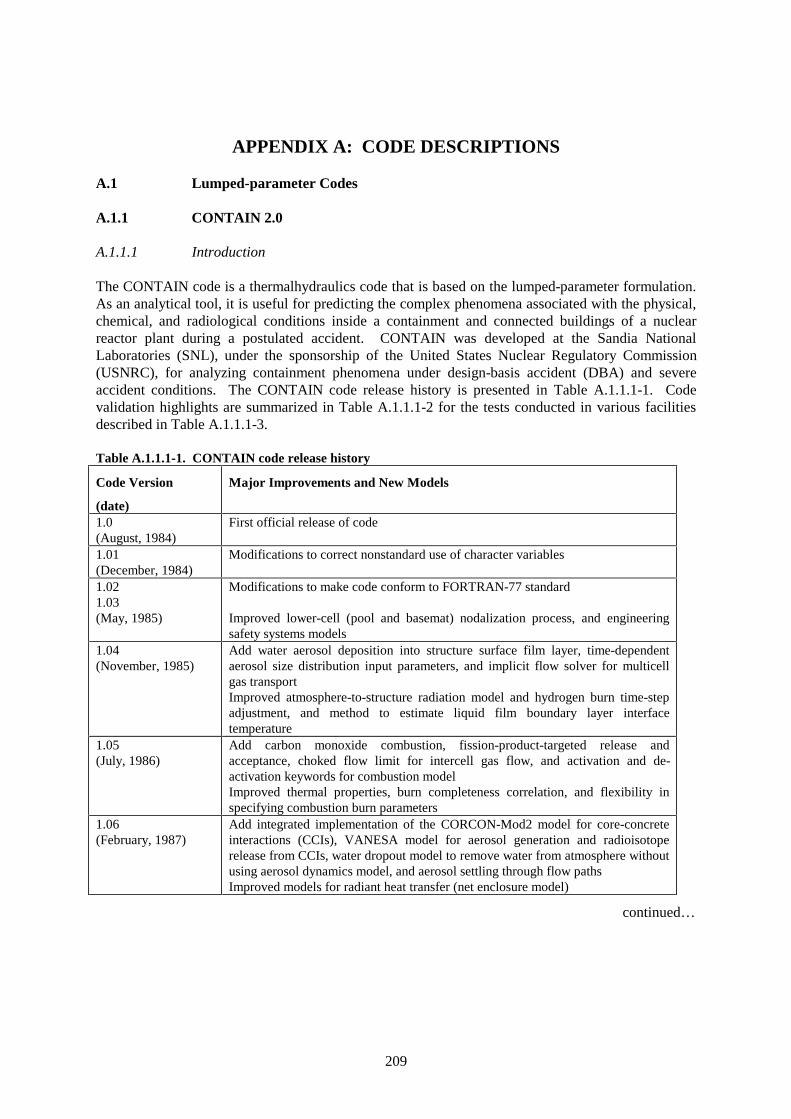
209
APPENDIX A: CODE DESCRIPTIONS
A.1 Lumped-parameter Codes
A.1.1 CONTAIN 2.0
A.1.1.1 Introduction
The CONTAIN code is a thermalhydraulics code that is based on the lumped-parameter formulation.As an analytical tool, it is useful for predicting the complex phenomena associated with the physical,chemical, and radiological conditions inside a containment and connected buildings of a nuclearreactor plant during a postulated accident. CONTAIN was developed at the Sandia NationalLaboratories (SNL), under the sponsorship of the United States Nuclear Regulatory Commission(USNRC), for analyzing containment phenomena under design-basis accident (DBA) and severeaccident conditions. The CONTAIN code release history is presented in Table A.1.1.1-1. Codevalidation highlights are summarized in Table A.1.1.1-2 for the tests conducted in various facilitiesdescribed in Table A.1.1.1-3.
Table A.1.1.1-1. CONTAIN code release history
Code Version
(date)
Major Improvements and New Models
1.0(August, 1984)
First official release of code
1.01(December, 1984)
Modifications to correct nonstandard use of character variables
1.021.03(May, 1985)
Modifications to make code conform to FORTRAN-77 standard
Improved lower-cell (pool and basemat) nodalization process, and engineeringsafety systems models
1.04(November, 1985)
Add water aerosol deposition into structure surface film layer, time-dependentaerosol size distribution input parameters, and implicit flow solver for multicellgas transportImproved atmosphere-to-structure radiation model and hydrogen burn time-stepadjustment, and method to estimate liquid film boundary layer interfacetemperature
1.05(July, 1986)
Add carbon monoxide combustion, fission-product-targeted release andacceptance, choked flow limit for intercell gas flow, and activation and de-activation keywords for combustion modelImproved thermal properties, burn completeness correlation, and flexibility inspecifying combustion burn parameters
1.06(February, 1987)
Add integrated implementation of the CORCON-Mod2 model for core-concreteinteractions (CCIs), VANESA model for aerosol generation and radioisotoperelease from CCIs, water dropout model to remove water from atmosphere withoutusing aerosol dynamics model, and aerosol settling through flow pathsImproved models for radiant heat transfer (net enclosure model)
continued…

210
Table A.1.1.1-1. CONTAIN Code Release History (concluded)
Code Version
(date)
Major Improvements and New Models
1.10(October, 1987)
Add specialized models for boiling water reactor features (safety relief valves andpressure suppression pools), new flow path type (engineering vent) to provideadded flexibility to plant nodalization, and user-defined material propertiesImproved method for tracking radioisotopes, the heat conduction algorithm forlower-cell concrete floor model, various solution techniques including semi-implicit coupling of the thermal radiation model with flow equations, andautomatic recovery from nonconvergence in the flow solver
1.11(March, 1991)
Add moving-grid calculation technique for solving the equations for aerosolgrowth by water vapour condensation, concrete outgassing of both bound andevaporable water and carbon monoxide, generalized treatment of heat structureboundary conditions, flexibility of variable setting on restart, aerosol settling intopools, volumetric displacement of atmosphere by pools, and an averaging schemeto approximate gas flow velocities within a cell, used for calculating forceconvection for heat structuresImproved material property library; heat and mass transfer models forcondensation/evaporation at structure surface, and in ice condenser and fancoolers; and, lower cell modelling of transient pool layersImproved flexibility of user control over plot files
1.12(March, 1991)
Add direct containment heating (DCH) modelling, reactor cavity models for high-pressure debris dispersal and vessel blowdown, and new model for the vapoursaturation of noncondensable gas vented into poolsImprove concrete outgassing modelling to include ability to outgas from behindliners
1.12V(August, 1993)
Workstation version of release 1.12
1.2(October, 1995)
Add film flow on wall structures, energy and mass conservation tracking, hybridflow solver, pool tracking, non-ideal equation of state for water, specific reactorpressure vessel and cavity models for DCH, CORCON-Mod3, and fission-productlibraryImproved DCH model set-up and heat and mass transfer for convection andcondensation on structures
2.0(December, 1997)
Improvements in the DCH and hydrogen burn models and miscellaneous bug fixes
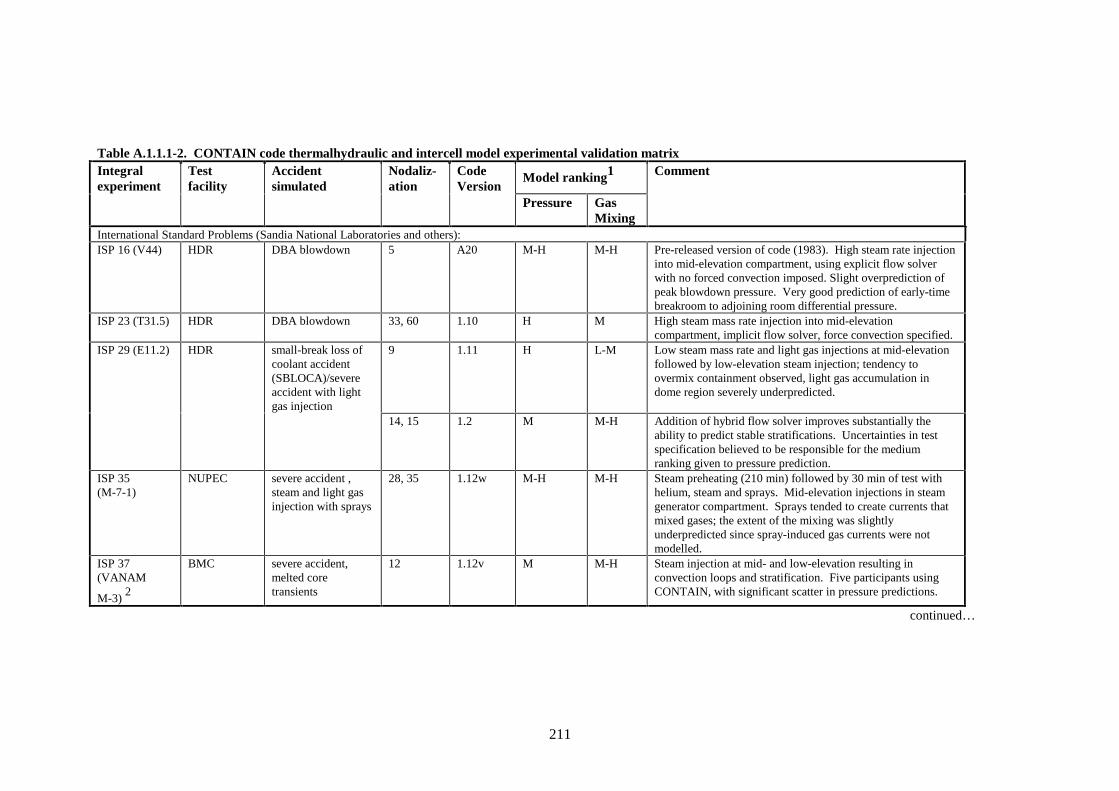
211
Table A.1.1.1-2. CONTAIN code thermalhydraulic and intercell model experimental validation matrixIntegralexperiment
Testfacility
Accidentsimulated
Nodaliz-ation
CodeVersion
Model ranking1 Comment
Pressure GasMixing
International Standard Problems (Sandia National Laboratories and others):ISP 16 (V44) HDR DBA blowdown 5 A20 M-H M-H Pre-released version of code (1983). High steam rate injection
into mid-elevation compartment, using explicit flow solverwith no forced convection imposed. Slight overprediction ofpeak blowdown pressure. Very good prediction of early-timebreakroom to adjoining room differential pressure.
ISP 23 (T31.5) HDR DBA blowdown 33, 60 1.10 H M High steam mass rate injection into mid-elevationcompartment, implicit flow solver, force convection specified.
ISP 29 (E11.2) HDR small-break loss ofcoolant accident(SBLOCA)/severeaccident with lightgas injection
9 1.11 H L-M Low steam mass rate and light gas injections at mid-elevationfollowed by low-elevation steam injection; tendency toovermix containment observed, light gas accumulation indome region severely underpredicted.
14, 15 1.2 M M-H Addition of hybrid flow solver improves substantially theability to predict stable stratifications. Uncertainties in testspecification believed to be responsible for the mediumranking given to pressure prediction.
ISP 35(M-7-1)
NUPEC severe accident ,steam and light gasinjection with sprays
28, 35 1.12w M-H M-H Steam preheating (210 min) followed by 30 min of test withhelium, steam and sprays. Mid-elevation injections in steamgenerator compartment. Sprays tended to create currents thatmixed gases; the extent of the mixing was slightlyunderpredicted since spray-induced gas currents were notmodelled.
ISP 37(VANAM
M-3) 2
BMC severe accident,melted coretransients
12 1.12v M M-H Steam injection at mid- and low-elevation resulting inconvection loops and stratification. Five participants usingCONTAIN, with significant scatter in pressure predictions.
continued…

212
Table A.1.1.1-2. CONTAIN code thermalhydraulic and intercell model experimental validation matrix (continued)Integralexperiment
Testfacility
Accidentsimulated
Nodaliz-ation
CodeVersion
Model ranking1 Comment
Pressure GasMixing
Other experimental comparisons by Sandia National Laboratories:M-8-1 NUPEC severe accident, no
preheating, steamand heliuminjected at top ofpressurizer
35 1.2 (oldflowsolver)
M-H L-M Old flow solver (Option tends to overmix gases such thatstratification boundary at the top of pressurizer issmeared.)
1.2(hydridflowsolver)
M-H M-H Hybrid flow solver (default option) maintains astratification boundary near the top of pressurizercorresponding to observed mixing behaviour.
LACE LA-4 CSTF severe accident,vessel heatup,steady state, anddepressurization,steam injection inbottom third ofopen vessel
1 1.11 H M Low injection resulted in nearly well-mixed conditions.Agreement in containment gas temperatures, exceptbelow the injection where the code overmixes. Vesselsteel walls were insulated, and the small, late-timedifference between measured and predicted pressure wasbelieved to be the result of uncertain insulationproperties.
ST-3 Surtsey severe accident,hydrogen injectioninto vessel withambient air
2, 8, 9,and 15
1.12v N/A 3 H High Froude number injection of hydrogen caused amarginally unstable condition to exist such that theovermixing observed, below the injection elevation, waswell represented by the code—a fortuitous result causedby numerical effects. The ability to predict the observedmixing was dependent on the nodalization scheme.
1.2 M-H Tendency of hybrid flow solver to maintain stablestratification (lack of momentum-driven mixing) resultsin an underprediction of mixing below the injection.
continued…

213
Table A.1.1.1-2. CONTAIN code thermalhydraulic and intercell model experimental validation matrix (continued)Integralexperiment
Testfacility
Accidentsimulated
Nodaliz-ation
CodeVersion
Model ranking1 Comment
Pressure GasMixing
Other experimental comparisons by Sandia National Laboratories:202.3, 203.3,212.1, 213.1,214.1, 222.2,224.1, 224.2
WEC Large-Scale TestFacility(LST)
Long-term passivecontainmentcooling for AP600- steam injectioninto steamgenerator room,varying initial airmass
2, 4, and17
1.12 H M-H The external passive containment cooling system(PCCS) was modelled with additional cells. Facilityarrangement did not allow convection loop betweenabove and below operation deck regions. Steam wasinjected into steam generator room, open to above deck,open region. Stratification between open regions abovethe operation deck and deadend regions below deck waswell approximated using “compartment only” noding.Stratifications above the operation deck were slight butcould not be calculated. Results were dependent onnodalization scheme. The 17-cell scheme showsovermixing behaviour.
221.1, 222.1 Long-term passivewith differentinjectionelevations
4, 17 1.12 H M 4-cell nodalization corresponds to compartmentboundaries—stratification, caused by compressioneffects, is well predicted. 17-cell nodalization allows forconvection loops—tends to overmix gas. Overmixingdependent on nodalization scheme.
17 1.2 H M-H Overmixing of gas below injection reduced, giving betteragreement with measurements. Overmixing lesssensitive to nodalization scheme with use of hybrid flowsolver.
219.1 Long-term passivewith heliuminjection intosteam generatorroom
4 1.12 H L-M Long-term mixing of light gas underpredicted. Gasmixing believed to be dominated by gas diffusion, whichis not physically modelled in the code.

214
Table A.1.1.1-2. CONTAIN code thermalhydraulic and intercell model experimental validation matrix (continued)Integralexperiment
Testfacility
Accidentsimulated
Nodaliz-ation
CodeVersion
Model ranking1 Comment
Pressure GasMixing
Other experimental comparisons by Sandia National Laboratories:221.1, 222.1 WEC Large-
Scale TestFacility(LST)
Rapid transientinjection of steamto simulate DBA-type phenomena
2, 4, and17
1.12 M-H M-H Transient gas mixing was dominated by compressioneffects. Nodalization schemes such as the 17-cellscheme with added cells below the injection tended torestrict mixing somewhat so that lower vessel heattransfer was reduced and pressure peak wasoverpredicted. 2-cell scheme, with a single cellrepresentative of the vessel (excluding the generatorroom) produced a well-mixed containment volume andtherefore overpredicted containment heat transfer andunderpredicted pressure. The 4-cell scheme appeared toapproximate the compression effect well using deadendcells such that the pressure peak was predicted betterthan the other noding schemes.
17 1.2 M M-H Mixing underpredicted, pressure overpredicted—similarto version 1.12 (old flow solver).
Test #1, 2, 3,and 4
WEC Small-Scale TestFacility(SST)
Long-term passivecontainmentcooling
1 1.11 H N/A The external PCCS was modelled with two additionalcells. Pressure controlled by PCCS. Multiple-elevationsteam injection created by a centreline distribution pipewith holes produced a well-mixed containment.
Experimental comparisons by others (AEA, U. of Maryland):FAL-3A Falcon
facility,open systemwith inletand outlet
severe accident,steam and heliuminjection alongwith solid aerosols
1 1.12 M-H 4 N/A Slight underprediction of degree of superheat. Problembelieved to be the result of the high concentration ofhelium in atmosphere and the assumed use of airdiffusivity to approximate the helium component(corrected in later code versions).
continued…

215
Table A.1.1.1-2. CONTAIN code thermalhydraulic and intercell model experimental validation matrix (continued)Integralexperiment
Testfacility
Accidentsimulated
Nodaliz-ation
CodeVersion
Model ranking1 Comment
Pressure GasMixing
Experimental comparisons by others (AEA, University of Maryland):ACE CSTF severe accident -
steam, solidaerosols, andiodine injections
1 1.11 H N/A Well-mixed steam and gas mixture in single-volumevessel—temperature and saturation ratio predicted.
FIPLOCverificationexperiment,F2
BMC 48-h heatup toinvestigatebuoyancy-drivencirculation inloopedcompartments
1, 5, and11
1.10 M-H L-M Uncertainties in containment leak rate made accuratepressure and local temperature comparisons difficult.Significant stratification observed—trends weregenerally predicted. Transition to well-mixedcontainment not predicted because of unknown lowercompartment leakage rates. Single-cell calculationsignificantly underpredicted measured pressure rise.
DEMONA,A9
BMC TH conditioningfor aerosoldeposition-steaminjection
5 1.11 M-H M-H Periods of saturated and superheated conditions.Pressure and local temperature predicted. Small degreeof stratification observed.
DEMONA,B2
BMC TH conditioningfor dry aerosol
1 1.11 M N/A Well-mixed non-condensable gas experiment.Depressurization dependent on containment leakage.Laminar leak flows not modelled with current flowmodels. Temperature relaxation predicted well,confirming dry heat transfer modelling in code.
DEMONA,B3
BMC TH conditioningfor wet aerosol -
1 1.11 H N/A Well-mixed steam and gas mixture test. Steam partialpressures shown to be in good agreement with data.

216
Table A.1.1.1-2. CONTAIN code thermalhydraulic and intercell model experimental validation matrix (concluded)Integralexperiment
Testfacility
Accidentsimulated
Nodaliz-ation
CodeVersion
Model ranking1 Comment
Pressure GasMixing
E11.4 HDR SBLOCA/severeaccident\low-elevation steaminjection, venteddepressurization
13 1.12 H M-H Low-elevation injection of steam tends to mixcontainment atmosphere, thereby producing a relativelysmall degree of stratification (compared to E11.2).Slight overprediction of light gas concentration in domeregion—general trends in temperature and concentrationthroughout containment are predicted.
Notes:1. H - prediction of prime quantity (pressure, temperature, or concentration) to within 10% and predict the trends M - prediction of prime quantity to within 20% to 40 % and predict trends L - prediction of prime quantity less than 50% and only a few trends predicted
2. Four participating countries from Europe using CONTAIN (Sandia did not participate)
3. Not applicable (not measured or reported)
4. Gas temperature comparisons only
Other abbreviations: DBA (design-basis accident), SBLOCA (small-break loss-of-coolant accident) TH (thermalhydraulic)

217
Table A.1.1.1-3. Containment test facilities used for CONTAIN thermalhydraulic and intercell model validation
Facility Location Free Volume
(m3)
Sub-compartments
Heat sinks Comment
HDR Germany 11 300 62 upper steel shellinternal concretewalls, misc. steel
Large-scale containment withvertical/horizontal aspect ratio significantlylarger (~4 times) than commercial plants.Well instrumented for stratification studies.
NUPEC Japan 1310 28 steel shellsteel interior walls
1/4 scale model of PWR plantnon-prototypical internal heat sinks
BMC Germany 600 9 concrete exterior andinterior walls
scale model of German PWR plantleakage rate uncertainty
CSTF USA 850 1 insulated steel shell domed cylindrical tankused mainly for iodine and aerosoldeposition testing
Surtsey USA 59 1 insulated steel shell domed cylindrical tankFalcon UK 0.3 1 insulated steel shell open tank (inlet and outlet) with heaters
used for aerosol deposition testsWEC Large-Scale TestFacility
USA 84 1 and 4 passive cooled steelshellsteel partition wallsmisc. Al heat sinks
1/8 scale model of AP600 containment
WEC Small-Scale TestFacility
USA 4.7 1 passive cooled steelshell
steam distribution pipe along axis of tallcylindrical tank

219
A.1.1.2 Important recent code development features
Recently, a new gravitational head formulation for the treatment of flows under stratified conditionshas been developed for CONTAIN [1]. The new formulation, termed the hybrid formulation orhybrid flow solver, extends the predictive capability of the code to include fully developed, stablystratified conditions that form in the containment as a result of a heat source or buoyant gas injection.(A fully developed stratification is one in which the conditions are essentially well mixed above theinjection point but are stratified with respect to regions below the injection point.) In addition to thehybrid flow solver, other models in the code have been added or improved: inter-structure liquid filmflow modelling has been added to the heat transfer structure model; an energy and mass conservationaccounting method with detailed output has been added; the hydrogen combustion model has beenupdated to include the HECTR 1.8 hydrogen burn model; and extensive pool-tracking modificationshave been added to allow the flooding of control volumes to be consistently treated.
In terms of containment thermalhydraulics and hydrogen distributions, the most important modeladdition has been the hybrid flow solver. The hybrid solver uses a combination of donor and averagedensity formulations for the gravitational head to treat the entire spectrum of possibilities for astratification with regard to its hydrostatic stability, including unstable, metastable, and stable. Thismodelling effort was begun during the CONTAIN peer review [2] to address the well-known problemof overmixing that is apparently common to a number of lumped-parameter codes, as noted in thereports on International Standard Problems ISP 23 and ISP 29.[3,4]. The validation of this newadvance in lumped-parameter modelling is discussed below and shows that the previously observedovermixing is not a necessary consequence of the lumped-parameter approach.
Stratifications of interest in containment analysis are typically ones within enclosed volumes that aregenerated by jets or plumes resulting from buoyant gas or heat sources or both. To be treatable withthe most recent version of CONTAIN (CONTAIN 2.0), such a stratification must be stable and fullydeveloped. The jet or plume in addition must occupy a small part of the cross-section of the enclosedvolume, so that the residence time of buoyant material within the jet or plume is short and theconditions in the ambient fluid outside of the jet or plume, rather than those within the jet or plume,are of principal interest. In this case, it can be shown [5] that (1) the ambient fluid stratification fortemperature and concentrations is one dimensional, and (2) ambient fluid stratification withincontainments can be predicted through integral relations (i.e., entrainment correlations) withoutdetailed knowledge of the entrainment flow fields near the jet or plume. It should be noted that suchentrainment correlations are not available in CONTAIN 2.0, although idealized correlations havebeen implemented in unofficial code versions. Therefore, CONTAIN 2.0 is applicable only to stable,fully developed stratifications, for which the detailed entrainment rate modelling is not important.Fortunately, most stratifications formed after the initial blowdown in containment scenarios areexpected to be stable, and the time constant for the development of stratifications is typically shortcompared to the time scale of interest, and the restriction to fully developed stratifications is not aserious one.
A.1.1.3 Recommended problem types for application
The CONTAIN code is most commonly applied to the integrated analysis of containment DBA andsevere accident events. Phenomenon identified as important to the prediction of containment loadsand events are generally nonlinear and are coupled. The lumped-parameter approach makes the codefast-running, so that an understanding of the complex interaction of various nonlinear models can beinvestigated through sensitivity studies. In many analyses, the initial conditions represented byinjection location, rates, or timing also require a large number of simulations. In such cases, a code

220
like CONTAIN is to be recommended because of its relatively fast execution time. Because it is fast-running, it is practical to run on a variety of workstations, as well as large mainframe computers. Thecode is currently running on SUN, IBM, HP, DEC, and CRAY workstations and CRAY mainframes.
With the lumped-parameter approach, the geometrical modelling of a containment is somewhatinvolved but much more straightforward than what is required for a first-principles numericalapproach based on the conservation equations, without use of integral models. For the former, asubstantial part of the input data is often available in tabular form that can be directly translated intocode input. In some cases, more detailed geometrical information may be required but is typicallyavailable from the general arrangement drawings provided in most plant safety analysis reports. Theavailability of data and ease of transference means that set-up time for a lumped-parameter model isrelatively short, allowing more resources to be devoted to the actual calculations and sensitivitystudies. In contrast, obtaining the full benefits of a first-principles approach requires a full renditionof a typically complex containment geometry composed of a number of irregularly shaped and sizedcompartments connected by a labyrinth of pipes and interconnecting doorways and hatches and filledwith complex structures.
In addition to being fast-running with modest set-up requirements, CONTAIN—as well as mostlumped-parameter codes—is structured so that integral models can be used to simplify modellingotherwise requiring a very complex nodalization if calculated from first principles. For example, theform and frictional loss coefficients used for interconnecting flow paths represent the integralsolution of a complex fluid flow problem in considerably simplified form. Flow coefficients arewidely used in fluid transport problems and in containment analyses have been shown to provideaccurate representations of pressure-driven gas flows during rapid steam injections.[6,7]. Heat andmass transfer correlations for heat sinks are another example of an integral model. Jet and plumeentrainment correlations are yet another example.
A.1.1.4 Specific disadvantages of code
The disadvantages of the CONTAIN code are in its current inability to predict some of the details ofgas-mixing behaviour. This deficiency stems from the lack of a detailed entrainment model for jets,plumes, and shear layers; the lack of a molecular/turbulent diffusion model for the mixing of gasesacross gas-gas interfaces, and the standard lumped-parameter assumption that momentum convectionwithin a control volume can be neglected. As a result of these deficiencies, various features oftransient gas mixing cannot be predicted. These include the initial formation stage of stratifications,before attaining a fully developed stratification; long-term mixing behaviour, dominated bymolecular/turbulent diffusion processes; and the instability of stratifications because of momentumconvection. However, it should be noted that the first deficiency, the lack of a detailed entrainmentmodel, could be remedied provided an appropriate entrainment model is available. In addition, therole of molecular/turbulent diffusion in containment scenarios has yet to be established, andmomentum convection is not expected to be important after the initial blowdown, during periodswhen steam or hydrogen stratification or both stratifications become important.[4].
A.1.1.5 Validation highlights
Recently, SNL has re-assessed the most recent version of the CONTAIN code with the hybrid flowsolver against ISP 29 and other experiments where stratifications are observed [1]. Previouscalculations of the HDR experiment E11.2, on which ISP 29 is based, showed that code versionspreceding CONTAIN 2.0 overmixed the containment during the heatup phase of the experiment,resulting in too little steam above the injection and too much steam below. During the period afterthe light gas injection and during a low-elevation steam injection, the code incorrectly predicted a
221
decreasing hydrogen concentration in the dome region and was unable to predict the rather largeincrease of hydrogen in the dome region subsequent to cooling of the dome shell by external sprays.The hybrid solver has been implemented for general use in CONTAIN 2.0. With this version,predicted steam and hydrogen spatial profiles are significantly improved when compared withmeasurements—dome hydrogen concentrations are now predicted to increase after the low-elevationsteam injection, and during the dome spray period a substantial increase in dome hydrogen isindicated. Other validation efforts with respect to stratifications have involved comparisons withtemperature and concentration profiles in the Surtsey, NUPEC, and Westinghouse Large-Scale TestFacilities.[1,8,9]. In each of these comparisons, when highly stratified conditions were present andthe nodalization was sufficient to resolve the stratification, they were predicted to good accuracy orconsiderably improved in accuracy with CONTAIN 2.0. When such conditions were not present orthe nodalization was too coarse to capture the stratification, the containment conditions werepredicted to be essentially unchanged from those predicted by previous code versions.
A.1.1.6 User base
The CONTAIN code was first released over 10 years ago. It has now matured into an analysis toolthat accomplishes essentially its stated purpose—to provide a validated predictive tool to analyzecontainment thermalhydraulics including hydrogen transport and combustion, as confirmed through apeer-review of the code [2]. The community of CONTAIN users is extensive, as indicated by thevariety of authors and institutions that have been involved in CONTAIN code applications andvalidation exercises. Reference and user manuals [10,11] are available, along with specific guidance[8] and validation reports [1,9,12-15]. The code is one of the most widely distributed and acceptednonproprietary containment code available to the reactor safety community.
A.1.2 MELCOR
A.1.2.1 Introduction
In 1982, the United States Nuclear Regulatory Commission (USNRC) sponsored development of theMELCOR code at SNL to perform integrated analyses of accidents in nuclear reactors. Relevantphenomena are modelled parametrically, with the level of detail for each depending both on itsimportance in an accident and on the consensus in the safety community concerning physicalunderstanding of the phenomenon.
MELCOR is a fully integrated, relatively fast-running code that models the progression of accidentsin light-water reactor (LWR) nuclear power plants (NPPs). MELCOR is "integrated" in the sensethat various feedback effects would be modelled, including—but not limited to—the effects ofcontainment conditions on in-vessel accident progression and the relocation of heat sources with thetransport of radionuclides. The previous calculational tool (Source Term Code Package (STCP)) [16]required manual transfer of data from one code to another. MELCOR eliminated this procedure andthe potential for introduction of errors. The analysis of consequences was to be performed by aseparate computer tool, MELCOR Accident Consequence Code System (MACCS) [17]. MELCORis capable of generating output for MACCS to use.
A.1.2.2 Important recent code development features
Recently, the critical heat flux correlation in MELCOR, based on the work of El-Genk and Guo et al.[18], was compared with the latest correlation developed as a result of NRC-sponsored experimentsat Pennsylvania State University (i.e., Cheung et al. [19]). MELCOR is sufficiently parametric thatthis comparison was made without any modifications to the code; that is, the correlation was

222
incorporated into the code solely through existing sensitivity coefficients. This comparisonconcluded that the default critical heat flux correlation in MELCOR (Guo et al.) provides aconservative estimate when compared with the experimental results. This observation demonstratesthe flexibility of the code and the soundness of the original critical heat flux model.
The list of phenomena now covered by MELCOR models includes two-phase hydrodynamics, heat,and mass transfer, both in the reactor and in the containment; decay heat generation; fission-productrelease and transport (including relocation of heat sources); aerosol physics; core and lower plenumthermal response, degradation, and relocation; gas combustion; thermomechanical response of thevessel lower head; low- and high-pressure melt–ejection phenomena; and melt–concrete interactions.In addition, models are included for control systems and engineered safeguards. Provision is made foruser-specified fission power levels, including connection to a Chexal-Layman correlation foranticipated transient without scram (ATWS) situations.
MELCOR can analyze the complete sequence of an accident, from steady-state power operationthrough calculation of the source term. In the hands of an experienced analyst, the code can be usedto treat a variety of LWRs (including some that differ substantially from US commercial designs) andexperimental facilities, and to address questions of the sensitivity of calculated results to assumptionsand modelling choices.
MELCOR uses a control volume/flow path calculational method, similar to RELAP4, HECTR, andCONTAIN. All the models in CONTAIN are considered for implementation into MELCOR;simplified models of most of the models are in MELCOR. This includes CORCON-Mod3.MELCOR contains the deflagration models from the HECTR 1.5 code, with more user-adjustableparameters than were available in HECTR. With the emphasis shifted to use MELCOR as a sourceterm code, several detailed models such as ex-vessel debris/concrete interactions (CORCON-Mod3),fission-product release (VANESA) [20], and aerosol scrubbing in water pools (SPARC-90) [21] wereadded as parts of MELCOR.
An entire spectrum of accident phenomena is modelled in MELCOR. Characteristics of accidentprogression that can be treated with MELCOR include the thermalhydraulic response in the reactorcoolant system (RCS), reactor cavity, containment, and confinement buildings; core heatup anddegradation; radionuclide release and transport; hydrogen production, transport, and combustion;core-concrete attack; heat structure response; and the effect of engineered safety features onthermalhydraulic and radionuclide behaviour.
There is also a growing appreciation of the potential uncertainties in our understanding of accidentsequences and progression as well as in the accident analysis themselves. An important part ofMELCOR is the capability to perform sensitivity analyses and uncertainty analyses through the use ofsensitivity coefficients. Many parameters in correlations, which are hardwired constants in mostcodes, are sensitivity coefficients in MELCOR and are adjustable by the user through input, asdiscussed in the MELCOR manuals [22]. For example, the coefficients in a heat transfer correlationare usually assumed to be constant. However, in MELCOR the constants are coded as sensitivitycoefficients that can be changed by the user to determine the sensitivity of the results to the heattransfer correlation.
A.1.2.3 Validation highlights
MELCOR was peer-reviewed in 1991 [23]. Much of our subsequent model development andimprovement activities have been based on comments received in that review. All new models havebeen independently peer-reviewed before being incorporated into MELCOR. One of the peer-review

223
suggestions was the need for additional code assessment. This suggestion resulted in the formationof the MELCOR Co-operative Assessment Program (MCAP) as an ongoing activity to assess thecode against experiments and in performing plant analyses. Twenty-two countries are currentlyparticipating in the MCAP activities. MCAP produces annual reports to document all MELCOR-related analyses reported by the MCAP participants during the preceding year.
Currently most major experiments are or have been modelled with MELCOR by the code developersor users of MELCOR. This list of experiments includes ABCOVE, ACE, ACRR (DC, DF, MP, andST), ATT (Marviken-V), Battelle Model Containment, BETA, CORA, CSE, DCH (1:40 CWTI(ANL) and 1:10 Surtsey (SNL)), DEMONA, EJECT, EPSI, FALCON, FIST, FLECHT-SEASET,FLHT, HCOG (1:4 Scale), HDR, HEVA, LACE, LOFT FP-2, LFP (in Surtsey), MIST, NUPEChydrogen tests, PACTEL (natural circulation), PBF-SFD, PHEBUS (FP and SFD), PMK, PNL IceCondenser, Semiscale, SEGMA, SNL 1:6 Scale Containment, SPARTA, STEP, SURC, SWISS-2,WETCOR, VI, and GE Large Vessel Swell. MELCOR has essentially duplicated the quarter-scaleHCOG hydrogen tests results for a Mark III containment. Currently, modelling of the PHEBUS FPT-0 experiment is complete and work is progressing on modelling of the PHEBUS FPT-1 experiment.MELCOR is also used in all ISPs, the most recent of which is ISP 37 of the VANAM-M3experiment. Sandia National Laboratories was one of the users of MELCOR in this problem and theresults were reasonable. Since completion of the ISP, the hygroscopic model was complete and there-run analysis yielded good agreement with the data .
Each release of the code is independently evaluated by the Brookhaven National Laboratory. Thepurpose this independent evaluation is to perform quality control verification to ensure that models,common numerics, and control options have been correctly implemented. Brookhaven providesfeedback to SNL to correct any problems encountered.
A.1.2.4 Specific disadvantages of code
The disadvantage of MELCOR is also one of its strengths, namely its flexibility through the use ofuser-adjustable default values. The default values are frequently used by analysts, primarily becausethey may not be aware of any reason to change to a different value. The default values have not beenendorsed by the USNRC or by SNL. Currently, we are investigating the default values to identifythose that should be changed and to provide a basis for the default values. Future editions of themanuals will highlight the default values and the need for users to verify their applicability for theproblem they will be analysing.
A.1.2.5 User base
Nine versions of MELCOR have been released and distributed in the past 10 years. The latestdistributed version, referred to as Version 1.8.3, was released in July of 1997 and has been receivedby more than 48 organizations in 22 countries. The code is supported on a variety of machines andoperating systems including various UNIX workstations (including IBM, SUN, DEC, and HP),mainframes (including Crays and DEC VMS machines), and personal computers (PCs) using DOS orWindows. The distribution includes a graphics package that allows preparation of time-history plotsof user-selected variables on any supported machine, without the need for third-party software.
MELCOR continues to be improved. Currently, the MELCOR 1.8.4 Reference Manual, User’sGuide, related documents, and sample input decks (as well as updates as they become available) areavailable through the World Wide Web at URL www.nrc.gov/RES/melcor/. The new version 1.8.4has many new and improved models.

224
New models that are available for this release include the following:
1. interactions between the reactor vessel and water in a flooded cavity, 2. creep rupture failure of the vessel lower head, 3. blockage of flow by core debris, 4. chemisorption of fission products on metallic surfaces, 5. hygroscopic aerosols, 6. fission-product aerosol behaviour, and 7. support of fuel pellets by ZrO2 and Zr.
Significant improvements have been made to models for
1. chemical reactions between boron carbide and steam, 2. detailed temperature and composition profiles for gases within the reactor core, 3. scrubbing of gas-borne fission products by passage through water pools, and 4. modelling of downward and cross-flows in cores.
Future code releases will include improvements to the modelling of boiling-water reactor (BWR)core sprays, core plate and core support structure, fission-product release under high-pressure melt-ejection (HPME) conditions, ex-vessel debris spreading, and core reflooding.
A.1.3 GOTHIC
A.1.3.1 Introduction
GOTHIC (Generation Of Thermal Hydraulic Information for Containments) is a general-purposethermalhydraulics computer program. It can be used for design, licensing and safety and operatinganalysis of nuclear containments and other confinements [24].
GOTHIC was developed from the public domain containment analysis code, COBRA-NC byNumerical Applications Inc. (NAI), which owns the code together with the Electric Power ResearchInstitute (EPRI) of the United States. Version3.4e (1993) is publicly available, and furtherdevelopment (current Version 6.0 - 1998) is funded by an EPRI-sponsored user group consisting ofabout 30 US and international organizations (mainly utilities) and is thus proprietary. Versions ofGOTHIC have been applied to ISP 29, ISP 35 and ISP 37. Its validation base for lumped-parameterand coarsely meshed distributed parameter models is very good, with application to BFMCblowdown tests D-1, 15 and 16, C-13 and 15; BFMC hydrogen mixing tests 6, 12 and 20; HEDLhydrogen mixing tests HM-5 and 6; LACE tests LA-5 and 6; Marvikken tests 17, 19, 22 and 24;CVTR DBA tests 3, 4 and 5; and HDR tests V21.1, T31.1, T31.5 and V44 [25]. This validation basehas recently been extended by Battelle’s application of GOTHIC to the CEC-F2 experiment,VANAM-M2, PAR test MC1 and MC3, all in the Battelle Model Containment (BMC), and several

225
HDR tests, including simulations of E11.2 and E11.4 using a truly two-dimensional six-node regionfor the dome.
A.1.3.2 Code features
GOTHIC calculates the thermalhydraulic response of a full-scale containment building modelled as acollection of interconnected volumes. In a lumped-parameter model, GOTHIC treats eachcompartment as a single control volume. A more detailed but more computationally intensiveanalysis can be obtained by subdividing some or all control volumes into one-, two- or three-dimensional Cartesian meshes. Mass, momentum and energy are transferred between controlvolumes using one-dimensional flow paths. Heat transfer to and from structures is handled usingthermal conductor models. The complete response of a model is calculated by solving a combinationof mass, momentum and energy conservation for three phases: vapour, liquid and droplets, andmechanistic models for interface mass, energy and momentum transfer. An ice phase is also includedfor ice-condenser analysis. While Version 3.4e contains only a simple one-parameter turbulencemodel, Version 5.0 can treat turbulence in a number of ways, including a k − ε model. GOTHICsimulations can also include models of engineered safety systems when calculating the containmentresponse. These include valves and doors, pumps and fans, cooling sprays, heat exchangers, and (inrecent versions) hydrogen recombiners. The inclusion of these models allows modelling of automaticcontainment response and the effects of operator action during an incident, i.e., accidentmanagement. Engineered safety features are activated through trips, which respond to changes inselected variables such as pressure, temperature, and velocity or on the status of other trips. Tripscan also be used to control boundary conditions. The latest version also includes a lumped-parameterand a distributed-parameter hydrogen burn model.
A.1.3.3 GOTHIC Validation in Canada
GOTHIC has been acquired by members of the Canadian nuclear industry and will be used for safetyanalysis of CANDU containments, including analysis of hydrogen distribution. Validation of allmajor safety analysis codes is a major requirement by the regulatory body and the goal of an industry-wide code validation effort. To provide a systematic framework for the validation work, the industryhas adopted the methodology of validation matrices, similar to that developed by the NEA for LWRs[26]. Specialists in 6 scientific disciplines—Systems Thermalhydraulics, Fuel and Fuel ChannelThermalmechanical Behaviour, Fission-Product Release and Transport, Containment Behaviour,Physics, and Moderator and Shield Systems Thermalhydraulics—are developing the matrices forCANDU plants. These disciplines cover a much broader range of phenomena than those addressedby Reference 26.
The validation matrix methodology has five basic components [27], as shown inFigure A.1.3.3-1. The first component is the Technical Basis Document, which provides a totaloverview of all postulated accidents in the design basis of the nuclear plant and the associated mainphysical phenomena governing the behaviour of plant systems. The steps for the validation matrixdevelopment, the second component, are as follows:_______________________________CANDU is a registered trademark of Atomic Energy of Canada Limited (AECL).

226
Figure A.1.3.3-1: Validation Process

227
a. identification of accident scenarios to be analysed,
b. identification and ranking of phenomena relevant to these accidents,
c. description of the phenomena,
d. identification of experiments that exhibit the phenomena,
e. description of the source facilities/tests, and
f. generation of a cross-reference table of phenomena versus relevant experimental data.
The validation matrix comprises the tables in items (b) and (f) above (a list of CANDU containmentbehaviour phenomena and accident scenarios is currently being considered for release for the purposeof inclusion in this SOAR). These two components provide the general knowledge base, which iscode independent. The last three components are code-specific: a code validation plan identifies thenecessary work required for validation; validation exercises compare code calculations withexperimental data; and a validation manual summarizes code accuracy, sensitivities and uncertaintiesfor specific applications. The manual addresses the question of whether the validation is adequate.
Because the current validation base for GOTHIC in its lumped-parameter mode is good, AECL willfocus on validating GOTHIC for 3D applications, essential in predicting hydrogen distribution in theabsence of active mixing equipment and for the prediction of hydrogen burn consequences, be theyfrom deliberate or accidental ignition. Validation of GOTHIC for CANDU containment safetyanalysis is planned to be completed in 2001.
A.1.4 FUMO
A.1.4.1 Introduction
The FUMO code [28,29] was developed as a part of an ongoing severe accident) research program bythe Department of Mechanical and Nuclear Construction (DCMN) of the Pisa University. Thepurpose of the code is to provide a best-estimate tool for thermalhydraulic analysis of a containmentsystem under severe accident conditions. In particular, it is able to predict pressures, temperaturesand gas distributions within the containment by assessing loads and associated threats to the systemintegrity. An "integrated" version of the code is also able to perform coupled analysis of primary andcontainment systems [30] for advanced LWR plants. The present version includes models related tohydrogen burning, direct containment heating (DCH) [31], and corium-water interaction. Specificmodels for external gravity-driven spray [32], "pool management" and heavy-water propertiesprovide FUMO with the capability to analyse a wide range of LWR, heavy-water reactor (HWR), andadvanced plants accident sequences [33].
A.1.4.2 Code features
Multicompartment. The code is able to treat the thermalhydraulic transients caused by a mass andenergy blowdown in a multicompartment containment. The transient is described using a quasi-steady-state approach. The major phenomena that are simulated include intercell flow, heat and mass

228
transfer processes, and simulation of emergency safety features, as the internal spray system.Thermodynamic conditions in each control volume are calculated according to the following options:
a. a stagnant homogeneous mixture of steam, liquid water and air;
b. a two-region model, consisting of a homogeneous air-steam mixture region and a liquid poolregion; the pool region may or may not be in thermal equilibrium with the atmosphere(Figure A.1.4.2-1);
c. a two-region model, consisting of a 6 non-gases/steam region and a liquid pool
Gases taken into account are oxygen, nitrogen, hydrogen, carbon monoxide and dioxide, and argon.Their production can be simulated with input blowdown tables, except for the hydrogen productionduring the corium-water interaction, that can be directly calculated. In very high volumes, it ispossible to use a model for hydrogen and steam vertical distributions.
Different de-entrainment models are available for evaluating the water condensed in the containmentatmosphere and its falling velocity, taking into account the drop diameter and the mixture turbulence.
Figure A.1.4.2-1. Description of a FUMO compartment
Heat Transfer. Particular care is given to flexibility in modelling heat sinks and heat transfercoefficients. Heat transfer between containment atmosphere and heat-conducting structures can becalculated using a set of heat transfer correlations or a mechanistic model based on the analogy ofheat and mass transfer. Temperature distribution inside a structure is evaluated by solving theFourier equation by a specifically developed coarse-mesh method [28]. A key aspect in this field isthe limits imposed by heat transfer correlations or models derived from specific experimentalconditions. In this context, a SOAR on available models and recent experiments, relevant toprediction of condensation heat transfer, was produced [34]. A mechanistic condensation heat
229
transfer model was also developed [35], by using the analogy between momentum, heat and masstransfer for forced and natural convection. Both smooth and wavy interfaces can be simulated forcondensate film to better describe situations (high condensation mass transfer rates) when the filmthermal resistance is comparable with that of the mixture boundary layer.
Junctions. FUMO uses a multicompartment configuration that allows an arbitrary arrangement ofcontrol volumes and flow paths. Control volumes are connected through junctions that can be alsosubmerged by water or that have a time- and pressure-dependent area. The junction flow rate isderived from the acceleration flow model, with the option of being quasi-steady, and can be evaluatedin three different ways:
1. from the pressure difference across the flow paths, considering mixture inertia as well asfrictional resistance. It can be also calculated by neglecting inertia (flow rate is assumed to comeinstantly to steady-state value);
2. for flow regimes characterized by small pressure differences compared to cell pressures (typicalin long-term phase) and a fast-running option, based on a semi-implicit model, has beendeveloped; and
3. Bernoulli equation is solved for the evaluation of water flow rate.
Natural Circulation. Specific models [28] have been developed to simulate loop-type naturalcirculation or phenomena inside a control node. Mass flow is calculated considering the densitydifference as the driving force, due both to the different gas temperature and to the differentatmosphere composition. Using these models, it is possible to overcome some limits of the lumped-parameter approach. For the description of a closed loop, a realistic evaluation of the gravitationalhead developed within two consecutive compartments of a branch is performed. The integration in acell is therefore between the two ends of the flow path linked to the cell, with the hypothesis of aconstant density of the atmosphere, while the integration along the junction, which links twoconsecutive nodes, is performed relating to an average value of the densities of the two connectedcells. The natural-circulation flow rate is determined by integrating the momentum equation for thewhole system using an electrical analogy. In this analogy the natural-circulation flow is equivalent tothe current in a single network, the friction losses along the branch are equivalent to the electricalresistances, and the "driving force" that is due to the difference of the integral of density alongbranches is equivalent to a direct current generator. Finally, each node is equivalent to an electricalcapacitance.
Atmosphere Stratification. Together with the model for the evaluation of the natural-circulationflow, a model [28] for the simulation of buoyancy and diffusive flows resulting from gas and steamstratification inside a large containment volume has been implemented in FUMO. This model isorganized in two temporal phases: in the first one the buoyancy mass flow towards the upper zone ofthe analysed node is described, and in the second one, the homogenization of the gas and steamconcentrations, caused by the diffusion process towards the lower zone, is simulated. The first phaseof this stratification process is analysed by dividing the considered control volume into n verticalzones and resolving, for each zone, a balance equation for the specific flow rate of considered gasmoles. In this way it is possible to obtain a vertical distribution of concentrations. The second phasesimulates the gas molecular diffusion that is due to the gradient of the concentration inside a volume.The Fick law for diffusion is resolved in a one-dimensional geometry using a completely implicitmethod of solution.

230
Hydrogen Combustion. The model is based on a stationary model, called FLAME [36]. The flamepropagation is considered isotropic, and the combustion completeness is limited only by theflammability limit achievement. The main characteristics of FLAME are as follows:
a. Injection and flammability criteria are based on the concentration of the combustible mixture; ifthe combustion starts in a control node, it goes on in the following time steps, until theachievement of default minimum concentrations of reactants.
b. Burning time ratio between the characteristic length of the compartment and the flame velocity, iscalculated on the basis of semiempirical correlations.
c. Flame propagation—If combustion starts in a compartment at a given time step, the combustionprocess propagates into all the adjacent nodes (isotropic propagation) if the flammabilitycondition is satisfied.
Consumption rate of the reactants (hydrogen, oxygen and carbon monoxide) and formation rate of theproducts (steam and carbon dioxide) are given by the ratio between mass variations and burning timefor a complete combustion. During the combustion process, FUMO uses an integration time stepequal to the smallest of all the complete burning times for the compartments in which a flammablemixture exists. On the basis of this assumption, one or more time steps are required in order tocomplete the combustion in all the nodes. At the end of each step, the mass and energy of the gases,present in each compartment, are updated on the basis of the junction flows; in this wayconcentrations and flammability characteristics are also updated.
A.1.4.3 Validation highlights
FUMO has been applied to the analyses of several international experiments. Among theseexperiments are the large-scale HDR test E11.2 [37], the FIPLOC-F2 test [38], and the NUPEC M-7-1 test [39] discussed below.
FIPLOC F2 Test. The major objective of this test [38] was to investigate thermalhydraulic long-termphenomena, with special emphasis on natural convection in a containment with a loop-type geometry.Description of natural circulation was correctly performed by FUMO and also prediction of theoverall transient was good [40]. Some limitations were, however, highlighted for phenomenainfluenced by containment local conditions. The results obtained (FUMO), with respect to natural-convection flow patterns and changes in the main flow direction, are compared with experimentaldata (EXP) and previous FUMO calculation (old) without the natural circulation models inFigure A.1.4.3-1.
HDR E11.2 Test. The HDR E11.2 test [37] simulates, in the first phase of the transient, a small-break SBLOCA within a multicompartment containment. This first phase is followed by a steam–hydrogen mixture injection. Steam strongly enriches volumes above the break, but it does not returndown in a substantial quantity. Local gas concentrations of up to 16% were measured near theinjection point, and concentrations between 12% and 14% were observed inside the dome (FigureA.1.4-3-2). The gas was only able to penetrate in small amounts into lower regions through adiffusion process. This was correctly predicted by FUMO. It is also possible to use the stratificationmodel to predict the increase inside the dome for the hydrogen concentration during the externalspray activation period.
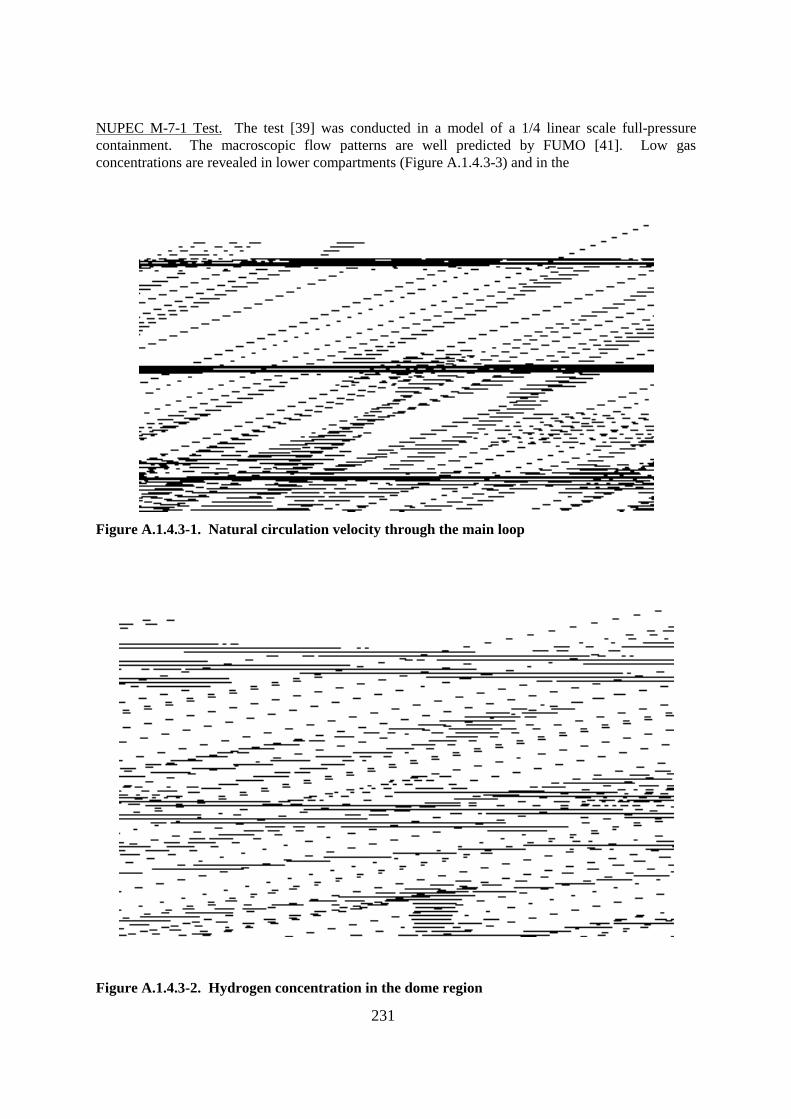
231
NUPEC M-7-1 Test. The test [39] was conducted in a model of a 1/4 linear scale full-pressurecontainment. The macroscopic flow patterns are well predicted by FUMO [41]. Low gasconcentrations are revealed in lower compartments (Figure A.1.4.3-3) and in the
Figure A.1.4.3-1. Natural circulation velocity through the main loop
Figure A.1.4.3-2. Hydrogen concentration in the dome region
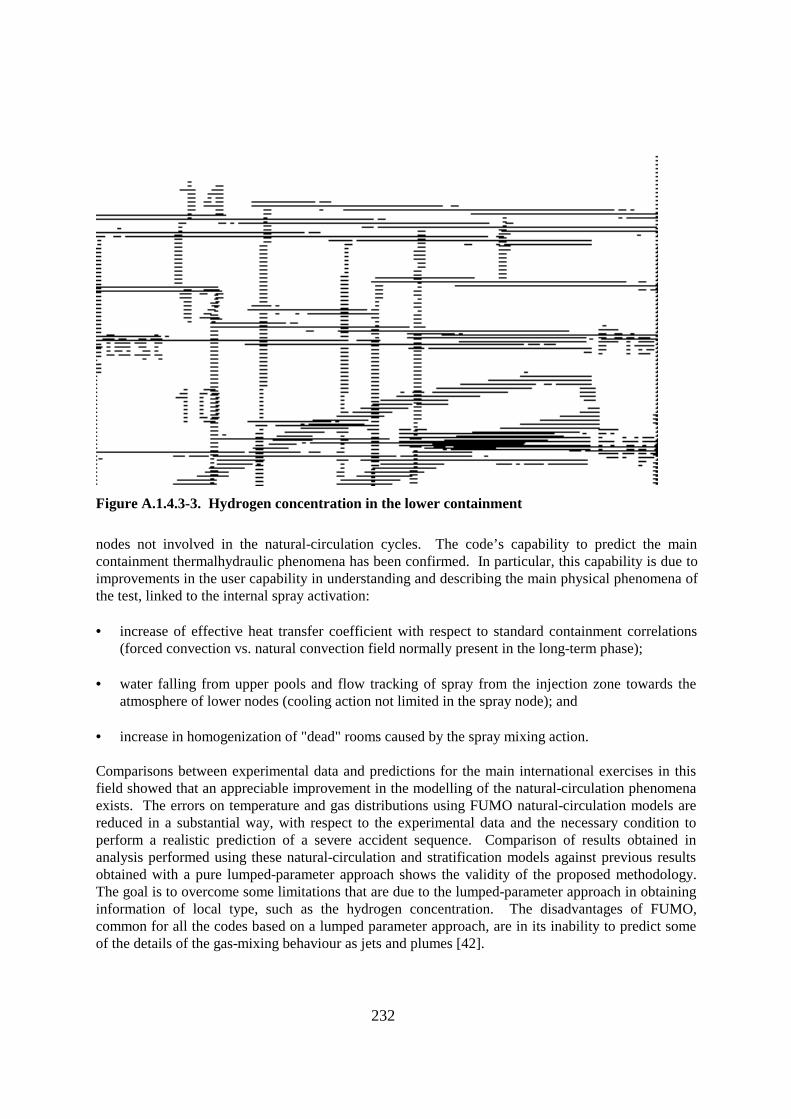
232
Figure A.1.4.3-3. Hydrogen concentration in the lower containment
nodes not involved in the natural-circulation cycles. The code’s capability to predict the maincontainment thermalhydraulic phenomena has been confirmed. In particular, this capability is due toimprovements in the user capability in understanding and describing the main physical phenomena ofthe test, linked to the internal spray activation:
• increase of effective heat transfer coefficient with respect to standard containment correlations(forced convection vs. natural convection field normally present in the long-term phase);
• water falling from upper pools and flow tracking of spray from the injection zone towards theatmosphere of lower nodes (cooling action not limited in the spray node); and
• increase in homogenization of "dead" rooms caused by the spray mixing action.
Comparisons between experimental data and predictions for the main international exercises in thisfield showed that an appreciable improvement in the modelling of the natural-circulation phenomenaexists. The errors on temperature and gas distributions using FUMO natural-circulation models arereduced in a substantial way, with respect to the experimental data and the necessary condition toperform a realistic prediction of a severe accident sequence. Comparison of results obtained inanalysis performed using these natural-circulation and stratification models against previous resultsobtained with a pure lumped-parameter approach shows the validity of the proposed methodology.The goal is to overcome some limitations that are due to the lumped-parameter approach in obtaininginformation of local type, such as the hydrogen concentration. The disadvantages of FUMO,common for all the codes based on a lumped parameter approach, are in its inability to predict someof the details of the gas-mixing behaviour as jets and plumes [42].
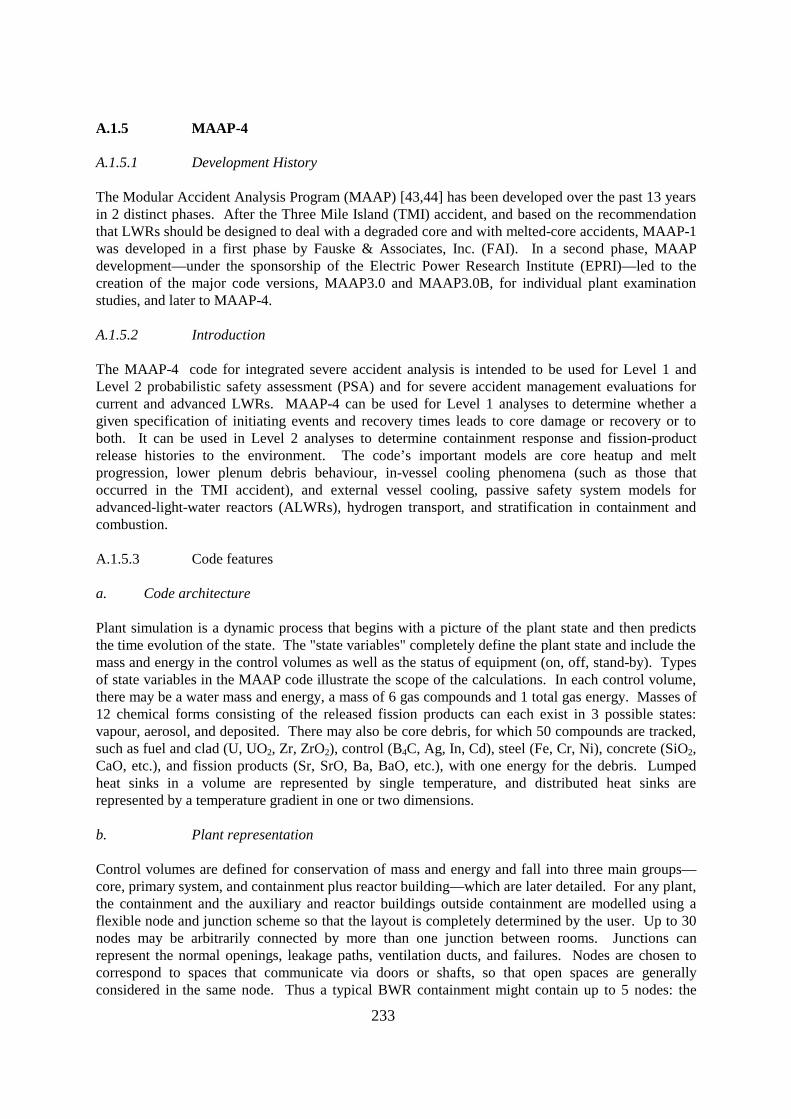
233
A.1.5 MAAP-4
A.1.5.1 Development History
The Modular Accident Analysis Program (MAAP) [43,44] has been developed over the past 13 yearsin 2 distinct phases. After the Three Mile Island (TMI) accident, and based on the recommendationthat LWRs should be designed to deal with a degraded core and with melted-core accidents, MAAP-1was developed in a first phase by Fauske & Associates, Inc. (FAI). In a second phase, MAAPdevelopment—under the sponsorship of the Electric Power Research Institute (EPRI)—led to thecreation of the major code versions, MAAP3.0 and MAAP3.0B, for individual plant examinationstudies, and later to MAAP-4.
A.1.5.2 Introduction
The MAAP-4 code for integrated severe accident analysis is intended to be used for Level 1 andLevel 2 probabilistic safety assessment (PSA) and for severe accident management evaluations forcurrent and advanced LWRs. MAAP-4 can be used for Level 1 analyses to determine whether agiven specification of initiating events and recovery times leads to core damage or recovery or toboth. It can be used in Level 2 analyses to determine containment response and fission-productrelease histories to the environment. The code’s important models are core heatup and meltprogression, lower plenum debris behaviour, in-vessel cooling phenomena (such as those thatoccurred in the TMI accident), and external vessel cooling, passive safety system models foradvanced-light-water reactors (ALWRs), hydrogen transport, and stratification in containment andcombustion.
A.1.5.3 Code features
a. Code architecture
Plant simulation is a dynamic process that begins with a picture of the plant state and then predictsthe time evolution of the state. The "state variables" completely define the plant state and include themass and energy in the control volumes as well as the status of equipment (on, off, stand-by). Typesof state variables in the MAAP code illustrate the scope of the calculations. In each control volume,there may be a water mass and energy, a mass of 6 gas compounds and 1 total gas energy. Masses of12 chemical forms consisting of the released fission products can each exist in 3 possible states:vapour, aerosol, and deposited. There may also be core debris, for which 50 compounds are tracked,such as fuel and clad (U, UO2, Zr, ZrO2), control (B4C, Ag, In, Cd), steel (Fe, Cr, Ni), concrete (SiO2,CaO, etc.), and fission products (Sr, SrO, Ba, BaO, etc.), with one energy for the debris. Lumpedheat sinks in a volume are represented by single temperature, and distributed heat sinks arerepresented by a temperature gradient in one or two dimensions.
b. Plant representation
Control volumes are defined for conservation of mass and energy and fall into three main groups—core, primary system, and containment plus reactor building—which are later detailed. For any plant,the containment and the auxiliary and reactor buildings outside containment are modelled using aflexible node and junction scheme so that the layout is completely determined by the user. Up to 30nodes may be arbitrarily connected by more than one junction between rooms. Junctions canrepresent the normal openings, leakage paths, ventilation ducts, and failures. Nodes are chosen tocorrespond to spaces that communicate via doors or shafts, so that open spaces are generallyconsidered in the same node. Thus a typical BWR containment might contain up to 5 nodes: the

234
annulus around the vessel, the CRD room below the vessel, the dry well, the downcomer vents, andthe wet well; a typical PWR containment might contain a similar number (Figure A.1.5.3-1). Finernodalization is possible when a containment is more highly compartmentalized and when the debrisor the hydrogen distribution is in question.
MAAP uses nodes that contain gradients or sub-nodes physics to simulate certain processes insteadof well-mixed control volumes, when necessary. For example, the potential formation of stablestratified layers inside an otherwise lumped-containment control volume is considered when hot gasenters into the top of a room, and therefore may not mix with gas in the room and exit out of a sidewall or bottom flow path. Sub-node physics thus draws attention to important details only when it isnecessary, so those phenomena are modelled at their own natural scale.
c. User controls and operator modelling
MAAP-4 contains an elegant scheme for the input processing to allow user control of a simulationand operator modelling. "Intervention conditions" are specified by the user to define plant states thatwill lead to either operator actions, equipment automatic function, or some other equipment statuschange. Corresponding to these conditions are “action blocks" that contain commands for equipmentand operator performance.
Detailed plant system logic, operator procedures, and event trees can be easily represented andunderstood using the intervention and the action structure. Interventions may be specified to simulatea sequence defined in an event tree, or they may also encode a causal relation, such as the failure of apump because of local high temperature, or an operator reaction to an observed set of reactorconditions.
Actions basically consist of the operation and alignment of equipment: turning systems on and off,controlling the positions of valves for relief or throttling, etc. The actions may also consist ofperformance curve adjustment to represent new alignments or degraded operating conditions.Intervention conditions are constructed from arbitrary Boolean combinations of fundamental events,such as a condition for reactor scram based on high dry-well pressure,
low reactor pressure or water level, etc. Arbitrary combinations of conditions and actions may beconstructed, allowing the logic for an entire system or operator procedure to be input.
d. Code use and validation
MAAP-4 can be used to model either a LWR or an experiment with geometry similar to some majorportion of a LWR. Core-melt progression experiments are modelled by providing inlet conditionsand simple boundary conditions such as system pressure. Hydrogen distribution experiments aremodelled by providing gas sources to the containment.
In any application, two input files are provided. The parameter file contains a description of the plantor the experiment in terms of geometry, materials, equipment, etc. It is independent of the specificaccident sequence or experimental run. The input deck contains accident initiators and operatoraction commands as well as sequence-specific initial conditions. Sources to experimental simulationsare provided by a third file that is specific to the experiment.

235
Figure A.1.5.3-1(a). PWR containment nodalization
Figure A.1..5.3-1(b). BWR containment nodalization

236
A.1.5.4 Containment and auxiliary reactor building models
a. General model description
In MAAP-4, the containment building can be divided by the user into many logically distinct roomsconnected by flow paths. The purpose of the MAAP containment model is to predict the temperature,pressure, gas composition, debris temperature, and fission-product inventory in each region,accounting for sources from the vessel and from core debris outside the vessel as well as engineeredsafeguard systems. In addition to the volumes and junctions, both lumped-parameter heat sinks(representing equipment) and distributed-parameter heat sinks (representing walls with non-negligible temperature gradients) are user-specified, with up to 200 of each allowed. Two basic typesof model exist in MAAP for these tasks: those that predict phenomena that occur within singlevolumes, such as core debris-concrete interactions; and those that predict intercompartmental flowsof gas and water.
Intercompartmental flow of gas involves tight coupling between the volumes, so an implicitnumerical technique is applied to the Bernoulli equation written for every junction. The same appliesto water flows when water is spilling between many compartments or when some compartments arenearly full of water (solid), so again an implicit technique is used.
The numerical techniques employed here are those of MAAP-3.0B, with recent improvements createdfor the simplified boiling-water reactor (SBWR) [45] of General Electric and the Department ofEnergy’s Atmospheric Remote Sensing and Assessment Program (ARSAP). Counter-current flowsof gas streams of different density (caused by either temperature or composition differences) can playa dominant role in mixing and fission-product transport, so that modelling of pressure-driven flowsalone can be quite non-conservative; the Epstein model [46] and the results of experiments [47] atFAI are employed in MAAP-4 to consider these effects. High-velocity gas flows can occur duringrapid transients such as vessel blowdown or debris quenching, and these flows can entrain both waterand core debris between compartments. Therefore, up to 10 compartments are allowed to handle thecore debris, with the potential for core-concrete interactions and the ex-vessel fission-product release.Entrainment is quantified by Kutateladze number of the flow, and it may be enhanced or retarded byuser input to account for unique geometry of flow paths [48].
Other phenomena treated in each node are debris-water interactions, fission-product transport, thedeposition and revaporization, the flammability and combustion, direct containment heating, sprays,fan coolers, simple fans, and fire suppression.
b. Hydrogen stratification
An important issue in containment thermalhydraulics is the distribution of hydrogen becausenonuniform distributions imply that a gas mixture will be flammable at some location in thecontainment much earlier than at other locations [49], and if the mixture is highly flammable there isa potential for flame acceleration [50]. MAAP-4 treats this issue using sub-node physics to considerthe formation of low-density layers within a room.
Consider a room (node) with flow paths in its ceiling (horizontal junction) and in a wall (verticaljunction) initially, and a lighter gas above the top of the right node is about to enter into the nodethrough the horizontal junction; this gas is driven by a pressure difference across the junction. As thelight gas moves downwards and replaces the original heavy gas, it starts to affect static headdistribution in the node and reduce the pressure difference across the horizontal junction. Eventually,the pressure difference vanishes, and the downward movement of the stratified layer stops. This

237
penetration distance (y) can easily be related to the initial pressure difference across the junction andthe density difference:
y = ∆P / g ( ρ H - ρ L )
When this penetration distance does not reach the nearest venting junction, the vertical junction canbe considered as being shut off. Such a test is applied for each vertically oriented junction todetermine whether to shut off the junction or leave it open before the flow calculation at every timestep.
c. HDR experiment comparison
The HDR Facility is a 50 m high and 20 m diameter cylindrical containment with a hemisphericaldome [37]. The containment is characterized by a relatively large dome space, which constitutes5000 m3 of 11 000 m3 total free space inside the containment and highly compartmentalized rooms.About 70 rooms are interconnected by numerous flow junctions.
Nevertheless, a dominant flow path can be identified by a pair of staircases and equipment shaftsrunning from low elevations up to the dome at diametrically opposite positions. The containment isencased in a 17-mm-thick steel shell, and there is a 0.6-m air gap between the steel shell and an outerconcrete wall; the steel shell provides the pressure boundary. In Test E11.2, a SBLOCA wassimulated by injecting superheated steam at 2.1 Kg/s for 12 h into Room 1805, which is located at anelevation of 20.45 m with respect to the ground level. After the preheat steam, a hydrogen–heliumgas mixture was released for 30 min into the same room. Then, the steam injection resumed at alower elevation for 3 h. The containment was allowed to cool naturally for 15 min before watersprays were applied outside of the containment steel shell. The external sprays were applied only tothe upper part of the steel shell, above 40 m. To simulate Test E11.2, the HDR Facility was modelledusing 29 nodes and 43 junctions. Rooms near the break location were modelled as separate nodes,and regions further away from the break location were lumped together. The dome region wasmodelled using two nodes. The elevation at which the external spray stops provided the naturalboundary between the two dome nodes. The MAAP-4 model results, simulating Test E11.2, are asfollows.
Figure A.1.5.4-1 shows the pressure prediction. MAAP-4 overpredicts the peak pressure by 0.3 bar (1bar = 100 kPa). This pressure comparison is fairly good considering the uncertainties in equipmentand gap heat losses and in the sources during the experiment. Figures A.1.5.4-2 and -3 show thecomparison of gas (hydrogen–helium mixture) concentration in the upper and lower domesrespectively. They show good agreement including a rapid turnover of a stratified layer at 64 000 sas the external spray cooling makes the upper dome gas progressively heavier. Insignificant gasconcentration observed in the lower level of the containment is also accurately predicted, as shown inFigure A.1.5.4-4.
d. Other phenomenological models
Two important phenomenological models in the containment are the core-concrete interaction modeand the flammability and combustion model because these influence containment loads.
An improved model for core-concrete interaction is included in MAAP-4 [51]. MAAP-4 allows theside wall erosion to differ from the downward penetration; this feature is primarily useful to study theeffect of preferential erosion on either basement or reactor support integrity. In addition,the most recent data [52-55] for solidification behaviour of core-
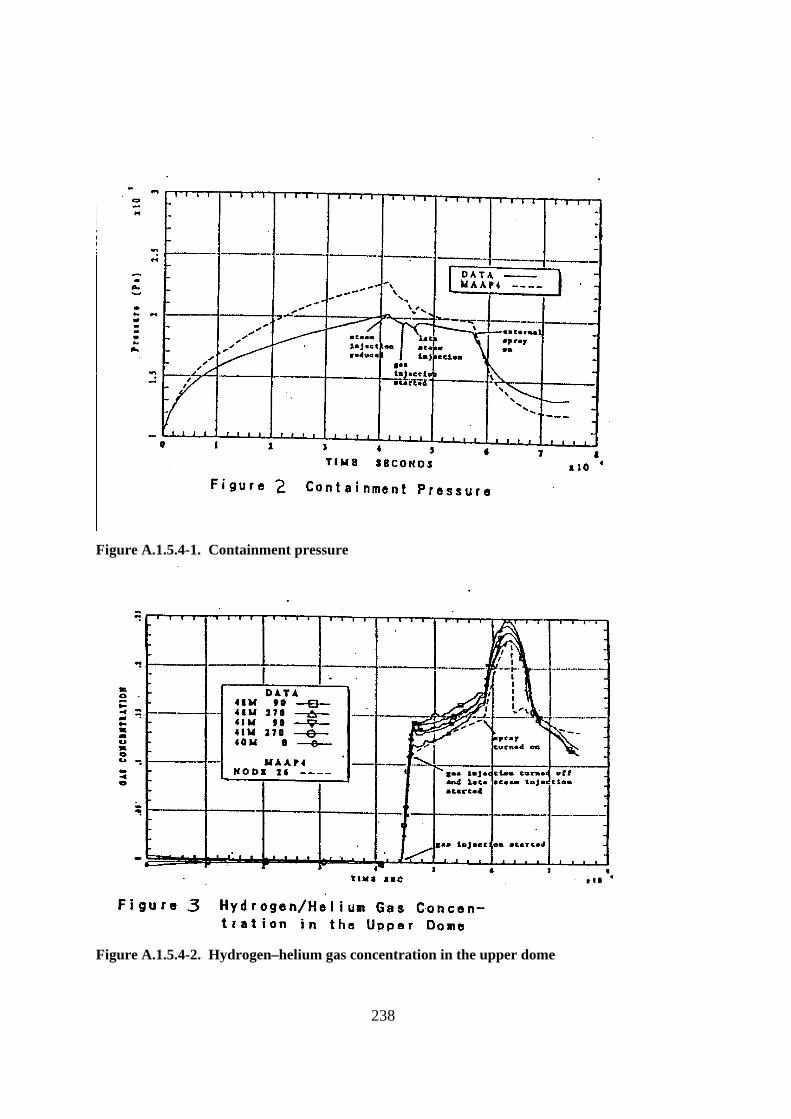
238
Figure A.1.5.4-1. Containment pressure
Figure A.1.5.4-2. Hydrogen–helium gas concentration in the upper dome

239
Figure A.1.5.4-3. Hydrogen–helium gas concentration in the lower dome
Figure A.1.5.4-4. Hydrogen–helium gas concentration in the lower elevation of thecontainment

240
concrete mixtures is applied to the improved estimates of debris temperature, and the basic effect ofthis model is the refinements in the prediction of fission-product release, which is quite sensitive totemperature. The model has been validated against all major core-concrete interaction experiments,with good results for both erosion and temperature.
Flammability and combustion models are the next logical step in analyzing hydrogen behaviour afterstratification [56] is considered. The MAAP-4 model [57-59] has the following features. First, itaccounts for generalized flammability of H2-CO-air-H2O-CO2-N2 mixtures, which can evolve in areactor accident; second, it considers the effects of increased temperature, which expands theflammability envelope for any mixtures and can eventually cause auto-ignition; third, it calculates thecombustion completeness based on the mixture properties and geometry, and its predictions compareextremely well with experimental data; and fourth, it contains provision for random ignition duringblackout sequences that are directly dependent on the flammability characteristics of the mixture [60-62].
e. Aerosol transport and deposition
Fission products are transported between control volumes, based on the donor concentration and thetotal flow rate, and they may be convected in either aerosol or gas forms. The decay power of fissionproducts is added at every time step in every node based on the local quantity of each species and itsdecay power fraction [63].
Fission-product deposition occurs from both the vapour and aerosol phase. Vapour/surfaceequilibrium depends on the relative vapour pressure in the gas and the surface vapour pressure;consequently either condensation or evaporation (revaporization) may occur. Fission-productvapours are always assumed to be in phase equilibrium with aerosols, so that aerosols will evaporatewhen the vapour pressure is less than saturation, and vapours will condense on aerosols when theirpressure exceeds saturation.
Aerosol deposition is found through correlations of the exact solution to the aerosol dynamicequation [64]. There are two exact solutions, one for a steady-state aerosol in equilibrium with itssource, and another for a decaying aerosol with a negligible source. Interpolation is used betweenthese correlations (rather than a switch) to ensure accuracy for intermediate situations [65]. Thecorrelations [66-71] account for coagulation, gravitational sedimentation, condensation(diffusiophoresis), inertial impaction, thermophoresis, and leakage (sources and sinks). For practicalsituations, a maximum of two such mechanisms plus agglomeration are important and the rest arenegligible. Excellent agreement is found between the correlations, exact calculations with sectionalaerosol codes, and experiments.
Hygroscopicity is considered for cesium hydroxide and cesium iodide [72]. A monodisperseformulation is used to determine the fallout rate of particles considered to be hygroscopic, and theminimum of this fallout rate and the dry polydisperse rate are chosen for actual use. A user-inputseed radius is used to determine the amount of water uptake, coupled with the change of vapourpressure implied by condensation on aerosols.
f. Ex-vessel release
Ex-vessel fission-product release is found by a chemical equilibrium method [48], coupled at everytime step with the thermalhydraulics so that the chemical reaction power is fed back to the debrisenergy equation. Activity coefficients are employed for materials that exhibit strong non-idealbehaviour such as the strontium, barium, and the alkali metals. These activity coefficients implicitly

241
account for formation of silicates, zirconates, and other compounds beyond the simple oxides.Releases of all elements, including radiological inert elements, are provided by the model [73].Mechanical aerosol formation mechanisms(bubble bursting) are neglected because of the lack of realmaterial data.
A.1.6 RALOC
The original objective of the development of the RALOC code [74,75] was to calculate theRAdiolysis and LOcal Gas Concentrations within the structures of a containment. Furtherdevelopments [76-78] have been pursued to use the code extensively. In the course of developments,and for intended coupling with other codes, both the tasks and the structure of the code have beenchanged fundamentally since 1991. Simultaneously, the models were verified. In this context,because of coupling with other codes, the structure of the code has fundamentally changed since1991. Simultaneously, the models were continuously verified and supplemented, according totechnical status, and new models have been added to the code.
The computer code RALOC is able to evaluate the following phenomena:
- pressure and temperature build-up and history,
- local temperature and pressure distributions,
- energy distribution and local heat transfer to and heat conduction in structures,
- local gas distributions (steam and different noncondensable gases),- hydrogen combustion and catalytic recombination,
- water distribution,
- mass and volume flow for the release of fluids via openings and leakage, and
- heat and combustion gas distribution during fires.
Calculations can be performed for simple and multicompartmented containments and closedbuildings of NPPs, as well as for compartmentalized systems (buildings, tunnels, pit system), withmore or less large openings to the environment. Mainly, the consequences of DBAs and severeaccidents were analysed with the code in containments of LWRs—i.e., for PWRs and BWRs—butalso in containments of VVER (voda vodynoy energiticheskie reactor) power plants. Some fireevents have been investigated too.
For the description of the physical processes during an accident, arbitrary compartment systems andgeometries can be simulated by specified volumes (the lumped-parameter concept). The conditionalchanges related to location and time are reduced to a purely time-dependent behaviour within thecontrol volumes (nodes). These volumes are connected by junctions. For the simulation of heattransfer and heat conduction via walls and internal components, specified structures can be coupledto the nodes. The heat conduction is described in one dimension, for the simulation of heat transferprocesses (heat and mass transfer); different models and correlations are available.
242
For the determination of the conditions in the nodes the following assumptions have been made:
• Water is considered as vapour or liquid (water) or both according to the conditions in the node.Superheated as well as saturated conditions are possible. Superheated atmospheres cannotcontain water. In these cases, the water is drained immediately into the sump or to other nodes.
• The gaseous components are assumed to be homogeneously mixed. Having the same
temperature, they are in thermal equilibrium. • In the equilibrium model for saturated conditions, the water is considered to be airborne,
homogeneously mixed, and at the same atmospheric temperature. For the drainage of water toother nodes, the water is assumed to be deposited on the floor.
• In the non-equilibrium model, the deposited and airborne water is separately balanced. The
temperature of the deposited water is calculated by an additional energy balance. In this zonemodel, the deposited water can be drained only. Airborne water is transported by the watercarryover effect.
• The number of noncondensable gases is principally arbitrary. Seven different gases (air, O2, N2
,
H2, CO, C0
2, He) are defined, including their material properties. These gases and steam are
treated as real gases with a set of correlations for their properties, valid up to temperatures of3000 K. Additional gases can be specified by the code user.
The mass transfer between nodes is described separately for gas and liquid flow by differentmomentum equations (unsteady, incompressible) taking into account geodetic height differences ofthe node centres. The mass flow rates of the different components are calculated without slip,according to the composition of the source node. Moreover, mass transfer by diffusion is considered.The diffusion flow rate is calculated separately in a quasi-steady way for all gas components.
For the simulation of heat and mass transfer between the zone atmosphere and the structures heattransfer is described by the different physical phenomena of free and forced convection, radiation(wall to gas, gas to wall, wall-gas-wall, wall to wall) and condensation depending on the thermalstatus of the zone and structures.
Heat conduction is described one dimensionally by a Fourier heat equation. Walls and other internalsconsisting of different materials can be represented in cylinder-type geometries. Such a wall, beingdenoted as a structure, can consist of several materials, arranged one after another. The differentmaterials can be separated by air-filled gaps. Each material can be subdivided into an arbitrarynumber of layers of a different thickness for the calculation of the heat conduction. The arbitrarymaterials are defined by the values for heat conductivity, specific heat, and density.
The combustion of gases (preferably hydrogen) runs in general very fast with large local pressure andtemperature gradients. Because of this nature of the combustion, older models for combustion withsimply averaged energy release rates over large volumes were not very successful in describing suchprocesses in a realistic way. The now-available combustion model DECOR in RALOC uses a newmodel approach. A one-dimensional flame front is assumed with flexible separation of the unburnedand burnt parts of the volume. To simulate the flame acceleration, general correlations for therelative movement of the two parts are used, which are based on experimental data. To thesecorrelations, functions for the growth of the flame front are added, which are deduced fromrepresentative experiments.

243
For a realistic description of accident sequences, the simulation of engineered systems—such aspumps, heat exchangers, ventilation systems, weir, doors and flaps of different kinds with inertiaeffect, spray systems, catalytic and thermal recombiners and pressure suppression systems, whichcontain 1D hydrodynamic pool models—is possible.
A.1.6.1 Validation
For the validation of the different models, a large number of experiments were analysed, as pre- andpostcalculations. The code was successfully used for four ISPs and for some other benchmarkexercises. Table A.1.6.1-1 lists the different validation calculations.
A.1.7 FIPLOC 3.0
The containment code FIPLOC 3.0 (Fission-Product Localization) was developed by the Gesellschaftfur Anlagen- und Reaktorsicherheit (GRS) mbH, Germany, with the support of the German Ministryfor Education, Science, Research and Technology.
FIPLOC is a computer code for the integrated analysis of thermalhydraulics, aerosol behaviour, andiodine behaviour in multicompartment containment geometries. The main purpose of FIPLOC-MI isto calculate the distribution and retention of airborne fission products in a LWR containment during asevere accident and to predict the radioactive source term to the environment [79]. But FIPLOC isalso suited to calculating the distribution and depletion of aerosols in other nuclear as well asnon-nuclear facilities.
FIPLOC is a multicompartment model using the lumped-parameter technique. The thermalhydraulicmodel is based on the RALOC code. In this model, a containment is divided into a number of controlvolumes (about 10 to 50), which are connected by junctions for the gas, condensate and aerosolflows. Larger rooms can be fictitiously subdivided into smaller control volumes. In each controlvolume, the following parameters are calculated:
• state of the atmosphere (pressure, temperature, relative humidity, etc.);
• partial pressure of steam, air and other non-condensable gases (e.g., hydrogen);
• steam condensation rate on aerosols;
• decay heat of gaseous and particulate fission products;
• concentration and particle-size distribution of eight aerosol components;
• deposited aerosol masses for floor, walls, and ceiling; and
• behaviour of 14 iodine species in the gas and in the water, respectively.
Atmospheric flow and stratification phenomena are simulated in multicompartment geometries underconsideration of local pressure and density differences in the atmosphere. Aerosols are transportedwith the gas flows. The additional transport by gravitation from upper into lower compartments isconsidered.
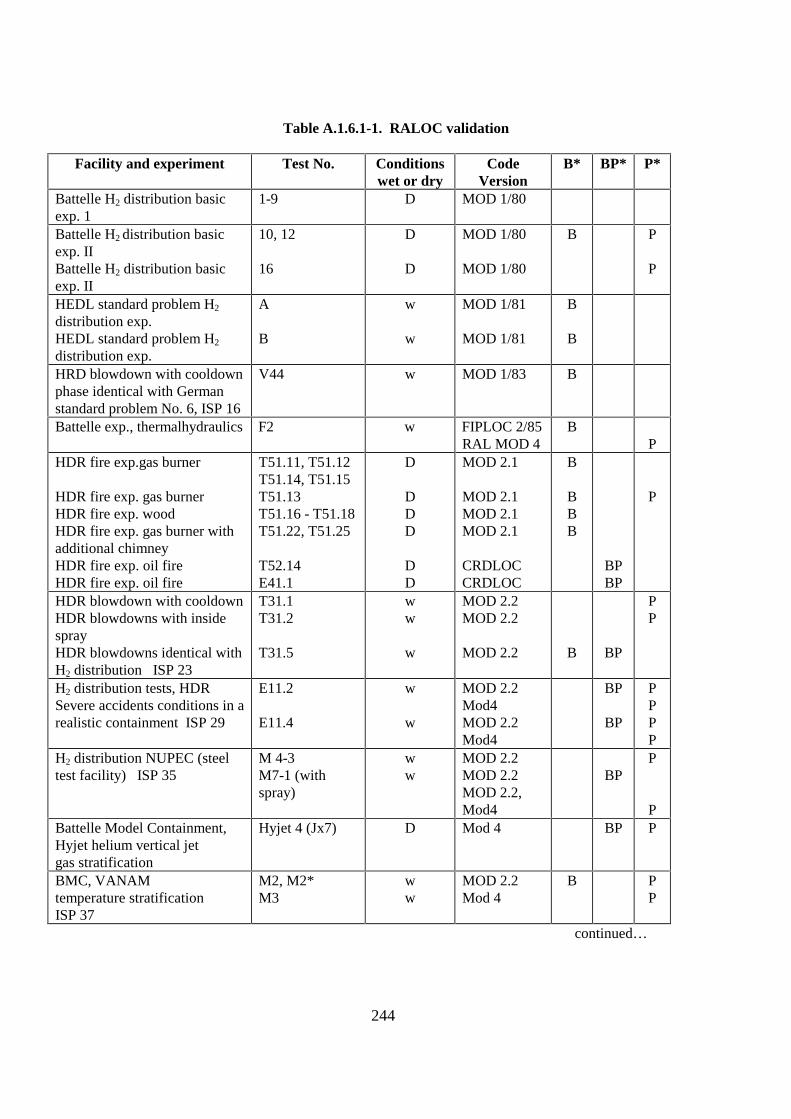
244
Table A.1.6.1-1. RALOC validation
Facility and experiment Test No. Conditionswet or dry
CodeVersion
B* BP* P*
Battelle H2 distribution basicexp. 1
1-9 D MOD 1/80
Battelle H2 distribution basicexp. IIBattelle H2 distribution basicexp. II
10, 12
16
D
D
MOD 1/80
MOD 1/80
B P
P
HEDL standard problem H2
distribution exp.HEDL standard problem H2
distribution exp.
A
B
w
w
MOD 1/81
MOD 1/81
B
B
HRD blowdown with cooldownphase identical with Germanstandard problem No. 6, ISP 16
V44 w MOD 1/83 B
Battelle exp., thermalhydraulics F2 w FIPLOC 2/85RAL MOD 4
BP
HDR fire exp.gas burner
HDR fire exp. gas burnerHDR fire exp. woodHDR fire exp. gas burner withadditional chimneyHDR fire exp. oil fireHDR fire exp. oil fire
T51.11, T51.12T51.14, T51.15T51.13T51.16 - T51.18T51.22, T51.25
T52.14E41.1
D
DDD
DD
MOD 2.1
MOD 2.1MOD 2.1MOD 2.1
CRDLOCCRDLOC
B
BBB
BPBP
P
HDR blowdown with cooldownHDR blowdowns with insidesprayHDR blowdowns identical withH2 distribution ISP 23
T31.1T31.2
T31.5
ww
w
MOD 2.2MOD 2.2
MOD 2.2 B BP
PP
H2 distribution tests, HDRSevere accidents conditions in arealistic containment ISP 29
E11.2
E11.4
w
w
MOD 2.2Mod4MOD 2.2Mod4
BP
BP
PPPP
H2 distribution NUPEC (steeltest facility) ISP 35
M 4-3M7-1 (withspray)
ww
MOD 2.2MOD 2.2MOD 2.2,Mod4
BPP
PBattelle Model Containment,Hyjet helium vertical jetgas stratification
Hyjet 4 (Jx7) D Mod 4 BP P
BMC, VANAMtemperature stratificationISP 37
M2, M2*M3
ww
MOD 2.2Mod 4
B PP
continued…
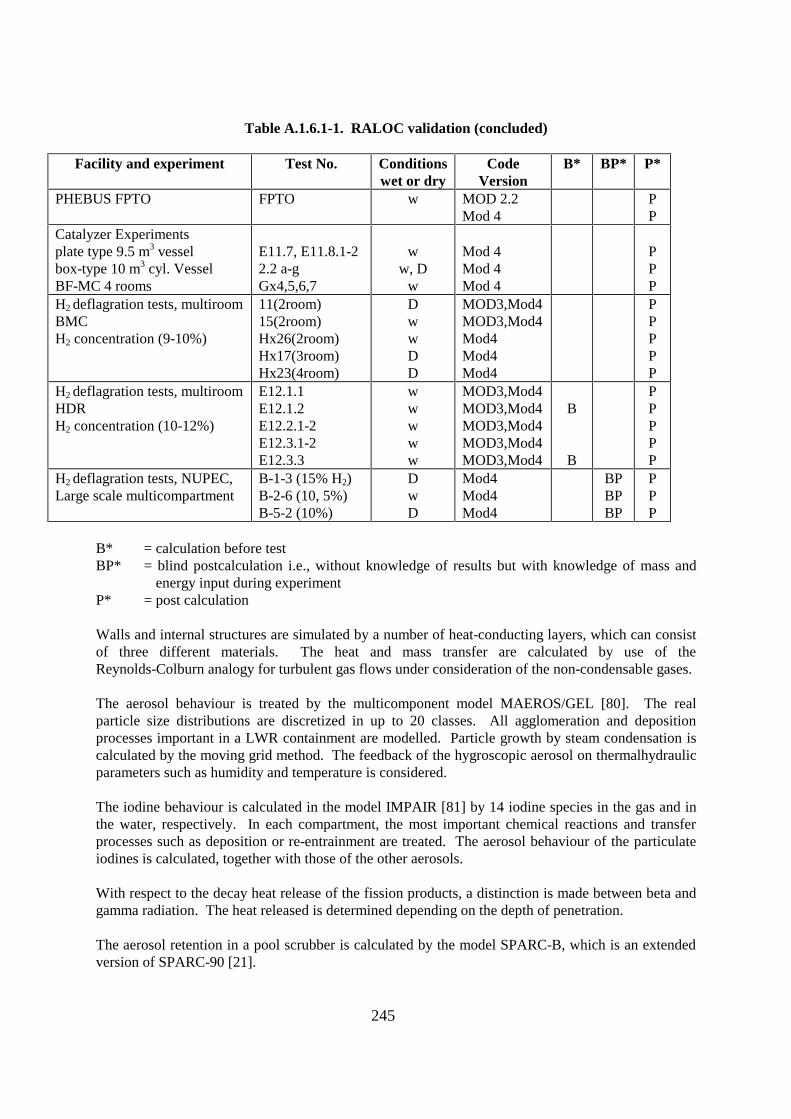
245
Table A.1.6.1-1. RALOC validation (concluded)
Facility and experiment Test No. Conditionswet or dry
CodeVersion
B* BP* P*
PHEBUS FPTO FPTO w MOD 2.2Mod 4
PP
Catalyzer Experimentsplate type 9.5 m3 vesselbox-type 10 m3 cyl. VesselBF-MC 4 rooms
E11.7, E11.8.1-22.2 a-gGx4,5,6,7
ww, D
w
Mod 4Mod 4Mod 4
PPP
H2 deflagration tests, multiroomBMCH2 concentration (9-10%)
11(2room)15(2room)Hx26(2room)Hx17(3room)Hx23(4room)
DwwDD
MOD3,Mod4MOD3,Mod4Mod4Mod4Mod4
PPPPP
H2 deflagration tests, multiroomHDRH2 concentration (10-12%)
E12.1.1E12.1.2E12.2.1-2E12.3.1-2E12.3.3
wwwww
MOD3,Mod4MOD3,Mod4MOD3,Mod4MOD3,Mod4MOD3,Mod4
B
B
PPPPP
H2 deflagration tests, NUPEC,Large scale multicompartment
B-1-3 (15% H2)B-2-6 (10, 5%)B-5-2 (10%)
DwD
Mod4Mod4Mod4
BPBPBP
PPP
B* = calculation before testBP* = blind postcalculation i.e., without knowledge of results but with knowledge of mass and
energy input during experimentP* = post calculation
Walls and internal structures are simulated by a number of heat-conducting layers, which can consistof three different materials. The heat and mass transfer are calculated by use of theReynolds-Colburn analogy for turbulent gas flows under consideration of the non-condensable gases.
The aerosol behaviour is treated by the multicomponent model MAEROS/GEL [80]. The realparticle size distributions are discretized in up to 20 classes. All agglomeration and depositionprocesses important in a LWR containment are modelled. Particle growth by steam condensation iscalculated by the moving grid method. The feedback of the hygroscopic aerosol on thermalhydraulicparameters such as humidity and temperature is considered.
The iodine behaviour is calculated in the model IMPAIR [81] by 14 iodine species in the gas and inthe water, respectively. In each compartment, the most important chemical reactions and transferprocesses such as deposition or re-entrainment are treated. The aerosol behaviour of the particulateiodines is calculated, together with those of the other aerosols.
With respect to the decay heat release of the fission products, a distinction is made between beta andgamma radiation. The heat released is determined depending on the depth of penetration.
The aerosol retention in a pool scrubber is calculated by the model SPARC-B, which is an extendedversion of SPARC-90 [21].

246
FIPLOC has been verified by a large number of SETs and integral experiments of the projects CSE,DEMONA, LACE, FIPLOC-Verification Experiments, VANAM, PHEBUS, KAEVER and AHMED.Table A.1.7-1 shows the complete verification matrix.
Using FIPLOC, different users successfully participated in several international benchmarks such asthe CEC thermalhydraulic benchmark exercise in FIPLOC verification experiment F2 [82] or theISP 37 [83].
A.1.8 WAVCO
A.1.8.1 Program characteristics
The lumped-parameter multicompartment code WAVCO (Wasserstoffverteilung im Containment,i.e., hydrogen distribution in the containment) was developed by Siemens/KWU for best-estimateintegrated analysis of the thermalhydraulics and the distribution of steam (including airborne waterdroplets), hydrogen, and other non-condensable gases in subdivided buildings (like the containmentof nuclear power plants). It can be applied for containment analyses and for monitoring of DBAs aswell as severe accidents in LWRs.
WAVCO has many useful models to simulate physical phenomena during the course of accidents forhigh transient short-term as well as extremely slow long-term processes.
A.1.8.2 Main features
As is usual for lumped-parameter codes, the entire control volume is subdivided in zones(compartments), which are connected with each other by junctions. Each zone has an atmosphereand a sump that are linked to each other by a flow path and a drainage respectively. The condition inthe atmosphere and sump are homogeneous, and mass and energy transport can occur at the sump andstructure surfaces taking into account the thermodynamics of heat and mass transfer laws, andconservation equations of mass and energy. The mass transport via connections is controlled by thepressure differences among the neighbouring zones.
WAVCO sufficiently predicts the following phenomena:
• pressure and temperature developing during the course of an accident • distribution of the gases in containment compartments • stratification of the light gases in containment • release and removal (recombination and burning) of burnable gases (H2 and CO) • sump boiling • sump pumping • heat and mass transfer to the structure • natural and force convection flows

247
Table A.1.7-1. FIPLOC validation matrix
Experiment Geometry Calculation FIPLOCVersion
Zones Aerosol Model Remarks Literature
CSE A-5CSE A-11DEMONA A1DEMONA B2
DEMONA B3DEMONA B4DEMONA B5DEMONA A7
DEMONA A9
LACE LA1LACE LA2LACE LA4
FIPLOC-Verifications-experiment F2F1F2
DEMONA B2VANAM M1VANAM M2
VANAM M2*
VANAM M3
VANAM M4
AHMED NaOH testsPHEBUS FPTOKAEVER
MM(M)QE
QEQEQEQE
M
EEE
M
MM
EMM
M
M
M
E
E
E
NNNVNNNVN
V
NVbNbN,N
bN
NNN
NVVN
N
N
N
N
bN
bN
N
1/83
2/85
M-1.3
M-1.4
M-1.3M-1.3M-1.5
M-1.5
M-1.5
MI-2.0
M-1.5
MI-2.0
MI-2.0
MI-2.0
2525223333399338
8
18181819
20
151618
11151514,17
14
14
18,30
14
3
9
4,12
MONAMMONAM-MONAMNAUA-MNAUA-MMONAM-MONAM,NAUA-MMONAM,NAUA-MMONAMMONAMMONAMMONAM,NAUA-M-
---
MAEROSMAEROSMAEROSMAEROS/MGAMAEROS/MGAMAEROS/MGAMAEROS/MGA
MAEROS/MGAMAEROS/MGAMAEROS/MGAMAEROS/MGA
no aerosol injection
LACE-BenchmarkandCEC Benchmark
no aerosol injection
no aerosol injectionno aerosol injectionno aerosol injectionCEC Benchmark
InternationalStandard ProblemISP 37
CSNI Benchmark
[84][84][85][85,86][85,86][85,86][85]86][85,86][85,86]
[85,86]
[85,86][85]
[87-89,85]
[90]
[91][91][92-94][82][95][96][96][97]
[97]
[97]
[98,99]
[83][97]
[100]
[101]
[102]
V pretest calculation E single volume geometrybN blind post-test calculation QE quasi single geometryN post test calculation M multicompartment geometry

248
• gas diffusion between neighbouring zones • drainage flow of the condensate to the sump • effects of spraying • release of decay heat in the atmosphere and sump • heating and cooling of the atmosphere and sump • radiation of the atmosphere to the structure • radiation of the structures to each other • leakage flow to environment • modelling of free jets
In contrast to other lumped-parameter codes, the density at the individual connections depends on thealtitude. Because of this feature, the determination of gas stratification in the containment is moreadequately predicted by WAVCO than by other codes.
A.1.8.3 Mathematical method
WAVCO uses the lumped-parameter technique based on the conservation of mass and energy (locallyand globally) and takes into account the interlinking of the balance zones, including the heat andmass transfer to the structure by iterative implicit time forward integration technique.
A.1.8.4 Documentation, validation, and experiences
WAVCO is documented in two code manuals, which describe the physical models and thepreparation of the input data respectively.
The code has been extensively validated in several experiments. For example:
• Battelle hydrogen distribution experiments, H15 and H16, all performed in the BMC, Frankfurt; • Blowdown experiment D6; • Hydrogen removal with catalytic recombiners J1.2; • Modelling of helium-free jet JX7; • Effect of spraying PACOS, Px1.2); • Blowdown experiment V42 in PHDR Facility, Karlsruhe; • Hydrogen-helium distribution experiments T31.5, E11.2, and E11.4;

249
• HEDL Helium distribution experiment HM6, performed in the Containment System Test Facility(CSTF), Hanford;
• ISP-35-092 hydrogen mixing and distribution test M-7-1, performed by Nuclear Power
Engineering Corporation (NUPEC), Japan; and • Thermalhydraulic benchmark exercise on FIPLOC verification experiment F2 Battelle,
performed by CEC.
Recently, Siemens/KWU performed, in co-operation with Forschungszentrum Karlsruhe (FZK), acode benchmarking on coupled thermalhydraulics and aerosol behaviour in an innovative PWRcontainment under medium-break LOCA conditions with the codes WAVCO/NAUA, MELCOR,CONTAIN and FIPLOC.
A.2 Field Codes
A.2.1 GASFLOW
GASFLOW [103] is a 3D finite-volume computer code that solves the time-dependent, compressibleNavier-Stokes equations for multiple gas species. GASFLOW was originally developed at the LosAlamos National Laboratory (LANL), with funding from the USNRC and the USDOE, taking the oldHMS code [104-106] as a starting point. In 1994 Forschungszentrum Karlsruhe (FZK) obtained theversion 1.0 of GASFLOW from LANL in exchange for experimental data from German government-funded programs in the Heißdampfreaktor (HDR) and Battelle Model Containment (BMC) testfacilities. Since then, FZK and LANL have continued to jointly develop and apply GASFLOW in theframework of a co-operative agreement. The FZK work in this agreement focuses on thedevelopment and application of GASFLOW for analysis of steam–hydrogen transport andcombustion processes in nuclear reactor containments with inclusion of mitigating measures.
GASFLOW applies 3D Cartesian or cylindrical coordinates and uses a staggered mesh where thescalar quantities are evaluated at the midpoints of the fluid cells and the vector quantities at themidpoints of the node surfaces. A linearized Lagrange-Eulerian integration scheme is applied, withan explicit Lagrangian phase A during which planar surfaces of the fluid cells expand according tothe surface velocities at the midpoints of the node surfaces. An implicit Lagrangian phase B iteratesthe pressure and the other state variables to become consistent with the expanded state of the volume.At the end of this phase B, a consistent set of variables is determined for the partial time step. Thisanalysis involves the solution of a Poisson equation for the pressure. In the subsequent rezoningphase C, the expanded mesh is re-mapped to the original Eulerian mesh, which mathematically isequivalent to solving for the convective terms in the Navier-Stokes equations. Turbulent transportprocesses are evaluated after the rezoning phase. An algebraic or a k-epsilon turbulence model canbe applied. The turbulent transport parameters are used in the next time step to simulate thecombined diffusion effect from turbulence and the molecular diffusion from concentration gradientsduring the explicit Lagrangian phase A. The solution has no restrictions on compressibility. Thefluid-dynamics algorithm is coupled to the chemical kinetics of combusting liquids or gases tosimulate diffusion or propagating flames in complex geometries of nuclear reactor containments.Because GASFLOW calculates the pressure implicitly, it is possible to follow transport andcombustion phases with very different time scales with a dynamic time-step adjustment.
The flow processes are solved in a 3D grid, which includes obstacles (no flow volumes) and walls(surfaces that divide two adjacent layers of fluid flow and forbid flow across it). Obstacles and walls
250
are used to build the representative geometry model within which the flow is simulated. Heat transfercan be simulated to obstacles and walls applying 1D heat conduction. In addition volumetric heatsinks can be defined to account for details of internal structures, which cannot be resolved by thefluid mesh. GASFLOW 1.0 had a restricted two-phase modelling, which accounted only for filmcondensation on colder structures.
A.2.1.1 Recent code development features
Version 1.1 of GASFLOW was jointly developed by LANL and FZK in 1994. It had a much-improved modelling of 2-phase processes with film vaporization and condensation and bulkvaporization/condensation, using a homogeneous equilibrium 2-phase model and a parametric modelfor rainout of the condensed droplets. One-dimensional heat conduction into structures of varioustypes and materials has been refined and allows very fine surface nodes with precise evaluations ofthe surface temperatures that drive the condensation/evaporation processes. Version 1.1 includes anew fractional mesh area option that allows to exactly match the sizes of overflow openings betweendifferent compartments. Further developments at FZK extended the code’s capability to includemitigation effects from recombiners, igniters, and from inertization by injection of CO2 and tosimulate steam vaporization from sumps. Up to 300 catalytic recombiners and 300 igniters can bepositioned in the containment. GASFLOW 1.1 includes a library of material properties for more than20 gas components with temperature dependencies fitted to data from the Chemkin Code and theJANAF tables. Velocity and pressure boundary conditions can be defined both internally and on theboundary of the system to simulate active ventilation systems and various sources and sinks duringthe convection process. Two intermediate versions (1.2 and 1.3) and then a final version (1.4) ofGASFLOW were defined during this GASFLOW development and validation at FZK. Meanwhile,LANL developed in parallel a multiblock version GASFLOW 2.0. GASFLOW 2.0 can modeldifferent 3D blocks, which have their own grids and which are coupled by 1D ducts. Ventilationsystems between these blocks can be simulated. GASFLOW 2.0 also includes an aerosol model thatcomprises a Lagrangian discrete particle transport model, a particle deposition and entrainmentmodel, and a particle cloud model. In 1996 it was decided to merge the latest FZK version ofGASFLOW (version 1.4) with the latest LANL version GASFLOW 2.0 into a new code versionGASFLOW 2.1. This work was jointly performed with LANL and FZK staff and was supported byUSNRC. Together with the merging of the two code versions, the programming language wasswitched to FORTRAN 90. The version GASFLOW 2.1 [107,108] has been generated in themeantime and is now in the final phase of documentation.
GASFLOW has been coupled to a CAD tool that allows the interactive 3D visualization of thecalculated scalar and vector variables in complex geometries. A general procedure for maintainingand updating GASFLOW in a multi-user environment has been developed. All updates are made to ageneric code version. Automatic procedures (Makefiles) then generate platform-dependent codesfrom this generic version. Current platforms on which GASFLOW runs are the IBM Risc6000/590,the SGI machine with the new R8000 processor, the Cray J90, and the mainframe machine FujitsuVPP-400. Problems of running the code on different platforms were largely removed after switchingto FORTRAN 90.
A.2.1.2 Code applicability
The GASFLOW code is applicable to study steam–hydrogen distribution and combustion in complexcontainment geometries for given steam–hydrogen sources from core-melt accidents. The code wasvalidated and continued to be validated in the principal application fields H2/steam transport withoutand with mitigation from inertization, catalytic hydrogen recombination, and combustion triggered at

251
igniters. The code has been applied also for demonstration and scoping analysis of integralsequences in complex containment geometries.
Code validation for phenomena of hydrogen–steam transport focused on three experiments. Thecontainment thermalhydraulics from the PHEBUS test FPT0 and a number of pretests in thiscontainment vessel were simulated with GASFLOW, and the condensation model was validated forwell-defined condensation conditions described in Reference 109 and Section 4.2.2.5 of this report.Integral validation analysis was performed for the two large-scale steam–hydrogen distribution testsT31.5 and E11.2 conducted in the Heißdampfreaktor (HDR); these tests were also partly analysed inthe two international standard problems, ISP 23 and ISP 29 [110]; for a summary of results see alsoSection 5.3.7 of this report. Using the validated code version, a demonstration and scoping analysisof steam–hydrogen transport, has been performed for different containment designs of the Europeanpressurized reactor (EPR) [111] and for a German PWR power plant of the Biblis A type [112]. Thespherical containment of the Biblis A type with 65 000 m3 free gas volume was modelled with118 000 computational cells. Nearly an order of magnitude more cells were applied for this modelthan what had been used for previous containment designs.
There are no known experimental data to validate the inertization model in GASFLOW, but we couldsuccessfully demonstrate the dilution effect of a hypothetical CO2 release under true conditions fromtest HDR T31.5—this means under real containment accident conditions. Carbon dioxideinertization involves sedimentation of a heavy gas and stratification of a light gas.
We have successfully validated the recombiner models in GASFLOW with data from the HDRE11.8.1, from the Battelle MC3 and the GX test series tests [110,113]. The HDR test E11.8.1investigated the effect of a recombiner foil that was positioned eccentrically within a spherical steelvessel. The pressure, the steam and hydrogen concentrations and the temperatures were measured atvarious locations inside this vessel during the hydrogen recombination. GASFLOW successfullysimulated this experiment in a 3D Cartesian mesh using a correlation for the recombination that wassuggested by GRS. Hydrogen transport with recombination has also been investigated for an NIS-type granulate recombiner and for a Siemens plate recombiner module that was positioned in theBMC. The results are summarized in Section 5.3 of this report. The hydrogen transport andrecombination could be well predicted for all these tests. The calculations serve as basis for thevalidation of the respective recombiner modules under realistic operating conditions. After thesuccessful validation of the recombiner model a scoping analysis was made with four of theserecombiner modules that were placed in the inner containment rooms of a Biblis-A-type containment.The calculation documented well the performance of these recombiners to prevent any hydrogenstratification in these rooms under DBA conditions [114].
The GASFLOW combustion modelling has been successfully applied for the analysis of hydrogencombustion tests from HDR E12, from the BMC HX series and from the PISA view facility [107].Also the analysis of the dual-concept test GX7 with a Siemens recombiner and spark igniters in theBMC was performed successfully. It demonstrated that the ignition of flammable mixtures near thelower combustion limit requires longer than the physical sparking times of the igniters when thecombustion is simulated in a coarse mesh out of an ongoing transport process (see also Section 5.3.8of this report for more details (main text). The igniters (glow/spark plugs) were also applied forstudying distribution and combustion from a dry hydrogen release in the EPR containment. Theresults demonstrated that the igniters could successfully prevent accumulation of otherwise detonablemixtures [114]. An experimentally derived criterion was applied to position the igniters in a way toprevent detonable conditions when the flame flashes back from the igniter to the source.A.2.2 INSPAT/CV code

252
A.2.2.1 Introduction
INSPAT/CV(Institute of Nuclear Safety, Liquid Sheet, Particle and Gas Turbulence in ContainmentVessel) is a computer code for analyses of transient thermalhydraulic phenomena in containmentvessels under severe accident conditions. It has been developed under the contract between MITI(Ministry of International Trade and Industry) and NUPEC.
Regarding containment thermalhydraulics, the INSPAT/CV code was developed to support theMELCOR code, which is employed as a severe accident assessment code, for PSA and analysis ofaccident management strategies. As is generally understood, precise prediction of hydrogenconcentration in a containment vessel dome in severe accidents by a lumped-model code such asMELCOR is quite limited because physical models are overtly simplified and node numbers in acontainment are limited in modelling whole phenomena during a hypothetical severe accident.Therefore, the uncertainty of a hydrogen concentration distribution is not eliminated, until thevalidity of MELCOR analysis is fully validated experimentally or is calculated with a precise 3Dfield code that has already been verified.
A.2.2.2 Recent code development features
The main part of the code deals with 3D multicomponent gas turbulent flow in the upper dome,considering effects of spray droplets and chemical reactions [115]. It also has subprograms of acompartment node-junction model, 3D detonation, model and 3D deflagration model.
The finite-difference method SMAC (simplified marker and cell) and the BFC (boundary-fittedcoordinate) was applied to predictions of transient turbulent gas behaviour in an upper dome. Thesemi-implicit turbulent flow solver based on the k - ε model was introduced from a general-purposeCFD (computational fluid dynamics) code, α-FLOW [116]. Transport and diffusion of up to 10species in mixture gas in the upper dome can be treated including hydrogen, nitrogen, oxygen, carbondioxide, carbon monoxide and steam. Changes in species concentrations because of chemicalreaction and phase change are taken into account as sink/source of the species. Motions of spraydroplets are calculated in the Lagrangean coordinates. Drag forces of droplets are assumed to beidentical to those between solid particles and gas flow. The summation of the drag force from manyparticles in a certain calculation cell is included in the gas momentum equation of the cell. Liquidfilm flows on the upper dome wall depend on droplet deposition rate and turbulent film flow ratecaused by gravity. Coalescence and break-up of the droplets are neglected because of the smallprobability of them occurring. Steam condensation and heat transfer between ambient gas and spraydroplets are considered in the gas energy conservation equation, and 1D transient heat conduction iscalculated through the wall of the upper dome.
Compartments under the upper dome are treated using a semi-implicit node-junction model. An icecondenser model and an air return fan model are included in the compartment model. Gas flow ratesbetween compartments are calculated from quasi-steady momentum balance equations throughjunctions. The dome pressure near the junction is a boundary condition of the compartmentcalculation, and the calculated flow rate of the junction is a boundary condition of the upper domecalculation.
Details of 3D combustion phenomena are analyzed with the following detonation and deflagrationmodels, using the flammable gas and oxygen distributions in the upper dome predicted by the 3Dturbulent multicomponent gas flow analysis.

253
Spray cooling is considered as one of accident management strategies for PWR plants in Japan.When spray is actuated, the increase of relative concentration of hydrogen and the additionalgeneration of hydrogen are concerned because of steam condensation and fuel clad and waterreaction respectively. If a high hydrogen concentration appears locally, deflagration or detonationmight occur.
A detonation subprogram COMA [117] (compressible fluid analysis) was newly developed, using anexplicit model in the 3D Cartesian coordinates.
The finite-volume method is based on the Godunov scheme, which enables calculation of adetonation wave when propagation velocity is over 5 times as fast as an isentropic sonic speed.Numerical diffusion at the wave front is very small, because overshoot and undershoot were avoidedin transport calculation of detonation peak pressures. The predicted propagation velocity of thedetonation wave agrees well with the Chapman-Jouguet detonation theory.
The deflagration model is based on the combustion calculation module of the α-FLOW code, whichtreats 3D compressible multicomponent gas behaviour with chemical reaction using the Cartesiancoordinates. About 20 elementary chemical reaction models of hydrogen combustion areincorporated into the module.
A.2.2.3 Code capability
The INSPAT/CV code is composed of the 3D upper-dome model, the node-junction compartmentmodel, the 3D detonation model and the 3D deflagration model. This composite calculation systemenables 3D multicomponent gas transport including spray effects and various types of flammable gascombustion in complex containment geometries, although the boundary conditions such as steam,flammable gas supply, and heat sources from core debris must be supplied from MELCOR analysis.
The upper-dome model and node-junction component models were verified [118] through thecomparison by calculated results and the NUPEC test data offered to the international standardproblem ISP 35 [119]. Behaviour of helium gas, which is a simulant to hydrogen gas, was observedin the 1/4 scale containment vessel under spraying conditions. Distributions of helium concentration,temperature and dome pressure were observed. After verification of the code, preliminarycalculations were performed for a typical ice-condenser-type PWR.
The 3D detonation subprogram COMA was verified [120] by the comparison with the NUPEC/BNLdetonation test results [121]. Propagation velocities and peak pressures as functions of hydrogen,oxygen, steam concentrations and initial gas temperature were measured systematically using thesmall-scale test facility SSDA (small-scale development apparatus) and the large-scale test facilityHTCF (High-Temperature Combustion Facility). The test dealt with detonation wave in a circularpipe, which furnished orifices inside it. COMA reproduced the 3D detonation propagation throughthe orifices, which promote detonation propagation. Another test section had branch pipes. If theends of the branch pipes were closed, the detonation wave was affected by the branch. If the ends ofthe branch pipe were open, the propagation ceased there in case of smaller hydrogen concentration.The time constant of COMA combustion model was adjusted to meet the propagation phenomenathrough the branch pipe section.
The deflagration subprogram was verified [118] using the Battelle deflagration tests [122] bycomparison of calculated and experimental results of the temperature and pressure histories in thecompartments of the small-scale containment vessel.

254
A.2.3 CFX-F3D
The modular CFX-F3D software system developed at AEA Technology, Harwell, simulates fluidflow, heat, and mass transfer, including models for multiphase, particle transport, and thermalradiation [123]. Essential numerical features of the integration techniques (of the conservationequations for mass, momentum, and energy in the form of convection - diffusion = source - sink) aresummarized in Table A.2.3-1.
Table A.2.3-1: Numerical features of the CFX-4 code
• Finite-volume method with multiblock grid and adaptive time steps
• Body-fitted coordinates using the Rhie-Chow algorithm
• Several robust equation solvers including an algebraic multigrid method and a variety ofdifferencing schemes, e.g., CONDIF, QUICK, MUSCL schemes
• Implicit time-stepping technique (e.g., Crank Nicolson schemes and quadratic time-differencing method)
• Pressure-velocity coupling using the SIMPLE algorithm
• Weakly and fully compressible flow options (low and high Mach numbers)
• Various turbulence and combustion models (e.g., k-epsilon and eddy break-up (EBU)concept)
• Radiation Interface for grey and non-grey systems
• Unmatched and sliding grids
• Numerous flow conditions at flow boundaries
CFX-F3D provides a wide range of physical models; in the area of combustion, two models areavailable: A “mixed-is-burnt” model with different probability density functions to account forturbulent fluctuations and a viscous mixing model with reaction kinetics to model ignition/extinctionthat was used in test cases as outlined below. The eddy dissipation concept (EDC) can be appliedwith relevance to turbulent flows in which the reaction rate is basically determined by the turbulentmixing rate. The EDC is a generalization of the EBU for chemical reactions in the fine structure ofthe turbulence as a result of molecular mixing (i.e., Kolmogorov micro-scale). In this context,different modelling approaches are currently being discussed to simulate the various district regimesof turbulent combustion, identified in the Borghi diagram (i.e., well-stirred reactor, distributedreaction zones, corrugated flamelets, and wrinkled flamelets).
A prominent feature of CFX-F3D is the user subroutines that allow modification of the numerics andthe physical models employed. The code is being tested for scalar, vector, and parallel computers.The numerical solution techniques of the basic physical equations provide a second-order accuracy.Options for mesh refinement allow a specific mesh adaptation necessary for turbulent combustion

255
processes. For the control of numerical accuracy of the CFX simulations, standard criteria aresolution convergence (residual), grid sensitivity (grid error), verification (code-to-code), andvalidation (experiment).
A.2.4 TONUS CODE
IPSN Containment Code System
Source term calculation is the main objective of the ESCADRE system, a set of codes that allowssevere accident calculations from core uncovery to fission-product release from the reactor building.PSA level 2 requires an integrated approach, allowing scenario calculations and parametric studies.Containment lumped-parameter codes JERICHO or RALOC2.2 are components of the system and areused for hydrogen distribution (eventually carbon monoxide and carbon dioxide) and include asimplified combustion model to evaluate the static loading on containment, resulting from hydrogencombustion [124].
The codes are qualified against standard problems and various experiments.
TONUS Code Features
Hydrogen risk analyses require a finer representation, to evaluate the distribution of gases. Theconsequence of a combustion on the mechanical behaviour of the containment and internal structuresis a major objective of risk evaluation.
The TONUS code is devoted to thermalhydraulic containment for PWRs (current or future), VVER,and other reactors, as well as experimental facilities used for validation (HDR, NUPEC ) or planned(TOSQAN, MISTRA).
The TONUS code combines the multicompartment approach with the multidimensional approach[125,126]. The first is suited for probabilistic safety analysis and allows the user to define acceptableboundary conditions to calculate flow fields in local zones with the multidimensional approach. Thiscoupling compromises between the complexity level and the required accuracy. It is well adapted forthe combustion model where the time and space scale for turbulence and chemistry may be verydifferent.
The TONUS code solves the Navier–Stokes equations with a turbulence model. The resolution isdefined by the mesh resolution and a junction requires a sufficient number of meshes in the opening.Near the walls, the mesh has to allow the description of the boundary layer, or adequate empiricalcorrelations have to be developed to calculate velocity of the flow and heat transfer between gas andstructure.
The level of model detail for physical phenomena is defined by the global accuracy required. Theuser has access to a programming language to enter his choice for physical models from existingones, introduce new physical models, implement geometrical meshes adapted to postprocessing ofdata, and choose a numerical solver. The user is able to generate heat and mass sources at anylocation for any period of time. Basic accident-management procedures are included in the code andare continuously improved with the progress of accident management.
256
An important postprocessing package was developed for visualizing physical variables such as localvelocities, local concentration, etc., and the CASTEM 2000 environment developed for mechanicalproblems is already available for the TONUS code.The physical phenomena for this risk evaluation are grouped around 3 topics: (1) Gas-mixingphenomena include gas circulation in a set of confined volume and through junctions betweencompartments, bulk and wall steam condensation, turbulence, heat transfer to structures,stratification, spray systems, passive residual heat removal systems, and recombiners. (2) Hydrogencombustion phenomena include slow combustion, turbulent deflagration, influence of internalobstacles, deflagration-to-detonation transition (DDT) criteria, and detonation. (3) Structuralbehaviour phenomena include static and dynamic loads and missile impact.
Validation
The TONUS multicompartment code, used with a geometrical description already defined with thelumped-parameter codes JERICHO or RALOC, is well suited to calculate hydrogen distributionsmeasured in experiments such as BATTELLE, HDR or NUPEC [127]. However, the prediction ofgas stratification resulting from buoyancy-driven circulation is limited because of simplified globalcorrelations for gas and liquid transport. It was possible to improve the agreement throughexperiments, by modifying the nodalization or adjusting the friction loss factor and the liquidcirculation rate. This adjustment is justified a posteriori by particularities of the experiment.
Code qualification requires specific experiments that are well instrumented to measure the principalvariables such as velocity field, local temperatures, and concentrations and variables characterizingthe turbulence. New experiments are being developed for this purpose (MISTRA and COPAIN atCEA/DRN, TOSQAN at IPSN).
A.3 References
1. K.K. Murata and D.W. Stamps, Development and Assessment of the CONTAINHybrid Flow Solver, SAND96-2792 Sandia National Laboratories, Albuquerque, NM,November, 1996.
2. B.E Boyack, M.L. Corradini, R.S. Denning, M. Khatib-Rahbar, S.K Loyalka and P.N.Smith, CONTAIN Independent Peer Review, LA-12866, Los Alamos NationalLaboratory, Los Alamos, NM, January, 1995.
3. H. Karwat, International Standard Problem ISP 23, Rupture of a Large-Diameter Pipewithin the HDR-Containment, Volumes 1 and 2, CSNI-Report No. 160, Committee onthe Safety of Nuclear Installations, OECD Nuclear Energy Agency, Paris, France,December, 1989.
4. H. Karwat, OECD Standard Problem ISP 29, Distribution of Hydrogen within the HDRContainment under Severe Accident Conditions, OECD-CSNI-ISP 29, Committee onthe Safety of Nuclear Installations, OECD Nuclear Energy Agency, Paris, France,August, 1992.
5. P.F. Peterson, Scaling and Analysis of Mixing in Large Stratified Volumes,International Journal of Heat Mass Transfer, Vol. 37, Suppl. 1, 1994, 97-106.

257
6. L. Valencia and T.F Kanzleiter, Blowdown-Investigations in a Reactor Containment -Rupture of a Steam Pipe - Quick Look Report for Tests V42, V43, V44, (In German),Technical Report PHDR 38-83, Nuclear Research Centre Karlsruhe, Project HDRSafety Program, Kernforschungszentrum Karlsruhe GmbH, Projekt HDR-Sicherheitsprogram (PHDR), May, 1983.
7. L. Wolf, L. Valencia and T. Kanzleiter, Overview of the HDR-Containment Tests,Proc. of the U.S. Nuclear Regulatory Commission, Eleventh Water Reactor SafetyResearch Information Meeting, NUREG/CP-0048, Vol. 3, January, 1984.
8. J. Tills, R.O. Griffith, K.K. Murata and D.W. Stamps, User Guidance on theCONTAIN Code for Advanced Light Water Reactors, SAND96-0947, Sandia NationalLaboratories, Albuquerque, NM, April, 1996.
9. D.W. Stamps, CONTAIN Assessment of the NUPEC Mixing Experiments, SAND942880, Sandia National Laboratories, Albuquerque, NM, August, 1995.
10. K.E. Washington et al., Reference Manual for the CONTAIN 1.1 Code forContainment Severe Accident Analysis, SAND91-0835, NUREG/CR-5715, SandiaNational Laboratories, Albuquerque, NM, July, 1991.
11. K. Murata et al., Code Manual for CONTAIN2.0: A Computer Code for NuclearReactor Containment Analysis, Sandia National Laboratories, Albuquerque,NM,NUREG/CR-6533, December 1997.
12. J. Tills, Calculations and Analyses for the Large-Scale Passive Containment CoolingSystem (PCS) Tests, SAND96-1089, Sandia National Laboratories, Albuquerque, NM,May, 1996 (Proprietary Report).
13. J. Green and K. Almenas, Modeling of the HDR E11.4 Experiment Using theCONTAIN 1.12, Report submitted to U.S. NRC/RES by University of Maryland,Nuclear Engineering Program, College of Engineering, College Park, Maryland,March, 1992.
14. J. Langhans, CONTAIN-Vergleichsrechnung zum HDR-CONTAINMENTVERSUCHT31.6 [CONTAIN comparison calculations of the HDR containment test T31.6], GRS-A-1495, Gesellschaft fur Reaktorsicherheit (GRS) mbH, Koln, Germany, October,1988.
15. P.N. Smith and P. Ellicott, The CONTAIN 1.11 (UK) Submission to the InternationalStandard Problem ISP-29, AEA-RS-5284, AEA Technology, Winfrith TechnologyCentre, AEA, 1992.
16. J.A. Gieseke et al., Source Term Code Package: A User’s Guide, Battelle Columbus
Division, BMI-2138(NUREG/CR-4587), July, 1986. 17. D.I. Chanin et al., MELCOR Accident Consequences Code System (MACCS),
SAND86-1562(NUREG/CR-4691), Sandia National Laboratories,Albuquerque, NM,February, 1990.
258
18. Z. Guo, H. Kumamaru and Y. Kukita, Critical Heat Flux for Rod Bundle under High-pressure Boil-off Conditions, Japan Atomic Energy Research Institute Report, JAERI-M-93-00238, 1993.
19. F.B. Cheung, K.H. Haddad, and Y.C. Liu, Critical Heat Flux (CHF) Phenomenon on aDownward Facing Curved Surface, Prepared by the authors at Pennsylvania StateUniversity, United States Nuclear Regulatory Commission Report, NUREG/CR-06507,1997.
20. D.A. Powers et al., VANESA: A Mechanistic of Radionuclide Release and Aerosol
Generation During Core Debris Interactions with Concrete, NUREG/CR-4308, SandiaNational Laboratories, July, 1986.
21. P.C. Owczarski and K.W. Burk, SPARC-90: A Code for Calculating Fission Product
Capture in Suppression Pools, NUREG/CR-5765, PNL-7723, October, 1991. 22. R.M. Summers et al., MELCOR Computer Code Manuals, NUREG/CR-6119, Sandia
National Laboratories, March, 1995. 23. B.E. Boyack et al., MELCOR Peer Review, LA-12240, Los Alamos National
Laboratory, Los Alamos, NM, March, 1992. 24. T.L. George, et al., GOTHIC Containment Analysis Package Technical/User Manual,
Version 3.4e, EPRI Report RP3048-1, 1993. 25. L.E. Wiles et al., GOTHIC Containment Analysis Package Qualification, Version 3.4e,
EPRI Report RP3048-1, 1993. 26. OECD/NEA, Separate Effects Test Matrix for Thermal-Hydraulic Code Validation;
Vol. I, Phenomena Characterizations and Selection of Facilities and Tests; Vol. II,Facility and Experiment Characteristics, Report OECD/GD(94)82, alsoNEA/CSNI/R(93)14, 1993.
27. E.O. Moeck et al., Generic Validation of Computer Codes for Safety Analyses of
CANDU Power Plants, Canadian Nuclear Society Bulletin, Vol. 17, No. 2, 1996, 23-29.
28. A. Manfredini, M. Mazzini, F. Oriolo and S. Paci, FUMO Code Manual Volume 1:
System Models, Pisa University, DCMN Report RL 533 (92), 1992. 29. A. Manfredini, F. Oriolo, S. Paci, Modelling of Buoyancy-driven Flows in LWRs
Containment System, X National Congress UIT on Heat Transfer, Genoa (I), June,1992.
30. P. Barbucci, G. Mariotti, A. Manfredini, F. Oriolo, W. Ambrosini and G. Fruttuoso, An
Integrated Model for Evaluating the Thermalhydraulic Behaviour of Primary andContainment Systems in Innovative Reactors, Advanced Nuclear Plant Conference,Tokyo (J), October, 1992.

259
31. G. Sandrelli, M. Valisi, G. Fruttuoso, A. Manfredini and F. Oriolo, A Model for theAnalysis of Containment Behaviour During High Pressure Melt Ejection Scenarios,ANS/ENS 1992 International Conference, Chicago (USA), November, 1992.
32. A. Manfredini, M. Mazzini, F. Oriolo and S. Paci, Validation of the External Spray
System for Advanced Nuclear Power Plants, (in Italian), VIII National Congress UITon Heat Transfer, Ancona (I), June, 1990.
33. P. Barbucci, A. Manfredini, G. Mariotti, F. Oriolo and S. Paci, Development and
Qualification of the FUMO Code for the Containment System Simulation of AdvancedLWRs, IAEA Meeting on Progress in Development and Design Aspects of AdvancedWater Cooled Reactors, Rome (I), September, 1991.
34. F. Oriolo, A. Manfredini, A. Villotti, F. De Rosa and S. Paci, Evaluation of
Containment Heat and Mass Transfer Models with Consideration on the PHEBUS-FPContainment Vessel, Final Report, EUR Report 16111 EN, JRC Ispra Site, 1994.
35. A.V. Jones, I. M. Shepherd, F. Oriolo, F. De Rosa, A. Manfredini and S. Paci,
Evaluation of LWR Containment Heat and Mass Transfer Models and Scaling toIntegral Experiments, NURETH-6, Grenoble, France, October 5-8, 1993.
36. F. Fineschi and M. Carcassi, Simulation of Burnable Gas Mixture, (in Italian), Pisa
University, DCMN Report, RL 468 (90), 1990. 37. L. Valencia and L. Wolf, Overview of First Results on H2 Distribution Test at the
Large Scale HDR Facility, II International Conference on Containment Design andOperation, Toronto, Canada, October, 1990.
38. K. Fischer, CEC Benchmark Exercise on FIPLOC Verification Experiment F2 in BMC.
Specifications for Phase II, Battelle Institute e.V., Frankfurt, Germany, September,1989.
39. K. Takumi, A. Nonaka, T. Hirose and J. Ogata, Proposal of International Standard
Problem Exercise for NUPEC’s Hydrogen Mixing and Distribution Test, Test M-4-3and Test M-7-1, June 1992, ISP 35-027, 1992.
40. K. Fischer, M. Schall and L. Wolf, CEC Thermal-hydraulic Benchmark Exercise on
FIPLOC Verification Experiment F2 in BMC. Experimental Phases II, III and IV.Results of Comparison, Battelle Institute e.V., Frankfurt, Germany, December, 1991.
41. A. Manfredini, F. Oriolo, S. Paci and A. Villotti, ISP-35 on NUPEC’s Hydrogen
Mixing and Distribution Test M-7-1: Pre-Test Analysis Using the FUMO Code,Presented at the 2nd ISP-35 Workshop, Tokyo, November 4-5, 1993.
42. A. Manfredini, Using the FUMO Computer Code, Pisa University, DCMN Report RL
637 (94), 1994. 43. MAAP-4 Code Manual, EPRI, 1994. 44. MAAP-30B, Code Manual, EPRI-NP-7071-COML, 1990.

260
45. M.A. Kenton, July 1991, Communication to M.G. Plys.46. M. Epstein and M.A. Kenton, Combined Natural Convection and Forced Flow Through
Small Openings in a Horizontal Partition, with Special Reference to Flows inMulticompartment Enclosures, presented at the 1989 National Heat TransferConference, Philadelphia, PA, August 6-9, 1989 and published by ASME, HTD, Vol.106, 316-326.
47. FAI (Fauske & Associates, Inc.), Phase III Large Scale Integral Tests, FAI/83-1, Burr
Ridge, IL, 1983. 48. M.G. Plys, M.A. Kenton and R.E. Henry (Fauske and Associates, Inc., Burr Ridge, Il),
Ex-Vessel Fission Product Release Modeling Within Integrated Accident Analysis,Proc. of CSNI Specialists’ Meeting on Core Debris/concrete Interactions, Palo Alto,CA, September 3-5, EPRI NP-5054-SE, 1986.
49. J.E. Hustad et al., Experimental Studies of Lower Flammability Limits of Gases and
Mixtures of Gases at Elevated Temperatures, Combustion and Flame. Vol. 71, 1988,283-294.
50. M. Hertzbert, Flammability Limits and Pressure Development in H2-Air Mixtures,Workshop on the Impact of Hydrogen on Water Reactor Safety. NUREG/CR-2017,SAND81-0661. September, 1981.
51. M.G. Plys et al., Modeling and Validation Progress with MAAP4 DECOMP, OECD
CSNI Spec. Meeting on Core Concrete Interactions, 1992. 52. P.Y. Chevalier et al., Thermodynamic Data Bases and Calculation Code Adapted to
the Modeling of Molten Core Concrete Interaction (MCCI) Phenomena, Proc. of Sec.OECD CSNI, Meeting on Molten Core Debris-Concrete Interactions. Karlsruhe,Germany, April 1-3, 1992.
53. E.R. Copus et al., Core Concrete Interactions Using Molten Urania with Zirconium on
a Limestone Concrete Basemat, SURC-4 Experiment, NUREG/CR- 5443, December,1990.
54. H. Alsmeyer, Rep. on BETA Experiments, V5.1, V5.2 and V6.1. CSARP Meeting,
Bethesda, MD, May 6-10, 1991. 55. D.H. Thompson et al., ACE MCCI Test L7 Test Data Report, Vol. 1, Thermal
Hydraulics, ACE-TR-C31, ANL, November, 1991. 56. R.W. Wierman. Experimental Study of Hydrogen Jet Ignition and Jet Extinguishement,
HEDL-TME 78-80, April, 1979. 57. R. Torok et al., Hydrogen Combustion and Control Studies in Intermediate Scale, EPRI
NP-2953, June, 1983. 58. W. B. Benedick et al., Combustion of Hydrogen-Air Mixtures in the VGES Cylindrical
Tank, SAND83-1022, May, 1984.

261
59. A.C. Ratzel, Data Analysis for Nevada Test Site (NTS) Premixed Combustion Tests,NUREG/CR-04138, SAND-85-00135, May, 1985.
60. D. Liu et al., Some Results of WNRE Experiments on Hydrogen Combustion,Workshop on the Impact of Hydrogen on Reactor Safety. NUREG/CR-2017,SAND81-0661, September, 1981.
61. M.G. Plys et al., Modification for the Development of the MAAP-DOE Code, A
Mechanistic Model for Combustion in Integrated Accident Analysis, DOE/ID-10216,Vol. III, November, 1988.
62. R.K. Kumar et al., Studies of Hydrogen Combustion in an Intermediate-scale Test
Facility, AECL Report, AECL-7814, 1984. 63. L. Godin Jacqmin et al., Detailed Analysis of the PHEBUS FPTO Test Results with the
MAAP4 Code, PSA-95, 681, November 26-30, 1995, Korea. Steam Mixture Tests,EPRI NP-2955, Palo Alto, CA, June 1984, NUREG/CR-4138, SAND85-0135, SNL.May, 1985.
64. M. Epstein and Phillip G. Ellison, Correlations of the Rate of Removal of Coagulating
and Depositing Aerosols for Application to Nuclear Reactor Safety Problems, NuclearEngineering and Design Vol. 107, 1988, 327-344.
65. C.D. Wu, New Switch Mechanism of Aerosol Removal Rate from Decay to Steady
State, FAI memo (M1.12.6), March 7, 1990. 66. M. Epstein et al., Correlation of Aerosol Sedimentation, Journal of Colloid Interface
Science, Vol. 113, No.2, October, 1986. 67. Evaluation of Current Empirical Aerosol Correlations, EPRI Report, 1985. 68. R.K. Hillard et al., Aerosol Behavior During Sodium Pool Fires in Large Vessel-CSTF
Tests AB-1 and AB-2, HEDL-TME 81-30, November, 1981. 69. M. Epstein et al., Thermophoretic Deposition of Particles in Natural Convection Flow
from a Vertical Plate, Transactions of the ASME, Vol. 107, 1985, 272-276. 70. J.R. Brock, On the Theory of Thermal Forces Acting in Aerosol Particles, Journal of
Colloid Science, Vol.17, 1962, 1837-1849. 71. L. Talbot et al., Thermophoresis of Particles in a Heated Boundary Layer, Journal of
Fluid Mechanics, Vol.101, 1980, 737-758. 72. E. Beakin, Models of Iodine Behavior in Reactor Containments, ORNL/TM-12202,
October, 1992. 73. B.W. Spencer et al., Hydrodynamic Aspects of Ex-Vessel Debris Dispersal and Zion-
Type Containment Designs, ANL/LWR/SAF 83-1. January,1983.

262
74. H. Jahn and G. Weber, Description of the M0D2185 Versions of the RALOC/FIPLOCFamily, Part 1: Code System, GRS-A-1315, Gesellschaft fur Anlagen- undReaktorsicherheit (GRS) mbH, 1986.
75. H. Jahn and E. Hofer, Description of the M0D2185 Versions of the RALOC/FPLOCFamily, Part 2: Physical Modeling of Thermalhydraulics and Integration Methods,GRS-A-1426, Gesellschaft fur Anlagen- und Reaktorsicherheit (GRS) mbH, 1988.
76. W. KIein-HeiBling, RALOC MOD 4.0 User Manual, GRS-A-2308, Gesellschaft WrAnlagen- und Reaktorsicherhelt (GRS) mbH, 1995.
77. Schwinges, B. Huttermann, M. Heitsch and W. KIein-HeBling, Progress in theDevelopment and Validation of the Containment Code RALOC, Presentation onCooperative Severe Accident Research Program Meeting, Bethesda, MD, October 19-20, 1992.
78. B. Schwinges, W. Klein-Hessling, M. Heitsch and B. Huttermann, Weiterentwicklungund Verifikation des Rechenprogramms RALOC [Further development and verificationof the code RALOC], AbschluBbericht GRS-A-2185, September, 1994.
79. Weber, S. Schwarz, F. Ewig and K. Fischer, Benutzerhandbuch fur FIPLOC 3.0, Teil1: Modellbeschreibung und Anwendungshilfen, Teil 2: Input Description [User Manualfor FIPLOC 3.0, Part 1: Model description and application guidelines, Part 2: InputDescription], GRS-A-2417, October, 1996.
80. F. Gelbard, MAEROS User Manual, NUREG / CR-1391, December, 1982.
81 S. Guntay and R. Cripps, IMPAIR/3: A Computer Program to Analyze the IodineBehaviour in Multi-compartments of a LWR Containment, PSI-Bericht Nr. 128, 1992.
82. K. Fischer, M. Schall and L. Wolf, CEC Thermal-hydraulic Benchmark Exercise onFIPLOC Verification Experiment F2 in Battelle Model Containment; ExperimentalPhases 2,3, and 4; Results of Comparison, EUR 14454 EN, 1993.
83. M. Firnhaber,. T. Kanzleiter, S. Schwarz and G. Weber, International Standard
Problem ISP 37,VANAM M3 - A Multi Compartment Aerosol Depletion Test withHygroscopic Aerosol Material Comparison Report, NEA / CSNI / R(96)26, December,1996.
84. G. Weber and H. Jahn, Rechnungen mit dem Programm FIPLOC Mod 1/83 zurMethyljodid- und Aerosolverteilung der Versuche A-5 und A-11 des ContainmentSystems Experiments [Calculations with the program FIPLOC Mod 1/83 for methyliodide and aerosol distribution in tests A-5 and A-11 of the containment systemsexperiments], GRS-A-1011, September, 1984.
85. G. Weber, Verifikation des Containment-Rechenprogramms FIPLOC an DEMONA-und LACE-Experimenten [Verification of the containment code FIPLOC withDEMONA and LACE experiments], GRS-A-1641, December, 1989.

263
86. E. Schodl, Begleitende Rechnungen zu den DEMONA-Experimenten, Teil 2:NAUA-Rechnungen (Abschlussbericht) [Companion calculations of the DEMONAexperiments, Part 2: NAUA calculations (final report)], GRS-A-1578, June, 1989.
87. R. Ricchena, CEC Comparative Exercise on the Performance of the Computer CodesSimulating the LACE-4 Experiment, EUR 11351 EN, 1988, 21.
88. D. Slaughterbeck, Pre- and Post-Test Thermal-Hydraulic Comparisons of LACE TestLA4, LACE TR-027, EPRI, Palo Alto, CA, March, 1988.
89. G. Weber, Support to Thermal Hydraulics Analysis for the C. E. C. Benchmark onLACE LA4-Multicompartment Modelling, GRS-A-1436, May, 1988.
90. S. Schwarz, “FIPLOC Verification Test F2, Blind Posttest Calculation Compared to
the Experiment, GRS-A-1490, 1988.
91. Schwarz and G. Weber, Uberprufung des Containment-Rechenprogramms FIPLOC anden FIPLOC-Verifikationsexperimenten F1 und F2 [Assessment of the containmentcode FIPLOC against the FIPLOC verification experiments F1 and F2], GRS-A-1753,January, 1991.
92. K. Fisher, M. Schall and L. Wolf, CEC Thermal-hydraulic Benchmark Exercise onFIPLOC Verification Experiment F2 in Battelle Model Containment (long-term heatupphase), Results of Phase 1 EUR 13588 EN, 1991.
93. Schwarz, Additional Investigation on Specific Results of the CEC F2 Benchmark(Phase 1), GRS-A-1797, July, 1991.
94. S. Schwarz, CEC F2 Benchmark (Phase II) FIPLOC Calculations, GRS-A-1826,
August, 1991.
95. S. Schwarz, FIPLOC-MAEROS-Nachrechnung des DEMONA-Trockenversuchs B2[FIPLOC-MAEROS post-test calculations for the DEMONA dry test B2],GRS-A-1512, December, 1988.
96. G. Weber, Auslegungs- und Vorausrechnungen der VANAM-Versuche M1 und M2 mitdem Containment-Rechenprogramm FIPLOC [Scoping and pre-test calculations of theVANAM tests M1 and M2 using the containment code FIPLOC], Abschlussbericht RS649, Teil 4, GRS-A-1754, January, 1991.
97. S. Schwarz, Verifikation des Containment-Rechenprogramms FIPLOC-M an den
VANAM-Experimenten [Verification of the containment code FIPLOC-M with theVANAM experiments], GRS-A-2136, January, 1994.
98. C. Smutek and B. Schwinges, ISP 37 VANAM M3 FIPLOC Calculation Note
Technique SEMAR 96/37, ISPN, Cadarache, April, 1996. 99. W. Klein-Hesslling and C. Smutek, Calculations (30 zones nodalisation), GRS-TN,
March, 1996.

264
100. J. Makynen and J. Jokiniemi, CSNI/PWG4/FPC, AHMED Code Comparison Exercise,NEA (CSNI) R(95)23, October, 1995.
101. J. Langhans, 2-dimensionale Nachrechnung des Containmentverhaltens in PHEBUS
FPT0 [Two-dimensional post-test calculation of the containment behavior in PHEBUSFPT0], GRS-A, report in preparation.
102. B. Fritsche, KAEVER Versuche [KEAVER tests], report in preparation.
103. J.R. Travis, K.L. Lam, and T.L. Wilson, GASFLOW: A Three-Dimensional Finite-Volume Fluid-Dynamics Code for Calculating the Transport, Mixing, and Combustionof Flammable Gases in Geometrically Complex Domains, LA-UR-94-2270, July 11,1994.
104. L. Lam, T.L. Wilson and J.R. Travis, Hydrogen Mixing Studies (HMS): User’s Manual,NUREG/CR-6180, December, 1994.
105. L. Lam, J.R. Travis and T.L. Wilson, Hydrogen Mixing Studies (HMS): AssessmentManual, NUREG/CR-6060, June, 1993.
106. J.R. Travis, HMS: A Computer Program for Transient, Three-Dimensional MixingGases, NUREG/CR-4020, November, 1984.
107. J.R. Travis, P. Royl, R. Redlinger, G.A. Necker, J.W. Spore, K.L. Lam, T.L. Wilson,B.D. Nichols and C. Muler: GASFLOW-II. Vol. I, Theory and Computational Model,Draft Report FZK/LANL, February, 1997.
108. W. Spore, K.L. Lam, B.D., Nichols, T.L. Wilson, C. Muler, J.R. Travis, P. Royl andG.A. Necker, GASFLOW 2.1 Code Manual, to be published.
109. P. Royl, GASFLOW Analysis of the Phebus FPT0 Containment Thermal Hydraulics ,Proc. Jahrestagung Kerntechnik, Nurnberg, May, 1995.
110. P. Royl, C. Muler, J.R. Travis and T. Wilson, Validation of GASFLOW for Analysis ofSteam/Hydrogen Transport and Combustion Processes in Nuclear ReactorContainments, Proc. of 13th Conference on Structural Mechanics in ReactorTechnology, August 13-18, 1995, Porto Alegre, RS, Brazil, 1995.
111. P. Royl, J.R. Travis, E.A. Haytcher and H. Wilkening, Analysis of Mitigating Measuresduring Steam/Hydrogen distributions in Nuclear Reactor Containments with the 3DField Code GASFLOW, presented at the OECD/NEA CSNI Workshop on theImplementation of Hydrogen Mitigation Techniques, Winnipeg, Canada, May 13-15,1996.
112. P. Royl, E.A. Haytcher, J.R. Travis and H. Wilkening, 3D-Simulationen vonWasserstoffverteilung und-verbrennung im ausseren Sicherheitsbehalter einesDruckwasserreaktors [3D simulations of hydrogen distribution and combustion in theouter containment of a PWR], FZK-Nachrichten [FZK news] 2-3, ForschungszentrumKarlsruhe 1996.

265
113. P. Royl and J.R. Travis, Simulation of Hydrogen Transport with Mitigation Using the3D Field Code GASFLOW, Proc. of 2nd International Conference on AdvancedReactor Safety, June 1-4, 1997, Orlando, FL, 1997.
114. W. Breitung, J.R. Travis and S.B. Dorofeev, A Mechanistic Approach to Safe IgniterImplementation for Hydrogen Mitigation, OECD/NEA CSNI Workshop on theImplementation of Hydrogen Mitigation Techniques, Winnipeg, Canada, May 13-15,1996.
115. A. Minato, M. Hirose and N. Tanaka, Numerical Analysis of Liquid Film and DropletsBehavior Considering Interaction with Gas Turbulence, Proc. of the 2nd Symposiumon α-FLOW Applications, 1996 (in Japanese).
116. R. Takahashi, M. Akiyama and H. Koike, Development of Advanced Fluid-DynamicAnalysis Code α-FLOW, Proc. of the 2nd ICHMT International Forum on ExpertSystems and Computer Simulation in Energy Engineering, 1992, 2-1-1.
117. A. Minato and N. Tanaka, Development of Detonation Calculation Method AlleviatingNumerical Diffusion, Proc. of Atomic Energy Society of Japan 96 Fall Meeting, D54,1996 (in Japanese)
.118. Numerical Method for Thermal-Hydraulics in Containment Vessels under Severe
Accident Conditions, Spray Induced Circulation and Hydrogen Concentration,NUPEC/INS Report M 95-10, 1966 (in Japanese).
119. Final Comparison Report on ISP-35: NUPEC Hydrogen Mixing and Distribution Test(Test M-7-1), NEA/CSNI/ R(94)29, General Distribution OECD/GD, 29, 1995.
120. Numerical Method for Thermal-Hydraulics in Containment Vessels under SevereAccident Conditions (II) -Hydrogen Gas Detonation, NUPEC/INS Report M 95-11,1966 (in Japanese).
121. G. Ciccarelli et al., High-Temperature Hydrogen-Air-Steam Detonation ExperimentApparatus, NUREG/CR 6213, 1995.
122. T.F. Kanzleiter and K.O. Fischer, Multi-Component Hydrogen DeflagrationExperiments and Model Development, Proc. of NURETH-5, 1992, 1373.
123. CFX-F3D (Version 4) User Manual, AEA Technology, Harwell, UK.
124. H. Paillere et al., “Development of Hydrogen Distribution and Combustion Models forthe Multi-dimensional/Lumped-parameter Code TONUS”, Paper submitted toNURETH-8 meeting, Kyoto, October 1-4, 1997.
125. L.V. Benet et al., “Geyser/TONUS : A Code for Severe Accidents ContainmentAtmosphere Analysis”, Heat and Mass Transfer in Severe Nuclear Reactor Accidents,J.T. Rogers (editor), Begell House, Inc., New York, 1996, 419-435.
126. M. Petit, M. Durin and J. Gauvain, “Geyser/TONUS : A Coupled Multi-DimensionalLumped Parameter Code for Reactor Thermalhydraulics Analysis in Case of SevereAccidents”, NUREG/CP-0142, Proc. of the 7th International Meeting on Nuclear

266
Reactor Thermal-Hydraulics NURETH-7, Saratoga Springs, NY, September, 1995,l574-l585.
127. L.V. Benet et al., “Modeling of Local Steam Condensation on Walls in Presence ofNon-Condensable Gases. Application to a LOCA Calculation in Reactor ContainmentUsing the Multi-dimensional Geyser/TONUS Code”, NUREG/CP-0142, Proc. of the7th International Meeting on Nuclear Reactor Thermal-Hydraulics NURETH-7,Saratoga Springs, NY, September, 1995, 1443-1455.

267
APPENDIX B: OTHER CODE DESCRIPTIONS
B.1 E11.2 benchmark [1]
Besides the open standard problem International Standard Problem (ISP) 29, some other comparisonexercises were performed on the experiment HDR E11.2.
Blind post-test predictions
Nine international institutions, using eight codes, participated in the predictions, as shown in TableB.1-1. This exercise should have given the opportunity to check the predictability of the codes.Unfortunately, the steam release rates were incorrectly specified because of a measurement errorrevealed during the ISP 29. Consequently, the results can only be used as comparison of analyticalsimulations with different codes. Nevertheless, the scatter of results, Figures B.1-1 and B.1-2, evenfor the prediction of pressure among the participating codes is significant [1-3] and should beevaluated. An evaluation of these results can be of interest for the developers of the participatingcodes.
Parameter studies [1]
A documented parameter study, performed with GOTHIC, gives some insight into the influences ofboundary and model parameters on the calculated results of E11.2 test. One parameter was thecorrected steam release rate; another one the energy removed by the measurement cooling system.
Open post-test calculations [1]
After the correction of the steam release rate and the specification of the energy loss by themeasurement cooling system, newly revised calculations were prepared by some institutions. Someof these calculations were compared in the framework of the PHDR project. Four institutions, withfour codes, participated in this comparison [2], Table B.1-2. For the calculations mainly the steamrelease rate and the subtracted cooling energy were changed in comparison with the blind predictions.Changes of other input parameters and changed nodalizations were investigated within the optimizedopen post-test calculations (see next paragraph).
Optimized open post-test calculations [1]
Under this topic, the results of 3 analytical investigations (CONTAIN/VTT, MELCOR/AEA,GOTHIC/BF) were compared; the analyses included among other things input parameter changesbeyond the geometrically specified junction areas and beyond technical standards, e.g., reduction ofjunction areas, of virtual junction areas because of subdivision of compartments (dome), changes ofresistance coefficients, detailed nodalization of the HDR dome, distribution of cooling energy. Thesestudies showed an improved quality of calculated results, but nevertheless significant discrepanciesto the measured results remained.

268
Table B.1-1 Teilnehmer, Codes und Modelle fur die blinde Nachrechung desVersuchs E11.2
[participants, codes, and models of the blind post-test analysis of Test E11.2]
Institution/Code Anzahl der Nodes Strömungspfade Ansahl Wärmetibergang an Strukturen Raum-
ReferenceCont.ohneKuppel
Kuppel Ring-spait
Ans.inCont.
Druckverlust-beiwert
Wärme-leiter
innerbalbContainment
sum RingspaitmodellsieheAnlage6.2.1-
BF/FATHOMS 41 6 9 97 1,2 -
2,8
156 Uchida-Korr.* Faktor 3
α = 100W/m2K
2
GRS/RALOC 48 7 5 184 1,0 -15,0
158 Konvekt.: Korr. Gröber et al.Gasstrahlung: Korr. Schack,
Hottel, Egbert
3
KWU/WAVCO 26 5 6 80 0,5 -0,85
144 WAVCO-Option Nr. 6 4
VTT/HECTR 67 7 - 160 2,0 700 HECTR-internesModell fürKonvektion
∆T Oberfl. -Umgebg=402Kα = 11W/m2K
5
AEA/CONTAIN 28 4 1 74 0,75 200 keine Angaben keineAngaben
6
SNL/COMPACT 31 4 11 221 0,7 418 Nusseit-Korr.In Abhäng. v.Flow Regime
α = 6 W/m2K 7
NNC/COMPACT 6 5 - 15 keineAngaben
44 Tagami/Uchida keineAngaben
8
AEA/MELCOR 24 7 - 65 2,0 124 keine Angaben adiabat 9
EPRI/MAAP 24 2 3 42 keineAngaben
58 keine Angaben keineAngaben
10

269
Table B.1-2 Tielnehmer, Codes und Modelle fur die offenen Nachrechnungen des Versuchs E11.2[participants, codes, and models of the open post-test analysis of test E11.2]
Institution/Code Anzahl der Nodes Strömungspfade Ansahl Wärmetibergang an Strukturen
ReferenceCont.ohneKuppel
Kuppel Ring-spait
Ans.inCont.
Druckverlust-beiwert
Wärme-leiter innerbalb
Containmentsum Ringspait
BF/GOTHIC 41 6 9 97 1,2 - 2,8 156 Zeitfunktionenaus MeBwerten
Zeitfunktionenaus MeBwerten
KWU/WAVCO 26 5 6 80 1,0 - 15 144 WAVCO-Option Nr. 6
VTT/CONTAIN 34 12 6 110 1,0 - 20 250 Nusselt-Korrelation
α = 6,08W/m2K
AEA/MELCOR 24 7 - 66 2,0 oberesContainment20,0 Rest
124 Nusselt-Korrelation
-

270
Alle Rechnungen wurden mit dem von PHDR zu hoch spezifizierten Massenstrom und ohneKohlsystemwdrmesenke durchgefohrt
Figure B.1-1 Vergleich Messung - Blinde Nachrechnungen E11.2 Containment druck[comparison of containment pressure - blind post-test analysis of E11.2]

271
Alle Rechnungen wurden mit dem von PHDR zu hoch spezifizierten Massenstrom und ohneKohlsystemwdrmesenke durchgefohrt
Figure B.1-2 Vergleich Messung - Blinde Nachrechnungen E11.2 Temperatur +16.5 m[comparison of temperature at +16.5 m - blind post-test analysis of E11.2]

272
B.2 E11.4 benchmark [1]
Blind post-test calculations [1-3]
The E11.4 experiment contained a scenario that differed from the scenario of test E11.2. Beside thedouble duration of the test of over 56 h, compared with 25 h of test E11.2, the main differenceconsists of the release location down on the 1400 level of the HDR building, for all injections. Fiveinstitutions, using 5 codes, participated in the predictions, as shown in Table B.2-1. This exerciseshould have been given the opportunity to check the predictability of the codes. Unfortunately, thesteam release rates were incorrectly specified because of measurement errors as was revealed duringISP 29. In addition, specification of the subtracted energy of the measurement cooling system wasmissing. Because of this error, the results of the blind exercise can only be used as a comparison ofanalytical simulations with different codes. Nevertheless, the scatter of results even for theprediction of pressure among the participating codes is significant [1-3] and is worth evaluating.
Open post-test calculations
After the correction of the steam release rates and specification of the cooling energy, thecalculations were repeated as an open comparison exercise. Four institutions, using 4 codes,participated, Table B.2-2.
Test E11.4 is also an important experiment for validation purposes. Besides the formation oftemperature and gas stratification found in the E11.2 experiment as one possible behaviour of energyand gas distribution processes under severe accident conditions, the other possibility of distributionprocesses is the rather well-mixed behaviour observed in the E11.4 experiment because of a loweredinjection location.
Unfortunately, the specified steam injection rates for the blind post-test calculations of test E11.4 hadto be significantly corrected —as for all E11 tests—so that only the open post-test calculations withthe corrected steam injection rates and the now-specified subtracted cooling energy gave a reliablebasis for the comparison of calculated and measured results. For all parameters—such as pressure,local temperatures, local concentrations—good and up to very good agreement was achieved, FiguresB.2-1 to B.2-3. (Reference 1 and the appendix of the ISP 29 report can also be consulted for moredetailed results.) This agreement is valid for the peak values as well as for the time histories ofpressure, temperatures and steam and light gas concentrations. Most of the participating codes andusers proved with their ASM their ability to simulate the processes in the containment during anaccident sequence with a lowered injection location.
B.3 NUPEC M-4-3, M-8-1, and M-8-2 Test [4,5]
B.3.1 Introduction
Only two computer codes, CONTAIN and MELCOR, have been applied to the NUPEC M-4-3, M-8-1 and M-8-2 experimental analyses because the experimental data are still limited to propagate. TheCONTAIN code analyses were conducted by the Sandia National Laboratories (SNL) in the UnitedStates, and the MELCOR code analyses were conducted by Nuclear Power Engineering Cooperation(NUPEC) in Japan. (MAYPHY-BURN, which is an original code of Mitsubishi Heavy Industry Inc.,has also been applied; however, it is not included in this section because it is a proprietary code.)

273
Table B.2-1 Teilnehmer, Codes und Modelle fur die blinde Nachrechung desVersuchs E11.4
[participants, codes, and models of the blind post-test analysis of Test E11.4]
Institution/Code Anzahl der Nodes Strömungspfade Ansahl Wärmetibergang an Strukturen Raum-
ReferenceCont.ohneKuppel
Kuppel Ring-spait
Ans.inCont.
Druckverlust-beiwert
Wärme-leiter
innerbalbContainment
sum RingspaitmodellsieheAnlage6.2.1-
BF/FATHOMS 41 6 9 97 1,2 -
2,8
157 Uchida-Korr.* Faktor 3
α = 100 W/m2K2
GRS/RALOC 48 7 5 184 1,0 -15,0
158 Konvekt.: Korr. Gröber et al.Gasstrahlung: Korr. Schack,
Hottel, EgbertKondensat. Fick’sches Gestez
3
KWU/WAVCO 26 5 6 80 0,5 -0,85
145 Tagami/Uchida WAVCO- Opt. Nr. 6Ab 88413 sek.Im Sumpfberei. WAVCO Opt.α=α(t) vorg Nr. 9
4
VTT/HECTR 67 7 - 160 2,0 700 HECTR-internesModell fürKonvektion
∆T Oberfl. -Umgebg =402Kα = 11 W/m2K
5
EPRI/MAAP 24 2 3 42 keineAngaben
58 keine Angaben keine Angaben 10

274
Table B.2 -2 Teilnehmer, Codes und Modelle fur die blinded Nachrechung desVersuchs E11.4
[participants, codes, and models of the blind post-test analysis of Test E11.4]
Institution/Code Anzahl der Nodes Strömungspfade Ansahl Wärmetibergang an Strukturen Raum-
ReferenceCont.ohneKuppel
Kuppel Ring-spait
Ans.inCont.
Druckverlust-beiwert
Wärme-leiter innerbalb
Containmentsum Ringspait
modellsieheAnlage6.2.1-
BF/GOTHIC 41 6 9 97 1,2 -
2,8
157Uchida-Korrelation
α = 25 W/m2K2
GRS/RALOC 48 7 7 184 1,0 -10,0
158 Konvekt.: Korr. Gröber et al.Gasstrahlung: Korr. Schack,
Hottel, EgbertKondensat: Fick’sches Gestez
3
KWU/WAVCO 26 5 6 89 0,5 -0,85
145 WAVCO-Option Nr. 6 4
UOM/CONTAIN 12 1 2 54 keingAngaben
89 CONTAIN-interne WU-Korrelation“Condense”-Option aktiviert
6.3.2-2
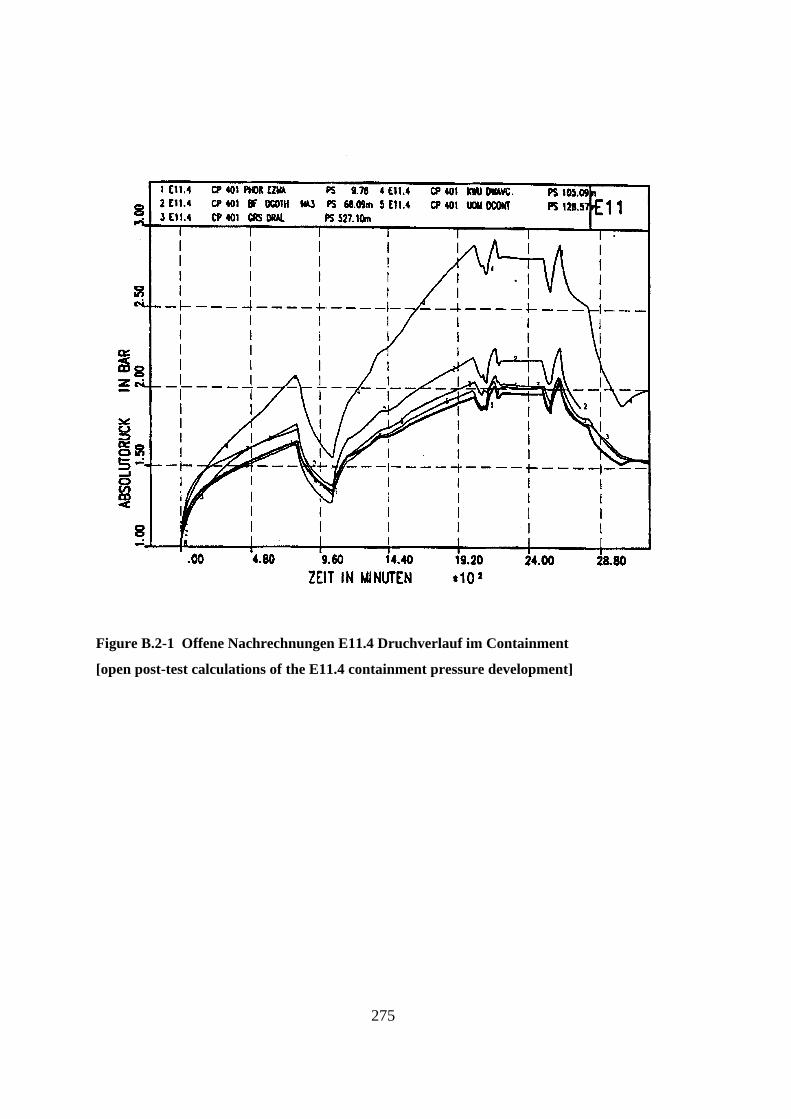
275
Figure B.2-1 Offene Nachrechnungen E11.4 Druchverlauf im Containment
[open post-test calculations of the E11.4 containment pressure development]

276
Figure B.2-2 Offene Nachrechnungen E11.4 Temperaturverlauf +16.5m (oben), +6m (unten)
[open post-test calculations of the E11.4 temperature development at elevations +16.5 m(above) and +6 m (below)]

277
Figure B.2-3 Offene Nachrechnungen E11.4 Gaskonzentration +48m (oben), +31m (unten)
[open post-test calculations of the E11.4 gas concentrations at elevations +48 m (above) and+31 m (below)
278
The summary of the CONTAIN code analyses is extracted from Reference 6. The MELCOR codeanalyses were summarized from open papers presented at international conferences and fromNUPEC’s internal report, which has limited distribution. (Refer to the compartment numbers inFigure 4.2.1.3-1 of Chapter 4.)
B.3.1.1 Comparison between Experimental results and calculations
a. NUPEC Test M-4-3 [4,5] gas–steam distribution test without internal spray
Helium Concentration Distributions
In NUPEC Test M-4-3 because of the large quantity of injected steam, the helium gas was well mixedin the containment vessel. Only six compartments had concentrations that differed from theconcentrations in the remaining compartments. Three compartments (Nos. 8,15 and 21), includingthe helium mixture gas injection compartment and those associated with the main upward flow path,recorded higher concentrations than the remaining compartments. The other three compartments(Nos. 1, 16 and 22), which are complex-shaped and dead-end compartments, recorded extremelylower concentrations.
The helium concentration distributions were in general well predicted by the CONTAIN andMELCOR [7] codes both quantitatively and qualitatively. In particular, the concentration transientsin the dome (No. 25) and in compartments Nos. 8,15 and 21 were predicted very well by both codes.However there were large discrepancies for compartments Nos. 1, 16 and 22 in both code analyses.The calculation results were 2 to 5 times greater than the experimental results.
A relatively large branching flow from the main upward flow path to the adjacent compartment,which led to poor agreement with experimental results in compartments No. 17 and 23, was alsoobserved in both CONTAIN and MELCOR calculation results.
After the gas injection mixture stopped, concentrations became almost uniform in both calculationresults because of a continuous gas circulation in the containment vessel, whereas they were lessuniform in the experiment.
Gas Temperature Distribution
The gas temperatures in the containment vessel increased continuously till the hot mixture gasinjection stopped, and then they slightly decreased. A small degree of thermal stratification wasobserved during and after the test period, whereas the helium gas was mixed very well in thecontainment vessel.
CONTAIN and MELCOR predicted the mixture gas temperature distributions well, bothquantitatively and qualitatively for all compartments, except for compartment No. 1. The probableexplanation of the discrepancy in compartment No. 1 was the stratification phenomenon caused by aweak gas current in the complex shape of compartment No.1. The measured values in compartmentNo. 1 might not have represented the properties, whereas the other calculations did.
Containment Dome Pressure
In the MELCOR code, using Uchida's correlation for steam concentration coefficients [8], thepressure transient agreed very well with the experimental results. CONTAIN also predicted thepressure transient very well.
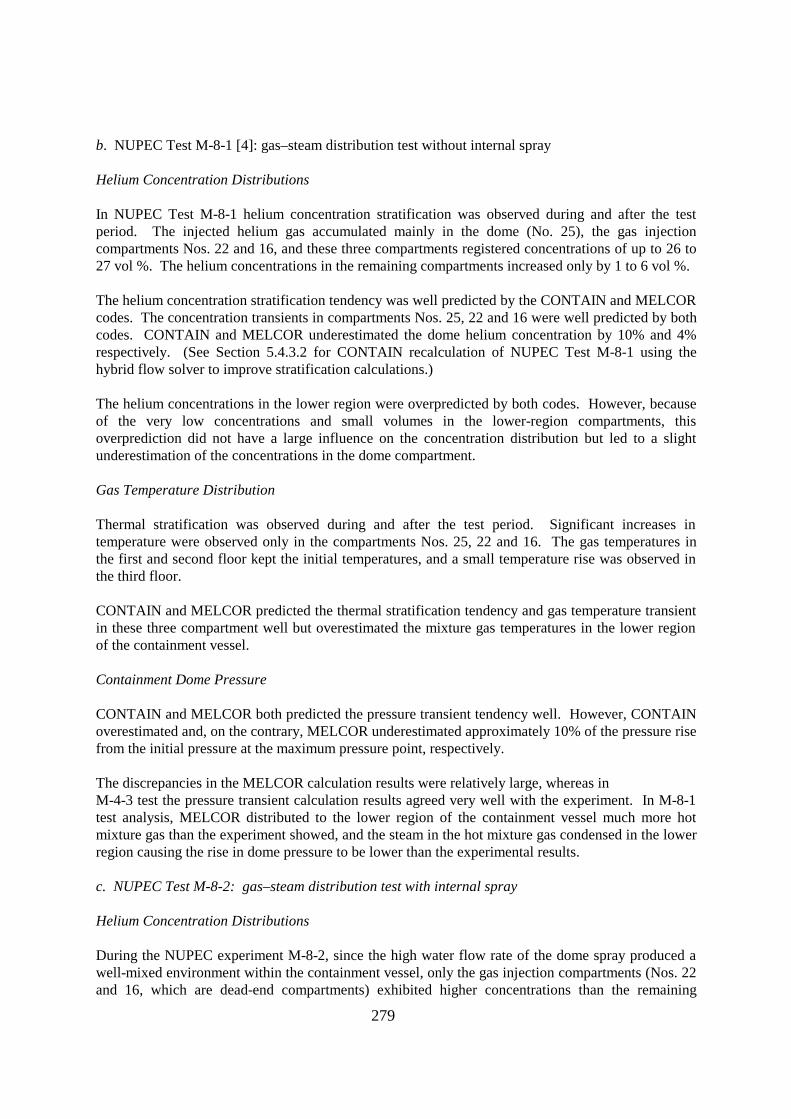
279
b. NUPEC Test M-8-1 [4]: gas–steam distribution test without internal spray
Helium Concentration Distributions
In NUPEC Test M-8-1 helium concentration stratification was observed during and after the testperiod. The injected helium gas accumulated mainly in the dome (No. 25), the gas injectioncompartments Nos. 22 and 16, and these three compartments registered concentrations of up to 26 to27 vol %. The helium concentrations in the remaining compartments increased only by 1 to 6 vol %.
The helium concentration stratification tendency was well predicted by the CONTAIN and MELCORcodes. The concentration transients in compartments Nos. 25, 22 and 16 were well predicted by bothcodes. CONTAIN and MELCOR underestimated the dome helium concentration by 10% and 4%respectively. (See Section 5.4.3.2 for CONTAIN recalculation of NUPEC Test M-8-1 using thehybrid flow solver to improve stratification calculations.)
The helium concentrations in the lower region were overpredicted by both codes. However, becauseof the very low concentrations and small volumes in the lower-region compartments, thisoverprediction did not have a large influence on the concentration distribution but led to a slightunderestimation of the concentrations in the dome compartment.
Gas Temperature Distribution
Thermal stratification was observed during and after the test period. Significant increases intemperature were observed only in the compartments Nos. 25, 22 and 16. The gas temperatures inthe first and second floor kept the initial temperatures, and a small temperature rise was observed inthe third floor.
CONTAIN and MELCOR predicted the thermal stratification tendency and gas temperature transientin these three compartment well but overestimated the mixture gas temperatures in the lower regionof the containment vessel.
Containment Dome Pressure
CONTAIN and MELCOR both predicted the pressure transient tendency well. However, CONTAINoverestimated and, on the contrary, MELCOR underestimated approximately 10% of the pressure risefrom the initial pressure at the maximum pressure point, respectively.
The discrepancies in the MELCOR calculation results were relatively large, whereas inM-4-3 test the pressure transient calculation results agreed very well with the experiment. In M-8-1test analysis, MELCOR distributed to the lower region of the containment vessel much more hotmixture gas than the experiment showed, and the steam in the hot mixture gas condensed in the lowerregion causing the rise in dome pressure to be lower than the experimental results.
c. NUPEC Test M-8-2: gas–steam distribution test with internal spray
Helium Concentration Distributions
During the NUPEC experiment M-8-2, since the high water flow rate of the dome spray produced awell-mixed environment within the containment vessel, only the gas injection compartments (Nos. 22and 16, which are dead-end compartments) exhibited higher concentrations than the remaining

280
compartments. Compartment No. 22 registered concentrations of up to over 50 vol % and No. 16registered up to approximately 20 vol %, before falling back to the 12% equilibrium levelsrespectively. The other compartments exhibited a steady build-up of helium gas, towards a finalconcentration level at around 12%.
CONTAIN and MELCOR predicted well the concentration transient. Large discrepancies wereobserved in compartments CV 22 and 16 and the complex-shaped compartment CV 1. Especially, theconcentrations in CV 1 were less than 1% those of the experimental results. However, in a casewhere compartment CV 22 was divided into four subcompartments (see Figure 5.4.1.2-1 (b) ),MELCOR predicted the concentrations in compartment CV 22 very well.
Gas Temperature Distributions
The gas temperatures in the containment vessel were decreased rapidly by the containment spraywater, except in two compartments, CV 22 and 16.
In general, both codes predicted well the tendency of the temperature distributions both incompartments CV 22, 16 and other compartments. Large discrepancies were observed incompartments CV 22 and 16. In spite of direct spray droplets impinging onto the pressurizer wall,the gas mixtures in those compartments were not cooled as well as they were in the experiment. Thespray impinging influence should be modelled and considered in an analytical model and analysis.The temperatures in the dome were underpredicted by the strong cooling effect of the spray shower.
Containment Dome Pressure
The dome pressure transient is nearly as same as that of M-7-1 test results. First, a rapid and largepressure drop resulting from a spray shower, then a gradual pressure rise resulting from hot gasaccumulation were observed.
CONTAIN and MELCOR both predicted the pressure transient tendency well. However, both codesgreatly overestimated the first pressure drop tendency because of an overestimated spray-coolingeffect in the containment vessel.
Well-predicted phenomena and discrepancies
Well-predicted phenomena are summarized as follows:
a. helium concentrations in released gas and in the dome compartment,
b. dome pressure transient behaviour,
c. helium concentration stratification phenomena in M-8-1 test analyses, and
d. temperature stratification phenomena in M-4-3 and M-8-1 test analyses.
Discrepancies are summarized as follows:
a. helium concentration in dead-end and complex-shaped compartments,
b. temperature in a complex-shaped compartment (this may be a question of the measurementlocation and representation), and
281
c. absolute value of helium concentration and temperature in the lower part of the containmentin the M-8-1 test analyses.
User-induced effects
In M-8-1 test analyses, differences in the noding scheme in the dome compartment showed arelatively large influence on the helium concentration phenomena. A suitable subdivision of thedome was obtained after conducting the noding survey calculations by comparing them with theexperimental data. This noding scheme was also proved to be suitable by a detailed analysis with afield code.
It was proved that the nodalization technique is one of big user-induced effects.
Suggestion and models to be improved
A new flow solver and a noding idea (see the example in Figure B.3-1) were proposed as a result ofthe analyses.
a. In the CONTAIN code, a new flow solver [6] in one flow path improves the calculationresults in a dead-end compartment.
b. Compartment subdividing in dead-end, complex-shaped and gas injection compartmentsallows a better prediction of the experimental results [6,7]. In case of thermal and gasconcentration stratification in the dome compartment, subdividing in the dome could allow abetter prediction of the experimental results [6,9,10].
c. An analysis with a multidimensional code helps the idea of suitable dome compartmentsubdividing [10].
B.3.1.2 Summary
In the M-4-3 test analysis, calculation results generally agreed well with the experimental resultsbecause of the good gas mixing in the containment vessel. Only in the compartments such as dead-end and complex-shaped compartments, was a large discrepancy observed. However, the discrepancywas decreased with adoption of a new analytical model and with user experience.
In the M-8-1 test analyses, CONTAIN and MELCOR both predicted the thermal and condensationstratification phenomena well in the containment vessel. However, the helium concentrations in thelower region were overpredicted, and this overprediction led to slight underestimation of theconcentrations in the dome compartment. (see Section 5.4.1.3 for CONTAIN recalculation ofNUPEC M-8-1 using the hybrid flow solver to improve stratification calculations)
In the test analyses of M-8-2, there were large discrepancies in the gas-released compartments both inhelium concentration and in the temperature of the gas mixture, though CONTAIN and MELCORgenerally predicted the experimental results well, both qualitatively and quantitatively. The dome gastemperatures were underpredicted, and this analysis led a large underestimation of the dome pressure.

282
Figure B.3-1 Compartment dividing examples

283
B.4 PHEBUS-FPT0
B.4.1 JERICHO and TRIO Analyses
The experimental analyses of PHEBUS-FPT0 test [11] were conducted with the JERICHO code,which is a part of ESCADRE system (lumped-parameter code) and with the TRIO-VF code (Fieldmodelling code, calculated by a 3D model) [12,13].
The aim of this 3D simulation was to investigate the circulation flow patterns in the vessel first, tobetter understand the reliability of a lumped-parameter approach of JERICHO [3] thermalhydraulicsand, more particularly, whether or not steam concentration gradients appeared inside the containmentand to help understand the aerosol depletion in the FPT0 test. Because the A TRIO-VF [15]calculation is very much time-consuming, we focused on the most interesting period of theexperimental transient: the major part of the steam injection plateau, by starting the calculation 20min before the hydrogen injection phase, the period of decrease down to the steam injection plateau,and the first 10 min of the latter. After this phase, it can be assumed that the flow pattern isunchanged.
The 0-D (JERICHO code) description of the PHEBUS-FPTO containment leads to a satisfactorysimulation of the PHEBUS FPT0 transient when use is made the Reynolds analogy for thecondensation flow rate calculations (Chilton-Colburn and Collier correlations); for example, shownin Figure B.4.4.1-1 is the comparison of measured and calculated pressure for the experiment. Inparticular, the time history of the condensation flow rate, which in lumped-parameter simulation isonly dependent on the atmosphere-condenser mass transfer coefficient, is well reproduced. Chilton-Colburn and Collier correlations are justified, if one assumes that the Reynolds analogy is applicable;i.e., the heat and mass transfer coupling is negligible. Moreover, their application in the present caseimplies that heat transfer is natural convection driven.
However, during the phase after the hydrogen injection, the condensation flow rate is more reducedthan in the experiment. It is possible that, in the experiment, hydrogen had been stratified in theupper part of the vessel, but no measurement (only one sampling line) sustains this view.
The Uchida correlation fails to reproduce the FPT0 transient. In view of the FPT0 code experimentcomparison, it seems to be not conservative (lowest predicted steam pressure), in opposition to theconclusions drawn in Reference 6 but, as we pointed out, the Uchida correlation prediction isdependent on the steam injection history.
In spite of the complex flow around the condensers, the TRIO-VF calculation shows a mixedconvection flow pattern. Natural convection is dominant in the lower part of the vessel and inportions not facing the condensers. The influence of the jet is dominant in the upper part of thevessel and in portions facing the condensers. The axial velocity along the condensers is similar to theone predicted by natural convection.
B.4.2 Field code analysis of Test FPT0 using GASFLOW
The PHEBUS test FPT0 and the series with the three stationary steam tests (A, B, C) were alsosuccessfully analyzed with the 3D field code GASFLOW [17]. Because the condenser had acontrolled surface temperature, it was not influenced by heat conduction on the condensing surfaces.This behaviour is true also for the outer-vessel wall temperatures that were kept above the dew pointduring this test. Condensation was modelled using the

284
Figure B.4.1.-1 Jericho experiment comparison of FPT0 test total pressure
Reynolds analogy, with a refinement for a condensation enhancement that was due to a reducedthicknesses of the boundary layer at high condensation rates. We used the series A thermalhydraulictests to calibrate the condensation model in GASFLOW. Using this model adjustment, we alsopredicted the pressure levels in the Series B and C thermalhydraulic tests and in test FPT0successfully. The condensation model calibrated with the series A thermalhydraulic test was thenalso successfully applied for the re-analysis of the HDR tests T31.5 and in the analysis of HDR testE11.2.
The PHEBUS test FPT0 was analyzed with GASFLOW for a time interval of 20 000 s starting10 000 s prior to the hydrogen injection. A 3D cylindrical model was developed for a 60° section ofthe containment with 11 radial, 5 azimuthal and 38 axial nodes. GASFLOW predicted the pressuretransient quite well , as shown in Figure B.4.2-1. The prediction of the pressure decay during thereductions of the steam source and its increase during the hydrogen injection are somewhatinfluenced during these phases by a too strong blanketing of the condenser surface with inert gases.Turbulent steam diffusion perpendicular to the main flow direction was underestimated. It wasdifficult to model for the PHEBUS test because the steam–hydrogen source was located in the centreof the vessel. Turbulence was difficult to simulate near the central singularity withthe cylindrical geometry model developed for the PHEBUS containment vessel.
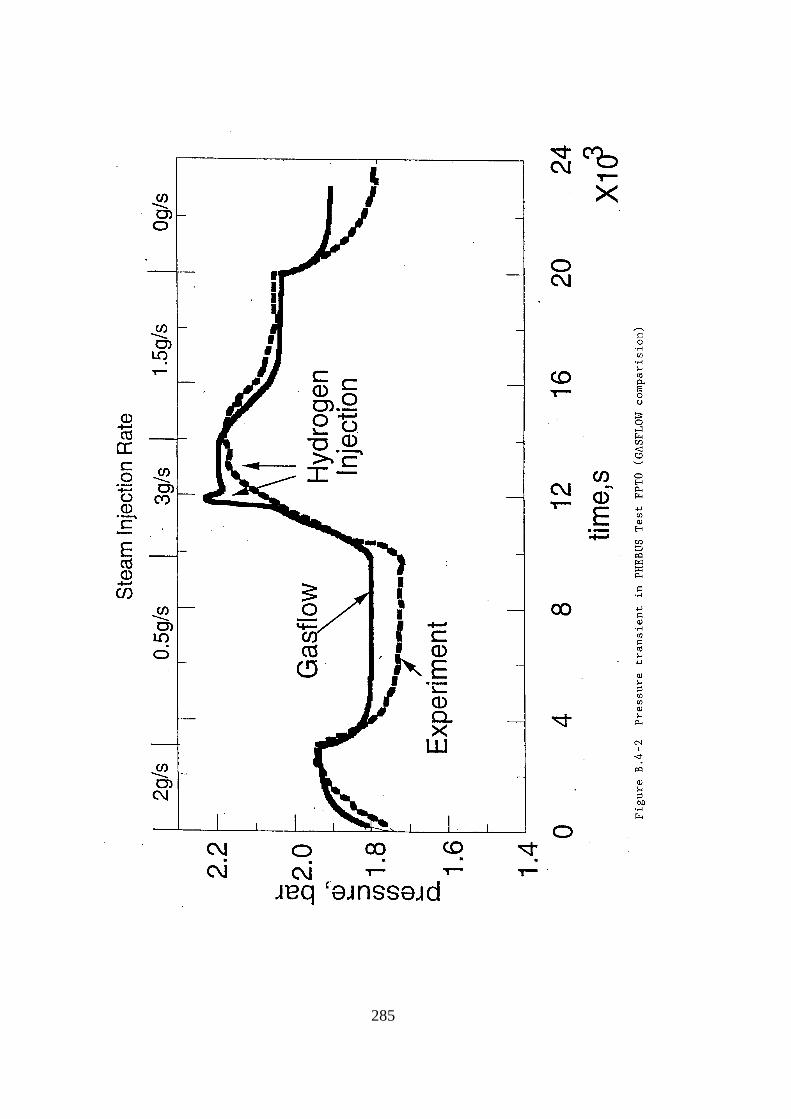
285

286
B.5 NUPEC Experiments M-2-2 [4](relevant separate-effects test)
B.5.1 Comparison between Experimental Results and Calculations
CONTAIN [2] and MELCOR code analyses [7,10] are summarized below.
The objective of NUPEC test M-2-2 was to investigate only the helium gas injection effect on thenatural-circulation phenomena in a test containment vessel, for comparison with the M-4-3 test inwhich helium gas and hot steam were injected simultaneously. The injection location was at arelatively low elevation in the containment vessel, and the injected gas temperature was nearly thesame as that of the containment atmosphere. Therefore, since the driving forces for the naturalcirculation in the containment vessel were only the momentum of the injected gas and its buoyancy, aless-well-mixed environment was observed compared with that of the M-4-3 test results.
Three compartments—CV 8, 15, and 21, which included the helium gas injection compartment—recorded higher concentrations than the remaining compartments. The dead-end and complex-shapedcompartments—CV16, 22, and 1—recorded extremely lower concentrations.
The CONTAIN code predicted (Section B.3.1.1) helium concentration generally well, bothquantitatively and qualitatively. The calculation results of MELCOR code were agreed very well withthose of the test by sub-dividing of compartments CV8, 15, 22 and 1.
A slight concentration stratification in the test was also reproduced well by both two computer codes.
B.5.2 Suggestion and Models
A new flow solver and a noding idea were suggested on the basis of the analyses.
1. A new flow solver [6] in one flow path could improve the calculation results in a dead-endcompartment.
2. Compartment subdividing [7,10] in dead-end, complex-shaped and gas injection compartments
could allow a better prediction of the experimental results.
B.5.3 Summary
In the M-2-2 test analysis, calculation results agreed well with the experimental results because of thenew analytical model or modified noding. Discrepancies, which had been observed in previousNUPEC's experimental analyses, were decreased with adoption of the new analytical model and withuser experience

287
B.6 Acknowledgements
Matt Krause, AECL-WL, translated the table titles and figure captions in this appendix.
B.7 References1. H. Holzbauer, L. Wolf and T. Cron, , Evaluation of Experimental and Analytical Results
of the HDR Hydrogen Distribution Experiments, Auswertebericht Versuche E11.0 - 6,Technischer Fachbericht PHDR 117-94 (Cat 2), February, 1994.
2. L. Wolf and L. Valencia, Results of the PHDR Computational Benchmark Exercise on
Hydrogen Distirbution Experiments E11.2 and E11.4, Proc. of Workshop on HydrogenBehaviour and Mitigation, Brussels, 4/8. March, 1991, EUR 14039en, 1991, 81-95.
3. L. Wolf et al., Comparison between HDR H2-Distribution Experiments E11.2 and E11.4,
Proc. of 19th Water Reactor Safety Information Meeting, Bethesda, USA, October, 1991,NUREG/CP-0119, Vol. 2, April, 1992, 139-168.
4. NUPEC (Nuclear Power Engineering Corporation), Hydrogen Mixing and Distribution
Tests, Summary of Tests and M-2-2,M-4-3,M-7-1,M-8-1 and M-8-2 Test, Extracted fromProving Test on the Reliability for Reactor Containment Vessel, NUPEC Report 1990and 1991 (Document Category 2).
5. J. Ogata et al., NUPEC’s Large Scale Hydrogen Mixing Tests in a Reactor Containment
Vessel (1) Hydrogen Mixing and Distribution Tests, The 3rd JSME/ASME JointInternational Conference on Nuclear Engineering, April, 1995, Kyoto, Japan, 1995,1149-1154
.6. D.W. Stamps, CONTAIN Assessment of the NUPEC Mixing Experiment, SAND94-
2880, October, 1994. 7. H. Tezuka et al., NUPEC’s Large Scale Hydrogen Mixing Tests in a Reactor Containment
Vessel (2) MELCOR Analyses of the Mixing Tests, The 3rd JSME/ASME JointInternational Conference on Nuclear Engineering, April, 1995, Kyoto, Japan, 1995,1155-1159.
8. H. Uchida et al., Evaluation of Post-Incident Systems of Light Water Reactors, the Third
International Conference on Peaceful Uses of Atomic Energy, August, 1964, Geneva,1964.
9. H. Tezuka et al., MELCOR Analyses of NUPEC’s Large Scale Hydrogen Mixing Tests
(II), American Nuclear Society 1995 Winter Meeting, October 28-November 3, 1995,San Francisco, CA, 1995, 497-499.
10. H. Tezuka et al., MELCOR Analyses of NUPEC’s Large Scale Hydrogen Mixing Tests:
M-2-2, M-8-1,M-8-2 (from “Proving Test on the Reliability for Reactor ContainmentVessel, Hydrogen Mixing and Distribution Test), NUPEC report, (Document Category2), 1995.

288
11. P. Von Der Hardt et al., “The PHEBUS FP Severe Accident Experimental Program,Nuclear Safety, Vol. 35, No.2, 1995, 187-205.
12. P. Spitz, V.D. Layly, S.Tirini and A. Mailliat, Analysis of the PHEBUS FPT0
Containment Thermal-hydraulics with the JERICHO and TRIO-VF Code, NuclearEngineering and Design, Vol.166, No.3, November,1996, 413-426.
13. Ch. Gonnier, Preliminary Results of the First PHEBUS FP Test(FPT0), C.S.A.R.P.
Meeting, Washington, 1994. 14. J. Gauvain and J.P. L'Heriteau, ESCADRE System: JERICHO Code Release 2.4,
Reference Document, Technical Report, CEA/IPSN/DEAC/91-05, 1991. 15. V. Barthel and M. Villand, TRIO-VF - Note de Presentation -Version du 07/93, Internal
Report, CEA/DRN/STR/LMDL/93 -169, 1993. 16. A. Dehbi, The Effects of Noncondensable Gases on Steam Condensation under Turbulent
Natural Convection, MIT, Ph.D. thesis, February, 1991. 17. P. Royl, GASFLOW Analysis of the Phebus FPT0 Containment Thermal Hydraulics,
Proc. Jahrestagung Kerntechnik, Nurnberg, Germany, May, 1995.

289
LIST OF AUTHORS
Prof. Dr. Helmut Karwat (Chairman)
Mr. Joël Bardelay (IPSN, France)
Mr. Takashi Hashimoto (NUPEC, Japan)
Mr. Grant W. Koroll (AECL–WL, Canada)
Mr. Matt Krause (AECL–WL, Canada)
Dr. Jean-Pierre L’Hériteau (IPSN, France)
Ms. Petra Lundström (IVO, Finland)
Mr. Allen Notafrancesco (USNRC, USA)
Dr. Peter Royl (FZK, Germany)
Mr. Bernd Schwinges (GRS, Germany)
Ms. Hiroko Tezuka (NUPEC, Japan)
Mr. Jack Tills (JTA, USA)
Secretariat:
Dr. Jacques Royen (OECD/NEA)

290
LIST OF ABBREVIATIONS
Acronym: Definition:
ALWR ADVANCED LIGHT-WATER REACTOR
ASM ANALYTICAL SIMULATION MODEL
ATWS ANTICIPATED TRANSIENTS WITHOUT SCRAM
BE BEST ESTIMATE
BMC BATTELLE MODEL CONTAINMENT
BWR BOILING WATER REACTOR
CEA COMMISSARIAT À L`ÉNERGIE ATOMIQUE
CEC COMMISSION OF THE EUROPEAN COMMUNITIES
CFD COMPUTATIONAL FLUID DYNAMICS
CSNI COMMITTEE ON THE SAFETY OF NUCLEAR INSTALLATIONS
DBA DESIGN-BASIS ACCIDENT
DCH DIRECT CONTAINMENT HEATING
DDT DEFLAGRATION-DETONATION TRANSITION
ECCS EMERGENCY CORE-COOLING SYSTEM
EDF ÉLECTRICITÉ DE FRANCE
EPRI ELECTRIC POWER RESEARCH INSTITUTE
FAI FAUSKE & ASSOCIATES, INC.
GE GENERAL ELECTRIC
GPR GROUPE PERMANENT DES REACTEURS (FRANCE)
GRS GESELLSCHAFT FÜR ANLAGEN- UND REAKTORSICHERHEIT
(Company for System and Reactor Safety)
HDR DECOMMISSIONED HIGH TEMPERATURE REACTOR PLANT
HEDL HANFORD ENGINEERING DEVELOPMENT LABORATORY
HPME HIGH PRESSURE CORE MELT EJECTION
IET INTEGRATED-EFFECTS TEST
IPSN INSTITUT DE PROTECTION ET DE SÛRÉTE NUCLÉAIRE
ISP INTERNATIONAL STANDARD PROBLEM
KWU KRAFTWERKUNION
LP LUMPED PARAMETER
LBLOCA LARGE-BREAK LOSS-OF-COOLANT ACCIDENT
LOCA LOSS-OF-COOLANT ACCIDENT

291
LWR LIGHT-WATER REACTOR
MCCI MOLTEN CORE-CONCRETE INTERACTION
NEA NUCLEAR ENERGY AGENCY (OF OECD)
NPP NUCLEAR POWER PLANT
NUPEC NUCLEAR POWER ENGINEERING CORPORATION
ODE ORDINARY DIFFERENTIAL EQUATION
OECD ORGANISATION FOR ECONOMIC COOPERATION AND DEVELOPMENT
PAR PASSIVE AUTOCATALYTIC RECOMBINER
PDE PARTIAL DIFFERENTIAL EQUATION
PHWR PRESSURIZED HEAVY-WATER REACTOR
PIRT PHENOMENA IDENTIFICATION AND RANKING TABLE
PRA PROBABILISTIC RISK ASSESSMENT
PSA PROBABILISTIC SAFETY ANALYSIS
PWR PRESSURIZED-WATER REACTOR
RSK REAKTORSICHERHEITSKOMMISSION (GERMANY)
SAC SEVERE ACCIDENT PHENOMENA IN CONTAINMENT (Task Group)
SBLOCA SMALL-BREAK LOSS-OF-COOLANT ACCIDENT
SET SEPARATE-(OR SINGLE) EFFECTS TEST
SNL SANDIA NATIONAL LABORATORIES
SOAR STATE-OF-THE-ART REPORT
USNRC UNITED STATES NUCLEAR REGULATORY COMMISSION
VVER SOVIET-DESIGNED PRESSURIZED WATER REACTOR(voda vodynoy energiticheskie reactor)