Embed Size (px)
Citation preview
International Gas Union Research Conference, Copenhagen, 2014
State of the Art and Perspectives of CO2 Methanation Process
Concepts for Power-to-Gas Applications
Paper Code: TO5-4 Abstract ID: 325
Authors: Manuel Götz, Amy McDaniel Koch, Frank Graf
DVGW Research Center at the Engler-Bunte-Institut of the Karlsruhe Institute of Technology (KIT), Engler-Bunte-Ring 1, 76131 Karlsruhe, Germany
Abstract
In a highly interconnected energy system power to gas might play an increasingly significant
role. Renewable electric energy can be transformed into a storable and save chemical energy
carrier via electrolysis and methanation. The existing gas grid infrastructure can be used for
energy storage and transportation.
Thermochemical methanation means the conversion of H2 and CO2 at about 300 - 550 °C
usually with nickel-based catalysts. Thermochemical methanation processes can be realized in
several reactor concepts. Mainly, these can be subdivided by the nature of the support (e. g.
honey combs or pellets), the temperature control (e. g. isothermal or adiabatic) or the phases
involved in methanation (two phase vs. three phase reactions).
Another approach is the biochemical conversion. A microorganism serves as biocatalyst. The
bioprocess takes place in aqueous solutions at temperatures between 40 - 70 °C. As limiting
step, the transfer of hydrogen from gas phase into the liquid phase is named in literature. Hence,
there are several reactor concepts under development aiming to reduce these mass transfer
limitations. So far the stirred fermenter is the mostly used reactor.
Mainly due to the higher process temperature and the resulting higher reaction velocity,
thermochemical methanation requires much lower reactor volumes for a certain feed gas flow
than biochemical methanation. However, full CO2-conversion in a single step thermochemical
methanation reactor cannot be achieved due to thermodynamic equilibrium limitations.
Therefore, especially for small scale applications biochemical methanation can be
advantageous.
Both thermochemical and biochemical methanation processes will be figured in the paper. The
main characteristics of the processes with advantages and challenges will be discussed as well
as the state of development.

IGRC 2014 Paper Code: TO5-4
1
1 Introduction The Power-to-Gas (PtG) process chain could play a significant role in the future energy system.
By utilizing this Power-to-Gas pathway, electrical energy from renewable resources can be
converted into storable chemical energy carriers (i.e. methane). E.g. Germany has a well-
developed gas grid infrastructure that can be used to both store and transport hydrogen and
synthetic natural gas produced in PtG processes [1]. In comparison to traditional methanation
processes where hydrogen is supplied by a gasifier, in PtG the hydrogen comes from an
electrolysis plant which uses excess electrical energy to split water into hydrogen and oxygen.
Then, the hydrogen, together with CO2, is fed into a methanation reactor. For the methanation
process, two possible process concepts exist: biological and thermochemical methanation. This
paper will focus on the advantages of these two methods of CO2 methanation and their possible
application in the PtG process chain. The produced methane is then upgraded until it reaches
the gas grid appropriate calorific value, and is then injected into the natural gas grid where it can
be stored long-term. The first PtG power plants from ETOGAS for Audi AG in Wertle, Germany
were focused on thermochemical methanation applying a tube bundle reactor [2, 3]. However,
alternative process pathways (three phase thermochemical methanation and biochemical
methanation) are currently under development and are being specifically optimized to the
requirements of a PtG process chain.
2 Biological Methanation
2.1 Process Overview
Biological methanation is an intriguing option for the PtG process chain. A microorganism serves
as a biocatalyst, converting the hydrogen and carbon dioxide into methane. This biological
reaction has been known since 1906 [4], however, the technical implementation is still an issue.
Biological methanation (BM) proceeds at low temperatures (40 to 70 °C), which makes the
process simpler, an advantage for small plants. Additionally, the microorganisms also have a
high tolerance for the impurities that are typically found in the types of gases that are used as
feed gas for methanation. Such impurities include the sulphur and ammonia that come from the
CO2 source (i.e. biogas) and the oxygen that comes from the electrolysis process. Moreover,
load change is, based on current state, a non-issue for biological methanation. This is ideal for
the large fluctuations in power supply from renewable resources. However, because the
microorganisms are present in a fermentation broth and the methanation reaction takes place
within the aqueous solution (hydrogen is poorly soluble in the liquid); the supply of hydrogen to
the microorganisms presents the biggest engineering challenge. Thus, several reactor concepts
are currently being developed to specifically reduce these mass transfer limitations. Mostly,
continuous stirred-tank reactors (CSTR) are used. By increasing the stirrer frequency, the mass
transfer of H2 can be improved. In other concepts such as trickle beds and membrane reactors,
the microorganisms are immobilized. An important parameter for evaluating the process
efficiency is the specific methane formation rate MFR. It depends, among other things, on the
microorganisms, the reactor type, the pressure, the pH-value, and the temperature.

IGRC 2014 Paper Code: TO5-4
2
Two principle process types are possible for biological methanation: methanation in situ digester
(Figure 1) and methanation in a separate reactor (Figure 2). Both the in situ and extern process
concepts were investigated by MicrobEnergy GmbH [5] and the extern process concept was
investigated by Krajete GmbH [6]. The investigations from both MicrobEnergy GmbH and
Krajete GmbH were carried out within the framework of the DVGW project G 3/01/13 designed
to determine the potential of biological methanation in comparison to thermochemical
methanation.
Figure 1: Process flow diagram for in situ variation of biological methanation (BM: Biological methanation)
Figure 2: Process flow diagram for biological methanation with a separate reactor (extern)
2.2 In situ biological methanation
Digesters of biogas plants can be used for the PtG process chain. Thereby, hydrogen is fed
directly to the biogas digester. A part or all of the produced CO2 is then in situ converted to CH4
resulting in a biogas with a higher methane content and calorific value. The methane formation
rate of the biological methanation is limited by the CO2 production rate of the biogas plant,
therefore only small MFRs of < 0.1 h-1 are possible. Nevertheless, no further reactor is
necessary resulting in a low investment. A total conversion of the produced CO2 is very difficult.
For biogas plants using energy crops as feedstock, the methane content can be increased from
52 to 75 %. In biogas plants using residues, a methane content of more than 97 % can be
achieved (both values are reported by MicrobEnergy GmbH, Germany).
Current research focuses on testing the ability of biogas plants for hydrogen addition. Another
issue is to achieve a high gas liquid mass transfer of H2 in the digester.
IGRC 2014 Paper Code: TO5-4
3
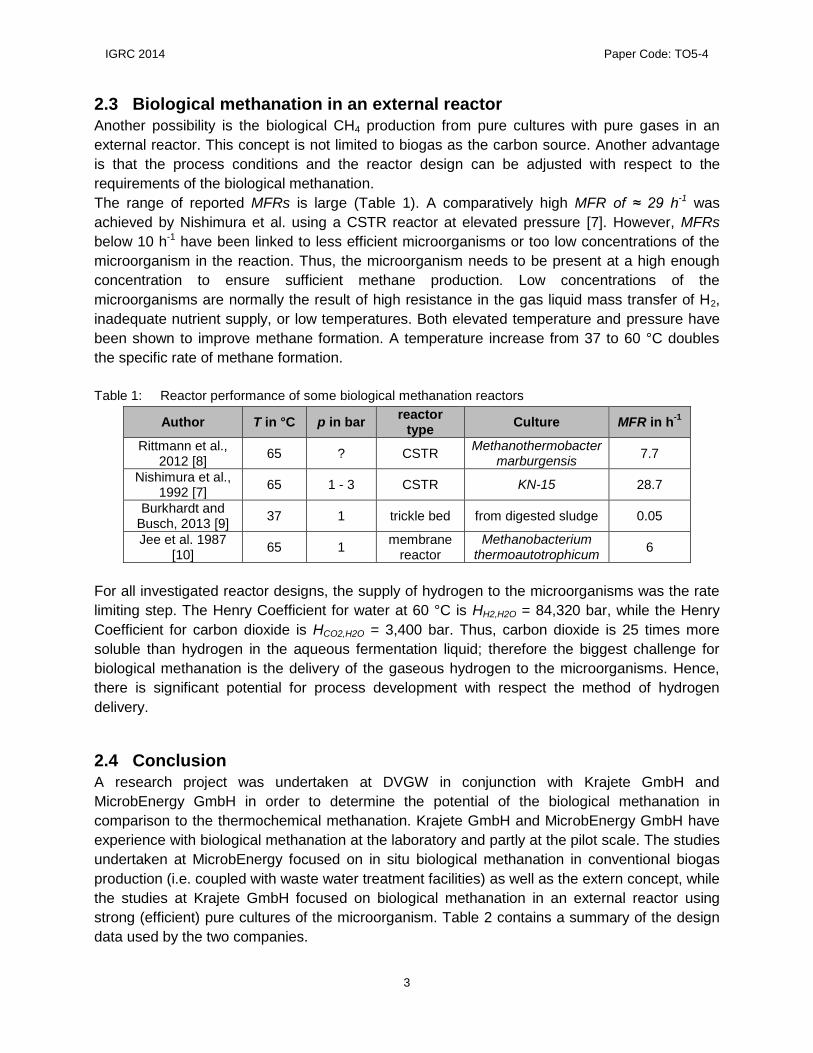
2.3 Biological methanation in an external reactor
Another possibility is the biological CH4 production from pure cultures with pure gases in an
external reactor. This concept is not limited to biogas as the carbon source. Another advantage
is that the process conditions and the reactor design can be adjusted with respect to the
requirements of the biological methanation.
The range of reported MFRs is large (Table 1). A comparatively high MFR of ≈ 29 h-1 was
achieved by Nishimura et al. using a CSTR reactor at elevated pressure [7]. However, MFRs
below 10 h-1 have been linked to less efficient microorganisms or too low concentrations of the
microorganism in the reaction. Thus, the microorganism needs to be present at a high enough
concentration to ensure sufficient methane production. Low concentrations of the
microorganisms are normally the result of high resistance in the gas liquid mass transfer of H2,
inadequate nutrient supply, or low temperatures. Both elevated temperature and pressure have
been shown to improve methane formation. A temperature increase from 37 to 60 °C doubles
the specific rate of methane formation.
Table 1: Reactor performance of some biological methanation reactors
Author T in °C p in bar reactor
type Culture MFR in h
-1
Rittmann et al., 2012 [8]
65 ? CSTR Methanothermobacter
marburgensis 7.7
Nishimura et al., 1992 [7]
65 1 - 3 CSTR KN-15 28.7
Burkhardt and Busch, 2013 [9]
37 1 trickle bed from digested sludge 0.05
Jee et al. 1987 [10]
65 1 membrane
reactor Methanobacterium
thermoautotrophicum 6
For all investigated reactor designs, the supply of hydrogen to the microorganisms was the rate
limiting step. The Henry Coefficient for water at 60 °C is HH2,H2O = 84,320 bar, while the Henry
Coefficient for carbon dioxide is HCO2,H2O = 3,400 bar. Thus, carbon dioxide is 25 times more
soluble than hydrogen in the aqueous fermentation liquid; therefore the biggest challenge for
biological methanation is the delivery of the gaseous hydrogen to the microorganisms. Hence,
there is significant potential for process development with respect the method of hydrogen
delivery.
2.4 Conclusion
A research project was undertaken at DVGW in conjunction with Krajete GmbH and
MicrobEnergy GmbH in order to determine the potential of the biological methanation in
comparison to the thermochemical methanation. Krajete GmbH and MicrobEnergy GmbH have
experience with biological methanation at the laboratory and partly at the pilot scale. The studies
undertaken at MicrobEnergy focused on in situ biological methanation in conventional biogas
production (i.e. coupled with waste water treatment facilities) as well as the extern concept, while
the studies at Krajete GmbH focused on biological methanation in an external reactor using
strong (efficient) pure cultures of the microorganism. Table 2 contains a summary of the design
data used by the two companies.

IGRC 2014 Paper Code: TO5-4
4
From Table 2, differences between design data for the experimental investigations performed by
the two companies can be observed. In particular, the MFR and the electrical energy demand
should be noted. This strong microorganism used by Krajete accounts for the high MFRs from
Krajete GmbH. The high MFRs may also be due to effective introduction of the gas. However, it
remains to be seen whether or not these high MFRs can be achieved at a larger scale, in
particular regarding the power demand. The higher energy demand reported by MicrobEnergy
(especially for the in situ variation), is due to the difficulty of introducing the gas into the
fermentation liquid. Here, the gas is not agitated by a stirrer; instead the gas is introduced via
two phase pump. Lastly, the investment costs for the extern variation are 1.5 x that of the in situ
variation, which is due to the extra process equipment necessary for the extern variation.
It can be concluded that from the work within the framework of this project, that biological
methanation is promising as part of a PtG process chain. This possibility of integration into
existing biogas or waste water plants, as well as the flexibility and robustness of the system
make biological methanation an interesting option, especially for smaller systems. Further
development is still necessary at the pilot scale, as well as improved introduction of the gas.
Table 2: Design data used by the two companies in the study: MicrobEnergy investigated both in situ
and extern concepts while Krajete only investigated extern concepts
MicrobEnergy
GmbH (in situ)
MicrobEnergy GmbH
(extern) Krajete GmbH
MFR in h-1
0.01 (in situ) 2.5 (extern) 11.2 – 22.4
GHSV in h-1
0.05 10.5 56 – 112
H2-Conversion XH2 in % 99 99 99
T in °C 40 65 65
p in bar 1 9 4
Process Materials buffer solution substrate,
buffer solution nutrient solution, buffer solution
Electrical Energy Demand in kWh/m3
SNG 1.8 (in situ) 1.2 - 1.3
0.3 - 0.4 (based on lab scale plant)
Specific Investment Cost for a 5 MW SNG Plant in €/kWh SNG
≈ 400 ≈ 600 ≈ 600
3 Thermochemical Methanation Thermochemical methanation is defined as the conversion of hydrogen and either CO or CO2 to
CH4 in the presence of catalyst (usually nickel-based). Typical operating conditions are
temperatures in the range of 300 to 550 °C and pressures from 1 to 100 bar. Beside others, the
following process concepts for thermochemical methanation exist [11]: fixed bed methanation,
fluidized bed methanation, and three phase methanation. The advantages and challenges of
each of these processes (with respect to PtG) will be described in the following sections.
3.1 Fixed Bed Methanation (FB)
Currently, adiabatic fixed bed methanation is state of the art and the most widely adopted
method of thermochemical methanation. In fixed bed methanation, the reactor is packed with the
catalyst with a particle size in the range of millimetres. The primary challenge in fixed bed

IGRC 2014 Paper Code: TO5-4
5
methanation is the temperature control in the reactor, which is a result of the extremely
exothermic methanation reaction. Reaction temperatures above 550 °C can cause catalyst
deactivation by sintering and need to be avoided. Furthermore, the methane conversion is
limited by the thermodynamic equilibrium at temperatures above ≈ 300 °C (depends on
pressure, Figure 3). Therefore, several reactors in series with interstage cooling are used. Some
concepts use recycle streams, additionally.
Well know concepts include the Lurgi process, which is used at the first commercial methanation
plant in North Dakota [12], and the TREMP process from Haldor Topsøe which is used in coal-
to-gas plants in China [13] and for the biomass-to-gas plant GoBiGas in Sweden [14, 15]. The
methanation reactor used in the Werlte plant (see section 1) is based on an isothermal
methanation [2, 3].
Figure 3: Equilibrium calculations for methanation (feed gas: H2/CO2/CH4 = 4/1/1)
3.2 Fluidized Bed Methanation
As an alternative to fixed bed methanation, fluidized bed reactors are also established
technologies for methanation, well suited for large scale operation. As an example, the Comflux
process was developed by Engler-Bunte-Institut in conjunction with Thyssengas GmbH from
which a demonstration plant was built to produce 2,000 m3/h SNG [16]. In 2009, the Comflux
process was used to produce SNG from solid biomass in a 1 MW plant in Güssing, Austria [14].
In fluidized bed methanation, fine catalyst particles are fluidized by the gaseous reactants. Due
to the uniform mixing of the fluidized solids in the gas, the heat removal is more effective
creating nearly isothermal conditions in the reactor. This is advantageous because it enables the
use of a single reactor with a relatively simple design. Negative aspects of this process include
attrition and breakage of the catalyst. Incomplete conversion due to bubbling is also an issue.
3.3 Three Phase Methanation (3PM)
In three phase methanation (Figure 4), a solid catalyst (powder < 100 µm) is suspended in a
temperature stable inert liquid such as dibenzyltoluene. The first three phase methanation
concept was developed by Chem Systems, Inc. from 1975 – 1981. The concept was based on a

IGRC 2014 Paper Code: TO5-4
6
three phase fluidized bed [17]. Currently, the three phase methanation in a slurry bubble column
reactor is under investigation at laboratory scale at the Engler-Bunte-Institut, Germany [18, 19]
and at the Institute of Coal Chemistry, China [20]. Good heat dissipation of the reaction is a
significant advantage for this method, as it allows for good heat control of the reaction. This is
especially beneficial in the PtG process, since the high heat capacity of the liquid phase makes it
easier for the methanation process to handle the fluctuations/downtime. Moreover, the catalyst
can be replaced during operation. However, a major disadvantage of the three phase
methanation is the liquid side mass transfer limitation, which reduces the effective reaction rate.
Further information on the three phase methanation can be found elsewhere.
Slurry bubble column20 bar
300 - 350 °C
H2
CO/CO2
SNG
H2O
boiler
feedwater
gasbubbles
liquid +catalyst
cooling tube
Liquid:Dibenzyltoluene (DBT)
Catalyst:Ni-based (size < 100 µm)
vapor
Figure 4: Schematic diagram of the three phase reactor concept
In any kind of bubble column, a minimum gas velocity is necessary to fluidize the solid particles.
A gas velocity that is too low prohibits a homogeneous distribution of the catalyst particles, may
reducing the overall conversion. Based on own calculations, a minimum load of less than 20 %
is necessary. Unlike fixed bed methanation, 3PM is tolerant of rapid load change. A load change
from 25 to 100 % takes only about 10 minutes to achieve steady state (Figure 5). Furthermore,
the time needed for load changes is only a function of the gas residence time. The reactor
hydrodynamics and reaction kinetics are not the limiting factors. This is a promising finding
regarding the flexibility of the slurry bubble column for methanation purpose.
Figure 5: Required time for a load change from 25 to 100% in a three phase methanation reactor
IGRC 2014 Paper Code: TO5-4
7
4 Comparison of Biological and Thermochemical Methanation A further aspect of the DVGW study was a comparison of the biochemical and thermochemical
methanation. Data for the biological methanation was taken from experimental investigations
from Krajete GmbH and MicrobEnergy GmbH and the data for thermochemical methanation was
taken from our own investigations at the DVGW Research Center at Engler-Bunte-Institut (KIT)
as well as from Outotec GmbH.
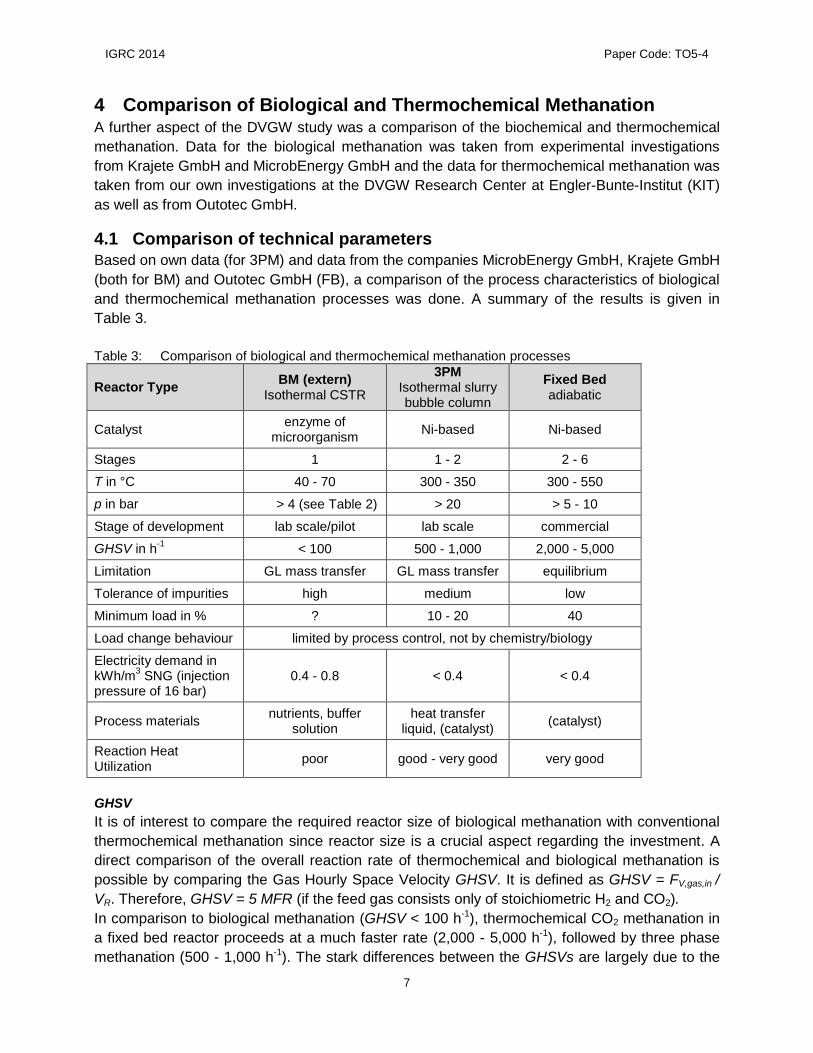
4.1 Comparison of technical parameters
Based on own data (for 3PM) and data from the companies MicrobEnergy GmbH, Krajete GmbH
(both for BM) and Outotec GmbH (FB), a comparison of the process characteristics of biological
and thermochemical methanation processes was done. A summary of the results is given in
Table 3.
Table 3: Comparison of biological and thermochemical methanation processes
Reactor Type BM (extern)
Isothermal CSTR
3PM Isothermal slurry bubble column
Fixed Bed adiabatic
Catalyst enzyme of
microorganism Ni-based Ni-based
Stages 1 1 - 2 2 - 6
T in °C 40 - 70 300 - 350 300 - 550
p in bar > 4 (see Table 2) > 20 > 5 - 10
Stage of development lab scale/pilot lab scale commercial
GHSV in h-1
< 100 500 - 1,000 2,000 - 5,000
Limitation GL mass transfer GL mass transfer equilibrium
Tolerance of impurities high medium low
Minimum load in % ? 10 - 20 40
Load change behaviour limited by process control, not by chemistry/biology
Electricity demand in kWh/m
3 SNG (injection
pressure of 16 bar) 0.4 - 0.8 < 0.4 < 0.4
Process materials nutrients, buffer
solution heat transfer
liquid, (catalyst) (catalyst)
Reaction Heat Utilization
poor good - very good very good
GHSV
It is of interest to compare the required reactor size of biological methanation with conventional
thermochemical methanation since reactor size is a crucial aspect regarding the investment. A
direct comparison of the overall reaction rate of thermochemical and biological methanation is
possible by comparing the Gas Hourly Space Velocity GHSV. It is defined as GHSV = FV,gas,in /
VR. Therefore, GHSV = 5 MFR (if the feed gas consists only of stoichiometric H2 and CO2).
In comparison to biological methanation (GHSV < 100 h-1), thermochemical CO2 methanation in
a fixed bed reactor proceeds at a much faster rate (2,000 - 5,000 h-1), followed by three phase
methanation (500 - 1,000 h-1). The stark differences between the GHSVs are largely due to the

IGRC 2014 Paper Code: TO5-4
8
much higher process temperatures, 300 to 550 °C for thermochemical methanation versus 40 to
70 °C for biochemical methanation. Because gas liquid mass transfer limitations are non-existent
in the fixed bed reactor, this reactor type achieves the highest GHSV.
Another disadvantage of the biological methanation is the higher backmixing in gas and liquid
phase resulting in a lower overall reaction rate. The backmixing in the three phase methanation
is moderate while in fixed bed reactors, almost no backmixing is present.
Tolerance of Impurities
Biological methanation is more robust against impurities than thermochemical methanation. For
biological methanation, process upset or infection from foreign organisms was not found to be
an issue. This is especially the case for process setups when the biological methanation takes
place in a separate reactor. Minor disruptive components such as sulphur and oxygen were
found to have no effect on the biological methanation. Furthermore, both of these components
can partly be removed by biological methanation. The remaining sulphur components have to be
removed before the gas injection.
Contrastingly, sulphur and sulphur containing components are a known catalyst poison for the
Nickel catalysts used for thermochemical methanation. Thus, the feed gas for thermochemical
methanation process must be cleaned upstream of the methanation reactor(s). In case of fixed
bed reactors, higher hydrocarbons are also an issue since they decompose at temperatures
above ≈ 500 °C forming coke. The deposited coke leads to catalyst deactivation [21].
Process Flexibility and Minimum Load
For methanation to be operated dynamically as part of a PtG chain, both the minimum load rate
and the load change rate need to be considered. A more flexible methanation reactor reduces
the costs for upstream storage of hydrogen significantly. Since hydrogen storage is a high cost
factor, minimization of this process factor is crucial.
Biological methanation is a flexible process with respect to load change. Krajete GmbH
experimentally demonstrated in a lab scale biological methanation process that an immediate
load change from 100 to 0 % can be realised with no negative effect on the process. It was also
demonstrated that a restart following a 560 h (23 d) of stagnant operation was also possible
without harmful consequences.
The catalyst in the thermochemical methanation reacts very fast to load changes, too. It is
reported that fast load changes can damage the methanation catalyst; however, our own
measurements as well as measurements from Outotec GmbH and ZSW Stuttgart [22] have
shown that dynamic operation has no negative effect on the CO2 methanation catalyst.
For biological as well as for thermochemical methanation, the limiting factor for load changes is
related to the process control system and not to the process itself.
The minimum load of biological methanation is unknown. For fixed bed reactors, a minimum load
rate of 40 % is recommended. Lower minimum loads could be possible with special reactor
designs. Three phase methanation can operate within a larger load range. A minimum load of
less than 10 - 20 % is necessary for homogeneous distribution of the catalyst in the heat transfer
oil. Minimum loads of less than 10 % should be possible, too. However, this needs to be
evaluated in a demo scale process.

IGRC 2014 Paper Code: TO5-4
9
Current state of development
Currently, biological methanation and three phase methanation have only been investigated at
the laboratory scale; the former is currently being tested at the pilot/demo scale. Thus, data and
experiences from commercial operations are not available at this time. A challenge of the BM is
the adequate mixing of a large scale biological reactor with respect to hydrogen supply. The
crucial part of the upscaling of 3PM is the backmixing behaviour in large scale reactors.
In contrast, FB methanation is well established in commercial industry (see section 3.1).
4.2 Energy efficiency
Power Requirements
All of the thermochemical methanation processes have a lower power requirement than the
biological methanation. The high power demands are due to the mass transfer limitations that
are present in the biological methanation. A stirrer or some kind of agitation mechanism is
needed to effectively introduce the gas into the liquid phase. Although, three phase methanation
is also subject to mass transfer limitations, the mass transfer in this case is better than that for
the biological methanation. For three phase methanation, the elevated temperature increases
the solubility of the H2 in the heat transfer oil, the mass transfer coefficient, and increases the
phase boundary by reducing the viscosity and the surface tension. For example, the solubility of
H2 in the heat transfer oil of the 3PM at 300 °C is approximately 6 times higher than the solubility
of H2 in water at 65 °C. As a consequence, a stirrer is not required; instead the dispersion of the
gas throughout the reactor occurs using the gas sparger that is present at the bottom of the
reactor.
Efficiency of Power-to-SNG and Utilization of waste heat
The energy efficiency of the PtG chain is ηPtG,PE ≈ 53 % (electrolysis + BM) if the electricity
demand of the BM is considered. The energy efficiency is calculated using Eq. 1.
Eq. 1
PSNG is the chemical energy of the SNG produced, Pel,Ely is the electrical power required for the
electrolysis process, and Pel,Meth is the electrical power required for the methanation. By using
the waste heat of the biological methanation for heating of the biogas digester (420 kW for a 5
MW plant), the overall efficiency is increased to 58 %. Further opportunities for utilization of the
waste heat from biological methanation are sparse due to the low temperature level (< 65 °C),
which yield few potential uses.
The higher temperature level (at least 300 °C) of the thermochemical methanation yields more
opportunities for integration/utilization of the waste heat streams. Relatively high valuable steam
and power could be produced, respectively. If the waste heat streams are utilized in a PtG
process chain with thermochemical methanation, then the overall efficiency is between 74 and
82 %. An example with an overall efficiency of > 80 % for a 5 MW SNG PtG plant is given in
Figure 6. However, the utilization of waste heat increases the investment of the methanation
plant; especially the gas turbine is expansive. For a 5 MW SNG plant, the investment is
increased by ≈ 30 % if the waste heat streams are used as given in Figure 6.

IGRC 2014 Paper Code: TO5-4
10
DigesterDesulphuriz-
ationCO2
removalDrying
Injection(16 bar)
Methanation
Electrolyser(Pel = 10 MW)
520 m3/hCH4
1880 m3/h H2
Pth = 1.75 MW
Pth
= 4
20
KW 470 m3/h CO2
Pth = 650 KW1)P
th =
71
KW
Pth
= 5
50
kW
Pth = 250 kW
H2O816 kg/h
SNG990 m3/h
O2
digestate
Biomass
Biomass / Biogas
CO2
H2
O2
Methane / SNG
H2O
Heat
Figure 6: Heat integration for thermochemical methanation (
1) to steam turbine)
4.3 Economics
As mentioned in section 2, the in situ variation of biological methanation has lower investment
costs than the extern variation. Due to the process similarities, it is of interest to compare the
investment costs for “extern” variation of biological methanation with thermochemical
methanation. Figure 7 compares the costs for a 5 MW and 110 MW SNG plants for
thermochemical methanation (fixed bed) and biological methanation (3,000 h of operation,
electricity costs of 5 ct/kWh). In the cases shown, the added influence of the hydrogen
production (electrolysis) costs are considered and compared with the costs for the methanation
process only. For biological and thermochemical methanation, the costs for hydrogen production
are well above the costs for SNG; which increases the specific production costs significantly.
Moreover, for the smaller plant size (5 MW) the production costs for biological methanation are
only slightly higher than for thermochemical methanation. When the costs for electrolysis are
considered the difference is negligible. However, for larger plant sizes (110 MW), the
methanation production costs for biological methanation are nearly 2.5 times that of
thermochemical methanation. Thus, it can be concluded that when only the methanation based
SNG production costs are considered, biological methanation is more attractive for smaller
plants sizes. However, for all cases considered the costs for hydrogen production are still the
most significant contributor to the overall SNG production costs.

IGRC 2014 Paper Code: TO5-4
11
In future, the hydrogen storage needs to be taken into account, too. However, the required
storage capacity depends on the flexibility of the methanation process which is under
investigation.
Figure 7: Comparison of specific investment cost for methanation based on capacity and type of
methanation (H2 storage not considered)
5 Conclusion Both biological and thermochemical methanation processes have potential for integration into
the Power-to-Gas process chain. Biological methanation is ideal for its simple process design
and tolerance of gas impurities. However, the slower reaction times, higher power requirements,
and lack of options for utilization of the waste heat stream are disadvantages leading to a lower
process efficiency than for thermochemical methanation. However, biological methanation is an
attractive option for small plants and impure gas feeds. On the other hand, thermochemical
methanation is attractive for its high reaction rates. Moreover, the high temperature level of
thermochemical methanation results in more options for process integration, which yields more
efficient processes. Biological methanation is currently being tested at the pilot and
demonstration scale, results from these processes are necessary in order to gain more practical
experience for further development.

IGRC 2014 Paper Code: TO5-4
12
6 Symbols and Abbreviations
Symbols
Symbol Unit Name
FV m3/h Volume flow at STP
GHSV h-1
Gas Hourly Space Velocity
Hi,j bar Henry coefficient of gas i in liquid j
MFR h-1
Methane formation rate (FV,CH4,out / VR)
η - Efficiency
Pel kW Electrical power
PSNG kW Chemical power in the SNG produced
Pth kW Thermal power
p bar Pressure (absolute)
T °C Temperature
t min Time
VR m³ Reactor volume
Xi - Conversion of component i
yi - Mole fraction of i in gas phase
Abbreviations
3PM Three phase methanation
BM Biological methanation
CSTR Continuous stirred-tank reactor
Ely Electrolysis
GL Gas liquid
Meth Methanation
PtG Power-to-Gas
SNG Substitute natural gas
ZSW Zentrum für Sonnenenergie- und Wasserstoff-Forschung Baden-Württemberg
7 Literature 1. Graf, F., M. Götz, and S. Bajohr, Injection of biogas, SNG and hydrogen into the gas grid.
gwf-Gas Erdgas, International issue 2011. 2(1): p. 30-40. 2. Rieke, S., Erste industrielle Power-to-Gas-Anlage mit 6 Megawatt gwf - Gas|Erdgas,
2013. 154(9): p. 660-664. 3. Kurt, O., T. Götze, and J.A. Schönrock, Das e-gas-Projekt am Biogasanlagenstandort in
Werlte gwf - Gas|Erdgas, 2014. 155(5): p. 304-309. 4. Söhngen, N.L., Het ontstaan en verdwijnen av waterstof en methan, 1906, Universität
Delft: Delft. 5. Viessmann. Storing excess power in the gas grid. 2013 [cited 2014 04.08.2014];
Available from: https://www.viessmann.com/com/content/dam/internet-global/pdf_documents/com/brochures_englisch/MicrobEnergy_power-to-gas.pdf.
6. Rittmann, S., A. Seifert, and C. Herwig, Essential prerequisites for successful bioprocess development of biological CH4 production from CO2 and H2. Critical Reviews in Biotechnology, 2013.
7. Nishimura, N., et al., Cultivation of thermophilic methanogen KN-15 on H2-CO2 under pressurized conditions. Journal of Fermentation and Bioengineering, 1992. 73(6): p. 477-480.

IGRC 2014 Paper Code: TO5-4
13
8. Rittmann, S., A. Seifert, and C. Herwig, Quantitative analysis of media dilution rate effects on Methanothermobacter marburgensis grown in continuous culture on H2 and CO2. Biomass and Bioenergy, 2012. 36(0): p. 293-301.
9. Burkhardt, M. and G. Busch, Methanation of hydrogen and carbon dioxide. Applied Energy, 2013. 111(0): p. 74-79.
10. Jee, H.S., et al., Biomethanation of H2 and CO2 by Methanobacterium thermoautotrophicum in membrane and ceramic bioreactors. Journal of Fermentation Technology, 1987. 65(4): p. 413-418.
11. Kopyscinski, J., T.J. Schildhauer, and S.M.A. Biollaz, Production of synthetic natural gas (SNG) from coal and dry biomass – A technology review from 1950 to 2009. Fuel, 2010. 89(8): p. 1763-1783.
12. Miller, W.R., et al., Great Plains Coal Gasification Plant Start-Up and Modification Report, F.T. Inc., Editor 1986: Irvine, CA.
13. Topsøe, H. Topsoe awarded the third coke oven gas to SNG plant in China. 2012 03.01.2012 24.01.2014]; Available from: http://www.topsoe.com/Media/News/2012/030112.aspx.
14. Aichernig, C. The GoBiGas Project. in 2nd Nuremberg Workshop: Methanation and Second Generation Fuels. 2014. Nuremberg
15. Gunnarsson, I. Efficient transfer of biomass to bio-SNG of high quality: The GoBiGas-project. in Nordic Baltic BIOENERGY. 2013. Oslo.
16. Hedden, K., et al., Forschungsbericht T 86-044 - Gleichzeitige Konvertierung und Methanisierung von CO-reichen Gasen, in Technologische Forschung und Entwicklung – Nichtnukleare Energietechnik, B.f.F.u. Technologie, Editor 1986, DVGW-Forschungsstelle am Engler-Bunte-Institut der Universität Karlsruhe.
17. Blum David, B., B. Sherwin Martin, and E. Frank Marshall, Liquid-Phase Methanation of High Concentration CO Synthesis Gas, in Methanation of Synthesis Gas. 1975, AMERICAN CHEMICAL SOCIETY. p. 149-159.
18. Götz, M., et al., Evaluation of Organic and Ionic Liquids for Three-Phase Methanation and Biogas Purification Processes. Energy & Fuels, 2013. 27(8): p. 4705-4716.
19. Götz, M., et al., Einsatz eines Blasensäulenreaktors zur Methansynthese. Chemie Ingenieur Technik, 2013. 85(7): p. 1-7.
20. Zhang, J., et al., Low-temperature methanation of syngas in slurry phase over Zr-doped Ni/γ-Al2O3 catalysts prepared using different methods. Fuel, 2014. 132(0): p. 211-218.
21. Bartholomew, C.H., Carbon Deposition in Steam Reforming and Methanation. Catalysis Reviews, 1982. 24(1): p. 67-112.
22. Specht, M. Power to Gas – zwischen Mythos und Wahrheit - Teil 2 P2G® in der Praxis: Erfahrungen und Ergebnisse. in dena Jahreskonferenz Power to Gas 2014. 2014. Berlin.