Embed Size (px)
Citation preview
State of the American Diet- A Selection of Data Describing Current Dietary Intakes -
TusaRebecca E. Pannucci, PhD, MPH, RDLead Nutritionist: Nutrition and Economic Analysis
USDA Center for Nutrition Policy and Promotion
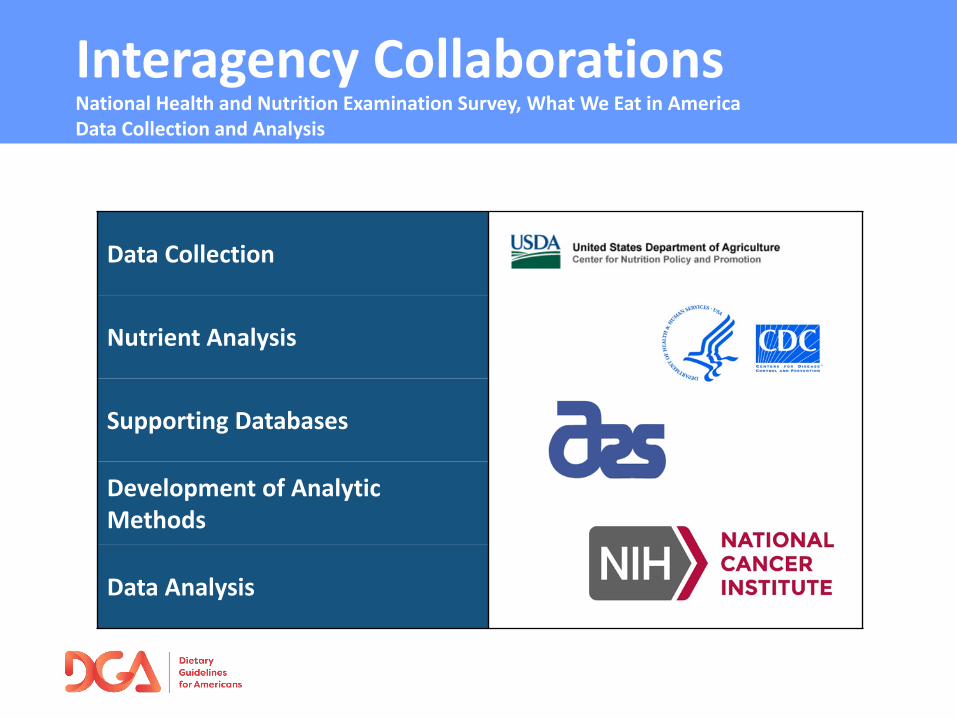
Interagency CollaborationsNational Health and Nutrition Examination Survey, What We Eat in America Data Collection and Analysis
Data Collection
Nutrient Analysis
Supporting Databases
Development of AnalyticMethods
Data Analysis
Overview
• Methods for dietary data collection• Levels of dietary intake data
• Overall diet quality: Healthy Eating Index (HEI)
• Food group intakes• Distributions of food group intakes• Food category sources of calories and food groups
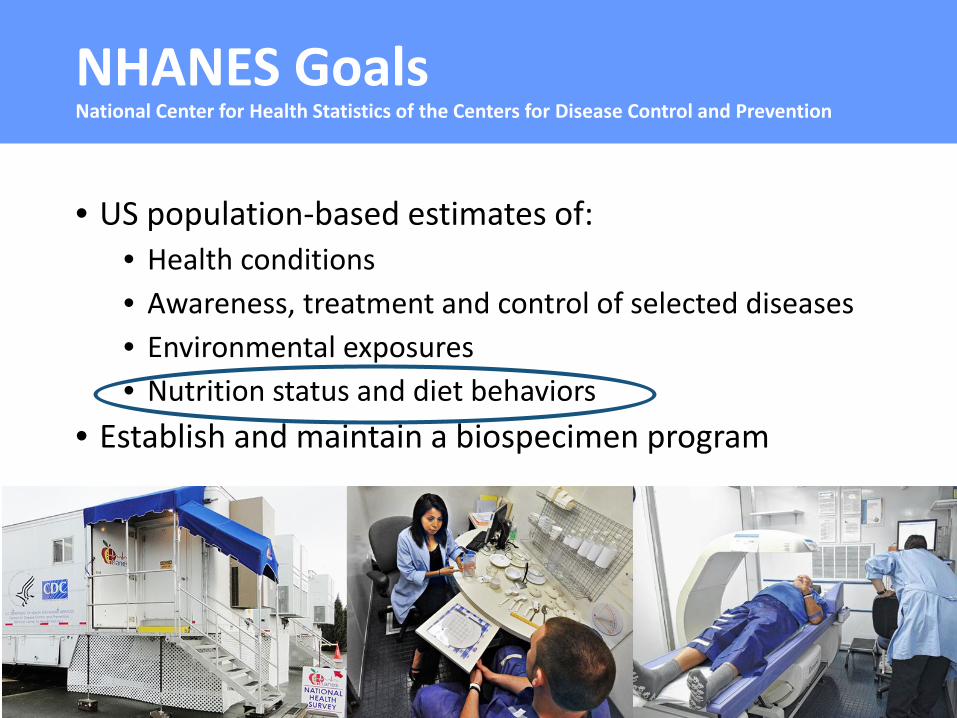
NHANES GoalsNational Center for Health Statistics of the Centers for Disease Control and Prevention
• US population-based estimates of: • Health conditions• Awareness, treatment and control of selected diseases• Environmental exposures• Nutrition status and diet behaviors
• Establish and maintain a biospecimen program
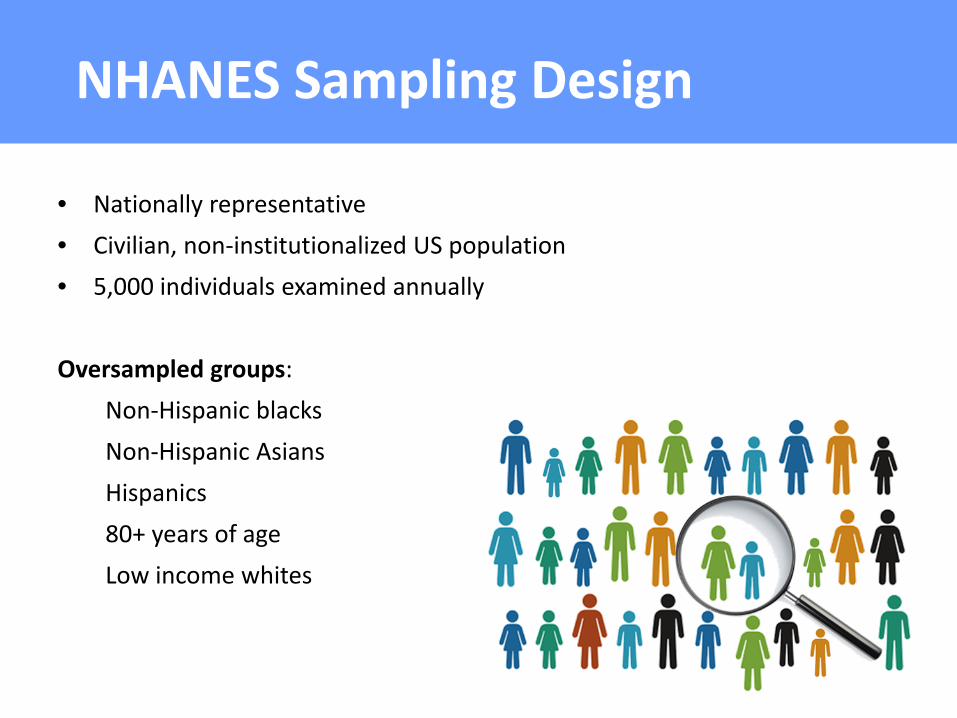
NHANES Sampling Design
• Nationally representative• Civilian, non-institutionalized US population• 5,000 individuals examined annually
Oversampled groups:Non-Hispanic blacksNon-Hispanic AsiansHispanics80+ years of ageLow income whites
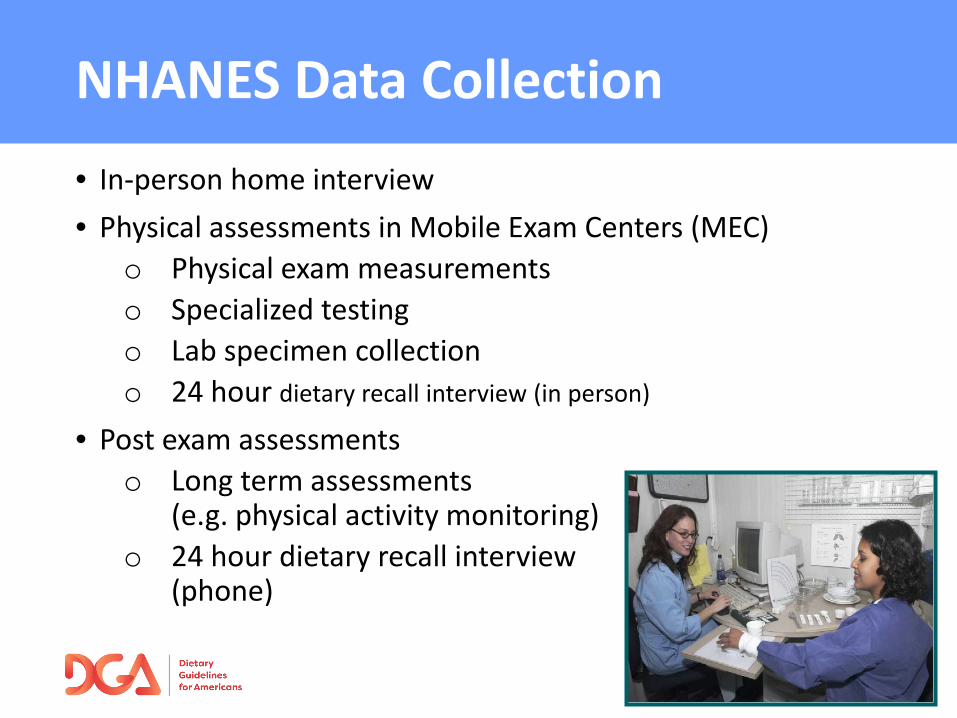
NHANES Data Collection• In-person home interview• Physical assessments in Mobile Exam Centers (MEC)
o Physical exam measurementso Specialized testingo Lab specimen collectiono 24 hour dietary recall interview (in person)
• Post exam assessments o Long term assessments
(e.g. physical activity monitoring)o 24 hour dietary recall interview
(phone)
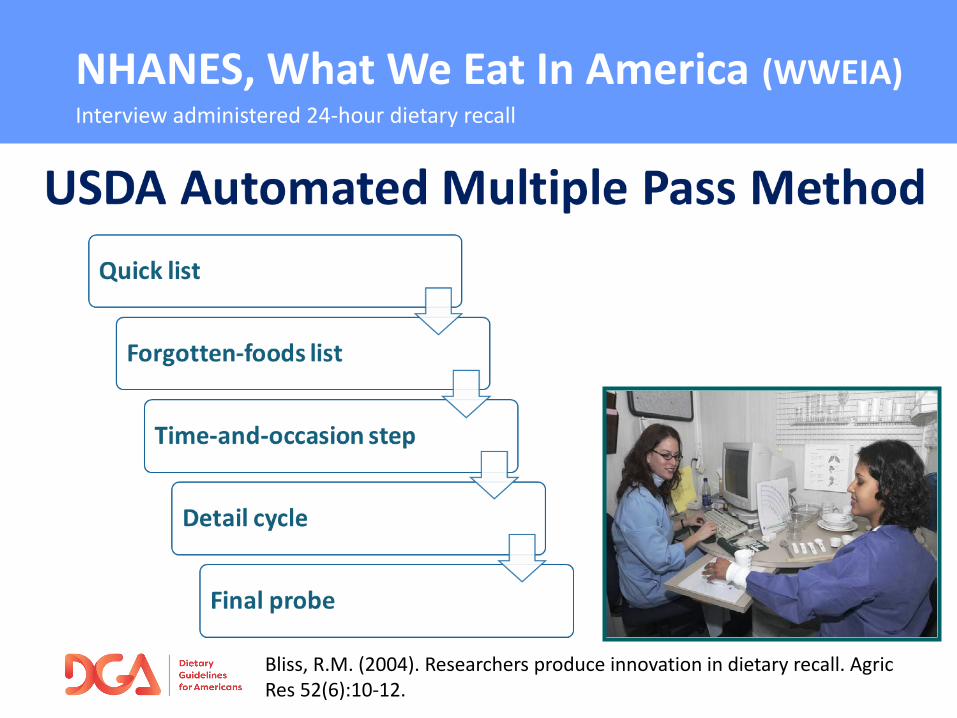
NHANES, What We Eat In America (WWEIA)Interview administered 24-hour dietary recall
Bliss, R.M. (2004). Researchers produce innovation in dietary recall. AgricRes 52(6):10-12.
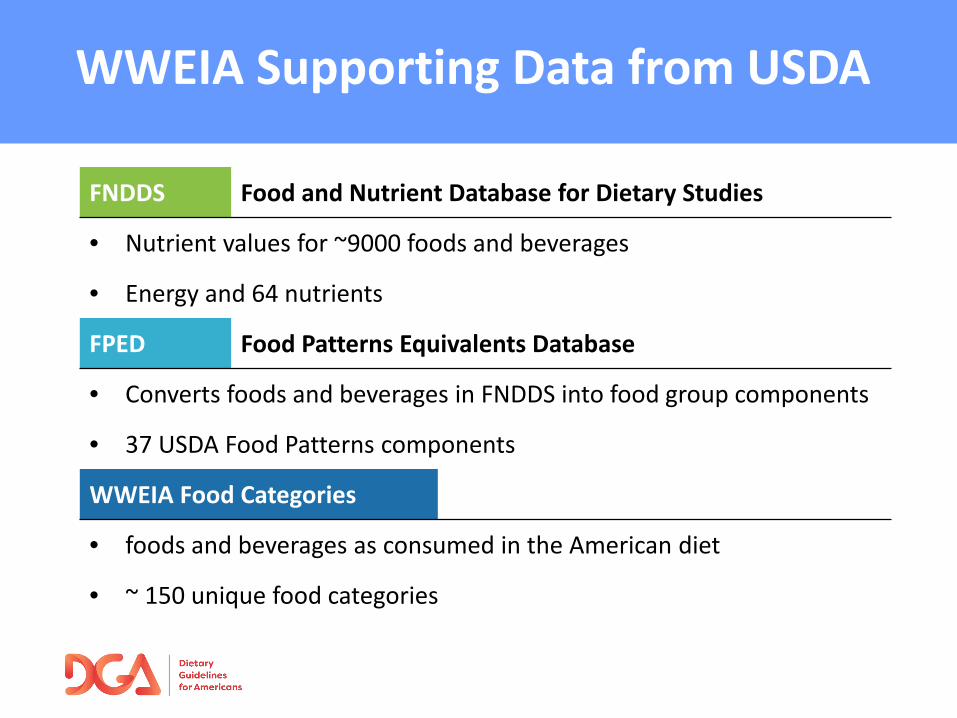
WWEIA Supporting Data from USDA
FNDDS Food and Nutrient Database for Dietary Studies
• Nutrient values for ~9000 foods and beverages
• Energy and 64 nutrients
FPED Food Patterns Equivalents Database
• Converts foods and beverages in FNDDS into food group components
• 37 USDA Food Patterns components
WWEIA Food Categories
• foods and beverages as consumed in the American diet
• ~ 150 unique food categories
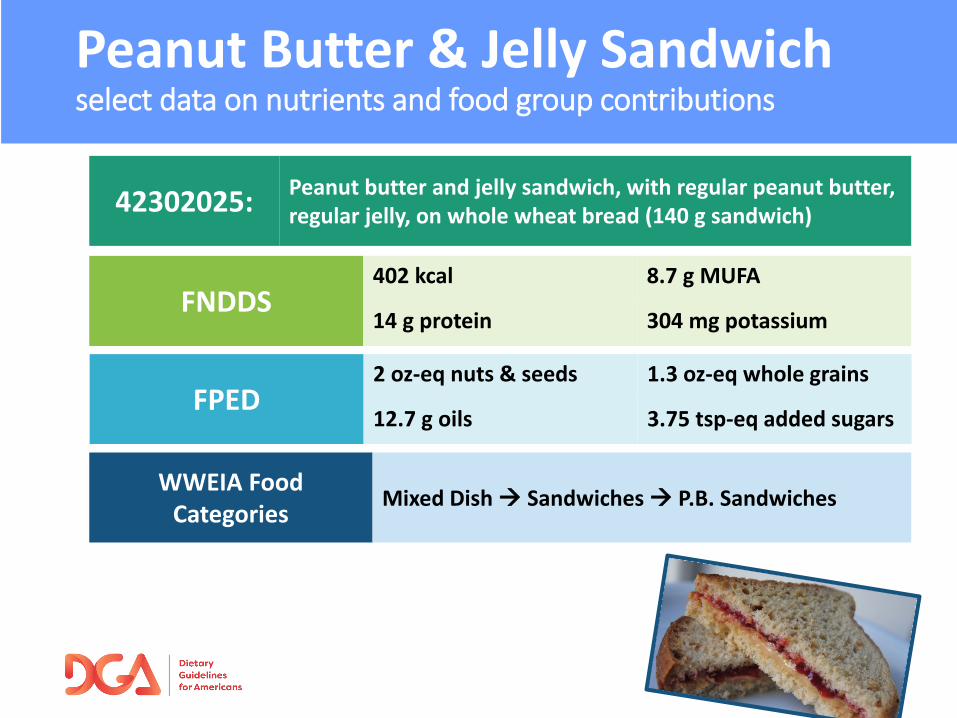
Peanut Butter & Jelly Sandwichselect data on nutrients and food group contributions
42302025: Peanut butter and jelly sandwich, with regular peanut butter,regular jelly, on whole wheat bread (140 g sandwich)
FNDDS402 kcal 8.7 g MUFA
14 g protein 304 mg potassium
FPED2 oz-eq nuts & seeds 1.3 oz-eq whole grains
12.7 g oils 3.75 tsp-eq added sugars
WWEIA Food Categories Mixed Dish Sandwiches P.B. Sandwiches
Overall Diet QualityHealthy Eating Index (HEI)
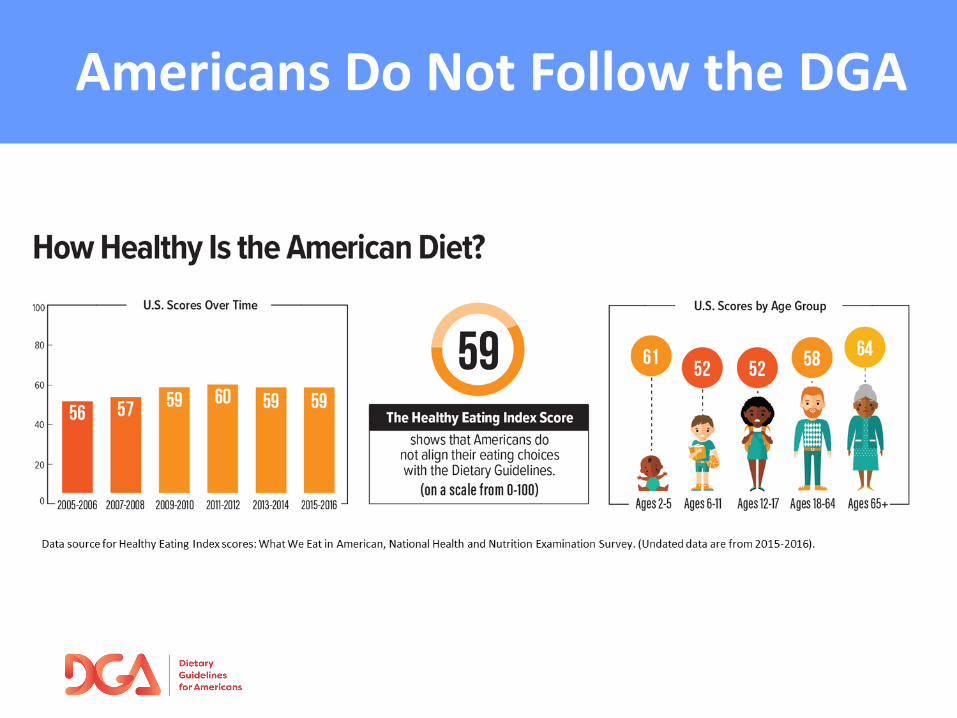
Americans Do Not Follow the DGA
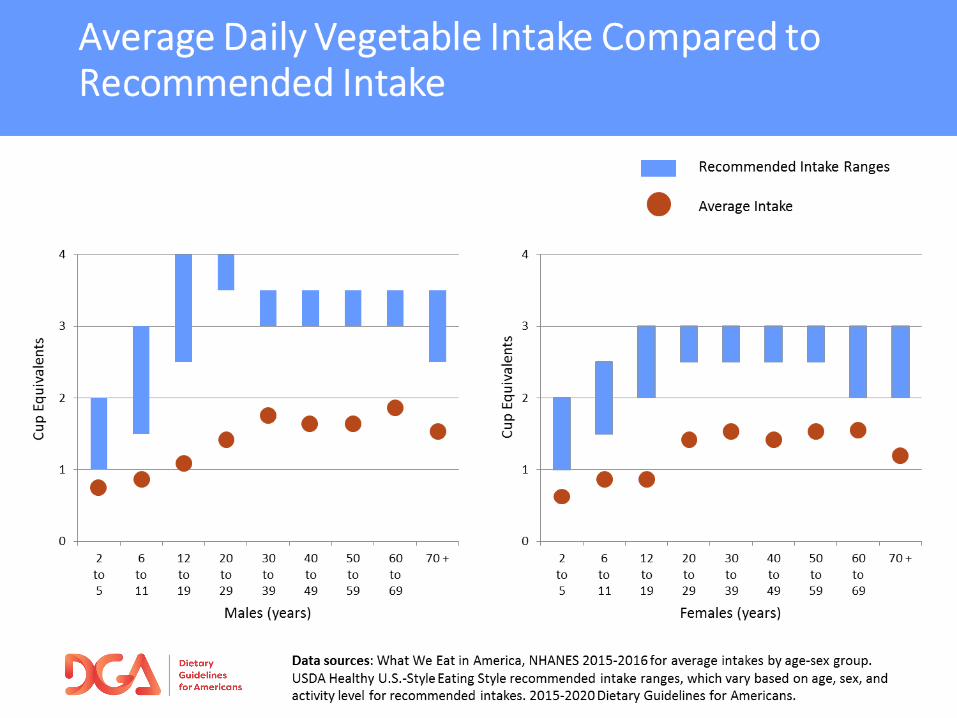
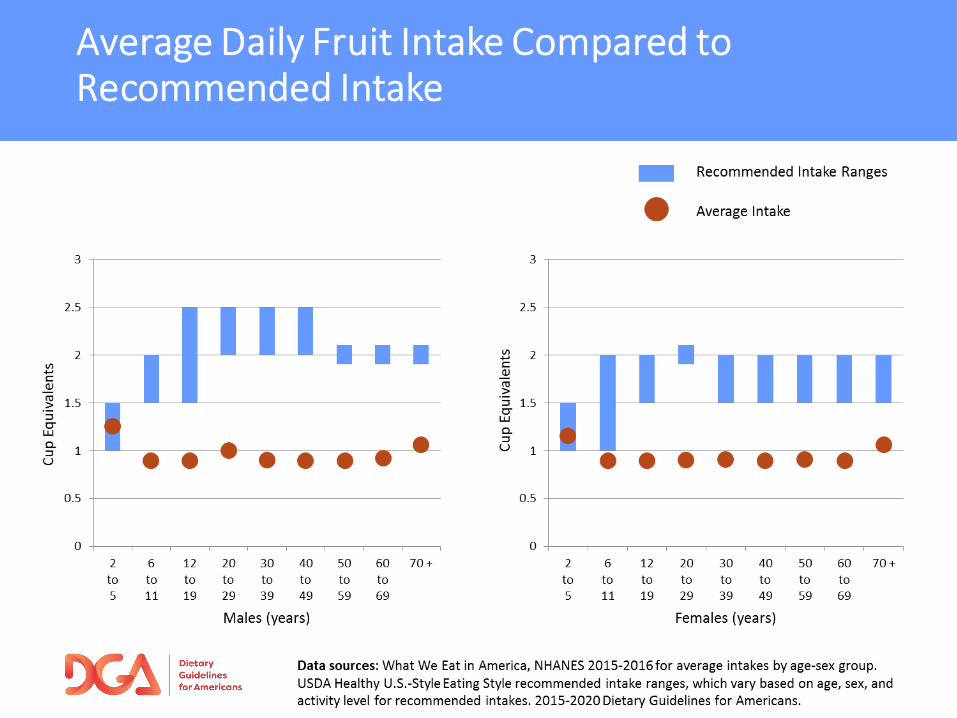
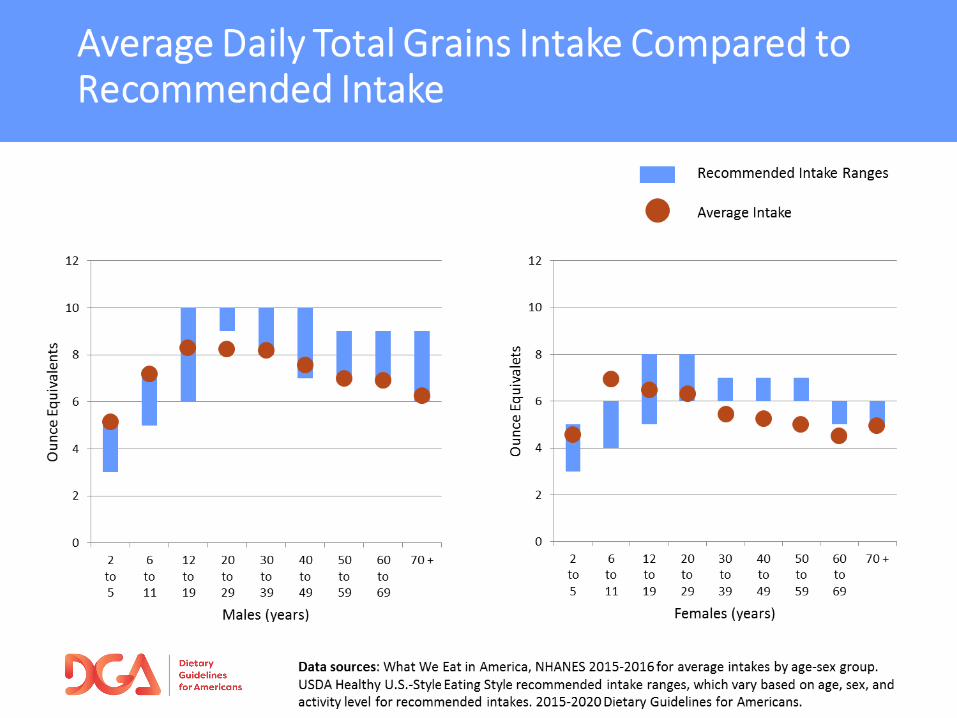
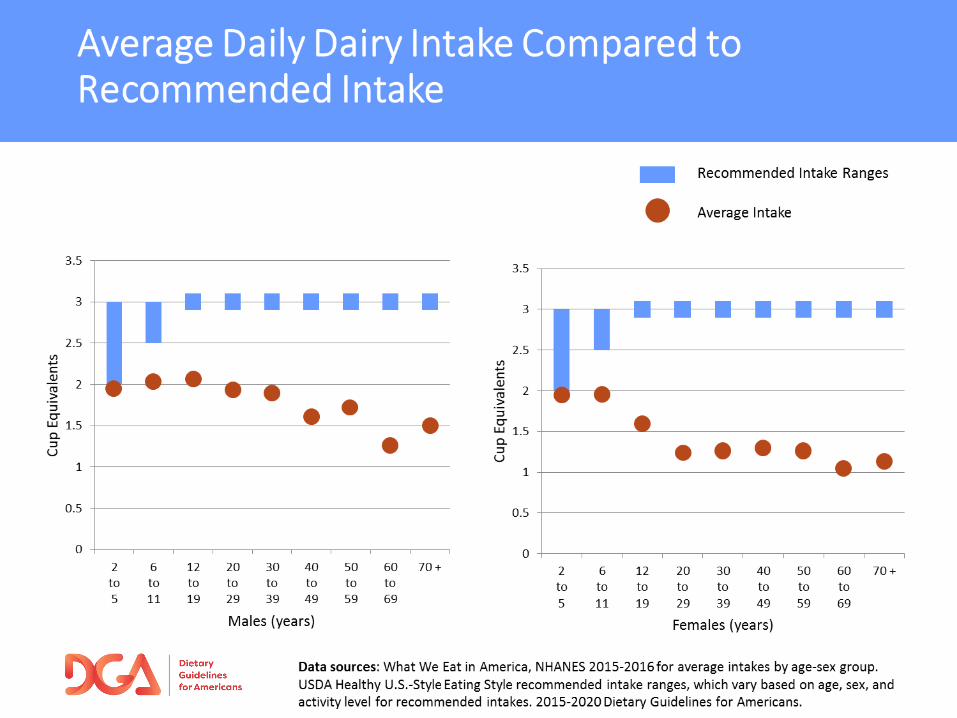
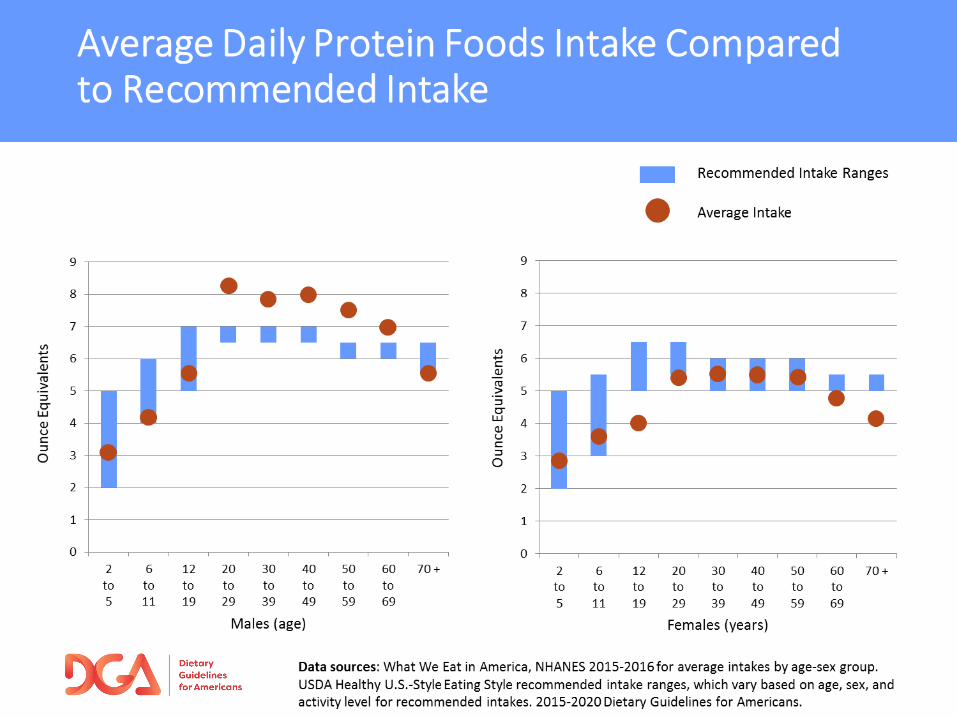
Average Food Group IntakesCompared to Recommendations

Average Food Group IntakesChanges Over Time
2003-2004 to 2015-2016
Bowman SA, Clemens JC, Friday JE, Schroeder N, Shimizu M, LaComb RP, and Moshfegh AJ. Food Patterns Equivalents Intakes by Americans: What We Eat in America, NHANES 2003-2004 and 2015-2016.
Food Surveys Research Group. Dietary Data Brief No. 20, November 2018.
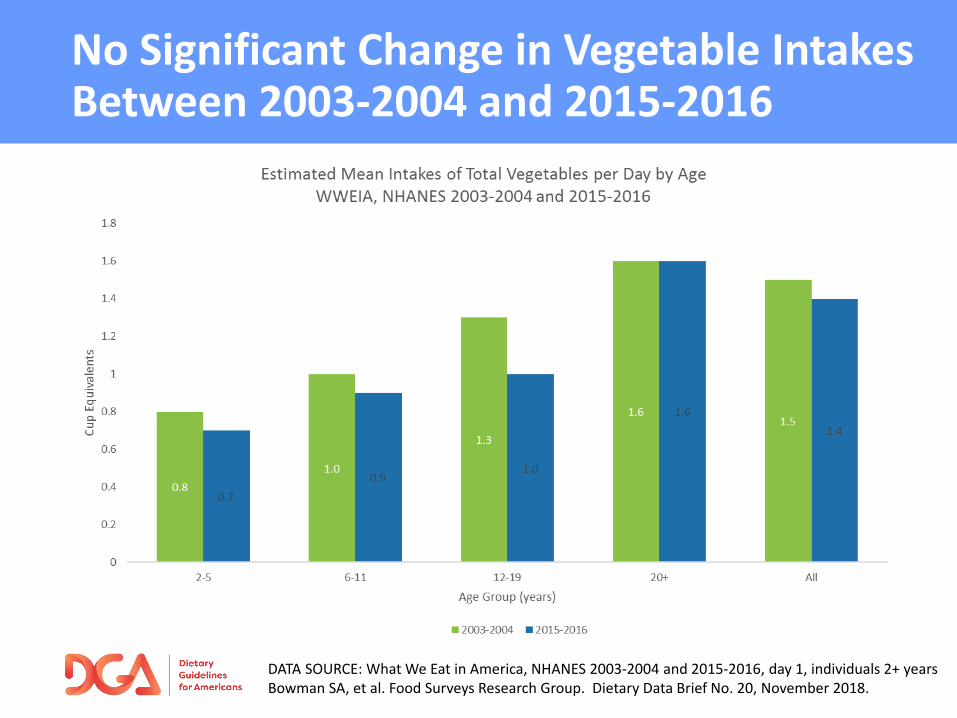
No Significant Change in Vegetable Intakes Between 2003-2004 and 2015-2016
DATA SOURCE: What We Eat in America, NHANES 2003-2004 and 2015-2016, day 1, individuals 2+ yearsBowman SA, et al. Food Surveys Research Group. Dietary Data Brief No. 20, November 2018.
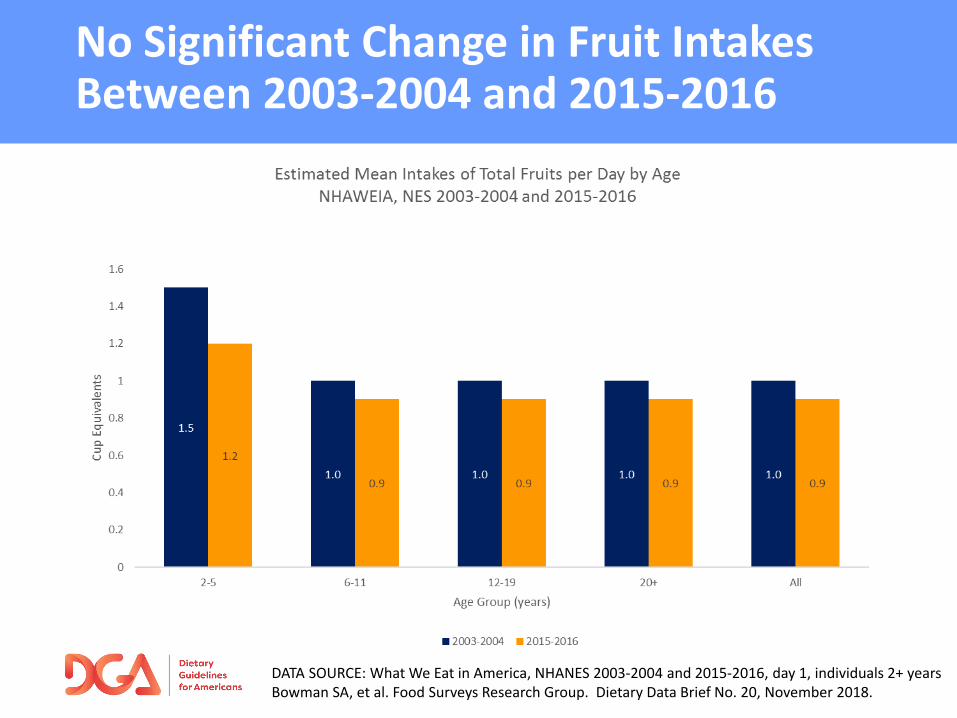
No Significant Change in Fruit Intakes Between 2003-2004 and 2015-2016
DATA SOURCE: What We Eat in America, NHANES 2003-2004 and 2015-2016, day 1, individuals 2+ yearsBowman SA, et al. Food Surveys Research Group. Dietary Data Brief No. 20, November 2018.
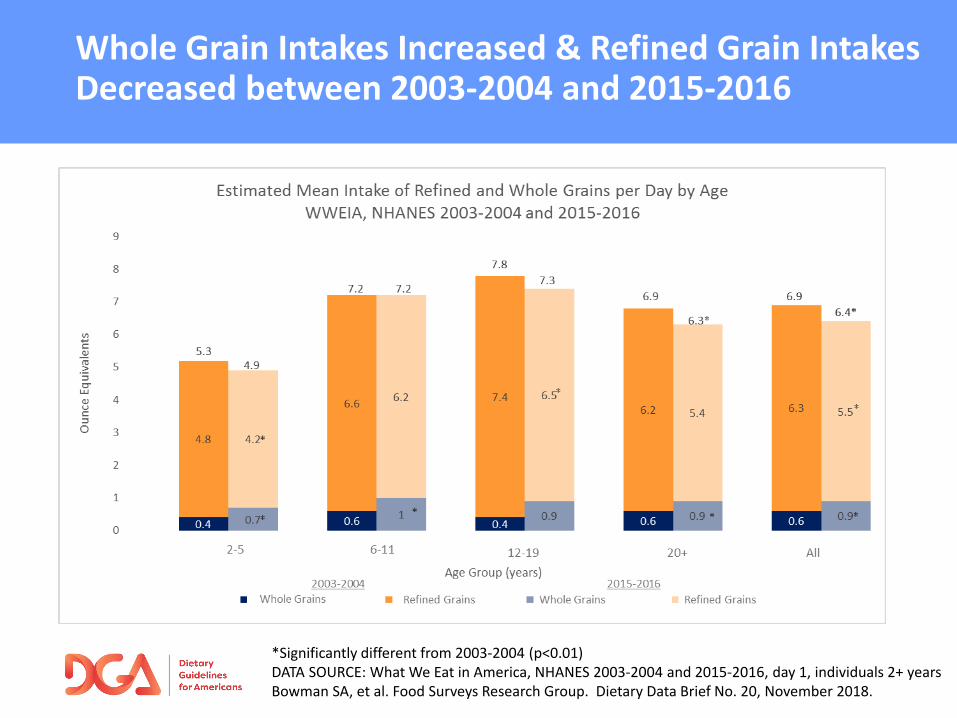
Whole Grain Intakes Increased & Refined Grain Intakes Decreased between 2003-2004 and 2015-2016
*Significantly different from 2003-2004 (p<0.01)DATA SOURCE: What We Eat in America, NHANES 2003-2004 and 2015-2016, day 1, individuals 2+ yearsBowman SA, et al. Food Surveys Research Group. Dietary Data Brief No. 20, November 2018.
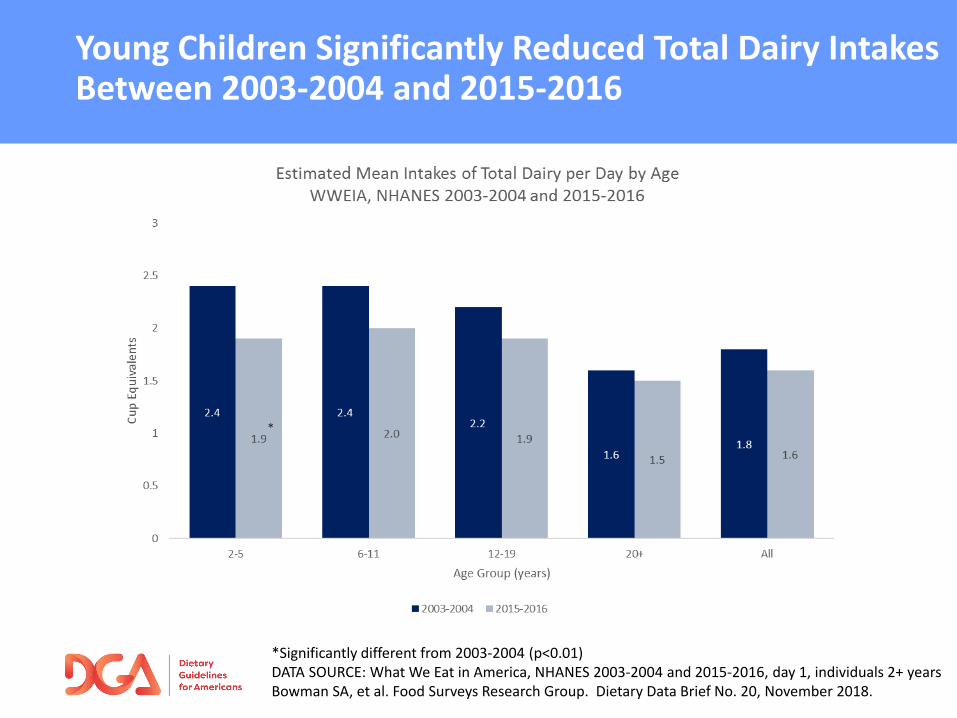
Young Children Significantly Reduced Total Dairy Intakes Between 2003-2004 and 2015-2016
*Significantly different from 2003-2004 (p<0.01)DATA SOURCE: What We Eat in America, NHANES 2003-2004 and 2015-2016, day 1, individuals 2+ yearsBowman SA, et al. Food Surveys Research Group. Dietary Data Brief No. 20, November 2018.
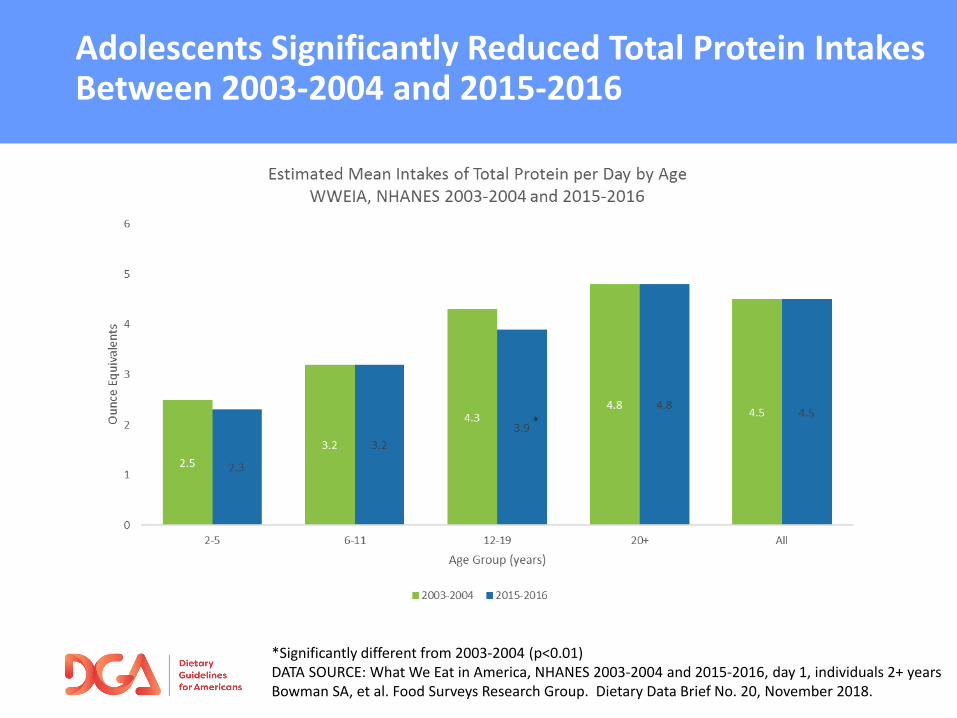
Adolescents Significantly Reduced Total Protein Intakes Between 2003-2004 and 2015-2016
*Significantly different from 2003-2004 (p<0.01)DATA SOURCE: What We Eat in America, NHANES 2003-2004 and 2015-2016, day 1, individuals 2+ yearsBowman SA, et al. Food Surveys Research Group. Dietary Data Brief No. 20, November 2018.
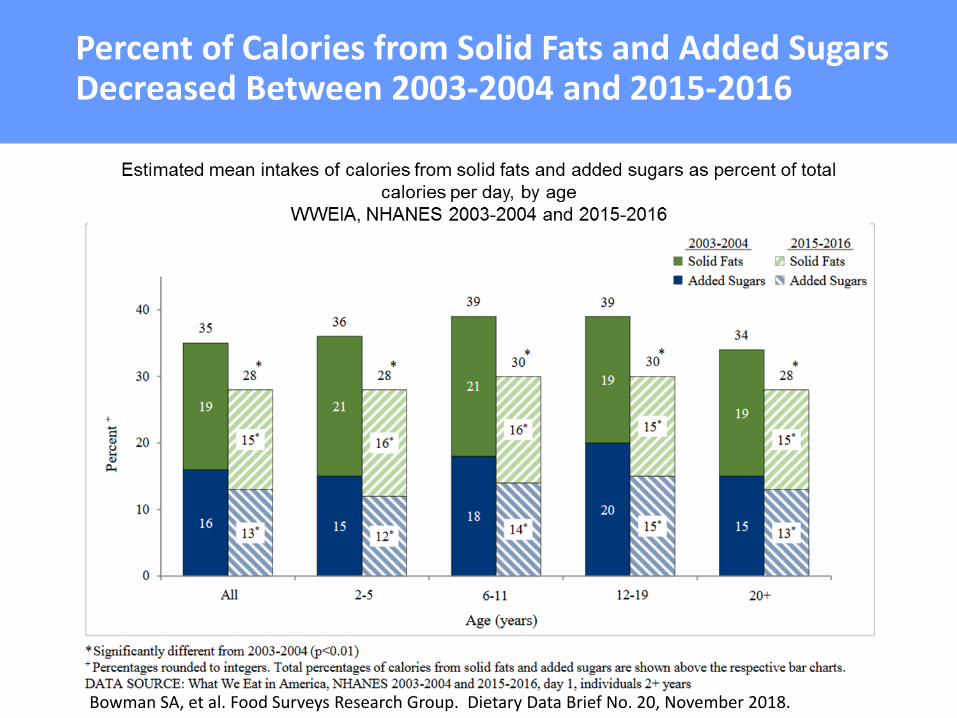
Percent of Calories from Solid Fats and Added Sugars Decreased Between 2003-2004 and 2015-2016
Bowman SA, et al. Food Surveys Research Group. Dietary Data Brief No. 20, November 2018.
Food Group Intake Distributions
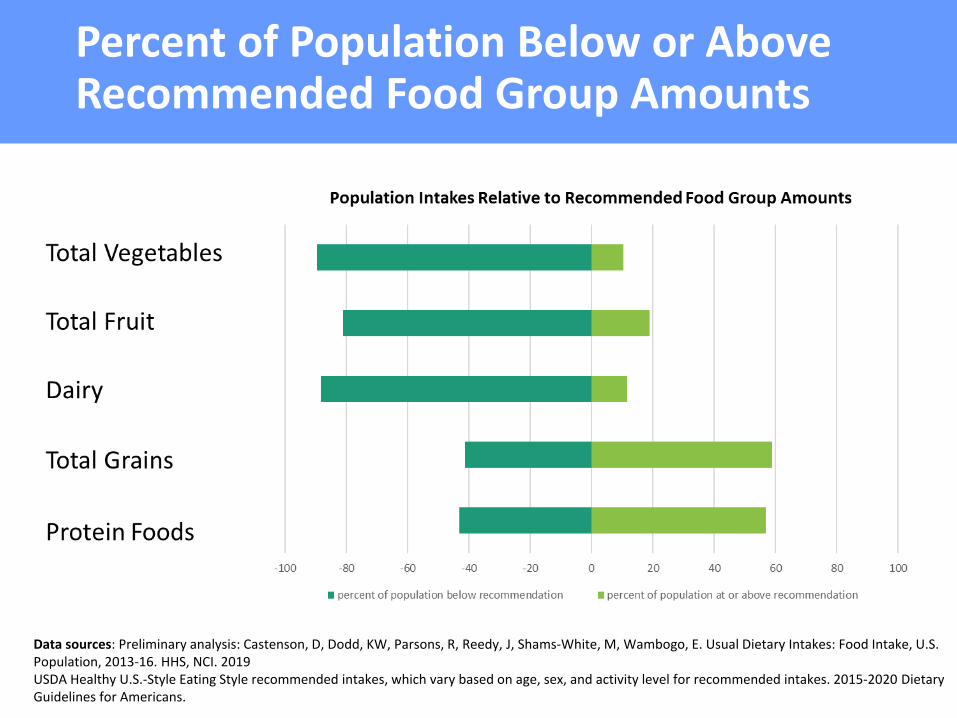
Percent of Population Below or Above Recommended Food Group Amounts
Data sources: Preliminary analysis: Castenson, D, Dodd, KW, Parsons, R, Reedy, J, Shams-White, M, Wambogo, E. Usual Dietary Intakes: Food Intake, U.S. Population, 2013-16. HHS, NCI. 2019USDA Healthy U.S.-Style Eating Style recommended intakes, which vary based on age, sex, and activity level for recommended intakes. 2015-2020 Dietary Guidelines for Americans.

Food Category Sources of Calories and Food Groups
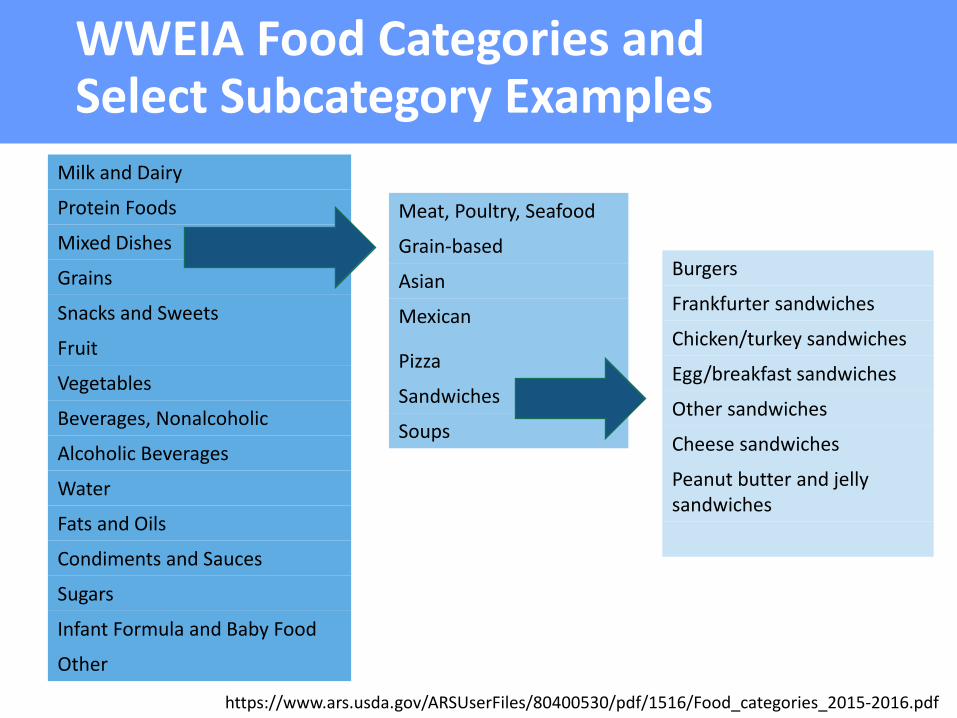
WWEIA Food Categories and Select Subcategory Examples
Milk and Dairy
Protein Foods
Mixed Dishes
Grains
Snacks and Sweets
Fruit
Vegetables
Beverages, Nonalcoholic
Alcoholic Beverages
Water
Fats and Oils
Condiments and Sauces
Sugars
Infant Formula and Baby Food
Other
Meat, Poultry, Seafood
Grain-based
Asian
Mexican
Pizza
Sandwiches
Soups
Burgers
Frankfurter sandwiches
Chicken/turkey sandwiches
Egg/breakfast sandwiches
Other sandwiches
Cheese sandwiches
Peanut butter and jelly sandwiches
https://www.ars.usda.gov/ARSUserFiles/80400530/pdf/1516/Food_categories_2015-2016.pdf
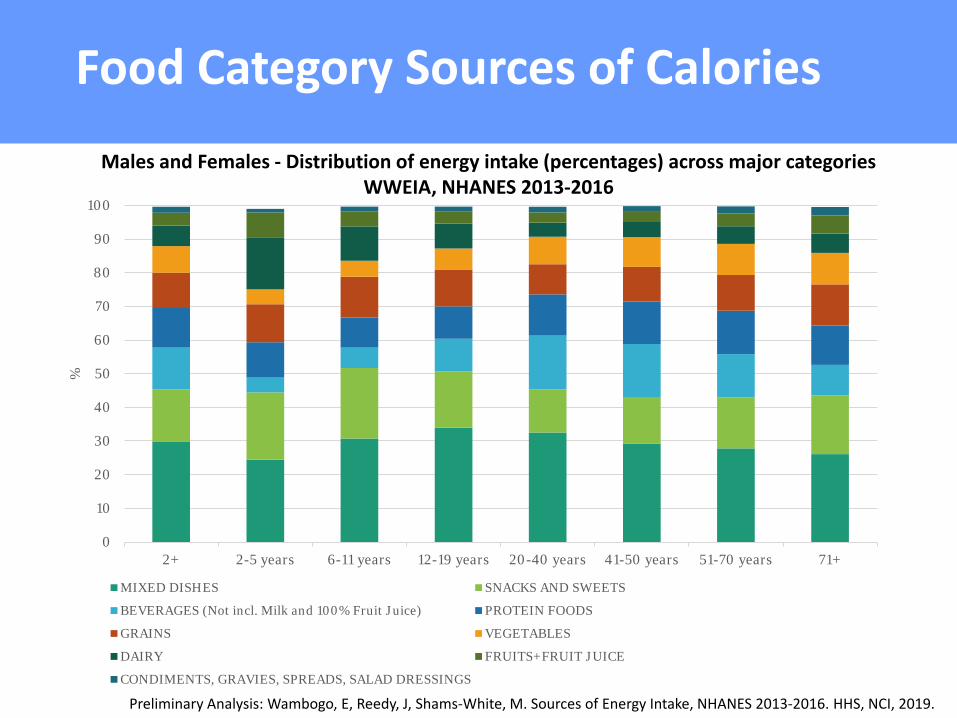
Food Category Sources of Calories
Males and Females - Distribution of energy intake (percentages) across major categoriesWWEIA, NHANES 2013-2016
0
10
20
30
40
50
60
70
80
90
100
2+ 2-5 years 6-11 years 12-19 years 20-40 years 41-50 years 51-70 years 71+
%
MIXED DISHES SNACKS AND SWEETS
BEVERAGES (Not incl. Milk and 100% Fruit Juice) PROTEIN FOODS
GRAINS VEGETABLES
DAIRY FRUITS+FRUIT JUICE
CONDIMENTS, GRAVIES, SPREADS, SALAD DRESSINGS
Preliminary Analysis: Wambogo, E, Reedy, J, Shams-White, M. Sources of Energy Intake, NHANES 2013-2016. HHS, NCI, 2019.
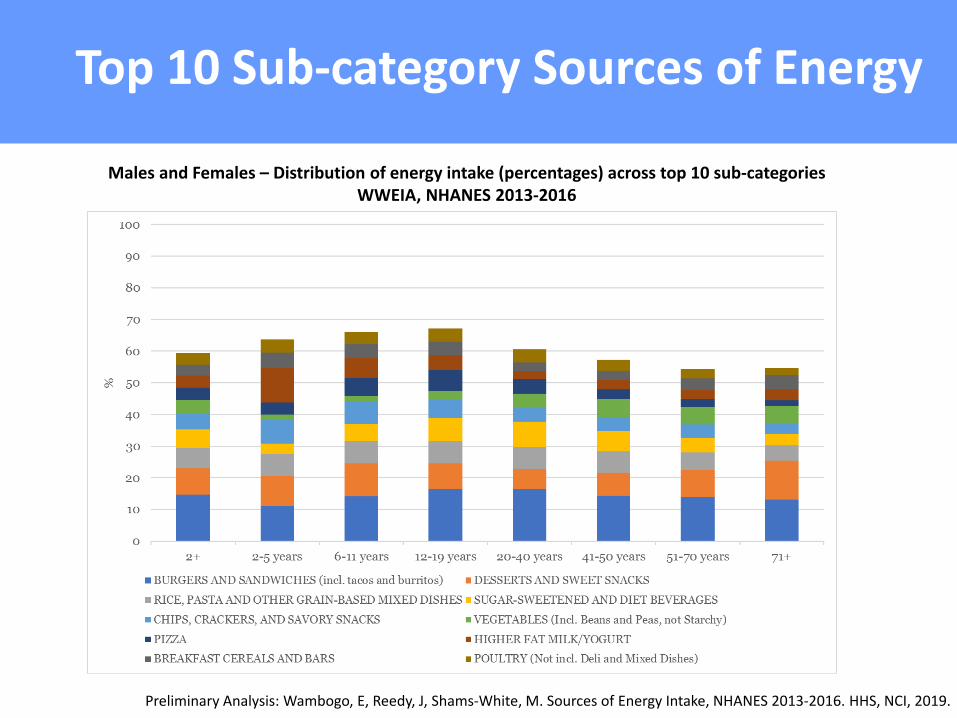
Top 10 Sub-category Sources of Energy
Males and Females – Distribution of energy intake (percentages) across top 10 sub-categoriesWWEIA, NHANES 2013-2016
Preliminary Analysis: Wambogo, E, Reedy, J, Shams-White, M. Sources of Energy Intake, NHANES 2013-2016. HHS, NCI, 2019.
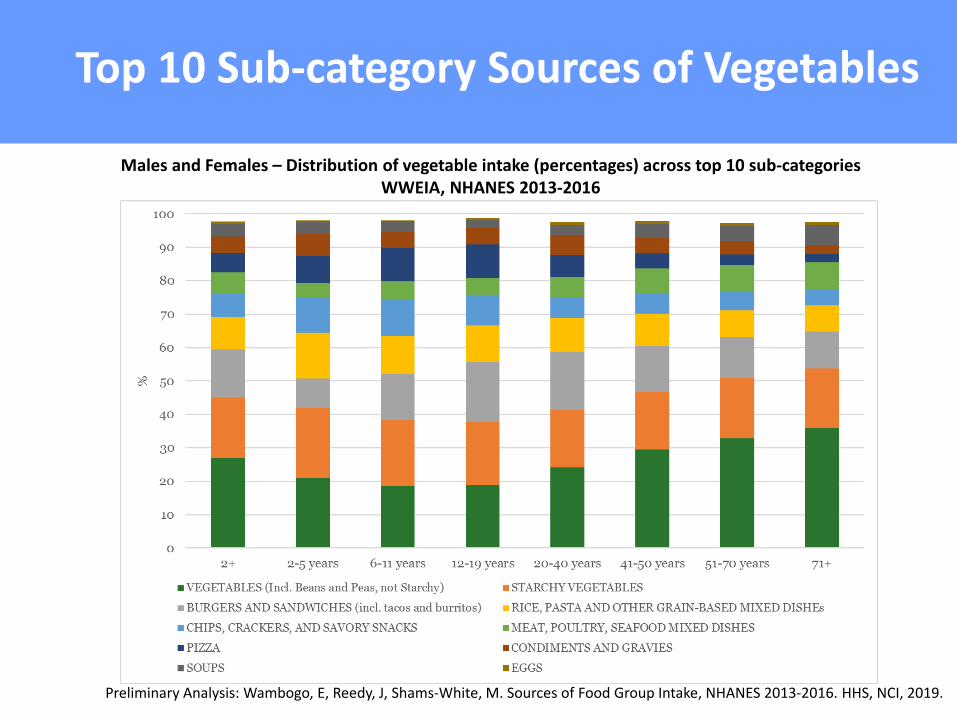
Top 10 Sub-category Sources of Vegetables
Males and Females – Distribution of vegetable intake (percentages) across top 10 sub-categoriesWWEIA, NHANES 2013-2016
Preliminary Analysis: Wambogo, E, Reedy, J, Shams-White, M. Sources of Food Group Intake, NHANES 2013-2016. HHS, NCI, 2019.
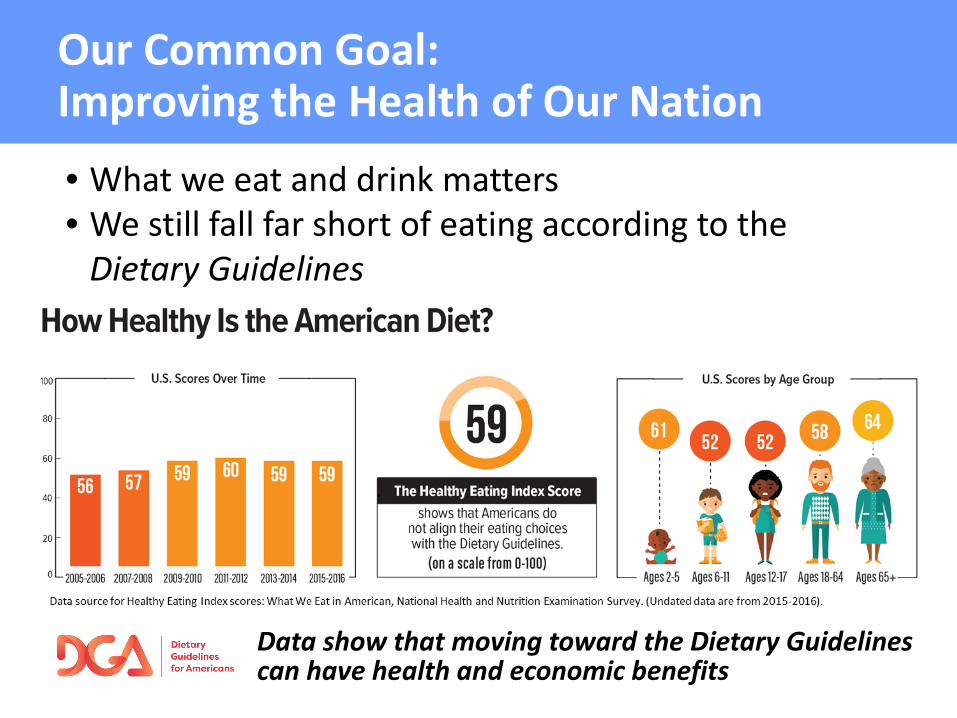
Our Common Goal: Improving the Health of Our Nation• What we eat and drink matters• We still fall far short of eating according to the
Dietary Guidelines
Data show that moving toward the Dietary Guidelines can have health and economic benefits