Embed Size (px)
Citation preview

State of the Agency Report Workforce Demographic
Briefing
Department of Health and Human Services
Hubert H. Humphrey Building
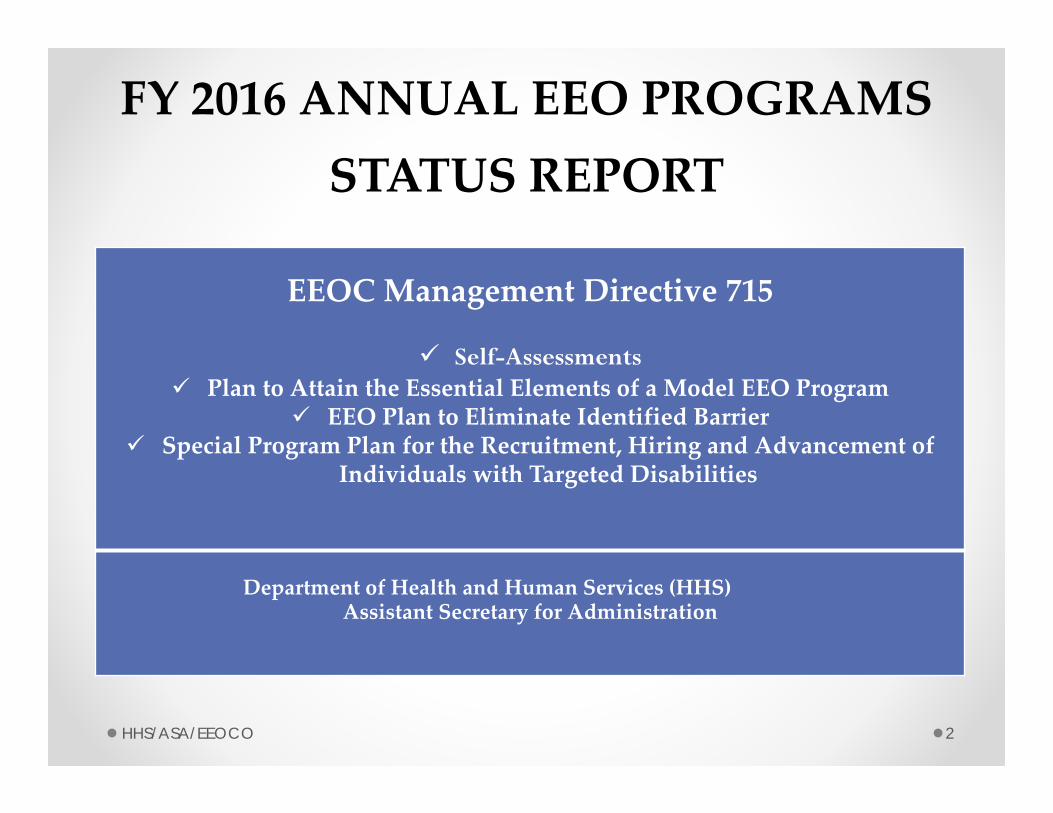
FY 2016 ANNUAL EEO PROGRAMS
STATUS REPORT
EEOC Management Directive 715
Self-Assessments Plan to Attain the Essential Elements of a Model EEO Program
EEO Plan to Eliminate Identified Barrier Special Program Plan for the Recruitment, Hiring and Advancement of
Individuals with Targeted Disabilities
Department of Health and Human Services (HHS) Assistant Secretary for Administration
HHS/ASA/EEOCO 2
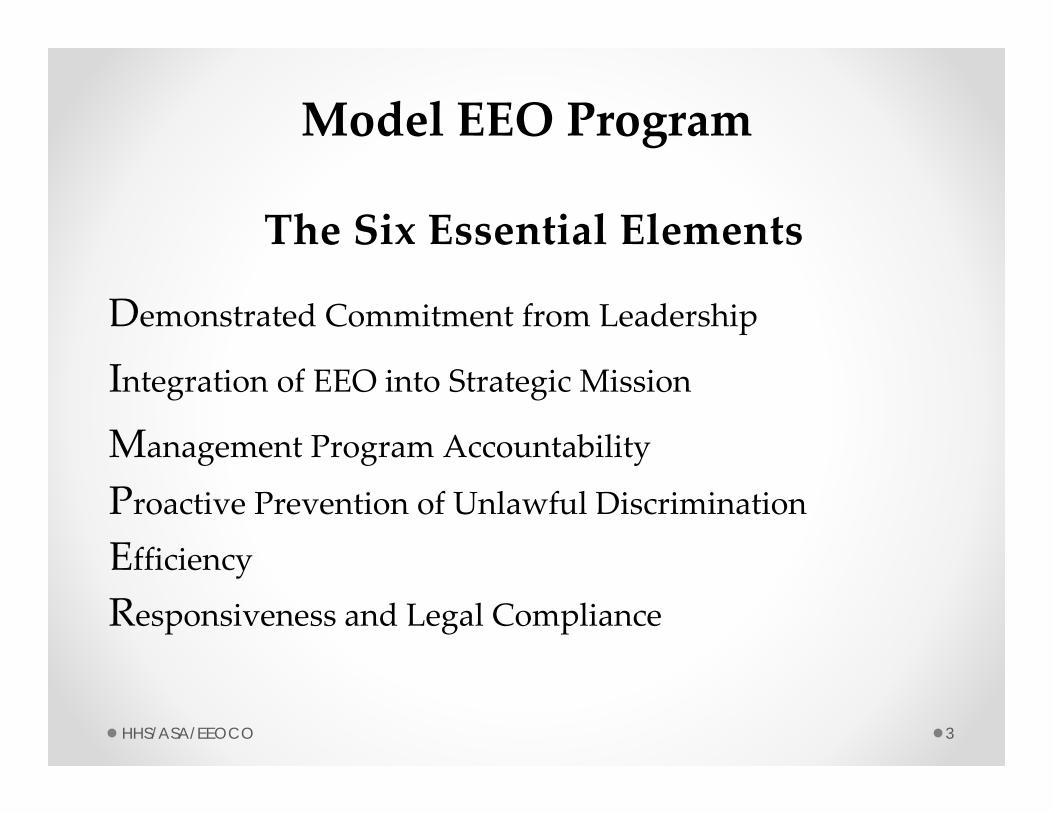
Model EEO Program
The Six Essential Elements
Demonstrated Commitment from Leadership
Integration of EEO into Strategic Mission
Management Program Accountability
Proactive Prevention of Unlawful Discrimination
Efficiency
Responsiveness and Legal Compliance
HHS/ASA/EEOCO 3
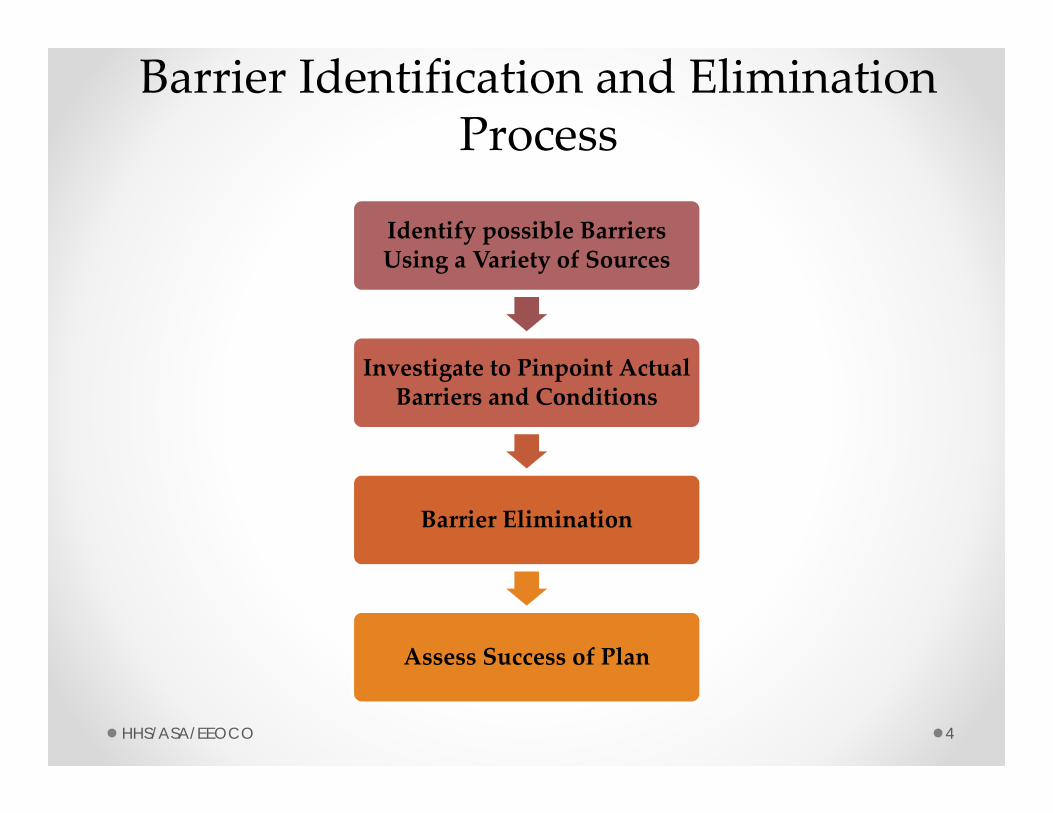
Barrier Identification and Elimination Process
Identify possible Barriers Using a Variety of Sources
Investigate to Pinpoint Actual Barriers and Conditions
Barrier Elimination
Assess Success of Plan
HHS/ASA/EEOCO 4
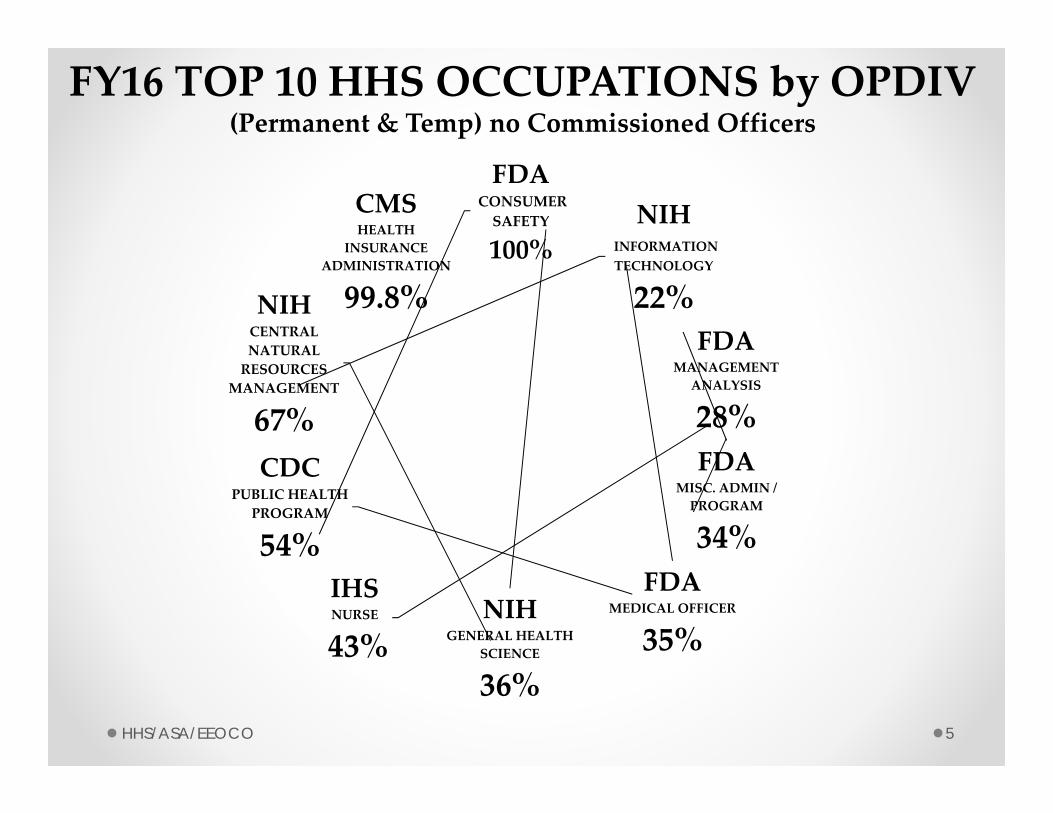
FY16 TOP 10 HHS OCCUPATIONS by OPDIV (Permanent & Temp) no Commissioned Officers
5
NIH GENERAL HEALTH
SCIENCE
36%
FDA MEDICAL OFFICER
35%
FDA MISC. ADMIN / PROGRAM
34%
IHS NURSE
43%
FDA MANAGEMENT ANALYSIS
28%
CDC PUBLIC HEALTH PROGRAM
54%
NIH CENTRAL NATURAL RESOURCES
MANAGEMENT
67%
FDA CONSUMER SAFETY
100% NIH
INFORMATION TECHNOLOGY
22%
CMS HEALTH
INSURANCE ADMINISTRATION
99.8%
HHS/ASA/EEOCO

Top Five Bases for Fiscal Years 2012 – 2016 (listed in order of frequency)
FY 2012
FY 2013
Reprisal
Reprisal
Race ‐ African American
Sex‐Female
Age
Age
Sex ‐ Female
Disability‐Physical
Disability‐Physical
Race‐African American
FY 2014 Reprisal Age Disability‐Physical Sex ‐ Female Race‐African American
FY 2015 Reprisal Age Disability ‐ Physical Sex ‐ Female Color
FY2016 Reprisal Age Disability ‐ Physical Sex‐Female Race‐African American
Top Five Issues or Fiscal Years 2012– 2016 (listed in order of frequency)
FY 2012 Harassment (NS) Assignment of Duties Evaluation/Appraisal Disciplinary Action Promotion/Non‐Selection
FY 2013 Harassment (NS) Assignment of Duties Disciplinary Action Evaluation/Appraisal Promotion/Non‐Selection
FY 2014 Harassment (NS) Disciplinary Action Assignment of Duties Evaluation/Appraisal Terms & Condition of Emp.
FY 2015 Harassment (NS) Evaluation/Appraisal Disciplinary Action Assignment of Duties Promotion/Non‐Selection
FY 2016 Harassment (NS) Disciplinary Action Evaluation/Appraisal Assignment of Duties Promotion/Non‐Selection
EEO Complaints Trends
HHS/ASA/EEOCO 6
The top five formal complaint bases and issues of alleged discrimination complaints
HHS/ASA/EEOCO 7
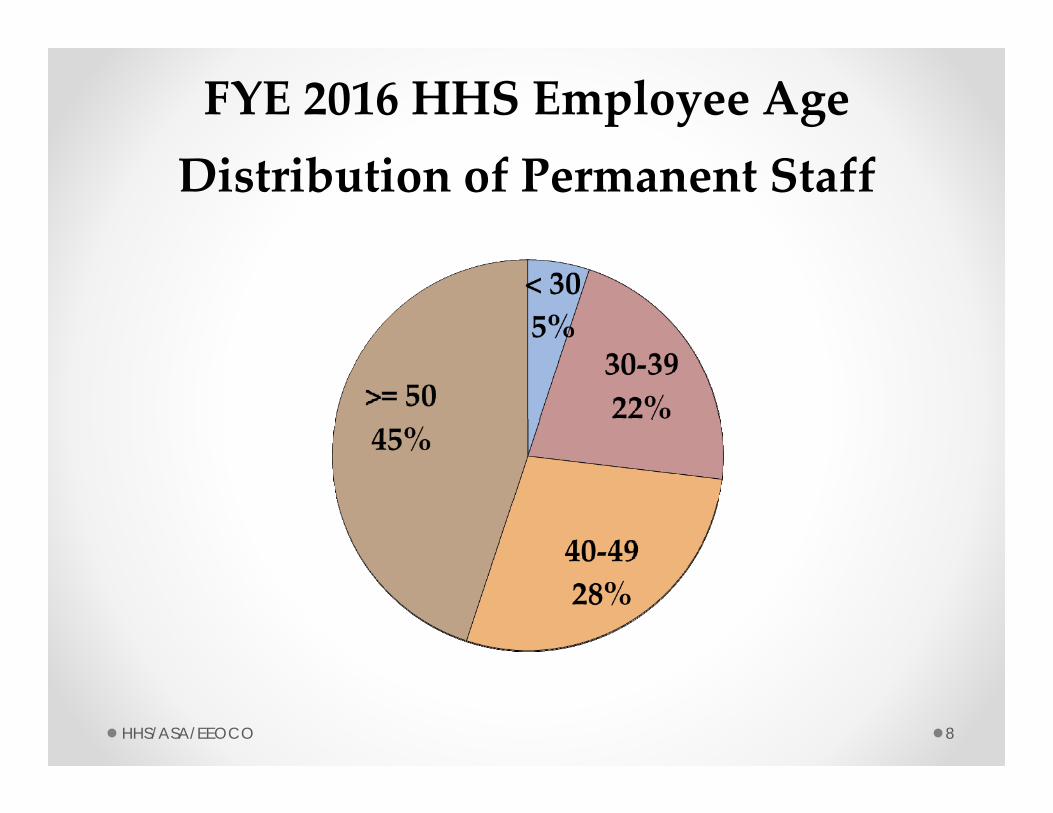
FYE 2016 HHS Employee Age Distribution of Permanent Staff
HHS/ASA/EEOCO 8

FYE 2016 HHS Total Employees (Permanent & Temporary)
Total Count 91,565
HHS/ASA/EEOCO 9
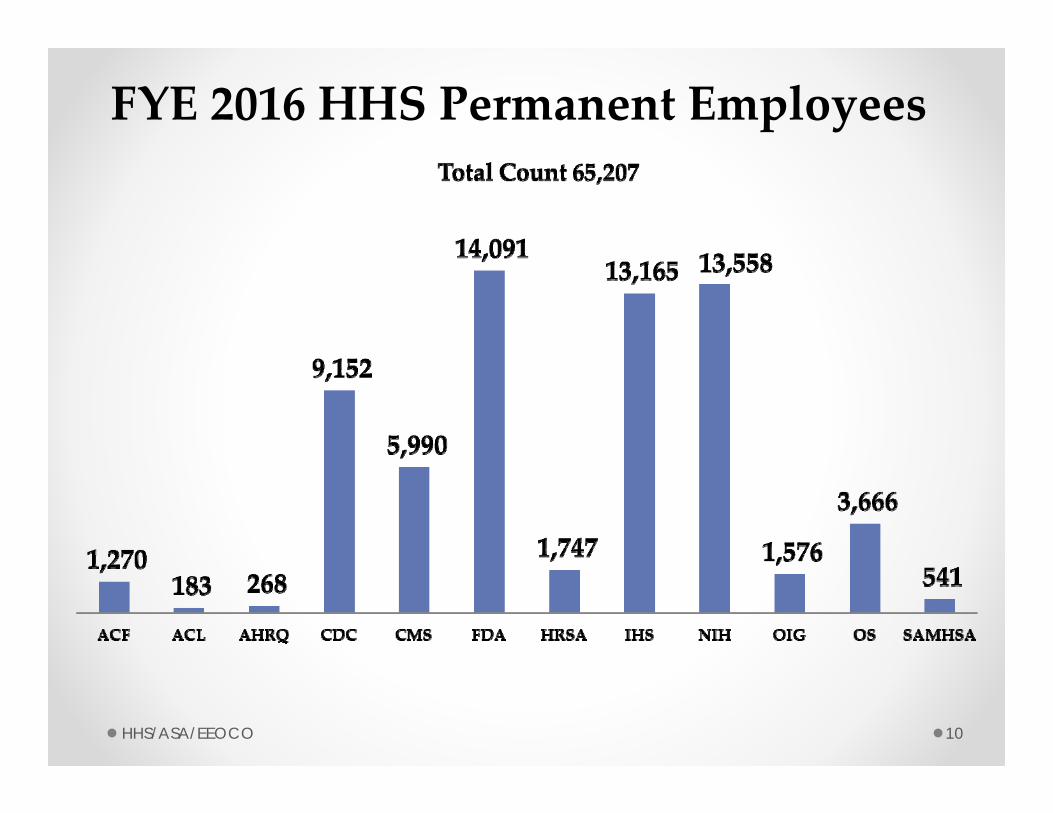
FYE 2016 HHS Permanent Employees
HHS/ASA/EEOCO 10

FYE 2016 HHS WORKFORCE BY U.S. LOCATION
Permanent Staff Only
States (not BL or DC) 33,845 49.7% DC Metro 29,575 43.4% Baltimore 4,288 6.3% Foreign 229 0.3% U.S. Territory 146 0.2%
Top States
MD 30,733 45.4% Georgia 8,317 12.3% Arizona 4,714 7.0% New Mexico 3,399 5.0% DC 3,322 4.9% Others 17,198 25.4% Total 67,681 100.0% HHS/ASA/EEOCO 11

FYE 2016 HHS TOTAL WORKFORCE COUNTRIESWITHHHSWORKFORCE
66 COUNTRIES, PLUS PUERTO RICO
KENYA 27
SWITZERLAND 20
TANZANIA 15
UGANDA 14 MOZAMBIQUE 13ZAMBIA 13 VIETNAM 12BOTSWANA 11 THAILAND 10
HHS/ASA/EEOCO 12

FYE 16 HHS Permanent Distribution by Pay Plan and Grade
HHS/ASA/EEOCO 13

Career Senior Executive
HHS/ASA/EEOCO 14

Employees with Targeted Disability
HHS/ASA/EEOCO 15
HHS/ASA/EEOCO 16
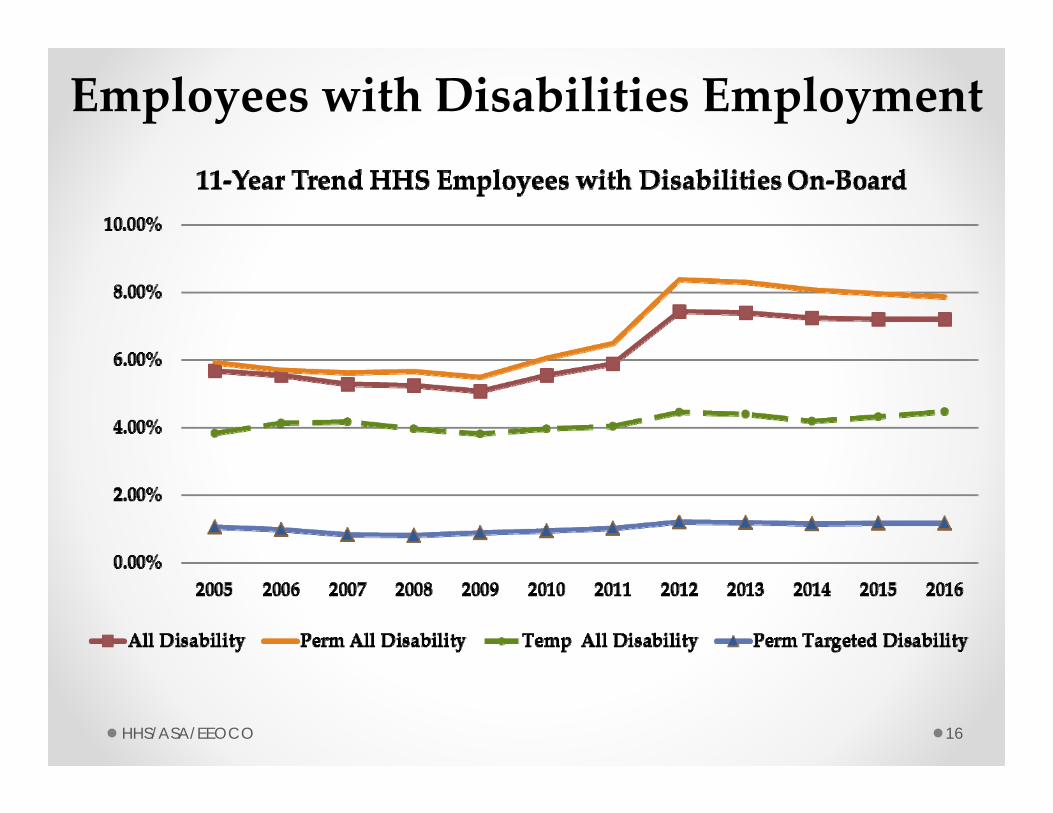
Employees with Disabilities Employment
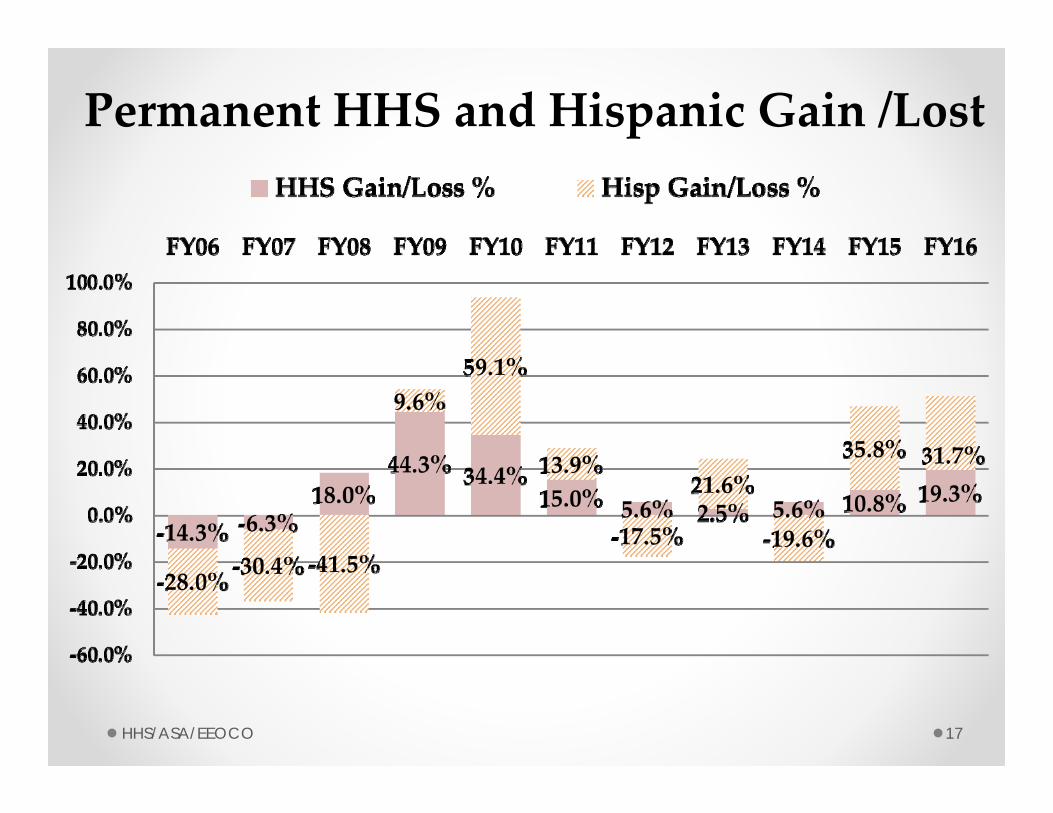
Permanent HHS and Hispanic Gain /Lost
HHS/ASA/EEOCO 17

Special Emphasis
• People of Hispanic Origin
• Individuals with Disabilities
HHS/ASA/EEOCO 18
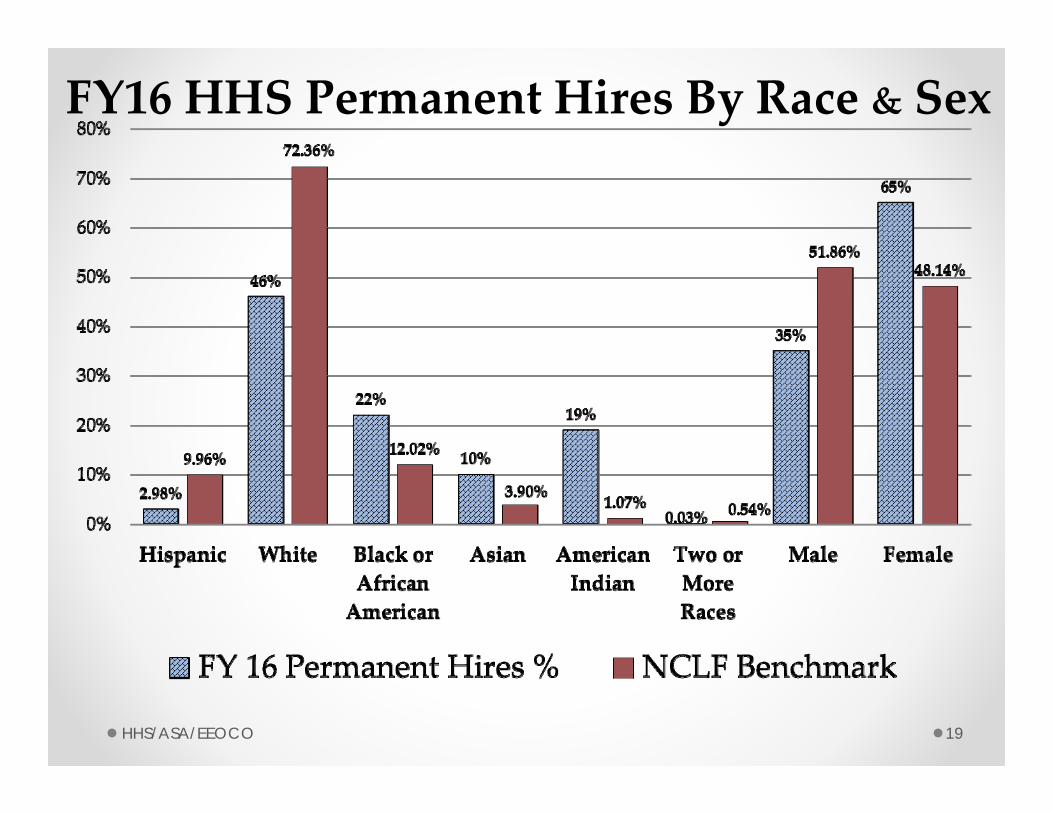
FY16 HHS Permanent Hires By Race & Sex
19HHS/ASA/EEOCO

FY16 Hispanic Employment at HHS
Less than expected rate of hire (2.98% vs 9.96%).
Hired into the 0685 Consumer Safety, 0601 General Health Science and 0401 Biological Science permanent positions at a rate greater or as expected.
Represented 11.4 percent of applicants, 10.1 percent of applicants considered qualified and 11 percent of applicants selected.
Hispanic applicants (permanent and temporary) were, “as expected” or “greater than expected”, in 9 of the 15 mission critical occupations.
Hispanics highest participation rate (4.02) is GS-14.
HHS/ASA/EEOCO 20
HHS/ASA/EEOCO 21
FY 2016 Separations
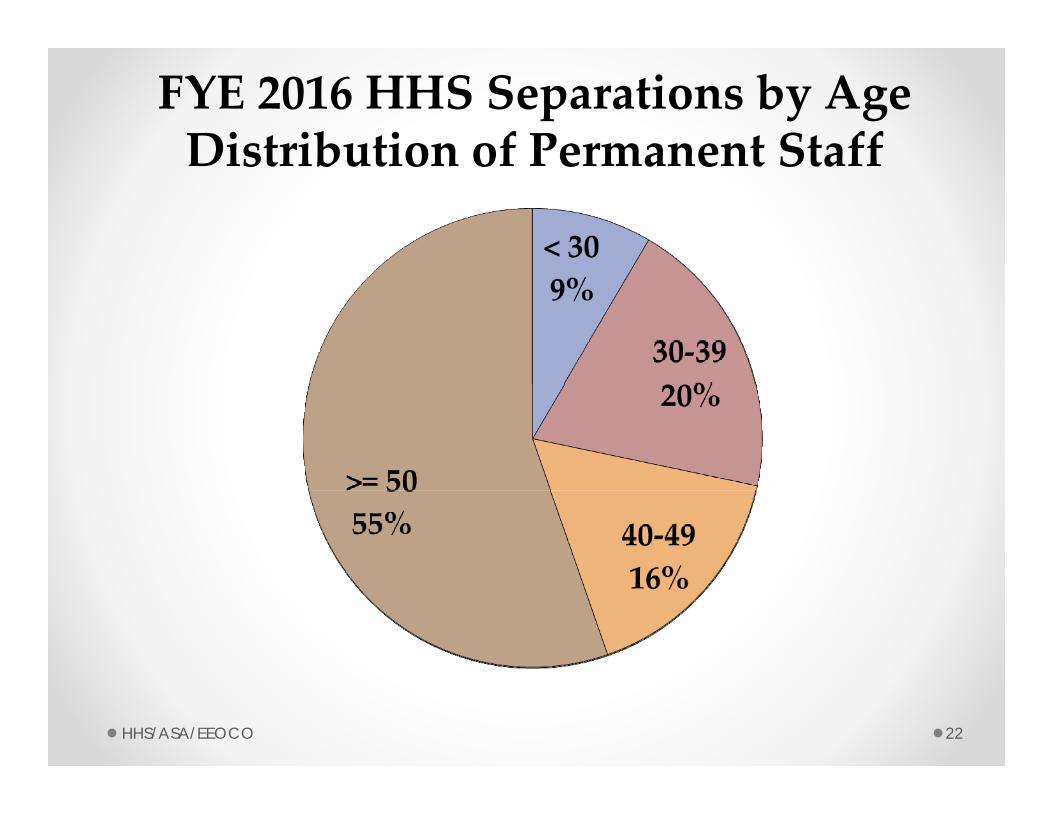
FYE 2016 HHS Separations by Age Distribution of Permanent Staff
HHS/ASA/EEOCO 22
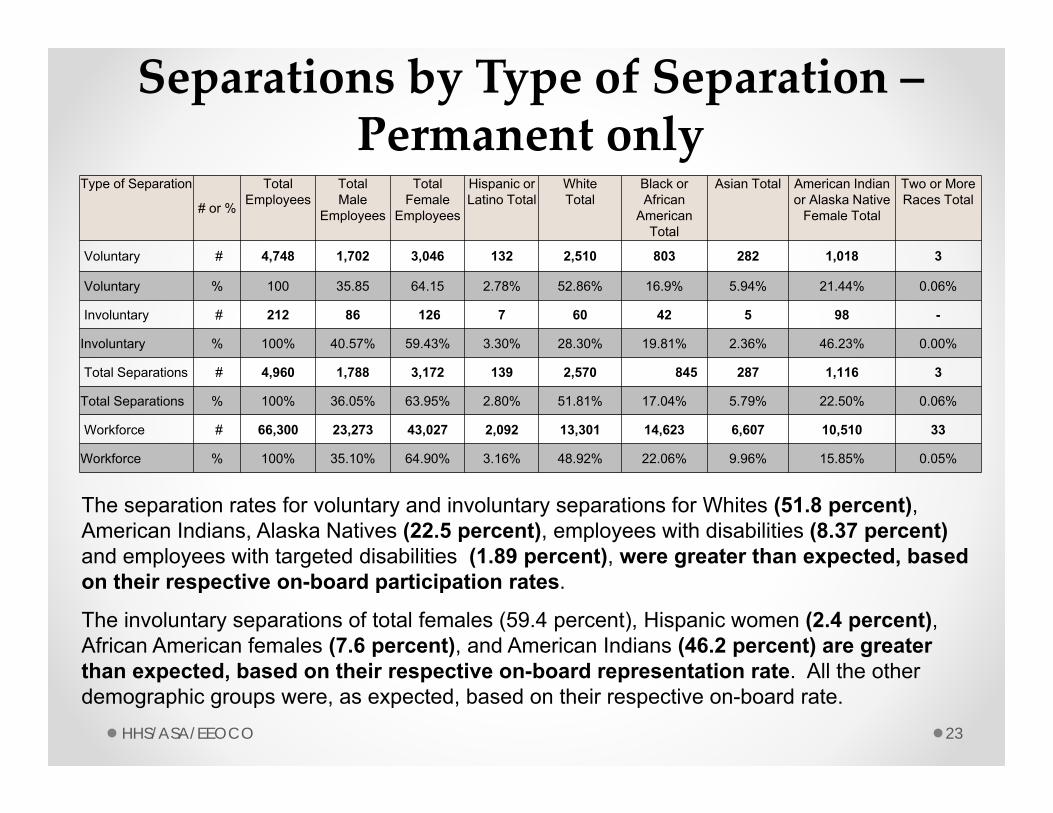
Separations by Type of Separation – Permanent only
Type of Separation
# or %
Total Employees
Total Male
Employees
Total Female Employees
Hispanic or Latino Total
White Total
Black or African American Total
Asian Total American Indian or Alaska Native Female Total
Two or More Races Total
Voluntary # 4,748 1,702 3,046 132 2,510 803 282 1,018 3
Voluntary % 100 35.85 64.15 2.78% 52.86% 16.9% 5.94% 21.44% 0.06%
Involuntary # 212 86 126 7 60 42 5 98 -
Involuntary % 100% 40.57% 59.43% 3.30% 28.30% 19.81% 2.36% 46.23% 0.00%
Total Separations # 4,960 1,788 3,172 139 2,570 845 287 1,116 3
Total Separations % 100% 36.05% 63.95% 2.80% 51.81% 17.04% 5.79% 22.50% 0.06%
Workforce # 66,300 23,273 43,027 2,092 13,301 14,623 6,607 10,510 33
Workforce % 100% 35.10% 64.90% 3.16% 48.92% 22.06% 9.96% 15.85% 0.05%
The separation rates for voluntary and involuntary separations for Whites (51.8 percent), American Indians, Alaska Natives (22.5 percent), employees with disabilities (8.37 percent) and employees with targeted disabilities (1.89 percent), were greater than expected, based on their respective on-board participation rates.
The involuntary separations of total females (59.4 percent), Hispanic women (2.4 percent), African American females (7.6 percent), and American Indians (46.2 percent) are greater than expected, based on their respective on-board representation rate. All the other demographic groups were, as expected, based on their respective on-board rate.
HHS/ASA/EEOCO 23

Separations by Type of Separation – Permanent only (Continued)
Type of Separation
# or %
Total Employees
Total Male
Employees
Total Female Employees
Hispanic or Latino Total
White Total
Black or African American Total
Asian Total American Indian or Alaska Native Female Total
Two or More Races Total
Voluntary # 4,748 1,702 3,046 132 2,510 803 282 1,018 3 Voluntary % 100 35.85 64.15 2.78% 52.86% 16.9% 5.94% 21.44% 0.06%
Involuntary # 212 86 126 7 60 42 5 98 -Involuntary % 100% 40.57% 59.43% 3.30% 28.30% 19.81% 2.36% 46.23% 0.00%
Total Separations # 4,960 1,788 3,172 139 2,570 845 287 1,116 3 Total Separations % 100% 36.05% 63.95% 2.80% 51.81% 17.04% 5.79% 22.50% 0.06%
Workforce # 66,300 23,273 43,027 2,092 13,301 14,623 6,607 10,510 33 Workforce % 100% 35.10% 64.90% 3.16% 48.92% 22.06% 9.96% 15.85% 0.05%
The percentages of total separated permanent employees’ age groups were: 8.5 percent for employees under 30 years of age; 19.2 percent for employees between 30 and 39 years of age; 16.4 percent of employees between 40 and 49 years of age; and 55.3 percent age 50 and older. The total separation rate for permanent employees with disabilities (8.37 percent) is greater than their on-board rate of 7.87%.
HHS/ASA/EEOCO 24
Forward Path
• Build on the data from the Employee
Viewpoint Survey results
• Increase efficiencies in our processes and
data quality
• Strategic outreach and recruitment
• Training focused on enhancing skill sets
and eliminating employment barriers HHS/ASA/EEOCO 25
Evaluation Survey The HHS/OHR Diversity & Inclusion Division (D&I) is committed to continuously improving HHS’ D&I program and your feedback is important to us. Therefore, we ask you to take a few minutes to complete the online evaluation for this session:
https://www.surveymonkey.com/r/DaytoDay‐State17
Your feedback is voluntary and completely anonymous and will be used to help plan upcoming Day‐to‐Day D&I sessions, compile priorities, action items, and/or next steps for the Division.
Thank you for your continued support of our efforts to make diversity and inclusion a reality in HHS.
HHS/ASA/EEOCO 26

Point of Contact
Glenn Smith, Jr. [email protected](202) 205-1437Data Analytics Team Lead,
Equal EmploymentOpportunity andCompliance Operations
Assistant Secretary for Administration
HHS/ASA/EEOCO 27