Embed Size (px)
Citation preview

1
State of South Carolina
Annual Ambient Air
Monitoring Network Plan
July 1, 2020 – December 31, 2021
Bureau of Air Quality
South Carolina Department of Health &
Environmental Control
2600 Bull Street ● South Carolina 29201 ● Phone: 803-898-4123 ● Website:
www.scdhec.gov


3
Acronyms
AQI – Air Quality Index
AQS – Air Quality System
BAQ – Bureau of Air Quality
CBSA – Core-Based Statistical Area
CFR – Code of Federal Regulation
CO – Carbon Monoxide
CSA – Combined Statistical Area
CBSA – Core Based Statistical Area
CSN – Chemical Speciation Network
CMS – Continuous Monitoring Site
DAQA – Division of Air Quality Analysis
Department – South Carolina
Department of Health and
Environmental Control
DNPH – Analysis method using 2,4-
dinitrophenylhydrazine
EPA – Environmental Protection Agency
FEM – Federal Equivalent Method
FRM – Federal Reference Method
GC/MS – Gas Chromatography / Mass
Spectroscopy
GFAA – Graphite Furnace Atomic
Absorption Spectrometry
HPLC – High Performance Liquid
Chromatography
IC – Ion Chromatography
IMPROVE – Interagency Monitoring of
Protected Visual Environments
ICP/MS – Inductively Coupled Plasma
Mass Spectroscopy
ID – Site Identification
MET – Meteorology
MOA – Memorandum of Agreement
MSA – Metropolitan Statistical Area
mSA – Micropolitan Statistical Area
µg/m3 – Micrograms per cubic meter
NAAQS – National Ambient Air Quality
Standards
NATTS – National Air Toxics Trends Site
NCore – National Core Monitoring
Network
NO – Nitric oxide
NO2 – Nitrogen Dioxide
NOx – Nitrogen Oxides
NOy – NOx and other oxidized species
NPAP – National Performance Audit
Program
OMB – Office of Management and
Budget
PEP – Performance Evaluation Program
PM2.5 – Particulate Matter < 2.5 microns
PM10 – Particulate Matter < 10 microns
PPB – Parts Per Billion
PPM – Parts Per Million
PSD – Prevention of Significant
Deterioration
PTFE – Polytetrafluoroethylene
PUF – Polyurethane Foam
QA – Quality Assurance
QAPP – Quality Assurance Project Plan
QC – Quality Control
SLAMS – State and Local Air Monitoring
Station
SO2 – Sulfur Dioxide
SPM – Special Purpose Monitor
STN – Speciation Trends Network
SVOC – Semi-volatile Organic
Compound
TAD – Technical Assistance Document
TEOM – Tapered Element Oscillating
Microbalance
TPY – Tons Per Year
TSP – Total Suspended Particulate
UV – Ultraviolet
VOC – Volatile Organic Compound

4
Table of Contents
Certification ......................................... 2
Acronyms ............................................. 3
Table of Contents ................................ 4
Introduction ......................................... 5
Public Participation Opportunities7
Network Operation ........................ 7
Station Description Content ......... 9
July 1, 2020 through December 31,
2021 Network Summary .............. 21
2018 Criteria Pollutant Design Values ......................................................... 22
2019 Criteria Pollutant Design
Values ............................................. 24
Required Monitoring .................... 29
Summary of Changes for July 1,
2020 through December 31, 2021 38
Site Descriptions ............................... 41
Augusta-Richmond County, GA-SC
MSA (part) ...................................... 41
Jackson Middle School ................. 42
Trenton ........................................... 43
Charleston-North Charleston MSA ......................................................... 44
Moncks Corner National Guard .. 46
Jenkins Ave. Fire Station .............. 47
North Charleston Fire Station
(NCFS) ............................................. 48
Irving Street ................................... 49
Cape Romain ................................. 50
FAA Beacon .................................... 52
Charleston Public Works (CPW) .. 53
Charlotte-Concord-Gastonia MSA54
York Landfill .................................. 55
Columbia MSA ............................... 56
Irmo ................................................ 58
Cayce City Hall ............................... 59
Parklane (NCore) .......................... 60
Congaree Bluff ............................... 63
Sandhill Experimental Station .... 65
Florence MSA ................................. 66
Pee Dee Experimental Station .... 67
Williams Middle School ................ 68
Johnson Controls ........................... 69
Greenville-Anderson MSA ............ 71
Big Creek ........................................ 72
Garrison Arena .............................. 73
Greenville Employment Security
Commission (ESC) .......................... 74
Hillcrest Middle School ................ 76
Myrtle Beach-Conway-North
Myrtle Beach, SC-NC MSA ............ 77
Coastal Carolina ............................ 78
Spartanburg MSA .......................... 79
North Spartanburg Fire Station #2 ......................................................... 80
T.K. Gregg Recreation Center ...... 81
Remainder of State ....................... 83
Chesterfield (NATTS) .................... 84
Howard High School #3 ................ 86
Network Development ....................... 87
Appendix A: Notification of Termination ........................................ 88
Appendix B: Site Evaluations Summary for CFR 40 Part 58, Appendix E Table ............................................... 93
Appendix C: Alphabetical Order of Monitoring Sites .............................. 105
Appendix D: Summary of Changes for July 1, 2019 through December 31, 2020 .......................................................... 106
Appendix E: EPA Correspondence108
Appendix F: Memorandum of Agreements and Waivers ............... 109
Appendix G: Summary of Public Comments Received ....................... 110
Appendix H: Ongoing Data Requirements Rule for 2010 1-hour SO2 NAAQS Verification Calendar Year 2019 .......................................................... 111

5
Introduction
The Department or its predecessors have operated an air quality monitoring network
in South Carolina since 1959. During that time, the network has continually evolved
to meet the requirements and needs of the Department’s Air Program and to comply
with federal requirements. In 2020-2021, after the new sites are established, the
network within South Carolina will be comprised of 77 monitors and samplers at 27
sites.
Map 1: 2020 South Carolina Monitoring Sites
On October 17, 2006, the EPA published revisions to the ambient monitoring
regulations (71 FR 61236) requiring quality assurance (QA), monitor designations,
minimum requirements for both number and distribution of monitors among
metropolitan statistical areas (MSAs), and probe siting changes. The regulations also
included the requirement for an annual monitoring network plan and periodic
network assessments.
This South Carolina Annual Ambient Air Monitoring Network Plan (Network Plan)
covers the eighteen-month period from July 1, 2020 through December 31, 2021. This

6
period includes a six-month implementation period during which sites indicated as
‘New’ will be identified, secured, and prepared for the installation of monitoring
equipment. It is expected that any monitoring indicated as ‘New’ or ‘Pending’ will be
installed, calibrated, and begin operating during the July 1, 2020 through December
31, 2021, time period covered by this Network Plan. This Network Plan, as required
and described in 40 CFR 58.10, and Periodic Network Assessment, must contain the
following information for each monitoring station in the network:
• The Air Quality System (AQS) site identification number (ID) for existing stations,
• Location of each monitoring station, including street address and geographical
coordinates,
• The sampling and analysis method used for each measured parameter,
• The operating schedule for each monitor,
• Any proposal to remove or relocate a monitoring station within a period of
eighteen months following the network plan submittal,
• The monitoring objective and spatial scale of representativeness for each
monitor,
• The identification of any sites that are suitable for comparison against the
Particulate Matter < 2.5 microns (PM2.5) National Ambient Air Quality Standard
(NAAQS), and
• The MSA, Core-Based Statistical Area (CBSA), Combined Statistical Area (CSA), or
other area represented by the monitor.
This document constitutes the 2020-2021 South Carolina Annual Ambient Air
Monitoring Network Plan. The site pages are organized into two main parts:
• Network Summaries: A table which presents the total number of sites and
monitors for the State, including a list of all proposed changes to the current
network, and
• Air Monitoring Station Descriptions: An outline of the designations, parameters,
monitoring methods, and the purpose for each monitor at the site.
The Monitoring Network is reviewed annually. Planned changes are described in this
Network Plan and provided for public review and comment prior to submission to
the EPA Region 4 Administrator.

7
Public Participation Opportunities
In response to public interest and the potential impact of the monitoring regulation
changes, the Department’s Air Program solicits involvement from both internal (to
the Department) and external workgroups. Opportunities for public involvement
include:
• A webpage maintained for publication and access to current and draft monitoring
plan reference documents and announcements1.
• The proposed 2020-2021 Network Plan was available for public review and
comment from April 24, 2020 through May 25, 2020. All public comments received
are summarized and addressed in Appendix F of the final 2020-2021 Network
Plan submitted to the EPA.
The Department is committed to continuing the opportunities for input and
participation in the development of the annual revisions of the Network Plan and the
periodic assessments of the air quality surveillance system.
Network Operation
The primary responsibility for the operation of the Monitoring Network is assigned
to the Division of Air Quality Analysis (DAQA) in the Bureau of Environmental Health
Services. The DAQA establishes, maintains, and operates the sites and instruments
that make up the network and performs the analysis of samples collected as part of
routine monitoring or special projects. Data generated by the network for
comparison to the NAAQS is verified to be accurate and reported by DAQA to the
national AQS database for storage and public access.
Criteria pollutant monitoring for comparison to the NAAQS is performed using the
EPA designated Federal Reference Method (FRM) or Federal Equivalent Method (FEM)
to ensure the precision and accuracy of the measurements across the air quality
surveillance system.
Regular calibration and audits of the measurement systems are performed to verify
that the instruments are operating correctly, and data being collected is accurate. All
monitors and samplers are calibrated at least once per year. Calibration is also
performed whenever the monitor/sampler fails a bi-weekly Quality Control
(QC)/precision check or multi-point audit, when maintenance is performed that may
affect the monitor response, or if the monitor is located away from the building in
which it was calibrated. If possible, a QC/precision check or flow check should
precede any maintenance that would affect monitor response.
1https://www.scdhec.gov/environment/your-air/ambient-air-monitoring-network
8
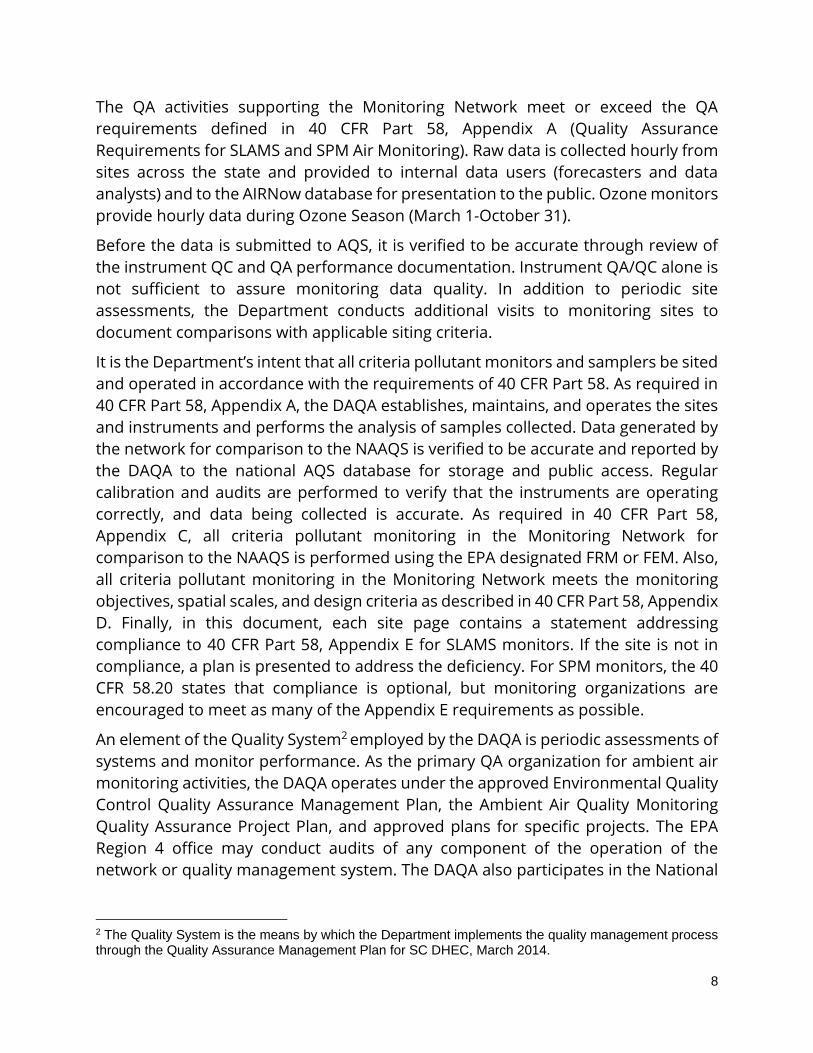
The QA activities supporting the Monitoring Network meet or exceed the QA
requirements defined in 40 CFR Part 58, Appendix A (Quality Assurance
Requirements for SLAMS and SPM Air Monitoring). Raw data is collected hourly from
sites across the state and provided to internal data users (forecasters and data
analysts) and to the AIRNow database for presentation to the public. Ozone monitors
provide hourly data during Ozone Season (March 1-October 31).
Before the data is submitted to AQS, it is verified to be accurate through review of
the instrument QC and QA performance documentation. Instrument QA/QC alone is
not sufficient to assure monitoring data quality. In addition to periodic site
assessments, the Department conducts additional visits to monitoring sites to
document comparisons with applicable siting criteria.
It is the Department’s intent that all criteria pollutant monitors and samplers be sited
and operated in accordance with the requirements of 40 CFR Part 58. As required in
40 CFR Part 58, Appendix A, the DAQA establishes, maintains, and operates the sites
and instruments and performs the analysis of samples collected. Data generated by
the network for comparison to the NAAQS is verified to be accurate and reported by
the DAQA to the national AQS database for storage and public access. Regular
calibration and audits are performed to verify that the instruments are operating
correctly, and data being collected is accurate. As required in 40 CFR Part 58,
Appendix C, all criteria pollutant monitoring in the Monitoring Network for
comparison to the NAAQS is performed using the EPA designated FRM or FEM. Also,
all criteria pollutant monitoring in the Monitoring Network meets the monitoring
objectives, spatial scales, and design criteria as described in 40 CFR Part 58, Appendix
D. Finally, in this document, each site page contains a statement addressing
compliance to 40 CFR Part 58, Appendix E for SLAMS monitors. If the site is not in
compliance, a plan is presented to address the deficiency. For SPM monitors, the 40
CFR 58.20 states that compliance is optional, but monitoring organizations are
encouraged to meet as many of the Appendix E requirements as possible.
An element of the Quality System2 employed by the DAQA is periodic assessments of
systems and monitor performance. As the primary QA organization for ambient air
monitoring activities, the DAQA operates under the approved Environmental Quality
Control Quality Assurance Management Plan, the Ambient Air Quality Monitoring
Quality Assurance Project Plan, and approved plans for specific projects. The EPA
Region 4 office may conduct audits of any component of the operation of the
network or quality management system. The DAQA also participates in the National
2 The Quality System is the means by which the Department implements the quality management process through the Quality Assurance Management Plan for SC DHEC, March 2014.

9
Performance Audit Program (NPAP) and the Performance Evaluation Program (PEP)
administered by the EPA to provide independent audits.
Station Description Content
Specific siting information for each site and monitor is stored in the EPA’s AQS, the
national ambient air database. The AQS Site Description includes the exact location
of the site, local and regional population, and description of the site location, monitor
types, and monitoring objectives. This site and monitor information are routinely
updated whenever there is a change in site characteristics or pollutants monitored.
Pictures for each monitoring site can be viewed at: https://gis.dhec.sc.gov/monitors/
The AQS is used as the primary repository for all South Carolina ambient air
monitoring information, including site descriptions. All ambient air monitoring data
is stored in AQS, including criteria pollutants, non-NAAQS parameters, ambient air
toxics, total suspended particulate (TSP), and supporting QA data.
Each network station description contained in this document includes a Site
Description and Monitor Details. An explanation of the information in each station
description is presented below.
Site Description – The site description includes specific information about each
ambient air monitoring site. The site description header includes the following:
1) Site Name – The name that is given to the site.
2) CSA/MSA – The area where the site is located as defined by the United States
Census. (September 2018).3
3) AQS Site ID – The unique site ID used in AQS is in the form of 45-cc-ssss where:
a. 45 is the federal identification code for South Carolina,
b. cc is the county identification code, and
c. ssss is the site identification code within the county.
4) Location – Typically, the street address of the site, where available.
5) County – County in which the site is located.
6) Coordinates – Latitude (N), then Longitude (W) listed in decimal degrees.
7) Date Established – The date when each existing monitoring station was
established is shown in the description. For new stations proposed in this
3 The US Census Bureau periodically adjusts CBSA names and boundaries. This plan uses the latest available revision.

10
Monitoring Plan, a date is provided when it is expected for the station to be in
operation. Individual monitors at a site may have differing start and stop dates.
8) Site Evaluation (most recent date visited) – Each monitoring station in the network
is visited annually to determine whether all required probe exposure criteria for
monitors are met. If necessary, corrective action is scheduled to address
deficiencies. If a new monitoring site has not yet been evaluated, it will be denoted
with the word “PENDING”.
Monitor Details – Each station description has a table that lists the parameter(s) and
the descriptive information associated with that particular parameter. An
explanation of the information in the tables is presented below.
1) Parameter – The chemicals that are being measured. These may be criteria
pollutants (compounds for which a NAAQS has been established), non-criteria
pollutants, and/or supporting information (primarily meteorological
measurements) measured at the site.
2) Scale – Each monitor or sampler in the monitoring network is described in
terms of the approximate physical dimensions of the air parcel nearest the
monitoring station throughout which pollutant concentrations are expected
to be reasonably similar. This is most often referred to as the “Scale” of the
monitor. Different pollutants monitored at the same location may represent
different scales depending on the characteristics of the pollutant. Area
dimensions or scales of representativeness used in the network description
are:
a. Microscale – Air volumes associated with area dimensions ranging from
several meters up to about 100 meters.
b. Middle scale – Areas up to several city blocks in size with dimensions
ranging from approximately 100 meters to 0.5 kilometers.
c. Neighborhood scale – Extended areas of a city that have relatively
uniform land use with dimensions ranging from 0.5 to 4.0 kilometers.
d. Urban scale – Citywide or equivalent rural areas with dimensions
ranging from 4 to 50 kilometers.
e. Regional scale – Areas ranging from 50 to hundreds of kilometers in
diameter.
The true representative area may best be described by an irregular shape of
the approximate dimensions indicated above to account for local sources,
topography, and differing land use.

11
The representative scale of a monitor is closely associated with the monitoring
objective.
3) Objective – The ambient air monitoring network is designed to meet three
primary objectives:
a. Provide air pollution data to the public in a timely manner. Near real-
time data is made available on the internet through AIRNow and Air
Quality Index (AQI) reporting and forecasting in the major metropolitan
areas.
b. Support compliance with ambient air quality standards and emissions
strategy development. Monitors are operated to measure
concentrations for comparison to NAAQS and to provide information to
aid in the development of strategies to improve air quality.
c. Support air pollution research studies. Data from the monitoring
network support greater understanding of the impacts and effects of
ambient air pollution.
Individual monitors within a monitoring network that support these basic
objectives generally serve one or more of the following purposes:
i. Determine highest concentrations of pollutants,
ii. Determine representative concentrations in areas of high
population density,
iii. Determine impact on air quality of significant sources or source
categories,
iv. Determine general background concentrations,
v. Determine extent of regional pollutant transport, and
vi. Determine welfare-related impacts in more rural and remote
areas (ex. visibility impairment and impacts to vegetation).
The design intent in siting stations is to correctly match the area represented
by the sample of monitored air with the scale most appropriate to meet the
monitoring objective of the monitor. The relationship of appropriate scale to
the six basic purposes is as follows:
Monitoring Purpose Siting Scale
Highest concentration Micro, Middle, Neighborhood

12
Monitoring Purpose Siting Scale
Population exposure Neighborhood, Urban
Source impact Micro, Middle, Neighborhood
General/background Neighborhood, Urban, Regional
Regional transport Urban, Regional
Welfare-related impacts Urban, Regional
Monitor and sampler data is regularly reviewed to assure the assigned scale is
correct and appropriate for the intended objective.
4) Designation – Monitor designations that may be found in the tables include
the State and Local Air Monitoring Station (SLAMS), special purpose monitor
(SPM), National Core Monitoring Network (NCore), non-regulatory, QA
collocated, and IMPROVE monitoring. Definitions of these designations are:
a. SLAMS – Monitors for which NAAQS have been established. These
stations must meet requirements that relate to four major areas:
QA/QC, monitoring methodology, sampling interval, and siting of
instruments and instrument probes.
b. SPM – Monitors which support investigations addressing complaints,
areas and pollutants of concern, network refinement, modeling
verification, and compliance. These monitors are committed to
investigation and projects as described in the associated Quality
Assurance Project Plan (QAPP). They may be located as separate
monitoring stations or be included at existing monitoring locations. The
SPM may also monitor for air toxics, particulate, criteria pollutants,
precipitation, and meteorology. Supplemental speciation is a type of
SPM monitor that operates according to Chemical Speciation Network
(CSN) protocols but is not contained in the STN Network. This
monitoring data is reported to AQS by the University of California -
Davis. Although siting and probe exposure will conform to all
requirements for SLAMS monitors whenever possible, the 40 CFR Part
58.20 states that compliance for SPM monitors is optional.
c. NCore – NCore is a national multi-pollutant network that utilizes
advanced measurement systems for particles, pollutant gases, and
meteorology. It provides data for long-term trends of criteria and non-
13
criteria pollutants, and supports air quality model evaluation, scientific
studies, and ecosystem assessments. Most NCore monitors are SLAMS.
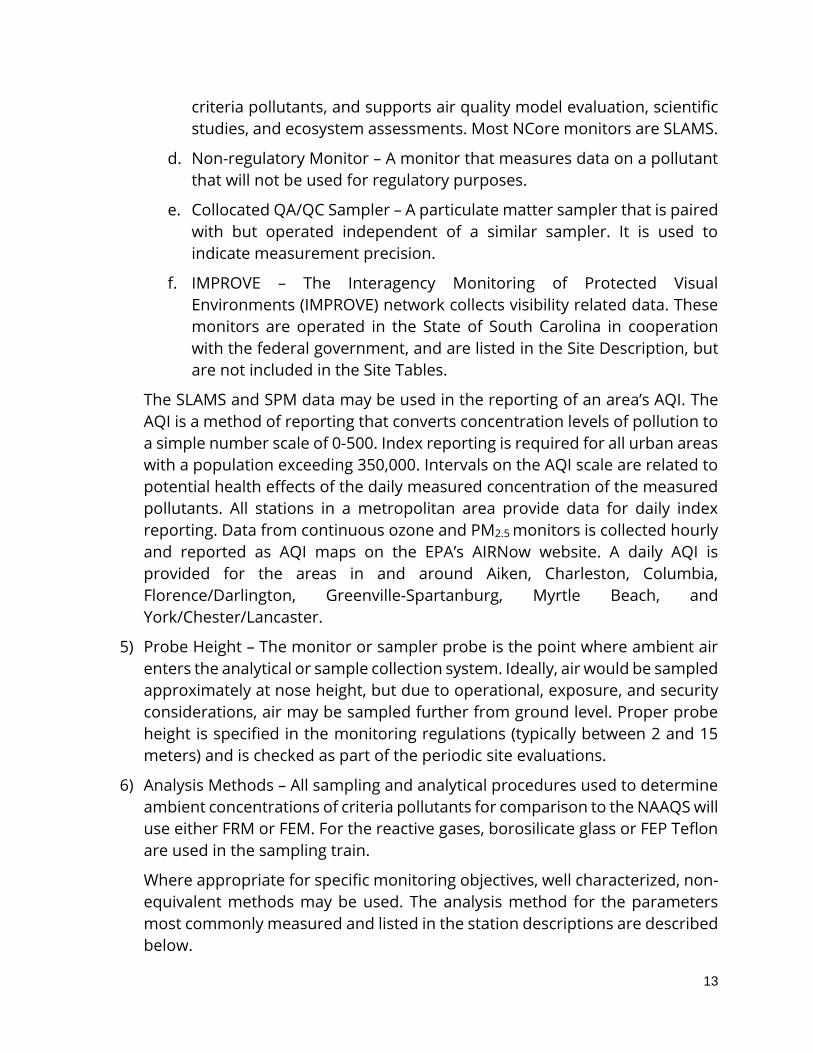
d. Non-regulatory Monitor – A monitor that measures data on a pollutant
that will not be used for regulatory purposes.
e. Collocated QA/QC Sampler – A particulate matter sampler that is paired
with but operated independent of a similar sampler. It is used to
indicate measurement precision.
f. IMPROVE – The Interagency Monitoring of Protected Visual
Environments (IMPROVE) network collects visibility related data. These
monitors are operated in the State of South Carolina in cooperation
with the federal government, and are listed in the Site Description, but
are not included in the Site Tables.
The SLAMS and SPM data may be used in the reporting of an area’s AQI. The
AQI is a method of reporting that converts concentration levels of pollution to
a simple number scale of 0-500. Index reporting is required for all urban areas
with a population exceeding 350,000. Intervals on the AQI scale are related to
potential health effects of the daily measured concentration of the measured
pollutants. All stations in a metropolitan area provide data for daily index
reporting. Data from continuous ozone and PM2.5 monitors is collected hourly
and reported as AQI maps on the EPA’s AIRNow website. A daily AQI is
provided for the areas in and around Aiken, Charleston, Columbia,
Florence/Darlington, Greenville-Spartanburg, Myrtle Beach, and
York/Chester/Lancaster.
5) Probe Height – The monitor or sampler probe is the point where ambient air
enters the analytical or sample collection system. Ideally, air would be sampled
approximately at nose height, but due to operational, exposure, and security
considerations, air may be sampled further from ground level. Proper probe
height is specified in the monitoring regulations (typically between 2 and 15
meters) and is checked as part of the periodic site evaluations.
6) Analysis Methods – All sampling and analytical procedures used to determine
ambient concentrations of criteria pollutants for comparison to the NAAQS will
use either FRM or FEM. For the reactive gases, borosilicate glass or FEP Teflon
are used in the sampling train.
Where appropriate for specific monitoring objectives, well characterized, non-
equivalent methods may be used. The analysis method for the parameters
most commonly measured and listed in the station descriptions are described
below.

14
a) Particulate Matter less than 10 microns (PM10) – PM10 samplers operated
by the Department are designated as either FRM or FEM and are operated
consistent with the requirements in 40 CFR Part 50, Appendix J and 40 CFR
Part 58. The PM10 samplers located at the Chesterfield Site are used for the
NATTS metals at Chesterfield.
Continuous PM10 monitors provide 24-hour concentration measurements
every day. During sampling, ambient air passes through an inlet designed
to pass only particles smaller than 10 microns in diameter. The flow rate,
critical to precise particle size separation, is monitored and controlled
constantly. Particulate in the sample stream is collected on a Teflon-coated
glass fiber filter. The mass collected on the filter is also continuously
monitored. The difference between the current filter weight and the
previous weight gives the total mass of the collected particulate for that
period. The mass concentration is calculated by dividing the mass gained
by the flow through the filter for the period. The concentration
measurements are averaged over 1-hour and 24-hour periods. Data is
stored locally on redundant data acquisition systems and recovered hourly
by a central office computer system (AirVision). Only 24-hour daily averages
are used for comparison to the ambient standards.
b) Particulate Matter less than 2.5 microns (PM2.5) – All PM2.5 samplers
operated by the Department for comparison to the NAAQS are designated
FRM samplers. Manual samplers are operated consistent with the
requirements in 40 CFR Part 50, Appendix L. Samples are collected on 46.2-
millimeter polytetrafluoroethylene (PTFE) filters over a 24-hour sampling
period. Air flow through the filter is maintained at 16.7 liters per minute at
local ambient temperature and pressure. The flow rate must be maintained
within ±5 percent throughout the sample period. Sample filters are
collected within 177 hours of the end of the sample run and are kept cooled
during transit to minimize potential sample loss.
The PTFE filters are equilibrated before each weighing for a minimum of 24
hours at a mean temperature between 20°C and 23°C and 30 to 40 percent
mean relative humidity. Filters are weighed before and after the sample
period. Filters are used within thirty days of initial weighing. Collected
samples are typically weighed within two weeks of sampling. If the samples
are maintained below 4°C after collection, they can be held for up to thirty
days from the end of the sample period. The mass collected and the
volume sampled are used to calculate the concentration, expressed in
µg/m3.

15
Unless designated a FEM, continuous PM2.5 monitors do not provide
concentration data suitable for comparison to the NAAQS. Non-FEM
continuous monitors that provide reasonably comparable measurements
may be used to provide data for calculation of an area AQI. Continuous
PM2.5 samplers provide 24-hour concentration measurements every day.
During sampling, ambient air passes through an inlet system designed to
pass only particles smaller than 2.5 microns in diameter. The flow rate,
critical to precise particle size separation, is monitored and controlled
constantly. Particulate in the sample stream is collected on a Teflon-coated
glass fiber filter. The mass collected on the filter is also continuously
monitored. The difference between the current filter weight and the
previous weight gives the total mass of the collected particulate for that
period. The mass concentration is calculated by dividing the mass gained
by the flow through the filter for the period. The concentration
measurements are averaged over 1-hour and 24-hour periods. Data is
stored locally on redundant data acquisition systems and recovered hourly
by a central office computer system (AirVision). Only 24-hour daily averages
from FEM monitors are used for comparison to the ambient standards.
c) PM2.5 Speciation sampling – In addition to operating PM2.5 samplers that
provide measurement of only the PM2.5 mass concentration, the
Department also operates a PM2.5 Speciation sampler to collect samples
for analysis to determine the chemical makeup of the particulate.
Speciation sample collections are part of the national CSN. Samples are
collected on a set of two cartridges on the Met-One SASS sampler for
nitrates, sulfates, and metals and on a single cartridge in the URG 3000N
sampler for carbon containing material. The samples are collected over a
24-hour sampling period. The individual cartridges contain denuders and
filters designed to efficiently capture the major components of PM2.5.
After collection, the samples are shipped cold to an EPA contract laboratory
for analysis. At the laboratory, the samples are analyzed using thermal
optical analysis (for carbon), ion chromatography (IC) for nitrates and
sulfates, and x-ray fluorescence for metals to determine the presence and
concentration of specific compounds. Sample results are available on the
EPA website.
d) Sulfur Dioxide (SO2) – Instruments used to continuously monitor SO2
concentrations in the atmosphere use the Ultraviolet (UV) Fluorescence
Federal Reference Method. The continuous data output from the

16
instrument is stored locally on redundant data acquisition systems and
recovered hourly by central office computer system (AirVision).
Calibration of these instruments and audits of their performance are done
using the EPA protocol gas mixtures containing a certified concentration of
SO2 in nitrogen. This gas is diluted to provide known concentrations of SO2.
These known concentrations are supplied to the instrument, which is
adjusted so the instrument output corresponds with the specific
concentrations.
e) Carbon Monoxide (CO) – Continuous monitoring for CO is performed using
the FRM non-dispersive infrared correlation method. Data is stored locally
on redundant data acquisition systems and recovered hourly by the DAQA
central office computer system (AirVision).
Calibration of the instrument and audits of its performance are done using
the EPA Protocol gas mixtures containing a certified concentration of CO in
air. The gas is diluted to provide known concentrations of CO. Known
concentrations are supplied to the instrument, which is adjusted so the
instrument output corresponds with the specific concentrations.
Ozone – Ozone is monitored using the FEM UV photometry method. The
continuous data output from the instrument is stored locally on redundant
data acquisition systems and recovered hourly by the central office
computer system (AirVision). Monitors are routinely calibrated, and their
performance audited using portable ozone transfer standards.
Nitrogen Dioxide (NO2) – The FRM UV chemiluminescence method is used
for measurement of NO2 concentration in the ambient air. The continuous
data output from the instrument is stored locally on redundant data
acquisition systems and recovered hourly by a central office computer
system (AirVision).
Calibration of the instrument and audits of their performance are done
using the EPA protocol gas mixtures containing a known concentration of
Nitric Oxide (NO) and Nitrogen Oxides (NOX) in nitrogen. The gas is diluted
to present several known concentrations of the oxides. A converter is used
to convert NO2 to NO for reaction with internally generated ozone and
measurement of the light produced by the reaction of NO and ozone.
Known concentrations are supplied to the instrument, which is adjusted so
the instrument output corresponds with the supplied concentrations.
f) Lead – Lead concentrations are determined by the analysis of TSP collected
using high volume particulate samplers as described in 40 CFR Part 50,

17
Appendix G. Particulate samples are extracted in accordance with IO-3.1
and analyzed by Inductively Coupled Plasma Mass Spectroscopy (ICP/MS)
using IO-3.5. The analysis also follows any additional NATTS requirements.
g) Meteorology – Meteorology consists of wind direction, wind speed,
precipitation, temperature, and pressure. Collection and/or analysis
methods are discussed below.
a. Wind Direction and Speed – Wind data is collected using systems that
incorporate high precision ‘Air Quality’ systems. The systems use
separate or combined wind vanes and anemometers mounted 10
meters above ground. The systems provide supporting information
about the local meteorology.
b. Precipitation – Precipitation is measured by tipping bucket gauges that
provide a signal indicating the occurrence, rate, and amount of
precipitation. The gauges are not heated, so they may not accurately
provide the time and rate for frozen precipitation events. The monitors
are checked periodically for operation and accuracy using a known
volume of water and compared with actual volumes of collected
precipitation where there are collocated samplers.
c. Ambient Temperature and Pressure – Ambient temperature is available
from sensors that are part of the sampling systems for the FRM PM2.5
samplers. Ambient temperature measurement is necessary for the
systems to maintain the required flow rate used to reproducibly
separate the desired particulate size fractions as conditions change.
Although the primary use of the measurement is for sampler flow
control, the sensors are accurate and regularly audited. Temperature
and pressure sensors are compared to reference systems at least once
per month.
h) Volatile Organic Compounds – Volatile organic compounds (VOCs) are
collected into passivated or silica lined stainless steel canisters. The
canisters are cleaned, tested, and evacuated at the laboratory prior to
installation at the sampling site. At the sampling location, the canisters are
filled and pressurized with ambient air throughout the sampling period
(typically 24 hours). Measured portions of the captured air are
concentrated at low temperature and analyzed using gas chromatography
with a mass spectrometer detector (GC/MS) to identify and quantitate
target compounds. The collection and analysis method are based on the
EPA Method TO-15 and the NATTS Technical Assistance Document (TAD).

18
i) Semi-volatile Organic Compounds – Semi-volatile organic compounds
(SVOCs) are collected using polyurethane foam (PUF) and a solid adsorbent
to trap the compounds from air pulled through the material by a high-
volume sampler. The SVOCs are extracted from the collection cartridge
using a solvent, and the rinses are concentrated for analysis. Measured
portions of the extract are analyzed using GC/MS to identify and quantitate
the collected compounds. The collection and analysis method are based on
the EPA Method TO-13 and the NATTS TAD.
j) Carbonyls – Carbonyls (including aldehydes and ketones) are extracted
from ambient air by reaction with a compound that stabilizes them enough
to capture and hold. The reaction of the target compounds with
Dinitrophenylhydrazine (DNPH) removes them from the sampled air and
concentrates them in the sample cartridge. Solvent extraction of the DNPH
derivatives from the cartridge is followed by analysis using High Pressure
Liquid Chromatograph to identify and quantitate the collected Carbonyls.
The collection and analysis method are based on the EPA Method TO-11
and the NATTS TAD.
k) Metals – Metals in particulate are collected on filters using the TSP or PM10
High Volume samplers. Metals are extracted from a portion of the filter
using sonication in an acid solution. Detection, identification, and
quantitation of the target metals inductively coupled plasma with a mass
spectrometer (ICP/MS). The collection and analysis method are based on
the EPA Method IO-3.1, IO-3.5, and the NATTS TAD.
l) Precipitation Chemistry – A portion of the precipitation sample collected
each week is analyzed for pH and conductivity. To determine
concentrations of dissolved material that contributes to acid rain, the
collected material is analyzed for cations and anions using ion
chromatography (IC).
7) Sampling frequency – Sampling frequency indicates how often a
measurement is made. Sampling typically involves collection of a sample over
a period (typically 24 hours, midnight to midnight EST) and the delivery of the
sample to the laboratory for preparation and analysis. Samples are collected
every day (1:1), every third day (1:3), every sixth day (1:6), every twelfth day
(1:12), or weekly, depending on the data quality objectives of the project.
Results are reported as averages for the sample period. The EPA publishes the

19
1:3 and 1:6 day sampling schedules used by the South Carolina Ambient Air
Monitoring Network and nationwide4.
8) Monitoring – Monitoring typically uses on-site analyzers that continuously
sample the air and measure the pollutant of interest. Results of the analysis
are reported as hourly averages. Five-minute averages are also reported for
SO2 concentrations. One-minute averages are collected from many of the
continuously monitored parameters for use in verification and validation of
the reported monitoring data.
4 http://www.epa.gov/ttn/amtic/calendar.html

20
This page left intentionally blank

21
July 1, 2020 through December 31, 2021 Network Summary
This summary table presents the elements of the 2020-2021 Monitoring Plan.
Network Summary: Calendar Year July 1, 2020 through December 31, 2021 Air Monitoring Stations and Monitors
Region
Sit
es
PM
2.5
PM
2.5
Co
nt.
Sp
eci
ati
on
PM
10
Le
ad
Ozo
ne
SO
2
NO
2/N
O/N
Oy
CO
Me
tals
Ca
rbo
nyls
SV
OC
VO
C
Pre
cip
. C
he
m.
Pre
cip
ita
tio
n
ME
T
Augusta-Richmond County, GA-SC MSA 2 1 1 0 0 0 2 0 0 0 0 0 0 0 0 0 0
Charleston-N. Charleston MSA 5 2 3 0 1 0 2 2 3 0 0 0 0 0 0 1 1
Charlotte-Concord-Gastonia, NC-SC MSA 1 0 0 0 0 0 1 1 0 0 0 0 0 0 0 0 0
Columbia MSA 5 3 2 1 1 0 3 1 2 1 0 0 1 0 2 2 1
Florence MSA 5 1 1 0 0 *7 1 0 0 0 0 0 0 0 0 0 0
Greenville-Anderson MSA 4 3 1 0 1 0 3 1 1 0 0 0 0 0 0 0 0
Myrtle Beach-Conway-North Myrtle Beach, SC-
NC MSA 1 0 0 0 0 0 1 0 0 0 0 0 0 0 0 0 0
Spartanburg MSA 2 2 1 0 0 0 1 0 0 0 0 0 0 0 0 0 0
Remainder of State 2 1 1 0 0 0 1 0 0 0 2 2 2 2 0 1 0
TOTALS 27 13 10 1 3 7 15 5 6 1 2 2 3 2 2 4 2
*In order to maximize resources, alternate lead samplers are run on different days (See Site pages for specific information).

22
2018 Criteria Pollutant Design Values
This section presents the 2018 certified design values for the South Carolina criteria pollutant monitoring network.
Site ID
County Site Name Ozone (ppm)
PM2.5 Annual (µg/m3)
PM2.5 24-hour (µg/m3)
PM10 (# Expect-
ed Exceed-ances)
SO2
1-hour (ppb)
NO2 1-
hour (ppb)
NO2 Annual (ppb)
CO 8-
hour (ppm)
CO 1-
hour (ppm)
Lead (µg/m3)
003-0003
Aiken Jackson Middle School
0.062
007-0005
Anderson Big Creek 0.057
015-0002
Berkeley Bushy Park 0.058
019-0003
Charleston Jenkins Avenue
0 13 *35 *7
019-0046
Charleston Cape
Romain 0.061 4 *10 1
019-0048
Charleston FAA 7.2 16
019-0049
Charleston Charleston
Public Works
7.2 15
025-0001
Chesterfield Chesterfield 0.062 *6.9 *14 0
029-0002
Colleton Ashton 0.056
031-0003
Darlington Pee Dee 0.060
037-0001
Edgefield Trenton 0.060 8.2 19
041-0003
Florence Williams *7.8 *17

23
Site ID
County Site Name Ozone (ppm)
PM2.5 Annual (µg/m3)
PM2.5 24-hour (µg/m3)
PM10 (# Expect-
ed Exceed-ances)
SO2
1-hour (ppb)
NO2 1-
hour (ppb)
NO2 Annual (ppb)
CO 8-
hour (ppm)
CO 1-
hour (ppm)
Lead (µg/m3)
041-8001
Florence JCI Railroad *0.05
041-8002
Florence JCI
Entrance *0.08
041-8003
Florence JCI River *0.03
043-0011
Georgetown Howard #3 0
045-0015
Greenville Greenville
ESC 8.3 23 0 2 41 8
045-0016
Greenville Hillcrest 0.062
7.9
17
063-0008
Lexington Irmo 8.5 19 *3
063-0010
Lexington Cayce City
Hall 0
073-0001
Oconee Long Creek 0.063 *6.0 *14 2
077-0002
Pickens Clemson 0.062
077-0003
Pickens Wolf Creek 0.062
079-0007
Richland Parklane 0.061 7.8 16 * 2 1 1 *0
079-0021
Richland Congaree
Bluff 0.055 3
079-1001
Richland Sandhill 0.064 *37 *4

24
Site ID
County Site Name Ozone (ppm)
PM2.5 Annual (µg/m3)
PM2.5 24-hour (µg/m3)
PM10 (# Expect-
ed Exceed-ances)
SO2
1-hour (ppb)
NO2 1-
hour (ppb)
NO2 Annual (ppb)
CO 8-
hour (ppm)
CO 1-
hour (ppm)
Lead (µg/m3)
083-0009
Spartanburg North
Spartan-burg
0.065
083-0011
Spartanburg T.K. Gregg 8.0 16
* denotes design values that did not meet data completeness requirements.
2019 Criteria Pollutant Design Values
This section presents the 2019 design values for the South Carolina criteria pollutant monitoring network. This data
will be certified in May 2020.
Site
ID County Site Name
Ozone
(ppm)
PM2.5
Annual
(µg/m3)
PM2.5
24-
hour
(µg/m3)
PM10 (#
Expect-
ed
Exceed-
ances)
SO2 1-
hour
(ppb)
NO2
1-
hour
(ppb)
NO2
Annual
(ppb)
CO
8-
hour
(ppm)
CO
1-
hour
(ppm)
Lead
(µg/m3)
003-
0003 Aiken
Jackson
Middle
School
0.063
007-
0005 Anderson Big Creek 0.058
015-
0002 Berkeley Bushy Park *0.060
019-
0003 Charleston
Jenkins
Avenue 0 15 *36 *6

25
Site
ID County Site Name
Ozone
(ppm)
PM2.5
Annual
(µg/m3)
PM2.5
24-
hour
(µg/m3)
PM10 (#
Expect-
ed
Exceed-
ances)
SO2 1-
hour
(ppb)
NO2
1-
hour
(ppb)
NO2
Annual
(ppb)
CO
8-
hour
(ppm)
CO
1-
hour
(ppm)
Lead
(µg/m3)
019-
0046 Charleston
Cape
Romain 0.062 4 *9 *1
019-
0048 Charleston FAA 7.0 15
019-
0049 Charleston
Charleston
Public
Works
7.1 15
025-
0001 Chesterfield Chesterfield 0.063 *7.0 *14 0
031-
0003 Darlington Pee Dee 0.061
037-
0001 Edgefield Trenton *0.061 7.7 16
041-
0003 Florence Williams *7.7 *17
041-
8001
Florence
JCI Railroad
*0.05
041-
8002 Florence JCI Entrance *0.09
041-
8003 Florence JCI River *0.07
043-
0011 Georgetown Howard #3 0

26
Site
ID County Site Name
Ozone
(ppm)
PM2.5
Annual
(µg/m3)
PM2.5
24-
hour
(µg/m3)
PM10 (#
Expect-
ed
Exceed-
ances)
SO2 1-
hour
(ppb)
NO2
1-
hour
(ppb)
NO2
Annual
(ppb)
CO
8-
hour
(ppm)
CO
1-
hour
(ppm)
Lead
(µg/m3)
045-
0015 Greenville
Greenville
ESC 7.8 18 0 1 40 8
045-
0016 Greenville Hillcrest 0.063
7.6
16
051-
0008 Horry
Coastal
Carolina 0.060
063-
0008 Lexington Irmo 7.7 17 2
063-
0010 Lexington
Cayce City
Hall 0
073-
0001 Oconee Long Creek 0.060 *5.8 *14 1
077-
0002 Pickens Clemson 0.063
077-
0003 Pickens Wolf Creek 0.062
079-
0007 Richland Parklane 0.061 7.6 14 * 2 1 1
079-
0021 Richland
Congaree
Bluff 0.055 3
079-
1001 Richland Sandhill 0.063 *34 3

27
Site
ID County Site Name
Ozone
(ppm)
PM2.5
Annual
(µg/m3)
PM2.5
24-
hour
(µg/m3)
PM10 (#
Expect-
ed
Exceed-
ances)
SO2 1-
hour
(ppb)
NO2
1-
hour
(ppb)
NO2
Annual
(ppb)
CO
8-
hour
(ppm)
CO
1-
hour
(ppm)
Lead
(µg/m3)
083-
0009 Spartanburg
North
Spartan-
burg
0.064
083-
0011 Spartanburg T.K. Gregg 7.7 15
091-
0008 York
York
Landfill 0.067
* denotes design values that did not meet data completeness requirements.

28
This page left intentionally blank

29
Required Monitoring
The EPA regulation 40 CFR Part 58 requires that each state maintain a minimum
number of monitors to properly characterize air quality and to meet any required
objectives of the monitoring network5. In general, these minimum requirements
are based on the MSA population and current ambient air monitoring design
values. The following sections discuss the minimum monitoring criteria from 40 CFR
Part 58, Appendix D for each of the criteria pollutants (ozone, particulate matter
(PM2.5 and PM10), lead, SO2, NO2, and CO), the CBSAs, and the MSA population. The
final section shows the current South Carolina minimum monitoring requirements.
Minimum Monitoring for Ozone – The ozone minimum monitoring criteria has two
requirements:
1) Required Ozone SLAMS sites – A minimum number of required ozone SLAMS
sites for each CBSA that is determined by CBSA population and the peak ozone
concentrations.
2) NCore Requirement – Each NCore site must include an ozone monitor. The
Parklane (45-079-0007) Site in Columbia, South Carolina is the NCore site for
South Carolina.
Minimum Monitoring for PM2.5 – The PM2.5 minimum monitoring criteria has six
requirements:
1) Required PM2.5 SLAMS sites – A minimum number of required PM2.5 SLAMS sites
for each CBSA.
2) Continuous Requirement – A continuous PM2.5 monitoring requirement which
is equal to at least one-half (round up) the minimum required PM2.5 SLAMS sites.
Also, at least one required continuous analyzer in each CBSA must be collocated
with one of the required FRM or FEM monitors, unless at least one of the
required FRM/FEM monitors is itself a continuous FEM monitor, in which case,
no collocation requirement applies.
3) Regional Background and Transport – At least one PM2.5 site must be
established in each state to monitor for regional background and at least one
PM2.5 site to monitor regional transport. The Cape Romain (45-019-0046) Site in
Charleston County is the regional background site and the Chesterfield (45-025-
0001) Site in Chesterfield County is the regional transport site.
4) NCore Requirement – Each state is required to operate at least one NCore site
which measures PM2.5 using both continuous and integrated/filter-based
5 40 CFR 58.11 paragraph (a)(3)(c) and Appendix D to 40 CFR Part 58.

30
samplers. The Parklane (45-079-0007) Site in Columbia, South Carolina is the
NCore site for South Carolina.
5) Near-road PM2.5 Monitoring – The EPA required the collocation of one PM2.5
monitor with a near-road NO2 monitor in urban areas having populations of
1,000,000 or more by January 1, 2017. The Charlotte-Concord-Gastonia, NC-SC
MSA is the only MSA in South Carolina that met the population requirement for
a collocated PM2.5 monitor. The near-road monitoring requirement for the
Charlotte-Concord-Gastonia, NC-SC MSA is being fulfilled at the Remount Road
(37-119-0045) Site by the Mecklenburg County Air Quality Commission
6) Speciation Monitoring – Chemical speciation monitoring is conducted at the
Parklane (45-079-0007) Site and is funded as part of the PM2.5 Speciation Trends
Network (STN).
Minimum Monitoring for PM10 – The PM10 minimum monitoring criteria has one
requirement that is based on the CBSA population, the number of exceedances of
the NAAQS, and the percentage of PM10 concentrations over or under the NAAQS.
Unlike other criteria pollutants, the minimum monitoring requirement for PM10 is
given as a range of required monitoring sites for a CBSA.
Minimum Monitoring for Lead – The lead minimum monitoring criteria has one
requirement that any facility with annual lead emissions exceeding 0.5 tpy will be
required to have a lead sampler. Based on the state-submitted 2014 National
Emissions Inventory, there are no facilities in South Carolina with lead emissions
greater than 0.5 tpy.
On May 7, 2010, the Department issued an air synthetic minor construction permit
to Johnson Controls Battery Group for the Florence Recycling Center (Permit No.
1040-0129-CA). The company has since changed its name to Clarios, LLC. Under a
settlement agreement6 with several petitioners, the Florence Recycling Center
supports source-oriented ambient lead monitoring being conducted by the
Department at several sites around the facility. Additional details of the monitoring
of this facility can be found in the Florence MSA section of this Monitoring Plan
under the Site name “Johnson Controls.”
Minimum Monitoring for SO2 – The SO2 minimum monitoring criteria has three
requirements:
6https://www.scdhec.gov/sites/default/files/docs/HomeAndEnvironment/Docs/JCI/JCI-Settlement%20Agreement_07142010.pdf

31
1) Requirement for Monitoring by the Population Weighted Emissions Index –
The population weighted emissions index (PWEI) is determined using the
most current population of each CBSA and the most recent level of SO2
emissions for each county within the CBSA. The emissions data is available
from the National Emissions Inventory. For any CBSA with a calculated PWEI
value equal to or greater than 1,000,000, a minimum of three SO2 monitors
are required. For any CBSA with a calculated PWEI value equal to or greater
than 100,000, but less than 1,000,000, a minimum of two SO2 monitors are
required. For any CBSA with a calculated PWEI value equal to or greater than
5,000, but less than 100,000, a minimum of one SO2 monitor is required.
The following table presents each CBSA’s 2019 population, 2014 SO2
emissions, calculated index, and minimum monitoring requirements. The
process for calculating the index can be found at the bottom of the table.
CBSA 2019 CBSA
Population
2014 CBSA SO2
Emissions
(Tons)
PWEI
SO2
Minimum
Monitors
Required
*Charlotte-Concord-
Gastonia, NC-SC MSA 2,636,883 7,624 20,104 1
Greenville-Anderson MSA 920,477 2,928 2,695 0
Columbia MSA 838,433 17,769 14,898 1
Charleston-North
Charleston MSA 802,122 15,784 12,661 1
*Augusta-Richmond
County, GA-SC MSA 608,980 3,353 2,042 0
*Myrtle Beach-Conway-
North Myrtle Beach, SC-
NC MSA
496,901 4,837 2,404 0
Spartanburg MSA 319,785 386 123 0
Hilton Head Island-
Bluffton MSA 222,195 1,164 259 0
Florence MSA 204,911 3,982 816 0
Sumter MSA 140,466 191 27 0 The PWEI is calculated using US Census population data and state emission inventory data at the CBSA level.
The population for each CBSA (based on the most recent US Census or Census estimate) is multiplied by the
CBSA total SO2 emissions (reported in tons using the latest National Emissions Inventory data). This product
is divided by 1,000,000 to derive the index. CBSA with index greater than 1,000,000 will require 3 monitors.
CBSA with index less than 1,000,000 but greater than 100,000 will require 2 monitors. CBSA with index less
than 100,000 but greater than 5,000 will require 1 monitor. CBSA with index less than 5,000 will require no
monitors.

32
*Monitors may be operated in the non-South Carolina portion of the CBSA.
2) Regional Administrator Required Monitoring – The Regional Administrator
may require additional SO2 monitoring sites above the minimum number of
monitors required by the PWEI in areas that have the potential to have high
SO2 concentrations, in areas impacted by sources which are not conducive
to modeling, or in locations with susceptible and vulnerable populations that
are not otherwise being monitored. South Carolina does not have any SO2
Regional Administrator Required Monitoring.
3) NCore Requirement – Each NCore site must include a SO2 monitor. The
Parklane (45-079-0007) Site in Columbia, South Carolina is the NCore site for
South Carolina.
Minimum Monitoring for NO2 – The NO2 minimum monitoring criteria has four
requirements:
1) Near-road NO2 Monitors – Each state must have one microscale near-road
NO2 monitoring site in each CBSA with a population of at least 1,000,000 or
more persons. An additional near-road NO2 monitoring site is required for
any CBSA with a population of 2,500,000 or more, or in any CBSA with a
population of 1,000,000 or more that has one or more roadway segments
with 250,000 or greater Annual Average Daily Traffic (AADT) counts. The
Charlotte-Gastonia-Concord NC-SC MSA meets the population requirement
of at least 2,500,000 or more persons. The first near-road site is the Remount
Road Site. It is located in Charlotte, North Carolina. The second near-road
site is commented on by North Carolina in the 2019-2020 Annual Monitoring
Network Plan-Mecklenburg County Air Quality document. On page 22, it
states the following:
“In the EPA response to the 2018-2019 Network Plan, EPA
recognized that establishing a new near-road monitoring site is
a resource intensive and time-consuming process. EPA also
acknowledged that the availability of resources to establish a
new near-road NO2 site are limited and are not currently
available. EPA stated it would “…work with MCAQ over the next
couple of years to determine the optimal location and timing
for establishing another near-road NO2 site in the Charlotte
area. Additionally, the EPA will provide funding for the initial
establishment of a new near-road site in the area…” MCAQ will
work with the EPA to determine the optimal location and timing

33
for establishment of an additional near-road NO2 site in
Mecklenburg County. As of the submission date of the 2019-
2020 Monitoring Plan, EPA has not provided funding for
operations, maintenance, equipment or capital expenditures in
support of the operation of an additional near-road NO2
monitoring station. As soon as practical and after EPA provided
funding for implementation becomes available, MCAQ will work
to install and operate an additional near-road NO2 monitoring
station in the MCAQ monitoring network.”
2) Requirements for Area-wide NO2 Monitoring – Each state must have one
monitoring site in each CBSA with a population of 1,000,000 or more persons
which will monitor a location of expected highest NO2 concentrations
representing the neighborhood or larger spatial scales. The Garinger High
School (37-119-0041) Site in Charlotte, North Carolina also operates an area
wide NO2 monitor.
3) Regional Administrator Required Monitoring – The Regional Administrators,
in collaboration with states, require a minimum of forty additional NO2
monitoring sites above the minimum monitoring requirements (nationwide)
in any area, with a primary focus on siting these monitors in locations to
protect susceptible and vulnerable populations. The Greenville ESC (45-045-
0015) Site is a Regional Administrator Required Monitoring site.
4) NCore Requirement (NO/NOy Monitoring) – Each NCore site must include a
NO/NOy monitor that will collect data to be used to produce conservative
estimates for NO2 and further ozone research. The Parklane (45-079-0007)
Site in Columbia, South Carolina is the NCore site for South Carolina.
Minimum Monitoring for CO – The CO minimum monitoring criteria has two
requirements:
1) Near-road CO Monitors – Each state with CBSAs having a population of
1,000,000 or more people must have one CO monitor collocated with one
required near-road NO2 monitor to be operational by January 1, 2017. The
Charlotte-Concord-Gastonia, NC-SC MSA is the only CBSA in South Carolina
that meets the population requirement for a collocated CO monitor. The
Mecklenburg County Air Quality office operates a CO monitor at the
Remount Road (37-119-0045) near-road Site in Charlotte, North Carolina that
became operational on January 1, 2017.

34
2) NCore Requirement – Each NCore site in a CBSA with a population of 500,000
or more must include a CO monitor. The Parklane (45-079-0007) Site in the
Columbia, SC MSA is the NCore site for South Carolina and supports one CO
monitor. The Garinger (37-119-0041) Site in Mecklenburg County is also an
NCore site and supports a CO monitor.
Minimum Monitoring for the Photochemical Assessment Monitoring Stations (PAMS) –
South Carolina is not subject to the PAMS requirement.
The CBSAs and the Minimum Monitoring Requirements – The term CBSA is a collective
term for the defined MSAs and Micropolitan Statistical Areas (mSA). An MSA area
contains a core urban area of 50,000 or more population, and a mSA contains an
urban core of at least 10,000 but less than 50,000 population. Each metropolitan or
micropolitan area consists of one or more counties and includes the counties
containing the core urban area, as well as any adjacent counties that have a high
degree of social and economic integration (as measured by commuting to work)
with the urban core7.
An MSA or mSA geographic composition, or list of geographic components at a
particular point in time, is referred to as its "delineation". The MSA or mSA are
delineated by the U.S. Office of Management and Budget (OMB) and are the result
of the application of published standards based on Census Bureau data. The
standards for delineating the areas are reviewed and revised once every ten years,
prior to each decennial census. Generally, the areas are delineated using the most
recent set of standards following each decennial census. Between censuses, the
delineations are updated annually to reflect the most recent Census Bureau
population estimates. Areas based on the 2010 standards and Census Bureau data
were delineated in September 20188,9. Minimum monitoring requirements only
apply to MSAs.
While the Department understands the need for establishing minimum monitoring
requirements, the EPA appropriately has mechanisms within the network plan
approval and network assessment process to allow states the flexibility to
implement a monitoring network that meets the three basic monitoring objectives
and addresses National and State needs. The recent changes in the MSA definitions
are an example of the reasons for the incorporation of flexibility in the regulations
7 https://www.census.gov/programs-surveys/metro-micro.html 8 https://www.census.gov/programs-surveys/metro-micro.html 9 OMB Bulletin No. 18-04-"Revised Delineations of Metropolitan Statistical Areas, Micropolitan Statistical Areas, and Combined Statistical Areas, and Guidance on Uses of the Delineations of These Areas", September 14, 2018.

35
and illustrates the necessity that the EPA use the discretion available in the
monitoring regulations to afford states flexibility and regulatory certainty.
Per 40 CFR Part 58, Appendix D, paragraph 2(e), minimum monitoring requirements
in multi-state MSAs can be met through a cooperative agreement.
In the absence of an agreement between states, the minimum monitoring
requirements must be met independently in each portion of the MSA.
Map 2: 2020 South Carolina Metropolitan Statistical Areas

36
South Carolina has established a memorandum of agreement (MOA) with the
Georgia Department of Natural Resources, Environmental Protection Division10,
North Carolina Department of Environmental and Natural Resources Division of Air
Quality, and Mecklenburg County, North Carolina11,12 which specifies the
responsibilities of each party to develop a monitoring network that meets the
appropriate monitoring objectives for the MSA.
Population and the Minimum Monitoring Requirements – The minimum monitoring
criteria only applies to MSAs. The table below presents the latest 2019* population
estimates for each MSA in South Carolina and the total population of MSAs shared
with North Carolina and Georgia.
MSA 2019 Population
Charlotte-Concord-Gastonia, NC-SC MSA 2,636,883
Greenville-Anderson MSA 920,477
Columbia MSA 838,433
Charleston-North Charleston MSA 802,122
Augusta-Richmond County, GA-SC MSA 608,980
Myrtle Beach-Conway-North Myrtle Beach, SC-NC MSA 496,901
Spartanburg MSA 319,785
Hilton Head Island-Bluffton MSA 222,195
Florence MSA 204,911
Sumter MSA 140,466 *United States Census Bureau and CFR 40 Part 58, Appendix D
South Carolina Minimum Monitoring Requirements – Federal minimum monitoring
requirements are based on the *latest available United States Census population
estimates and the 2019 ambient air quality design values (page 22).
10 The Memorandum of Agreement on Air Quality Monitoring for Criteria Pollutants for the Augusta-Richmond County Metropolitan Statistical Area (MSA) was signed on March 6, 2017 by the South Carolina DHEC Bureau of Air Quality and the Georgia Environmental Protection Division-Air Protection Branch. 11 The Memorandum of Agreement on Air Quality Monitoring for Criteria Pollutants for the Myrtle Beach-Conway-North Myrtle Beach, SC-NC Metropolitan Statistical Area (MSA) was signed on July 1, 2015 by the South Carolina DHEC Bureau of Air Quality and the North Carolina Department of Environmental and Natural Resources-Division of Air Quality. 12 The Memorandum of Agreement on Air Quality Monitoring for Criteria Pollutants for the Charlotte-Gastonia-Concord Metropolitan Statistical Area (MSA) was signed on July 1, 2016 by the South Carolina DHEC Bureau of Air Quality, the North Carolina Department of Environmental and Natural Resources-Division of Air Quality and the Mecklenburg County, North Carolina Land Use and Environmental Service Agency-Air Quality.

37
Based on this information, the minimum monitoring requirements for each MSA
are:
MSA
Ozo
ne
PM
2.5
PM
2.5
Co
nt.
PM
10
Le
ad
SO
2
NO
/NO
y/N
O2
CO
**Augusta-Richmond County, GA-SC
MSA
2 1 1 1-2 0 0 0 0
Charleston-North Charleston, MSA 2 1 1 1-2 0 1 0 0
**Charlotte-Concord-Gastonia, NC-SC
MSA
2 2 1 2-4 0 1 4**
*
2
Columbia MSA (NCore) 2 1 1 1-2 0 1 1 1
Florence MSA 1 0 0 0 0 0 0 0
Greenville-Anderson MSA 2 1 1 1-2 0 0 1 0
Hilton Head Island-Bluffton MSA 0 0 0 0 0 0 0 0
Myrtle Beach-Conway-North Myrtle
Beach, SC-NC MSA
2 0 0 0-1 0 0 0 0
Spartanburg MSA 1 0 0 0-1 0 0 0 0
Sumter MSA 0 0 0 0 0 0 0 0 *United States Census Bureau population estimates and CFR 40 Part 58, Appendix D.
**Minimum ambient air monitoring requirements are met cooperatively with the States of Georgia and
North Carolina.
***Charlotte MSA is required to have two near-road monitors, one area-wide monitor and an NOy at the
NCore site.

38
Summary of Changes for July 1, 2020 through December 31, 2021
Any planned changes in parameters monitored, the configuration, or operations at
the site planned for 2020-2021 are described herein and summarized in the
Summary of July 1, 2020 through December 31, 2021 Network Changes. Unless
otherwise indicated, changes at a site including the beginning of new monitoring
activity will be effective on or before January 1, 2021. Ozone monitoring for 2020
and 2021 at new or special project sites may start at the beginning of the Ozone
Monitoring Season (March 1-October 31).
Augusta-Richmond County, GA-SC MSA (South Carolina portion includes Aiken
and Edgefield Counties)
No changes planned.
Charleston-North Charleston MSA
Moncks Corner National Guard (45-015-1002) Site – This Site is a replacement site
for the Bushy Park (45-015-0002) Site. It began monitoring for ozone on March 2,
2020.
FAA (45-019-0048) Site – After the North Charleston Fire Station (45-019-0020) Site
is established, this Site will operate concurrently with the North Charleston Fire
Station (45-019-0020) Site for one year, then PM2.5 monitoring will be discontinued.
CPW (45-019-0049) Site – After the North Charleston Fire Station (45-019-0020) Site
is established, this Site will be discontinued.
NCFS (45-019-0020) Site – Once this Site is established, the collocated PM2.5 that
was temporarily relocated from the Charleston MSA to the T.K. Gregg (45-083-0011)
Site will be relocated to the North Charleston Fire Station (45-019-0020) Site.
Irving Street (45-019-0021) Site – This site is in expected to be operational by June
2020.
Charlotte-Concord-Gastonia, NC-SC MSA
No changes planned.
Columbia MSA
State Hospital (45-079-0029) Site – All monitoring at this Site was discontinued on
December 19, 2019.
Irmo (45-063-0008) Site – The SO2 monitoring was discontinued on April 22, 2020.
Florence MSA
No changes planned.

39
Greenville-Anderson MSA
Big Creek (45-007-0005) Site – This Site will run concurrently with the Garrison
Arena Site for the 2020 Ozone Monitoring Season. Afterward, the Department will
evaluate the data and determine if this site is redundant.
Garrison Arena (45-007-0006) Site – This Site became operational on March 2, 2020.
This site serves as a replacement for the Clemson (45-077-0002) Site.
Clemson (45-077-0002) Site – Monitoring at this site was discontinued on November
5, 2019, and the Site will be shut down.
Wolf Creek (45-077-0003) Site – Monitoring at this Site was discontinued on
November 15, 2019. The site will be closed.
Hilton Head Island-Bluffton MSA
No changes planned.
Myrtle Beach-Conway-North Myrtle Beach SC-NC MSA
Coastal Carolina (45-051-0008) Site – The Coastal Carolina Monitoring Site collected
its first complete ozone design value in 2019. Its design value for 2017-2019 is at 86
percent of the NAAQS, requiring the MSA to have a second ozone monitor
according to Appendix D of 40 CFR Part 58. Since this design value is the first
complete design value for the monitor and the 2019 design value is so close to the
85% threshold the Department and the State of North Carolina are working with
EPA Region 4 to determine the appropriate ozone monitoring for this MSA and may
wait to see what the 2020 design value is before taking action to add a second
ozone monitor to the MSA.
Spartanburg MSA
T.K. Gregg (45-083-0011) Site – After the North Charleston Fire Station (45-019-
0020) Site is established, the collocated PM2.5 monitor at the T.K. Gregg (45-083-
0011) Site will be relocated to the North Charleston Fire Station (45-019-0020) Site.
Sumter MSA
No changes planned.
Remainder of State
Howard High #3 (45-043-0011) Site – The Department has determined that this Site
will be maintained and will operate on a rotating schedule. The PM10 monitor was
discontinued on April 3, 2019. It will resume monitoring on January 1, 2021.

40
Long Creek (45-073-0001) Site – This site will be closed. SO2 monitoring was
discontinued on January 22, 2020, continuous PM2.5 was discontinued on December
4, 2019, precipitation monitoring was discontinued on January 22, 2020, and ozone
monitoring was discontinued on November 6, 2019. After the Department
evaluates the options, the SO2 monitor will be moved to a suitable Site.

41
Site Descriptions
Augusta-Richmond County, GA-SC MSA (part)
Classification of Monitoring Type by Site
Site ID Site Name
PM
2.5
PM
2.5
Co
nt.
Sp
eci
ati
on
PM
10
Le
ad
Ozo
ne
SO
2
NO
2
CO
45-003-0003 Jackson Middle School
45-037-0001 Trenton
TOTAL 1 1 0 0 0 2 0 0 0
SPM / Other SLAMS / duplicate / QA monitors

42
Jackson Middle School
CSA/MSA: none/Augusta-Richmond County MSA
AQS Site ID: 45-003-0003
Location: 8217 Atomic Road, Jackson
County: Aiken
Coordinates: +33.34219, -81.78872
Date Established: October 24, 1985
Site Evaluation: February 26, 2020
The Jackson Middle School Site is located in southwestern Aiken County, within the
town limits of Jackson at the Jackson Middle School. Jackson is located in a suburban
setting to monitor ozone concentrations upwind of the Augusta urbanized area.
The sample inlet is 128 meters from the nearest road.
This site meets siting criteria found in 40 CFR Part 58 Appendix E. The northeast
tree does not meet the requirements for tree height in the 40 CFR Part 58 Appendix
E, Section 4 (Spacing from Obstructions), but there is still more than 270°
unobstructed air flow around the probe.
Changes for 2020-2021:
There are no changes planned for 2020-2021.
Monitors:
Parameter Scale Objective Designation Probe
Height
(m)
Analysis &
(Method
Code)
Sampling
Frequency
Ozone
44201-2
Urban Upwind
Background
SLAMS 3.35 Ultraviolet
Absorption
(087)
Continuous

43
Trenton
CSA/MSA: none/Augusta-Richmond County MSA
AQS Site ID: 45-037-0001
Location: 660 Woodyard Road (Hwy 121)
County: Edgefield
Coordinates: +33.73993, -81.85362
Date Established: March 28, 1980
Site Evaluation: February 26, 2020
The Trenton Site is located in southeastern Edgefield County. Trenton was originally
established to monitor for ozone crossing into South Carolina from Georgia. The
Trenton Site monitors for ozone and PM2.5. The PM2.5 monitors are the required
FRM PM2.5 sampler and continuous FEM PM2.5. The sample inlets are 30 meters
from the nearest road.
This Site meets all 40 CFR Part 58, Appendix E requirements.
Changes for 2020-2021:
There are no changes planned for 2020-2021.
Monitors:
Parameter Scale Objective Designation Probe
Height
(m)
Analysis &
(Method
Code)
Sampling
Frequency
PM2.5
88101-1
Urban Extreme
Downwind
SPM 4.72 FRM
Gravimetric
w/ VSCC
(145)
1:3
Continuous
PM2.5
88502-3
Urban Extreme
Downwind
SPM
4.57 TEOM
Gravimetric
(702)
Continuous
Ozone
44201-1
Urban Maximum
Ozone
Concentration
/ Extreme
Downwind
SLAMS 3.45 Ultraviolet
Absorption
(087)
Continuous

44
Charleston-North Charleston MSA
Classification of Monitoring Type by Site
Site ID Site Name
PM
2.5
PM
2.5
Co
nt.
Sp
eci
ati
on
PM
10
Le
ad
Ozo
ne
SO
2
NO
2
CO
Pre
cip
.
ME
T
45-015-1002 Moncks Corner National
Guard
45-019-0003 Jenkins Ave. Fire Station
45-019-0020 North Charleston Fire
Station-PENDING
45-019-0021 Irving Street
45-019-0046 Cape Romain

45
Site ID Site Name
PM
2.5
PM
2.5
Co
nt.
Sp
eci
ati
on
PM
10
Le
ad
Ozo
ne
SO
2
NO
2
CO
Pre
cip
.
ME
T
45-019-0048 FAA
45-019-0049 CPW
TOTAL 2 2 0 1 0 2 2 2 0 1 1
SPM / Other SLAMS / duplicate / QA monitors / Pending

46
Moncks Corner National Guard
CSA/MSA: none/Charleston-North Charleston MSA
AQS Site ID: 45-015-1002
Location: Airport Drive and Wal Flo Lane
County: Berkeley
Coordinates: 33.18, -80.03
Date Established: March 2, 2020
Site Evaluation: PENDING
The Moncks Corner National Guard Site is located in Moncks Corner downwind
from the Charleston urban area. It is a replacement for the Bushy Park Site. This
Site monitors for ozone with a monitoring objective of maximum ozone
concentration. The sample inlet is ~177 meters from the nearest road.
This Site will meet 40 CFR Part 58, Appendix E requirements.
Changes for 2020-2021:
There are no changes planned for 2020-2021.
Monitors:
Parameter Scale Objective Designation Probe
Height
(m)
Analysis &
(Method
Code)
Sampling
Frequency
Ozone
44201-1
Urban Max Ozone
Concentration
SLAMS Ultraviolet
Absorption
(087)
Continuous

47
Jenkins Ave. Fire Station
CSA/MSA: none/Charleston-North Charleston MSA
AQS Site ID: 45-019-0003
Location: 4830 Jenkins Ave.
County: Charleston
Coordinates: +32.88228, -79.97755
Date Established: February 14, 1969
Site Evaluation: January 29, 2020
The Jenkins Ave. Fire Station Site is located in the city of North Charleston behind a
fire station in an urban and central city setting. The Jenkins Ave. Fire Station Site
supports monitors for PM10, SO2, and NO2. The sample inlets are 33.5 meters from
the nearest road.
This Site meets all 40 CFR Part 58, Appendix E requirements.
Changes for 2020-2021:
There are no changes planned for 2020-2021.
Monitors:
Parameter Scale Objective Designation Probe
Height
(m)
Analysis &
(Method
Code)
Sampling
Frequency
PM10
81102-3
Neighbor
-hood
Highest
Concentration
SLAMS 4.10 TEOM-
Gravimetric
(079)
Continuous
Sulfur
Dioxide
42401-1
Neighbor
-hood
Population
Exposure
SLAMS 4.68 Pulsed
Fluorescent
(560)
Continuous
Nitrogen
Dioxide
42602-2
Neighbor
-hood
Highest
Concentration
Source
Oriented
SPM 4.68 Chemilumi-
nescence
(599)
Continuous

48
North Charleston Fire Station (NCFS)
CSA/MSA: none/Charleston-North Charleston MSA
AQS Site ID: 45-019-0020
Location: 2800 Carner Avenue
County: Charleston
Coordinates: 32.84, -79.96
Date Established: PENDING
Site Evaluation: PENDING
The North Charleston Fire Station (NCFS) Site will be located in the central portion of the
Charleston peninsula on the grounds of the North Charleston Fire Station #3. This Site
was selected for its heavy exposure to population and industry and is a replacement for
the FAA Beacon and the Charleston Public Works (CPW) Sites PM2.5 monitoring locations.
This Site will support collocated PM2.5 intermittent samplers and a continuous PM2.5
monitor.
This Site will meet siting criteria found in 40 CFR Part 58 Appendix E.
Changes for 2020-2021:
This Site is PENDING.
Monitors:
Parameter Scale Objective Designation Probe
Height
(m)
Analysis &
(Method
Code)
Sampling
Frequency
PM2.5
88101-1
Neighbor-
hood
Population
Exposure
SLAMS FRM
Gravimetric
w/ VSCC
(145)
1:3
Collocated
PM2.5
88101-2
Neighbor-
hood
Population
Exposure
QA
Collocated
SLAMS
FRM
Gravimetric
w/ VSCC
(145)
1:3
PM2.5
88502-3
Neighbor-
hood
Population
Exposure
SPM TEOM
Gravimetric
(704)
Continuous

49
Irving Street
CSA/MSA: none/Charleston-North Charleston MSA
AQS Site ID: 45-019-0021
Location: Irving Avenue
County: Charleston
Coordinates: 32.83, -79.95
Date Established: June 11, 2020
Site Evaluation: PENDING
The Irving Street Site is being established in cooperation with the Port Authority. The Site
will be located in the “neck” of Charleston in the proximity of the Port expansion. The
Site will exist for approximately 2 years as dictated by the MOA. This Site will support
SO2, NO2, and continuous PM2.5 monitors.
This Site will meet siting criteria found in 40 CFR Part 58 Appendix E.
Changes for 2020-2021:
This Site is PENDING.
Monitors:
Parameter Scale Objective Designa-
tion
Probe
Height
(m)
Analysis &
(Method
Code)
Sampling
Frequency
Sulfur
Dioxide
42401-1
Neighbor-
hood
Background/
Population
Exposure
SPM Pulsed
fluorescent
(560)
Continuous
Nitrogen
Dioxide
42602-1
Neighbor-
hood
Background/
Population
Exposure
SPM Chemilumi-
nescence
(599)
Continuous
PM2.5
88502-3
Neighbor-
hood
Population
Exposure
SPM TEOM
Gravimetric
(704)
Continuous

50
Cape Romain
CSA/MSA: none/Charleston-North Charleston MSA
AQS Site ID: 45-019-0046
Location: 390 Bulls Island Road (Awendaw)
County: Charleston
Coordinates: +32.94101, -79.65719
Date Established: July 11, 1983
Site Evaluation: January 15, 2020
The Cape Romain Site is located in Charleston County at the Cape Romain National
Wildlife Refuge (NWR) near Moore’s Landing. The Cape Romain NWR is a Class I area
about 20 miles northeast of Charleston. The majority of the Refuge area is offshore,
extending from Bull Island 20 miles northeast to Cape Romain. The Refuge is bordered
on the west by the Intracoastal Waterway. Inland are large tracts of forests with
scattered residences. Several miles inland, a primary coastal route, US Highway (Hwy)
17, parallels the coast, with some development along the section of highway that is
closest to the Refuge.
The Cape Romain Site has continuous monitors for ozone, SO2, NO2, PM2.5, and
meteorological parameters. Additionally, this Site serves as a required regional
background for PM2.5. The sample inlets are 86 meters from the nearest road. This site
has been designated as a two-year rotational site for SO2. The SO2 monitor is scheduled
to operate from 2020 through 2021.
This Site meets all 40 CFR Part 58, Appendix E requirements.
Changes for 2020-2021:
There are no changes planned for 2020-2021.
Monitors:
(Table continues on next page)
Parameter Scale Objective Desig-
nation
Probe
Height
(m)
Analysis &
(Method
Code)
Sampling
Frequency
PM2.5
88502-3
Regional General /
Background
SLAMS 4.75 FDMS w/ SCC
(183)
Continuous
Ozone
44201-1
Regional General /
Background
SLAMS 4.10 Ultraviolet
(047)
Continuous

51
Parameter Scale Objective Desig-
nation
Probe
Height
(m)
Analysis &
(Method
Code)
Sampling
Frequency
Sulfur
Dioxide
42401-2
Regional Source
Oriented
SPM 4.10 Pulsed
Fluorescent
(560)
Continuous
Nitrogen
Dioxide
42602-1
Regional General /
Background
SPM 4.10 Chemilumine-
scence
(599)
Continuous
Wind
Speed,
Wind
Direction
and
Precipita-
tion
Neighbor-
hood
Local
Conditions
SLAMS 10.0 Instruments
for wind
speed,
direction, and
precipitation
(020)
Continuous

52
FAA Beacon
CSA/MSA: none/Charleston-North Charleston MSA
AQS Site ID: 45-019-0048
Location: 2670 Elms Plantation Blvd
County: Charleston
Coordinates: +32.98024, -80.06502
Date Established: April 9, 1999
Site Evaluation: January 23, 2020
The Charleston FAA Beacon Site is located in Charleston County approximately five miles
northwest of the Charleston International Airport near Charleston Southern University.
This Site has a SPM PM2.5 FRM sampler. The sample inlet is 160 meters from the nearest
road.
Although the 40 CFR 58.20 states that compliance to the siting regulations is optional, it
is the Department’s intent to meet as many of the Appendix E requirements as possible.
This Site does not meet 40 CFR Part 58 Appendix E, Section 4, Section 5 and Section 11
for site obstructions due to trees and drip line requirements.
Changes for 2020-2021:
The Department is planning to consolidate the FAA and CPW PM2.5 Sites into the NCFS
Monitoring Site. The collocated PM2.5 was temporarily moved to the T. K. Gregg
Monitoring Site in 2018 to meet State minimum monitoring requirements. When the
NCFS is established, the PM2.5 sampler will be moved back to the Charleston-North
Charleston MSA. The FAA Site will run concurrently for one year after the NCFS Site is
established.
Monitors:
Parameter Scale Objective Designa-
tion
Probe
Height
(m)
Analysis &
(Method
Code)
Sampling
Frequency
PM2.5
88101-1
Neighbor-
hood
Population
Exposure
SPM 2.35 FRM
Gravimetric
w/ VSCC
(145)
1:1
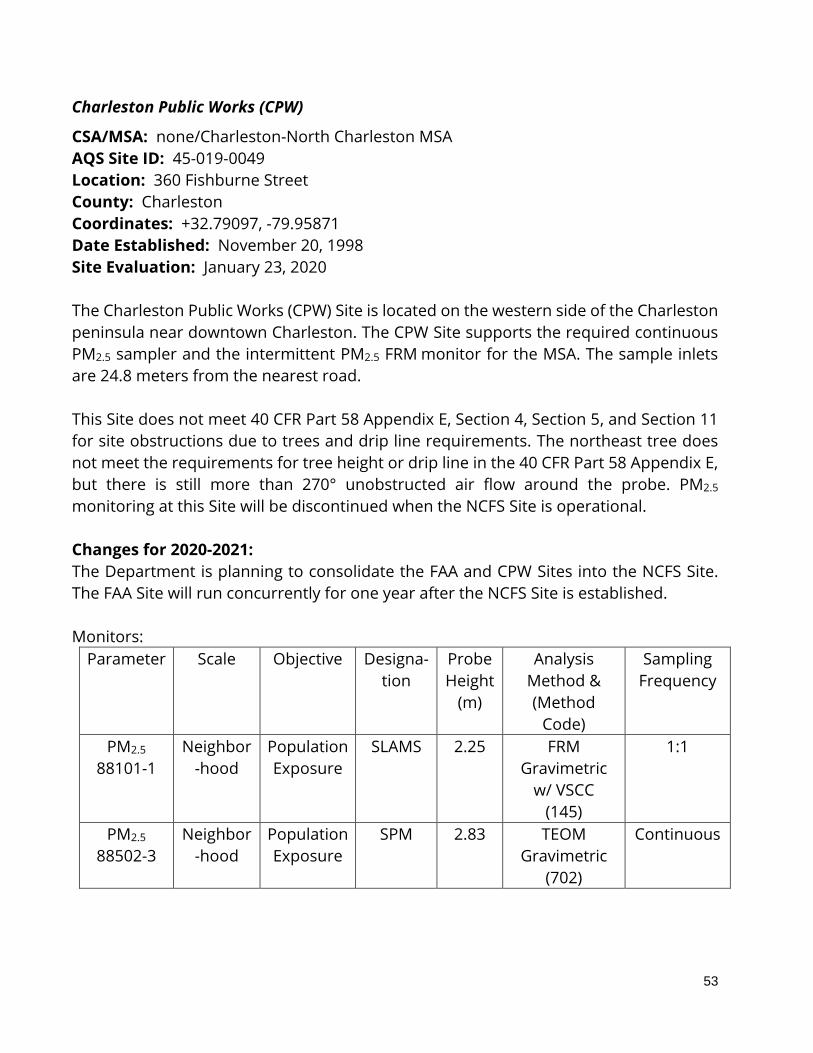
53
Charleston Public Works (CPW)
CSA/MSA: none/Charleston-North Charleston MSA
AQS Site ID: 45-019-0049
Location: 360 Fishburne Street
County: Charleston
Coordinates: +32.79097, -79.95871
Date Established: November 20, 1998
Site Evaluation: January 23, 2020
The Charleston Public Works (CPW) Site is located on the western side of the Charleston
peninsula near downtown Charleston. The CPW Site supports the required continuous
PM2.5 sampler and the intermittent PM2.5 FRM monitor for the MSA. The sample inlets
are 24.8 meters from the nearest road.
This Site does not meet 40 CFR Part 58 Appendix E, Section 4, Section 5, and Section 11
for site obstructions due to trees and drip line requirements. The northeast tree does
not meet the requirements for tree height or drip line in the 40 CFR Part 58 Appendix E,
but there is still more than 270° unobstructed air flow around the probe. PM2.5
monitoring at this Site will be discontinued when the NCFS Site is operational.
Changes for 2020-2021:
The Department is planning to consolidate the FAA and CPW Sites into the NCFS Site.
The FAA Site will run concurrently for one year after the NCFS Site is established.
Monitors:
Parameter Scale Objective Designa-
tion
Probe
Height
(m)
Analysis
Method &
(Method
Code)
Sampling
Frequency
PM2.5
88101-1
Neighbor
-hood
Population
Exposure
SLAMS 2.25 FRM
Gravimetric
w/ VSCC
(145)
1:1
PM2.5
88502-3
Neighbor
-hood
Population
Exposure
SPM
2.83 TEOM
Gravimetric
(702)
Continuous

54
Charlotte-Concord-Gastonia MSA
Classification of Monitoring Type by Site
Site ID Site Name
PM
2.5
PM
2.5
Co
nt.
Sp
eci
ati
on
PM
10
Le
ad
Ozo
ne
SO
2
NO
2
CO
ME
T
45-091-0008
York Landfill
TOTAL 0 0 0 0 0 1 1 0 0 0
SPM / Other SLAMS / duplicate / QA monitors
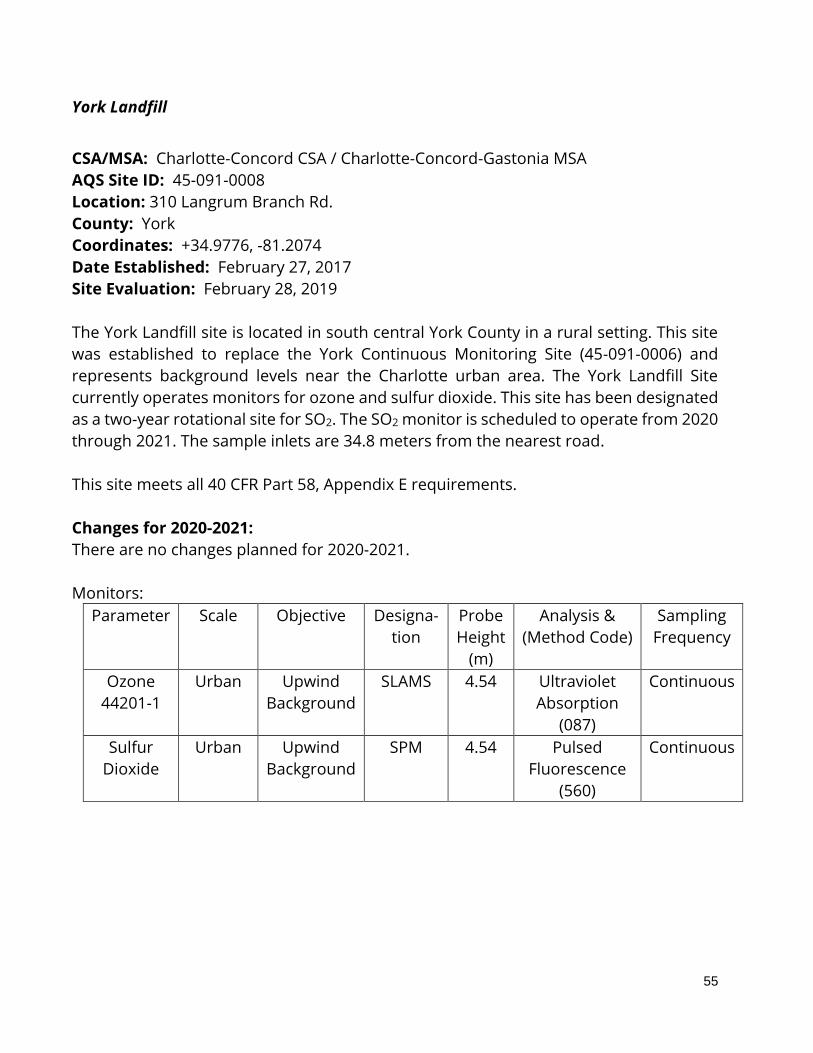
55
York Landfill
CSA/MSA: Charlotte-Concord CSA / Charlotte-Concord-Gastonia MSA
AQS Site ID: 45-091-0008
Location: 310 Langrum Branch Rd.
County: York
Coordinates: +34.9776, -81.2074
Date Established: February 27, 2017
Site Evaluation: February 28, 2019
The York Landfill site is located in south central York County in a rural setting. This site
was established to replace the York Continuous Monitoring Site (45-091-0006) and
represents background levels near the Charlotte urban area. The York Landfill Site
currently operates monitors for ozone and sulfur dioxide. This site has been designated
as a two-year rotational site for SO2. The SO2 monitor is scheduled to operate from 2020
through 2021. The sample inlets are 34.8 meters from the nearest road.
This site meets all 40 CFR Part 58, Appendix E requirements.
Changes for 2020-2021:
There are no changes planned for 2020-2021.
Monitors:
Parameter Scale Objective Designa-
tion
Probe
Height
(m)
Analysis &
(Method Code)
Sampling
Frequency
Ozone
44201-1
Urban Upwind
Background
SLAMS 4.54 Ultraviolet
Absorption
(087)
Continuous
Sulfur
Dioxide
Urban Upwind
Background
SPM 4.54 Pulsed
Fluorescence
(560)
Continuous

56
Columbia MSA
Classification of Monitoring Type by Site
Site ID Site Name
PM
2.5
PM
2.5
Co
nt.
Sp
eci
ati
on
PM
10
Le
ad
Ozo
ne
SO
2
NO
2/N
O/N
Oy
CO
Ca
rbo
nyl
s
SV
OC
Pre
cip
. C
he
m.
Pre
cip
.
ME
T
45-063-
0008 Irmo
45-063-
0010
Cayce City
Hall
45-079-
0007
Parklane
(NCore)

57
Site ID Site Name
PM
2.5
PM
2.5
Co
nt.
Sp
eci
ati
on
PM
10
Le
ad
Ozo
ne
SO
2
NO
2/N
O/N
Oy
CO
Ca
rbo
nyl
s
SV
OC
Pre
cip
. C
he
m.
Pre
cip
.
ME
T
45-079-
0021
Congaree
Bluff
45-079-
1001 Sandhill
TOTAL 3 2 1 1 0 3 1 2 1 0 1 2 2 1
SPM / Other SLAMS / duplicate / QA monitors

58
Irmo
CSA/MSA: Columbia-Orangeburg-Newberry CSA / Columbia MSA
AQS Site ID: 45-063-0008
Location: 200 Leisure Lane
County: Lexington
Coordinates: +34.051017, -81.15492
Date Established: April 7, 1989
Site Evaluation: June 19, 2019
The Irmo site is located in Lexington County near the Town of Irmo. This site has a
sampler for PM2.5 and a continuous monitor for PM2.5. The sample inlets are 39 meters
from the nearest road.
This site meets all 40 CFR Part 58, Appendix E requirements.
Changes for 2020-2021:
The SO2 monitoring at this site was discontinued on April 22, 2020. Semi-volatile Organic
Compounds and Carbonyls were discontinued at this site in December 2019. The
landowner has requested that this Site be relocated. We will submit a request to the EPA
to approve the site relocation once it has been identified.
Monitors:
(Table continues on next page)
Parameter Scale Objective Designa-
tion
Probe
Height
(m)
Analysis &
(Method
Code)
Sampling
Frequency
PM2.5
88101-1
Neighbor
-hood
Population
Exposure
SLAMS 4.9 FRM
Gravimetric
w/ VSCC
(145)
1:1
PM2.5
88101-3
Neighbor
-hood
Population
Exposure
SPM
4.4 FEM FDMS
Gravimetric
(581)
Continuous

59
Cayce City Hall
CSA/MSA: Columbia-Orangeburg-Newberry CSA / Columbia MSA
AQS Site ID: 45-063-0010
Location: 1 830 Morlaine Road
County: Lexington
Coordinates: +33.96914, -81.06629
Date Established: December 6, 2007
Site Evaluation: February 4, 2020
The Cayce City Hall site is located in the City of Cayce and measures PM10. This site was
established to measure PM10 concentrations in populated areas and to determine the
potential impact of occasional high concentrations on neighborhoods surrounding the
industrialized area. The sample inlet is 24 meters from the nearest road.
This site meets all 40 CFR Part 58, Appendix E requirements.
Changes for 2020-2021:
There are no changes planned for 2020-2021.
Monitors:
Parameter Scale Objective Designa-
tion
Probe
Height
(m)
Analysis &
(Method
Code)
Sampling
Frequency
PM10
81102-1
Neighbor
-hood
Population
Exposure
SLAMS 2.42 TEOM-
Gravimetric
(079)
Continuous

60
Parklane (NCore)
CSA/MSA: Columbia-Orangeburg-Newberry CSA / Columbia MSA
AQS Site ID: 45-079-0007
Location: 8311 Parklane Road
County: Richland
Coordinates: +34.09398, -80.96230
Date Established: April 3, 1980
Site Evaluation: June 26, 2019
The Parklane site is located in north central Richland County within the city limits of
Columbia. Parklane was originally sited to provide downwind population exposure
measurements at the edge of the Columbia urban area population and has been
expanded to support the full complement of NCore parameters. The suite of samplers
measure collocated FRM PM2.5, speciated PM2.5, precipitation chemistry, precipitation,
and SVOC. The suite of continuous monitors measure PM2.5, ozone, SO2, CO, and
NO/NOy. The site also provides support for demonstration, training, and equipment
evaluation convenient to the Department’s Columbia air laboratory. The sample inlets
are 131 meters from the nearest road.
This site meets all 40 CFR Part 58, Appendix E requirements.
Changes for 2020:
There are no changes planned for 2020-2021.
Monitors:
*Bolded parameters are an NCore requirement.
(Table continues on next page)
Parameter
*Required
Scale Objective Designa-
tion
Probe
Height
(m)
Analysis &
(Method
Code)
Sampling
Frequency
PM2.5
88101-1
Neighbor-
hood
Population
Exposure
NCore
SLAMS
4.9 FRM
Gravimetric
w/ VSCC
(145)
1:3
Collocated
PM2.5
88101-2
Neighbor-
hood
Population
Exposure
QA
Collocated
SLAMS
5.3 FRM
Gravimetric
w/ VSCC
(145)
1:3

61
Parameter
*Required
Scale Objective Designa-
tion
Probe
Height
(m)
Analysis &
(Method
Code)
Sampling
Frequency
PM2.5
88502-3
Neighbor-
hood
Population
Exposure
SLAMS
4.72 FDMS
Gravimetric
(183)
Continuous
Speciated
PM2.5
Neighbor-
hood
Population
Exposure
NCore
SLAMS
2.4 CSN
Protocol
(811,812,82
6,838,839,8
41, 842)
1:3
PM10-2.5
86101-1
Neighbor-
hood
Population
Exposure
NCore
SLAMS
4.4 Gravimetric
FRM Pair
(176)
1:3
Ozone
44201-1
Urban Max Ozone
Concentra-
tion
NCore
SLAMS
4.45 Ultraviolet
Absorption
(087)
Continuous
Sulfur
Dioxide
42401-1
Neighbor-
hood
Population
Exposure/
Other
NCore
SLAMS
4.45 Pulsed
Fluorescent
(560)
Continuous
Nitric
Oxide
/NOy
42600-2
42601-2
Neighbor-
hood
Population
Exposure
NCore
SLAMS
10.0 Chemi-
lumine-
sence
(674)
Continuous
Carbon
Monoxide
42101-1
Neighbor-
hood
Population
Exposure
NCore
SLAMS
4.45 Gas filter
Correlation
(593)
Continuous
SVOC Neighbor-
hood
Population
Exposure
SPM 1.4 PUF-GC/MS 1:6
Precipita-
tion
chemistry
Neighbor-
hood
Regional
Transport
Non-
regulatory
1.4 Not
applicable
Weekly-
Tues-Tues
Precipita-
tion
Neighbor-
hood
General /
Background
SPM 1.1 Tipping
bucket
(011)
Continuous
and
Sample
Wind
Speed /
Direction
Neighbor-
hood
Local
Conditions
SLAMS 10.0 Instruments
for wind
Continuous

62
Parameter
*Required
Scale Objective Designa-
tion
Probe
Height
(m)
Analysis &
(Method
Code)
Sampling
Frequency
speed/wind
direction
(020)

63
Congaree Bluff
CSA/MSA: Columbia-Orangeburg-Newberry CSA / Columbia MSA
AQS Site ID: 45-079-0021
Location: 1850 South Cedar Creek Road
County: Richland
Coordinates: +33.81467, -80.78113
Date Established: December 27, 1999
Site Evaluation: February 4, 2020
The Congaree Bluff site is located in southern Richland County. The site is located in a
rural setting within the boundaries of the Congaree National Park. The Congaree Bluff
monitoring continues a data record begun in 1981 with the establishment of the
Congaree Swamp site (45-079-1006). The original site was established in cooperation
with the Department of the Interior and the support of the General Assembly to provide
long term monitoring in this unique area. The Congaree Swamp site was located in the
flood plain and had to be relocated to the current Congaree Bluff site in 2001.
Monitoring activities at this site are intended to represent conditions found in the
National Park only. The Congaree Bluff site has monitors for ozone, SO2, precipitation,
and precipitation chemistry. Sample inlets are 188 meters from the nearest road. This
site has been designated as a two-year rotational site for SO2. The SO2 monitor is
scheduled to operate from 2022 through 2023.
The EPA has issued a waiver for 40 CFR Part 58, Appendix E, Section 4-Spacing from
Obstructions and Section 11-Summary for tree obstructions. Also, the EPA issued a
waiver for 40 CFR Part 58, Appendix E, Section 5-Spacing from Trees and Section 11-
Summary for a drip line issue.
Changes for 2020-2021: There are no changes planned for 2020-2021.
Monitors:
(Table continues on next page)
Parameter Scale Objective Designa-
tion
Probe
Height
(m)
Analysis &
(Method
Code)
Sampling
Frequency
Ozone
44201-1
Neighbor
-hood
General /
Background
SPM 4.15 Ultraviolet
(047)
Continuous

64
Parameter Scale Objective Designa-
tion
Probe
Height
(m)
Analysis &
(Method
Code)
Sampling
Frequency
Sulfur
Dioxide
42401-1
Neighbor
-hood
General /
Background
SPM Pulsed
Fluorescent
Continuous
Precipita-
tion
Chemistry
Regional Regional
Transport
Non-
regula-
tory
1.70 IC Weekly-
Tue-Tue
Precipita-
tion
Neighbor
-hood
General/
Background
SPM 1.6 Tipping
Bucket
(011)
Continuous
and Sample

65
Sandhill Experimental Station
CSA/MSA: Columbia-Orangeburg-Newberry CSA / Columbia MSA
AQS Site ID: 45-079-1001
Location: 900 Clemson Road
County: Richland
Coordinates: +34.13126, -80.86832
Date Established: January 1, 1959
Site Evaluation: February 21, 2020
The Sandhill Experimental Station Site is located in northeastern Richland County,
downwind from the Columbia metropolitan area. This Site is located in a rapidly
urbanizing portion of the City of Columbia. The Sandhill Site measures ozone and NO2.
The sample inlets are 31 meters from the nearest road.
This Site meets all 40 CFR Part 58, Appendix E requirements.
Changes for 2020-2021:
There are no changes planned for 2020-2021.
Monitors:
Parameter Scale Objective Designa-
tion
Probe
Height
(m)
Analysis &
(Method
Code)
Sampling
Frequency
Ozone
44201-1
Urban Max Ozone
Concentration
SLAMS 4.12 Ultraviolet
Absorption
(087)
Continuous
Nitrogen
Dioxide
42602-1
Urban General /
Background
Max Precursor
Emissions
SPM 4.12 Chemi-
luminesence
(599)
Continuous

66
Florence MSA
Classification of Monitoring Type by Site
Site ID Site Name
PM
2.5
PM
2.5
Co
nt.
Sp
eci
ati
on
PM
10
Le
ad
Ozo
ne
SO
2
NO
2
CO
45-031-0003 Pee Dee Exp. Station
45-041-0003 Williams Middle School
45-041-8001,
8002, 8003 Johnson Controls *
TOTAL 1 1 0 0 *7 1 0 0 0
SPM / Other SLAMS / duplicate / QA monitors
* See details on site page for number of samplers
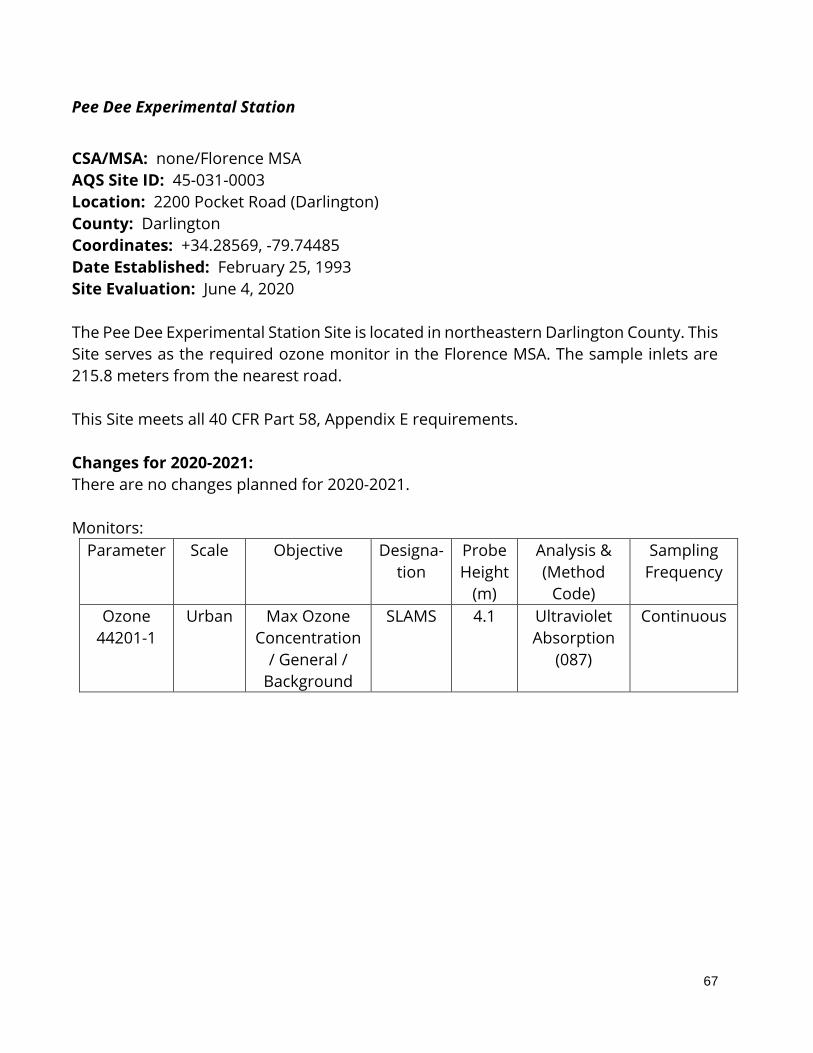
67
Pee Dee Experimental Station
CSA/MSA: none/Florence MSA
AQS Site ID: 45-031-0003
Location: 2200 Pocket Road (Darlington)
County: Darlington
Coordinates: +34.28569, -79.74485
Date Established: February 25, 1993
Site Evaluation: June 4, 2020
The Pee Dee Experimental Station Site is located in northeastern Darlington County. This
Site serves as the required ozone monitor in the Florence MSA. The sample inlets are
215.8 meters from the nearest road.
This Site meets all 40 CFR Part 58, Appendix E requirements.
Changes for 2020-2021:
There are no changes planned for 2020-2021.
Monitors:
Parameter Scale Objective Designa-
tion
Probe
Height
(m)
Analysis &
(Method
Code)
Sampling
Frequency
Ozone
44201-1
Urban Max Ozone
Concentration
/ General /
Background
SLAMS 4.1 Ultraviolet
Absorption
(087)
Continuous

68
Williams Middle School
CSA/MSA: none/Florence MSA
AQS Site ID: 45-041-0003
Location: 1119 N. Irby Street
County: Florence
Coordinates: +34.21427, -79.76735
Date Established: August 4, 2008
Site Evaluation: May 7, 2020
The Williams Middle School Site is located in Florence County. The Department
established the Williams Site to meet the 40 CFR Part 58 Appendix D requirements for
collocated continuous monitoring for the Florence MSA. This site has the required
collocated PM2.5 FRM sampler and PM2.5 continuous monitor. Sample inlets are 110
meters from the nearest road.
This Site meets all 40 CFR Part 58, Appendix E requirements.
Changes for 2020-2021:
There are no changes planned for 2020-2021.
Monitors:
Parameter Scale Objective Designa-
tion
Probe
Height
(m)
Analysis &
(Method
Code)
Sampling
Frequency
PM2.5
88101-1
Neighbor
-hood
Population
Exposure/
Highest
Concentration
SLAMS 2.71 FRM
Gravimetric
w/ VSCC
(145)
1:3
PM2.5
88502-3
Neighbor
-hood
Population
Exposure
SLAMS
2.71 TEOM
Gravimetric
(704)
Continuous

69
Johnson Controls (3 Sites-JCI Railroad, JCI Entrance, JCI Woods)
CSA/MSA: none/Florence MSA
AQS Site ID: 45-041-8001, 8002, 8003
Location: Liberty Chapel at Bethel Road, Liberty Chapel at Paper Mill Road, Liberty
Chapel at Paper Mill Road
County: Florence
Coordinates: +34.15567, -79.56981; +34.16413, -79.572330; +34.16747, -79.56266
Dates Established: January 4-10, 2012
Site Evaluation: May 2, 2020 (Entrance and Railroad), June 4, 2020 (Woods)
Johnson Controls Incorporated (JCI) is located in Florence County. It is now owned by
Clarios. On May 7, 2010, the Department issued an air synthetic minor construction
permit to Johnson Controls Battery Group for the Florence Recycling Center (Permit No.
1040-0129-CA). Under a settlement agreement with several petitioners13, the Florence
Recycling Center will conduct source-oriented ambient lead monitoring at three
locations around the facility.
The JCI samplers are set on a 1:6 sampling schedule. In order to reduce the amount of
time that staff must collect the filters, additional samplers have been added to each Site.
Sampling frequency may be increased if needed for special investigations.
The 40 CFR 58.20 states that compliance to the siting regulations is optional, but it is the
Department’s intent to meet as many of the Appendix E requirements as possible. The
JCI Railroad (45-041-8001) Site has one sampler. There is also a second sampler that runs
consecutively. The JCI Railroad (45-041-8001) Site meets 40 CFR Part 58, Appendix E
requirements.
The JCI Entrance (45-041-8002) Site has two samplers. There is also a third sampler that
runs consecutively. The JCI Entrance (45-041-8002) Site meets all 40 CFR Part 58,
Appendix E requirements.
The JCI Woods (45-041-8003) Site has one sampler. There is also a second sampler that
runs consecutively. The JCI Woods (45-041-8003) Site meets 40 CFR Part 58, Appendix E
requirements except Section 4-Spacing from Obstructions and Section 11-Summary
siting requirements due to tree obstructions. However, the tree obstructions in the
13 Coastal Conservation League and League of Women Voters of South Carolina vs South Carolina Department of
Health and Environmental Control and Johnson Controls Battery Group, Inc., (State of SC, 2010).

70
predominant wind direction toward the source have been removed. A waiver was
received on April 1, 2020, for the four trees to the north and east of the site.
Changes for 2020-2021:
There are no changes planned for 2020-2021.
Monitors:
Site ID Parameter Scale Objective Desig-
nation
Probe
Height
(m)
Analysis &
(Method
Code)
Sampling
Frequency
041-
8001
Lead
14129
Middle Source
oriented
SPM 2.42 ICP/MS
(193)
1:6
041-
8001
Lead
14129
Middle Source
oriented
SPM 2.62 ICP/MS
(193)
1:6
041-
8002
Lead
14129
Middle Source
oriented
SPM 2.3 ICP/MS
(193)
1:6
041-
8002
Lead
14129
Middle Source
oriented
SPM 2.3 ICP/MS
(193)
1:6
*041-
8002
Lead
14129
Middle Source
oriented
SPM 2.6 ICP/MS
(193)
1:6
041-
8003
Lead
14129
Middle Source
oriented
SPM 2.4 ICP/MS
(193)
1:6
041-
8003
Lead
14129
Middle Source
oriented
SPM 2.4 ICP/MS
(193)
1:6
*Collocated sampler

71
Greenville-Anderson MSA
Classification of Monitoring Type by Site
Site ID Site Name
PM
2.5
PM
2.5
Co
nt.
Sp
eci
ati
on
PM
10
Le
ad
Ozo
ne
SO
2
NO
2
CO
Me
t
45-007-0005 Big Creek
44-007-0006 Garrison Arena
45-045-0015 Greenville ESC
45-045-0016 Hillcrest
TOTAL 3 1 0 1 0 3 1 1 0 0

72
Big Creek
CSA/MSA: Greenville-Spartanburg-Anderson CSA / Greenville-Anderson MSA
AQS Site ID: 45-007-0005
Location: 215 McAlister Road
County: Anderson
Coordinates: +34.62324, -82.53206
Date Established: June 4, 2008
Site Evaluation: March 9, 2020
The Big Creek Site is located northeast of the City of Anderson. The Site was established
to represent maximum ozone concentrations in the Anderson MSA, downwind of
Anderson and upwind background for the Greenville MSA. In February 2013, the MSA
definitions were changed, and this Site is now contained within the Greenville-Anderson
MSA. The sample inlet is 43.9 feet from the nearest road.
This Site meets all 40 CFR Part 58, Appendix E requirements.
Changes for 2020-2021:
This Site will run concurrently with the Garrison Arena Site for the 2020 Ozone
Monitoring Season. Then, the Department will analyze the data and determine whether
this Site is redundant.
Monitors:
Parameter Scale Objective Designa-
tion
Probe
Height
(m)
Analysis &
(Method
Code)
Sampling
Frequency
Ozone
44201-1
Urban Max Ozone
Concentra-
tion / Upwind
Background
SLAMS 4.1 Ultraviolet
Absorption
(087)
Continuous
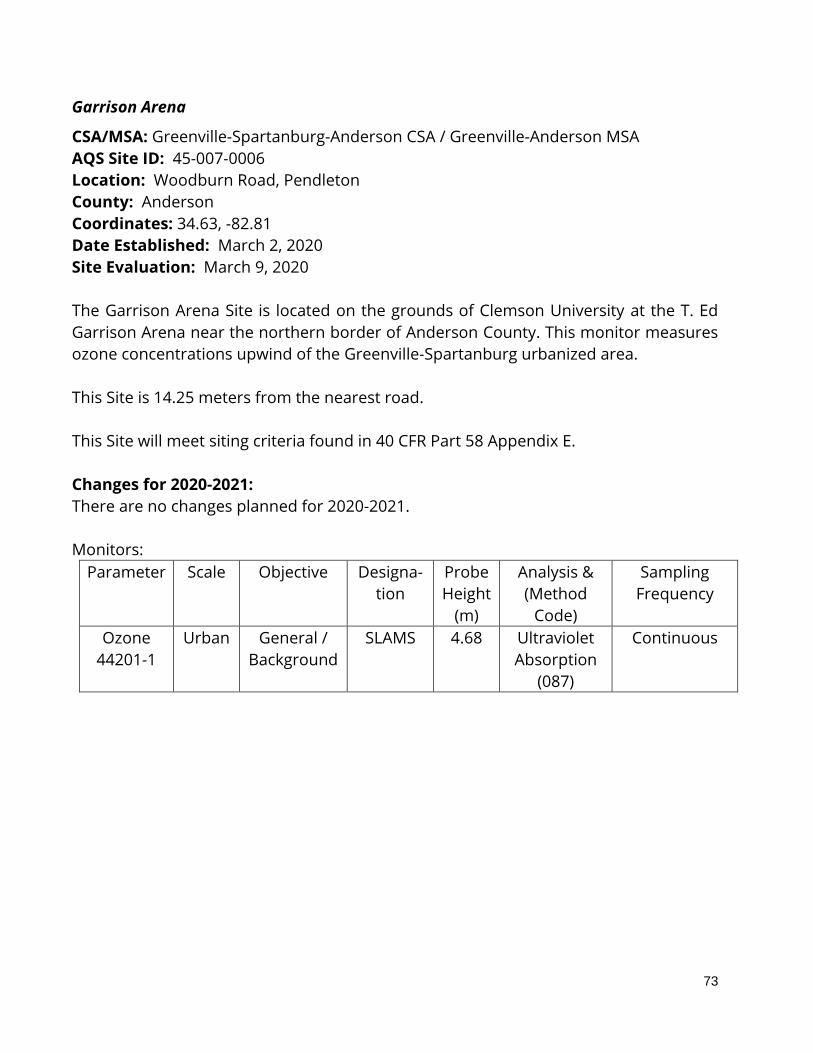
73
Garrison Arena
CSA/MSA: Greenville-Spartanburg-Anderson CSA / Greenville-Anderson MSA
AQS Site ID: 45-007-0006
Location: Woodburn Road, Pendleton
County: Anderson
Coordinates: 34.63, -82.81
Date Established: March 2, 2020
Site Evaluation: March 9, 2020
The Garrison Arena Site is located on the grounds of Clemson University at the T. Ed
Garrison Arena near the northern border of Anderson County. This monitor measures
ozone concentrations upwind of the Greenville-Spartanburg urbanized area.
This Site is 14.25 meters from the nearest road.
This Site will meet siting criteria found in 40 CFR Part 58 Appendix E.
Changes for 2020-2021:
There are no changes planned for 2020-2021.
Monitors:
Parameter Scale Objective Designa-
tion
Probe
Height
(m)
Analysis &
(Method
Code)
Sampling
Frequency
Ozone
44201-1
Urban General /
Background
SLAMS 4.68 Ultraviolet
Absorption
(087)
Continuous

74
Greenville Employment Security Commission (ESC)
CSA/MSA: Greenville-Spartanburg-Anderson CSA / Greenville-Anderson MSA
AQS Site ID: 45-045-0015
Location: 133 Perry Avenue
County: Greenville
Coordinates: +34.84389, -82.41458
Date Established: April 11, 2008
Site Evaluation: May 21, 2020
The Greenville ESC Site is located in the city of Greenville and was established on April
11, 2008. This Site supports a PM2.5 FRM sampler and continuous PM2.5 FEM monitor. It
also supports PM10, SO2, NO2, and measurements for wind speed and wind direction.
The sample inlets are 15.0 meters from the nearest road. The EPA Region 4 has selected
this Site as one of the locations for a Regional Administrator required NO2 monitor to
help protect susceptible and vulnerable populations, as required by 40 CFR Part 58,
Appendix D, Section 4.3.4.
This Site meets siting criteria found in 40 CFR Part 58 Appendix E except Section 4-
Spacing from Obstructions, but there is still 270° of airflow around the probes.
Changes for 2020-2021:
There are no changes planned for 2020-2021.
Monitors:
(Table continues on next page)
Parameter Scale Objective Designa-
tion
Probe
Height
(m)
Analysis &
(Method
Code)
Sampling
Frequency
PM2.5
88101-1
Neighbor
-hood
Population
Exposure /
Welfare
Related
Impacts/
Collocated
SLAMS 3.5 FRM
Gravimetric
w/ VSCC
(145)
1:1
PM2.5
88101-3
Neighbor
-hood
Population
Exposure/
SPM
4.55 FEM FDMS
Gravimetric
(581)
Continuous

75
Parameter Scale Objective Designa-
tion
Probe
Height
(m)
Analysis &
(Method
Code)
Sampling
Frequency
Welfare
Related
Impacts
PM10
81102-1
Neighbor
-hood
Population
Exposure
SLAMS 4.26 TEOM
Gravimetric
(079)
Continuous
Sulfur
Dioxide
42401-1
Neighbor
-hood
Population
Exposure
SLAMS 4.54 Pulsed
fluorescent
(560)
Continuous
Nitrogen
Dioxide
42602-1
Neighbor
-hood
Population
Exposure
SLAMS 4.54 Chemilumi-
nescence
(599)
Continuous

76
Hillcrest Middle School
CSA/MSA: Greenville-Spartanburg-Anderson CSA / Greenville-Anderson MSA
AQS Site ID: 45-045-0016
Location: 510 Garrison Road
County: Greenville
Coordinates: +34.75185, -82.25670
Date Established: February 17, 2009
Site Evaluation: May 21, 2020
The Hillcrest Middle School Site represents suburban areas near the interstate corridors
in the Greenville MSA. Initiated in 2008, this Site was selected as a monitoring location
based on results of the Greenville MSA Ozone Study. This Site supports an ozone
monitor, a PM2.5 FRM sampler, and a collocated PM2.5 FRM sampler. The sample inlets
are 54 meters from the nearest road.
This Site meets all 40 CFR Part 58, Appendix E requirements.
Changes for 2020-2021:
There are no changes planned for 2020-2021.
Monitors:
Parameter Scale Objective Designa-
tion
Probe
Height
(m)
Analysis &
(Method
Code)
Sampling
Frequency
PM2.5
88101-1
Urban Population
Exposure
SLAMS 3.41 FRM
Gravimetric
w/ VSCC
(145)
1:3
Collocated
PM2.5
88101-2
Urban Population
Exposure
QA
SLAMS
3.5 FRM
Gravimetric
w/ VSCC
(145)
1:3
Ozone
44201-1
Urban Population
Exposure
SLAMS 3.83 Ultraviolet
Adsorption
(087)
Continuous

77
Myrtle Beach-Conway-North Myrtle Beach, SC-NC MSA
Classification of Monitoring Type by Site
Site ID Site Name
PM
2.5
PM
2.5
Co
nt.
Sp
eci
ati
on
PM
10
Le
ad
Ozo
ne
SO
2
NO
2
CO
ME
T
45-051-0008 Coastal Carolina
TOTAL 0 0 0 0 0 1 0 0 0 0
SPM / Other SLAMS / duplicate / QA monitors

78
Coastal Carolina
CSA/MSA: Myrtle Beach-Conway-North Myrtle Beach, SC-NC MSA
AQS Site ID: 45-051-0008
Location: Century Circle
County: Horry
Coordinates: 33.8007, -78.9939
Date Established: June 27, 2016
Site Evaluation: March 3, 2020
In February 2013, OMB combined Horry County with Brunswick County, NC to establish
the Myrtle Beach-Conway-North Myrtle Beach, SC-NC MSA. In conjunction with the State
of North Carolina, local government, and stakeholders, the Department established the
Coastal Carolina Monitoring Site to be representative of expected maximum ozone
concentrations in northeast South Carolina. In order to meet the minimum monitoring
criteria in 40 CFR Part 58, Appendix D, at least one ozone monitor is required in the MSA.
The sample inlet is 18.3 meters from the nearest road.
This Site meets all 40 CFR Part 58, Appendix E requirements.
Changes for 2020-2021:
The Coastal Carolina Monitoring Site collected its first complete ozone design value in
2019. Its design value for 2017-2019 is at 86 percent of the NAAQS, requiring the MSA to
have a second ozone monitor, according to Appendix D of 40 CFR Part 58. Since this
design value is the first complete design value for the monitor and the 2019 design value
is so close to the 85% threshold, the Department and the State of North Carolina are
working with EPA Region 4 to determine the appropriate ozone monitoring for this MSA
and may wait to see what the 2020 design value is before taking action to add a second
ozone monitor to the MSA.
Monitors:
Parameter Scale Objective Designa
-tion
Probe
Height
(m)
Analysis &
(Method
Code)
Sampling
Frequency
Ozone
44201-1
Urban Population
Exposure
SLAMS 4.1 Ultraviolet
(087)
Continuous

79
Spartanburg MSA
Classification of Monitoring Type by Site
Site ID Site Name
PM
2.5
PM
2.5
Co
nt.
Sp
eci
ati
on
PM
10
Le
ad
Ozo
ne
SO
2
NO
2
CO
45-083-0009 North Spartanburg
Fire Station #2
45-083-0011 T.K. Gregg
TOTAL 2 1 0 0 0 1 0 0 0
SPM / Other SLAMS / duplicate / QA monitors

80
North Spartanburg Fire Station #2
CSA/MSA: Greenville-Spartanburg-Anderson CSA / Spartanburg MSA
AQS Site ID: 45-083-0009
Location: 1556 John Dodd Road
County: Spartanburg
Coordinates: +34.98874, -82.07573
Date Established: April 4, 1990
Site Evaluation: February 5, 2019
The North Spartanburg Fire Station #2 Site is located in rural Spartanburg County,
northwest of the City of Spartanburg. This Site supports an ozone monitor and was
established as a maximum ozone concentration monitor for the Greenville-
Spartanburg-Anderson urban area on April 4, 1990. This monitor is designated SLAMS
and fulfills the requirement for a maximum concentration site for the Spartanburg MSA.
The sample inlet is 92.5 meters from the nearest road.
This Site meets siting criteria found in 40 CFR Part 58 Appendix E except Section 4-
Spacing from Obstructions. There is a northwest tree that does not meet the
requirements for tree height but there is still more than 270° unobstructed air flow
around the probe.
Changes for 2020-2021:
There are no changes planned for 2020-2021.
Monitors:
Parameter Scale Objective Designa-
tion
Probe
Height
(m)
Analysis &
(Method
Code)
Sampling
Frequency
Ozone
44201-1
Urban Max Ozone
Concentration
SLAMS 4.2 Ultraviolet
Absorption
(047)
Continuous

81
T.K. Gregg Recreation Center
CSA/MSA: Greenville-Spartanburg-Anderson CSA / Spartanburg MSA
AQS Site ID: 45-083-0011
Location: 267 Northview Street
County: Spartanburg
Coordinates: +34.95557, -81.92480
Date Established: December 29, 2008
Site Evaluation: February 5, 2019
The T.K. Gregg Recreation Center Site is located in Spartanburg County. With the
cooperation of local government and stakeholders, the Department established this
PM2.5 Site in the downtown Spartanburg area to meet the 40 CFR Part 58, Appendix D
requirements for monitoring objectives, reporting and collocation requirements. The
Site has a PM2.5 FRM sampler and a collocated continuous PM2.5 monitor. There is also a
PM2.5 sampler from the Charleston MSA that is being temporarily housed at this Site to
meet 40 CFR Part 58 Appendix A collocation requirements. The sample inlets are 48.2
meters from the nearest road.
This Site meets all 40 CFR Part 58, Appendix E requirements.
Changes for 2020-2021:
There are no changes planned for 2020-2021. The PM2.5 sampler was moved temporarily
to this Site to fulfill the State collocation requirements. Once the North Charleston Fire
Station Monitoring Site is established in the Charleston-North Charleston MSA, this
monitor will be moved back to that MSA.
Monitors:
Parameter Scale Objective Designa-
tion
Probe
Height
(m)
Analysis &
(Method
Code)
Sampling
Frequency
PM2.5
88101-1
Neighbor-
hood
Highest
Concentration
SLAMS 2.4 FRM
Gravimetric
w/VSCC
(145)
1:1
PM2.5
88502-3
Neighbor-
hood
Highest
Concentration
SPM
2.5 TEOM
Gravimetric
(702)
Continuous

82
Parameter Scale Objective Designa-
tion
Probe
Height
(m)
Analysis &
(Method
Code)
Sampling
Frequency
Collocated
PM2.5
88101-2
Neighbor-
hood
Population
Exposure
QA
Colloca-
ted
SPM
2.5 FRM
Gravimetric
w/ VSCC
(145)
1:6

83
Remainder of State
Classification of Monitoring Type by Site
Site ID Site Name
PM
2.5
PM
2.5
Co
nt.
Sp
eci
ati
on
PM
10
Le
ad
Ozo
ne
SO
2
NO
2
Me
tals
Ca
rbo
nyl
s
SV
OC
VO
Cs
Pre
cip
ita
tio
n
45-025-0001 Chesterfield
45-043-0011 Howard High
School #3 *
TOTAL 1 1 0 0 0 1 0 0 2 2 2 2 1
SPM / Other SLAMS / duplicate / QA monitors
*The PM10 monitor is being rotated and will begin operation again in 2021.

84
Chesterfield (NATTS)
CSA/MSA: none/none
AQS Site ID: 45-025-0001
Location: SC Hwy 145, McBee (Route 2 Box 100)
County: Chesterfield
Coordinates: +34.61538, -80.19878
Date Established: January 6, 2000
Site Evaluation: April 30, 2020
The Chesterfield Site is located in central Chesterfield County. The Chesterfield Site has
continuous monitors for PM2.5, ozone, and meteorological parameters. This Site serves
as the required regional transport site for PM2.5. The sample inlets are 43.9 meters from
the nearest road.
The Chesterfield Site is a rural National Air Toxics Trends Station Site (NATTS) which
includes Carbonyls, Volatile Organic Compounds (VOCs), Semi-Volatile Organic
Compounds (SVOCs), and Metals sampling.
This Site meets all 40 CFR Part 58, Appendix E requirements.
Changes for 2020-2021:
There are no changes planned for 2020-2021.
Monitors:
(Table continues on next page)
Parameter Scale Objective Desig-
nation
Probe
Height
(m)
Analysis &
(Method
Code)
Sampling
Frequency
PM2.5
88101-1
Regional Regional
Transport
SLAMS 2.9 FRM
Gravimetric
w/ VSCC
(145)
1:3
PM2.5
88502-3
Regional Population
Exposure
SLAMS
4.8 FDMS
Gravimetric
(183)
Continuous
Ozone
44201-1
Regional General /
Background
SPM 4.8 Ultraviolet
Absorption
(087)
Continuous

85
Parameter Scale Objective Desig-
nation
Probe
Height
(m)
Analysis &
(Method
Code)
Sampling
Frequency
Carbonyls Urban NATTS Non-
regula-
tory
4.78 DNPH/HPLC 1:6
Collocated
Carbonyls
Urban NATTS Non-
regula-
tory
4.78 DNPH/HPLC 1:6
SVOC Urban NATTS Non-
regula-
tory
1.9 PUF/GCMS 1:6
Collocated
SVOC
Urban NATTS Non-
regula-
tory
1.9 PUF/GCMS 1:6
VOC Urban NATTS Non-
regula-
tory
3.23 Canister/
GCMS
1:6
Collocated
VOC
Urban NATTS Non-
regula-
tory
3.28 Canister/
GCMS
1:6
Metals Urban NATTS SPM 2.4 PM10 /
ICP/MS
1:6
Collocated
Metals
Urban NATTS SPM 2.4 PM10 /
ICP/MS
1:6
Precipita-
tion
Neighbor-
hood
General/
Background
SPM 1.73 Tipping
Bucket
(011)
Continuous

86
Howard High School #3
CSA/MSA: Myrtle Beach-Conway SC, NC CSA/none
AQS Site ID: 45-043-0011
Location: 594 Gilbert Street
County: Georgetown
Coordinates: +33.36892, -79.29662
Date Established: July 15, 2008
Site Evaluation: January 23, 2019
The Howard High #3 Site is located in Georgetown County on the grounds of
Howard High School and supports a PM10 monitor. PM10 monitoring in this area of
Georgetown has been ongoing since 1970, when the original Howard High site was
established. The sample inlet is 49.7 meters from the nearest road.
This site began a rotational schedule in 2019. The PM10 monitoring was
discontinued on April 3, 2019, and will operate again from 2021 through 2022.
This site meets all 40 CFR Part 58, Appendix E requirements.
Changes for 2020-2021:
Instead of terminating this Site, the Department has decided to maintain the
Howard High #3 Site and operate the PM10 monitor on a two-year rotation from
2021-2022.
Monitors:
Parameter Scale Objective Designation Probe
Height
(m)
Analysis
&
(Method
Code)
Sampling
Frequency
PM10
81102-1
Neighbor
-hood
Population
Exposure/
Highest
Concentration
SPM TEOM
Gravime-
tric
(079)
Continuous

87
Network Development
The Monitoring Network provides data to support an array of decisions ranging
from development of emissions strategies to protect and improve air quality to the
level of activity appropriate for individuals in sensitive populations. To support
these varied data users, the network must provide both stable, long-term measures
to document trends and rapid reporting of conditions to the public. In response to
land use, population, and urban areas growth, the network must be evaluated and
adjusted to meet the changing conditions and needs.
The Monitoring Network described in this plan continues to build upon a significant
transition from the network that has evolved over the last thirty-five years. It
reflects the successes in reducing ambient concentrations of TSP, lead, CO, NO2,
and SO2, and the increasing concern about the impact of fine particles and ozone
on public health and the environment.
A series of studies are planned for the major urban areas, as resources permit, to
gain better understanding of the air quality, and provide information to improve
the monitoring network. In addition to the intensive studies that provide a detailed
‘snapshot,’ it is intended that SPM sites be established and monitored in rotation to
provide regular checks and long term tracking of the trends in air quality in all areas
of the state including smaller cities, towns, and rural areas. The implementation of
this long-term strategy is contingent on sufficient federal funding to support the
core-required monitoring and will be developed and evaluated as resources
become available. Project plans will be developed for the monitoring and data
analysis activity to better define the scope of these strategies prior to
implementation. These studies are long-term needs the Department has identified
and are important tools for evaluating and improving the representativeness of the
ambient air monitoring network and our knowledge of air quality in the state.

88
Appendix A: Notification of Termination
The Table below contains information on the monitoring sites the Department has
scheduled to terminate.
Site ID Date
Established Notes
Long Creek 45-073-0001 August 1, 1983
Due to limited resources and limited
use of the data, the Department has
decided to terminate this site.
Termination of the Long Creek (45-073-0001) Monitoring Site
The Department is notifying the EPA that all monitoring at the Long Creek (45-073-
0001) Site has been terminated and all monitoring ended January 22, 2020.
Details on the Long Creek (45-073-0001) Site are given in the Table below.
Long Creek (45-073-0001) Monitoring Site Information Table
Name Long Creek
Site ID 45-073-0001
Address Round Tower Mountain Road
County Oconee
Name of MSA None
Name of CSA None
Coordinates +34.805333, -83.23777
Date Established August 1, 1983
Parameter PM2.5
Scale Urban
Begin Date May 4,1989
End Date December 4, 2019
Objective General/Background
Designation SPM
Probe Height 4.0
Analysis Method and code FDMS Gravimetric (581)
Sampling Frequency Continuous

89
Distance to road 30 meters
Distance to drip line 7.48
Distance to nearest obstruction 9.8
Parameter Ozone
Scale Regional
Begin Date July 1, 1991
End Date November 6, 2019
Objective General/Background
Designation SPM
Probe Height 4.18
Analysis Method and code Ultraviolet (047)
Sampling Frequency Continuous
Distance to road 30 meters
Distance to drip line 9.8
Distance to nearest obstruction 11.4
Parameter Sulfur Dioxide
Scale Regional
Begin Date July 1, 1991
End Date January 22, 2020
Objective Regional Transport
Designation SPM
Probe Height 4.18
Analysis Method and code Pulsed Fluorescent
Sampling Frequency Continuous
Distance to road 30 meters
Distance to drip line 7.48
Distance to nearest obstruction 9.8
Parameter Precipitation
Scale Neighborhood
Objective General/Background
Designation SPM
Probe Height 1.73
Analysis Method and code Tipping Bucket (011)

90
Sampling Frequency Continuous and Sample
Background
The Long Creek (45-073-0001) Site was located at the top of Round Mountain in
northwest Oconee County. Oconee County is included in the Seneca, SC
Micropolitan Statistical Area. The site monitored for ozone, sulfur dioxide,
continuous PM2.5, and precipitation and all monitors were designated as SPM. This
site was established as a part of the Southern Oxidant Study in 1983. In the past, it
was used as a ‘bellwether’ site for regional transport of criteria pollutants from the
Atlanta area. Unfortunately, the site’s had continual tree obstructions and drip line
issues. Also, it was the most expensive site to operate because of its remote
location. Therefore, in order to conserve resources, the Department has decided to
terminate the site.
Since the establishment of this Site, the trees surrounding the site have grown. In
the Table below, the first panorama shown below was taken in 2015. All of the area
above the red line in the picture were considered obstructions. Since that time,
some of the trees were cut. Also, there are two tree limbs that cause the drip line
requirement found in 40 CFR 58.5(a) to not be met (7.48 meters).
Table of Long Creek Monitoring Site Panoramas
2015 Long Creek Monitoring Site Panorama from Top of Monitor Building
2018 Long Creek Site Panorama Toward Site
2018 Long Creek Site Panorama Away from Site

91
Region 4 has requested, and the Department herein gives notification that the
PM2.5, ozone, and SO2 SPM monitors which have been in operation for more than
24 months will be terminated.

92
This page left intentionally blank.

93
Appendix B: Site Evaluations Summary for CFR 40 Part 58, Appendix E Table
Site Evaluations are conducted yearly on each monitoring site to ensure compliance to requirements found in 40 CFR
Part 58, Appendix E. After appropriate administrative review, the Site Evaluations are sent to the EPA Region 4. The
following tables summarize information about the latest Site Evaluations for each monitoring site.
The first table gives the column number and the shortened Column Name listed in the columns of the second table.
It also gives the Section number and the regulatory requirement it represents from the 40 CFR, Part 58, Appendix E.
The second table lists each monitoring site, their individual criteria pollutant monitors, and the fulfillment and/or
measurements of the 40 CFR Part 58, Appendix E requirements. For brevity, the column titles in the second table have
been shortened as follows:

94
Column Column Name 40 CFR Part 58, Appendix E Requirements
Column 1: Site ID, Site Name
and Date Visited
Site Identification information and date the Site Evaluation was conducted.
Column 2: Parameter Criteria Pollutant.
Column 3: Sampling Train Section 9. For reactive gases, is sampling train made of borosilicate glass, FEP
Teflon or their equivalent?
Column 4: Sampling Time Section 9. For reactive gases, is sampling time <20 seconds?
Column 5: Probe Height Section 2. Horizontal and Vertical Placement: Height from ground to probe must
be 2-15 meters.
Column 6: Support Structure Section 2. Horizontal and Vertical Placement: Is Horizontal and vertical distance
from supporting structure >1 meter.
Column 7: Collocation
Placement
Section 11. Horizontal and Vertical Placement: Collocated monitors must be
within 4 meters of each other.
Column 8: Flow Rates Section 11. Horizontal and Vertical Placement: For PM collocation, flow rates
greater than 200 liters/min must be at least 2 meters apart or at least 1-meter
flow rates for less than 200 liters/min.
Column 9: Minor Sources Section 3. Spacing from Minor Sources: Probe should be away from minor
sources.
Column 10: Obstructions* Section 4. Spacing from Obstructions: Distance from probe to obstacle must be
at least twice the height the obstacle protrudes above the probe.
Column 11: Airflow Section 4. Spacing from Obstructions: Must have unrestricted airflow 270
degrees around probe.
Column 12: Dripline Section 5. Spacing from Trees: Distance from dripline of trees to probe must be
<10 meters.
Column 13: Roadway Section 6. Spacing from Roadways: Does it meet distance from roadway to
probe?

95
Site ID,
Site Name
and Date
Visited
Para-
meter
Sam-
pling
Train
Sam-
pling
Time
Probe
Height
(m)
Support
Structure
Colloca-
tion
Place-
ment (m)
Flow
Rate
Minor
Sources
*Obstr
uctions
Air-
flow
Dripline
(m)
Roadway
(m)
003-0003
Jackson
2/26/2020
Ozone Yes Yes Yes 3.35 Yes N/A N/A N/A Yes *No Yes Yes 11.5 Yes 128.0
037-0001
Trenton
2/26/2020
PM2.5 N/A N/A Yes 4.72 Yes N/A N/A Yes Yes Yes Yes Yes No
trees
Yes 30.3
037-0001
Trenton
2/26/2020
PM2.5 C N/A N/A Yes 4.57 Yes N/A N/A Yes Yes Yes Yes Yes No
trees
Yes 30.3
037-0001
Trenton
2/26/2020
Ozone Yes Yes Yes 3.45 Yes N/A N/A N/A Yes Yes Yes Yes No
trees
Yes 30.3
015-1002
Moncks
Corner
Ozone Yes Yes Yes 3.13 Yes N/A N/A N/A Yes No No No 1.40 Yes 15.2
019-0003
Jenkins Ave.
1/29/2020
PM10 N/A N/A Yes 4.1 Yes N/A N/A Yes Yes Yes Yes Yes 16.0 Yes 33.5
019-0003
Jenkins Ave.
1/29/2020
SO2 Yes Yes Yes 4.68 Yes N/A N/A N/A Yes Yes Yes Yes 16.0 Yes 33.5
019-0003
Jenkins Ave.
1/29/2020
NO2 Yes Yes Yes 4.68 Yes N/A N/A N/A Yes Yes Yes Yes 16.0 Yes 33.5

96
Site ID,
Site Name
and Date
Visited
Para-
meter
Sam-
pling
Train
Sam-
pling
Time
Probe
Height
(m)
Support
Structure
Colloca-
tion
Place-
ment (m)
Flow
Rate
Minor
Sources
*Obstr
uctions
Air-
flow
Dripline
(m)
Roadway
(m)
019-0046
Cape
Romain
1/15/2020
PM2.5 N/A N/A Yes 4.71 Yes N/A N/A N/A Yes No No Yes 15.5 Yes 86.0
019-0046
Cape
Romain
1/15/2020
Ozone Yes Yes Yes 4.22 Yes N/A N/A N/A Yes No No Yes 12.6 Yes 86.0
019-0046
Cape
Romain
1/15/2020
SO2 Yes Yes Yes 4.10 Yes N/A N/A N/A Yes No No Yes 12.6 Yes 86.0
019-0048
FAA
1/23/2020
PM2.5 N/A N/A Yes 2.42 Yes N/A N/A Yes Yes No Yes No 5.9 Yes 160.0
019-0049
CPW
1/23/2020
PM2.5 N/A N/A Yes 2.25 Yes N/A N/A Yes Yes *No Yes No 4.43 Yes 24.8
019-0049
CPW
1/23/2020
PM2.5 C N/A N/A Yes 2.83 Yes N/A N/A Yes Yes *No Yes No 5.63 Yes 24.8
091-0008
York
Landfill
2/28/2019
Ozone Yes Yes Yes 4.54 Yes N/A N/A N/A Yes Yes Yes Yes 26.4
0
Yes 34.8

97
Site ID,
Site Name
and Date
Visited
Para-
meter
Sam-
pling
Train
Sam-
pling
Time
Probe
Height
(m)
Support
Structure
Colloca-
tion
Place-
ment (m)
Flow
Rate
Minor
Sources
*Obstr
uctions
Air-
flow
Dripline
(m)
Roadway
(m)
091-0008
York
Landfill
2/28/2019
SO2 Yes Yes Yes 4.54 Yes N/A N/A N/A Yes Yes Yes Yes 26.4
0
Yes 34.8
063-0008
Irmo
6/19/2019
PM2.5 C N/A N/A Yes 4.87 Yes Yes 1.4 Yes Yes Yes Yes Yes N/A Yes 39.0
063-0008
Irmo
6/19/2019
PM2.5 N/A N/A Yes 4.6 Yes Yes 1.4 Yes Yes Yes Yes Yes N/A Yes 39.0
063-0008
Irmo
6/19/2019
SO2 Yes Yes Yes 3.38 Yes N/A N/A N/A Yes Yes Yes Yes N/A Yes 39.0
063-0010
Cayce CH
2/4/2020
PM10 N/A N/A Yes 2.22 Yes N/A N/A Yes Yes Yes Yes Yes 10.5 Yes 24.0
079-0007
Parklane
6/26/2019
PM2.5 N/A N/A Yes 4.26 Yes Yes 2.4 Yes Yes Yes Yes Yes 16.7 Yes 131.0
079-0007
Parklane
6/26/2019
PM2.5 N/A N/A Yes 4.7 Yes Yes 2.4 Yes Yes Yes Yes Yes 16.7 Yes 131.0
079-0007
Parklane
6/26/2019
PM2.5 C N/A N/A Yes 4.5 Yes N/A N/A Yes Yes Yes Yes Yes 22.9 Yes 131.0

98
Site ID,
Site Name
and Date
Visited
Para-
meter
Sam-
pling
Train
Sam-
pling
Time
Probe
Height
(m)
Support
Structure
Colloca-
tion
Place-
ment (m)
Flow
Rate
Minor
Sources
*Obstr
uctions
Air-
flow
Dripline
(m)
Roadway
(m)
079-0007
Parklane
6/26/2019
Speciat
ed
PM2.5
N/A N/A Yes 2.40 Yes N/A N/A N/A Yes Yes Yes Yes 15.3 Yes 145.8
079-0007
Parklane
6/26/2019
PM10 C N/A N/A Yes 5.1 Yes N/A N/A N/A Yes Yes Yes Yes 17.9 Yes 131.0
079-0007
Parklane
6/26/2019
Ozone Yes Yes Yes 4.26 Yes N/A N/A N/A Yes Yes Yes Yes 22.3 Yes 131.0
079-0007
Parklane
6/26/2019
SO2 Yes Yes Yes 4.26 Yes N/A N/A N/A Yes Yes Yes Yes 22.3 Yes 131.0
079-0007
Parklane
6/26/2019
CO Yes Yes Yes 4.26 Yes N/A N/A N/A Yes Yes Yes Yes 22.3 Yes 131.0
079-0007
Parklane
6/26/2019
NO/NO
y
Yes Yes Yes 10.0 Yes N/A N/A N/A Yes Yes Yes Yes 22.3 Yes 131.0
079-0021
Congaree
Bluff
2/24/2020
Ozone Yes Yes Yes 4.15 Yes N/A N/A N/A Yes **No Yes No 7.4 Yes 187.5
079-0021
Congaree
Bluff
2/24/2020
SO2 Yes Yes Yes 4.15 Yes N/A N/A N/A Yes **No Yes No 7.4 Yes 187.5

99
Site ID,
Site Name
and Date
Visited
Para-
meter
Sam-
pling
Train
Sam-
pling
Time
Probe
Height
(m)
Support
Structure
Colloca-
tion
Place-
ment (m)
Flow
Rate
Minor
Sources
*Obstr
uctions
Air-
flow
Dripline
(m)
Roadway
(m)
079-1001
Sandhill
2/21/2020
Ozone Yes Yes Yes 4.2 Yes N/A N/A N/A Yes Yes Yes Yes 16.4 Yes 31.1
079-1001
Sandhill
2/21/2020
NO2 Yes Yes Yes 4.2 Yes N/A N/A N/A Yes Yes Yes Yes 16.4 Yes 31.1
031-0003
Pee Dee
6/04/2020
Ozone Yes Yes Yes 4.16 Yes N/A N/A N/A Yes Yes Yes Yes No
trees
Yes 193.3
041-0003
Williams
MS
5/07/2020
PM2.5 C N/A N/A Yes 2.23 Yes N/A N/A Yes Yes Yes Yes Yes 19.4 Yes 110.0
041-0003
Williams
MS
5/07/2020
PM2.5 N/A N/A Yes 2.15 Yes N/A N/A Yes Yes Yes Yes Yes 20.4 Yes 110.0
041-8001
JCI Railroad
5/07/2020
Lead
POC 1
N/A N/A Yes 2.58 Yes N/A N/A N/A Yes Yes Yes Yes 17.4 Yes 99.0
041-8001
JCI Railroad
5/07/2020
Lead
POC 2
N/A N/A Yes 2.59 Yes N/A N/A N/A Yes Yes Yes Yes 17.4 Yes 99.0
041-8002
JCI Entrance
5/07/2020
Lead
POC 1
N/A N/A Yes 2..53 Yes N/A N/A N/A Yes Yes Yes Yes 17.2 Yes 37.0

100
Site ID,
Site Name
and Date
Visited
Para-
meter
Sam-
pling
Train
Sam-
pling
Time
Probe
Height
(m)
Support
Structure
Colloca-
tion
Place-
ment (m)
Flow
Rate
Minor
Sources
*Obstr
uctions
Air-
flow
Dripline
(m)
Roadway
(m)
041-8002
JCI Entrance
5/07/2020
Lead
POC 2
N/A N/A Yes 2.52 Yes N/A N/A N/A Yes Yes Yes Yes 19.3 Yes 37.0
041-8002
JCI Entrance
5/07/2020
Lead
POC 3
N/A N/A Yes 2.54 Yes N/A N/A N/A Yes Yes Yes Yes 19.3 Yes 37.0
041-8003
JCI Woods
6/04/2020
Lead
POC 1
N/A N/A Yes 2.43 Yes N/A N/A N/A Yes *No Yes Yes 20.4 Yes 1030.0
041-8003
JCI Woods
6/04/2020
Lead
POC 2
N/A N/A Yes 2.43 Yes
N/A
N/A
N/A Yes *No Yes Yes 20.4 Yes 1030.0
041-8003
JCI Woods
6/04/2020
Lead #3 N/A N/A Yes 2.42 Yes N/A N/A N/A Yes *No Yes Yes 21.4 Yes 1030.0
007-0005
Big Creek
3/09/2020
Ozone Yes Yes Yes 4.10 Yes N/A N/A N/A Yes Yes Yes Yes No
trees
Yes 43.9
045-0015
ESC
5/21/2020
PM2.5 N/A N/A Yes 3.50
Yes Yes 2.8
4
Yes Yes **No Yes Yes 19.5 Yes 15.9
045-0015
ESC
5/21/2020
PM2.5 C N/A N/A Yes 4.6 Yes Yes 2.8
4
Yes Yes Yes Yes Yes 16.5 Yes 13.8
045-0015
ESC
PM10 N/A N/A Yes 4.35 Yes N/A N/A Yes Yes Yes Yes Yes 20.8 Yes 12.4

101
Site ID,
Site Name
and Date
Visited
Para-
meter
Sam-
pling
Train
Sam-
pling
Time
Probe
Height
(m)
Support
Structure
Colloca-
tion
Place-
ment (m)
Flow
Rate
Minor
Sources
*Obstr
uctions
Air-
flow
Dripline
(m)
Roadway
(m)
4/4/2019
045-0015
ESC
5/21/2020
SO2 Yes Yes Yes 4.35 Yes N/A N/A N/A Yes Yes Yes Yes 16.0 Yes 13.0
045-0015
ESC
5/21/2020
NO2 Yes Yes Yes 4.35 Yes N/A N/A N/A Yes Yes Yes Yes 16.0 Yes 13.0
045-0016
Hillcrest
5/21/2020
PM2.5 N/A N/A Yes 3.42 Yes Yes 1.7
2
Yes Yes Yes Yes Yes 67.0 Yes 54.0
045-0016
Hillcrest
5/21/2020
PM2.5 N/A N/A Yes 3.42 Yes Yes 1.7
2
Yes Yes Yes Yes Yes 67.0 Yes 54.0
045-0016
Hillcrest
5/21/2020
Ozone Yes Yes Yes 3.96 Yes N/A N/A N/A Yes Yes Yes Yes 67.0 Yes 54.0
Garrison
Arena
007-0006
3/9/2020
Ozone Yes Yes Yes 4.55 Yes N/A N/A N/A Yes *No Yes Yes 12.6 Yes 33.9
077-0003
Wolf Creek
5/22/2019
Ozone Yes Yes Yes 4.15 Yes N/A N/A N/A Yes Yes Yes Yes 26.3 Yes 56.4
051-0008
Coastal
Carolina
Ozone Yes Yes Yes 4.10 Yes N/A N/A N/A Yes Yes Yes Yes 10.3 Yes 18.3

102
Site ID,
Site Name
and Date
Visited
Para-
meter
Sam-
pling
Train
Sam-
pling
Time
Probe
Height
(m)
Support
Structure
Colloca-
tion
Place-
ment (m)
Flow
Rate
Minor
Sources
*Obstr
uctions
Air-
flow
Dripline
(m)
Roadway
(m)
3/3/2020
083-0009
NSFS#2
2/5/2019
Ozone Yes Yes Yes 3.9 Yes N/A N/A N/A Yes Yes No Yes 21.8 Yes 92.5
083-0011
TK Gregg
2/9/2019
PM2.5 N/A N/A Yes 2.43 Yes Yes 1.7 Yes Yes Yes Yes Yes 37.0 Yes 48.2
083-0011
TK Gregg
2/9/2019
PM2.5 N/A N/A Yes 2.43 Yes Yes 1.7 Yes Yes Yes Yes Yes 37.0 Yes 48.2
083-0011
TK Gregg
2/9/2019
PM2.5 C N/A N/A Yes 2.44 Yes N/A N/A Yes Yes Yes Yes Yes 37.0 Yes 48.2
025-0001
Chesterfiel
d
4/30/2020
PM2.5 N/A N/A Yes 2.1 Yes N/A N/A Yes Yes Yes Yes Yes 23.0 Yes 43.9
025-0001
Chesterfiel
d
4/30/2020
PM2.5 C N/A N/A Yes 4.90 Yes N/A N/A Yes Yes Yes Yes Yes 25.8 Yes 33.1
025-0001
Chesterfiel
d
4/30/2020
Speciat
ed
PM2.5
N/A N/A Yes 2.0 Yes N/A N/A N/A Yes Yes Yes Yes 32.8 Yes 43.9

103
Site ID,
Site Name
and Date
Visited
Para-
meter
Sam-
pling
Train
Sam-
pling
Time
Probe
Height
(m)
Support
Structure
Colloca-
tion
Place-
ment (m)
Flow
Rate
Minor
Sources
*Obstr
uctions
Air-
flow
Dripline
(m)
Roadway
(m)
025-0001
Chesterfiel
d
4/30/2020
Ozone Yes Yes Yes 4.65 Yes N/A N/A N/A Yes Yes Yes Yes 25.0 Yes 33.1
073-0001
Long Creek
10/23/2018
PM2.5 C N/A N/A Yes 4.18 Yes N/A N/A Yes Yes Yes No No 7.48 Yes 30.0
073-0001
Long Creek
10/23/2018
Ozone Yes Yes Yes 4.06 Yes N/A N/A N/A Yes Yes No No 9.08 Yes 30.0
073-0001
Long Creek
10/23/2018
SO2 Yes Yes Yes 4.06 Yes N/A N/A N/A Yes Yes No No 9.08 Yes 30.0
*The monitor is still considered in compliance if the distance from probe to obstacle is not at least twice the height the obstacle protrudes
above the probe but there is still 270° of airflow around probe. **Site has waiver for these obstructions

104
This page left intentionally blank

105
Appendix C: Alphabetical Order of Monitoring Sites
Monitoring Site Name MSA/County Page
Big Creek Greenville-Anderson MSA 72
Cape Romain Charleston-North Charleston MSA 50
Cayce City Hall Columbia MSA 59
Charleston Public Works (CPW) Charleston-North Charleston MSA 53
Chesterfield Chesterfield County 84
Coastal Carolina Myrtle Beach-Conway-North Myrtle
Beach SC-NC MSA
78
Congaree Bluff Columbia MSA 63
FAA Charleston-North Charleston MSA 52
Garrison Arena Greenville-Anderson MSA 73
Greenville Employment Security
Commission (ESC)
Greenville-Anderson MSA 74
Hillcrest Middle School Greenville-Anderson 76
Irmo Columbia MSA 58
Irving Street Charleston-North Charleston MSA 49
Howard High #3 Georgetown County 86
Jackson Middle School Augusta-Richmond County, GA-SC MSA
(part)
42
Jenkins Ave. Fire Station Charleston-North Charleston MSA 47
Johnson Controls-JCI Railroad Florence MSA 69
Johnson Controls-JCI Entrance Florence MSA 69
Johnson Controls-JCI Woods Florence MSA 69
Moncks Corner National Guard Charleston-North Charleston MSA 46
North Charleston Fire Station Charleston-North Charleston MSA 48
North Spartanburg Fire Station
#2
Spartanburg MSA 80
Parklane (NCore) Columbia MSA 60
Pee Dee Experimental Station Florence MSA 67
Sandhill Experimental Station Columbia MSA 65
T.K. Gregg Recreational Center Spartanburg MSA 81
Trenton Augusta-Richmond County, GA-SC MSA
(part)
43
Williams Middle School Florence MSA 68
York Landfill Charlotte-Concord-Gastonia MSA 55

106
Appendix D: Summary of Changes for July 1, 2019 through
December 31, 2020
Augusta-Richmond County, GA-SC MSA (South Carolina portion includes Aiken and Edgefield Counties)
No changes planned for 2020.
Charleston-North Charleston MSA
Bushy Park (45-015-0002) Site – This Site will be discontinued after the Moncks Corner National Guard Site is established.
Moncks Corner National Guard (45-015-1002) Site – This Site is targeted to become operational on March 1, 2020 and will house the required Ozone monitor for the MSA.
North Charleston Fire Station (45-019-0020) Site – This Site is targeted to become operational on January 1, 2020 and will house the required PM2.5 monitors from the FAA and CPW Sites.
Cape Romain (45-019-0046) Site – The SO2 monitor has been put on a two-year rotating schedule and will begin operation on January 1, 2020.
FAA (45-019-0048) Site – This Site or the CPW Site will operate for one year, then be discontinued when the North Charleston Fire Station Site is established.
CPW (45-019-0049) Site – This Site or the FAA Site will operate for one year, then be discontinued when the North Charleston Fire Station Site is established.
Charlotte-Concord-Gastonia, NC-SC MSA
York Landfill (45-091-0008) Site – The SO2 monitor has been put on a two-year rotating schedule and will begin operation on January 1, 2020.
Columbia MSA
Irmo (45-063-0008) Site – The carbonyls, SVOCs, and SO2 will be discontinued on 12/31/2019.
Parklane (45-079-0007) Site – The SLAMS Lead monitor is no longer required at the NCore site. It was discontinued on December 31, 2018.
Congaree Bluff (45-079-0021) Site – The SO2 monitor has been put on a two-year rotating schedule and will begin operation on January 1, 2022.
Florence MSA
No changes planned for 2020.
Greenville-Anderson MSA
Big Creek (45-007-0005) Site – This Site will run concurrently with the Garrison Arena Site for the 2020 Ozone season, and then be discontinued after October 31, 2020.
Garrison Arena (45-007-0006) Site – This Site is targeted to become operational in 2020.
Clemson (45-077-0002) Site – This Site will close after the 2019 Ozone season.

107
Wolf Creek (45-077-0003) Site – This Site will close after the 2019 Ozone season.
Hilton Head Island-Bluffton MSA
No changes planned for 2020.
Myrtle Beach-Conway-North Myrtle Beach SC-NC MSA
No changes planned for 2020.
Spartanburg MSA
No changes planned for 2020.
Sumter MSA
No changes planned for 2020.
Remainder of State
Chesterfield (45-025-0001) Site – Due to resource reallocation, the PM2.5 Speciation was discontinued on January 2, 2019.
Ashton (45-029-0002) Site – This Site was discontinued on January 08, 2019.
Howard #3 (45-45-043-0011) Site – This Site was discontinued on April 3, 2019.
Long Creek (45-073-0001) Site – The SO2 monitor has been put on a two-year rotating schedule and will begin operation on January 1, 2022.

108
Appendix E: EPA Correspondence


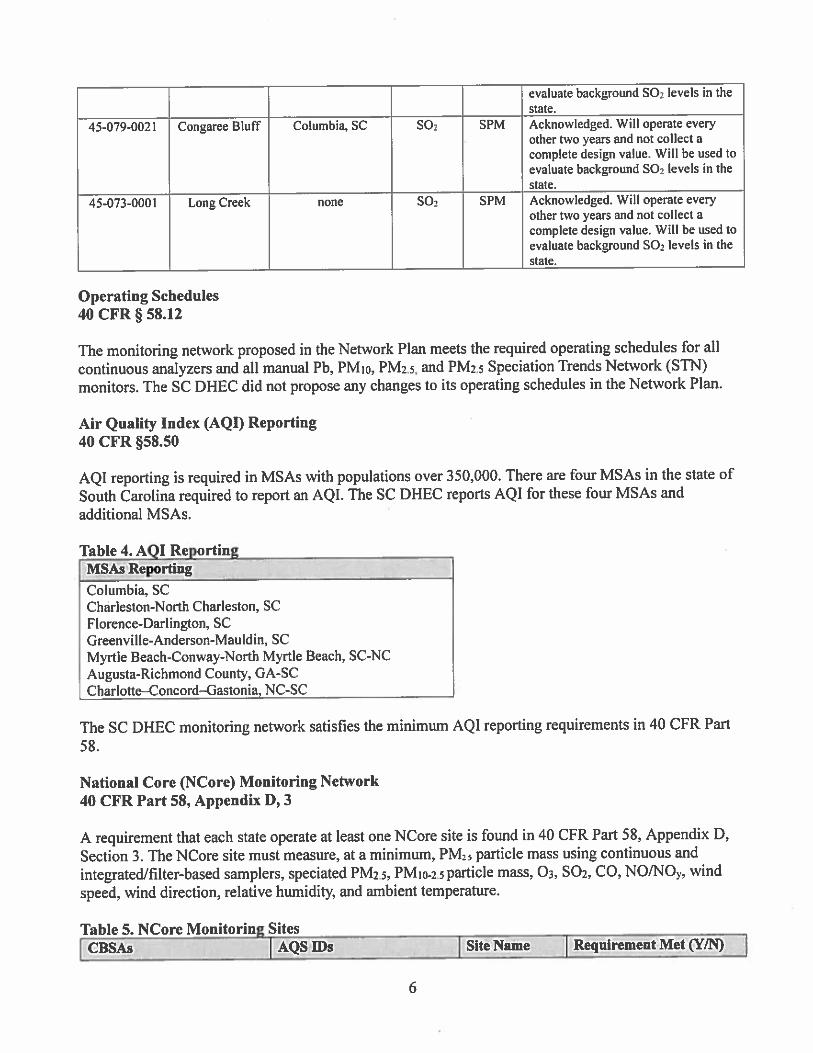


109
Appendix F: Memorandum of Agreements and Waivers


MEMORANDUM OF AGREEMENT
ON AIR QUALITY MONITORING FOR CRITERIA POLLUTANTS FOR
THE CHARLOTTE-CONCORD-GASTONIA
Participating Agencies:
North Carolina
METROPOLITAN STATISTICAL AREA (MSA)
July I, 2016
Department of Environmental Quality (NCDEQ) Division of Air Quality (NCDAQ)
South Carolina Department of Health and Environmental Control (SCDHEC) Bureau of Air Quality
Mecklenburg County, North Carolina Land Use and Environmental Services Agency Air Quality (MCAQ)
I. PURPOSE/OBJECTIVES/GOALS
:RECEIVED JUl 01 7.010
BUREAU OF AIR QUAUiY
The purpose of this Memorandum of Agreement (MOA) is to establish the Charlotte-ConcordGastonia Metropolitan Statistical Area (MSA) Criteria Pollutant Air Quality Monitoring Agreement among NCDAQ, SCDHEC, and the MCAQ (collectively referred to as the "affected agencies") to collectively meet United States Environmental Protection Agency (EPA) minimum monitoring requirements for criteria pollutants deemed necessary to meet the needs of the MSA as determined reasonable by all parties. This MOA will renew the terms and conditions of this collective agreement to provide adequate criteria pollutant monitoring for the Charlotte-Concord-Gastonia MSA as required by 40 CFR 58 Appendix D, Section 2(e).
II. BACKGROUND
The Charlotte-Concord-Gastonia MSA consists of
Cabarrus County, NC Gaston County, NC Iredell County, NC Lincoln County, NC Mecklenburg County, NC Rowan County, NC Union County, NC Chester County, SC Lancaster County, SC

York County, SC
NCDAQ has jurisdiction over Cabarrus, Gaston, Iredell, Lincoln, Rowan, and Union Counties; SCDHEC has jurisdiction over Chester, Lancaster, and York Counties; MCAQ has jurisdiction over Mecklenburg County.
The NCDAQ, SCDHEC, and MCAQ are required by the Clean Air Act to measure for certain criteria pollutants in the ambient air in the Charlotte-Concord-Gastonia MSA. The EPA has established minimum monitoring requirements based on the size of the MSA and the quality of the air in the MSA.
40 CFR 58 Appendix D, Section 2 (e) states (in part):
" ... The EPA recognizes that State or local agencies must consider MSA/CSA boundaries and their own political boundaries and geographical characteristics in designing their air monitoring networks. The EPA recognizes that there may be situations where the EPA Regional Administrator and the affected State or local agencies may need to augment or to divide the overall MSA/CSA monitoring responsibilities and requirements among these various agencies to achieve an effective network design. Full monitoring requirements apply separately to each affected State or local agency in the absence of an agreement between the affected agencies and the EPA Regional Administrator."
Currently each air pollution control agency (affected agency) conducts monitoring in its respective jurisdiction and coordinates monitoring with the other air pollution control agencies within the MSA.
III. ROLES AND RESPONSIBILITIES
The parties agree to the following terms and conditions:
• NCDAQ, SCDHEC, and MCAQ (the "affected agencies") commit to conducting appropriate monitoring in their respective jurisdictions of the MSA; as needed, to collectively meet EPA minimum monitoring requirements for the entire MSA for criteria air pollutant monitoring deemed necessary to meet the needs of the MSA as determined reasonable by all affected agencies. The minimum air quality monitoring requirements for the MSA shall apply to the MSA in its entirety and shall not apply to any sole affected agency within the MSA unless agreed upon by all affected agencies.
• The affected agencies commit to coordinating monitoring responsibilities and requirements to achieve an effective network design regarding criteria air pollutant monitoring conducted in the MSA and commit to communicate unexpected or unplanned changes in monitoring activities within their jurisdictions to the other affected agencies. As conditions warrant, the affected agencies may conduct telephone conference calls, meetings, or other communications to discuss monitoring activities for the MSA. Each affected party shall inform the others via telephone or e-mail of any monitoring changes occurring in its jurisdiction of the MSA at its earliest convenience after learning of the need for the change or making the changes. Such unforeseen changes may include evictions from monitoring sites, destruction of monitoring sites due to

natural disaster, or similar occurrences that result in extended change (greater than one quarter) or permanent change in the monitoring network. At least once a year in the second quarter or before June IS Ih, each agency shall make available to the other agency a copy of its proposed monitoring plan for its jurisdiction with the MSA for the next year.
• Each party reserves the right to revoke or terminate this MOA at any time for any reason by giving thirty (30) days written notice prior to the date of termination.
IV. LIMITATIONS
A. All commitments made in this MOA are subject to the availability of funds and each party's budget priorities. Nothing in this MOA, in and of itself, obligates NCDAQ, SCDHEC, or MCAQ to expend funds or to enter into any contract, assistance agreement, interagency agreement, or other financial obligation.
B. This MOA is neither a fiscal nor a funds obligation document. Any endeavor involving reimbursement or contribution of funds between parties to this MOA will be handled in accordance with applicable laws, regulations, and procedures, and will be subject to separate subsidiary agreements what will be effected in writing by representatives of the parties.
C. Except as provided in Section III, this MOA does not create any right or benefit, substantive or procedural, enforceable by law or equity against NCDAQ, SCDHEC, or MCAQ, their officers or employees, or any other person. This MOA does not direct or apply to any person outside NCDAQ, SCDHEC, or MCAQ.
V. PROPRIETARY INFORMATION AND INTELLUCTUAL PROPERTY
No proprietary information or intellectual property is anticipated to arise out of this MOA.
VI. POINTS OF CONTACT
The following individuals are designated points of contact for the MOA:
NCDEQDAQ:
SCDHEC:
Joette Steger NC DENR Division of Air Quality 1641 Mail Service Center Raleigh, NC 27699-1641
[email protected] Voice/fax: 919-707-8449
Scott Reynolds SCDHEC Bureau of Environmental Health Services 2600 Bull Street Columbia, SC 29201

MCAQ:
[email protected] Voice: 803-896-0902
Jeff Francis Mecklenburg County Land Use and Environmental Services Agency Air Quality 2145 Suttle Avenue Charlotte, NC 28208-5237
[email protected] Phone 704-336-5430 Fax 704-336-4391
In the event that a point of contact needs to be changed, notification may be made via email to the other parties.
VII. MODIFICATION/DURA TIONfTERMINA TION
This MOA will be effective when signed by all parties. This MOA may be amended at any time by the mutual written consent of all parties. The parties will review this MOA at least once every 10 years to determine whether it should be revised, renewed, or cancelled. This MOA may be revoked or terminated by an affected party at any time and for any reason by giving thirty (30) days written notice prior to the date of termination.
VIII. REFERENCE
United States Environmental Protection Agency, Title 40 Code of Federal Regulations, Part 58, Appendix D, "Network Design Criteria for Ambient Air Quality Monitoring", Section 2 (e), "General Monitoring Requirements"
IX. APPROVALS
North Carolina Department of Environmental Quality Division of Air Quality (NCDAQ)
BY: aQ~c.~ TITLE: );?;M~ ) :U;V~1&.--. r:tb fty 6L.,.Q.~ DATE: Ce I ;;1'1 J d=O l !..
South Carolina Department of Health and Environmental Control (SCDHEC)
BureauofA:~CX ~ BY: J~ ~lA...A TITLE: Ch~ { 6J.d~ ~ tI.- .~ At V Qu~

DATE: _____ 6_1+{_D_S-;(r~_'_o"__'_l -""Cp'--_______ _
Mecklenburg County Land Use and Environmental Services Agency - Air Quality (MCAQ) Mecklenburg County Air Quality
BY: JIWAJ.;'-) hi QtboclA"y.= TITLE: ~til.lIM. J Ql H. [JUfi1i16 DATE: Ce /-;; q/~O{U ,

C.uh~lin~ E. H~igd. Din:cIO£
Promoliug lind prOIl'Clin.( rlJl' lUll/I" a/rill' public Imd rill' l'1lViro1l1l1ml
MEMORANDUM
July 5,2016
Subject:
From:
Change of Point of Contact for South Carolina
Memorandum of Agreement on Air Quality Monitoring for Criteria Pollutants for the Charlotte-Concord-Gastonia Metropolitan Statistical Area (MSA)
Rhonda B. Thompson, SC DHEC IY1()J~ Chief, Bureau of Air Quality '-~
As of July 5, 2016, the Point of Contact for South Carolina will be Micheal Mattocks, instead of Scott Reynolds.
Micheal's contact information is below:
Micheal Mattocks SC DHEC - Bureau of Environmental Health Services 2600 Bull Street Columbia, SC 29201 (803)896-0856 [email protected]
SOUTH CAROLINA DEPARTMENT OF HEALTH AND ENVIRONMENTAL CONTROL 2600 BnllStrccl • Cohllnhia,SC29201 • Phollc:(803)8gs.~132· www.scdhcc.go\'

MEMORANDUM OF AGREEMENT
ON AIR QUALITY MONITORING FOR CRITERIA POLLUTANTS FOR
THE MYRTLE BEACH-CONWAY-NORTH MYRTLE BEACH
METROPOLITAN STATISTICAL AREA (MSA)
July 1,2015
Participating Agencies:
North Carolina Department of Environment and Natural Resources (NCDENR) Division of Air Quality (NCDAQ)
South Carolina Department of Health and Environmental Control (SCDHEC) Bureau of Air Quality
I. PURPOSE/OBJECTIVES/GOALS
The purpose of this Memorandum of Agreement (MOA) is to establish the Myrtle Beach-Conway-North Myrtle Beach Metropolitan Statistical Area (MSA) Criteria Pollutant Air Quality Monitoring Agreement between NCDAQ and SCDHEC (collectively referred to as the "affected agencies") to collectively meet United States Environmental Protection Agency (EPA) minimum monitoring requirements for ozone, as well as other criteria pollutants air quality monitoring deemed necessary to meet the needs of the MSA as determined reasonable by all parties. This MOA will establish the terms and conditions of this collective agreement to provide adequate criteria pollutant monitoring for the Myrtle Beach-Conway-North Myrtle Beach MSA as required by 40 CFR 58 Appendix D, Section 2(e).
II. BACKGROUND
The Myrtle Beach-Conway-North Myrtle Beach MSA consists of Horry County and Brunswick County. NCDAQ has jurisdiction over Brunswick County and SCDHEC has jurisdiction over Horry County. Brunswick County was previously included in the Wilmington (NC) MSA with New Hanover and Pender Counties. However, the United States Office of Management and Budget revised the geographic delineation in February 2013 to include Brunswick County in the Myrtle Beach-Conway-North Myrtle Beach MSA instead.
The NCDAQ and SCDHEC are required by the Clean Air Act to measure for certain criteria pollutants in the ambient air in the Myrtle Beach-Conway-North Myrtle Beach MSA. The EPA has established minimum monitoring requirements based on the size of the MSA and the quality of the air in the MSA for ozone.
40 CFR 58 Appendix D, Section 2 (e) states (in part):
" ... The EPA recognizes that State or local agencies must consider MSNCSA boundaries and their own political boundaries and geographical characteristics in designing their air monitoring networks. The EPA recognizes that there may be situations where the EPA Regional Administrator and the affected State or local agencies may need to augment or to

divide the overall MSAlCSA monitoring responsibilities and requirements among these various agencies to achieve an effective network design. Full monitoring requirements apply separately to each affected State or local agency in the absence of an agreement between the affected agencies and the EPA Regional Administrator."
Currently each air pollution control agency (affected agency) conducts monitoring in its respective jurisdiction and coordinates monitoring with the other air pollution control agencies with the MSA.
III. ROLES AND RESPONSffiILITIES
The parties agree to the following terms and conditions:
• NCDAQ and SCDHEC (the "affected agencies") commit to conducting appropriate monitoring in their respective jurisdictions of the MSA; as needed, to collectively meet EPA minimum monitoring requirements for the entire MSA for ozone, as well as other criteria air pollutant monitoring deemed necessary to meet the needs of the MSA as determined reasonable by both affected agencies. The minimum air quality monitoring requirements for the MSA shall apply to the MSA in its entirety and shall not apply to any sole affected agency within the MSA unless agreed upon by all affected agencies.
• The affected agencies commit to coordinating monitoring responsibilities and requirements to achieve an effective network design regarding criteria air pollutant monitoring conducted in the MSA and commit to communicate unexpected or unplanned changes in monitoring activities within their jurisdictions to the other affected agency. As conditions warrant, the affected agencies may conduct telephone conference calls, meetings, or other communications to discuss monitoring activities for the MSA. Each affected party shall inform the other via telephone or email of any monitoring changes occurring in its jurisdiction of the MSA at its earliest convenience after learning of the need for the change or making the changes. Such unforeseen changes may include evictions from monitoring sites, destruction of monitoring sites due to natural disaster, or similar occurrences that result in extend (greater than one quarter) or permanent change in the monitoring network. At least once a year in the second quarter or before June is", each agency shall deliver to the other agency a copy of its proposed monitoring plan for its jurisdiction with the MSA for the next year.
• Each party reserves the right to revoke or terminate this MOA at any time for any reason by giving thirty (30) days written notice prior to the date of termination.
IV. LIMITATIONS
A. All commitments made in this MOA are subject to the availability of funds and each party's budget priorities. Nothing in this MOA, in and of itself, obligates NCDAQ or SCDHEC to expend funds or to enter into any contract, assistance agreement, interagency agreement, or other financial obligation.
B. This MOA is neither a fiscal nor a funds obligation document. Any endeavor involving reimbursement or contribution of funds between parties to this MOA will be handled in accordance

with applicable laws, regulations, and procedures, and will be subject to separate subsidiary agreements what will be effected in writing by representatives of the parties.
C. Except as provided in Section III, this MOA does not create any right or benefit, substantive or procedural, enforceable by law or equity against NCDAQ or SCDHEC, their officers or employees, or any other person. This MOA does not direct or apply to any person outside NCDAQ or SCDHEC.
V. PROPRIETARY INFORMATION AND INTELLUCTUAL PROPERTY
No proprietary information or intellectual property is anticipated to arise out of this MOA.
VI. POINTS OF CONTACT
The following individuals are designated points of contact for the MOA:
NCDENRDAQ: Donnie Redmond NC DENR Division of Air Quality 1641 Mail Service Center Raleigh, NC 27699-1641
donnie. redmond @ncdenr.gov Voice/fax: 919-707-8468
SCDHEC: Scott Reynolds SCDHEC Bureau of Air Quality 2600 Bull Street Columbia, SC 29201
[email protected] Voice: 803-896-0902
VII. MODIFICATIONIDURATIONITERMINATION
This MOA will be effective when signed by all parties. This MOA may be amended at any time by the mutual written consent of all parties. The parties will review this MOA at least once every 10 years to determine whether it should be revised, renewed, or cancelled. This MOA may be revoked or terminated by an affected party at any time and for any reason by giving thirty (30) days written notice prior to the date of termination.
VIII. REFERENCE
United States Environmental Protection Agency, Title 40 Code of Federal Regulations, Part 58, Appendix D, "Network Design Criteria for Ambient Air Quality Monitoring", Section 2 (e), "General Monitoring Requirements"
IX. APPROVALS

, ,
North Carolina Department of Environment and Natural Resources Division of Air Quality (NCDAQ)
BY: ~~QJHC~~ TITLE: \):iD!1@, S?>."·l'i>~ ~ by- ~.~
DATE: ~.:L.0~-I-"~~ _
South Carolina Department of Health and Environmental Control (SCDHEC) Bureau of Air Quality
BY;
DATE: __~~""¥-<~--'-""-- _

UNITED STATES ENVIRONMENTAL PROTECTION AGENCY
REGION 4
ATLANTA FEDERAL CENTER
61 FORSYTH STREET
ATLANTA, GEORGIA 30303-8960
April 1, 2020
Rhonda B. Thompson
Chief
Bureau of Air Quality
South Carolina Department of Health
and Environmental Control
2600 Bull Street
Columbia, South Carolina 29201
Dear Ms. Thompson:
On February 12, 2020, the South Carolina Department of Health and Environmental Control (DHEC)
submitted to the U.S. Environmental Protection Agency a modification to the state of South Carolina’s
2019 Annual Ambient Air Monitoring Network Plan (Network Plan Addendum). The Network Plan
Addendum requests approval for a 40 CFR Part 58, Appendix E monitor siting waiver to be granted for
the JCI Woods lead (Pb) monitoring site (AQS ID: 45-041-8003). The monitoring regulations found in
40 CFR Part 58.10(a)(1) require that the monitoring network plan and modification be made available
for public comment for at least 30 days before submission to the EPA for approval. The Network Plan
Addendum was published in the State Register for public comment from October 25, 2019 to November
25, 2019, during which no comments were received.
The Network Plan Addendum requests a waiver of siting requirements for the JCI Woods Pb monitoring
site. Four trees to the north and east of the site are identified as not meeting the spacing from
obstructions requirement as defined in 40 CFR Part 58, Appendix E, Section 4(a):
“The distance from the obstacle to the probe, inlet, or monitoring path must be at least twice the
height that the obstacle protrudes above the probe, inlet, or monitoring path.”
The width and locations of the trees around the sampler are also such that the monitor siting does not
meet the footnote to Table E-4 of 40 CFR Part 58, Appendix E, Section 11, requiring that the site “must
have unrestricted airflow 270 degrees around the probe or sampler...”
Forty (40) CFR Part 58, Appendix E, Section 10 states that waivers of siting criteria for existing sites
can be granted if either of the following criteria are met:
“10.1.1 – The site can be demonstrated to be as representative of the monitoring area as it would
be if the siting criteria were being met.
10.1.2 – The monitor or probe cannot be reasonably located so as to meet the siting criteria
because of physical constraints”

The EPA believes that this situation meets the waiver requirements of Section 10.1.1. As the location of
the JCI Woods site is located for source-oriented monitoring, and the identified trees do not obscure the
path of highest concentration from the source, the site’s location is still representative of the ambient Pb
concentrations around the JCI facility. The EPA therefore waives the requirements of 40 CFR Part 58,
Appendix E, Section 4(a) and the footnote to Table E-4 in 40 CFR Part 58, Appendix E, Section 11,
regarding the four trees to the north and east of the JCI Woods site. This site must still meet all other
siting requirements found in Appendix E of 40 CFR Part 58. This waiver should be re-evaluated in the
2025 South Carolina network assessment due to the EPA by July 1, 2025.
The waiver of the specific siting requirements discussed above for JCI Woods is effective on the date of
this letter. The DHEC should consult the EPA Region 4 Laboratory Services and Applied Science
Division (LSASD) staff on whether quality assurance flags should be added to the data in the Air
Quality System (AQS) to indicate that there were siting criteria issues at the site prior to and after the
EPA approval of this siting criteria waiver. The data with QA flags for siting criteria issues would still
be comparable to the Lead National Ambient Air Quality Standard.
Thank you for your collaboration with the EPA to monitor air and promote clean air in South Carolina.
If you have any questions about this approval, please contact Adam Friedman at 404-562-9033.
Sincerely,
Kenneth L. Mitchell, Ph.D.
Acting Director
Air and Radiation Division
cc: Renee Shealy, Bureau Chief, BEHS
Connie Turner, Director, DAQA, BEHS
Robert J. Brown Jr., BAQ
Mary Peyton Wall, BAQ
G. Renee Madden, BAQ
Laura Ackerman, Region 4 LSASD


110
Appendix G: Summary of Public Comments Received
Below is a summary of the comments received and the Department’s response. A
copy of the actual comments (emails and mail) received will be submitted to the EPA
Region 4 staff, along with the final 2020-2021 Monitoring Plan.
Comment: EPA Region 4 stated that the MOA’s and Waivers in Appendix D and
Appendix E were not included in the Network Plan that was out for public comment.
Department response: The MOA’s and Waivers were inadvertently left out when the
document was being assembled. All of the MOA’s and Waivers have been on public
comment in the past and will be added to the final document.

111
Appendix H: Ongoing Data Requirements Rule for 2010 1-hour SO2
NAAQS Verification Calendar Year 2019
On June 2, 2010, the U.S. EPA revised the primary NAAQS for sulfur dioxide (SO2) by
establishing a 1-hour standard at a level of 75 parts per billion. In 2017, The
Department of Health and Environmental Control (Department) submitted SO2
designation modeling for certain facilities in Berkeley, Richland and York counties to
demonstrate these counties should be designated as attainment. These facilities
included Santee Cooper Cross Generating Station, Resolute Industries (now New-
Indy Catawba), International Paper – Eastover, and (SCE&G) Wateree Station.
In January 2018 EPA designated each county in South Carolina as
attainment/unclassifiable for the 2010 SO2 standard. Under 40 CFR 51.1205(b), for
areas designated as attaining the standard based on modeling of actual emissions,
the Department is required to submit an annual report that documents the annual
SO2 emissions of these sources, an assessment of any emissions increase from the
prior year, and a recommendation whether further modeling is warranted.
Attached is the Department’s annual report satisfying the ongoing data requirements
for the affected area’s designations. The annual report was provided for a 30-day
public comment period, which began on April 24, 2020 and ended May 26, 2020. No
comments were received.
International Paper - Eastover Mill (IP Eastover) and Wateree Station (Wateree),
Richland County
IP Eastover and Wateree were modeled in the same modeling domain for the 1-hr
SO2 attainment modeling. Wateree has taken permit limits matching its modeled
rates, and this revised permit was provided to the EPA by letter on May 11, 2017. IP
Eastover modeled several units below the permitted emission rates. As shown in
Tables 1-5 below, actual SO2 emissions for all these sources are significantly less than
the modeled rates and no further modeling is warranted.
Table 1
IP Eastover No. 1 Power Boiler and Recovery Boiler (Combined Stack)
2018 SO2
Emissions
2019 SO2
Emissions
Modeled
Emissions
Status
179.0 lbs/hr 173.5 lbs/hr 606.9 lbs/hr No further action
needed

112
Table 2
IP Eastover Recovery Furnace No. 2 and NCG Incinerator (Combined Stack)
2018 SO2
Emissions
2019 SO2
Emissions
Modeled
Emissions
Status
206.6 lbs/hr 216.5 lbs/hr 420.8 lbs/hr No further action
needed
Table 3
IP Eastover No. 2 Power Boiler
2018 SO2
Emissions
2019 SO2
Emissions
Modeled
Emissions
Status
105.9 lbs/hr 72.8 lbs/hr 971.0 lbs/hr No further action
needed
For IP Eastover, the source of sulfur dioxide (SO2) pound per hour (lb/hr) emissions
rates is actual total emissions per source per year over time period (year). An
example calculation is shown below for the combined stack of No. 1 Recovery
Furnace (381A) and No. 1 Power Boiler (501A):
𝐸𝑚𝑖𝑠𝑠𝑖𝑜𝑛 𝑅𝑎𝑡𝑒 (𝑙𝑏
ℎ𝑟) =
𝑇𝑜𝑡𝑎𝑙 𝑆𝑂2 𝑡𝑜𝑛𝑠 𝑒𝑚𝑖𝑡𝑡𝑒𝑑 𝑓𝑟𝑜𝑚 381𝐴 & 501𝐴
𝑇𝑜𝑡𝑎𝑙 𝑡𝑖𝑚𝑒 𝑖𝑛 𝐶𝑎𝑙𝑒𝑛𝑑𝑎𝑟 𝑌𝑒𝑎𝑟, 𝑑𝑎𝑦𝑠×
2000 𝑙𝑏
𝑡𝑜𝑛×
𝑑𝑎𝑦
24 ℎ𝑜𝑢𝑟𝑠
Actual emissions (tons) are provided in the chart below for 2018 and 2019. The
combined stack emissions have been included on the annual reports sent to SC
DHEC. Explanations of changes in emissions/year, per 40 CFR 51.1205 (b), were
documented in the March 4th, 2020, report to SC DHEC. The increase in stack
emissions for the Recovery Furnace No. 9/NCG Incinerator (382A/331A) from 2018 to
2019 was due to burning more No. 5 fuel oil in 382A and more concentrated NCG
burn hours in 331A (primary treatment device) compared to previous years.

113
Table 4
Wateree No. 1
2019 SO2 Emissions Modeled Emissions Status
151.6 lbs/hr 2687.3 lbs/hr
11770.3 TPY, combined stack
No further action
needed
Table 5
Wateree No. 2
2019 SO2 Emissions Modeled Emissions Status
147.3 lbs/hr 2687.3 lbs/hr
11770.34 TPY, combined stack
No further action
needed
The data for Wateree is based on actual emissions per actual hours of operation.
Since each unit’s emissions are measured on one combined stack, the emissions are
apportioned by heat rate. The final result is actual pounds/hour.
WAT1SO2: 657.8 𝑡𝑜𝑛𝑠
4717.00 ℎ𝑟𝑠𝑥
11511800.6 𝑚𝑚𝐵𝑡𝑢
11511800.6 𝑚𝑚𝐵𝑡𝑢 + 9663258.8 𝑚𝑚𝐵𝑡𝑢𝑥 2000 𝑙𝑏𝑠 = 151.6 𝑙𝑏𝑠/ℎ𝑟
WAT2SO2: 657.8 𝑡𝑜𝑛𝑠
4076.29 ℎ𝑟𝑠𝑥
9663258.8 𝑚𝑚𝐵𝑡𝑢
11511800.6 𝑚𝑚𝐵𝑡𝑢 + 9663258.8 𝑚𝑚𝐵𝑡𝑢𝑥 2000 𝑙𝑏𝑠 = 147.3 𝑙𝑏𝑠/ℎ𝑟
The Actual SO2 emissions in tons per year:
Unit 2018 2019
WAT Unit 1 474.9 357.6
WAT Unit 2 541.6 300.2
The reduction in emissions from 2018 to 2019 is due to a reduction of coal
consumption (i.e. less unit operation).
New-Indy Catawba (New-Indy), formerly Resolute, York County
The New-Indy 1-hr SO2 DRR modeling was based on permit allowable SO2 emissions
with the exception that No. 6 fuel oil combustion emissions were based on actual No.
6 fuel oil use at maximum permitted sulfur content. The information used in the
assessment (shown in Table 6) for this facility shows that no further modeling is
warranted.

114
Table 6
New-Indy (Resolute) Facility No. 6 Fuel Oil Use
2018 fuel oil used 2019 fuel oil used Modeled usage: Status
1,677,048 gallons 1,330,372 gallons 4,041,888 gallons No further action
needed
The primary sources of SO2 at New-Indy Catawba LLC (Catawba Mill) are No. 6 fuel
oil combustion for process steam generation and incineration of pulp mill non-
condensable gases (NCG's) in the combination boilers. The SO2 DRR modeling for the
Catawba Mill was performed using the actual hourly No. 6 fuel oil usage during
calendar years 2012 - 2014 year assuming the maximum fuel oil sulfur content (2.1%)
as a conservative assumption. The combustion of pulp mill NCG's was modeled at
the pulp mill design capacity and the permitted SO2 emission rate of 10.1 pounds SO2
per air dried ton pulp (Ib SO2/ ADTP). Other minor sources of SO2 at the Catawba Mill
(biomass and natural gas combustion, etc.) were modeled at the maximum short-
term permitted emission rates.
The 2018 and 2019 actual SO2 emissions are compared to the modeled SO2
emissions in Tables 7 and 8 and are less than one-half the modeled emissions rates
in 2012, 2013, and 2014. As shown in Table 7, the annual SO2 emissions from No. 6
fuel oil are based on the total fuel oil usage and the average fuel oil sulfur content.
The annual SO2 emissions from pulp mill NCG combustion are based on the total
pulp production and the actual NCG emissions factor per ton of production. The
annual emissions for NCG combustion are over-reported in the 2018 EIS. The
permitted pulp production was applied to the source-specific actual SO2 emissions
factor instead of the actual 2018 pulp production. The 2019 EIS emissions from NCG
combustion are similarly over-reported. This oversight will be corrected in future
emissions inventories to avoid over-reporting the total SO2 emissions from the
facility.
The highest actual hourly emissions rate is compared to the highest modeled hourly
emissions rate in Table 8. The highest actual hourly emissions in 2018 and 2019 from
burning No. 6 fuel oil combined with the highest hourly emissions from pulp mill NCG
combustion are less than the highest hourly emissions modeled in 2012, 2013, or
2014. When the 2018 and 2019 actual emissions are paired in time, the highest
hourly emissions are 1,575 pounds per hour in 2018 and 1,234 pounds per hour in
2019. To be conservative, the highest actual hourly emissions from burning No. 6 fuel
oil in 2018 and 2019 were combined with the highest actual hourly emissions from
pulp mill NCG combustion for 2018 and 2019; these results are found in Table 8. In

115
reality, these two functions are related but not solely dependent upon each other.
This means that the highest hourly emissions from burning No. 6 fuel oil and the
highest hourly emission from pulp mill NCG combustion did not occur at the same
time (e.g. during the same hour of the year). When accounting for this, the highest
actual hourly SO2 emissions are 1,575 pounds per hour for 2018 and 1,234 pounds
per hour for 2019. The 2018 and 2019 highest actual hourly emissions are between
41% and 79% of the highest hourly modeled SO2 emissions.
As shown in both Tables 7 and 8 the actual emissions during 2018 and 2019 are well
below the maximum modeled SO2 1-hour emissions rates.
Table 7 – Comparison of Annual SO2 Emissions
Year
No. 6 Fuel Oil Pulp Mill NCG Combustion Sum
Gallons % S tons SO2 ADTP lb
SO2/ADTP
tons
SO2
tons
SO2
2012
Model 1,566,028 2.1 258 666,125 10.1 3,364 3,622
2013
Model 1,230,464 2.1 203 666,125 10.1 3,364 3,567
2014
Model 4,041,888 2.1 666 666,125 10.1 3,364 4,030
2018
Actual 1,677,048 1.69 222 379,371 6.76 1,282 1,505
2019
Actual 1,330,272 1.84 192 385,101 6.76 1,302 1,494
Table 8 – Comparison of Maximum Hourly SO2 Emissions
Year
No. 6 Fuel Oil Pulp Mill NCG Combustion Sum
max
gallons/hr % S
lbs
SO2/hr
max
ADTP/hr
lb
SO2/ADTP
lbs
SO2/hr
lbs
SO2/hr
2012
Model 6,696 2.1 2,208 76.0 10.1 768 2,976
2013
Model 3,746 2.1 1,235 76.0 10.1 768 2,003
2014
Model 6,086 2.1 2,007 76.0 10.1 768 2,775
2018
Actual 5,386 1.69 1,429 67.8 6.76 459 1,888

116
Year
No. 6 Fuel Oil Pulp Mill NCG Combustion Sum
max
gallons/hr % S
lbs
SO2/hr
max
ADTP/hr
lb
SO2/ADTP
lbs
SO2/hr
lbs
SO2/hr
2019
Actual 3,829 1.84 1,106 75.8 6.76 512 1,618
Santee Cooper Cross Generating Station (Cross Station), Berkeley County
Cross Station used actual SO2 emission data using Part 75 hourly emissions data
from years 2012-2014 paired with corresponding 2012-2014 hourly meteorological
data for their modeling demonstration. Emission data from 2019 along with modeled
emission rates are shown in Table 9. Annual average SO2 emissions for Cross Station
for the 2012 – 2014 timeframe were 6760.9 tons. Annual SO2 emissions from Cross
for 2018 and 2019 were significantly less than the average modeled rate at 3560.1
tons (2018) and 3538 tons (2019).
Table 9
Cross Station Coal Units 1-4
Unit Modeled
SO2
emission
rates
(lbs/hr)
2019
Maximum
Hourly SO2
Emission
Rates
(lbs/hr)
Modeled
Average
Hourly
Emission
Rates (lbs/hr)
2019
Average
Hourly SO2
Emission
Rates
(lbs/hr)
2019 Hours
of
Operation
#1 4,236 3,593.2 280 385.2 6,008
#2 2,935 2,973.2 370 434.5 618
#3 8,571 4,021.3 409 296.1 8,064
#4 3,567 7,481.5 483 285.2 7,133
Total 19,309 18,069.2 1,542 1,401 N/A
In the Cross DRR modeling, a refined approach of determining seasonal SO2
background concentrations (in accordance with EPA guidance) was used instead of
using an annual design value concentration for the background concentration. This
discussion is located in section 6.5 of the 2017 DRR Report. The modeled impacts,
including the seasonal background concentrations, were tabulated separately with
the highest ten values listed in Table 7-1 of the Report, with a worst-case design value
of 87.7 µg/m3 (or about 45% of the NAAQS).
Unit 2’s 2019 maximum one-hour emission rate (2,973.2 lb/hr) is slightly above the
modeled maximum emission rate used in the DRR air dispersion modeling (2,935

117
lb/hr). Unit 4’s 2019 maximum one-hour emission rate (7,481.5 lb/hr) is also above
the modeled maximum emission rate used in the air dispersion modeling (3,567
lb/hr). The combined effect of the emissions increases for both Unit 2 and Unit 4 can
be estimated by scaling up the combined increase. The scaled-up concentration for
this combined increase would be 141.0 µg/m3 (87.7 * (2973.2+7481.5)/(2935+3567)).
Although the original modeling result included seasonal background concentrations,
it was discovered after the original DRR modeling was submitted that the data the
seasonal concentrations were based on did not meet EPA completeness criteria.
Thus, in order to ensure the total 1-hour SO2 design value did not underestimate the
background contributions, a separate updated design value based on complete data
for the 2014-2016 period was conservatively added to the modeled result. For this
reporting period, it is appropriate to add the 2017-2019 design value of 39.3 µg/m3
for the Jenkins Avenue station (same station as used in the original DRR modeling) to
the scaled-up concentration. Thus, the scaled-up concentration plus background is
141.0 + 39.3 = 180.3 µg/m3, or 92% of the 1-hour SO2 NAAQS. This calculation is
conservative in that the seasonal background concentrations are also included in the
ratio calculation and then a conservative design value concentration is added to the
scaled-up result, essentially double-counting the background concentrations. In
addition, this calculation also ignores the significant decreases in the maximum one-
hour emissions for Units 1 and 3.
Unit 1’s 2019 annual average emission rate (385.2 lb/hr) was higher than the unit’s
modeled annual average emission rate (280 lb/hr). Unit 2’s 2019 annual average
emission rate (434.5 lb/hr) was also higher than the unit’s modeled annual average
emission rate (370 lb/hr). However, the sum of the average emissions for all units for
2019 (1401 tons) is less than the sum of the modeled average emissions (1542 tons)
in the DRR modeling.
Thus, this analysis of the DRR modeling results and modeled emissions compared to
the current SO2 emissions data indicates the conclusions drawn from the original
modeling analysis are still valid and updated modeling for the 1-Hour SO2 NAAQS is
not needed.