Embed Size (px)
Citation preview

State of Oklahoma Incentive Evaluation Commission Clean-Burning Fuel Vehicle Credit September 29, 2017
PFM Group Consulting LLC BNY Mellon Center 1735 Market Street 43rd Floor Philadelphia, PA 19103

Clean-Burning Fuel Vehicle Credit 2
Contents Executive Summary ............................................................................................................................................ 3
Key Findings and Recommendations ................................................................................................................. 6
Introduction ........................................................................................................................................................ 10
Industry Background ......................................................................................................................................... 12
Incentive Usage and Administration .................................................................................................................. 17
Economic and Fiscal Impact ............................................................................................................................. 23
Incentive Benchmarking .................................................................................................................................... 27
Appendices ........................................................................................................................................................ 31

Clean-Burning Fuel Vehicle Credit 3
Executive Summary

Clean-Burning Fuel Vehicle Credit 4
The purpose of the Clean Burning Fuel Vehicle Credit is to increase the number of clean burning fuel vehicles in use in Oklahoma and encourage development of clean burning fuel vehicle infrastructure. Overall Recommendation: Based on its analysis of available data, the project team recommends retaining and reconfiguring the Clean Burning Fuel Vehicle Credit. Key Findings
Total credits claimed peaked in 2013 but declined in the most recent two tax years. The Oklahoma Tax Commission (OTC) does not track the number of qualified credits at a detailed level; however, in 2014, it began to separate vehicle claims from all other claims.1 Data suggest increasing investment in infrastructure.
The number of compressed natural gas (CNG) and electric fueling stations has increased significantly in recent years. It is difficult to track the total number of alternative fuel vehicles owned at any given time, so the project team has used alternative fueling stations as a proxy. The number of CNG and electric fueling stations has increased significantly in recent years. The compound annual growth rate (CAGR) of total CNG stations was 8.9 percent between 1996 and 2010; between 2010 and 2017, that rate was 15.1 percent.
Oklahoma has an above average share of CNG stations. Using fueling stations as a proxy,
Oklahoma accounted for 6.8 percent of total CNG stations in the U.S. in 1996. While that share fluctuated over time, as of 2017, the State has 7.3 percent of all CNG fueling stations. Given that the state has just 1.2 percent of the total U.S. population,2 this percentage suggests a higher than average share of stations.
There is insufficient data to accurately estimate or verify the total economic or tax revenue
impacts of the clean-burning fuel vehicle credit. An attempt to estimate the economic impact would require significant assumptions regarding “but for” these programs residents would not have purchased another type of vehicle. In addition, there is limited data to support that these vehicles are manufactured or modified in Oklahoma.
Oklahoma’s program is comparable to other states and was not found to be an outlier in any
aspects. Interestingly, the federal government offers a similar credit but has structured it to phase out over time as sales increase and the desired result is achieved (which is consistent with the ‘best practices’ approach to incentives targeted at building an industry ‘critical mass’ and, once achieved, phasing the incentive out).
Adequate protections are not in place. One of the statutory requirements is that each evaluation
should determine “whether adequate protections are in place to ensure the fiscal impact of the incentive does not increase substantially beyond the State’s expectations in future years.” As currently constructed, the program has no cap and no other thresholds that would limit the potential cost to the State. Given the increasing public interest in alternate fuel vehicles, it can be expected that the program demands will increase in coming years.
1 As noted in the prior section, the all other claims category includes including vehicles which were purchased with qualified property installed by the manufacturer for which the taxpayer is unable or elects not to determine the cost. 2 Per ACS 2016 Annual Estimate of Resident Population.
Clean-Burning Fuel Vehicle Credit 5
Data collection and reporting issues exist, but improvements are being made. Currently, it is difficult (if not impossible) to analyze the number of and change in qualified vehicles as a result of the credit, in alignment with the approved evaluation criteria. However, improvements are being made.
Recommended Program Changes
Recommendation 1: Retain the infrastructure credit; sunset the vehicle credit. The feasibility of purchasing an alternative fuel vehicle is largely dependent upon the ability to refuel the vehicle, assuming the taxpayer does not have access to a private fueling source. Recent data suggest an increasing interest in the infrastructure portion on the credit, and prior administrative changes to the program are indicative of the prioritization of infrastructure investment over vehicles.
Recommendation 2: Structure the program to phase out. The State should consider structuring its program in a similar manner the federal government’s Qualified Plug-In Electric Drive Motor Vehicle Tax Credit Program, which will phase out as electric vehicle sales increase.
Recommendation 3: Improve reporting on the credit. For infrastructure claims, the State should require the taxpayer to disclose on the application form whether the claim is for property related to the delivery of natural gas into a fuel tank for commercial purposes or public access recharging systems for electric vehicles (currently the two are reported in a single line and not distinguished). The State should produce annually a report that provides a detailed accounting of the number and total payment of qualified credits claimed for each of the following categories:
- Vehicle purchases; - Vehicle modifications; - Property related to the delivery of natural gas into a fuel tank for commercial purposes; - Public access recharging systems for electric vehicles; - Property related to the compression of natural gas for private residences or noncommercial
purposes.
Clean-Burning Fuel Vehicle Credit 6
Key Findings and Recommendations
Clean-Burning Fuel Vehicle Credit 7
Overall Recommendation: Based on its analysis of available data, the project team recommends retaining and reconfiguring the Clean Burning Fuel Vehicle Credit. Key Findings Regarding the program’s successes in meeting the Incentive Evaluation Commission’s approved criteria:
Total credits claimed peaked in 2013 but declined in the most recent two tax years. The Oklahoma Tax Commission (OTC) does not track the number of qualified credits at a detailed level; however, in 2014, it began to separate vehicle claims from all other claims.3 The total number of claims peaked in 2013 at more than 1,600 but declined in the most recent two tax years.
The number of compressed natural gas (CNG) and electric fueling stations has increased significantly in recent years. It is difficult to track the total number of alternative fuel vehicles owned at any given time. This is largely because many of these vehicles are original gasoline/diesel fueled vehicles that have been converted to run on alternative fuels – and this conversion is not recorded in any database. Additionally, the State does not track fuel type or other detailed data in its administration of this tax incentive.
The feasibility of purchasing an alternative fuel vehicle is largely dependent upon the ability to refuel the vehicle, assuming the taxpayer does not have access to a private fueling source. For this reason, in lieu of data regarding the number of vehicles in Oklahoma, it is logical to analyze the number of alternative fueling stations in the State. The number of CNG and electric fueling stations has increased significantly in recent years. The compound annual growth rate (CAGR) of total CNG stations was 8.9 percent between 1996 and 2010; between 2010 and 2017, that rate was 15.1 percent.
Oklahoma has a higher than average share of CNG stations. While detailed data regarding the
number of alternative fuel and electric vehicles in not available, it can be useful to examine the number of alternative fueling stations in existence, as it is a reasonable proxy for the usage of clean burning fuel and electric vehicles. Oklahoma accounted for 6.8 percent of total CNG stations in the U.S. in 1996. While that share fluctuated over time, as of 2017, the State has 7.3 percent of all CNG fueling stations. Given that the state has just 1.2 percent of the total U.S. population,4 this percentage suggests a higher than average share of stations. Regarding annual growth, the incidence of new stations in Oklahoma is closely aligned with nationwide trends, both between 1996-2010 and 2010-2017.
Other Findings
There is insufficient data to accurately estimate or verify the total economic or tax revenue impacts of the clean-burning fuel vehicle credit. Any attempt to estimate the economic impact would require significant assumptions regarding “but for” these programs residents would not have purchased another type of vehicle. In addition, there is limited data to support that these vehicles are manufactured or modified in Oklahoma.
3 The all other claims category includes including vehicles which were purchased with qualified property installed by the manufacturer for which the taxpayer is unable or elects not to determine the cost. 4 Per ACS 2016 Annual Estimate of Resident Population.
Clean-Burning Fuel Vehicle Credit 8
In terms of retail activity, consumers are most likely purchasing the clean burning fuel at a filling station - but substituting gasoline for compressed natural gas. Both of these purchases generate retail sector sales. In the short-term, it is reasonable to assume that retail outlets adding clean burning fuel options have generated some construction sectors jobs. There are also positive environmental benefits associated with usage of clean burning vehicles. While some studies and models put a dollar figure on the environmental and health benefits associated with cleaner burning vehicles, that analysis was not performed as part of this effort.
Oklahoma’s program is comparable to other states and was not found to be an outlier in any
aspects. Interestingly, the federal government offers a similar credit but has structured it to phase out over time as sales increase and the desired result is achieved. This is consistent with a ‘best practices’ approach to incentives targeted at building an industry ‘critical mass’ and, once achieved, phasing the incentive out.
Adequate protections are not in place. One of the statutory requirements is that each evaluation
should determine “whether adequate protections are in place to ensure the fiscal impact of the incentive does not increase substantially beyond the State’s expectations in future years.” As currently constructed, the program has no cap and no other thresholds that would limit the potential cost to the State.
Data collection and reporting issues exist but improvements are being made. Currently, it is difficult (if not impossible) to analyze the number of and change in qualified vehicles as a result of the credit, in alignment with the approved evaluation criteria. However, improvements are being made. In 2014, the OTC began including refundable credits in reported totals, and began reporting on credits carried over and credits established in the current year to generate a total amount claimed, and total amount used. The OTC also began separating purchase and modification of vehicle claims from all other claims. While the project team feels these changes are an improvement to the reporting process, it makes analyzing activity pre- and post-2014 challenging.
Recommendations The purpose of the Clean Burning Fuel Vehicle Credit is to increase the number of clean burning fuel vehicles in use in Oklahoma and encourage development of clean burning fuel vehicle infrastructure. It should be noted that as of the date of this report, the Oklahoma Supreme Court is hearing arguments challenging the legality of an Oklahoma bill approved in May 2017 that levies a $100 fee on electric vehicles and $30 fee on hybrid cars. Pending the results of this litigation, the new fee may impact consumer purchasing and infrastructure investment trends. With that in mind, the project team provides the following recommendations to improve the program.
Recommendation 1: Retain the infrastructure credit; sunset the vehicle credit. The feasibility of purchasing an alternative fuel vehicle is largely dependent upon the ability to refuel the vehicle, assuming the taxpayer does not have access to a private fueling source. Recent data suggests an increasing interest in the infrastructure portion on the credit. Prior to 2014, vehicle claims were not tracked separately from infrastructure claims. In 2014, 46 percent of credits

Clean-Burning Fuel Vehicle Credit 9
established and 32 percent of those claimed were related to infrastructure; by 2015, those shares were 92 percent and 88 percent, respectively. Additionally, prior administrative changes suggest the prioritization of infrastructure investment over vehicles. Prior to July 1, 2010, the State offered a credit for investment in qualified electric motor vehicle property. The current clean burning fuel incentive continues to offer credits for metered-for-fee, public access recharging systems for motor vehicles propelled by electricity.
Recommendation 2: Structure the program to phase out. The federal government’s Qualified Plug-
In Electric Drive Motor Vehicle Tax Credit Program is structured to phase out as electric vehicle sales increase. The credit begins to phase out for each manufacturer in the second quarter following the calendar quarter in which a minimum of 200,000 qualified plug-in electric drive vehicles have been sold by that manufacturer in the U.S.5 The State should consider structuring its own program in a similar manner, whereby it would continue to offer credits for infrastructure until the market reaches a certain saturation point.
Recommendation 3: Improve reporting on the credit. Currently, the State reports claims in two high-level categories: credits related to vehicles (the aggregate total of purchases and modifications) and all other claims. This level of reporting makes it difficult to analyze the number of and change in qualified vehicles as a result of the credit, in alignment with the approved evaluation criteria.
The project team recommends that the application process be revised to disclose on the application form (Form 567-A, Credit for Investment in Clean-Burning Motor Vehicle Fuel Property) the type of alternative fuel being used in the vehicle and whether the claim is for a purchase or modification. For infrastructure claims, the State should require the taxpayer to disclose on the application form whether the claim is for property related to the delivery of natural gas into a fuel tank for commercial purposes or public access recharging systems for electric vehicles (currently the two are reported in a single line and not distinguished). The State should produce annually a report that provides a detailed accounting of the number and total payment of qualified credits claimed for each of the following categories:
- Vehicle purchases; - Vehicle modifications; - Property related to the delivery of natural gas into a fuel tank for commercial purposes; - Public access recharging systems for electric vehicles; - Property related to the compression of natural gas for private residences or noncommercial
purposes.
5 Alternative Fuels Data Center. Available at https://www.afdc.energy.gov/laws/409.

Clean-Burning Fuel Vehicle Credit 10
Introduction
Clean-Burning Fuel Vehicle Credit 11
Overview In 2015, HB2182 established the Oklahoma Incentive Evaluation Commission (the Commission). It requires the Commission to conduct evaluations of all qualified state incentives over a four-year timeframe. The law also provides that criteria specific to each incentive be used for the evaluation. The first set of 11 evaluations was conducted in 2016. The Clean-Burning Fuel Vehicle Credit is one of 12 incentives scheduled for review by the Commission in 2017. Based on this evaluation and their collective judgement, the Commission will make recommendations to the Governor and the State Legislature related to this incentive Incentive Background The State offers a one-time tax credit for investment in clean burning fuel vehicles and infrastructure used in the delivery or compression of clean burning fuel or electricity to such vehicles. The incentive is multifaceted and applies to the following investments:
Vehicles: 45 percent of the cost of either modifications to vehicles originally propelled by gasoline or diesel to enable them to be propelled by CNG, liquefied natural gas or liquefied petroleum gas; or the purchase of a vehicle originally equipped to be propelled by clean burning fuel. If no credit is claimed by the prior owner of originally equipped vehicle, the new owner is entitled to the lesser of 10 percent or $1,500.
Delivery Property: 75 percent of the cost of either property directly related to the delivery of clean burning fuel for commercial purposes or for a fee or charge; or a metered-for-fee public access recharging system for electric vehicles.
Compression Property: The lesser of 50 percent or $2,500 per location for property directly related to
the compression and delivery of natural gas from a private home or residence for noncommercial purposes into a motor vehicle propelled by CNG.
Criteria for Evaluation A key factor in evaluating the effectiveness of incentive programs is to determine whether they are meeting the stated goals as established in state statute or legislation. In the case of this credit, the specific goals were not included in the legislation that established it. To assist in a determination of program effectiveness, the Incentive Evaluation Commission has adopted the following criteria:
Number of qualified credits by the categories identified; Change in number of qualified vehicles versus prior to credit; Change in clean burning fuel vehicles in Oklahoma versus other states.
The criteria focus on specific objectives related to this program (change in number of qualified vehicles, change relative to other states). Ultimately, incentive programs have to weigh both the benefits (outcomes related to achieving policy goals and objectives) and the costs, and that is also a criterion for evaluation (State return on investment). These will be discussed throughout the balance of the evaluation.

Clean-Burning Fuel Vehicle Credit 12
Industry Background

Clean-Burning Fuel Vehicle Credit 13
History of Clean Burning Fuel in the U.S. In 1973, Arab members of the Organization of Petroleum Exporting Countries (OPEC) imposed an oil embargo on the U.S. This created a significant strain on a U.S. economy that had grown increasingly dependent on foreign oil. As the price of oil doubled – and eventually quadrupled - it dramatically increased prices for a variety of products, including gasoline. As a result, the resulting crisis necessitated a more comprehensive approach to federal energy policy. Over the next 25 years, Congress and Presidents took numerous actions intended to reduce the impact of foreign oil on the U.S. economy. The Energy Policy Conservation Act of 1975 added Title V, Improving Automotive Efficiency, to the Motor Vehicle Information and Cost Savings Act, which established Corporate Average Fuel Economy (CAFE) standards for passenger cars and light trucks. The near-term goal was to double new car fuel economy by 1985 to 27.5 miles per gallon.6 In 2008, the National Biofuel Action Plan (NBAP) was established in response to President Bush’s “Twenty in Ten” goal, which called for reducing U.S. gasoline consumption by 20 percent over 10 years by investing in renewable and alternative fuel sources, increasing vehicle efficiency and developing alternative fuel vehicles. In 2009, President Obama issued a presidential directive to the USDA to aggressively accelerate the investment in and production of biofuels; with the directive came $786.5 million in funding and the establishment of the Biofuels Interagency Working Group, which worked to develop policies to increase flexible fuel vehicle production and assist in retail marketing efforts. The Rise of Clean Burning Fuel Vehicles At present, more than a dozen alternative fuels are in production or under development for use in alternative fuel vehicles and advanced technology vehicles. Government and private-sector vehicle fleets are the primary users of these fuels and vehicles, but consumers are increasingly using them. Table 1 displays the estimated number of on-road alternative fueled and hybrid vehicles produced in 2016.
Table 1: Estimated Number of On-Road Alternative Fueled and Hybrid Vehicles Produced, 2016 Fuel Type Total % of Total
Ethanol (E85) 1,272,091 71.7% Gasoline-Electric Hybrid 327,641 18.5% Electricity 162,951 9.2% Compressed Natural Gas 7,840 0.4% Liquefied Petroleum Gas (LPG) 1,932 0.1% Diesel-Electric Hybrid 1,583 0.1% Hydrogen 29 0.0% Liquefied Natural Gas (LNG) 10 0.0%
Total 1,774,077 100.0% Source: U.S. Energy Information Administration
As gasoline prices increase, alternative fuels appeal more to vehicle fleet managers and consumers. Like gasoline, alternative fuel prices can fluctuate based on location, time of year and political climate. As shown in Figure 1, of the fuels included under the State’s incentive program, CNG and electricity (for hydrogen fuel cell powered vehicles) generally provide a cost-effective and predictably-priced alternative to traditional gasoline and diesel, while liquefied petroleum is typically more expensive per gasoline gallon equivalent and tends to
6 U.S. Departments of Transportation and Energy and U.S. Environmental Protection Agency – Report to Congress: Effects of Alternative Motor Fuels Act, CAFE Incentives Policy (March 2002).

Clean-Burning Fuel Vehicle Credit 14
fluctuate in a way similar to gasoline and diesel. It should be noted that fuel efficiency is not factored into this calculation, as this is the cost of fuel alone.
Figure 1: U.S. Average Retail Fuel Prices, April 2000-April 20177
Source: Alternative Fuels Data Center Clean Cities Alternative Fuel Price Reports Of course, the feasibility of purchasing an alternative fuel vehicle is largely dependent upon the ability to refuel the vehicle, assuming the purchaser does not have access to a private fueling source. Table 2 displays the number of fueling stations, in the U.S. and Oklahoma, available for each type of alternative fuel currently included under the State’s incentive program.
Table 2: Alternative Fueling Stations
Alternative Fuel Type Fueling Stations in
U.S. Fueling Stations in
OK Liquefied Petroleum 388 8 Compressed Natural Gas 1,695 123 Liquefied Natural Gas 131 1 Electric Stations 18,833 53 Charging Outlets 50,357 115
Source: Alternative Fuel Data Center; data as of 9/7/2017 Nationwide, tax credits (including federal credits) have been developed to encourage the purchase of and conversion to clean burning fuel vehicles. The U.S. Energy Policy Act of 2005 established a federal income tax credit of up to $3,400 for the purchase of new hybrid vehicles purchased or placed into service between January 1, 2006 and December 31, 2010. National Outlook According to the Fuels Institute, natural gas, propane, electric vehicles and fuel cell vehicles are projected to grow exponentially between now and 2023. Due to starting from a very modest market position, they will make up just 1.0 to 1.4 percent of the light duty vehicle pool in 2023. The number of medium and heavy duty (M/HD)
7 LNG was first tracked in July 2016 but data is not available per GGE.
$0.00$0.50$1.00$1.50$2.00$2.50$3.00$3.50$4.00$4.50$5.00
Cos
t per
GG
E
Liquefied Petroleum Gasoline Diesel CNG Electricity

Clean-Burning Fuel Vehicle Credit 15
vehicles powered by CNG is forecast to increase from 0.3 percent to between 1.7 and 3.8 percent. Liquefied natural gas and liquefied petroleum will also gain M/HD market share, but both will remain below 1.0 percent.8 Clean-Burning Fuel and Electric Vehicles in Oklahoma9 It is difficult to track the total number of alternative fuel vehicles owned in Oklahoma at any given time. Many of these vehicles are original gasoline/diesel fueled vehicles that have been converted to run on alternative fuels – and this conversion is not recorded in any official database. Additionally, the State does not track fuel type or other detailed data in its administration of this incentive, making it difficult to derive a total count. The feasibility of purchasing an alternative fuel vehicle is largely dependent upon the ability to refuel the vehicle, assuming the taxpayer does not have access to a private fueling source. For this reason, in lieu of data regarding the number of vehicles in Oklahoma, it is logical to analyze the number of alternative fueling stations in the State. As displayed in the following figure, the number of CNG and electric fueling stations has increased significantly in recent years. The compound annual growth rate (CAGR) of total CNG stations was 8.9 percent between 1996 and 2010; between 2010 and 2017, that rate was 15.1 percent.
Figure 2: Oklahoma Alternative Fueling Stations, 1996-2017
Source: Alternative Fuels Data Center (as of Sept 7, 2017) Note: excludes seven electric fueling stations for which the open date is unknown.
Clean-Burning Fuel and Electric Vehicles versus Other States As shown in the following table, Oklahoma accounted for 6.8 percent of total CNG stations in the U.S. in 1996. While that share fluctuated over time, as of 2017, the State has 7.3 percent of all CNG fueling stations. Given
8 Fuels Institute – Tomorrow’s Vehicles: What Will We Drive in 2023? 9 Electric vehicles are included in this section due to the inclusion in this incentive of metered-for-fee, public access recharging systems for electric cars.
0
20
40
60
80
100
120
140
CNG ELEC
Clean-Burning Fuel Vehicle Credit 16
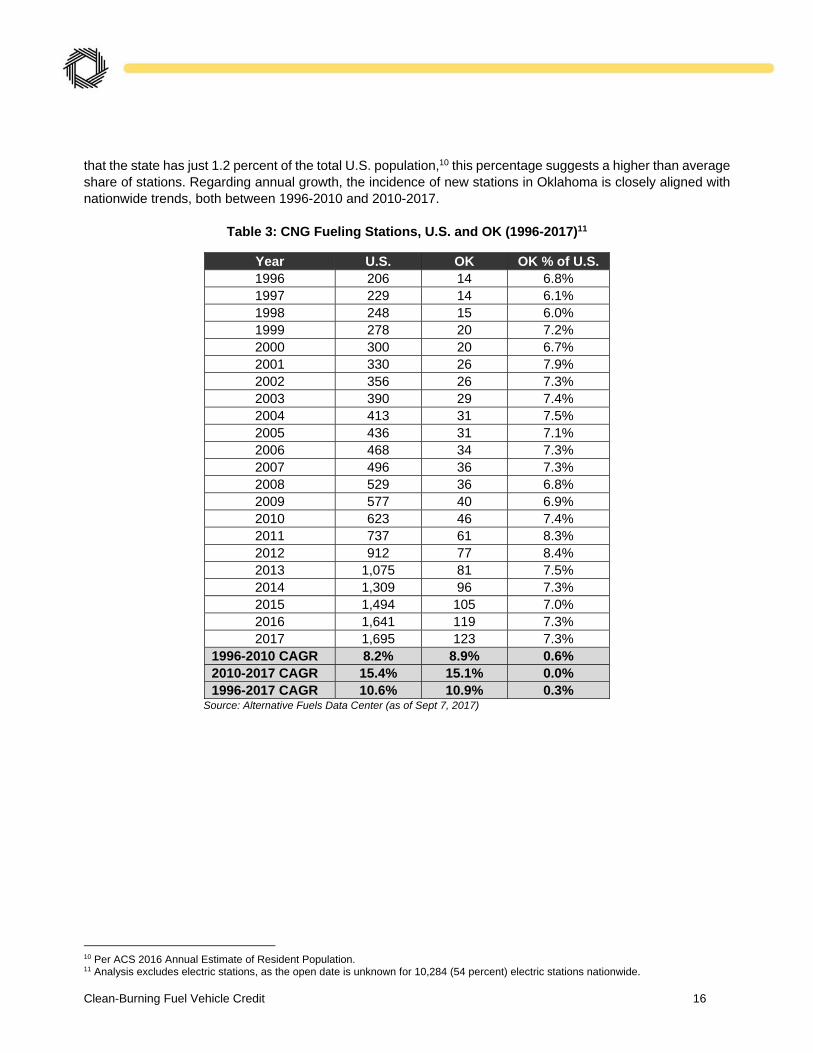
that the state has just 1.2 percent of the total U.S. population,10 this percentage suggests a higher than average share of stations. Regarding annual growth, the incidence of new stations in Oklahoma is closely aligned with nationwide trends, both between 1996-2010 and 2010-2017.
Table 3: CNG Fueling Stations, U.S. and OK (1996-2017)11
Year U.S. OK OK % of U.S. 1996 206 14 6.8% 1997 229 14 6.1% 1998 248 15 6.0% 1999 278 20 7.2% 2000 300 20 6.7% 2001 330 26 7.9% 2002 356 26 7.3% 2003 390 29 7.4% 2004 413 31 7.5% 2005 436 31 7.1% 2006 468 34 7.3% 2007 496 36 7.3% 2008 529 36 6.8% 2009 577 40 6.9% 2010 623 46 7.4% 2011 737 61 8.3% 2012 912 77 8.4% 2013 1,075 81 7.5% 2014 1,309 96 7.3% 2015 1,494 105 7.0% 2016 1,641 119 7.3% 2017 1,695 123 7.3%
1996-2010 CAGR 8.2% 8.9% 0.6% 2010-2017 CAGR 15.4% 15.1% 0.0% 1996-2017 CAGR 10.6% 10.9% 0.3%
Source: Alternative Fuels Data Center (as of Sept 7, 2017)
10 Per ACS 2016 Annual Estimate of Resident Population. 11 Analysis excludes electric stations, as the open date is unknown for 10,284 (54 percent) electric stations nationwide.

Clean-Burning Fuel Vehicle Credit 17
Incentive Usage and Administration

Clean-Burning Fuel Vehicle Credit 18
Incentive Characteristics The State offers a one-time tax credit for investment in clean burning fuel vehicles and electric vehicles and property used in the delivery of clean burning fuel to such vehicles. Applicable purchases are broad, and the incentive is multifaceted, which applies to:
Vehicles: 45 percent of the cost of either modifications to vehicles originally propelled by gasoline or diesel to enable them to be propelled by compressed natural gas (CNG), liquefied natural gas or liquefied petroleum gas; or the purchase of a vehicle originally equipped to be propelled by clean burning fuel. If no credit is claimed by the prior owner of originally equipped vehicle, the new owner is entitled to the lesser of 10 percent or $1,500.
Delivery Property: 75 percent of the cost of either property directly related to the delivery of clean burning fuel for commercial purposes or for a fee or charge; or a metered-for-fee public access recharging system for electric vehicles.
Compression Property: The lesser of 50 percent or $2,500 per location for property directly related to
the compression and delivery of natural gas from a private home or residence for noncommercial purposes into a motor vehicle propelled by CNG.
The following alternative fuels (in addition to electricity) are acceptable under the State’s incentive program:12
Hydrogen Fuel Cell: Fuel cell electric vehicles (FCEVs) are more efficient than conventional internal combustion engine vehicles and produce no tailpipe exhaust – instead, they emit water vapor and warm air. Similar to conventional vehicles, they can fuel in less than 10 minutes and have a driving range of around 300 miles. Note: hydrogen fuel cell property was only eligible for credits in the 2010 tax year.
Compressed Natural Gas and Liquefied Natural Gas: Natural gas powers more than 150,000
vehicles in the United States. Natural gas vehicles (NGVs) are good choices for high-mileage, centrally fueled fleets. Compressed natural gas (CNG) can provide adequate range for required vehicle application. For vehicles needing to travel long distances, liquefied natural gas (LNG) is a good choice. The advantages of natural gas as a transportation fuel include its domestic availability, widespread distribution infrastructure, and reduced greenhouse gas emissions compared to conventional gasoline and diesel fuels. The driving range of NGVs is generally less than that of comparable conventional vehicles because of the lower energy density of natural gas.
Liquefied Petroleum: Also known as propane, liquefied petroleum is a cleaner-burning alternative fuel
that has been used for decades to power light, medium, and heavy-duty propane vehicles. In addition to its clean-burning qualities, benefits include its domestic availability, high-energy density and relatively low cost. It is the world’s third most common transportation fuel.
Any credit allowed but not used may be carried forward for a period of five years; the credit has been available since 1990 and is to sunset on January 1, 2020.
12 All descriptions come from the U.S. Department of Energy’s Alternative Fuels Data Center.

Clean-Burning Fuel Vehicle Credit 19
Historic Use of Clean Burning Fuel Credits As shown in the following figure, aggregate claims used to reduce tax liability have grown significantly in recent years, increasing at a CAGR of 50 percent between 2008 and 2015. The average claim per return has also increasing during this time frame (with a CAGR of 39 percent), peaking in 2015 at nearly $20,000 per return.13
Figure 3: Clean Burning Fuel Claims, 2008-2015
Source: OTC Form 511CR data, 2008-2015
The OTC does not track the number of qualified credits at a detailed level; however, in 2014, it began to separate vehicle claims from all other claims.14 As shown in the following figure, the total number of claims peaked in 2013 at more than 1,600 but declined in the most recent two tax years.
Figure 4: Clean Burning Fuel Credit Claims, 2008-2015
Source: OTC Form 511CR data
13 It should be noted that a single return can contain multiple vehicles. 14 As noted in the prior section, the all other claims category includes including vehicles which were purchased with qualified property installed by the manufacturer for which the taxpayer is unable or elects not to determine the cost.
$0
$5,000
$10,000
$15,000
$20,000
$25,000
$0
$2
$4
$6
$8
$10
$12
$14
$16
$18
$20
2008 2009 2010 2011 2012 2013 2014 2015
Mill
ions
Total Claims Reducing Tax Liability Average Claim/ Return
$0
$5
$10
$15
$20
2008 2009 2010 2011 2012 2013 2014 2015
Mill
ions
Vehicle Claims Infrastructure Claims All Claims

Clean-Burning Fuel Vehicle Credit 20
According to Oklahoma Revised Statute, if the tax credit allowed exceeds the amount of income taxes due or if there are no state income taxes due on the income of the taxpayer, the amount of the credit not used as an offset against the income taxes of a taxable year may be carried forward as a credit against subsequent income tax liability for a period not to exceed five years. As illustrated in the following table, approximately two-thirds of the available credits in 2014 were used to reduce current year tax liability; in 2015, just over 40 percent of available credits reduced current tax liability. The amount used to offset tax liability (i.e. the tax expenditures incurred by the State) as a percent of total available credits typically ranges from 40 to 70 percent and averaged 54 percent between 2008 and 2015.
Table 4: Clean Burning Fuel Credits and Claims, 2008-2015
Year Number of
Returns
Total Credits
Earned15
Total Claims Used16
Average Claim/ Return
Claims as % of
Credits Earned
2008 395 $1,371,847 $778,729 $1,971 56.8% 2009 198 $648,882 $435,050 $2,197 67.0% 2010 207 $5,674,122 $2,621,173 $12,663 46.2% 2011 419 $5,717,764 $3,245,106 $7,745 56.8% 2012 872 $21,986,243 $10,674,376 $12,241 48.6% 2013 1637 $18,533,894 $9,749,056 $5,955 52.6% 2014 1196 $29,125,776 $18,405,031 $15,389 63.2% 2015 677 $31,840,403 $13,464,676 $19,889 42.3%
Source: OTC data
Oklahoma Special Fuel Decal and CNG Tax Revenues Oklahoma levies an annual Alternative Fuel Flat Fee in Lieu of Motor Fuel Taxes in exchange for a special fuel decal. Prior to January 1, 2012, the structure of the fee was as follows:
$50 per year in lieu of use tax on LPG used to propel automobiles, vans and pickup trucks not exceeding 1 ton capacity;
$100 for the same using CNG or LNG; $150 for those exceeding 1 ton capacity.
Since January 1, 2012, however, the $100 flat fee on CNG was replaced by a tax of $0.05 per gasoline gallon equivalent (GGE) of CNG. Upon expiration of the tax credit, the CNG tax will become equal to the tax rate imposed on diesel fuel (currently $0.13 per gallon). As shown in the following table, special fuel fees and CNG taxes (minor revenue sources) declined by half between 1999 and 2012. Since the introduction of the CNG tax, however, revenues have increased, totaling $0.8 million in 2016 (a slight decline from 2015 totals).
15 Prior to 2014, “Total Credits Earned” was the amount of the credit (including any carryover credit) claimed on a tax return eligible to be used to offset any tax liability. 16 Based upon a taxpayer’s final liability as calculated, the “Total Claims Used” is the amount used to offset any tax liability.

Clean-Burning Fuel Vehicle Credit 21
Figure 5: Special Fuel Decal and CNG Tax Revenues, 1999-2016
Source: OTC Annual Reports, 1999-2016
Incentive Administration There are three components to overall program administration:
1. Determining eligibility. No qualified establishments or its contractors or subcontractors that has received or is receiving an incentive payment in accordance in the Quality Jobs Program Act and/or Small Employer Quality Jobs Incentive Act are eligible to receive this credit in connection with the activity and establishment for which incentive payments have been, or are being, received.17
2. Determining the credit. Eligible taxpayers apply for the credit by submitting Form 567-A, Credit for Investment in Clean-Burning Motor Fuel Vehicle Property. The totals generated in this form are then carried over to Form 511CR, Other Credits. In addition to the forms, taxpayers must also submit the associated invoice(s) and purchasing agreement(s). Applications for the credit are processed alongside their associated income tax returns; the credit forms are not reviewed unless the income tax return is flagged. In these instances, the Tax Policy division reviews the returns and associated applications for accuracy.
3. Reporting. Estimates from Form 511CR are reported in Open Books and in the State’s Tax
Expenditures report, which is produced every two years (most recently 2015-2016 for Tax Year 2014). Estimates are calculated using the OTC’s microsimulation model. The model is SAS-based and determines rate change and other changes on IIT.
Annual Transfer Effective 2014, the OTC transfers five percent of the cost of qualified clean burning motor vehicles to the Compressed Natural Gas Conversion Safety and Regulation Fund.
17 See Oklahoma Administrative Code 710:50-15-81(b).
$0.4 $0.4 $0.4$0.3 $0.3 $0.3 $0.2 $0.2 $0.2 $0.2 $0.2 $0.2
$0.3
$0.2
$0.4
$0.6
$0.9$0.8
$0.0
$0.1
$0.2
$0.3
$0.4
$0.5
$0.6
$0.7
$0.8
$0.9
$1.0
1999 2000 2001 2002 2003 2004 2005 2006 2007 2008 2009 2010 2011 2012 2013 2014 2015 2016
Mill
ions
Special Fuel Decals CNG Tax

Clean-Burning Fuel Vehicle Credit 22
Reporting Issues Currently, the State reports claims in two high-level categories: credits related to vehicles (the aggregate total of purchases and modifications) and all other claims. This makes it difficult (if not impossible) to analyze the number of and change in qualified vehicles as a result of the credit, in alignment with the approved evaluation criteria. For instance, in 2015, 677 claims were submitted. A total of 407 (60 percent) were for vehicle claims, while 270 (40 percent) were for all other claims – but it is unclear how many of the 407 vehicle claims were for original purchases versus modifications, and unclear how many of the 270 other claims were for commercial purposes, electric vehicle recharging stations, or residential/noncommercial purposes. Additionally, the 511CR data reporting changed between tax years 2013 and 2014. In 2013, the OTC reported on the number of returns and total amounts claimed and used for each incentive. Effective in 2014, the OTC began including refundable credits in the totals, and began reporting on credits carried over and credits established in the current year to generate a total amount claimed, and total amount used. The OTC also began separating purchase and modification of vehicle claims from all other claims (including vehicles which were purchased with qualified property installed by the manufacturer for which the taxpayer is unable or elects not to determine the cost). While the project team feels these changes are an improvement to the reporting process, it makes analyzing activity pre- and post-2014 challenging.
Clean-Burning Fuel Vehicle Credit 23
Economic and Fiscal Impact
Clean-Burning Fuel Vehicle Credit 24
Economic Impact Methodology Economists use a number of statistics to describe regional economic activity. Four common measures are Output, which describes total economic activity and is generally equivalent to a firm’s gross sales; Value Added, which equals gross output of an industry or a sector less its intermediate inputs; Labor Income, which corresponds to wages and benefits; and Employment, which refers to jobs that have been created in the local economy. In an input-output analysis of new economic activity, it is useful to distinguish three types of effects: direct, indirect, and induced. Direct effects are production changes associated with the immediate effects or final demand changes. The payment made by an out-of-town visitor to a hotel operator or the taxi fare paid for transportation while in town are examples of direct effects. Indirect effects are production changes in backward-linked industries caused by the changing input needs of directly affected industries – typically, additional purchases to produce additional output. Satisfying the demand for an overnight stay will require the hotel operator to purchase additional cleaning supplies and services. The taxi driver will have to replace the gasoline consumed during the trip from the airport. These downstream purchases affect the economic output of other local merchants. Induced effects are the changes in regional household spending patterns caused by changes in household income generated from the direct and indirect effects. Both the hotel operator and taxi driver experience increased income from the visitor’s stay, as do the cleaning supplies outlet and the gas station proprietor. Induced effects capture the way in which increased income is spent in the local economy. A multiplier reflects the interaction between different sectors of the economy. An output multiplier of 1.4, for example, means that for every $1,000 injected into the economy, all other sectors produce an additional $400 in output. The larger the multiplier, the greater the impact will be in the regional economy.
For this analysis, the project team used the IMPLAN online economic impact model with the dataset for the State of Oklahoma (2014 Model). Fiscal Impact To provide an “order of magnitude” estimate for state tax revenue attributable to the incentive being evaluated, the project team focused on the ratio of state government tax collections to Oklahoma Gross Domestic Product (GDP).18 Two datasets were used to derive the ratio: 1) U.S. Department of Commerce Bureau of Economic
18 Gross State Product (GSP) is the state counterpart of Gross Domestic Product (GDP) for the nation. To assist the reader, the project team has decided to use GDP throughout this section of the report instead of mixing the two terms. This decision was made because more people are familiar with the term GDP.
Direct Indirect Induced Total Impact
Figure 6: The Flow of Economic Impacts
Clean-Burning Fuel Vehicle Credit 25
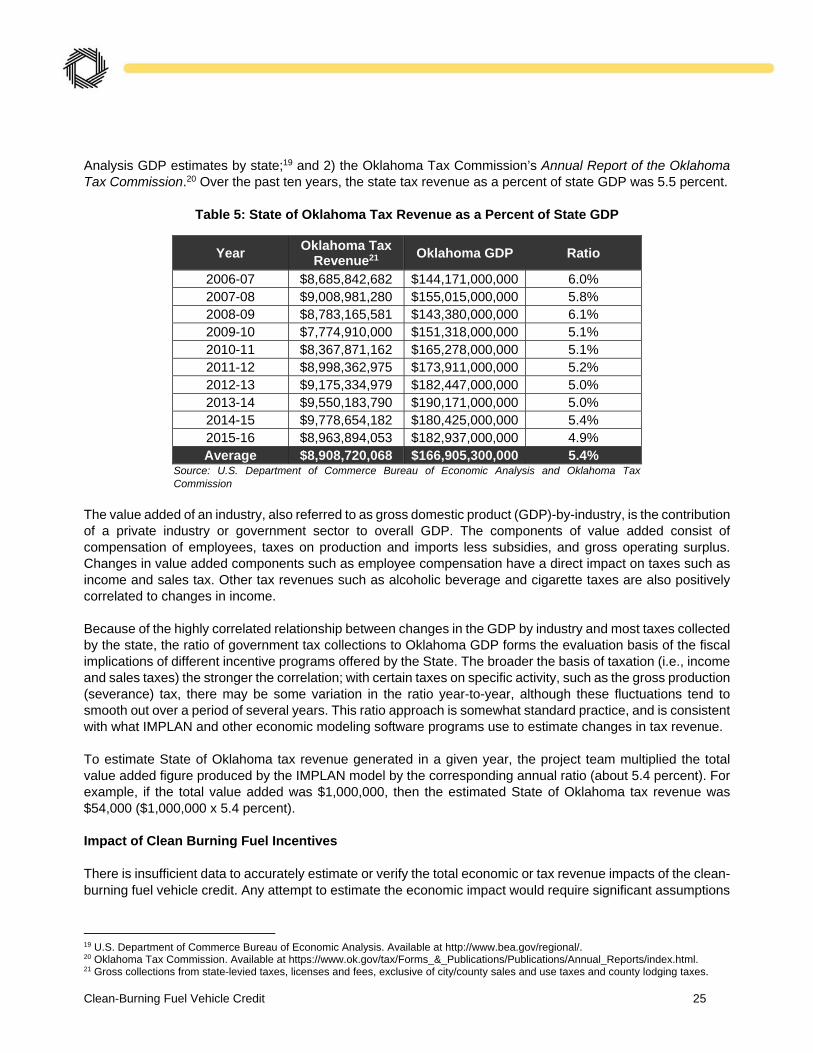
Analysis GDP estimates by state;19 and 2) the Oklahoma Tax Commission’s Annual Report of the Oklahoma Tax Commission.20 Over the past ten years, the state tax revenue as a percent of state GDP was 5.5 percent.
Table 5: State of Oklahoma Tax Revenue as a Percent of State GDP
Year Oklahoma Tax
Revenue21 Oklahoma GDP Ratio
2006-07 $8,685,842,682 $144,171,000,000 6.0% 2007-08 $9,008,981,280 $155,015,000,000 5.8% 2008-09 $8,783,165,581 $143,380,000,000 6.1% 2009-10 $7,774,910,000 $151,318,000,000 5.1% 2010-11 $8,367,871,162 $165,278,000,000 5.1% 2011-12 $8,998,362,975 $173,911,000,000 5.2% 2012-13 $9,175,334,979 $182,447,000,000 5.0% 2013-14 $9,550,183,790 $190,171,000,000 5.0% 2014-15 $9,778,654,182 $180,425,000,000 5.4% 2015-16 $8,963,894,053 $182,937,000,000 4.9% Average $8,908,720,068 $166,905,300,000 5.4%
Source: U.S. Department of Commerce Bureau of Economic Analysis and Oklahoma Tax Commission
The value added of an industry, also referred to as gross domestic product (GDP)-by-industry, is the contribution of a private industry or government sector to overall GDP. The components of value added consist of compensation of employees, taxes on production and imports less subsidies, and gross operating surplus. Changes in value added components such as employee compensation have a direct impact on taxes such as income and sales tax. Other tax revenues such as alcoholic beverage and cigarette taxes are also positively correlated to changes in income. Because of the highly correlated relationship between changes in the GDP by industry and most taxes collected by the state, the ratio of government tax collections to Oklahoma GDP forms the evaluation basis of the fiscal implications of different incentive programs offered by the State. The broader the basis of taxation (i.e., income and sales taxes) the stronger the correlation; with certain taxes on specific activity, such as the gross production (severance) tax, there may be some variation in the ratio year-to-year, although these fluctuations tend to smooth out over a period of several years. This ratio approach is somewhat standard practice, and is consistent with what IMPLAN and other economic modeling software programs use to estimate changes in tax revenue. To estimate State of Oklahoma tax revenue generated in a given year, the project team multiplied the total value added figure produced by the IMPLAN model by the corresponding annual ratio (about 5.4 percent). For example, if the total value added was $1,000,000, then the estimated State of Oklahoma tax revenue was $54,000 ($1,000,000 x 5.4 percent). Impact of Clean Burning Fuel Incentives There is insufficient data to accurately estimate or verify the total economic or tax revenue impacts of the clean-burning fuel vehicle credit. Any attempt to estimate the economic impact would require significant assumptions
19 U.S. Department of Commerce Bureau of Economic Analysis. Available at http://www.bea.gov/regional/. 20 Oklahoma Tax Commission. Available at https://www.ok.gov/tax/Forms_&_Publications/Publications/Annual_Reports/index.html. 21 Gross collections from state-levied taxes, licenses and fees, exclusive of city/county sales and use taxes and county lodging taxes.
Clean-Burning Fuel Vehicle Credit 26
regarding “but for” these programs residents would not have purchased another type of vehicle. In addition, there is limited data to support that these vehicles are manufactured or modified in Oklahoma. In terms of retail activity, consumers are most likely purchasing the clean burning fuel at a filling station - but substituting gasoline for compressed natural gas. Both of these purchases generate retail sector sales. In the short-term, it is reasonable to assume that retail outlets adding clean burning fuel options have generated some construction sectors jobs. There are also positive environmental benefits associated with usage of clean burning vehicles. While some studies and models put a dollar figure on the environmental and health benefits associated with cleaner burning vehicles, that type analysis was not performed as part of this effort.

Clean-Burning Fuel Vehicle Credit 27
Incentive Benchmarking
Clean-Burning Fuel Vehicle Credit 28
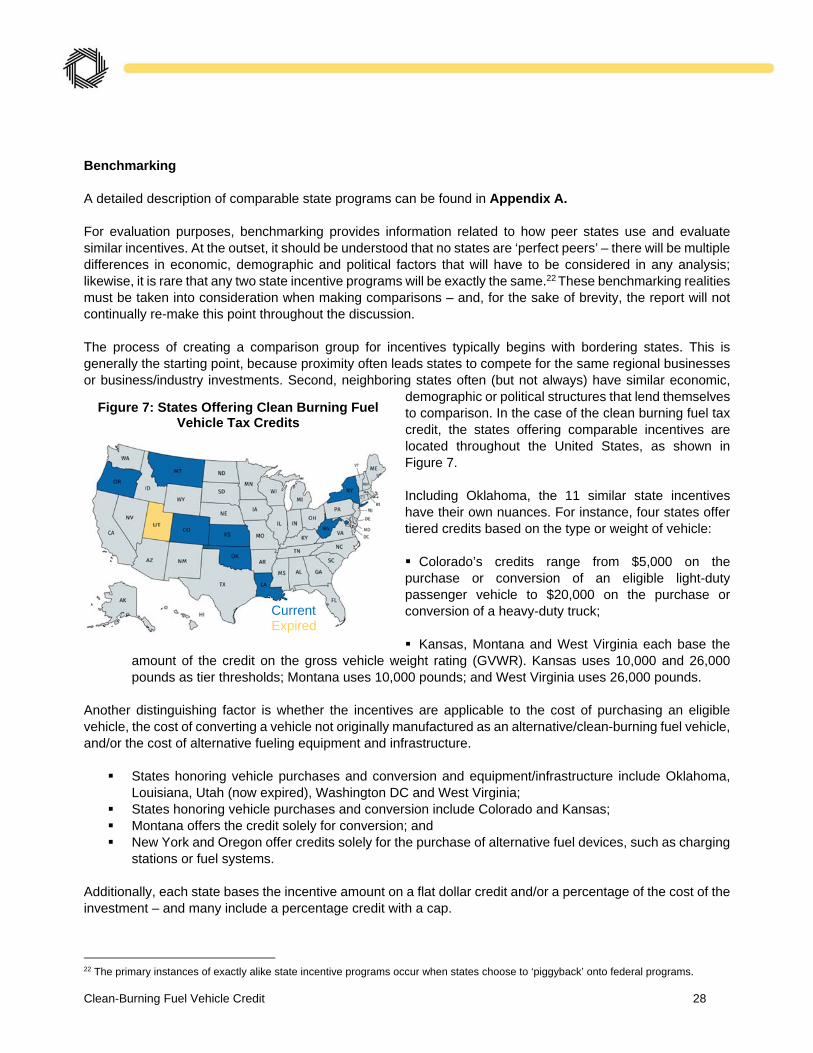
Benchmarking A detailed description of comparable state programs can be found in Appendix A. For evaluation purposes, benchmarking provides information related to how peer states use and evaluate similar incentives. At the outset, it should be understood that no states are ‘perfect peers’ – there will be multiple differences in economic, demographic and political factors that will have to be considered in any analysis; likewise, it is rare that any two state incentive programs will be exactly the same.22 These benchmarking realities must be taken into consideration when making comparisons – and, for the sake of brevity, the report will not continually re-make this point throughout the discussion. The process of creating a comparison group for incentives typically begins with bordering states. This is generally the starting point, because proximity often leads states to compete for the same regional businesses or business/industry investments. Second, neighboring states often (but not always) have similar economic,
demographic or political structures that lend themselves to comparison. In the case of the clean burning fuel tax credit, the states offering comparable incentives are located throughout the United States, as shown in Figure 7. Including Oklahoma, the 11 similar state incentives have their own nuances. For instance, four states offer tiered credits based on the type or weight of vehicle: Colorado’s credits range from $5,000 on the purchase or conversion of an eligible light-duty passenger vehicle to $20,000 on the purchase or conversion of a heavy-duty truck; Kansas, Montana and West Virginia each base the
amount of the credit on the gross vehicle weight rating (GVWR). Kansas uses 10,000 and 26,000 pounds as tier thresholds; Montana uses 10,000 pounds; and West Virginia uses 26,000 pounds.
Another distinguishing factor is whether the incentives are applicable to the cost of purchasing an eligible vehicle, the cost of converting a vehicle not originally manufactured as an alternative/clean-burning fuel vehicle, and/or the cost of alternative fueling equipment and infrastructure.
States honoring vehicle purchases and conversion and equipment/infrastructure include Oklahoma, Louisiana, Utah (now expired), Washington DC and West Virginia;
States honoring vehicle purchases and conversion include Colorado and Kansas; Montana offers the credit solely for conversion; and New York and Oregon offer credits solely for the purchase of alternative fuel devices, such as charging
stations or fuel systems. Additionally, each state bases the incentive amount on a flat dollar credit and/or a percentage of the cost of the investment – and many include a percentage credit with a cap.
22 The primary instances of exactly alike state incentive programs occur when states choose to ‘piggyback’ onto federal programs.
Figure 7: States Offering Clean Burning Fuel Vehicle Tax Credits
Current Expired

Clean-Burning Fuel Vehicle Credit 29
Only Colorado bases its credits on a flat dollar amount (credits ranging from $5,000 for light duty vehicles to $20,000 for heavy-duty trucks);
Oklahoma and Louisiana base their credits on an uncapped percentage of the cost of purchase or conversion: Oklahoma (45 percent of vehicle or conversion cost or 75 percent of fuel delivery equipment); Louisiana (36 percent of vehicle, conversion or equipment cost);
Several states offer a capped credit based on a percentage of cost: Kansas (40 percent of the cost up to $40,000 for vehicles over 26,000 pounds); Montana (50 percent of the cost of equipment up to $1,000); New York (50 percent of property cost up to $5,000); Oregon (50 percent of charging station or fuel system up to $750); Washington, DC (50 percent of the cost up to $19,000 for vehicles or conversion, up to $1,000 for residential electric charging stations and $10,000 for publicly accessible AFV fueling stations) and West Virginia (35 percent of the purchase cost and 50 percent of the conversion cost, up to $25,000 for the heaviest vehicles);
Though now expired, Utah’s program offered very specific credits based on vehicle or equipment type. For example, plug-in hybrid vehicles were eligible for $1,000, while conversion equipment was eligible at 50 percent of the cost up to $1,500.
Finally, states offer varying carry-forward policies. Oklahoma’s carry forward provision (five years) is matched by Oregon and West Virginia. While Kansas allows a credit to be carried forward for three years and Washington DC for two years, several (Colorado, Louisiana, Montana and Utah) do not allow any carry forward. Only New York, which provides unlimited carry forward, has a more generous carry forward policy. Other distinguishing factors include:
Oklahoma offers a credit of the lesser of $2,500 or 50 percent of the cost of property directly related to the compression and delivery of natural gas from a home into a fuel tank of a vehicle propelled by CNG;
Oklahoma offers the lesser of $1,500 or 10 percent to second owners if no credit is claimed by the original purchaser;
In Colorado, the cost of leasing is credited at half the rate; Kansas offers an alternative tax credit of 5 percent of the cost of the alternative fuel vehicle, up to $750.
Similarly, Louisiana offers an alternative credit of 7.2 percent of the cost of the vehicle, up to $1,500; Though now expired, Utah covered the purchase of electric motorcycles.
The federal government also offers several grants, tax exemptions and incentives related to alternative fuels. In fact, 17 incentives related to alternative fuels and vehicles, advanced technologies or air quality are currently offered. The Qualified Plug-In Electric Drive Motor Vehicle Tax Credit is most comparable to the State’s current program. This incentive makes available a tax credit for the purchase of a new qualified plug-in electric drive motor vehicle that meets the qualification criteria. The minimum credit amount is $2,500, and the credit may be up to $7,500, based on the vehicle’s traction battery capacity and the gross vehicle weight rating. Interestingly, the program is structured to phase out as electric vehicle sales increase – the credit begins to phase out for each manufacturer in the second quarter following the calendar quarter in which a minimum of 200,000 qualified plug-in electric drive vehicles have been sold by that manufacturer in the U.S.23
23 Alternative Fuels Data Center. Available at https://www.afdc.energy.gov/laws/409
Clean-Burning Fuel Vehicle Credit 30
Benchmarking Program Evaluations Among the states with comparable incentive programs, two relevant studies have been conducted: a study of the economic impacts of Oregon’s Residential and Business Energy Tax Credits in 2007 and 2008, and a 2014 evaluation of Connecticut’s Clean Alternative Fuels Tax Credit. The State of Oregon offers tax credits to residents and businesses that invest in energy conservation and renewable energy projects. The Oregon study24 sought to estimate the economic impact on employment, outputs and wages, as well as revenue in Oregon that resulted from 2007 and 2008 tax credits and the subsequent spending on activity and labor that these credits create. The evaluation compared all impacts against a base case scenario in which the tax credits did not exist and the tax credit funds were spent on other Oregon government programs. The evaluation found that in 2007, a total of $4.3 million in claims was paid out for the purchase of more than 2,900 vehicles, resulting in a net annual energy savings of more than $1.0 million and a net annual CO2 reduction of 3,910 tons. In 2008, a total of $4.3 million in claims was again paid out for the purchase of more than 2,900 vehicles; net annual energy savings totaled nearly $1.0 million, and the net annual CO2 reduction was 3,833 tons. Connecticut’s Clean Alternative Fuels Tax Incentive (eliminated effective January 1, 2008) provided a tax credit of 10 percent of the difference in cost between the purchase of a vehicle exclusively powered by clean alternative fuel and the MSRP of a comparably-equipped, non-alternative fuel vehicle. The 2014 program evaluation25 used the full value of the associated investment to calculate the range of activity related to the credit. The evaluators presented four scenarios (0, 20, 50 and 100 percent) to model a range of outcomes, where a given percent times the full investment associated with the credit represents the range of created target activity. The report also recognized that credits and abatements reduce total State revenue, and offset the increased economic activity resulting from the use of the credits, abatements and exemptions claimed by reducing state government spending by the amount of foregone revenue. The analysis found that nearly all (96 percent) of the total credits were claimed in the first six years of the program, after which claims declined precipitously. The evaluation also found that the incentive spurred the purchase of more than $28 million in alternative fuel vehicles, but did not report on the emissions reduction or exact number of vehicles purchased.
24 ECONorthwest, Economic Impacts of Oregon Energy Tax Credit Programs in 2007 and 2008 – Final Report (February 2009). 25 Connecticut Department of Economic and Community Development, An Assessment of Connecticut’s Tax Credit and Abatement Programs (September 2014).

Clean-Burning Fuel Vehicle Credit 31
Appendices

Clean-Burning Fuel Vehicle Credit 32
Appendix A: Comparable State Programs
State Program Name
For Vehicles Placed in
Service On or After
Sunset Date
Credit Carry
Forward
Oklahoma Clean-Burning Fuel Vehicle Tax Credits
July 1, 1990 December 31, 2019
- 45% of the cost of converting vehicles to be propelled by clean burning fuel; or the cost of purchasing a vehicle originally equipped to be propelled by clean burning fuel. If no credit is claimed by prior owner of originally equipped vehicle, credit of lesser of 10% or $1,500 is available - 75% of the cost of property directly related to the delivery of alternative fuels, such as compression equipment and storage tanks; or a metered-for-fee, public access recharging system for vehicles propelled in whole or part by electricity - The lesser of $2,500 or 50% of the cost of property directly related to the compression and delivery of natural gas from a home into the fuel tank of a vehicle propelled by CNG
5 years
Arkansas Gaseous Fuels Vehicle Rebate
Program Unknown Expired
- 50% of the incremental cost up to $4,500 - 50% of conversion costs up to $2,500 - 75% of the cost of natural gas and propane fueling stations
None
Colorado Alternative Fuel Tax
Credit January 1,
2012 December 31, 2021
Between 2017 and 2019: - Light-duty passenger vehicles eligible for $5,000 credit on purchase or conversion; $2,500 on lease - Light-duty trucks eligible for $7,000 credit on purchase or conversion; $3,500 on lease - Medium-duty trucks eligible for $10,000 credit on purchase or conversation; $5,000 on lease - Heavy-duty trucks eligible for $20,000 credit on purchase or conversion; $10,000 on lease
None
Delaware Alternative Fuel Vehicle Rebate
November 1, 2016
June 30, 2018
- $3,500 for all-electric vehicles - $1,500 for plug-in hybrid vehicles and electric vehicles with gasoline range extenders - $1,500 for dedicated propane or natural gas vehicles - $1,350 for bi-fuel propane or natural gas vehicles - $20,000 for dedicated heavy-duty natural gas vehicles
None

Clean-Burning Fuel Vehicle Credit 33
State Program Name
For Vehicles Placed in
Service On or After
Sunset Date
Credit Carry
Forward
Georgia Commercial
Alternative Fuel Vehicle Tax Credit
Unknown June 30,
2017
- Tax credit for new commercial medium-duty or heavy-duty AFVs that operate using at least 90 percent alternative fuel - medium-duty hybrid electric vehicles also qualify - Eligible medium-duty AFVs with a GVWR between 8,500 and 26,001 pounds may qualify for a credit of up to $12,000 - Heavy-duty AFVs with a GVWR over 26,001 pounds may quality for a credit of up to $20,000
None
Illinois
Alternative Fuel Vehicle and
Alternative Fuel Rebates
Unknown Suspended indefinitely
- 80%, up to $4,000, of the cost of purchasing an AFV - 80%, up to $4,000, of the cost of converting a conventional vehicle to an AFV using a federally certified conversion - The incremental cost of purchasing alternative fuels
None
Kansas
AFV and Alternative Fueling
Infrastructure Tax Credits
January 1, 1996
None
- 40% of the cost of purchasing an AFV or converting a vehicle to alternative fuels; credits are $2,400 for vehicles less than 10,000 pounds, $4,000 for vehicles between 10,000 and 26,000 pounds, and $40,000 for vehicles over 26,000 pounds - Alternatively, tax credit of 5% of the cost of the AFV, up to $750, is available
3 years
Louisiana AFV and Fueling Infrastructure Tax
Credit
January 1, 2009
None, extension granted effective
July 1, 2018
- 36% of the cost of purchasing an AFV or alternative fueling equipment, or converting a vehicle to run on alternative fuels - Alternatively, taxpayer may take credit of 7.2% of the cost of the vehicle, up to $1,500
None
Montana Alternative Fuel
Vehicle Conversion Tax Credit
January 1, 2009
None - 50% of the equipment and labor costs of conversion, up to $500 for vehicles with GVWR less than 10,000 pounds and $1,000 for vehicles with GVWR more than 10,000 pounds
None

Clean-Burning Fuel Vehicle Credit 34
State Program Name
For Vehicles Placed in
Service On or After
Sunset Date
Credit Carry
Forward
Nebraska Alternative Fuel Vehicle Rebate
January 4, 2016
When funds are depleted
- 50% of the incremental cost of the vehicle compared to the MSRP of the conventional fuel equivalent, up to $4,500 - For vehicles that do not have a conventional fuel equivalent, the rebate amount is up to $4,500 per vehicle - 50% of the cost of conversion equipment and installation, up to $4,500 - Qualified vehicle conversions includes new equipment that is installed in Nebraska by a certified installer to convert a conventional fuel vehicle to operate using a qualified clean-burning motor fuel. These fuels include hydrogen, compressed natural gas and propane
None
New York
Alternative Fuels and Electric Vehicle
Recharging Property Credit
January 1, 2013
December 31, 2017
- The lesser of $5,000 or 50% of the cost of alternative fuels refueling property or electric vehicle recharging property
Unlimited
Oregon Residential Energy
Tax Credit January 1,
2006 December 31, 2017
- 50% of the cost of an alternative fuel device (charging station or fuel system), not to exceed $750
5 Years
Pennsylvania Alternative Fuel Vehicle Funding
Unknown
250 rebates disbursed or
June 30, 2017
- $1,000 for the incremental cost of the purchase of new AFVs
None
Texas Clean Vehicle Replacement
Vouchers Unknown Unknown
- $3,500 vouchers for the purchase of hybrid electric, battery electric or natural gas vehicles up to three model years old
None
Utah Clean Fuel Vehicle
Tax Credits (Expired)
January 1, 2009
December 31, 2016
- $1,000 for the cost of a qualified plug-in hybrid vehicle - 35% of the cost, up to $1,500, of an alternative fuel or electric vehicle - $1,000 for plug-in hybrid and $1,500 for alternative fuel or electric vehicle leases - 50% of the cost of conversion equipment, up to $1,500 - $1,000 for special equipment converted to operating using alternative fuel or electricity - $750 for the cost of an electric motorcycle
None

Clean-Burning Fuel Vehicle Credit 35
State Program Name
For Vehicles Placed in
Service On or After
Sunset Date
Credit Carry
Forward
Qualified Heavy-Duty Alternative Fuel Vehicle Tax
Credit
Unknown December 31, 2020
Qualified taxpayers are eligible for a tax credit for the purchase of qualified heavy-duty AFVs as follows: - 2017: $25,000 - 2018: $20,000 - 2019: $18,000 - 2020: $15,000
None
Washington Alternative Fuel Tax
Exemption Unknown July 1, 2019
Sales tax exemption on passenger cars, light-duty trucks and medium-duty passenger vehicles that are dedicated AFVs; applies up to $32,000 of a vehicle's selling price or total lease payment
None
Washington, DC
AFV Infrastructure and Conversion Tax
Credits
January 1, 2014
December 31, 2026
- 50% of the cost, up to $19,000, to purchase an alternative fuel vehicle or convert a vehicle to alternative fuels - 50% of the equipment and labor costs for the purchase and installation of alternative fuel infrastructure on qualified AFV fueling property; limits are $1,000 per residential electric charging station and $10,000 per publicly accessible AFV fueling station
2 Years
West Virginia Alternative Fuel
Motor Vehicle Tax Credit
January 1, 2011
December 31, 2017
- 35% of the cost to purchase an alternative fuel vehicle - 50% of the cost to convert a vehicle to alternative fuels - Limits are $7,500 for vehicles with GVWR up to 26,000 pounds and $25,000 for vehicles with GVWR more than 26,000 pounds
5 Years