Embed Size (px)
Citation preview
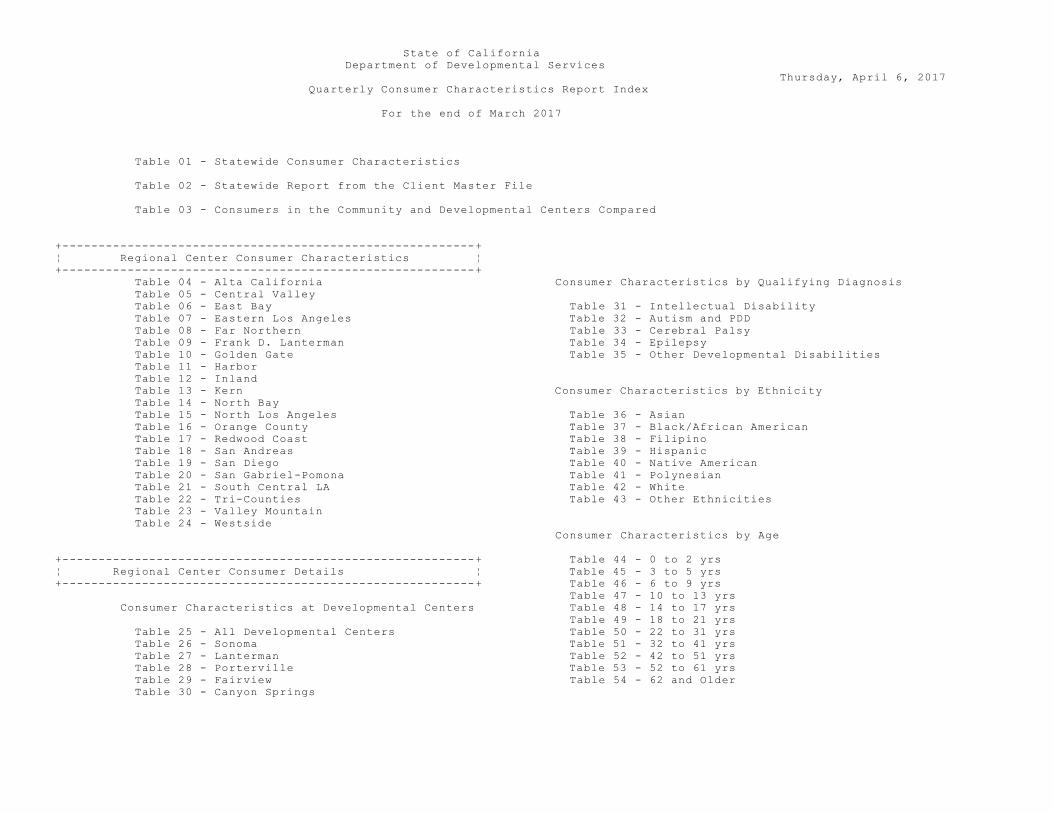
State of California
Department of Developmental Services
Thursday, April 6, 2017
Quarterly Consumer Characteristics Report Index
For the end of March 2017
Table 01 - Statewide Consumer Characteristics
Table 02 - Statewide Report from the Client Master File
Table 03 - Consumers in the Community and Developmental Centers Compared
+---------------------------------------------------------+
¦ Regional Center Consumer Characteristics ¦
+---------------------------------------------------------+
Table 04 - Alta California Consumer Characteristics by Qualifying Diagnosis
Table 05 - Central Valley
Table 06 - East Bay Table 31 - Intellectual Disability
Table 07 - Eastern Los Angeles Table 32 - Autism and PDD
Table 08 - Far Northern Table 33 - Cerebral Palsy
Table 09 - Frank D. Lanterman Table 34 - Epilepsy
Table 10 - Golden Gate Table 35 - Other Developmental Disabilities
Table 11 - Harbor
Table 12 - Inland
Table 13 - Kern Consumer Characteristics by Ethnicity
Table 14 - North Bay
Table 15 - North Los Angeles Table 36 - Asian
Table 16 - Orange County Table 37 - Black/African American
Table 17 - Redwood Coast Table 38 - Filipino
Table 18 - San Andreas Table 39 - Hispanic
Table 19 - San Diego Table 40 - Native American
Table 20 - San Gabriel-Pomona Table 41 - Polynesian
Table 21 - South Central LA Table 42 - White
Table 22 - Tri-Counties Table 43 - Other Ethnicities
Table 23 - Valley Mountain
Table 24 - Westside
Consumer Characteristics by Age
+---------------------------------------------------------+ Table 44 - 0 to 2 yrs
¦ Regional Center Consumer Details ¦ Table 45 - 3 to 5 yrs
+---------------------------------------------------------+ Table 46 - 6 to 9 yrs
Table 47 - 10 to 13 yrs
Consumer Characteristics at Developmental Centers Table 48 - 14 to 17 yrs
Table 49 - 18 to 21 yrs
Table 25 - All Developmental Centers Table 50 - 22 to 31 yrs
Table 26 - Sonoma Table 51 - 32 to 41 yrs
Table 27 - Lanterman Table 52 - 42 to 51 yrs
Table 28 - Porterville Table 53 - 52 to 61 yrs
Table 29 - Fairview Table 54 - 62 and Older
Table 30 - Canyon Springs
State of California
Department of Developmental Services Thursday, April 6, 2017
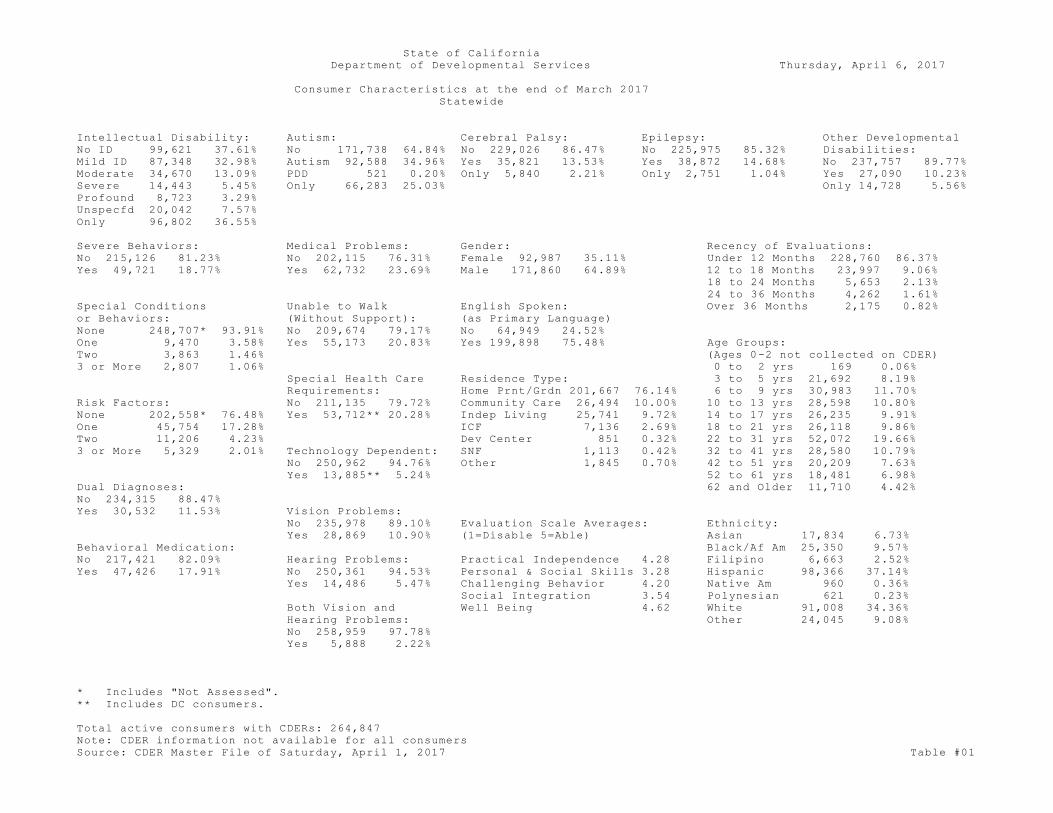
Consumer Characteristics at the end of March 2017
Statewide
Intellectual Disability: Autism: Cerebral Palsy: Epilepsy: Other Developmental
No ID 99,621 37.61% No 171,738 64.84% No 229,026 86.47% No 225,975 85.32% Disabilities:
Mild ID 87,348 32.98% Autism 92,588 34.96% Yes 35,821 13.53% Yes 38,872 14.68% No 237,757 89.77%
Moderate 34,670 13.09% PDD 521 0.20% Only 5,840 2.21% Only 2,751 1.04% Yes 27,090 10.23%
Severe 14,443 5.45% Only 66,283 25.03% Only 14,728 5.56%
Profound 8,723 3.29%
Unspecfd 20,042 7.57%
Only 96,802 36.55%
Severe Behaviors: Medical Problems: Gender: Recency of Evaluations:
No 215,126 81.23% No 202,115 76.31% Female 92,987 35.11% Under 12 Months 228,760 86.37%
Yes 49,721 18.77% Yes 62,732 23.69% Male 171,860 64.89% 12 to 18 Months 23,997 9.06%
18 to 24 Months 5,653 2.13%
24 to 36 Months 4,262 1.61%
Special Conditions Unable to Walk English Spoken: Over 36 Months 2,175 0.82%
or Behaviors: (Without Support): (as Primary Language)
None 248,707* 93.91% No 209,674 79.17% No 64,949 24.52%
One 9,470 3.58% Yes 55,173 20.83% Yes 199,898 75.48% Age Groups:
Two 3,863 1.46% (Ages 0-2 not collected on CDER)
3 or More 2,807 1.06% 0 to 2 yrs 169 0.06%
Special Health Care Residence Type: 3 to 5 yrs 21,692 8.19%
Requirements: Home Prnt/Grdn 201,667 76.14% 6 to 9 yrs 30,983 11.70%
Risk Factors: No 211,135 79.72% Community Care 26,494 10.00% 10 to 13 yrs 28,598 10.80%
None 202,558* 76.48% Yes 53,712** 20.28% Indep Living 25,741 9.72% 14 to 17 yrs 26,235 9.91%
One 45,754 17.28% ICF 7,136 2.69% 18 to 21 yrs 26,118 9.86%
Two 11,206 4.23% Dev Center 851 0.32% 22 to 31 yrs 52,072 19.66%
3 or More 5,329 2.01% Technology Dependent: SNF 1,113 0.42% 32 to 41 yrs 28,580 10.79%
No 250,962 94.76% Other 1,845 0.70% 42 to 51 yrs 20,209 7.63%
Yes 13,885** 5.24% 52 to 61 yrs 18,481 6.98%
Dual Diagnoses: 62 and Older 11,710 4.42%
No 234,315 88.47%
Yes 30,532 11.53% Vision Problems:
No 235,978 89.10% Evaluation Scale Averages: Ethnicity:
Yes 28,869 10.90% (1=Disable 5=Able) Asian 17,834 6.73%
Behavioral Medication: Black/Af Am 25,350 9.57%
No 217,421 82.09% Hearing Problems: Practical Independence 4.28 Filipino 6,663 2.52%
Yes 47,426 17.91% No 250,361 94.53% Personal & Social Skills 3.28 Hispanic 98,366 37.14%
Yes 14,486 5.47% Challenging Behavior 4.20 Native Am 960 0.36%
Social Integration 3.54 Polynesian 621 0.23%
Both Vision and Well Being 4.62 White 91,008 34.36%
Hearing Problems: Other 24,045 9.08%
No 258,959 97.78%
Yes 5,888 2.22%
* Includes "Not Assessed".
** Includes DC consumers.
Total active consumers with CDERs: 264,847
Note: CDER information not available for all consumers
Source: CDER Master File of Saturday, April 1, 2017 Table #01
State of California
Department of Developmental Services Thursday, April 6, 2017
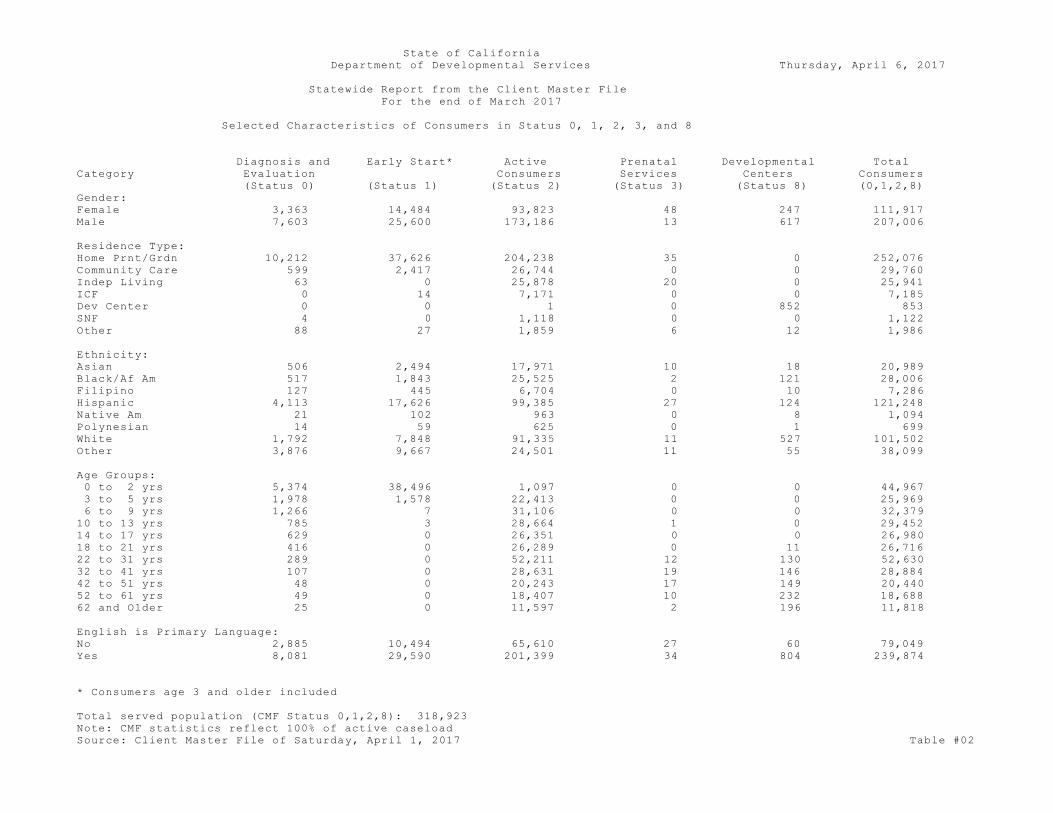
Statewide Report from the Client Master File
For the end of March 2017
Selected Characteristics of Consumers in Status 0, 1, 2, 3, and 8
Diagnosis and Early Start* Active Prenatal Developmental Total
Category Evaluation Consumers Services Centers Consumers
(Status 0) (Status 1) (Status 2) (Status 3) (Status 8) (0,1,2,8)
Gender:
Female 3,363 14,484 93,823 48 247 111,917
Male 7,603 25,600 173,186 13 617 207,006
Residence Type:
Home Prnt/Grdn 10,212 37,626 204,238 35 0 252,076
Community Care 599 2,417 26,744 0 0 29,760
Indep Living 63 0 25,878 20 0 25,941
ICF 0 14 7,171 0 0 7,185
Dev Center 0 0 1 0 852 853
SNF 4 0 1,118 0 0 1,122
Other 88 27 1,859 6 12 1,986
Ethnicity:
Asian 506 2,494 17,971 10 18 20,989
Black/Af Am 517 1,843 25,525 2 121 28,006
Filipino 127 445 6,704 0 10 7,286
Hispanic 4,113 17,626 99,385 27 124 121,248
Native Am 21 102 963 0 8 1,094
Polynesian 14 59 625 0 1 699
White 1,792 7,848 91,335 11 527 101,502
Other 3,876 9,667 24,501 11 55 38,099
Age Groups:
0 to 2 yrs 5,374 38,496 1,097 0 0 44,967
3 to 5 yrs 1,978 1,578 22,413 0 0 25,969
6 to 9 yrs 1,266 7 31,106 0 0 32,379
10 to 13 yrs 785 3 28,664 1 0 29,452
14 to 17 yrs 629 0 26,351 0 0 26,980
18 to 21 yrs 416 0 26,289 0 11 26,716
22 to 31 yrs 289 0 52,211 12 130 52,630
32 to 41 yrs 107 0 28,631 19 146 28,884
42 to 51 yrs 48 0 20,243 17 149 20,440
52 to 61 yrs 49 0 18,407 10 232 18,688
62 and Older 25 0 11,597 2 196 11,818
English is Primary Language:
No 2,885 10,494 65,610 27 60 79,049
Yes 8,081 29,590 201,399 34 804 239,874
* Consumers age 3 and older included
Total served population (CMF Status 0,1,2,8): 318,923
Note: CMF statistics reflect 100% of active caseload
Source: Client Master File of Saturday, April 1, 2017 Table #02
State of California
Department of Developmental Services Thursday, April 6, 2017
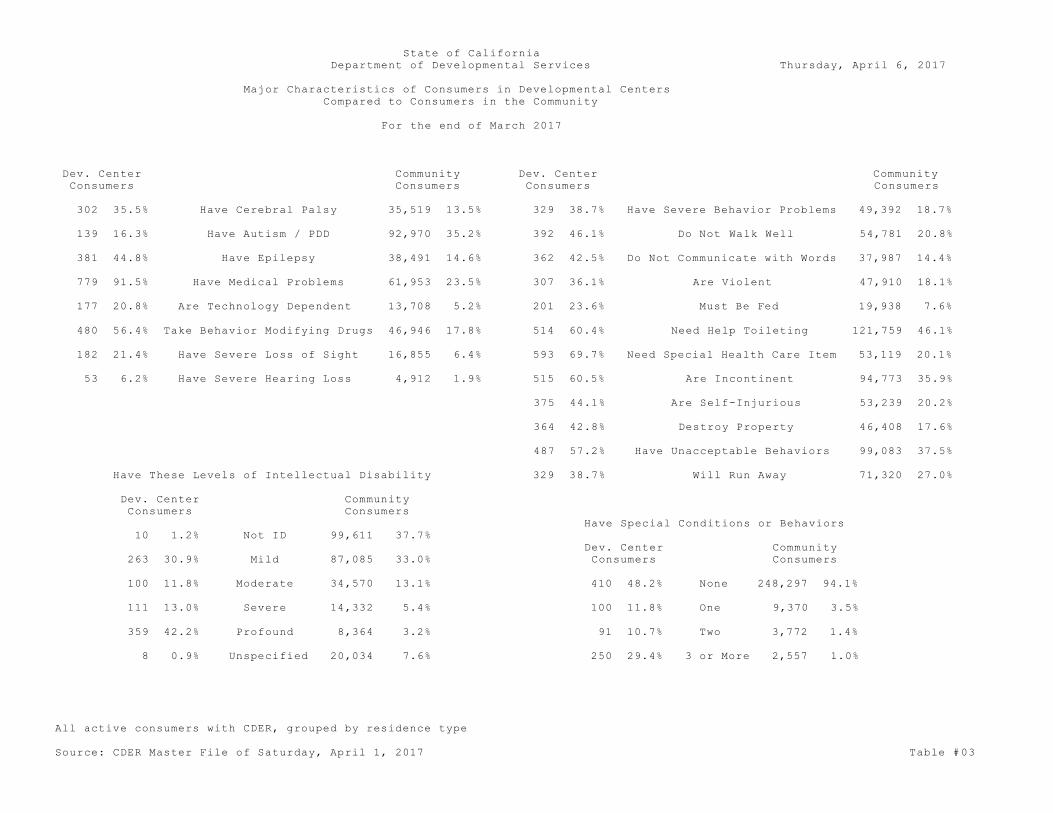
Major Characteristics of Consumers in Developmental Centers
Compared to Consumers in the Community
For the end of March 2017
Dev. Center Community Dev. Center Community
Consumers Consumers Consumers Consumers
302 35.5% Have Cerebral Palsy 35,519 13.5% 329 38.7% Have Severe Behavior Problems 49,392 18.7%
139 16.3% Have Autism / PDD 92,970 35.2% 392 46.1% Do Not Walk Well 54,781 20.8%
381 44.8% Have Epilepsy 38,491 14.6% 362 42.5% Do Not Communicate with Words 37,987 14.4%
779 91.5% Have Medical Problems 61,953 23.5% 307 36.1% Are Violent 47,910 18.1%
177 20.8% Are Technology Dependent 13,708 5.2% 201 23.6% Must Be Fed 19,938 7.6%
480 56.4% Take Behavior Modifying Drugs 46,946 17.8% 514 60.4% Need Help Toileting 121,759 46.1%
182 21.4% Have Severe Loss of Sight 16,855 6.4% 593 69.7% Need Special Health Care Item 53,119 20.1%
53 6.2% Have Severe Hearing Loss 4,912 1.9% 515 60.5% Are Incontinent 94,773 35.9%
375 44.1% Are Self-Injurious 53,239 20.2%
364 42.8% Destroy Property 46,408 17.6%
487 57.2% Have Unacceptable Behaviors 99,083 37.5%
Have These Levels of Intellectual Disability 329 38.7% Will Run Away 71,320 27.0%
Dev. Center Community
Consumers Consumers
Have Special Conditions or Behaviors
10 1.2% Not ID 99,611 37.7%
Dev. Center Community
263 30.9% Mild 87,085 33.0% Consumers Consumers
100 11.8% Moderate 34,570 13.1% 410 48.2% None 248,297 94.1%
111 13.0% Severe 14,332 5.4% 100 11.8% One 9,370 3.5%
359 42.2% Profound 8,364 3.2% 91 10.7% Two 3,772 1.4%
8 0.9% Unspecified 20,034 7.6% 250 29.4% 3 or More 2,557 1.0%
All active consumers with CDER, grouped by residence type
Source: CDER Master File of Saturday, April 1, 2017 Table #03

State of California
Department of Developmental Services Thursday, April 6, 2017
Consumer Characteristics at the end of March 2017
Alta California Regional Center
Intellectual Disability: Autism: Cerebral Palsy: Epilepsy: Other Developmental
No ID 8,461 42.88% No 13,302 67.41% No 17,473 88.55% No 17,492 88.64% Disabilities:
Mild ID 5,894 29.87% Autism 6,428 32.57% Yes 2,260 11.45% Yes 2,241 11.36% No 16,555 83.89%
Moderate 2,347 11.89% PDD 3 0.02% Only 526 2.67% Only 171 0.87% Yes 3,178 16.11%
Severe 974 4.94% Only 4,522 22.92% Only 2,196 11.13%
Profound 375 1.90%
Unspecfd 1,682 8.52%
Only 7,461 37.81%
Severe Behaviors: Medical Problems: Gender: Recency of Evaluations:
No 16,182 82.00% No 15,312 77.60% Female 7,100 35.98% Under 12 Months 18,446 93.48%
Yes 3,551 18.00% Yes 4,421 22.40% Male 12,633 64.02% 12 to 18 Months 1,070 5.42%
18 to 24 Months 106 0.54%
24 to 36 Months 45 0.23%
Special Conditions Unable to Walk English Spoken: Over 36 Months 66 0.33%
or Behaviors: (Without Support): (as Primary Language)
None 18,418* 93.34% No 15,919 80.67% No 2,210 11.20%
One 798 4.04% Yes 3,814 19.33% Yes 17,523 88.80% Age Groups:
Two 319 1.62% (Ages 0-2 not collected on CDER)
3 or More 198 1.00% 0 to 2 yrs 48 0.24%
Special Health Care Residence Type: 3 to 5 yrs 1,580 8.01%
Requirements: Home Prnt/Grdn 14,404 72.99% 6 to 9 yrs 2,253 11.42%
Risk Factors: No 15,797 80.05% Community Care 2,018 10.23% 10 to 13 yrs 2,114 10.71%
None 16,700* 84.63% Yes 3,936** 19.95% Indep Living 2,778 14.08% 14 to 17 yrs 1,948 9.87%
One 2,144 10.87% ICF 233 1.18% 18 to 21 yrs 1,869 9.47%
Two 575 2.91% Dev Center 82 0.42% 22 to 31 yrs 3,835 19.43%
3 or More 314 1.59% Technology Dependent: SNF 99 0.50% 32 to 41 yrs 2,234 11.32%
No 18,370 93.09% Other 119 0.60% 42 to 51 yrs 1,540 7.80%
Yes 1,363** 6.91% 52 to 61 yrs 1,427 7.23%
Dual Diagnoses: 62 and Older 885 4.48%
No 17,044 86.37%
Yes 2,689 13.63% Vision Problems:
No 17,636 89.37% Evaluation Scale Averages: Ethnicity:
Yes 2,097 10.63% (1=Disable 5=Able) Asian 1,282 6.50%
Behavioral Medication: Black/Af Am 2,472 12.53%
No 14,163 71.77% Hearing Problems: Practical Independence 4.30 Filipino 391 1.98%
Yes 5,570 28.23% No 18,918 95.87% Personal & Social Skills 3.30 Hispanic 3,134 15.88%
Yes 815 4.13% Challenging Behavior 4.22 Native Am 102 0.52%
Social Integration 3.79 Polynesian 87 0.44%
Both Vision and Well Being 4.62 White 10,024 50.80%
Hearing Problems: Other 2,241 11.36%
No 19,426 98.44%
Yes 307 1.56%
* Includes "Not Assessed".
** Includes DC consumers.
Total active consumers with CDERs: 19,733
Note: CDER information not available for all consumers
Source: CDER Master File of Saturday, April 1, 2017 Table #04

State of California
Department of Developmental Services Thursday, April 6, 2017
Consumer Characteristics at the end of March 2017
Central Valley Regional Center
Intellectual Disability: Autism: Cerebral Palsy: Epilepsy: Other Developmental
No ID 4,894 31.91% No 11,827 77.11% No 13,305 86.75% No 12,457 81.22% Disabilities:
Mild ID 5,375 35.05% Autism 3,424 22.33% Yes 2,032 13.25% Yes 2,880 18.78% No 13,728 89.51%
Moderate 2,128 13.87% PDD 86 0.56% Only 244 1.59% Only 228 1.49% Yes 1,609 10.49%
Severe 865 5.64% Only 2,646 17.25% Only 1,186 7.73%
Profound 648 4.23%
Unspecfd 1,427 9.30%
Only 6,861 44.73%
Severe Behaviors: Medical Problems: Gender: Recency of Evaluations:
No 12,351 80.53% No 6,592 42.98% Female 5,854 38.17% Under 12 Months 14,302 93.25%
Yes 2,986 19.47% Yes 8,745 57.02% Male 9,483 61.83% 12 to 18 Months 877 5.72%
18 to 24 Months 34 0.22%
24 to 36 Months 44 0.29%
Special Conditions Unable to Walk English Spoken: Over 36 Months 80 0.52%
or Behaviors: (Without Support): (as Primary Language)
None 13,877* 90.48% No 11,767 76.72% No 3,786 24.69%
One 874 5.70% Yes 3,570 23.28% Yes 11,551 75.31% Age Groups:
Two 342 2.23% (Ages 0-2 not collected on CDER)
3 or More 244 1.59% 0 to 2 yrs 1 0.01%
Special Health Care Residence Type: 3 to 5 yrs 1,223 7.97%
Requirements: Home Prnt/Grdn 11,213 73.11% 6 to 9 yrs 1,710 11.15%
Risk Factors: No 10,818 70.54% Community Care 1,707 11.13% 10 to 13 yrs 1,483 9.67%
None 11,032* 71.93% Yes 4,519** 29.46% Indep Living 1,621 10.57% 14 to 17 yrs 1,384 9.02%
One 3,013 19.65% ICF 586 3.82% 18 to 21 yrs 1,377 8.98%
Two 851 5.55% Dev Center 71 0.46% 22 to 31 yrs 3,161 20.61%
3 or More 441 2.88% Technology Dependent: SNF 64 0.42% 32 to 41 yrs 1,909 12.45%
No 14,136 92.17% Other 75 0.49% 42 to 51 yrs 1,119 7.30%
Yes 1,201** 7.83% 52 to 61 yrs 1,098 7.16%
Dual Diagnoses: 62 and Older 872 5.69%
No 12,515 81.60%
Yes 2,822 18.40% Vision Problems:
No 13,545 88.32% Evaluation Scale Averages: Ethnicity:
Yes 1,792 11.68% (1=Disable 5=Able) Asian 836 5.45%
Behavioral Medication: Black/Af Am 957 6.24%
No 11,809 77.00% Hearing Problems: Practical Independence 4.19 Filipino 109 0.71%
Yes 3,528 23.00% No 14,625 95.36% Personal & Social Skills 3.17 Hispanic 7,804 50.88%
Yes 712 4.64% Challenging Behavior 4.15 Native Am 64 0.42%
Social Integration 3.63 Polynesian 15 0.10%
Both Vision and Well Being 4.67 White 4,700 30.64%
Hearing Problems: Other 852 5.56%
No 15,073 98.28%
Yes 264 1.72%
* Includes "Not Assessed".
** Includes DC consumers.
Total active consumers with CDERs: 15,337
Note: CDER information not available for all consumers
Source: CDER Master File of Saturday, April 1, 2017 Table #05

State of California
Department of Developmental Services Thursday, April 6, 2017
Consumer Characteristics at the end of March 2017
East Bay Regional Center
Intellectual Disability: Autism: Cerebral Palsy: Epilepsy: Other Developmental
No ID 7,739 45.73% No 10,620 62.75% No 14,496 85.65% No 14,509 85.73% Disabilities:
Mild ID 4,014 23.72% Autism 6,305 37.25% Yes 2,429 14.35% Yes 2,416 14.27% No 13,910 82.19%
Moderate 1,781 10.52% Only 4,137 24.44% Only 390 2.30% Only 158 0.93% Yes 3,015 17.81%
Severe 569 3.36% Only 1,358 8.02%
Profound 365 2.16%
Unspecfd 2,457 14.52%
Only 5,412 31.98%
Severe Behaviors: Medical Problems: Gender: Recency of Evaluations:
No 14,660 86.62% No 12,735 75.24% Female 5,798 34.26% Under 12 Months 13,129 77.57%
Yes 2,265 13.38% Yes 4,190 24.76% Male 11,127 65.74% 12 to 18 Months 2,300 13.59%
18 to 24 Months 846 5.00%
24 to 36 Months 468 2.77%
Special Conditions Unable to Walk English Spoken: Over 36 Months 182 1.08%
or Behaviors: (Without Support): (as Primary Language)
None 15,935* 94.15% No 13,496 79.74% No 4,253 25.13%
One 598 3.53% Yes 3,429 20.26% Yes 12,672 74.87% Age Groups:
Two 236 1.39% (Ages 0-2 not collected on CDER)
3 or More 156 0.92% 0 to 2 yrs 15 0.09%
Special Health Care Residence Type: 3 to 5 yrs 1,394 8.24%
Requirements: Home Prnt/Grdn 12,382 73.16% 6 to 9 yrs 1,835 10.84%
Risk Factors: No 14,162 83.68% Community Care 2,035 12.02% 10 to 13 yrs 1,730 10.22%
None 11,897* 70.29% Yes 2,763** 16.32% Indep Living 1,823 10.77% 14 to 17 yrs 1,565 9.25%
One 3,671 21.69% ICF 364 2.15% 18 to 21 yrs 1,667 9.85%
Two 914 5.40% Dev Center 113 0.67% 22 to 31 yrs 3,392 20.04%
3 or More 443 2.62% Technology Dependent: SNF 73 0.43% 32 to 41 yrs 1,883 11.13%
No 16,327 96.47% Other 135 0.80% 42 to 51 yrs 1,288 7.61%
Yes 598** 3.53% 52 to 61 yrs 1,311 7.75%
Dual Diagnoses: 62 and Older 845 4.99%
No 14,343 84.74%
Yes 2,582 15.26% Vision Problems:
No 14,993 88.58% Evaluation Scale Averages: Ethnicity:
Yes 1,932 11.42% (1=Disable 5=Able) Asian 2,162 12.77%
Behavioral Medication: Black/Af Am 3,121 18.44%
No 14,162 83.68% Hearing Problems: Practical Independence 4.33 Filipino 793 4.69%
Yes 2,763 16.32% No 15,853 93.67% Personal & Social Skills 3.38 Hispanic 3,460 20.44%
Yes 1,072 6.33% Challenging Behavior 4.35 Native Am 36 0.21%
Social Integration 3.79 Polynesian 51 0.30%
Both Vision and Well Being 4.62 White 5,240 30.96%
Hearing Problems: Other 2,062 12.18%
No 16,513 97.57%
Yes 412 2.43%
* Includes "Not Assessed".
** Includes DC consumers.
Total active consumers with CDERs: 16,925
Note: CDER information not available for all consumers
Source: CDER Master File of Saturday, April 1, 2017 Table #06

State of California
Department of Developmental Services Thursday, April 6, 2017
Consumer Characteristics at the end of March 2017
Eastern Los Angeles Regional Center
Intellectual Disability: Autism: Cerebral Palsy: Epilepsy: Other Developmental
No ID 4,369 45.07% No 5,213 53.78% No 8,644 89.17% No 8,349 86.13% Disabilities:
Mild ID 2,692 27.77% Autism 4,479 46.20% Yes 1,050 10.83% Yes 1,345 13.87% No 8,532 88.01%
Moderate 1,136 11.72% PDD 2 0.02% Only 120 1.24% Only 93 0.96% Yes 1,162 11.99%
Severe 592 6.11% Only 3,497 36.07% Only 235 2.42%
Profound 399 4.12%
Unspecfd 506 5.22%
Only 2,782 28.70%
Severe Behaviors: Medical Problems: Gender: Recency of Evaluations:
No 7,809 80.55% No 6,989 72.10% Female 3,090 31.88% Under 12 Months 8,717 89.92%
Yes 1,885 19.45% Yes 2,705 27.90% Male 6,604 68.12% 12 to 18 Months 705 7.27%
18 to 24 Months 134 1.38%
24 to 36 Months 85 0.88%
Special Conditions Unable to Walk English Spoken: Over 36 Months 53 0.55%
or Behaviors: (Without Support): (as Primary Language)
None 9,364* 96.60% No 7,748 79.93% No 3,541 36.53%
One 229 2.36% Yes 1,946 20.07% Yes 6,153 63.47% Age Groups:
Two 59 0.61% (Ages 0-2 not collected on CDER)
3 or More 42 0.43% 0 to 2 yrs 9 0.09%
Special Health Care Residence Type: 3 to 5 yrs 789 8.14%
Requirements: Home Prnt/Grdn 8,335 85.98% 6 to 9 yrs 1,298 13.39%
Risk Factors: No 7,734 79.78% Community Care 566 5.84% 10 to 13 yrs 1,243 12.82%
None 7,786* 80.32% Yes 1,960** 20.22% Indep Living 483 4.98% 14 to 17 yrs 1,074 11.08%
One 1,523 15.71% ICF 98 1.01% 18 to 21 yrs 1,031 10.64%
Two 295 3.04% Dev Center 14 0.14% 22 to 31 yrs 1,808 18.65%
3 or More 90 0.93% Technology Dependent: SNF 28 0.29% 32 to 41 yrs 932 9.61%
No 9,275 95.68% Other 170 1.75% 42 to 51 yrs 711 7.33%
Yes 419** 4.32% 52 to 61 yrs 509 5.25%
Dual Diagnoses: 62 and Older 290 2.99%
No 7,669 79.11%
Yes 2,025 20.89% Vision Problems:
No 8,704 89.79% Evaluation Scale Averages: Ethnicity:
Yes 990 10.21% (1=Disable 5=Able) Asian 1,134 11.70%
Behavioral Medication: Black/Af Am 141 1.45%
No 8,695 89.69% Hearing Problems: Practical Independence 4.29 Filipino 148 1.53%
Yes 999 10.31% No 9,185 94.75% Personal & Social Skills 3.19 Hispanic 6,761 69.74%
Yes 509 5.25% Challenging Behavior 4.15 Native Am 11 0.11%
Social Integration 3.75 Polynesian 5 0.05%
Both Vision and Well Being 4.57 White 1,093 11.28%
Hearing Problems: Other 401 4.14%
No 9,465 97.64%
Yes 229 2.36%
* Includes "Not Assessed".
** Includes DC consumers.
Total active consumers with CDERs: 9,694
Note: CDER information not available for all consumers
Source: CDER Master File of Saturday, April 1, 2017 Table #07

State of California
Department of Developmental Services Thursday, April 6, 2017
Consumer Characteristics at the end of March 2017
Far Northern Regional Center
Intellectual Disability: Autism: Cerebral Palsy: Epilepsy: Other Developmental
No ID 2,551 38.24% No 4,676 70.09% No 5,919 88.73% No 5,780 86.64% Disabilities:
Mild ID 2,872 43.05% Autism 1,995 29.91% Yes 752 11.27% Yes 891 13.36% No 6,114 91.65%
Moderate 749 11.23% Only 1,585 23.76% Only 225 3.37% Only 132 1.98% Yes 557 8.35%
Severe 257 3.85% Only 430 6.45%
Profound 108 1.62%
Unspecfd 134 2.01%
Only 2,923 43.82%
Severe Behaviors: Medical Problems: Gender: Recency of Evaluations:
No 5,374 80.56% No 4,635 69.48% Female 2,530 37.93% Under 12 Months 5,585 83.72%
Yes 1,297 19.44% Yes 2,036 30.52% Male 4,141 62.07% 12 to 18 Months 650 9.74%
18 to 24 Months 187 2.80%
24 to 36 Months 200 3.00%
Special Conditions Unable to Walk English Spoken: Over 36 Months 49 0.73%
or Behaviors: (Without Support): (as Primary Language)
None 5,923* 88.79% No 5,329 79.88% No 415 6.22%
One 402 6.03% Yes 1,342 20.12% Yes 6,256 93.78% Age Groups:
Two 178 2.67% (Ages 0-2 not collected on CDER)
3 or More 168 2.52% 0 to 2 yrs 4 0.06%
Special Health Care Residence Type: 3 to 5 yrs 495 7.42%
Requirements: Home Prnt/Grdn 4,054 60.77% 6 to 9 yrs 676 10.13%
Risk Factors: No 5,058 75.82% Community Care 823 12.34% 10 to 13 yrs 573 8.59%
None 4,952* 74.23% Yes 1,613** 24.18% Indep Living 1,562 23.41% 14 to 17 yrs 534 8.00%
One 1,098 16.46% ICF 151 2.26% 18 to 21 yrs 479 7.18%
Two 367 5.50% Dev Center 20 0.30% 22 to 31 yrs 1,260 18.89%
3 or More 254 3.81% Technology Dependent: SNF 14 0.21% 32 to 41 yrs 912 13.67%
No 6,203 92.98% Other 47 0.70% 42 to 51 yrs 646 9.68%
Yes 468** 7.02% 52 to 61 yrs 650 9.74%
Dual Diagnoses: 62 and Older 442 6.63%
No 5,414 81.16%
Yes 1,257 18.84% Vision Problems:
No 5,924 88.80% Evaluation Scale Averages: Ethnicity:
Yes 747 11.20% (1=Disable 5=Able) Asian 152 2.28%
Behavioral Medication: Black/Af Am 154 2.31%
No 5,559 83.33% Hearing Problems: Practical Independence 4.40 Filipino 18 0.27%
Yes 1,112 16.67% No 6,395 95.86% Personal & Social Skills 3.51 Hispanic 697 10.45%
Yes 276 4.14% Challenging Behavior 4.17 Native Am 131 1.96%
Social Integration 3.88 Polynesian 6 0.09%
Both Vision and Well Being 4.61 White 5,134 76.96%
Hearing Problems: Other 379 5.68%
No 6,578 98.61%
Yes 93 1.39%
* Includes "Not Assessed".
** Includes DC consumers.
Total active consumers with CDERs: 6,671
Note: CDER information not available for all consumers
Source: CDER Master File of Saturday, April 1, 2017 Table #08

State of California
Department of Developmental Services Thursday, April 6, 2017
Consumer Characteristics at the end of March 2017
Frank D. Lanterman Regional Center
Intellectual Disability: Autism: Cerebral Palsy: Epilepsy: Other Developmental
No ID 4,059 50.66% No 3,990 49.79% No 7,166 89.43% No 6,879 85.85% Disabilities:
Mild ID 2,184 27.26% Autism 4,023 50.21% Yes 847 10.57% Yes 1,134 14.15% No 7,246 90.43%
Moderate 745 9.30% Only 3,303 41.22% Only 156 1.95% Only 136 1.70% Yes 767 9.57%
Severe 414 5.17% Only 144 1.80%
Profound 337 4.21%
Unspecfd 274 3.42%
Only 2,081 25.97%
Severe Behaviors: Medical Problems: Gender: Recency of Evaluations:
No 6,554 81.79% No 7,003 87.40% Female 2,463 30.74% Under 12 Months 6,454 80.54%
Yes 1,459 18.21% Yes 1,010 12.60% Male 5,550 69.26% 12 to 18 Months 1,048 13.08%
18 to 24 Months 290 3.62%
24 to 36 Months 180 2.25%
Special Conditions Unable to Walk English Spoken: Over 36 Months 41 0.51%
or Behaviors: (Without Support): (as Primary Language)
None 7,655* 95.53% No 6,446 80.44% No 3,266 40.76%
One 206 2.57% Yes 1,567 19.56% Yes 4,747 59.24% Age Groups:
Two 78 0.97% (Ages 0-2 not collected on CDER)
3 or More 74 0.92% 0 to 2 yrs 1 0.01%
Special Health Care Residence Type: 3 to 5 yrs 731 9.12%
Requirements: Home Prnt/Grdn 6,598 82.34% 6 to 9 yrs 1,206 15.05%
Risk Factors: No 7,261 90.62% Community Care 751 9.37% 10 to 13 yrs 1,048 13.08%
None 6,425* 80.18% Yes 752** 9.38% Indep Living 423 5.28% 14 to 17 yrs 882 11.01%
One 1,219 15.21% ICF 134 1.67% 18 to 21 yrs 784 9.78%
Two 280 3.49% Dev Center 8 0.10% 22 to 31 yrs 1,332 16.62%
3 or More 89 1.11% Technology Dependent: SNF 68 0.85% 32 to 41 yrs 677 8.45%
No 7,855 98.03% Other 31 0.39% 42 to 51 yrs 518 6.46%
Yes 158** 1.97% 52 to 61 yrs 483 6.03%
Dual Diagnoses: 62 and Older 351 4.38%
No 7,305 91.16%
Yes 708 8.84% Vision Problems:
No 7,355 91.79% Evaluation Scale Averages: Ethnicity:
Yes 658 8.21% (1=Disable 5=Able) Asian 702 8.76%
Behavioral Medication: Black/Af Am 532 6.64%
No 6,860 85.61% Hearing Problems: Practical Independence 4.28 Filipino 339 4.23%
Yes 1,153 14.39% No 7,711 96.23% Personal & Social Skills 3.18 Hispanic 3,541 44.19%
Yes 302 3.77% Challenging Behavior 4.20 Native Am 9 0.11%
Social Integration 3.41 Polynesian 6 0.07%
Both Vision and Well Being 4.56 White 2,308 28.80%
Hearing Problems: Other 576 7.19%
No 7,903 98.63%
Yes 110 1.37%
* Includes "Not Assessed".
** Includes DC consumers.
Total active consumers with CDERs: 8,013
Note: CDER information not available for all consumers
Source: CDER Master File of Saturday, April 1, 2017 Table #09

State of California
Department of Developmental Services Thursday, April 6, 2017
Consumer Characteristics at the end of March 2017
Golden Gate Regional Center
Intellectual Disability: Autism: Cerebral Palsy: Epilepsy: Other Developmental
No ID 2,774 35.77% No 6,001 77.37% No 6,537 84.28% No 6,498 83.78% Disabilities:
Mild ID 2,397 30.91% Autism 1,755 22.63% Yes 1,219 15.72% Yes 1,258 16.22% No 6,485 83.61%
Moderate 1,147 14.79% Only 1,072 13.82% Only 245 3.16% Only 70 0.90% Yes 1,271 16.39%
Severe 488 6.29% Only 1,002 12.92%
Profound 336 4.33%
Unspecfd 614 7.92%
Only 3,100 39.97%
Severe Behaviors: Medical Problems: Gender: Recency of Evaluations:
No 6,179 79.67% No 6,726 86.72% Female 3,005 38.74% Under 12 Months 6,790 87.55%
Yes 1,577 20.33% Yes 1,030 13.28% Male 4,751 61.26% 12 to 18 Months 813 10.48%
18 to 24 Months 85 1.10%
24 to 36 Months 50 0.64%
Special Conditions Unable to Walk English Spoken: Over 36 Months 18 0.23%
or Behaviors: (Without Support): (as Primary Language)
None 7,457* 96.14% No 5,848 75.40% No 2,122 27.36%
One 157 2.02% Yes 1,908 24.60% Yes 5,634 72.64% Age Groups:
Two 82 1.06% (Ages 0-2 not collected on CDER)
3 or More 60 0.77% 3 to 5 yrs 392 5.05%
Special Health Care Residence Type: 6 to 9 yrs 651 8.39%
Requirements: Home Prnt/Grdn 5,282 68.10% 10 to 13 yrs 650 8.38%
Risk Factors: No 6,476 83.50% Community Care 1,191 15.36% 14 to 17 yrs 663 8.55%
None 6,078* 78.37% Yes 1,280** 16.50% Indep Living 836 10.78% 18 to 21 yrs 683 8.81%
One 1,347 17.37% ICF 243 3.13% 22 to 31 yrs 1,495 19.28%
Two 247 3.18% Dev Center 80 1.03% 32 to 41 yrs 905 11.67%
3 or More 84 1.08% Technology Dependent: SNF 46 0.59% 42 to 51 yrs 828 10.68%
No 7,580 97.73% Other 78 1.01% 52 to 61 yrs 848 10.93%
Yes 176** 2.27% 62 and Older 641 8.26%
Dual Diagnoses:
No 7,156 92.26%
Yes 600 7.74% Vision Problems:
No 6,955 89.67% Evaluation Scale Averages: Ethnicity:
Yes 801 10.33% (1=Disable 5=Able) Asian 1,287 16.59%
Behavioral Medication: Black/Af Am 676 8.72%
No 6,510 83.94% Hearing Problems: Practical Independence 4.26 Filipino 585 7.54%
Yes 1,246 16.06% No 7,321 94.39% Personal & Social Skills 3.26 Hispanic 1,570 20.24%
Yes 435 5.61% Challenging Behavior 4.13 Native Am 6 0.08%
Social Integration 3.64 Polynesian 71 0.92%
Both Vision and Well Being 4.60 White 2,789 35.96%
Hearing Problems: Other 772 9.95%
No 7,593 97.90%
Yes 163 2.10%
* Includes "Not Assessed".
** Includes DC consumers.
Total active consumers with CDERs: 7,756
Note: CDER information not available for all consumers
Source: CDER Master File of Saturday, April 1, 2017 Table #10

State of California
Department of Developmental Services Thursday, April 6, 2017
Consumer Characteristics at the end of March 2017
Harbor Regional Center
Intellectual Disability: Autism: Cerebral Palsy: Epilepsy: Other Developmental
No ID 4,452 41.60% No 6,261 58.51% No 9,610 89.80% No 9,471 88.51% Disabilities:
Mild ID 3,382 31.60% Autism 4,440 41.49% Yes 1,091 10.20% Yes 1,230 11.49% No 9,543 89.18%
Moderate 1,184 11.06% Only 3,279 30.64% Only 186 1.74% Only 84 0.78% Yes 1,158 10.82%
Severe 506 4.73% Only 583 5.45%
Profound 364 3.40%
Unspecfd 813 7.60%
Only 3,654 34.15%
Severe Behaviors: Medical Problems: Gender: Recency of Evaluations:
No 8,958 83.71% No 8,821 82.43% Female 3,601 33.65% Under 12 Months 9,649 90.17%
Yes 1,743 16.29% Yes 1,880 17.57% Male 7,100 66.35% 12 to 18 Months 894 8.35%
18 to 24 Months 88 0.82%
24 to 36 Months 40 0.37%
Special Conditions Unable to Walk English Spoken: Over 36 Months 30 0.28%
or Behaviors: (Without Support): (as Primary Language)
None 10,149* 94.84% No 8,597 80.34% No 2,424 22.65%
One 331 3.09% Yes 2,104 19.66% Yes 8,277 77.35% Age Groups:
Two 127 1.19% (Ages 0-2 not collected on CDER)
3 or More 94 0.88% 0 to 2 yrs 2 0.02%
Special Health Care Residence Type: 3 to 5 yrs 1,033 9.65%
Requirements: Home Prnt/Grdn 8,657 80.90% 6 to 9 yrs 1,283 11.99%
Risk Factors: No 9,314 87.04% Community Care 938 8.77% 10 to 13 yrs 1,133 10.59%
None 9,279* 86.71% Yes 1,387** 12.96% Indep Living 821 7.67% 14 to 17 yrs 1,090 10.19%
One 1,061 9.91% ICF 176 1.64% 18 to 21 yrs 1,229 11.48%
Two 246 2.30% Dev Center 9 0.08% 22 to 31 yrs 2,126 19.87%
3 or More 115 1.07% Technology Dependent: SNF 43 0.40% 32 to 41 yrs 985 9.20%
No 10,407 97.25% Other 57 0.53% 42 to 51 yrs 734 6.86%
Yes 294** 2.75% 52 to 61 yrs 700 6.54%
Dual Diagnoses: 62 and Older 386 3.61%
No 9,746 91.08%
Yes 955 8.92% Vision Problems:
No 9,558 89.32% Evaluation Scale Averages: Ethnicity:
Yes 1,143 10.68% (1=Disable 5=Able) Asian 924 8.63%
Behavioral Medication: Black/Af Am 1,296 12.11%
No 9,246 86.40% Hearing Problems: Practical Independence 4.36 Filipino 500 4.67%
Yes 1,455 13.60% No 10,033 93.76% Personal & Social Skills 3.41 Hispanic 4,207 39.31%
Yes 668 6.24% Challenging Behavior 4.26 Native Am 15 0.14%
Social Integration 3.52 Polynesian 58 0.54%
Both Vision and Well Being 4.76 White 2,715 25.37%
Hearing Problems: Other 986 9.21%
No 10,348 96.70%
Yes 353 3.30%
* Includes "Not Assessed".
** Includes DC consumers.
Total active consumers with CDERs: 10,701
Note: CDER information not available for all consumers
Source: CDER Master File of Saturday, April 1, 2017 Table #11

State of California
Department of Developmental Services Thursday, April 6, 2017
Consumer Characteristics at the end of March 2017
Inland Regional Center
Intellectual Disability: Autism: Cerebral Palsy: Epilepsy: Other Developmental
No ID 8,317 30.24% No 19,083 69.38% No 22,532 81.92% No 22,757 82.74% Disabilities:
Mild ID 11,191 40.69% Autism 8,146 29.62% Yes 4,972 18.08% Yes 4,747 17.26% No 25,949 94.35%
Moderate 4,218 15.34% PDD 275 1.00% Only 736 2.68% Only 393 1.43% Yes 1,555 5.65%
Severe 2,008 7.30% Only 6,020 21.89% Only 509 1.85%
Profound 1,378 5.01%
Unspecfd 392 1.43%
Only 10,721 38.98%
Severe Behaviors: Medical Problems: Gender: Recency of Evaluations:
No 21,118 76.78% No 19,344 70.33% Female 10,005 36.38% Under 12 Months 24,931 90.64%
Yes 6,386 23.22% Yes 8,160 29.67% Male 17,499 63.62% 12 to 18 Months 1,771 6.44%
18 to 24 Months 55 0.20%
24 to 36 Months 103 0.37%
Special Conditions Unable to Walk English Spoken: Over 36 Months 644 2.34%
or Behaviors: (Without Support): (as Primary Language)
None 25,902* 94.18% No 21,471 78.07% No 6,241 22.69%
One 1,016 3.69% Yes 6,033 21.93% Yes 21,263 77.31% Age Groups:
Two 360 1.31% (Ages 0-2 not collected on CDER)
3 or More 226 0.82% 0 to 2 yrs 7 0.03%
Special Health Care Residence Type: 3 to 5 yrs 2,267 8.24%
Requirements: Home Prnt/Grdn 22,139 80.49% 6 to 9 yrs 3,168 11.52%
Risk Factors: No 20,402 74.18% Community Care 2,468 8.97% 10 to 13 yrs 3,013 10.95%
None 19,549* 71.08% Yes 7,102** 25.82% Indep Living 1,575 5.73% 14 to 17 yrs 2,853 10.37%
One 5,678 20.64% ICF 1,015 3.69% 18 to 21 yrs 2,874 10.45%
Two 1,539 5.60% Dev Center 25 0.09% 22 to 31 yrs 5,865 21.32%
3 or More 738 2.68% Technology Dependent: SNF 83 0.30% 32 to 41 yrs 3,072 11.17%
No 25,332 92.10% Other 199 0.72% 42 to 51 yrs 1,938 7.05%
Yes 2,172** 7.90% 52 to 61 yrs 1,579 5.74%
Dual Diagnoses: 62 and Older 868 3.16%
No 25,509 92.75%
Yes 1,995 7.25% Vision Problems:
No 24,123 87.71% Evaluation Scale Averages: Ethnicity:
Yes 3,381 12.29% (1=Disable 5=Able) Asian 690 2.51%
Behavioral Medication: Black/Af Am 3,279 11.92%
No 23,085 83.93% Hearing Problems: Practical Independence 4.17 Filipino 443 1.61%
Yes 4,419 16.07% No 25,537 92.85% Personal & Social Skills 3.19 Hispanic 12,280 44.65%
Yes 1,967 7.15% Challenging Behavior 4.12 Native Am 87 0.32%
Social Integration 3.44 Polynesian 59 0.21%
Both Vision and Well Being 4.69 White 8,658 31.48%
Hearing Problems: Other 2,008 7.30%
No 26,667 96.96%
Yes 837 3.04%
* Includes "Not Assessed".
** Includes DC consumers.
Total active consumers with CDERs: 27,504
Note: CDER information not available for all consumers
Source: CDER Master File of Saturday, April 1, 2017 Table #12

State of California
Department of Developmental Services Thursday, April 6, 2017
Consumer Characteristics at the end of March 2017
Kern Regional Center
Intellectual Disability: Autism: Cerebral Palsy: Epilepsy: Other Developmental
No ID 2,565 35.00% No 5,018 68.47% No 6,535 89.17% No 6,250 85.28% Disabilities:
Mild ID 2,974 40.58% Autism 2,310 31.52% Yes 794 10.83% Yes 1,079 14.72% No 6,278 85.66%
Moderate 1,014 13.84% PDD 1 0.01% Only 70 0.96% Only 40 0.55% Yes 1,051 14.34%
Severe 450 6.14% Only 1,487 20.29% Only 566 7.72%
Profound 239 3.26%
Unspecfd 87 1.19%
Only 2,934 40.03%
Severe Behaviors: Medical Problems: Gender: Recency of Evaluations:
No 5,916 80.72% No 6,343 86.55% Female 2,630 35.88% Under 12 Months 6,087 83.05%
Yes 1,413 19.28% Yes 986 13.45% Male 4,699 64.12% 12 to 18 Months 978 13.34%
18 to 24 Months 174 2.37%
24 to 36 Months 82 1.12%
Special Conditions Unable to Walk English Spoken: Over 36 Months 8 0.11%
or Behaviors: (Without Support): (as Primary Language)
None 6,323* 86.27% No 5,966 81.40% No 1,617 22.06%
One 504 6.88% Yes 1,363 18.60% Yes 5,712 77.94% Age Groups:
Two 242 3.30% (Ages 0-2 not collected on CDER)
3 or More 260 3.55% 0 to 2 yrs 2 0.03%
Special Health Care Residence Type: 3 to 5 yrs 547 7.46%
Requirements: Home Prnt/Grdn 5,458 74.47% 6 to 9 yrs 880 12.01%
Risk Factors: No 4,568 62.33% Community Care 688 9.39% 10 to 13 yrs 758 10.34%
None 4,683* 63.90% Yes 2,761** 37.67% Indep Living 909 12.40% 14 to 17 yrs 717 9.78%
One 1,879 25.64% ICF 166 2.26% 18 to 21 yrs 705 9.62%
Two 538 7.34% Dev Center 28 0.38% 22 to 31 yrs 1,518 20.71%
3 or More 229 3.12% Technology Dependent: SNF 30 0.41% 32 to 41 yrs 813 11.09%
No 6,880 93.87% Other 50 0.68% 42 to 51 yrs 583 7.95%
Yes 449** 6.13% 52 to 61 yrs 460 6.28%
Dual Diagnoses: 62 and Older 346 4.72%
No 6,196 84.54%
Yes 1,133 15.46% Vision Problems:
No 6,481 88.43% Evaluation Scale Averages: Ethnicity:
Yes 848 11.57% (1=Disable 5=Able) Asian 105 1.43%
Behavioral Medication: Black/Af Am 626 8.54%
No 5,586 76.22% Hearing Problems: Practical Independence 4.35 Filipino 98 1.34%
Yes 1,743 23.78% No 6,878 93.85% Personal & Social Skills 3.36 Hispanic 3,274 44.67%
Yes 451 6.15% Challenging Behavior 4.15 Native Am 44 0.60%
Social Integration 3.45 Polynesian 5 0.07%
Both Vision and Well Being 4.60 White 2,669 36.42%
Hearing Problems: Other 508 6.93%
No 7,175 97.90%
Yes 154 2.10%
* Includes "Not Assessed".
** Includes DC consumers.
Total active consumers with CDERs: 7,329
Note: CDER information not available for all consumers
Source: CDER Master File of Saturday, April 1, 2017 Table #13

State of California
Department of Developmental Services Thursday, April 6, 2017
Consumer Characteristics at the end of March 2017
North Bay Regional Center
Intellectual Disability: Autism: Cerebral Palsy: Epilepsy: Other Developmental
No ID 2,619 35.03% No 5,465 73.10% No 6,538 87.45% No 6,354 84.99% Disabilities:
Mild ID 2,263 30.27% Autism 2,006 26.83% Yes 938 12.55% Yes 1,122 15.01% No 6,460 86.41%
Moderate 915 12.24% PDD 5 0.07% Only 145 1.94% Only 125 1.67% Yes 1,016 13.59%
Severe 408 5.46% Only 1,421 19.01% Only 641 8.57%
Profound 252 3.37%
Unspecfd 1,019 13.63%
Only 3,111 41.61%
Severe Behaviors: Medical Problems: Gender: Recency of Evaluations:
No 6,057 81.02% No 5,062 67.71% Female 2,762 36.94% Under 12 Months 5,074 67.87%
Yes 1,419 18.98% Yes 2,414 32.29% Male 4,714 63.06% 12 to 18 Months 977 13.07%
18 to 24 Months 604 8.08%
24 to 36 Months 741 9.91%
Special Conditions Unable to Walk English Spoken: Over 36 Months 80 1.07%
or Behaviors: (Without Support): (as Primary Language)
None 6,639* 88.80% No 5,775 77.25% No 1,158 15.49%
One 434 5.81% Yes 1,701 22.75% Yes 6,318 84.51% Age Groups:
Two 253 3.38% (Ages 0-2 not collected on CDER)
3 or More 150 2.01% 0 to 2 yrs 9 0.12%
Special Health Care Residence Type: 3 to 5 yrs 392 5.24%
Requirements: Home Prnt/Grdn 4,862 65.03% 6 to 9 yrs 580 7.76%
Risk Factors: No 6,080 81.33% Community Care 866 11.58% 10 to 13 yrs 711 9.51%
None 5,593* 74.81% Yes 1,396** 18.67% Indep Living 1,288 17.23% 14 to 17 yrs 657 8.79%
One 1,273 17.03% ICF 241 3.22% 18 to 21 yrs 708 9.47%
Two 342 4.57% Dev Center 90 1.20% 22 to 31 yrs 1,678 22.45%
3 or More 268 3.58% Technology Dependent: SNF 56 0.75% 32 to 41 yrs 867 11.60%
No 7,178 96.01% Other 73 0.98% 42 to 51 yrs 648 8.67%
Yes 298** 3.99% 52 to 61 yrs 679 9.08%
Dual Diagnoses: 62 and Older 547 7.32%
No 5,775 77.25%
Yes 1,701 22.75% Vision Problems:
No 6,227 83.29% Evaluation Scale Averages: Ethnicity:
Yes 1,249 16.71% (1=Disable 5=Able) Asian 156 2.09%
Behavioral Medication: Black/Af Am 765 10.23%
No 6,204 82.99% Hearing Problems: Practical Independence 4.31 Filipino 291 3.89%
Yes 1,272 17.01% No 6,862 91.79% Personal & Social Skills 3.40 Hispanic 1,511 20.21%
Yes 614 8.21% Challenging Behavior 4.18 Native Am 24 0.32%
Social Integration 3.56 Polynesian 22 0.29%
Both Vision and Well Being 4.63 White 3,850 51.50%
Hearing Problems: Other 857 11.46%
No 7,203 96.35%
Yes 273 3.65%
* Includes "Not Assessed".
** Includes DC consumers.
Total active consumers with CDERs: 7,476
Note: CDER information not available for all consumers
Source: CDER Master File of Saturday, April 1, 2017 Table #14

State of California
Department of Developmental Services Thursday, April 6, 2017
Consumer Characteristics at the end of March 2017
North Los Angeles Regional Center
Intellectual Disability: Autism: Cerebral Palsy: Epilepsy: Other Developmental
No ID 9,698 48.48% No 10,641 53.19% No 17,509 87.53% No 17,719 88.58% Disabilities:
Mild ID 5,900 29.49% Autism 9,363 46.81% Yes 2,495 12.47% Yes 2,285 11.42% No 18,727 93.62%
Moderate 2,012 10.06% Only 7,658 38.28% Only 403 2.01% Only 136 0.68% Yes 1,277 6.38%
Severe 726 3.63% Only 1,099 5.49%
Profound 492 2.46%
Unspecfd 1,176 5.88%
Only 6,093 30.46%
Severe Behaviors: Medical Problems: Gender: Recency of Evaluations:
No 16,369 81.83% No 17,612 88.04% Female 6,409 32.04% Under 12 Months 16,350 81.73%
Yes 3,635 18.17% Yes 2,392 11.96% Male 13,595 67.96% 12 to 18 Months 2,145 10.72%
18 to 24 Months 825 4.12%
24 to 36 Months 549 2.74%
Special Conditions Unable to Walk English Spoken: Over 36 Months 135 0.67%
or Behaviors: (Without Support): (as Primary Language)
None 19,404* 97.00% No 16,339 81.68% No 5,252 26.25%
One 365 1.82% Yes 3,665 18.32% Yes 14,752 73.75% Age Groups:
Two 143 0.71% (Ages 0-2 not collected on CDER)
3 or More 92 0.46% 0 to 2 yrs 6 0.03%
Special Health Care Residence Type: 3 to 5 yrs 1,899 9.49%
Requirements: Home Prnt/Grdn 16,267 81.32% 6 to 9 yrs 2,863 14.31%
Risk Factors: No 16,655 83.26% Community Care 1,394 6.97% 10 to 13 yrs 2,571 12.85%
None 17,887* 89.42% Yes 3,349** 16.74% Indep Living 1,540 7.70% 14 to 17 yrs 2,246 11.23%
One 1,760 8.80% ICF 567 2.83% 18 to 21 yrs 2,128 10.64%
Two 248 1.24% Dev Center 26 0.13% 22 to 31 yrs 3,753 18.76%
3 or More 109 0.54% Technology Dependent: SNF 65 0.32% 32 to 41 yrs 1,715 8.57%
No 19,068 95.32% Other 145 0.72% 42 to 51 yrs 1,163 5.81%
Yes 936** 4.68% 52 to 61 yrs 1,053 5.26%
Dual Diagnoses: 62 and Older 607 3.03%
No 18,333 91.65%
Yes 1,671 8.35% Vision Problems:
No 18,483 92.40% Evaluation Scale Averages: Ethnicity:
Yes 1,521 7.60% (1=Disable 5=Able) Asian 703 3.51%
Behavioral Medication: Black/Af Am 2,163 10.81%
No 16,657 83.27% Hearing Problems: Practical Independence 4.36 Filipino 548 2.74%
Yes 3,347 16.73% No 19,349 96.73% Personal & Social Skills 3.37 Hispanic 8,557 42.78%
Yes 655 3.27% Challenging Behavior 4.21 Native Am 31 0.15%
Social Integration 3.46 Polynesian 17 0.08%
Both Vision and Well Being 4.59 White 6,843 34.21%
Hearing Problems: Other 1,142 5.71%
No 19,730 98.63%
Yes 274 1.37%
* Includes "Not Assessed".
** Includes DC consumers.
Total active consumers with CDERs: 20,004
Note: CDER information not available for all consumers
Source: CDER Master File of Saturday, April 1, 2017 Table #15

State of California
Department of Developmental Services Thursday, April 6, 2017
Consumer Characteristics at the end of March 2017
Orange County Regional Center
Intellectual Disability: Autism: Cerebral Palsy: Epilepsy: Other Developmental
No ID 5,231 30.56% No 11,080 64.72% No 14,232 83.14% No 14,192 82.90% Disabilities:
Mild ID 5,305 30.99% Autism 6,039 35.28% Yes 2,887 16.86% Yes 2,927 17.10% No 16,058 93.80%
Moderate 2,519 14.71% Only 3,542 20.69% Only 376 2.20% Only 145 0.85% Yes 1,061 6.20%
Severe 1,074 6.27% Only 674 3.94%
Profound 513 3.00%
Unspecfd 2,477 14.47%
Only 6,219 36.33%
Severe Behaviors: Medical Problems: Gender: Recency of Evaluations:
No 13,596 79.42% No 10,924 63.81% Female 6,120 35.75% Under 12 Months 16,318 95.32%
Yes 3,523 20.58% Yes 6,195 36.19% Male 10,999 64.25% 12 to 18 Months 735 4.29%
18 to 24 Months 32 0.19%
24 to 36 Months 20 0.12%
Special Conditions Unable to Walk English Spoken: Over 36 Months 14 0.08%
or Behaviors: (Without Support): (as Primary Language)
None 16,149* 94.33% No 13,183 77.01% No 4,463 26.07%
One 638 3.73% Yes 3,936 22.99% Yes 12,656 73.93% Age Groups:
Two 207 1.21% (Ages 0-2 not collected on CDER)
3 or More 125 0.73% 0 to 2 yrs 1 0.01%
Special Health Care Residence Type: 3 to 5 yrs 1,066 6.23%
Requirements: Home Prnt/Grdn 13,054 76.25% 6 to 9 yrs 1,831 10.70%
Risk Factors: No 12,863 75.14% Community Care 1,732 10.12% 10 to 13 yrs 1,936 11.31%
None 12,740* 74.42% Yes 4,256** 24.86% Indep Living 1,308 7.64% 14 to 17 yrs 1,738 10.15%
One 3,595 21.00% ICF 785 4.59% 18 to 21 yrs 1,883 11.00%
Two 580 3.39% Dev Center 69 0.40% 22 to 31 yrs 3,538 20.67%
3 or More 204 1.19% Technology Dependent: SNF 93 0.54% 32 to 41 yrs 1,798 10.50%
No 15,915 92.97% Other 78 0.46% 42 to 51 yrs 1,375 8.03%
Yes 1,204** 7.03% 52 to 61 yrs 1,270 7.42%
Dual Diagnoses: 62 and Older 683 3.99%
No 13,932 81.38%
Yes 3,187 18.62% Vision Problems:
No 15,171 88.62% Evaluation Scale Averages: Ethnicity:
Yes 1,948 11.38% (1=Disable 5=Able) Asian 2,307 13.48%
Behavioral Medication: Black/Af Am 369 2.16%
No 13,788 80.54% Hearing Problems: Practical Independence 4.25 Filipino 346 2.02%
Yes 3,331 19.46% No 15,943 93.13% Personal & Social Skills 3.25 Hispanic 5,436 31.75%
Yes 1,176 6.87% Challenging Behavior 4.15 Native Am 28 0.16%
Social Integration 3.32 Polynesian 17 0.10%
Both Vision and Well Being 4.62 White 6,453 37.69%
Hearing Problems: Other 2,163 12.64%
No 16,684 97.46%
Yes 435 2.54%
* Includes "Not Assessed".
** Includes DC consumers.
Total active consumers with CDERs: 17,119
Note: CDER information not available for all consumers
Source: CDER Master File of Saturday, April 1, 2017 Table #16
State of California
Department of Developmental Services Thursday, April 6, 2017
Consumer Characteristics at the end of March 2017
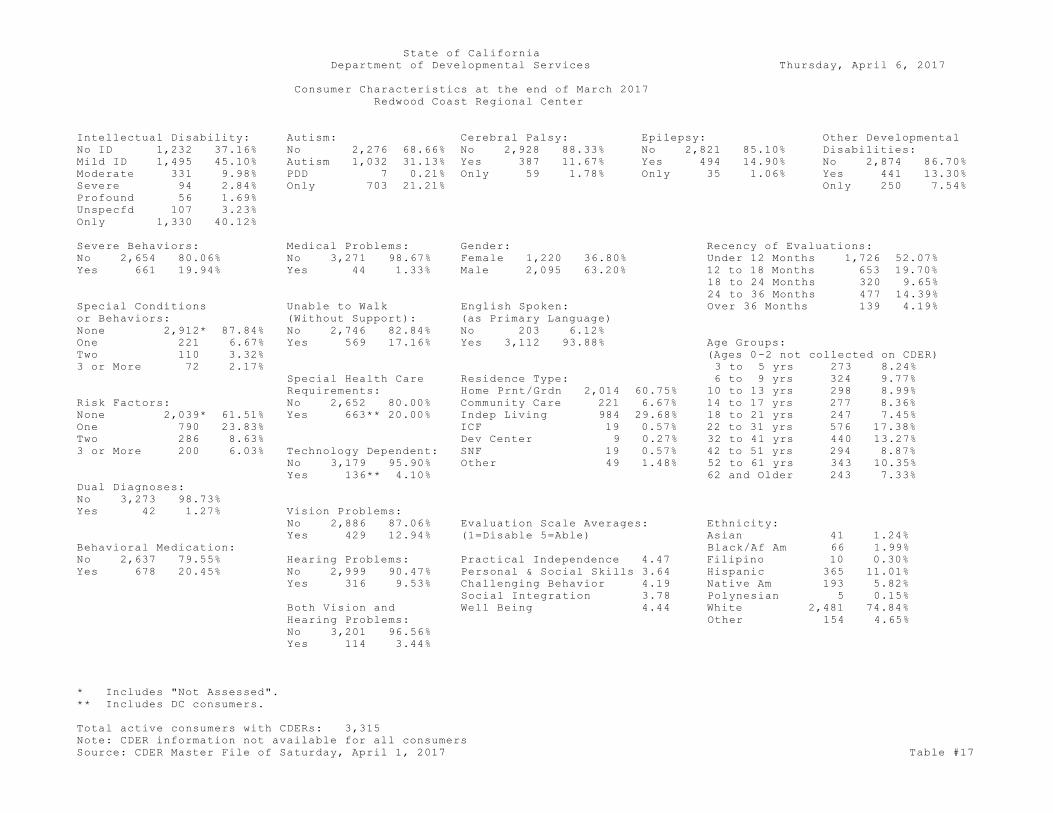
Redwood Coast Regional Center
Intellectual Disability: Autism: Cerebral Palsy: Epilepsy: Other Developmental
No ID 1,232 37.16% No 2,276 68.66% No 2,928 88.33% No 2,821 85.10% Disabilities:
Mild ID 1,495 45.10% Autism 1,032 31.13% Yes 387 11.67% Yes 494 14.90% No 2,874 86.70%
Moderate 331 9.98% PDD 7 0.21% Only 59 1.78% Only 35 1.06% Yes 441 13.30%
Severe 94 2.84% Only 703 21.21% Only 250 7.54%
Profound 56 1.69%
Unspecfd 107 3.23%
Only 1,330 40.12%
Severe Behaviors: Medical Problems: Gender: Recency of Evaluations:
No 2,654 80.06% No 3,271 98.67% Female 1,220 36.80% Under 12 Months 1,726 52.07%
Yes 661 19.94% Yes 44 1.33% Male 2,095 63.20% 12 to 18 Months 653 19.70%
18 to 24 Months 320 9.65%
24 to 36 Months 477 14.39%
Special Conditions Unable to Walk English Spoken: Over 36 Months 139 4.19%
or Behaviors: (Without Support): (as Primary Language)
None 2,912* 87.84% No 2,746 82.84% No 203 6.12%
One 221 6.67% Yes 569 17.16% Yes 3,112 93.88% Age Groups:
Two 110 3.32% (Ages 0-2 not collected on CDER)
3 or More 72 2.17% 3 to 5 yrs 273 8.24%
Special Health Care Residence Type: 6 to 9 yrs 324 9.77%
Requirements: Home Prnt/Grdn 2,014 60.75% 10 to 13 yrs 298 8.99%
Risk Factors: No 2,652 80.00% Community Care 221 6.67% 14 to 17 yrs 277 8.36%
None 2,039* 61.51% Yes 663** 20.00% Indep Living 984 29.68% 18 to 21 yrs 247 7.45%
One 790 23.83% ICF 19 0.57% 22 to 31 yrs 576 17.38%
Two 286 8.63% Dev Center 9 0.27% 32 to 41 yrs 440 13.27%
3 or More 200 6.03% Technology Dependent: SNF 19 0.57% 42 to 51 yrs 294 8.87%
No 3,179 95.90% Other 49 1.48% 52 to 61 yrs 343 10.35%
Yes 136** 4.10% 62 and Older 243 7.33%
Dual Diagnoses:
No 3,273 98.73%
Yes 42 1.27% Vision Problems:
No 2,886 87.06% Evaluation Scale Averages: Ethnicity:
Yes 429 12.94% (1=Disable 5=Able) Asian 41 1.24%
Behavioral Medication: Black/Af Am 66 1.99%
No 2,637 79.55% Hearing Problems: Practical Independence 4.47 Filipino 10 0.30%
Yes 678 20.45% No 2,999 90.47% Personal & Social Skills 3.64 Hispanic 365 11.01%
Yes 316 9.53% Challenging Behavior 4.19 Native Am 193 5.82%
Social Integration 3.78 Polynesian 5 0.15%
Both Vision and Well Being 4.44 White 2,481 74.84%
Hearing Problems: Other 154 4.65%
No 3,201 96.56%
Yes 114 3.44%
* Includes "Not Assessed".
** Includes DC consumers.
Total active consumers with CDERs: 3,315
Note: CDER information not available for all consumers
Source: CDER Master File of Saturday, April 1, 2017 Table #17

State of California
Department of Developmental Services Thursday, April 6, 2017
Consumer Characteristics at the end of March 2017
San Andreas Regional Center
Intellectual Disability: Autism: Cerebral Palsy: Epilepsy: Other Developmental
No ID 5,719 40.79% No 9,107 64.96% No 12,534 89.40% No 12,314 87.83% Disabilities:
Mild ID 2,809 20.04% Autism 4,902 34.96% Yes 1,486 10.60% Yes 1,706 12.17% No 12,478 89.00%
Moderate 1,728 12.33% PDD 11 0.08% Only 346 2.47% Only 147 1.05% Yes 1,542 11.00%
Severe 642 4.58% Only 3,688 26.31% Only 1,047 7.47%
Profound 325 2.32%
Unspecfd 2,797 19.95%
Only 5,410 38.59%
Severe Behaviors: Medical Problems: Gender: Recency of Evaluations:
No 11,609 82.80% No 11,656 83.14% Female 4,782 34.11% Under 12 Months 12,492 89.10%
Yes 2,411 17.20% Yes 2,364 16.86% Male 9,238 65.89% 12 to 18 Months 1,252 8.93%
18 to 24 Months 174 1.24%
24 to 36 Months 48 0.34%
Special Conditions Unable to Walk English Spoken: Over 36 Months 54 0.39%
or Behaviors: (Without Support): (as Primary Language)
None 13,486* 96.19% No 10,958 78.16% No 4,244 30.27%
One 323 2.30% Yes 3,062 21.84% Yes 9,776 69.73% Age Groups:
Two 129 0.92% (Ages 0-2 not collected on CDER)
3 or More 82 0.58% 0 to 2 yrs 4 0.03%
Special Health Care Residence Type: 3 to 5 yrs 967 6.90%
Requirements: Home Prnt/Grdn 10,866 77.50% 6 to 9 yrs 1,491 10.63%
Risk Factors: No 11,937 85.14% Community Care 1,677 11.96% 10 to 13 yrs 1,587 11.32%
None 11,356* 81.00% Yes 2,083** 14.86% Indep Living 1,124 8.02% 14 to 17 yrs 1,548 11.04%
One 1,979 14.12% ICF 200 1.43% 18 to 21 yrs 1,515 10.81%
Two 431 3.07% Dev Center 10 0.07% 22 to 31 yrs 2,780 19.83%
3 or More 254 1.81% Technology Dependent: SNF 31 0.22% 32 to 41 yrs 1,458 10.40%
No 13,441 95.87% Other 112 0.80% 42 to 51 yrs 1,055 7.52%
Yes 579** 4.13% 52 to 61 yrs 1,018 7.26%
Dual Diagnoses: 62 and Older 597 4.26%
No 13,026 92.91%
Yes 994 7.09% Vision Problems:
No 12,627 90.06% Evaluation Scale Averages: Ethnicity:
Yes 1,393 9.94% (1=Disable 5=Able) Asian 2,339 16.68%
Behavioral Medication: Black/Af Am 374 2.67%
No 12,416 88.56% Hearing Problems: Practical Independence 4.24 Filipino 487 3.47%
Yes 1,604 11.44% No 13,411 95.66% Personal & Social Skills 3.07 Hispanic 4,881 34.81%
Yes 609 4.34% Challenging Behavior 4.23 Native Am 26 0.19%
Social Integration 3.28 Polynesian 36 0.26%
Both Vision and Well Being 4.58 White 4,525 32.28%
Hearing Problems: Other 1,352 9.64%
No 13,768 98.20%
Yes 252 1.80%
* Includes "Not Assessed".
** Includes DC consumers.
Total active consumers with CDERs: 14,020
Note: CDER information not available for all consumers
Source: CDER Master File of Saturday, April 1, 2017 Table #18

State of California
Department of Developmental Services Thursday, April 6, 2017
Consumer Characteristics at the end of March 2017
San Diego Regional Center
Intellectual Disability: Autism: Cerebral Palsy: Epilepsy: Other Developmental
No ID 6,797 31.51% No 13,457 62.39% No 18,207 84.41% No 18,312 84.90% Disabilities:
Mild ID 7,670 35.56% Autism 8,107 37.59% Yes 3,362 15.59% Yes 3,257 15.10% No 20,017 92.80%
Moderate 3,661 16.97% PDD 5 0.02% Only 560 2.60% Only 208 0.96% Yes 1,552 7.20%
Severe 1,409 6.53% Only 5,047 23.40% Only 531 2.46%
Profound 560 2.60%
Unspecfd 1,472 6.82%
Only 7,445 34.52%
Severe Behaviors: Medical Problems: Gender: Recency of Evaluations:
No 17,109 79.32% No 20,135 93.35% Female 7,493 34.74% Under 12 Months 18,098 83.91%
Yes 4,460 20.68% Yes 1,434 6.65% Male 14,076 65.26% 12 to 18 Months 2,158 10.01%
18 to 24 Months 662 3.07%
24 to 36 Months 427 1.98%
Special Conditions Unable to Walk English Spoken: Over 36 Months 224 1.04%
or Behaviors: (Without Support): (as Primary Language)
None 20,176* 93.54% No 17,058 79.09% No 5,258 24.38%
One 812 3.76% Yes 4,511 20.91% Yes 16,311 75.62% Age Groups:
Two 353 1.64% (Ages 0-2 not collected on CDER)
3 or More 228 1.06% 0 to 2 yrs 21 0.10%
Special Health Care Residence Type: 3 to 5 yrs 2,216 10.27%
Requirements: Home Prnt/Grdn 16,554 76.75% 6 to 9 yrs 2,707 12.55%
Risk Factors: No 16,673 77.30% Community Care 2,264 10.50% 10 to 13 yrs 2,167 10.05%
None 14,666* 68.00% Yes 4,896** 22.70% Indep Living 1,831 8.49% 14 to 17 yrs 2,012 9.33%
One 4,964 23.01% ICF 626 2.90% 18 to 21 yrs 2,077 9.63%
Two 1,363 6.32% Dev Center 60 0.28% 22 to 31 yrs 4,176 19.36%
3 or More 576 2.67% Technology Dependent: SNF 99 0.46% 32 to 41 yrs 2,352 10.90%
No 20,255 93.91% Other 135 0.63% 42 to 51 yrs 1,657 7.68%
Yes 1,314** 6.09% 52 to 61 yrs 1,412 6.55%
Dual Diagnoses: 62 and Older 772 3.58%
No 20,318 94.20%
Yes 1,251 5.80% Vision Problems:
No 19,334 89.64% Evaluation Scale Averages: Ethnicity:
Yes 2,235 10.36% (1=Disable 5=Able) Asian 833 3.86%
Behavioral Medication: Black/Af Am 1,301 6.03%
No 16,784 77.82% Hearing Problems: Practical Independence 4.27 Filipino 729 3.38%
Yes 4,785 22.18% No 20,408 94.62% Personal & Social Skills 3.20 Hispanic 7,440 34.49%
Yes 1,161 5.38% Challenging Behavior 4.15 Native Am 59 0.27%
Social Integration 3.41 Polynesian 77 0.36%
Both Vision and Well Being 4.63 White 7,052 32.70%
Hearing Problems: Other 4,078 18.91%
No 21,103 97.84%
Yes 466 2.16%
* Includes "Not Assessed".
** Includes DC consumers.
Total active consumers with CDERs: 21,569
Note: CDER information not available for all consumers
Source: CDER Master File of Saturday, April 1, 2017 Table #19

State of California
Department of Developmental Services Thursday, April 6, 2017
Consumer Characteristics at the end of March 2017
San Gabriel-Pomona Regional Center
Intellectual Disability: Autism: Cerebral Palsy: Epilepsy: Other Developmental
No ID 3,379 31.17% No 7,164 66.09% No 9,196 84.84% No 8,909 82.19% Disabilities:
Mild ID 3,841 35.44% Autism 3,675 33.91% Yes 1,643 15.16% Yes 1,930 17.81% No 10,004 92.30%
Moderate 1,745 16.10% Only 2,596 23.95% Only 215 1.98% Only 101 0.93% Yes 835 7.70%
Severe 886 8.17% Only 222 2.05%
Profound 707 6.52%
Unspecfd 281 2.59%
Only 4,009 36.99%
Severe Behaviors: Medical Problems: Gender: Recency of Evaluations:
No 9,159 84.50% No 7,419 68.45% Female 3,875 35.75% Under 12 Months 9,458 87.26%
Yes 1,680 15.50% Yes 3,420 31.55% Male 6,964 64.25% 12 to 18 Months 1,109 10.23%
18 to 24 Months 180 1.66%
24 to 36 Months 66 0.61%
Special Conditions Unable to Walk English Spoken: Over 36 Months 26 0.24%
or Behaviors: (Without Support): (as Primary Language)
None 10,360* 95.58% No 8,314 76.70% No 3,313 30.57%
One 296 2.73% Yes 2,525 23.30% Yes 7,526 69.43% Age Groups:
Two 105 0.97% (Ages 0-2 not collected on CDER)
3 or More 78 0.72% 0 to 2 yrs 3 0.03%
Special Health Care Residence Type: 3 to 5 yrs 723 6.67%
Requirements: Home Prnt/Grdn 8,110 74.82% 6 to 9 yrs 1,149 10.60%
Risk Factors: No 8,258 76.19% Community Care 1,411 13.02% 10 to 13 yrs 1,126 10.39%
None 7,440* 68.64% Yes 2,581** 23.81% Indep Living 605 5.58% 14 to 17 yrs 1,025 9.46%
One 2,517 23.22% ICF 599 5.53% 18 to 21 yrs 1,026 9.47%
Two 659 6.08% Dev Center 13 0.12% 22 to 31 yrs 2,065 19.05%
3 or More 223 2.06% Technology Dependent: SNF 53 0.49% 32 to 41 yrs 1,248 11.51%
No 10,353 95.52% Other 48 0.44% 42 to 51 yrs 933 8.61%
Yes 486** 4.48% 52 to 61 yrs 921 8.50%
Dual Diagnoses: 62 and Older 620 5.72%
No 9,495 87.60%
Yes 1,344 12.40% Vision Problems:
No 9,281 85.63% Evaluation Scale Averages: Ethnicity:
Yes 1,558 14.37% (1=Disable 5=Able) Asian 986 9.10%
Behavioral Medication: Black/Af Am 697 6.43%
No 8,959 82.66% Hearing Problems: Practical Independence 4.27 Filipino 270 2.49%
Yes 1,880 17.34% No 10,218 94.27% Personal & Social Skills 3.28 Hispanic 5,818 53.68%
Yes 621 5.73% Challenging Behavior 4.29 Native Am 14 0.13%
Social Integration 3.33 Polynesian 17 0.16%
Both Vision and Well Being 4.59 White 2,316 21.37%
Hearing Problems: Other 721 6.65%
No 10,582 97.63%
Yes 257 2.37%
* Includes "Not Assessed".
** Includes DC consumers.
Total active consumers with CDERs: 10,839
Note: CDER information not available for all consumers
Source: CDER Master File of Saturday, April 1, 2017 Table #20
State of California
Department of Developmental Services Thursday, April 6, 2017
Consumer Characteristics at the end of March 2017
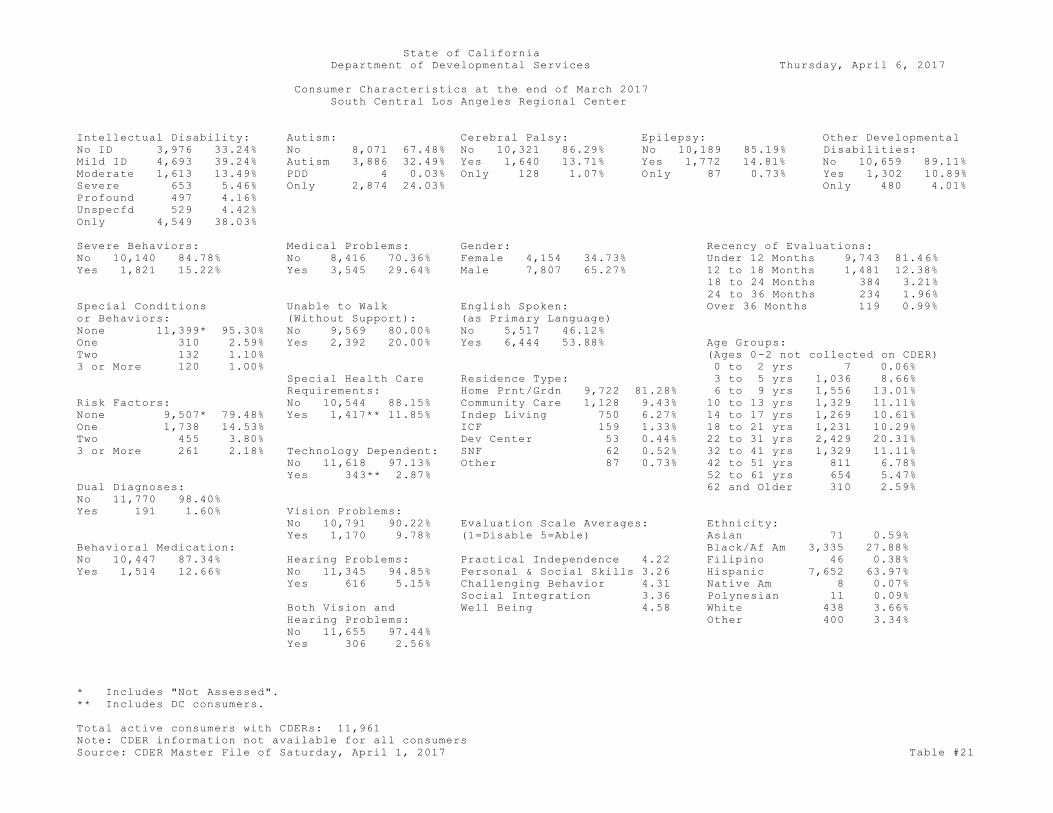
South Central Los Angeles Regional Center
Intellectual Disability: Autism: Cerebral Palsy: Epilepsy: Other Developmental
No ID 3,976 33.24% No 8,071 67.48% No 10,321 86.29% No 10,189 85.19% Disabilities:
Mild ID 4,693 39.24% Autism 3,886 32.49% Yes 1,640 13.71% Yes 1,772 14.81% No 10,659 89.11%
Moderate 1,613 13.49% PDD 4 0.03% Only 128 1.07% Only 87 0.73% Yes 1,302 10.89%
Severe 653 5.46% Only 2,874 24.03% Only 480 4.01%
Profound 497 4.16%
Unspecfd 529 4.42%
Only 4,549 38.03%
Severe Behaviors: Medical Problems: Gender: Recency of Evaluations:
No 10,140 84.78% No 8,416 70.36% Female 4,154 34.73% Under 12 Months 9,743 81.46%
Yes 1,821 15.22% Yes 3,545 29.64% Male 7,807 65.27% 12 to 18 Months 1,481 12.38%
18 to 24 Months 384 3.21%
24 to 36 Months 234 1.96%
Special Conditions Unable to Walk English Spoken: Over 36 Months 119 0.99%
or Behaviors: (Without Support): (as Primary Language)
None 11,399* 95.30% No 9,569 80.00% No 5,517 46.12%
One 310 2.59% Yes 2,392 20.00% Yes 6,444 53.88% Age Groups:
Two 132 1.10% (Ages 0-2 not collected on CDER)
3 or More 120 1.00% 0 to 2 yrs 7 0.06%
Special Health Care Residence Type: 3 to 5 yrs 1,036 8.66%
Requirements: Home Prnt/Grdn 9,722 81.28% 6 to 9 yrs 1,556 13.01%
Risk Factors: No 10,544 88.15% Community Care 1,128 9.43% 10 to 13 yrs 1,329 11.11%
None 9,507* 79.48% Yes 1,417** 11.85% Indep Living 750 6.27% 14 to 17 yrs 1,269 10.61%
One 1,738 14.53% ICF 159 1.33% 18 to 21 yrs 1,231 10.29%
Two 455 3.80% Dev Center 53 0.44% 22 to 31 yrs 2,429 20.31%
3 or More 261 2.18% Technology Dependent: SNF 62 0.52% 32 to 41 yrs 1,329 11.11%
No 11,618 97.13% Other 87 0.73% 42 to 51 yrs 811 6.78%
Yes 343** 2.87% 52 to 61 yrs 654 5.47%
Dual Diagnoses: 62 and Older 310 2.59%
No 11,770 98.40%
Yes 191 1.60% Vision Problems:
No 10,791 90.22% Evaluation Scale Averages: Ethnicity:
Yes 1,170 9.78% (1=Disable 5=Able) Asian 71 0.59%
Behavioral Medication: Black/Af Am 3,335 27.88%
No 10,447 87.34% Hearing Problems: Practical Independence 4.22 Filipino 46 0.38%
Yes 1,514 12.66% No 11,345 94.85% Personal & Social Skills 3.26 Hispanic 7,652 63.97%
Yes 616 5.15% Challenging Behavior 4.31 Native Am 8 0.07%
Social Integration 3.36 Polynesian 11 0.09%
Both Vision and Well Being 4.58 White 438 3.66%
Hearing Problems: Other 400 3.34%
No 11,655 97.44%
Yes 306 2.56%
* Includes "Not Assessed".
** Includes DC consumers.
Total active consumers with CDERs: 11,961
Note: CDER information not available for all consumers
Source: CDER Master File of Saturday, April 1, 2017 Table #21

State of California
Department of Developmental Services Thursday, April 6, 2017
Consumer Characteristics at the end of March 2017
Tri-Counties Regional Center
Intellectual Disability: Autism: Cerebral Palsy: Epilepsy: Other Developmental
No ID 4,324 40.24% No 7,240 67.37% No 9,403 87.50% No 9,354 87.05% Disabilities:
Mild ID 4,011 37.33% Autism 3,506 32.63% Yes 1,343 12.50% Yes 1,392 12.95% No 9,746 90.69%
Moderate 1,451 13.50% Only 2,768 25.76% Only 411 3.82% Only 131 1.22% Yes 1,000 9.31%
Severe 482 4.49% Only 757 7.04%
Profound 288 2.68%
Unspecfd 190 1.77%
Only 4,242 39.48%
Severe Behaviors: Medical Problems: Gender: Recency of Evaluations:
No 8,605 80.08% No 8,910 82.91% Female 3,907 36.36% Under 12 Months 8,833 82.20%
Yes 2,141 19.92% Yes 1,836 17.09% Male 6,839 63.64% 12 to 18 Months 1,154 10.74%
18 to 24 Months 396 3.69%
24 to 36 Months 324 3.02%
Special Conditions Unable to Walk English Spoken: Over 36 Months 39 0.36%
or Behaviors: (Without Support): (as Primary Language)
None 10,064* 93.65% No 8,403 78.20% No 2,186 20.34%
One 376 3.50% Yes 2,343 21.80% Yes 8,560 79.66% Age Groups:
Two 168 1.56% (Ages 0-2 not collected on CDER)
3 or More 138 1.28% 0 to 2 yrs 4 0.04%
Special Health Care Residence Type: 3 to 5 yrs 872 8.11%
Requirements: Home Prnt/Grdn 7,866 73.20% 6 to 9 yrs 1,228 11.43%
Risk Factors: No 8,788 81.78% Community Care 859 7.99% 10 to 13 yrs 1,117 10.39%
None 8,586* 79.90% Yes 1,958** 18.22% Indep Living 1,523 14.17% 14 to 17 yrs 1,044 9.72%
One 1,640 15.26% ICF 399 3.71% 18 to 21 yrs 1,011 9.41%
Two 385 3.58% Dev Center 24 0.22% 22 to 31 yrs 2,012 18.72%
3 or More 135 1.26% Technology Dependent: SNF 24 0.22% 32 to 41 yrs 1,170 10.89%
No 10,396 96.74% Other 51 0.47% 42 to 51 yrs 866 8.06%
Yes 350** 3.26% 52 to 61 yrs 834 7.76%
Dual Diagnoses: 62 and Older 588 5.47%
No 9,742 90.66%
Yes 1,004 9.34% Vision Problems:
No 9,477 88.19% Evaluation Scale Averages: Ethnicity:
Yes 1,269 11.81% (1=Disable 5=Able) Asian 243 2.26%
Behavioral Medication: Black/Af Am 263 2.45%
No 8,514 79.23% Hearing Problems: Practical Independence 4.29 Filipino 161 1.50%
Yes 2,232 20.77% No 10,132 94.29% Personal & Social Skills 3.28 Hispanic 4,080 37.97%
Yes 614 5.71% Challenging Behavior 4.15 Native Am 21 0.20%
Social Integration 3.59 Polynesian 18 0.17%
Both Vision and Well Being 4.67 White 5,206 48.45%
Hearing Problems: Other 754 7.02%
No 10,531 98.00%
Yes 215 2.00%
* Includes "Not Assessed".
** Includes DC consumers.
Total active consumers with CDERs: 10,746
Note: CDER information not available for all consumers
Source: CDER Master File of Saturday, April 1, 2017 Table #22

State of California
Department of Developmental Services Thursday, April 6, 2017
Consumer Characteristics at the end of March 2017
Valley Mountain Regional Center
Intellectual Disability: Autism: Cerebral Palsy: Epilepsy: Other Developmental
No ID 3,752 34.26% No 7,154 65.32% No 9,614 87.78% No 9,139 83.45% Disabilities:
Mild ID 3,887 35.49% Autism 3,798 34.68% Yes 1,338 12.22% Yes 1,813 16.55% No 10,000 91.31%
Moderate 1,540 14.06% Only 2,566 23.43% Only 178 1.63% Only 79 0.72% Yes 952 8.69%
Severe 607 5.54% Only 520 4.75%
Profound 253 2.31%
Unspecfd 913 8.34%
Only 4,102 37.45%
Severe Behaviors: Medical Problems: Gender: Recency of Evaluations:
No 9,071 82.83% No 7,775 70.99% Female 3,833 35.00% Under 12 Months 10,161 92.78%
Yes 1,881 17.17% Yes 3,177 29.01% Male 7,119 65.00% 12 to 18 Months 684 6.25%
18 to 24 Months 61 0.56%
24 to 36 Months 18 0.16%
Special Conditions Unable to Walk English Spoken: Over 36 Months 28 0.26%
or Behaviors: (Without Support): (as Primary Language)
None 10,266* 93.74% No 8,939 81.62% No 1,915 17.49%
One 378 3.45% Yes 2,013 18.38% Yes 9,037 82.51% Age Groups:
Two 169 1.54% (Ages 0-2 not collected on CDER)
3 or More 139 1.27% 0 to 2 yrs 6 0.05%
Special Health Care Residence Type: 3 to 5 yrs 1,242 11.34%
Requirements: Home Prnt/Grdn 8,220 75.05% 6 to 9 yrs 1,387 12.66%
Risk Factors: No 8,511 77.71% Community Care 1,291 11.79% 10 to 13 yrs 1,185 10.82%
None 8,745* 79.85% Yes 2,441** 22.29% Indep Living 1,078 9.84% 14 to 17 yrs 937 8.56%
One 1,640 14.97% ICF 220 2.01% 18 to 21 yrs 903 8.25%
Two 364 3.32% Dev Center 25 0.23% 22 to 31 yrs 1,898 17.33%
3 or More 203 1.85% Technology Dependent: SNF 44 0.40% 32 to 41 yrs 1,187 10.84%
No 10,179 92.94% Other 74 0.68% 42 to 51 yrs 896 8.18%
Yes 773** 7.06% 52 to 61 yrs 769 7.02%
Dual Diagnoses: 62 and Older 542 4.95%
No 9,161 83.65%
Yes 1,791 16.35% Vision Problems:
No 9,890 90.30% Evaluation Scale Averages: Ethnicity:
Yes 1,062 9.70% (1=Disable 5=Able) Asian 608 5.55%
Behavioral Medication: Black/Af Am 1,000 9.13%
No 9,250 84.46% Hearing Problems: Practical Independence 4.33 Filipino 284 2.59%
Yes 1,702 15.54% No 10,348 94.49% Personal & Social Skills 3.41 Hispanic 3,544 32.36%
Yes 604 5.51% Challenging Behavior 4.26 Native Am 41 0.37%
Social Integration 3.78 Polynesian 28 0.26%
Both Vision and Well Being 4.67 White 4,546 41.51%
Hearing Problems: Other 901 8.23%
No 10,695 97.65%
Yes 257 2.35%
* Includes "Not Assessed".
** Includes DC consumers.
Total active consumers with CDERs: 10,952
Note: CDER information not available for all consumers
Source: CDER Master File of Saturday, April 1, 2017 Table #23

State of California
Department of Developmental Services Thursday, April 6, 2017
Consumer Characteristics at the end of March 2017
Westside Regional Center
Intellectual Disability: Autism: Cerebral Palsy: Epilepsy: Other Developmental
No ID 2,713 37.77% No 4,092 56.97% No 6,327 88.08% No 6,230 86.73% Disabilities:
Mild ID 2,499 34.79% Autism 2,969 41.33% Yes 856 11.92% Yes 953 13.27% No 6,394 89.02%
Moderate 706 9.83% PDD 122 1.70% Only 121 1.68% Only 52 0.72% Yes 789 10.98%
Severe 339 4.72% Only 1,872 26.06% Only 298 4.15%
Profound 231 3.22%
Unspecfd 695 9.68%
Only 2,363 32.90%
Severe Behaviors: Medical Problems: Gender: Recency of Evaluations:
No 5,656 78.74% No 6,435 89.59% Female 2,356 32.80% Under 12 Months 6,417 89.34%
Yes 1,527 21.26% Yes 748 10.41% Male 4,827 67.20% 12 to 18 Months 543 7.56%
18 to 24 Months 16 0.22%
24 to 36 Months 61 0.85%
Special Conditions Unable to Walk English Spoken: Over 36 Months 146 2.03%
or Behaviors: (Without Support): (as Primary Language)
None 6,849* 95.35% No 5,803 80.79% No 1,565 21.79%
One 202 2.81% Yes 1,380 19.21% Yes 5,618 78.21% Age Groups:
Two 71 0.99% (Ages 0-2 not collected on CDER)
3 or More 61 0.85% 0 to 2 yrs 19 0.26%
Special Health Care Residence Type: 3 to 5 yrs 555 7.73%
Requirements: Home Prnt/Grdn 5,610 78.10% 6 to 9 yrs 907 12.63%
Risk Factors: No 6,584 91.66% Community Care 466 6.49% 10 to 13 yrs 826 11.50%
None 5,618* 78.21% Yes 599** 8.34% Indep Living 879 12.24% 14 to 17 yrs 772 10.75%
One 1,225 17.05% ICF 155 2.16% 18 to 21 yrs 691 9.62%
Two 241 3.36% Dev Center 22 0.31% 22 to 31 yrs 1,375 19.14%
3 or More 99 1.38% Technology Dependent: SNF 19 0.26% 32 to 41 yrs 694 9.66%
No 7,015 97.66% Other 32 0.45% 42 to 51 yrs 606 8.44%
Yes 168** 2.34% 52 to 61 yrs 463 6.45%
Dual Diagnoses: 62 and Older 275 3.83%
No 6,593 91.79%
Yes 590 8.21% Vision Problems:
No 6,537 91.01% Evaluation Scale Averages: Ethnicity:
Yes 646 8.99% (1=Disable 5=Able) Asian 273 3.80%
Behavioral Medication: Black/Af Am 1,763 24.54%
No 6,090 84.78% Hearing Problems: Practical Independence 4.33 Filipino 67 0.93%
Yes 1,093 15.22% No 6,890 95.92% Personal & Social Skills 3.22 Hispanic 2,354 32.77%
Yes 293 4.08% Challenging Behavior 4.11 Native Am 10 0.14%
Social Integration 3.75 Polynesian 10 0.14%
Both Vision and Well Being 4.52 White 1,968 27.40%
Hearing Problems: Other 738 10.27%
No 7,066 98.37%
Yes 117 1.63%
* Includes "Not Assessed".
** Includes DC consumers.
Total active consumers with CDERs: 7,183
Note: CDER information not available for all consumers
Source: CDER Master File of Saturday, April 1, 2017 Table #24
State of California
Department of Developmental Services Thursday, April 6, 2017
Consumer Characteristics at the end of March 2017
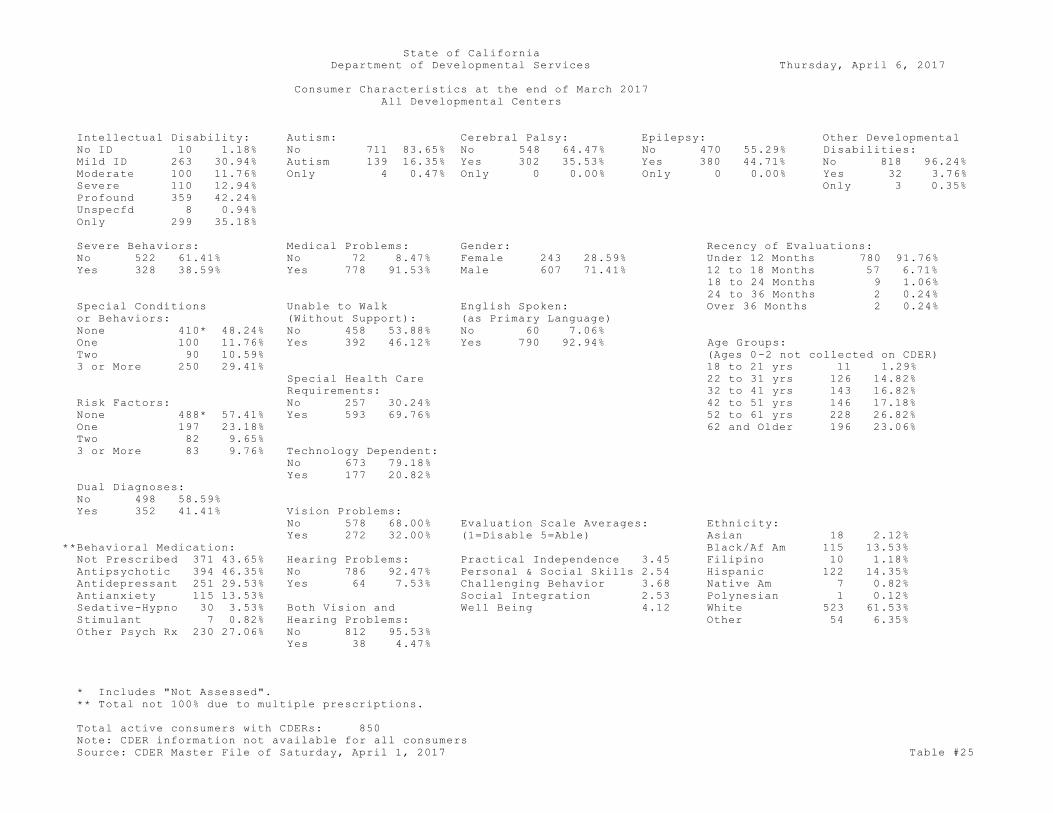
All Developmental Centers
Intellectual Disability: Autism: Cerebral Palsy: Epilepsy: Other Developmental
No ID 10 1.18% No 711 83.65% No 548 64.47% No 470 55.29% Disabilities:
Mild ID 263 30.94% Autism 139 16.35% Yes 302 35.53% Yes 380 44.71% No 818 96.24%
Moderate 100 11.76% Only 4 0.47% Only 0 0.00% Only 0 0.00% Yes 32 3.76%
Severe 110 12.94% Only 3 0.35%
Profound 359 42.24%
Unspecfd 8 0.94%
Only 299 35.18%
Severe Behaviors: Medical Problems: Gender: Recency of Evaluations:
No 522 61.41% No 72 8.47% Female 243 28.59% Under 12 Months 780 91.76%
Yes 328 38.59% Yes 778 91.53% Male 607 71.41% 12 to 18 Months 57 6.71%
18 to 24 Months 9 1.06%
24 to 36 Months 2 0.24%
Special Conditions Unable to Walk English Spoken: Over 36 Months 2 0.24%
or Behaviors: (Without Support): (as Primary Language)
None 410* 48.24% No 458 53.88% No 60 7.06%
One 100 11.76% Yes 392 46.12% Yes 790 92.94% Age Groups:
Two 90 10.59% (Ages 0-2 not collected on CDER)
3 or More 250 29.41% 18 to 21 yrs 11 1.29%
Special Health Care 22 to 31 yrs 126 14.82%
Requirements: 32 to 41 yrs 143 16.82%
Risk Factors: No 257 30.24% 42 to 51 yrs 146 17.18%
None 488* 57.41% Yes 593 69.76% 52 to 61 yrs 228 26.82%
One 197 23.18% 62 and Older 196 23.06%
Two 82 9.65%
3 or More 83 9.76% Technology Dependent:
No 673 79.18%
Yes 177 20.82%
Dual Diagnoses:
No 498 58.59%
Yes 352 41.41% Vision Problems:
No 578 68.00% Evaluation Scale Averages: Ethnicity:
Yes 272 32.00% (1=Disable 5=Able) Asian 18 2.12%
**Behavioral Medication: Black/Af Am 115 13.53%
Not Prescribed 371 43.65% Hearing Problems: Practical Independence 3.45 Filipino 10 1.18%
Antipsychotic 394 46.35% No 786 92.47% Personal & Social Skills 2.54 Hispanic 122 14.35%
Antidepressant 251 29.53% Yes 64 7.53% Challenging Behavior 3.68 Native Am 7 0.82%
Antianxiety 115 13.53% Social Integration 2.53 Polynesian 1 0.12%
Sedative-Hypno 30 3.53% Both Vision and Well Being 4.12 White 523 61.53%
Stimulant 7 0.82% Hearing Problems: Other 54 6.35%
Other Psych Rx 230 27.06% No 812 95.53%
Yes 38 4.47%
* Includes "Not Assessed".
** Total not 100% due to multiple prescriptions.
Total active consumers with CDERs: 850
Note: CDER information not available for all consumers
Source: CDER Master File of Saturday, April 1, 2017 Table #25
State of California
Department of Developmental Services Thursday, April 6, 2017
Consumer Characteristics at the end of March 2017
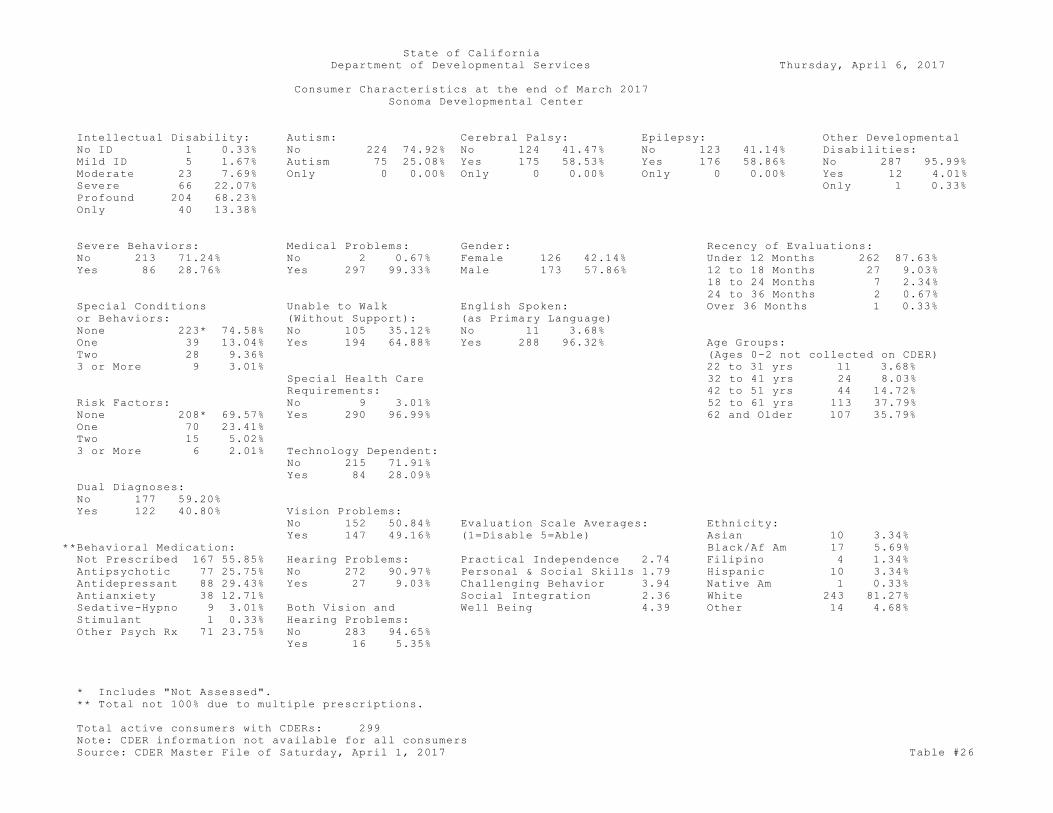
Sonoma Developmental Center
Intellectual Disability: Autism: Cerebral Palsy: Epilepsy: Other Developmental
No ID 1 0.33% No 224 74.92% No 124 41.47% No 123 41.14% Disabilities:
Mild ID 5 1.67% Autism 75 25.08% Yes 175 58.53% Yes 176 58.86% No 287 95.99%
Moderate 23 7.69% Only 0 0.00% Only 0 0.00% Only 0 0.00% Yes 12 4.01%
Severe 66 22.07% Only 1 0.33%
Profound 204 68.23%
Only 40 13.38%
Severe Behaviors: Medical Problems: Gender: Recency of Evaluations:
No 213 71.24% No 2 0.67% Female 126 42.14% Under 12 Months 262 87.63%
Yes 86 28.76% Yes 297 99.33% Male 173 57.86% 12 to 18 Months 27 9.03%
18 to 24 Months 7 2.34%
24 to 36 Months 2 0.67%
Special Conditions Unable to Walk English Spoken: Over 36 Months 1 0.33%
or Behaviors: (Without Support): (as Primary Language)
None 223* 74.58% No 105 35.12% No 11 3.68%
One 39 13.04% Yes 194 64.88% Yes 288 96.32% Age Groups:
Two 28 9.36% (Ages 0-2 not collected on CDER)
3 or More 9 3.01% 22 to 31 yrs 11 3.68%
Special Health Care 32 to 41 yrs 24 8.03%
Requirements: 42 to 51 yrs 44 14.72%
Risk Factors: No 9 3.01% 52 to 61 yrs 113 37.79%
None 208* 69.57% Yes 290 96.99% 62 and Older 107 35.79%
One 70 23.41%
Two 15 5.02%
3 or More 6 2.01% Technology Dependent:
No 215 71.91%
Yes 84 28.09%
Dual Diagnoses:
No 177 59.20%
Yes 122 40.80% Vision Problems:
No 152 50.84% Evaluation Scale Averages: Ethnicity:
Yes 147 49.16% (1=Disable 5=Able) Asian 10 3.34%
**Behavioral Medication: Black/Af Am 17 5.69%
Not Prescribed 167 55.85% Hearing Problems: Practical Independence 2.74 Filipino 4 1.34%
Antipsychotic 77 25.75% No 272 90.97% Personal & Social Skills 1.79 Hispanic 10 3.34%
Antidepressant 88 29.43% Yes 27 9.03% Challenging Behavior 3.94 Native Am 1 0.33%
Antianxiety 38 12.71% Social Integration 2.36 White 243 81.27%
Sedative-Hypno 9 3.01% Both Vision and Well Being 4.39 Other 14 4.68%
Stimulant 1 0.33% Hearing Problems:
Other Psych Rx 71 23.75% No 283 94.65%
Yes 16 5.35%
* Includes "Not Assessed".
** Total not 100% due to multiple prescriptions.
Total active consumers with CDERs: 299
Note: CDER information not available for all consumers
Source: CDER Master File of Saturday, April 1, 2017 Table #26
State of California
Department of Developmental Services Thursday, April 6, 2017
Consumer Characteristics at the end of March 2017
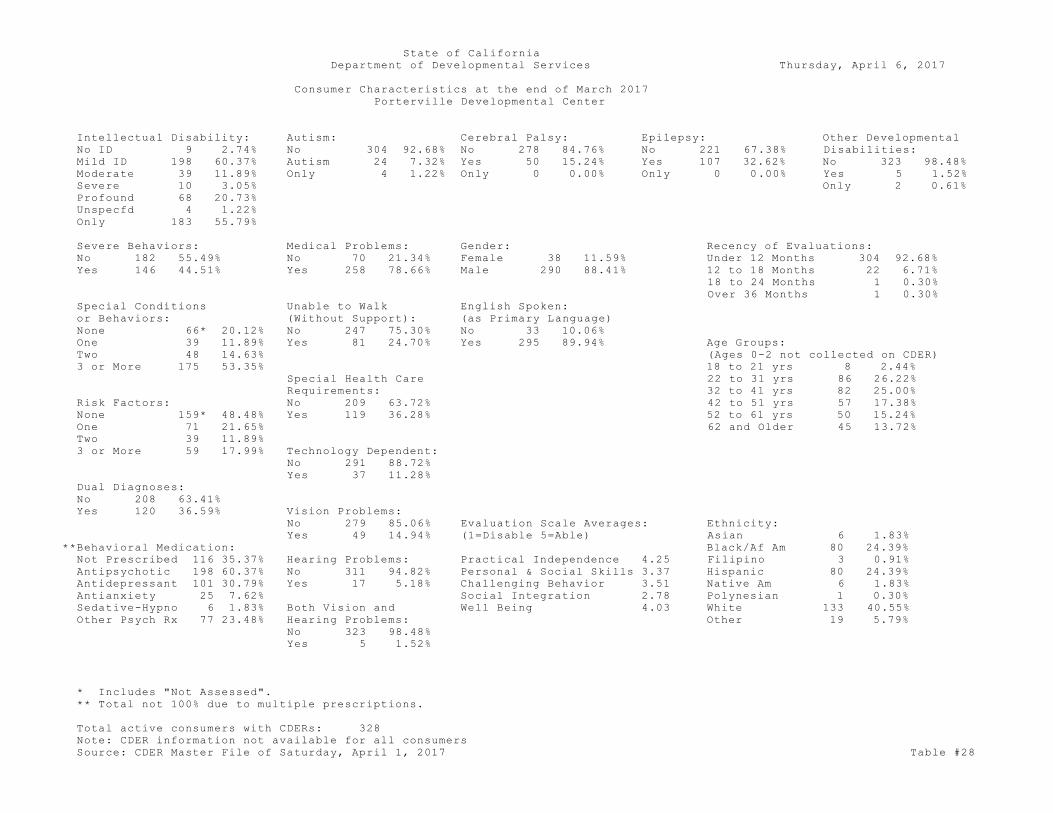
Porterville Developmental Center
Intellectual Disability: Autism: Cerebral Palsy: Epilepsy: Other Developmental
No ID 9 2.74% No 304 92.68% No 278 84.76% No 221 67.38% Disabilities:
Mild ID 198 60.37% Autism 24 7.32% Yes 50 15.24% Yes 107 32.62% No 323 98.48%
Moderate 39 11.89% Only 4 1.22% Only 0 0.00% Only 0 0.00% Yes 5 1.52%
Severe 10 3.05% Only 2 0.61%
Profound 68 20.73%
Unspecfd 4 1.22%
Only 183 55.79%
Severe Behaviors: Medical Problems: Gender: Recency of Evaluations:
No 182 55.49% No 70 21.34% Female 38 11.59% Under 12 Months 304 92.68%
Yes 146 44.51% Yes 258 78.66% Male 290 88.41% 12 to 18 Months 22 6.71%
18 to 24 Months 1 0.30%
Over 36 Months 1 0.30%
Special Conditions Unable to Walk English Spoken:
or Behaviors: (Without Support): (as Primary Language)
None 66* 20.12% No 247 75.30% No 33 10.06%
One 39 11.89% Yes 81 24.70% Yes 295 89.94% Age Groups:
Two 48 14.63% (Ages 0-2 not collected on CDER)
3 or More 175 53.35% 18 to 21 yrs 8 2.44%
Special Health Care 22 to 31 yrs 86 26.22%
Requirements: 32 to 41 yrs 82 25.00%
Risk Factors: No 209 63.72% 42 to 51 yrs 57 17.38%
None 159* 48.48% Yes 119 36.28% 52 to 61 yrs 50 15.24%
One 71 21.65% 62 and Older 45 13.72%
Two 39 11.89%
3 or More 59 17.99% Technology Dependent:
No 291 88.72%
Yes 37 11.28%
Dual Diagnoses:
No 208 63.41%
Yes 120 36.59% Vision Problems:
No 279 85.06% Evaluation Scale Averages: Ethnicity:
Yes 49 14.94% (1=Disable 5=Able) Asian 6 1.83%
**Behavioral Medication: Black/Af Am 80 24.39%
Not Prescribed 116 35.37% Hearing Problems: Practical Independence 4.25 Filipino 3 0.91%
Antipsychotic 198 60.37% No 311 94.82% Personal & Social Skills 3.37 Hispanic 80 24.39%
Antidepressant 101 30.79% Yes 17 5.18% Challenging Behavior 3.51 Native Am 6 1.83%
Antianxiety 25 7.62% Social Integration 2.78 Polynesian 1 0.30%
Sedative-Hypno 6 1.83% Both Vision and Well Being 4.03 White 133 40.55%
Other Psych Rx 77 23.48% Hearing Problems: Other 19 5.79%
No 323 98.48%
Yes 5 1.52%
* Includes "Not Assessed".
** Total not 100% due to multiple prescriptions.
Total active consumers with CDERs: 328
Note: CDER information not available for all consumers
Source: CDER Master File of Saturday, April 1, 2017 Table #28
State of California
Department of Developmental Services Thursday, April 6, 2017
Consumer Characteristics at the end of March 2017
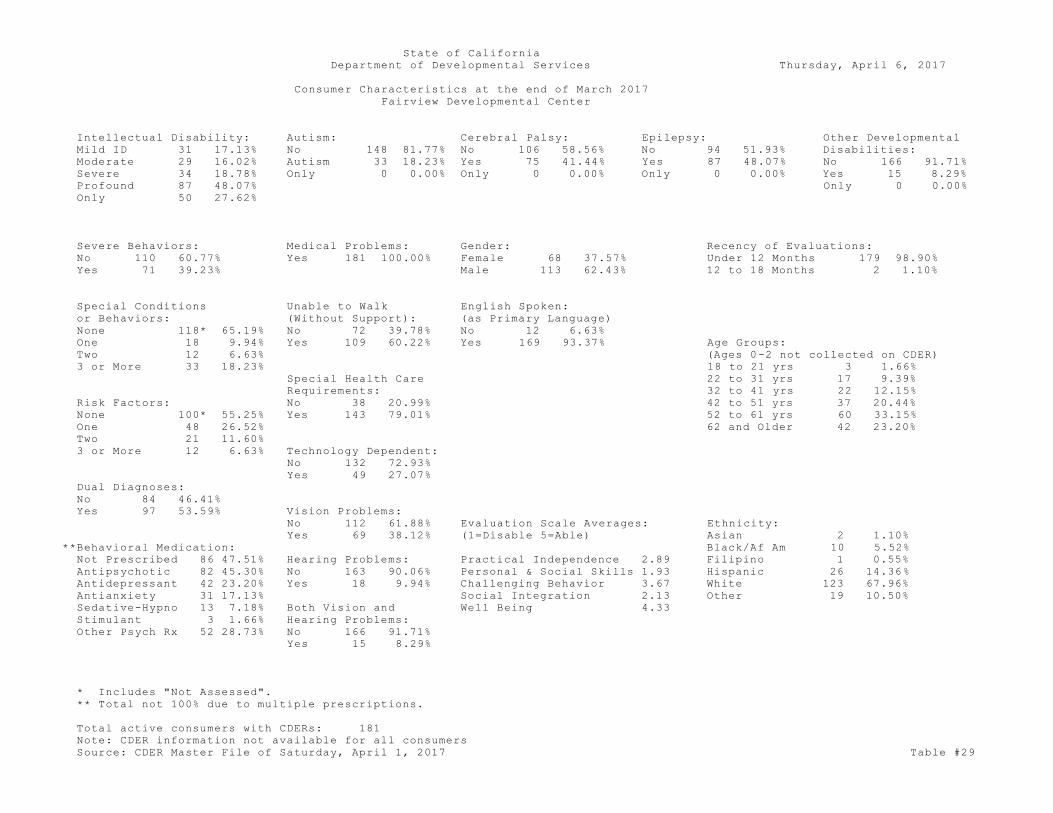
Fairview Developmental Center
Intellectual Disability: Autism: Cerebral Palsy: Epilepsy: Other Developmental
Mild ID 31 17.13% No 148 81.77% No 106 58.56% No 94 51.93% Disabilities:
Moderate 29 16.02% Autism 33 18.23% Yes 75 41.44% Yes 87 48.07% No 166 91.71%
Severe 34 18.78% Only 0 0.00% Only 0 0.00% Only 0 0.00% Yes 15 8.29%
Profound 87 48.07% Only 0 0.00%
Only 50 27.62%
Severe Behaviors: Medical Problems: Gender: Recency of Evaluations:
No 110 60.77% Yes 181 100.00% Female 68 37.57% Under 12 Months 179 98.90%
Yes 71 39.23% Male 113 62.43% 12 to 18 Months 2 1.10%
Special Conditions Unable to Walk English Spoken:
or Behaviors: (Without Support): (as Primary Language)
None 118* 65.19% No 72 39.78% No 12 6.63%
One 18 9.94% Yes 109 60.22% Yes 169 93.37% Age Groups:
Two 12 6.63% (Ages 0-2 not collected on CDER)
3 or More 33 18.23% 18 to 21 yrs 3 1.66%
Special Health Care 22 to 31 yrs 17 9.39%
Requirements: 32 to 41 yrs 22 12.15%
Risk Factors: No 38 20.99% 42 to 51 yrs 37 20.44%
None 100* 55.25% Yes 143 79.01% 52 to 61 yrs 60 33.15%
One 48 26.52% 62 and Older 42 23.20%
Two 21 11.60%
3 or More 12 6.63% Technology Dependent:
No 132 72.93%
Yes 49 27.07%
Dual Diagnoses:
No 84 46.41%
Yes 97 53.59% Vision Problems:
No 112 61.88% Evaluation Scale Averages: Ethnicity:
Yes 69 38.12% (1=Disable 5=Able) Asian 2 1.10%
**Behavioral Medication: Black/Af Am 10 5.52%
Not Prescribed 86 47.51% Hearing Problems: Practical Independence 2.89 Filipino 1 0.55%
Antipsychotic 82 45.30% No 163 90.06% Personal & Social Skills 1.93 Hispanic 26 14.36%
Antidepressant 42 23.20% Yes 18 9.94% Challenging Behavior 3.67 White 123 67.96%
Antianxiety 31 17.13% Social Integration 2.13 Other 19 10.50%
Sedative-Hypno 13 7.18% Both Vision and Well Being 4.33
Stimulant 3 1.66% Hearing Problems:
Other Psych Rx 52 28.73% No 166 91.71%
Yes 15 8.29%
* Includes "Not Assessed".
** Total not 100% due to multiple prescriptions.
Total active consumers with CDERs: 181
Note: CDER information not available for all consumers
Source: CDER Master File of Saturday, April 1, 2017 Table #29
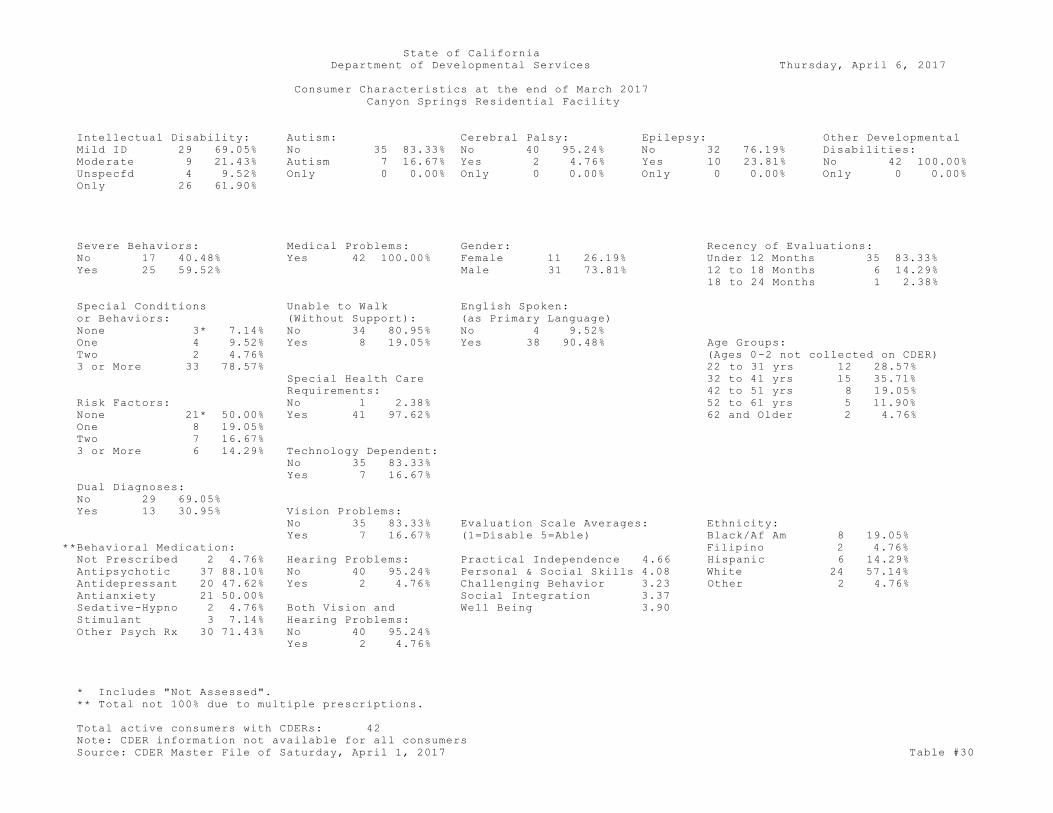
State of California
Department of Developmental Services Thursday, April 6, 2017
Consumer Characteristics at the end of March 2017
Canyon Springs Residential Facility
Intellectual Disability: Autism: Cerebral Palsy: Epilepsy: Other Developmental
Mild ID 29 69.05% No 35 83.33% No 40 95.24% No 32 76.19% Disabilities:
Moderate 9 21.43% Autism 7 16.67% Yes 2 4.76% Yes 10 23.81% No 42 100.00%
Unspecfd 4 9.52% Only 0 0.00% Only 0 0.00% Only 0 0.00% Only 0 0.00%
Only 26 61.90%
Severe Behaviors: Medical Problems: Gender: Recency of Evaluations:
No 17 40.48% Yes 42 100.00% Female 11 26.19% Under 12 Months 35 83.33%
Yes 25 59.52% Male 31 73.81% 12 to 18 Months 6 14.29%
18 to 24 Months 1 2.38%
Special Conditions Unable to Walk English Spoken:
or Behaviors: (Without Support): (as Primary Language)
None 3* 7.14% No 34 80.95% No 4 9.52%
One 4 9.52% Yes 8 19.05% Yes 38 90.48% Age Groups:
Two 2 4.76% (Ages 0-2 not collected on CDER)
3 or More 33 78.57% 22 to 31 yrs 12 28.57%
Special Health Care 32 to 41 yrs 15 35.71%
Requirements: 42 to 51 yrs 8 19.05%
Risk Factors: No 1 2.38% 52 to 61 yrs 5 11.90%
None 21* 50.00% Yes 41 97.62% 62 and Older 2 4.76%
One 8 19.05%
Two 7 16.67%
3 or More 6 14.29% Technology Dependent:
No 35 83.33%
Yes 7 16.67%
Dual Diagnoses:
No 29 69.05%
Yes 13 30.95% Vision Problems:
No 35 83.33% Evaluation Scale Averages: Ethnicity:
Yes 7 16.67% (1=Disable 5=Able) Black/Af Am 8 19.05%
**Behavioral Medication: Filipino 2 4.76%
Not Prescribed 2 4.76% Hearing Problems: Practical Independence 4.66 Hispanic 6 14.29%
Antipsychotic 37 88.10% No 40 95.24% Personal & Social Skills 4.08 White 24 57.14%
Antidepressant 20 47.62% Yes 2 4.76% Challenging Behavior 3.23 Other 2 4.76%
Antianxiety 21 50.00% Social Integration 3.37
Sedative-Hypno 2 4.76% Both Vision and Well Being 3.90
Stimulant 3 7.14% Hearing Problems:
Other Psych Rx 30 71.43% No 40 95.24%
Yes 2 4.76%
* Includes "Not Assessed".
** Total not 100% due to multiple prescriptions.
Total active consumers with CDERs: 42
Note: CDER information not available for all consumers
Source: CDER Master File of Saturday, April 1, 2017 Table #30

State of California
Department of Developmental Services Thursday, April 6, 2017
Consumer Characteristics at the end of March 2017
Intellectual Disability
Intellectual Disability: Autism: Cerebral Palsy: Epilepsy: Other Developmental
Mild ID 87,348 52.87% No 143,002 86.55% No 139,168 84.23% No 134,195 81.22% Disabilities:
Moderate 34,670 20.98% Autism 21,873 13.24% Yes 26,058 15.77% Yes 31,031 18.78% No 159,082 96.28%
Severe 14,443 8.74% PDD 351 0.21% Only 0 0.00% Only 0 0.00% Yes 6,144 3.72%
Profound 8,723 5.28% Only 0 0.00% Only 0 0.00%
Unspecfd 20,042 12.13%
Only 96,802 58.59%
Severe Behaviors: Medical Problems: Gender: Recency of Evaluations:
No 139,839 84.63% No 115,231 69.74% Female 69,251 41.91% Under 12 Months 143,013 86.56%
Yes 25,387 15.37% Yes 49,995 30.26% Male 95,975 58.09% 12 to 18 Months 14,911 9.02%
18 to 24 Months 3,370 2.04%
24 to 36 Months 2,560 1.55%
Special Conditions Unable to Walk English Spoken: Over 36 Months 1,372 0.83%
or Behaviors: (Without Support): (as Primary Language)
None 151,938* 91.96% No 122,566 74.18% No 44,739 27.08%
One 7,726 4.68% Yes 42,660 25.82% Yes 120,487 72.92% Age Groups:
Two 3,231 1.96% (Ages 0-2 not collected on CDER)
3 or More 2,331 1.41% 0 to 2 yrs 77 0.05%
Special Health Care Residence Type: 3 to 5 yrs 5,902 3.57%
Requirements: Home Prnt/Grdn 114,104 69.06% 6 to 9 yrs 10,926 6.61%
Risk Factors: No 122,093 73.89% Community Care 22,917 13.87% 10 to 13 yrs 12,650 7.66%
None 121,106* 73.30% Yes 43,133** 26.11% Indep Living 18,224 11.03% 14 to 17 yrs 13,930 8.43%
One 31,676 19.17% ICF 6,784 4.11% 18 to 21 yrs 15,766 9.54%
Two 8,272 5.01% Dev Center 841 0.51% 22 to 31 yrs 38,035 23.02%
3 or More 4,172 2.53% Technology Dependent: SNF 968 0.59% 32 to 41 yrs 23,973 14.51%
No 153,924 93.16% Other 1,388 0.84% 42 to 51 yrs 17,405 10.53%
Yes 11,302** 6.84% 52 to 61 yrs 16,163 9.78%
Dual Diagnoses: 62 and Older 10,399 6.29%
No 144,630 87.53%
Yes 20,596 12.47% Vision Problems:
No 141,353 85.55% Evaluation Scale Averages: Ethnicity:
Yes 23,873 14.45% (1=Disable 5=Able) Asian 9,966 6.03%
Behavioral Medication: Black/Af Am 17,934 10.85%
No 131,052 79.32% Hearing Problems: Practical Independence 4.22 Filipino 4,001 2.42%
Yes 34,174 20.68% No 153,298 92.78% Personal & Social Skills 3.26 Hispanic 63,817 38.62%
Yes 11,928 7.22% Challenging Behavior 4.29 Native Am 632 0.38%
Social Integration 3.48 Polynesian 417 0.25%
Both Vision and Well Being 4.66 White 56,576 34.24%
Hearing Problems: Other 11,883 7.19%
No 160,116 96.91%
Yes 5,110 3.09%
* Includes "Not Assessed".
** Includes DC consumers.
Total active consumers with CDERs: 165,226
Note: CDER information not available for all consumers
Source: CDER Master File of Saturday, April 1, 2017 Table #31

State of California
Department of Developmental Services Thursday, April 6, 2017
Consumer Characteristics at the end of March 2017
Autism and PDD
Intellectual Disability: Autism: Cerebral Palsy: Epilepsy: Other Developmental
No ID 70,885 76.13% Autism 92,588 99.44% No 92,050 98.86% No 89,298 95.91% Disabilities:
Mild ID 9,933 10.67% PDD 521 0.56% Yes 1,059 1.14% Yes 3,811 4.09% No 89,599 96.23%
Moderate 4,473 4.80% Only 66,283 71.19% Only 0 0.00% Only 0 0.00% Yes 3,510 3.77%
Severe 2,071 2.22% Only 0 0.00%
Profound 725 0.78%
Unspecfd 5,022 5.39%
Only 0 0.00%
Severe Behaviors: Medical Problems: Gender: Recency of Evaluations:
No 64,204 68.96% No 84,050 90.27% Female 16,938 18.19% Under 12 Months 80,424 86.38%
Yes 28,905 31.04% Yes 9,059 9.73% Male 76,171 81.81% 12 to 18 Months 8,410 9.03%
18 to 24 Months 1,997 2.14%
24 to 36 Months 1,438 1.54%
Special Conditions Unable to Walk English Spoken: Over 36 Months 840 0.90%
or Behaviors: (Without Support): (as Primary Language)
None 90,789* 97.51% No 88,705 95.27% No 19,874 21.34%
One 1,490 1.60% Yes 4,404 4.73% Yes 73,235 78.66% Age Groups:
Two 560 0.60% (Ages 0-2 not collected on CDER)
3 or More 270 0.29% 0 to 2 yrs 44 0.05%
Special Health Care Residence Type: 3 to 5 yrs 14,891 15.99%
Requirements: Home Prnt/Grdn 85,424 91.75% 6 to 9 yrs 20,344 21.85%
Risk Factors: No 88,300 94.84% Community Care 4,485 4.82% 10 to 13 yrs 16,335 17.54%
None 78,440* 84.25% Yes 4,809** 5.16% Indep Living 2,328 2.50% 14 to 17 yrs 12,900 13.85%
One 11,809 12.68% ICF 502 0.54% 18 to 21 yrs 10,232 10.99%
Two 2,164 2.32% Dev Center 139 0.15% 22 to 31 yrs 12,366 13.28%
3 or More 696 0.75% Technology Dependent: SNF 23 0.02% 32 to 41 yrs 2,876 3.09%
No 91,955 98.76% Other 208 0.22% 42 to 51 yrs 1,530 1.64%
Yes 1,154** 1.24% 52 to 61 yrs 1,194 1.28%
Dual Diagnoses: 62 and Older 397 0.43%
No 86,646 93.06%
Yes 6,463 6.94% Vision Problems:
No 90,642 97.35% Evaluation Scale Averages: Ethnicity:
Yes 2,467 2.65% (1=Disable 5=Able) Asian 8,362 8.98%
Behavioral Medication: Black/Af Am 6,838 7.34%
No 79,432 85.31% Hearing Problems: Practical Independence 4.43 Filipino 3,090 3.32%
Yes 13,677 14.69% No 91,251 98.00% Personal & Social Skills 3.10 Hispanic 32,865 35.30%
Yes 1,858 2.00% Challenging Behavior 3.84 Native Am 253 0.27%
Social Integration 3.48 Polynesian 206 0.22%
Both Vision and Well Being 4.55 White 29,376 31.55%
Hearing Problems: Other 12,119 13.02%
No 92,694 99.55%
Yes 415 0.45%
* Includes "Not Assessed".
** Includes DC consumers.
Total active consumers with CDERs: 93,109
Note: CDER information not available for all consumers
Source: CDER Master File of Saturday, April 1, 2017 Table #32

State of California
Department of Developmental Services Thursday, April 6, 2017
Consumer Characteristics at the end of March 2017
Cerebral Palsy
Intellectual Disability: Autism: Cerebral Palsy: Epilepsy: Other Developmental
No ID 9,763 27.25% No 34,762 97.04% Yes 35,821 100.00% No 21,118 58.95% Disabilities:
Mild ID 7,809 21.80% Autism 1,032 2.88% Only 5,840 16.30% Yes 14,703 41.05% No 33,267 92.87%
Moderate 5,135 14.34% PDD 27 0.08% Only 0 0.00% Yes 2,554 7.13%
Severe 4,681 13.07% Only 0 0.00% Only 0 0.00%
Profound 4,770 13.32%
Unspecfd 3,663 10.23%
Only 0 0.00%
Severe Behaviors: Medical Problems: Gender: Recency of Evaluations:
No 32,235 89.99% No 22,418 62.58% Female 15,926 44.46% Under 12 Months 30,934 86.36%
Yes 3,586 10.01% Yes 13,403 37.42% Male 19,895 55.54% 12 to 18 Months 3,261 9.10%
18 to 24 Months 689 1.92%
24 to 36 Months 511 1.43%
Special Conditions Unable to Walk English Spoken: Over 36 Months 426 1.19%
or Behaviors: (Without Support): (as Primary Language)
None 34,284* 95.71% No 8,040 22.44% No 9,253 25.83%
One 1,071 2.99% Yes 27,781 77.56% Yes 26,568 74.17% Age Groups:
Two 310 0.87% (Ages 0-2 not collected on CDER)
3 or More 156 0.44% 0 to 2 yrs 23 0.06%
Special Health Care Residence Type: 3 to 5 yrs 1,398 3.90%
Requirements: Home Prnt/Grdn 24,258 67.72% 6 to 9 yrs 2,328 6.50%
Risk Factors: No 13,067 36.48% Community Care 3,542 9.89% 10 to 13 yrs 2,597 7.25%
None 23,923* 66.78% Yes 22,754** 63.52% Indep Living 3,672 10.25% 14 to 17 yrs 2,834 7.91%
One 8,920 24.90% ICF 3,328 9.29% 18 to 21 yrs 3,404 9.50%
Two 2,174 6.07% Dev Center 302 0.84% 22 to 31 yrs 8,195 22.88%
3 or More 804 2.24% Technology Dependent: SNF 349 0.97% 32 to 41 yrs 5,553 15.50%
No 29,435 82.17% Other 370 1.03% 42 to 51 yrs 3,816 10.65%
Yes 6,386** 17.83% 52 to 61 yrs 3,407 9.51%
Dual Diagnoses: 62 and Older 2,266 6.33%
No 33,016 92.17%
Yes 2,805 7.83% Vision Problems:
No 25,402 70.91% Evaluation Scale Averages: Ethnicity:
Yes 10,419 29.09% (1=Disable 5=Able) Asian 2,005 5.60%
Behavioral Medication: Black/Af Am 3,181 8.88%
No 30,053 83.90% Hearing Problems: Practical Independence 3.09 Filipino 694 1.94%
Yes 5,768 16.10% No 31,999 89.33% Personal & Social Skills 2.62 Hispanic 13,089 36.54%
Yes 3,822 10.67% Challenging Behavior 4.48 Native Am 130 0.36%
Social Integration 3.39 Polynesian 102 0.28%
Both Vision and Well Being 4.71 White 13,938 38.91%
Hearing Problems: Other 2,682 7.49%
No 33,555 93.67%
Yes 2,266 6.33%
* Includes "Not Assessed".
** Includes DC consumers.
Total active consumers with CDERs: 35,821
Note: CDER information not available for all consumers
Source: CDER Master File of Saturday, April 1, 2017 Table #33
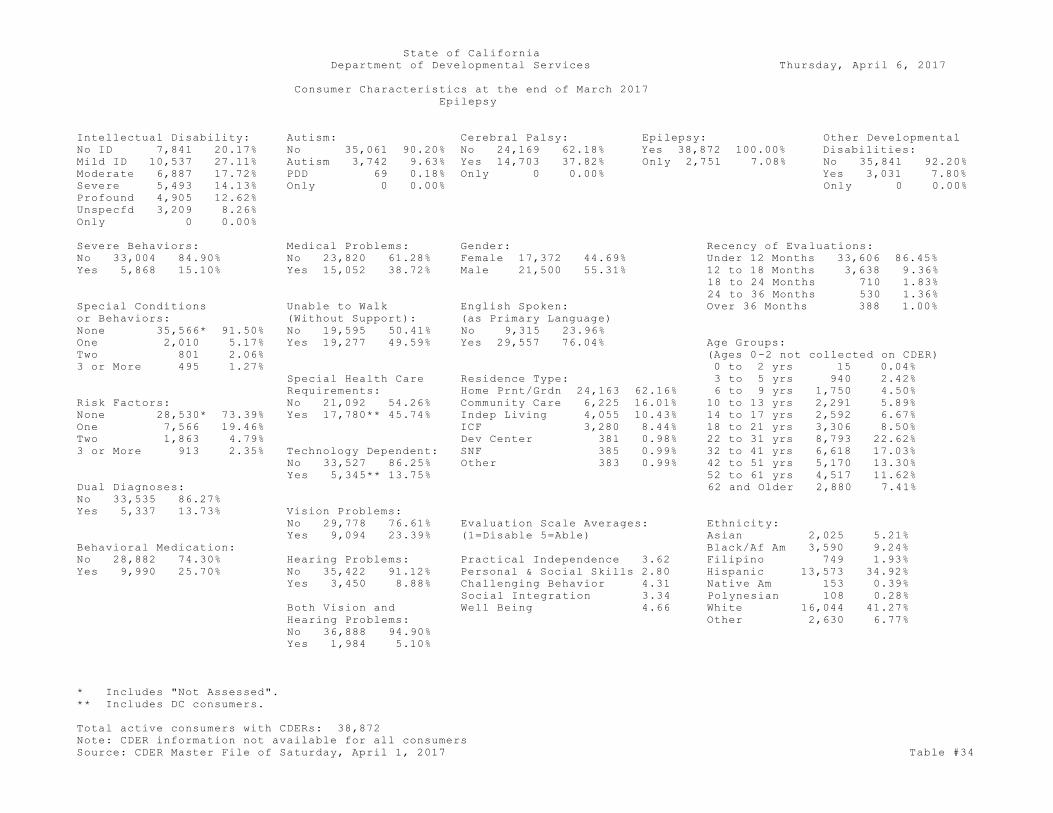
State of California
Department of Developmental Services Thursday, April 6, 2017
Consumer Characteristics at the end of March 2017
Epilepsy
Intellectual Disability: Autism: Cerebral Palsy: Epilepsy: Other Developmental
No ID 7,841 20.17% No 35,061 90.20% No 24,169 62.18% Yes 38,872 100.00% Disabilities:
Mild ID 10,537 27.11% Autism 3,742 9.63% Yes 14,703 37.82% Only 2,751 7.08% No 35,841 92.20%
Moderate 6,887 17.72% PDD 69 0.18% Only 0 0.00% Yes 3,031 7.80%
Severe 5,493 14.13% Only 0 0.00% Only 0 0.00%
Profound 4,905 12.62%
Unspecfd 3,209 8.26%
Only 0 0.00%
Severe Behaviors: Medical Problems: Gender: Recency of Evaluations:
No 33,004 84.90% No 23,820 61.28% Female 17,372 44.69% Under 12 Months 33,606 86.45%
Yes 5,868 15.10% Yes 15,052 38.72% Male 21,500 55.31% 12 to 18 Months 3,638 9.36%
18 to 24 Months 710 1.83%
24 to 36 Months 530 1.36%
Special Conditions Unable to Walk English Spoken: Over 36 Months 388 1.00%
or Behaviors: (Without Support): (as Primary Language)
None 35,566* 91.50% No 19,595 50.41% No 9,315 23.96%
One 2,010 5.17% Yes 19,277 49.59% Yes 29,557 76.04% Age Groups:
Two 801 2.06% (Ages 0-2 not collected on CDER)
3 or More 495 1.27% 0 to 2 yrs 15 0.04%
Special Health Care Residence Type: 3 to 5 yrs 940 2.42%
Requirements: Home Prnt/Grdn 24,163 62.16% 6 to 9 yrs 1,750 4.50%
Risk Factors: No 21,092 54.26% Community Care 6,225 16.01% 10 to 13 yrs 2,291 5.89%
None 28,530* 73.39% Yes 17,780** 45.74% Indep Living 4,055 10.43% 14 to 17 yrs 2,592 6.67%
One 7,566 19.46% ICF 3,280 8.44% 18 to 21 yrs 3,306 8.50%
Two 1,863 4.79% Dev Center 381 0.98% 22 to 31 yrs 8,793 22.62%
3 or More 913 2.35% Technology Dependent: SNF 385 0.99% 32 to 41 yrs 6,618 17.03%
No 33,527 86.25% Other 383 0.99% 42 to 51 yrs 5,170 13.30%
Yes 5,345** 13.75% 52 to 61 yrs 4,517 11.62%
Dual Diagnoses: 62 and Older 2,880 7.41%
No 33,535 86.27%
Yes 5,337 13.73% Vision Problems:
No 29,778 76.61% Evaluation Scale Averages: Ethnicity:
Yes 9,094 23.39% (1=Disable 5=Able) Asian 2,025 5.21%
Behavioral Medication: Black/Af Am 3,590 9.24%
No 28,882 74.30% Hearing Problems: Practical Independence 3.62 Filipino 749 1.93%
Yes 9,990 25.70% No 35,422 91.12% Personal & Social Skills 2.80 Hispanic 13,573 34.92%
Yes 3,450 8.88% Challenging Behavior 4.31 Native Am 153 0.39%
Social Integration 3.34 Polynesian 108 0.28%
Both Vision and Well Being 4.66 White 16,044 41.27%
Hearing Problems: Other 2,630 6.77%
No 36,888 94.90%
Yes 1,984 5.10%
* Includes "Not Assessed".
** Includes DC consumers.
Total active consumers with CDERs: 38,872
Note: CDER information not available for all consumers
Source: CDER Master File of Saturday, April 1, 2017 Table #34

State of California
Department of Developmental Services Thursday, April 6, 2017
Consumer Characteristics at the end of March 2017
Other Developmental Disability
Intellectual Disability: Autism: Cerebral Palsy: Epilepsy: Other Developmental
No ID 20,946 77.32% No 23,580 87.04% No 24,536 90.57% No 24,059 88.81% Disabilities:
Mild ID 3,037 11.21% Autism 3,406 12.57% Yes 2,554 9.43% Yes 3,031 11.19% Yes 27,090 100.00%
Moderate 1,610 5.94% PDD 104 0.38% Only 0 0.00% Only 0 0.00% Only 14,728 54.37%
Severe 648 2.39% Only 0 0.00%
Profound 320 1.18%
Unspecfd 529 1.95%
Only 0 0.00%
Severe Behaviors: Medical Problems: Gender: Recency of Evaluations:
No 23,094 85.25% No 20,281 74.87% Female 9,952 36.74% Under 12 Months 23,093 85.25%
Yes 3,996 14.75% Yes 6,809 25.13% Male 17,138 63.26% 12 to 18 Months 2,474 9.13%
18 to 24 Months 636 2.35%
24 to 36 Months 559 2.06%
Special Conditions Unable to Walk English Spoken: Over 36 Months 328 1.21%
or Behaviors: (Without Support): (as Primary Language)
None 25,071* 92.55% No 22,088 81.54% No 5,838 21.55%
One 1,124 4.15% Yes 5,002 18.46% Yes 21,252 78.45% Age Groups:
Two 509 1.88% (Ages 0-2 not collected on CDER)
3 or More 386 1.42% 0 to 2 yrs 32 0.12%
Special Health Care Residence Type: 3 to 5 yrs 2,435 8.99%
Requirements: Home Prnt/Grdn 19,664 72.59% 6 to 9 yrs 2,289 8.45%
Risk Factors: No 22,222 82.03% Community Care 2,457 9.07% 10 to 13 yrs 2,396 8.84%
None 20,092* 74.17% Yes 4,868** 17.97% Indep Living 4,168 15.39% 14 to 17 yrs 2,530 9.34%
One 4,875 18.00% ICF 362 1.34% 18 to 21 yrs 2,829 10.44%
Two 1,372 5.06% Dev Center 32 0.12% 22 to 31 yrs 6,538 24.13%
3 or More 751 2.77% Technology Dependent: SNF 90 0.33% 32 to 41 yrs 3,258 12.03%
No 25,748 95.05% Other 317 1.17% 42 to 51 yrs 2,133 7.87%
Yes 1,342** 4.95% 52 to 61 yrs 1,725 6.37%
Dual Diagnoses: 62 and Older 925 3.41%
No 21,872 80.74%
Yes 5,218 19.26% Vision Problems:
No 24,050 88.78% Evaluation Scale Averages: Ethnicity:
Yes 3,040 11.22% (1=Disable 5=Able) Asian 1,636 6.04%
Behavioral Medication: Black/Af Am 2,977 10.99%
No 21,765 80.34% Hearing Problems: Practical Independence 4.42 Filipino 533 1.97%
Yes 5,325 19.66% No 25,530 94.24% Personal & Social Skills 3.57 Hispanic 9,125 33.68%
Yes 1,560 5.76% Challenging Behavior 4.31 Native Am 133 0.49%
Social Integration 3.71 Polynesian 58 0.21%
Both Vision and Well Being 4.58 White 10,289 37.98%
Hearing Problems: Other 2,339 8.63%
No 26,512 97.87%
Yes 578 2.13%
* Includes "Not Assessed".
** Includes DC consumers.
Total active consumers with CDERs: 27,090
Note: CDER information not available for all consumers
Source: CDER Master File of Saturday, April 1, 2017 Table #35

State of California
Department of Developmental Services Thursday, April 6, 2017
Consumer Characteristics at the end of March 2017
Ethnicity - Asian
Intellectual Disability: Autism: Cerebral Palsy: Epilepsy: Other Developmental
No ID 7,868 44.12% No 9,472 53.11% No 15,829 88.76% No 15,809 88.65% Disabilities:
Mild ID 4,130 23.16% Autism 8,341 46.77% Yes 2,005 11.24% Yes 2,025 11.35% No 16,198 90.83%
Moderate 2,241 12.57% PDD 21 0.12% Only 378 2.12% Only 115 0.64% Yes 1,636 9.17%
Severe 963 5.40% Only 5,847 32.79% Only 785 4.40%
Profound 430 2.41%
Unspecfd 2,202 12.35%
Only 5,458 30.60%
Severe Behaviors: Medical Problems: Gender: Recency of Evaluations:
No 14,541 81.54% No 14,607 81.91% Female 5,747 32.22% Under 12 Months 15,904 89.18%
Yes 3,293 18.46% Yes 3,227 18.09% Male 12,087 67.78% 12 to 18 Months 1,426 8.00%
18 to 24 Months 275 1.54%
24 to 36 Months 155 0.87%
Special Conditions Unable to Walk English Spoken: Over 36 Months 74 0.41%
or Behaviors: (Without Support): (as Primary Language)
None 17,412* 97.63% No 14,641 82.10% No 8,197 45.96%
One 285 1.60% Yes 3,193 17.90% Yes 9,637 54.04% Age Groups:
Two 94 0.53% (Ages 0-2 not collected on CDER)
3 or More 43 0.24% 0 to 2 yrs 13 0.07%
Special Health Care Residence Type: 3 to 5 yrs 1,743 9.77%
Requirements: Home Prnt/Grdn 15,661 87.82% 6 to 9 yrs 2,400 13.46%
Risk Factors: No 15,339 86.01% Community Care 1,086 6.09% 10 to 13 yrs 2,178 12.21%
None 14,209* 79.67% Yes 2,495** 13.99% Indep Living 730 4.09% 14 to 17 yrs 2,016 11.30%
One 3,056 17.14% ICF 252 1.41% 18 to 21 yrs 1,795 10.07%
Two 465 2.61% Dev Center 18 0.10% 22 to 31 yrs 3,387 18.99%
3 or More 104 0.58% Technology Dependent: SNF 32 0.18% 32 to 41 yrs 1,852 10.38%
No 17,172 96.29% Other 55 0.31% 42 to 51 yrs 1,312 7.36%
Yes 662** 3.71% 52 to 61 yrs 771 4.32%
Dual Diagnoses: 62 and Older 367 2.06%
No 16,358 91.72%
Yes 1,476 8.28% Vision Problems:
No 16,332 91.58% Evaluation Scale Averages: Ethnicity:
Yes 1,502 8.42% (1=Disable 5=Able) Asian 17,834 100.00%
Behavioral Medication:
No 15,967 89.53% Hearing Problems: Practical Independence 4.29
Yes 1,867 10.47% No 16,867 94.58% Personal & Social Skills 3.08
Yes 967 5.42% Challenging Behavior 4.19
Social Integration 3.34
Both Vision and Well Being 4.60
Hearing Problems:
No 17,475 97.99%
Yes 359 2.01%
* Includes "Not Assessed".
** Includes DC consumers.
Total active consumers with CDERs: 17,834
Note: CDER information not available for all consumers
Source: CDER Master File of Saturday, April 1, 2017 Table #36
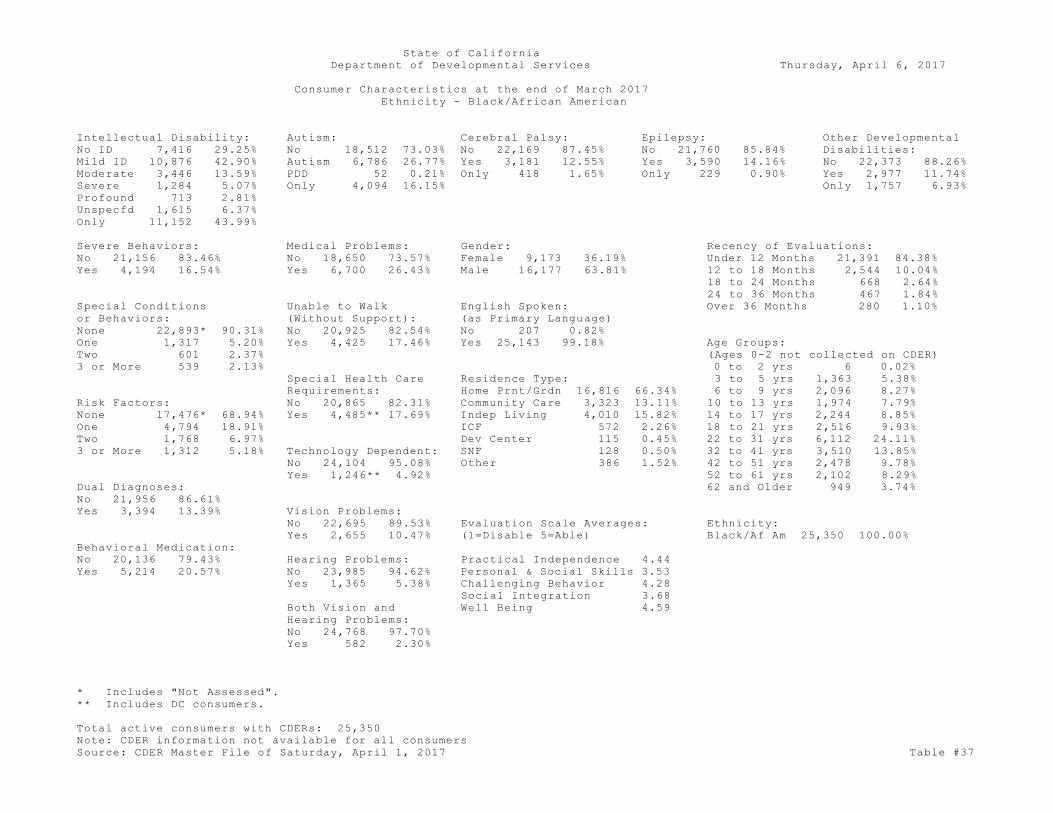
State of California
Department of Developmental Services Thursday, April 6, 2017
Consumer Characteristics at the end of March 2017
Ethnicity - Black/African American
Intellectual Disability: Autism: Cerebral Palsy: Epilepsy: Other Developmental
No ID 7,416 29.25% No 18,512 73.03% No 22,169 87.45% No 21,760 85.84% Disabilities:
Mild ID 10,876 42.90% Autism 6,786 26.77% Yes 3,181 12.55% Yes 3,590 14.16% No 22,373 88.26%
Moderate 3,446 13.59% PDD 52 0.21% Only 418 1.65% Only 229 0.90% Yes 2,977 11.74%
Severe 1,284 5.07% Only 4,094 16.15% Only 1,757 6.93%
Profound 713 2.81%
Unspecfd 1,615 6.37%
Only 11,152 43.99%
Severe Behaviors: Medical Problems: Gender: Recency of Evaluations:
No 21,156 83.46% No 18,650 73.57% Female 9,173 36.19% Under 12 Months 21,391 84.38%
Yes 4,194 16.54% Yes 6,700 26.43% Male 16,177 63.81% 12 to 18 Months 2,544 10.04%
18 to 24 Months 668 2.64%
24 to 36 Months 467 1.84%
Special Conditions Unable to Walk English Spoken: Over 36 Months 280 1.10%
or Behaviors: (Without Support): (as Primary Language)
None 22,893* 90.31% No 20,925 82.54% No 207 0.82%
One 1,317 5.20% Yes 4,425 17.46% Yes 25,143 99.18% Age Groups:
Two 601 2.37% (Ages 0-2 not collected on CDER)
3 or More 539 2.13% 0 to 2 yrs 6 0.02%
Special Health Care Residence Type: 3 to 5 yrs 1,363 5.38%
Requirements: Home Prnt/Grdn 16,816 66.34% 6 to 9 yrs 2,096 8.27%
Risk Factors: No 20,865 82.31% Community Care 3,323 13.11% 10 to 13 yrs 1,974 7.79%
None 17,476* 68.94% Yes 4,485** 17.69% Indep Living 4,010 15.82% 14 to 17 yrs 2,244 8.85%
One 4,794 18.91% ICF 572 2.26% 18 to 21 yrs 2,516 9.93%
Two 1,768 6.97% Dev Center 115 0.45% 22 to 31 yrs 6,112 24.11%
3 or More 1,312 5.18% Technology Dependent: SNF 128 0.50% 32 to 41 yrs 3,510 13.85%
No 24,104 95.08% Other 386 1.52% 42 to 51 yrs 2,478 9.78%
Yes 1,246** 4.92% 52 to 61 yrs 2,102 8.29%
Dual Diagnoses: 62 and Older 949 3.74%
No 21,956 86.61%
Yes 3,394 13.39% Vision Problems:
No 22,695 89.53% Evaluation Scale Averages: Ethnicity:
Yes 2,655 10.47% (1=Disable 5=Able) Black/Af Am 25,350 100.00%
Behavioral Medication:
No 20,136 79.43% Hearing Problems: Practical Independence 4.44
Yes 5,214 20.57% No 23,985 94.62% Personal & Social Skills 3.53
Yes 1,365 5.38% Challenging Behavior 4.28
Social Integration 3.68
Both Vision and Well Being 4.59
Hearing Problems:
No 24,768 97.70%
Yes 582 2.30%
* Includes "Not Assessed".
** Includes DC consumers.
Total active consumers with CDERs: 25,350
Note: CDER information not available for all consumers
Source: CDER Master File of Saturday, April 1, 2017 Table #37
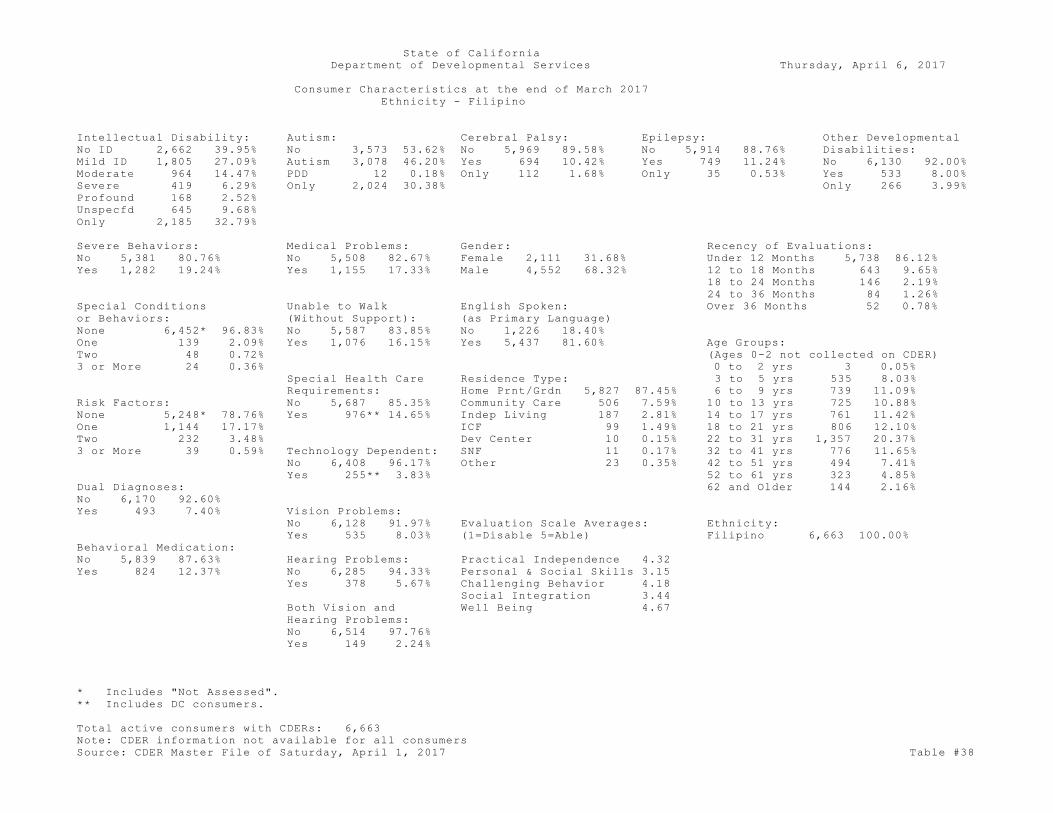
State of California
Department of Developmental Services Thursday, April 6, 2017
Consumer Characteristics at the end of March 2017
Ethnicity - Filipino
Intellectual Disability: Autism: Cerebral Palsy: Epilepsy: Other Developmental
No ID 2,662 39.95% No 3,573 53.62% No 5,969 89.58% No 5,914 88.76% Disabilities:
Mild ID 1,805 27.09% Autism 3,078 46.20% Yes 694 10.42% Yes 749 11.24% No 6,130 92.00%
Moderate 964 14.47% PDD 12 0.18% Only 112 1.68% Only 35 0.53% Yes 533 8.00%
Severe 419 6.29% Only 2,024 30.38% Only 266 3.99%
Profound 168 2.52%
Unspecfd 645 9.68%
Only 2,185 32.79%
Severe Behaviors: Medical Problems: Gender: Recency of Evaluations:
No 5,381 80.76% No 5,508 82.67% Female 2,111 31.68% Under 12 Months 5,738 86.12%
Yes 1,282 19.24% Yes 1,155 17.33% Male 4,552 68.32% 12 to 18 Months 643 9.65%
18 to 24 Months 146 2.19%
24 to 36 Months 84 1.26%
Special Conditions Unable to Walk English Spoken: Over 36 Months 52 0.78%
or Behaviors: (Without Support): (as Primary Language)
None 6,452* 96.83% No 5,587 83.85% No 1,226 18.40%
One 139 2.09% Yes 1,076 16.15% Yes 5,437 81.60% Age Groups:
Two 48 0.72% (Ages 0-2 not collected on CDER)
3 or More 24 0.36% 0 to 2 yrs 3 0.05%
Special Health Care Residence Type: 3 to 5 yrs 535 8.03%
Requirements: Home Prnt/Grdn 5,827 87.45% 6 to 9 yrs 739 11.09%
Risk Factors: No 5,687 85.35% Community Care 506 7.59% 10 to 13 yrs 725 10.88%
None 5,248* 78.76% Yes 976** 14.65% Indep Living 187 2.81% 14 to 17 yrs 761 11.42%
One 1,144 17.17% ICF 99 1.49% 18 to 21 yrs 806 12.10%
Two 232 3.48% Dev Center 10 0.15% 22 to 31 yrs 1,357 20.37%
3 or More 39 0.59% Technology Dependent: SNF 11 0.17% 32 to 41 yrs 776 11.65%
No 6,408 96.17% Other 23 0.35% 42 to 51 yrs 494 7.41%
Yes 255** 3.83% 52 to 61 yrs 323 4.85%
Dual Diagnoses: 62 and Older 144 2.16%
No 6,170 92.60%
Yes 493 7.40% Vision Problems:
No 6,128 91.97% Evaluation Scale Averages: Ethnicity:
Yes 535 8.03% (1=Disable 5=Able) Filipino 6,663 100.00%
Behavioral Medication:
No 5,839 87.63% Hearing Problems: Practical Independence 4.32
Yes 824 12.37% No 6,285 94.33% Personal & Social Skills 3.15
Yes 378 5.67% Challenging Behavior 4.18
Social Integration 3.44
Both Vision and Well Being 4.67
Hearing Problems:
No 6,514 97.76%
Yes 149 2.24%
* Includes "Not Assessed".
** Includes DC consumers.
Total active consumers with CDERs: 6,663
Note: CDER information not available for all consumers
Source: CDER Master File of Saturday, April 1, 2017 Table #38
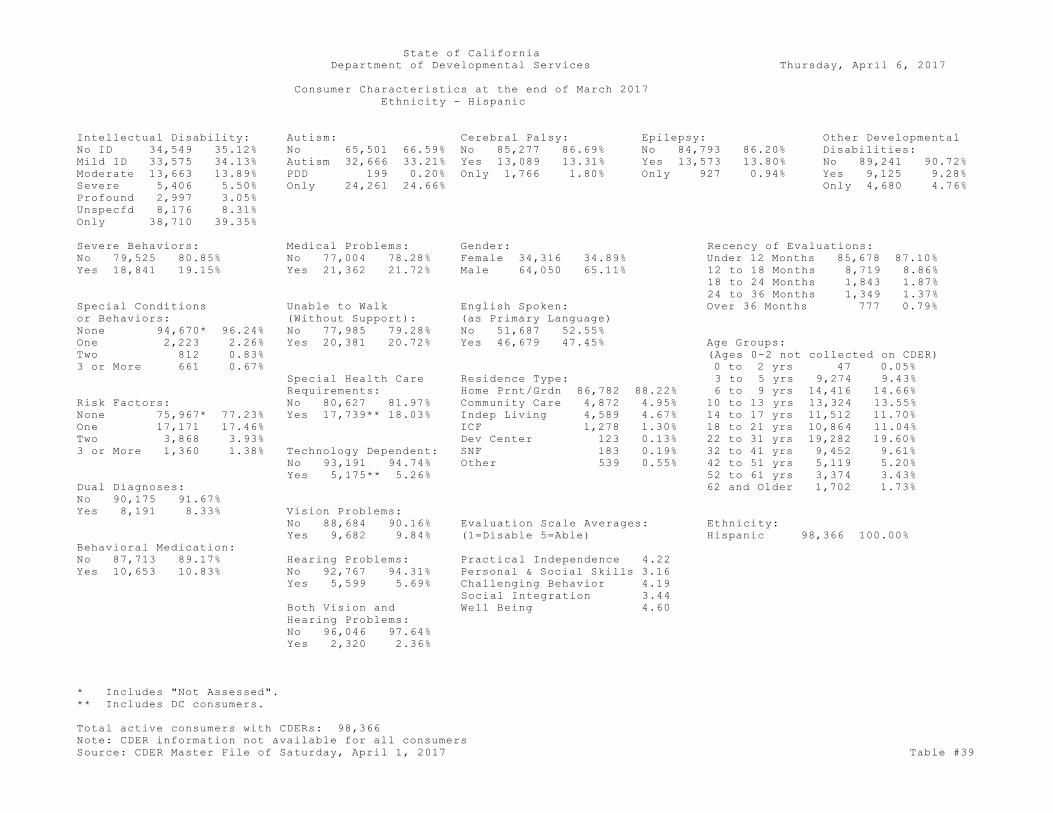
State of California
Department of Developmental Services Thursday, April 6, 2017
Consumer Characteristics at the end of March 2017
Ethnicity - Hispanic
Intellectual Disability: Autism: Cerebral Palsy: Epilepsy: Other Developmental
No ID 34,549 35.12% No 65,501 66.59% No 85,277 86.69% No 84,793 86.20% Disabilities:
Mild ID 33,575 34.13% Autism 32,666 33.21% Yes 13,089 13.31% Yes 13,573 13.80% No 89,241 90.72%
Moderate 13,663 13.89% PDD 199 0.20% Only 1,766 1.80% Only 927 0.94% Yes 9,125 9.28%
Severe 5,406 5.50% Only 24,261 24.66% Only 4,680 4.76%
Profound 2,997 3.05%
Unspecfd 8,176 8.31%
Only 38,710 39.35%
Severe Behaviors: Medical Problems: Gender: Recency of Evaluations:
No 79,525 80.85% No 77,004 78.28% Female 34,316 34.89% Under 12 Months 85,678 87.10%
Yes 18,841 19.15% Yes 21,362 21.72% Male 64,050 65.11% 12 to 18 Months 8,719 8.86%
18 to 24 Months 1,843 1.87%
24 to 36 Months 1,349 1.37%
Special Conditions Unable to Walk English Spoken: Over 36 Months 777 0.79%
or Behaviors: (Without Support): (as Primary Language)
None 94,670* 96.24% No 77,985 79.28% No 51,687 52.55%
One 2,223 2.26% Yes 20,381 20.72% Yes 46,679 47.45% Age Groups:
Two 812 0.83% (Ages 0-2 not collected on CDER)
3 or More 661 0.67% 0 to 2 yrs 47 0.05%
Special Health Care Residence Type: 3 to 5 yrs 9,274 9.43%
Requirements: Home Prnt/Grdn 86,782 88.22% 6 to 9 yrs 14,416 14.66%
Risk Factors: No 80,627 81.97% Community Care 4,872 4.95% 10 to 13 yrs 13,324 13.55%
None 75,967* 77.23% Yes 17,739** 18.03% Indep Living 4,589 4.67% 14 to 17 yrs 11,512 11.70%
One 17,171 17.46% ICF 1,278 1.30% 18 to 21 yrs 10,864 11.04%
Two 3,868 3.93% Dev Center 123 0.13% 22 to 31 yrs 19,282 19.60%
3 or More 1,360 1.38% Technology Dependent: SNF 183 0.19% 32 to 41 yrs 9,452 9.61%
No 93,191 94.74% Other 539 0.55% 42 to 51 yrs 5,119 5.20%
Yes 5,175** 5.26% 52 to 61 yrs 3,374 3.43%
Dual Diagnoses: 62 and Older 1,702 1.73%
No 90,175 91.67%
Yes 8,191 8.33% Vision Problems:
No 88,684 90.16% Evaluation Scale Averages: Ethnicity:
Yes 9,682 9.84% (1=Disable 5=Able) Hispanic 98,366 100.00%
Behavioral Medication:
No 87,713 89.17% Hearing Problems: Practical Independence 4.22
Yes 10,653 10.83% No 92,767 94.31% Personal & Social Skills 3.16
Yes 5,599 5.69% Challenging Behavior 4.19
Social Integration 3.44
Both Vision and Well Being 4.60
Hearing Problems:
No 96,046 97.64%
Yes 2,320 2.36%
* Includes "Not Assessed".
** Includes DC consumers.
Total active consumers with CDERs: 98,366
Note: CDER information not available for all consumers
Source: CDER Master File of Saturday, April 1, 2017 Table #39

State of California
Department of Developmental Services Thursday, April 6, 2017
Consumer Characteristics at the end of March 2017
Ethnicity - Native American
Intellectual Disability: Autism: Cerebral Palsy: Epilepsy: Other Developmental
No ID 328 34.17% No 707 73.65% No 830 86.46% No 807 84.06% Disabilities:
Mild ID 405 42.19% Autism 250 26.04% Yes 130 13.54% Yes 153 15.94% No 827 86.15%
Moderate 110 11.46% PDD 3 0.31% Only 17 1.77% Only 12 1.25% Yes 133 13.85%
Severe 52 5.42% Only 176 18.33% Only 91 9.48%
Profound 23 2.40%
Unspecfd 42 4.38%
Only 394 41.04%
Severe Behaviors: Medical Problems: Gender: Recency of Evaluations:
No 794 82.71% No 729 75.94% Female 358 37.29% Under 12 Months 767 79.90%
Yes 166 17.29% Yes 231 24.06% Male 602 62.71% 12 to 18 Months 97 10.10%
18 to 24 Months 36 3.75%
24 to 36 Months 44 4.58%
Special Conditions Unable to Walk English Spoken: Over 36 Months 16 1.67%
or Behaviors: (Without Support): (as Primary Language)
None 838* 87.29% No 766 79.79% No 15 1.56%
One 59 6.15% Yes 194 20.21% Yes 945 98.44% Age Groups:
Two 36 3.75% (Ages 0-2 not collected on CDER)
3 or More 27 2.81% 3 to 5 yrs 55 5.73%
Special Health Care Residence Type: 6 to 9 yrs 88 9.17%
Requirements: Home Prnt/Grdn 592 61.67% 10 to 13 yrs 68 7.08%
Risk Factors: No 729 75.94% Community Care 139 14.48% 14 to 17 yrs 95 9.90%
None 624* 65.00% Yes 231** 24.06% Indep Living 170 17.71% 18 to 21 yrs 98 10.21%
One 180 18.75% ICF 26 2.71% 22 to 31 yrs 198 20.63%
Two 90 9.38% Dev Center 7 0.73% 32 to 41 yrs 114 11.88%
3 or More 66 6.88% Technology Dependent: SNF 8 0.83% 42 to 51 yrs 88 9.17%
No 890 92.71% Other 18 1.88% 52 to 61 yrs 101 10.52%
Yes 70** 7.29% 62 and Older 55 5.73%
Dual Diagnoses:
No 826 86.04%
Yes 134 13.96% Vision Problems:
No 835 86.98% Evaluation Scale Averages: Ethnicity:
Yes 125 13.02% (1=Disable 5=Able) Native Am 960 100.00%
Behavioral Medication:
No 731 76.15% Hearing Problems: Practical Independence 4.39
Yes 229 23.85% No 899 93.65% Personal & Social Skills 3.52
Yes 61 6.35% Challenging Behavior 4.19
Social Integration 3.75
Both Vision and Well Being 4.51
Hearing Problems:
No 938 97.71%
Yes 22 2.29%
* Includes "Not Assessed".
** Includes DC consumers.
Total active consumers with CDERs: 960
Note: CDER information not available for all consumers
Source: CDER Master File of Saturday, April 1, 2017 Table #40
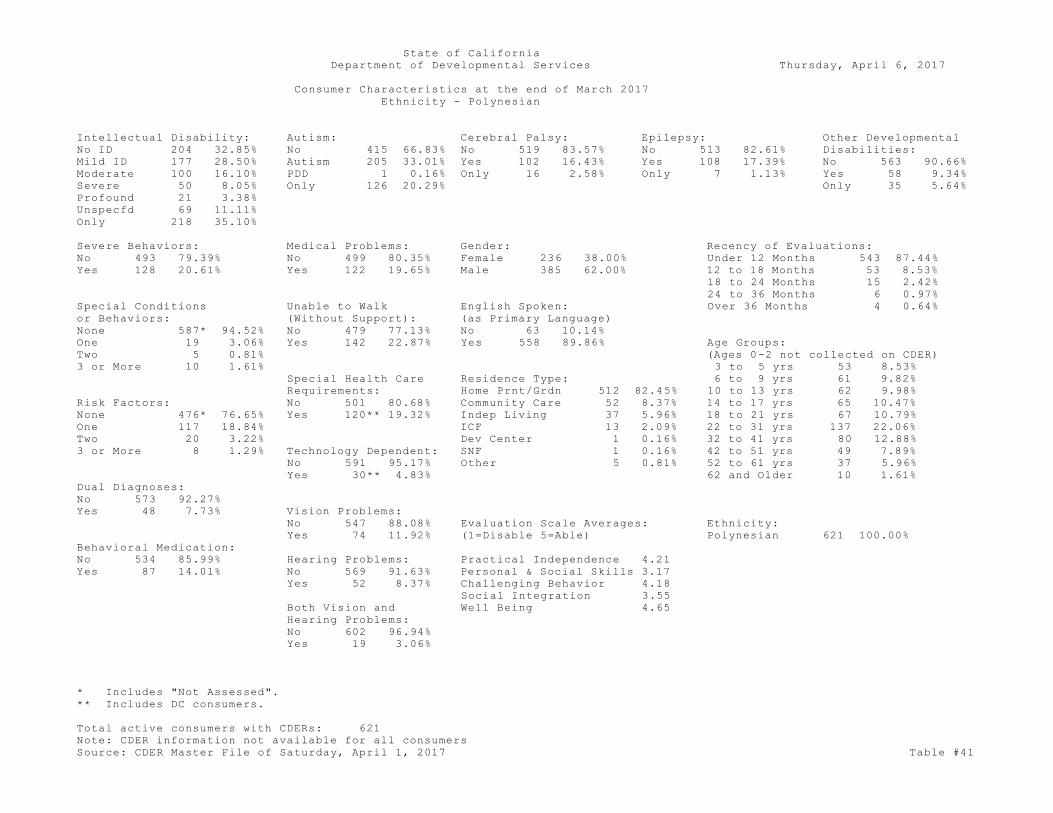
State of California
Department of Developmental Services Thursday, April 6, 2017
Consumer Characteristics at the end of March 2017
Ethnicity - Polynesian
Intellectual Disability: Autism: Cerebral Palsy: Epilepsy: Other Developmental
No ID 204 32.85% No 415 66.83% No 519 83.57% No 513 82.61% Disabilities:
Mild ID 177 28.50% Autism 205 33.01% Yes 102 16.43% Yes 108 17.39% No 563 90.66%
Moderate 100 16.10% PDD 1 0.16% Only 16 2.58% Only 7 1.13% Yes 58 9.34%
Severe 50 8.05% Only 126 20.29% Only 35 5.64%
Profound 21 3.38%
Unspecfd 69 11.11%
Only 218 35.10%
Severe Behaviors: Medical Problems: Gender: Recency of Evaluations:
No 493 79.39% No 499 80.35% Female 236 38.00% Under 12 Months 543 87.44%
Yes 128 20.61% Yes 122 19.65% Male 385 62.00% 12 to 18 Months 53 8.53%
18 to 24 Months 15 2.42%
24 to 36 Months 6 0.97%
Special Conditions Unable to Walk English Spoken: Over 36 Months 4 0.64%
or Behaviors: (Without Support): (as Primary Language)
None 587* 94.52% No 479 77.13% No 63 10.14%
One 19 3.06% Yes 142 22.87% Yes 558 89.86% Age Groups:
Two 5 0.81% (Ages 0-2 not collected on CDER)
3 or More 10 1.61% 3 to 5 yrs 53 8.53%
Special Health Care Residence Type: 6 to 9 yrs 61 9.82%
Requirements: Home Prnt/Grdn 512 82.45% 10 to 13 yrs 62 9.98%
Risk Factors: No 501 80.68% Community Care 52 8.37% 14 to 17 yrs 65 10.47%
None 476* 76.65% Yes 120** 19.32% Indep Living 37 5.96% 18 to 21 yrs 67 10.79%
One 117 18.84% ICF 13 2.09% 22 to 31 yrs 137 22.06%
Two 20 3.22% Dev Center 1 0.16% 32 to 41 yrs 80 12.88%
3 or More 8 1.29% Technology Dependent: SNF 1 0.16% 42 to 51 yrs 49 7.89%
No 591 95.17% Other 5 0.81% 52 to 61 yrs 37 5.96%
Yes 30** 4.83% 62 and Older 10 1.61%
Dual Diagnoses:
No 573 92.27%
Yes 48 7.73% Vision Problems:
No 547 88.08% Evaluation Scale Averages: Ethnicity:
Yes 74 11.92% (1=Disable 5=Able) Polynesian 621 100.00%
Behavioral Medication:
No 534 85.99% Hearing Problems: Practical Independence 4.21
Yes 87 14.01% No 569 91.63% Personal & Social Skills 3.17
Yes 52 8.37% Challenging Behavior 4.18
Social Integration 3.55
Both Vision and Well Being 4.65
Hearing Problems:
No 602 96.94%
Yes 19 3.06%
* Includes "Not Assessed".
** Includes DC consumers.
Total active consumers with CDERs: 621
Note: CDER information not available for all consumers
Source: CDER Master File of Saturday, April 1, 2017 Table #41

State of California
Department of Developmental Services Thursday, April 6, 2017
Consumer Characteristics at the end of March 2017
Ethnicity - White
Intellectual Disability: Autism: Cerebral Palsy: Epilepsy: Other Developmental
No ID 34,432 37.83% No 61,632 67.72% No 77,070 84.68% No 74,964 82.37% Disabilities:
Mild ID 30,551 33.57% Autism 29,176 32.06% Yes 13,938 15.32% Yes 16,044 17.63% No 80,719 88.69%
Moderate 11,931 13.11% PDD 200 0.22% Only 2,597 2.85% Only 1,206 1.33% Yes 10,289 11.31%
Severe 5,340 5.87% Only 20,742 22.79% Only 5,791 6.36%
Profound 3,970 4.36%
Unspecfd 4,784 5.26%
Only 32,201 35.38%
Severe Behaviors: Medical Problems: Gender: Recency of Evaluations:
No 75,214 82.65% No 65,017 71.44% Female 33,571 36.89% Under 12 Months 77,909 85.61%
Yes 15,794 17.35% Yes 25,991 28.56% Male 57,437 63.11% 12 to 18 Months 8,327 9.15%
18 to 24 Months 2,159 2.37%
24 to 36 Months 1,811 1.99%
Special Conditions Unable to Walk English Spoken: Over 36 Months 802 0.88%
or Behaviors: (Without Support): (as Primary Language)
None 82,720* 90.89% No 69,513 76.38% No 1,310 1.44%
One 4,896 5.38% Yes 21,495 23.62% Yes 89,698 98.56% Age Groups:
Two 2,058 2.26% (Ages 0-2 not collected on CDER)
3 or More 1,334 1.47% 0 to 2 yrs 66 0.07%
Special Health Care Residence Type: 3 to 5 yrs 4,542 4.99%
Requirements: Home Prnt/Grdn 54,707 60.11% 6 to 9 yrs 6,833 7.51%
Risk Factors: No 66,882 73.49% Community Care 15,003 16.49% 10 to 13 yrs 7,157 7.86%
None 69,841* 76.74% Yes 24,126** 26.51% Indep Living 14,764 16.22% 14 to 17 yrs 7,140 7.85%
One 15,273 16.78% ICF 4,632 5.09% 18 to 21 yrs 7,659 8.42%
Two 3,886 4.27% Dev Center 523 0.57% 22 to 31 yrs 17,332 19.04%
3 or More 2,008 2.21% Technology Dependent: SNF 706 0.78% 32 to 41 yrs 11,084 12.18%
No 85,682 94.15% Other 673 0.74% 42 to 51 yrs 9,792 10.76%
Yes 5,326** 5.85% 52 to 61 yrs 11,183 12.29%
Dual Diagnoses: 62 and Older 8,220 9.03%
No 76,373 83.92%
Yes 14,635 16.08% Vision Problems:
No 78,604 86.37% Evaluation Scale Averages: Ethnicity:
Yes 12,404 13.63% (1=Disable 5=Able) White 91,008 100.00%
Behavioral Medication:
No 65,947 72.46% Hearing Problems: Practical Independence 4.33
Yes 25,061 27.54% No 85,902 94.39% Personal & Social Skills 3.43
Yes 5,106 5.61% Challenging Behavior 4.23
Social Integration 3.66
Both Vision and Well Being 4.66
Hearing Problems:
No 88,937 97.72%
Yes 2,071 2.28%
* Includes "Not Assessed".
** Includes DC consumers.
Total active consumers with CDERs: 91,008
Note: CDER information not available for all consumers
Source: CDER Master File of Saturday, April 1, 2017 Table #42

State of California
Department of Developmental Services Thursday, April 6, 2017
Consumer Characteristics at the end of March 2017
Ethnicity - Other Ethnicities
Intellectual Disability: Autism: Cerebral Palsy: Epilepsy: Other Developmental
No ID 12,162 50.58% No 11,926 49.60% No 21,363 88.85% No 21,415 89.06% Disabilities:
Mild ID 5,829 24.24% Autism 12,086 50.26% Yes 2,682 11.15% Yes 2,630 10.94% No 21,706 90.27%
Moderate 2,215 9.21% PDD 33 0.14% Only 536 2.23% Only 220 0.91% Yes 2,339 9.73%
Severe 929 3.86% Only 9,013 37.48% Only 1,323 5.50%
Profound 401 1.67%
Unspecfd 2,509 10.43%
Only 6,484 26.97%
Severe Behaviors: Medical Problems: Gender: Recency of Evaluations:
No 18,022 74.95% No 20,101 83.60% Female 7,475 31.09% Under 12 Months 20,830 86.63%
Yes 6,023 25.05% Yes 3,944 16.40% Male 16,570 68.91% 12 to 18 Months 2,188 9.10%
18 to 24 Months 511 2.13%
24 to 36 Months 346 1.44%
Special Conditions Unable to Walk English Spoken: Over 36 Months 170 0.71%
or Behaviors: (Without Support): (as Primary Language)
None 23,135* 96.22% No 19,778 82.25% No 2,244 9.33%
One 532 2.21% Yes 4,267 17.75% Yes 21,801 90.67% Age Groups:
Two 209 0.87% (Ages 0-2 not collected on CDER)
3 or More 169 0.70% 0 to 2 yrs 34 0.14%
Special Health Care Residence Type: 3 to 5 yrs 4,127 17.16%
Requirements: Home Prnt/Grdn 20,770 86.38% 6 to 9 yrs 4,350 18.09%
Risk Factors: No 20,505 85.28% Community Care 1,513 6.29% 10 to 13 yrs 3,110 12.93%
None 18,717* 77.84% Yes 3,540** 14.72% Indep Living 1,254 5.22% 14 to 17 yrs 2,402 9.99%
One 4,019 16.71% ICF 264 1.10% 18 to 21 yrs 2,313 9.62%
Two 877 3.65% Dev Center 54 0.22% 22 to 31 yrs 4,267 17.75%
3 or More 432 1.80% Technology Dependent: SNF 44 0.18% 32 to 41 yrs 1,712 7.12%
No 22,924 95.34% Other 146 0.61% 42 to 51 yrs 877 3.65%
Yes 1,121** 4.66% 52 to 61 yrs 590 2.45%
Dual Diagnoses: 62 and Older 263 1.09%
No 21,884 91.01%
Yes 2,161 8.99% Vision Problems:
No 22,153 92.13% Evaluation Scale Averages: Ethnicity:
Yes 1,892 7.87% (1=Disable 5=Able) Other 24,045 100.00%
Behavioral Medication:
No 20,554 85.48% Hearing Problems: Practical Independence 4.17
Yes 3,491 14.52% No 23,087 96.02% Personal & Social Skills 3.07
Yes 958 3.98% Challenging Behavior 4.02
Social Integration 3.53
Both Vision and Well Being 4.61
Hearing Problems:
No 23,679 98.48%
Yes 366 1.52%
* Includes "Not Assessed".
** Includes DC consumers.
Total active consumers with CDERs: 24,045
Note: CDER information not available for all consumers
Source: CDER Master File of Saturday, April 1, 2017 Table #43
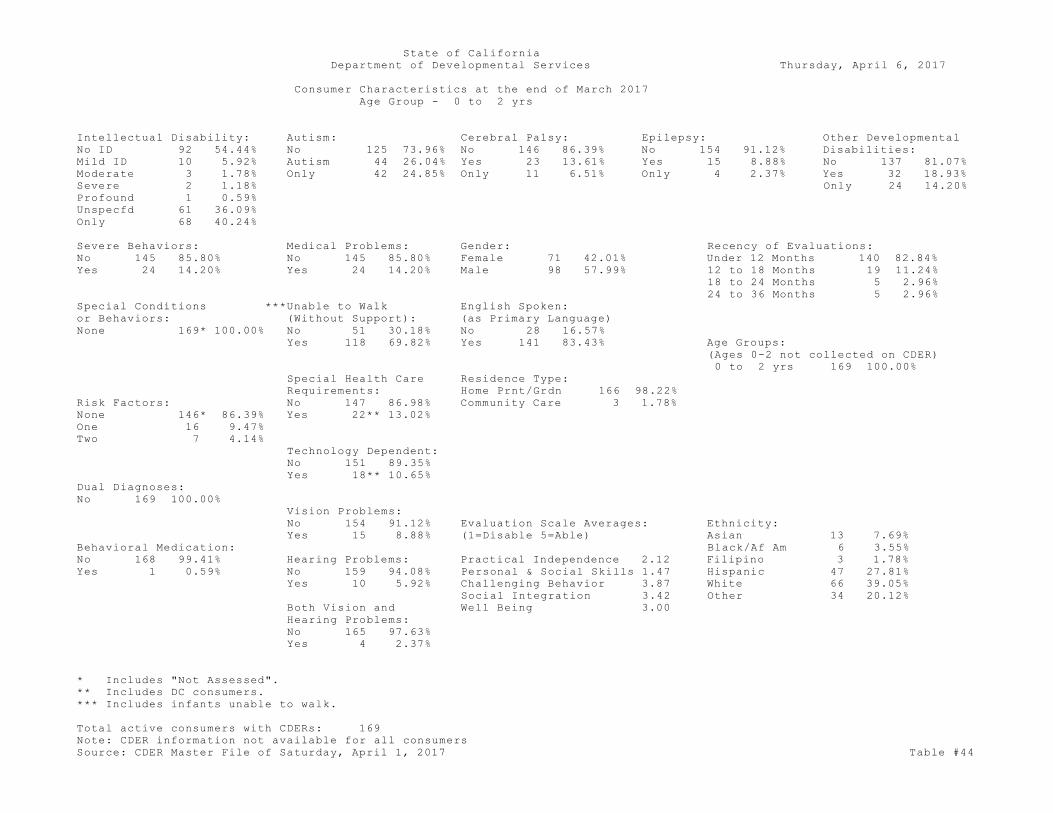
State of California
Department of Developmental Services Thursday, April 6, 2017
Consumer Characteristics at the end of March 2017
Age Group - 0 to 2 yrs
Intellectual Disability: Autism: Cerebral Palsy: Epilepsy: Other Developmental
No ID 92 54.44% No 125 73.96% No 146 86.39% No 154 91.12% Disabilities:
Mild ID 10 5.92% Autism 44 26.04% Yes 23 13.61% Yes 15 8.88% No 137 81.07%
Moderate 3 1.78% Only 42 24.85% Only 11 6.51% Only 4 2.37% Yes 32 18.93%
Severe 2 1.18% Only 24 14.20%
Profound 1 0.59%
Unspecfd 61 36.09%
Only 68 40.24%
Severe Behaviors: Medical Problems: Gender: Recency of Evaluations:
No 145 85.80% No 145 85.80% Female 71 42.01% Under 12 Months 140 82.84%
Yes 24 14.20% Yes 24 14.20% Male 98 57.99% 12 to 18 Months 19 11.24%
18 to 24 Months 5 2.96%
24 to 36 Months 5 2.96%
Special Conditions ***Unable to Walk English Spoken:
or Behaviors: (Without Support): (as Primary Language)
None 169* 100.00% No 51 30.18% No 28 16.57%
Yes 118 69.82% Yes 141 83.43% Age Groups:
(Ages 0-2 not collected on CDER)
0 to 2 yrs 169 100.00%
Special Health Care Residence Type:
Requirements: Home Prnt/Grdn 166 98.22%
Risk Factors: No 147 86.98% Community Care 3 1.78%
None 146* 86.39% Yes 22** 13.02%
One 16 9.47%
Two 7 4.14%
Technology Dependent:
No 151 89.35%
Yes 18** 10.65%
Dual Diagnoses:
No 169 100.00%
Vision Problems:
No 154 91.12% Evaluation Scale Averages: Ethnicity:
Yes 15 8.88% (1=Disable 5=Able) Asian 13 7.69%
Behavioral Medication: Black/Af Am 6 3.55%
No 168 99.41% Hearing Problems: Practical Independence 2.12 Filipino 3 1.78%
Yes 1 0.59% No 159 94.08% Personal & Social Skills 1.47 Hispanic 47 27.81%
Yes 10 5.92% Challenging Behavior 3.87 White 66 39.05%
Social Integration 3.42 Other 34 20.12%
Both Vision and Well Being 3.00
Hearing Problems:
No 165 97.63%
Yes 4 2.37%
* Includes "Not Assessed".
** Includes DC consumers.
*** Includes infants unable to walk.
Total active consumers with CDERs: 169
Note: CDER information not available for all consumers
Source: CDER Master File of Saturday, April 1, 2017 Table #44
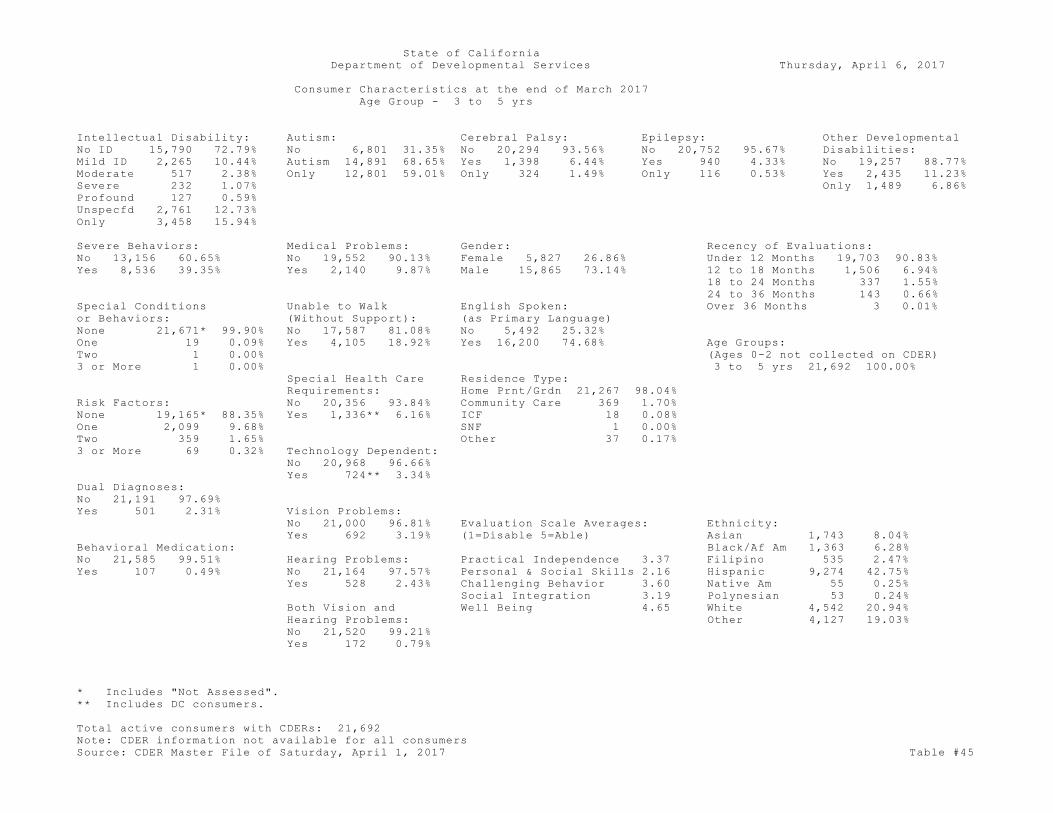
State of California
Department of Developmental Services Thursday, April 6, 2017
Consumer Characteristics at the end of March 2017
Age Group - 3 to 5 yrs
Intellectual Disability: Autism: Cerebral Palsy: Epilepsy: Other Developmental
No ID 15,790 72.79% No 6,801 31.35% No 20,294 93.56% No 20,752 95.67% Disabilities:
Mild ID 2,265 10.44% Autism 14,891 68.65% Yes 1,398 6.44% Yes 940 4.33% No 19,257 88.77%
Moderate 517 2.38% Only 12,801 59.01% Only 324 1.49% Only 116 0.53% Yes 2,435 11.23%
Severe 232 1.07% Only 1,489 6.86%
Profound 127 0.59%
Unspecfd 2,761 12.73%
Only 3,458 15.94%
Severe Behaviors: Medical Problems: Gender: Recency of Evaluations:
No 13,156 60.65% No 19,552 90.13% Female 5,827 26.86% Under 12 Months 19,703 90.83%
Yes 8,536 39.35% Yes 2,140 9.87% Male 15,865 73.14% 12 to 18 Months 1,506 6.94%
18 to 24 Months 337 1.55%
24 to 36 Months 143 0.66%
Special Conditions Unable to Walk English Spoken: Over 36 Months 3 0.01%
or Behaviors: (Without Support): (as Primary Language)
None 21,671* 99.90% No 17,587 81.08% No 5,492 25.32%
One 19 0.09% Yes 4,105 18.92% Yes 16,200 74.68% Age Groups:
Two 1 0.00% (Ages 0-2 not collected on CDER)
3 or More 1 0.00% 3 to 5 yrs 21,692 100.00%
Special Health Care Residence Type:
Requirements: Home Prnt/Grdn 21,267 98.04%
Risk Factors: No 20,356 93.84% Community Care 369 1.70%
None 19,165* 88.35% Yes 1,336** 6.16% ICF 18 0.08%
One 2,099 9.68% SNF 1 0.00%
Two 359 1.65% Other 37 0.17%
3 or More 69 0.32% Technology Dependent:
No 20,968 96.66%
Yes 724** 3.34%
Dual Diagnoses:
No 21,191 97.69%
Yes 501 2.31% Vision Problems:
No 21,000 96.81% Evaluation Scale Averages: Ethnicity:
Yes 692 3.19% (1=Disable 5=Able) Asian 1,743 8.04%
Behavioral Medication: Black/Af Am 1,363 6.28%
No 21,585 99.51% Hearing Problems: Practical Independence 3.37 Filipino 535 2.47%
Yes 107 0.49% No 21,164 97.57% Personal & Social Skills 2.16 Hispanic 9,274 42.75%
Yes 528 2.43% Challenging Behavior 3.60 Native Am 55 0.25%
Social Integration 3.19 Polynesian 53 0.24%
Both Vision and Well Being 4.65 White 4,542 20.94%
Hearing Problems: Other 4,127 19.03%
No 21,520 99.21%
Yes 172 0.79%
* Includes "Not Assessed".
** Includes DC consumers.
Total active consumers with CDERs: 21,692
Note: CDER information not available for all consumers
Source: CDER Master File of Saturday, April 1, 2017 Table #45
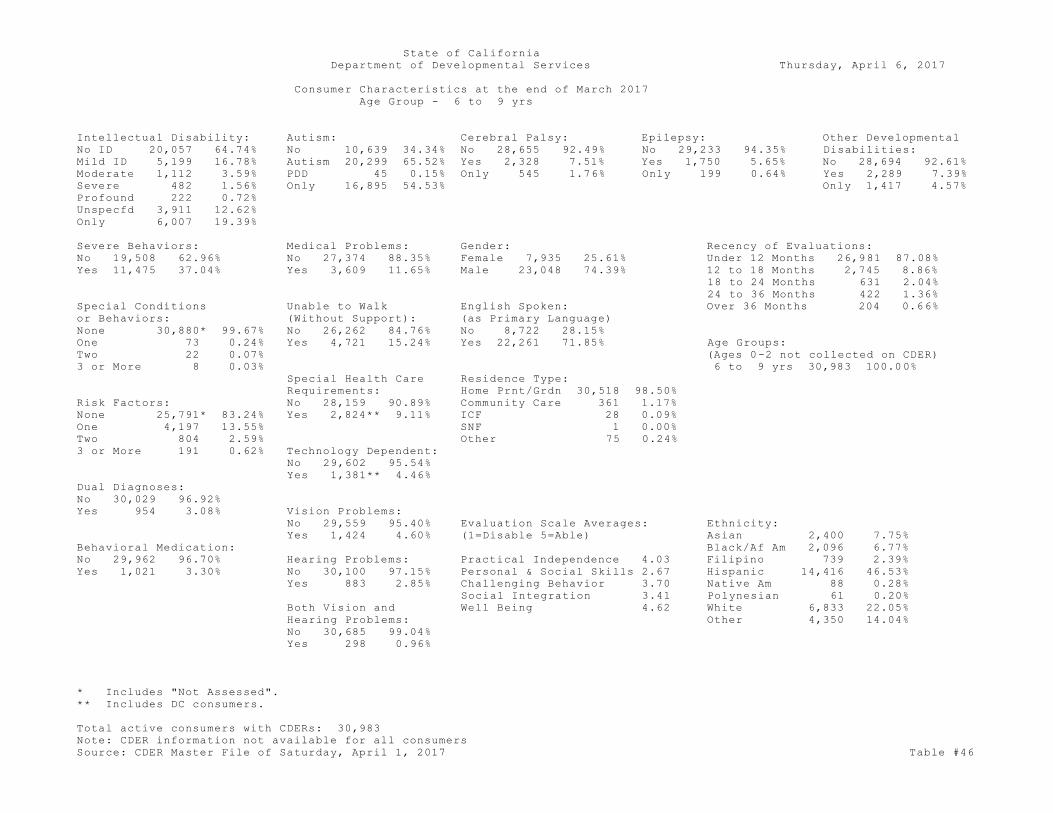
State of California
Department of Developmental Services Thursday, April 6, 2017
Consumer Characteristics at the end of March 2017
Age Group - 6 to 9 yrs
Intellectual Disability: Autism: Cerebral Palsy: Epilepsy: Other Developmental
No ID 20,057 64.74% No 10,639 34.34% No 28,655 92.49% No 29,233 94.35% Disabilities:
Mild ID 5,199 16.78% Autism 20,299 65.52% Yes 2,328 7.51% Yes 1,750 5.65% No 28,694 92.61%
Moderate 1,112 3.59% PDD 45 0.15% Only 545 1.76% Only 199 0.64% Yes 2,289 7.39%
Severe 482 1.56% Only 16,895 54.53% Only 1,417 4.57%
Profound 222 0.72%
Unspecfd 3,911 12.62%
Only 6,007 19.39%
Severe Behaviors: Medical Problems: Gender: Recency of Evaluations:
No 19,508 62.96% No 27,374 88.35% Female 7,935 25.61% Under 12 Months 26,981 87.08%
Yes 11,475 37.04% Yes 3,609 11.65% Male 23,048 74.39% 12 to 18 Months 2,745 8.86%
18 to 24 Months 631 2.04%
24 to 36 Months 422 1.36%
Special Conditions Unable to Walk English Spoken: Over 36 Months 204 0.66%
or Behaviors: (Without Support): (as Primary Language)
None 30,880* 99.67% No 26,262 84.76% No 8,722 28.15%
One 73 0.24% Yes 4,721 15.24% Yes 22,261 71.85% Age Groups:
Two 22 0.07% (Ages 0-2 not collected on CDER)
3 or More 8 0.03% 6 to 9 yrs 30,983 100.00%
Special Health Care Residence Type:
Requirements: Home Prnt/Grdn 30,518 98.50%
Risk Factors: No 28,159 90.89% Community Care 361 1.17%
None 25,791* 83.24% Yes 2,824** 9.11% ICF 28 0.09%
One 4,197 13.55% SNF 1 0.00%
Two 804 2.59% Other 75 0.24%
3 or More 191 0.62% Technology Dependent:
No 29,602 95.54%
Yes 1,381** 4.46%
Dual Diagnoses:
No 30,029 96.92%
Yes 954 3.08% Vision Problems:
No 29,559 95.40% Evaluation Scale Averages: Ethnicity:
Yes 1,424 4.60% (1=Disable 5=Able) Asian 2,400 7.75%
Behavioral Medication: Black/Af Am 2,096 6.77%
No 29,962 96.70% Hearing Problems: Practical Independence 4.03 Filipino 739 2.39%
Yes 1,021 3.30% No 30,100 97.15% Personal & Social Skills 2.67 Hispanic 14,416 46.53%
Yes 883 2.85% Challenging Behavior 3.70 Native Am 88 0.28%
Social Integration 3.41 Polynesian 61 0.20%
Both Vision and Well Being 4.62 White 6,833 22.05%
Hearing Problems: Other 4,350 14.04%
No 30,685 99.04%
Yes 298 0.96%
* Includes "Not Assessed".
** Includes DC consumers.
Total active consumers with CDERs: 30,983
Note: CDER information not available for all consumers
Source: CDER Master File of Saturday, April 1, 2017 Table #46

State of California
Department of Developmental Services Thursday, April 6, 2017
Consumer Characteristics at the end of March 2017
Age Group - 10 to 13 yrs
Intellectual Disability: Autism: Cerebral Palsy: Epilepsy: Other Developmental
No ID 15,948 55.77% No 12,263 42.88% No 26,001 90.92% No 26,307 91.99% Disabilities:
Mild ID 6,370 22.27% Autism 16,256 56.84% Yes 2,597 9.08% Yes 2,291 8.01% No 26,202 91.62%
Moderate 1,784 6.24% PDD 79 0.28% Only 529 1.85% Only 232 0.81% Yes 2,396 8.38%
Severe 554 1.94% Only 12,609 44.09% Only 1,423 4.98%
Profound 274 0.96%
Unspecfd 3,668 12.83%
Only 7,079 24.75%
Severe Behaviors: Medical Problems: Gender: Recency of Evaluations:
No 20,436 71.46% No 24,415 85.37% Female 7,837 27.40% Under 12 Months 24,922 87.15%
Yes 8,162 28.54% Yes 4,183 14.63% Male 20,761 72.60% 12 to 18 Months 2,404 8.41%
18 to 24 Months 530 1.85%
24 to 36 Months 430 1.50%
Special Conditions Unable to Walk English Spoken: Over 36 Months 312 1.09%
or Behaviors: (Without Support): (as Primary Language)
None 28,416* 99.36% No 24,267 84.86% No 8,744 30.58%
One 132 0.46% Yes 4,331 15.14% Yes 19,854 69.42% Age Groups:
Two 37 0.13% (Ages 0-2 not collected on CDER)
3 or More 13 0.05% 10 to 13 yrs 28,598 100.00%
Special Health Care Residence Type:
Requirements: Home Prnt/Grdn 28,024 97.99%
Risk Factors: No 25,051 87.60% Community Care 456 1.59%
None 22,650* 79.20% Yes 3,547** 12.40% ICF 42 0.15%
One 4,663 16.31% SNF 1 0.00%
Two 978 3.42% Other 75 0.26%
3 or More 307 1.07% Technology Dependent:
No 26,985 94.36%
Yes 1,613** 5.64%
Dual Diagnoses:
No 27,082 94.70%
Yes 1,516 5.30% Vision Problems:
No 26,860 93.92% Evaluation Scale Averages: Ethnicity:
Yes 1,738 6.08% (1=Disable 5=Able) Asian 2,178 7.62%
Behavioral Medication: Black/Af Am 1,974 6.90%
No 26,235 91.74% Hearing Problems: Practical Independence 4.30 Filipino 725 2.54%
Yes 2,363 8.26% No 27,598 96.50% Personal & Social Skills 3.02 Hispanic 13,324 46.59%
Yes 1,000 3.50% Challenging Behavior 3.90 Native Am 68 0.24%
Social Integration 3.51 Polynesian 62 0.22%
Both Vision and Well Being 4.56 White 7,157 25.03%
Hearing Problems: Other 3,110 10.87%
No 28,199 98.60%
Yes 399 1.40%
* Includes "Not Assessed".
** Includes DC consumers.
Total active consumers with CDERs: 28,598
Note: CDER information not available for all consumers
Source: CDER Master File of Saturday, April 1, 2017 Table #47
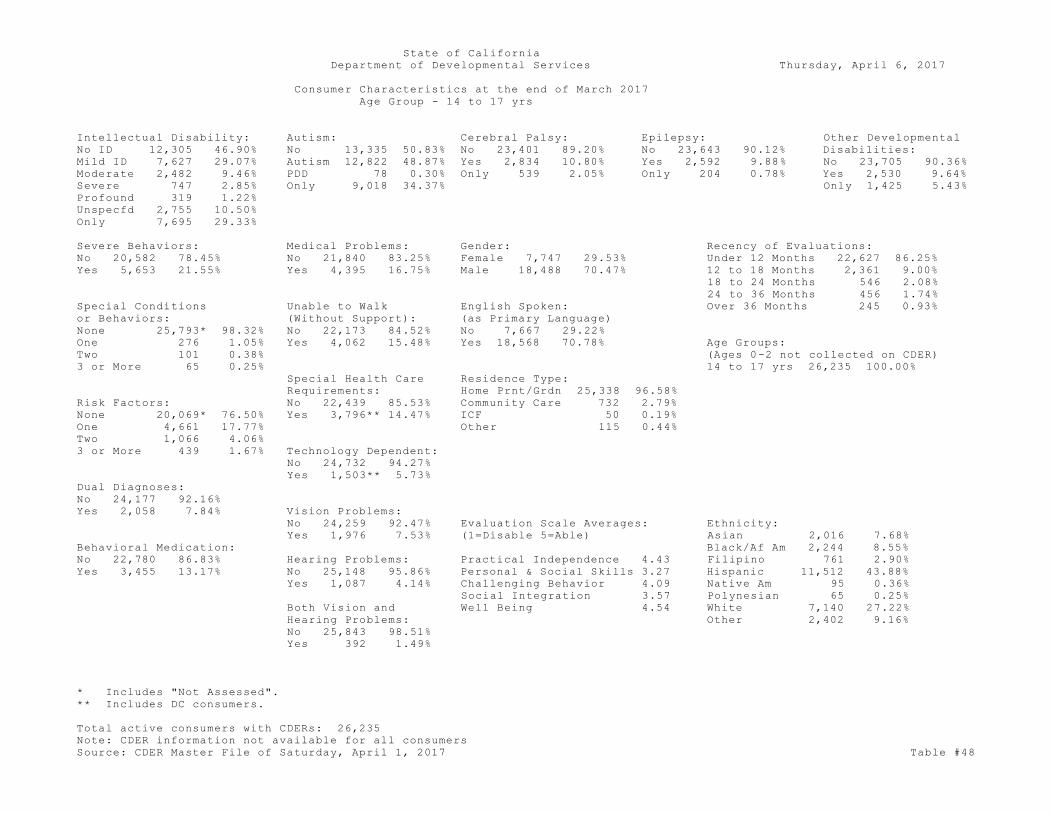
State of California
Department of Developmental Services Thursday, April 6, 2017
Consumer Characteristics at the end of March 2017
Age Group - 14 to 17 yrs
Intellectual Disability: Autism: Cerebral Palsy: Epilepsy: Other Developmental
No ID 12,305 46.90% No 13,335 50.83% No 23,401 89.20% No 23,643 90.12% Disabilities:
Mild ID 7,627 29.07% Autism 12,822 48.87% Yes 2,834 10.80% Yes 2,592 9.88% No 23,705 90.36%
Moderate 2,482 9.46% PDD 78 0.30% Only 539 2.05% Only 204 0.78% Yes 2,530 9.64%
Severe 747 2.85% Only 9,018 34.37% Only 1,425 5.43%
Profound 319 1.22%
Unspecfd 2,755 10.50%
Only 7,695 29.33%
Severe Behaviors: Medical Problems: Gender: Recency of Evaluations:
No 20,582 78.45% No 21,840 83.25% Female 7,747 29.53% Under 12 Months 22,627 86.25%
Yes 5,653 21.55% Yes 4,395 16.75% Male 18,488 70.47% 12 to 18 Months 2,361 9.00%
18 to 24 Months 546 2.08%
24 to 36 Months 456 1.74%
Special Conditions Unable to Walk English Spoken: Over 36 Months 245 0.93%
or Behaviors: (Without Support): (as Primary Language)
None 25,793* 98.32% No 22,173 84.52% No 7,667 29.22%
One 276 1.05% Yes 4,062 15.48% Yes 18,568 70.78% Age Groups:
Two 101 0.38% (Ages 0-2 not collected on CDER)
3 or More 65 0.25% 14 to 17 yrs 26,235 100.00%
Special Health Care Residence Type:
Requirements: Home Prnt/Grdn 25,338 96.58%
Risk Factors: No 22,439 85.53% Community Care 732 2.79%
None 20,069* 76.50% Yes 3,796** 14.47% ICF 50 0.19%
One 4,661 17.77% Other 115 0.44%
Two 1,066 4.06%
3 or More 439 1.67% Technology Dependent:
No 24,732 94.27%
Yes 1,503** 5.73%
Dual Diagnoses:
No 24,177 92.16%
Yes 2,058 7.84% Vision Problems:
No 24,259 92.47% Evaluation Scale Averages: Ethnicity:
Yes 1,976 7.53% (1=Disable 5=Able) Asian 2,016 7.68%
Behavioral Medication: Black/Af Am 2,244 8.55%
No 22,780 86.83% Hearing Problems: Practical Independence 4.43 Filipino 761 2.90%
Yes 3,455 13.17% No 25,148 95.86% Personal & Social Skills 3.27 Hispanic 11,512 43.88%
Yes 1,087 4.14% Challenging Behavior 4.09 Native Am 95 0.36%
Social Integration 3.57 Polynesian 65 0.25%
Both Vision and Well Being 4.54 White 7,140 27.22%
Hearing Problems: Other 2,402 9.16%
No 25,843 98.51%
Yes 392 1.49%
* Includes "Not Assessed".
** Includes DC consumers.
Total active consumers with CDERs: 26,235
Note: CDER information not available for all consumers
Source: CDER Master File of Saturday, April 1, 2017 Table #48

State of California
Department of Developmental Services Thursday, April 6, 2017
Consumer Characteristics at the end of March 2017
Age Group - 18 to 21 yrs
Intellectual Disability: Autism: Cerebral Palsy: Epilepsy: Other Developmental
No ID 10,352 39.64% No 15,886 60.82% No 22,714 86.97% No 22,812 87.34% Disabilities:
Mild ID 9,266 35.48% Autism 10,142 38.83% Yes 3,404 13.03% Yes 3,306 12.66% No 23,289 89.17%
Moderate 3,078 11.78% PDD 90 0.34% Only 629 2.41% Only 280 1.07% Yes 2,829 10.83%
Severe 1,117 4.28% Only 6,634 25.40% Only 1,635 6.26%
Profound 378 1.45%
Unspecfd 1,927 7.38%
Only 9,084 34.78%
Severe Behaviors: Medical Problems: Gender: Recency of Evaluations:
No 22,253 85.20% No 21,304 81.57% Female 8,376 32.07% Under 12 Months 22,338 85.53%
Yes 3,865 14.80% Yes 4,814 18.43% Male 17,742 67.93% 12 to 18 Months 2,492 9.54%
18 to 24 Months 617 2.36%
24 to 36 Months 405 1.55%
Special Conditions Unable to Walk English Spoken: Over 36 Months 266 1.02%
or Behaviors: (Without Support): (as Primary Language)
None 25,356* 97.08% No 21,855 83.68% No 7,192 27.54%
One 467 1.79% Yes 4,263 16.32% Yes 18,926 72.46% Age Groups:
Two 169 0.65% (Ages 0-2 not collected on CDER)
3 or More 126 0.48% 18 to 21 yrs 26,118 100.00%
Special Health Care Residence Type:
Requirements: Home Prnt/Grdn 24,109 92.31%
Risk Factors: No 22,025 84.33% Community Care 1,197 4.58%
None 18,962* 72.60% Yes 4,093** 15.67% Indep Living 395 1.51%
One 5,262 20.15% ICF 152 0.58%
Two 1,305 5.00% Dev Center 11 0.04%
3 or More 589 2.26% Technology Dependent: SNF 3 0.01%
No 24,631 94.31% Other 251 0.96%
Yes 1,487** 5.69%
Dual Diagnoses:
No 23,571 90.25%
Yes 2,547 9.75% Vision Problems:
No 23,727 90.85% Evaluation Scale Averages: Ethnicity:
Yes 2,391 9.15% (1=Disable 5=Able) Asian 1,795 6.87%
Behavioral Medication: Black/Af Am 2,516 9.63%
No 21,544 82.49% Hearing Problems: Practical Independence 4.49 Filipino 806 3.09%
Yes 4,574 17.51% No 24,807 94.98% Personal & Social Skills 3.49 Hispanic 10,864 41.60%
Yes 1,311 5.02% Challenging Behavior 4.30 Native Am 98 0.38%
Social Integration 3.59 Polynesian 67 0.26%
Both Vision and Well Being 4.55 White 7,659 29.32%
Hearing Problems: Other 2,313 8.86%
No 25,609 98.05%
Yes 509 1.95%
* Includes "Not Assessed".
** Includes DC consumers.
Total active consumers with CDERs: 26,118
Note: CDER information not available for all consumers
Source: CDER Master File of Saturday, April 1, 2017 Table #49
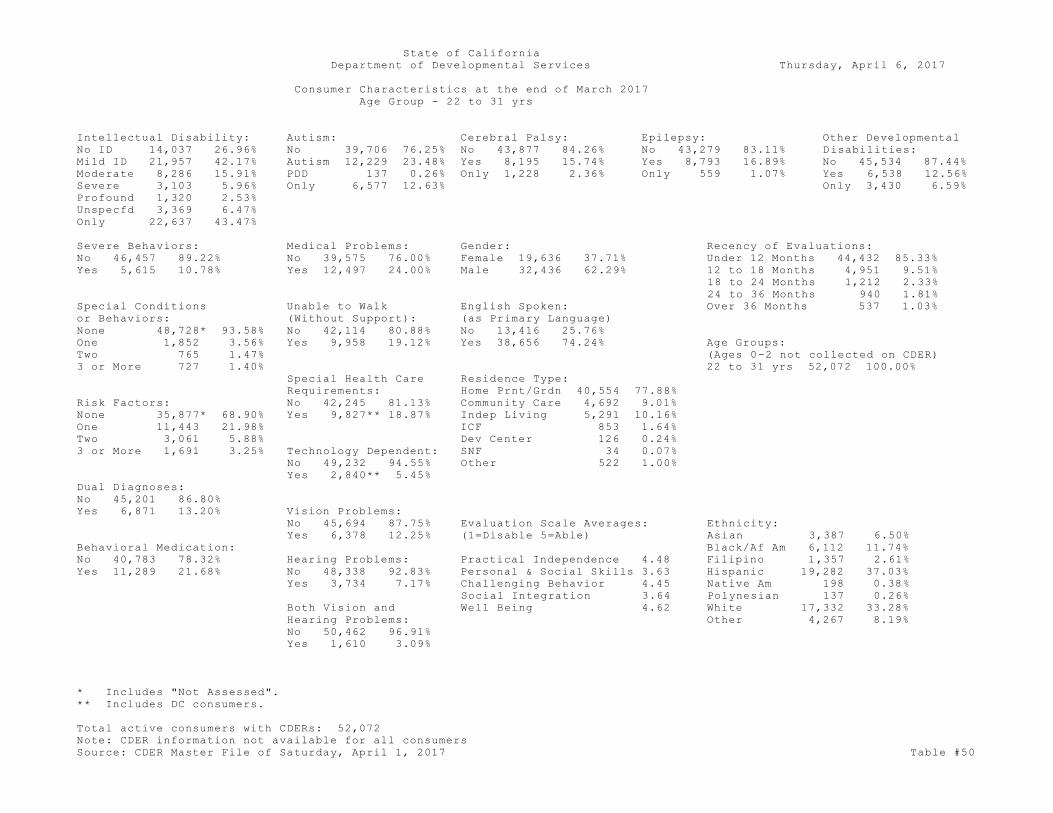
State of California
Department of Developmental Services Thursday, April 6, 2017
Consumer Characteristics at the end of March 2017
Age Group - 22 to 31 yrs
Intellectual Disability: Autism: Cerebral Palsy: Epilepsy: Other Developmental
No ID 14,037 26.96% No 39,706 76.25% No 43,877 84.26% No 43,279 83.11% Disabilities:
Mild ID 21,957 42.17% Autism 12,229 23.48% Yes 8,195 15.74% Yes 8,793 16.89% No 45,534 87.44%
Moderate 8,286 15.91% PDD 137 0.26% Only 1,228 2.36% Only 559 1.07% Yes 6,538 12.56%
Severe 3,103 5.96% Only 6,577 12.63% Only 3,430 6.59%
Profound 1,320 2.53%
Unspecfd 3,369 6.47%
Only 22,637 43.47%
Severe Behaviors: Medical Problems: Gender: Recency of Evaluations:
No 46,457 89.22% No 39,575 76.00% Female 19,636 37.71% Under 12 Months 44,432 85.33%
Yes 5,615 10.78% Yes 12,497 24.00% Male 32,436 62.29% 12 to 18 Months 4,951 9.51%
18 to 24 Months 1,212 2.33%
24 to 36 Months 940 1.81%
Special Conditions Unable to Walk English Spoken: Over 36 Months 537 1.03%
or Behaviors: (Without Support): (as Primary Language)
None 48,728* 93.58% No 42,114 80.88% No 13,416 25.76%
One 1,852 3.56% Yes 9,958 19.12% Yes 38,656 74.24% Age Groups:
Two 765 1.47% (Ages 0-2 not collected on CDER)
3 or More 727 1.40% 22 to 31 yrs 52,072 100.00%
Special Health Care Residence Type:
Requirements: Home Prnt/Grdn 40,554 77.88%
Risk Factors: No 42,245 81.13% Community Care 4,692 9.01%
None 35,877* 68.90% Yes 9,827** 18.87% Indep Living 5,291 10.16%
One 11,443 21.98% ICF 853 1.64%
Two 3,061 5.88% Dev Center 126 0.24%
3 or More 1,691 3.25% Technology Dependent: SNF 34 0.07%
No 49,232 94.55% Other 522 1.00%
Yes 2,840** 5.45%
Dual Diagnoses:
No 45,201 86.80%
Yes 6,871 13.20% Vision Problems:
No 45,694 87.75% Evaluation Scale Averages: Ethnicity:
Yes 6,378 12.25% (1=Disable 5=Able) Asian 3,387 6.50%
Behavioral Medication: Black/Af Am 6,112 11.74%
No 40,783 78.32% Hearing Problems: Practical Independence 4.48 Filipino 1,357 2.61%
Yes 11,289 21.68% No 48,338 92.83% Personal & Social Skills 3.63 Hispanic 19,282 37.03%
Yes 3,734 7.17% Challenging Behavior 4.45 Native Am 198 0.38%
Social Integration 3.64 Polynesian 137 0.26%
Both Vision and Well Being 4.62 White 17,332 33.28%
Hearing Problems: Other 4,267 8.19%
No 50,462 96.91%
Yes 1,610 3.09%
* Includes "Not Assessed".
** Includes DC consumers.
Total active consumers with CDERs: 52,072
Note: CDER information not available for all consumers
Source: CDER Master File of Saturday, April 1, 2017 Table #50

State of California
Department of Developmental Services Thursday, April 6, 2017
Consumer Characteristics at the end of March 2017
Age Group - 32 to 41 yrs
Intellectual Disability: Autism: Cerebral Palsy: Epilepsy: Other Developmental
No ID 4,607 16.12% No 25,704 89.94% No 23,027 80.57% No 21,962 76.84% Disabilities:
Mild ID 12,637 44.22% Autism 2,825 9.88% Yes 5,553 19.43% Yes 6,618 23.16% No 25,322 88.60%
Moderate 6,275 21.96% PDD 51 0.18% Only 727 2.54% Only 385 1.35% Yes 3,258 11.40%
Severe 2,681 9.38% Only 963 3.37% Only 1,601 5.60%
Profound 1,362 4.77%
Unspecfd 1,018 3.56%
Only 14,238 49.82%
Severe Behaviors: Medical Problems: Gender: Recency of Evaluations:
No 25,888 90.58% No 19,837 69.41% Female 12,302 43.04% Under 12 Months 24,510 85.76%
Yes 2,692 9.42% Yes 8,743 30.59% Male 16,278 56.96% 12 to 18 Months 2,659 9.30%
18 to 24 Months 620 2.17%
24 to 36 Months 558 1.95%
Special Conditions Unable to Walk English Spoken: Over 36 Months 233 0.82%
or Behaviors: (Without Support): (as Primary Language)
None 25,046* 87.63% No 21,907 76.65% No 6,897 24.13%
One 1,978 6.92% Yes 6,673 23.35% Yes 21,683 75.87% Age Groups:
Two 853 2.98% (Ages 0-2 not collected on CDER)
3 or More 703 2.46% 32 to 41 yrs 28,580 100.00%
Special Health Care Residence Type:
Requirements: Home Prnt/Grdn 16,665 58.31%
Risk Factors: No 20,914 73.18% Community Care 4,223 14.78%
None 20,580* 72.01% Yes 7,666** 26.82% Indep Living 6,162 21.56%
One 5,472 19.15% ICF 1,082 3.79%
Two 1,556 5.44% Dev Center 143 0.50%
3 or More 972 3.40% Technology Dependent: SNF 45 0.16%
No 27,146 94.98% Other 260 0.91%
Yes 1,434** 5.02%
Dual Diagnoses:
No 23,865 83.50%
Yes 4,715 16.50% Vision Problems:
No 24,170 84.57% Evaluation Scale Averages: Ethnicity:
Yes 4,410 15.43% (1=Disable 5=Able) Asian 1,852 6.48%
Behavioral Medication: Black/Af Am 3,510 12.28%
No 21,284 74.47% Hearing Problems: Practical Independence 4.44 Filipino 776 2.72%
Yes 7,296 25.53% No 26,358 92.23% Personal & Social Skills 3.68 Hispanic 9,452 33.07%
Yes 2,222 7.77% Challenging Behavior 4.48 Native Am 114 0.40%
Social Integration 3.65 Polynesian 80 0.28%
Both Vision and Well Being 4.66 White 11,084 38.78%
Hearing Problems: Other 1,712 5.99%
No 27,686 96.87%
Yes 894 3.13%
* Includes "Not Assessed".
** Includes DC consumers.
Total active consumers with CDERs: 28,580
Note: CDER information not available for all consumers
Source: CDER Master File of Saturday, April 1, 2017 Table #51

State of California
Department of Developmental Services Thursday, April 6, 2017
Consumer Characteristics at the end of March 2017
Age Group - 42 to 51 yrs
Intellectual Disability: Autism: Cerebral Palsy: Epilepsy: Other Developmental
No ID 2,804 13.88% No 18,679 92.43% No 16,393 81.12% No 15,039 74.42% Disabilities:
Mild ID 8,751 43.30% Autism 1,511 7.48% Yes 3,816 18.88% Yes 5,170 25.58% No 18,076 89.45%
Moderate 4,755 23.53% PDD 19 0.09% Only 514 2.54% Only 316 1.56% Yes 2,133 10.55%
Severe 2,157 10.67% Only 368 1.82% Only 1,021 5.05%
Profound 1,448 7.17%
Unspecfd 294 1.45%
Only 10,259 50.76%
Severe Behaviors: Medical Problems: Gender: Recency of Evaluations:
No 18,582 91.95% No 12,554 62.12% Female 9,181 45.43% Under 12 Months 17,336 85.78%
Yes 1,627 8.05% Yes 7,655 37.88% Male 11,028 54.57% 12 to 18 Months 1,886 9.33%
18 to 24 Months 456 2.26%
24 to 36 Months 370 1.83%
Special Conditions Unable to Walk English Spoken: Over 36 Months 161 0.80%
or Behaviors: (Without Support): (as Primary Language)
None 16,990* 84.07% No 14,905 73.75% No 3,792 18.76%
One 1,843 9.12% Yes 5,304 26.25% Yes 16,417 81.24% Age Groups:
Two 809 4.00% (Ages 0-2 not collected on CDER)
3 or More 567 2.81% 42 to 51 yrs 20,209 100.00%
Special Health Care Residence Type:
Requirements: Home Prnt/Grdn 8,302 41.08%
Risk Factors: No 13,310 65.86% Community Care 4,618 22.85%
None 15,184* 75.13% Yes 6,899** 34.14% Indep Living 5,534 27.38%
One 3,520 17.42% ICF 1,309 6.48%
Two 976 4.83% Dev Center 147 0.73%
3 or More 529 2.62% Technology Dependent: SNF 117 0.58%
No 19,154 94.78% Other 182 0.90%
Yes 1,055** 5.22%
Dual Diagnoses:
No 16,134 79.84%
Yes 4,075 20.16% Vision Problems:
No 16,557 81.93% Evaluation Scale Averages: Ethnicity:
Yes 3,652 18.07% (1=Disable 5=Able) Asian 1,312 6.49%
Behavioral Medication: Black/Af Am 2,478 12.26%
No 13,893 68.75% Hearing Problems: Practical Independence 4.44 Filipino 494 2.44%
Yes 6,316 31.25% No 18,723 92.65% Personal & Social Skills 3.67 Hispanic 5,119 25.33%
Yes 1,486 7.35% Challenging Behavior 4.49 Native Am 88 0.44%
Social Integration 3.62 Polynesian 49 0.24%
Both Vision and Well Being 4.67 White 9,792 48.45%
Hearing Problems: Other 877 4.34%
No 19,558 96.78%
Yes 651 3.22%
* Includes "Not Assessed".
** Includes DC consumers.
Total active consumers with CDERs: 20,209
Note: CDER information not available for all consumers
Source: CDER Master File of Saturday, April 1, 2017 Table #52

State of California
Department of Developmental Services Thursday, April 6, 2017
Consumer Characteristics at the end of March 2017
Age Group - 52 to 61 yrs
Intellectual Disability: Autism: Cerebral Palsy: Epilepsy: Other Developmental
No ID 2,318 12.54% No 17,287 93.54% No 15,074 81.56% No 13,964 75.56% Disabilities:
Mild ID 8,097 43.81% Autism 1,178 6.37% Yes 3,407 18.44% Yes 4,517 24.44% No 16,756 90.67%
Moderate 3,970 21.48% PDD 16 0.09% Only 466 2.52% Only 293 1.59% Yes 1,725 9.33%
Severe 2,038 11.03% Only 287 1.55% Only 823 4.45%
Profound 1,895 10.25%
Unspecfd 163 0.88%
Only 9,820 53.14%
Severe Behaviors: Medical Problems: Gender: Recency of Evaluations:
No 17,102 92.54% No 10,141 54.87% Female 8,404 45.47% Under 12 Months 15,793 85.46%
Yes 1,379 7.46% Yes 8,340 45.13% Male 10,077 54.53% 12 to 18 Months 1,819 9.84%
18 to 24 Months 428 2.32%
24 to 36 Months 311 1.68%
Special Conditions Unable to Walk English Spoken: Over 36 Months 130 0.70%
or Behaviors: (Without Support): (as Primary Language)
None 15,492* 83.83% No 12,504 67.66% No 2,047 11.08%
One 1,795 9.71% Yes 5,977 32.34% Yes 16,434 88.92% Age Groups:
Two 761 4.12% (Ages 0-2 not collected on CDER)
3 or More 433 2.34% 52 to 61 yrs 18,481 100.00%
Special Health Care Residence Type:
Requirements: Home Prnt/Grdn 4,883 26.42%
Risk Factors: No 10,804 58.46% Community Care 5,565 30.11%
None 14,597* 78.98% Yes 7,677** 41.54% Indep Living 5,372 29.07%
One 2,802 15.16% ICF 1,945 10.52%
Two 710 3.84% Dev Center 228 1.23%
3 or More 372 2.01% Technology Dependent: SNF 294 1.59%
No 17,423 94.28% Other 194 1.05%
Yes 1,058** 5.72%
Dual Diagnoses:
No 14,116 76.38%
Yes 4,365 23.62% Vision Problems:
No 14,967 80.99% Evaluation Scale Averages: Ethnicity:
Yes 3,514 19.01% (1=Disable 5=Able) Asian 771 4.17%
Behavioral Medication: Black/Af Am 2,102 11.37%
No 11,939 64.60% Hearing Problems: Practical Independence 4.36 Filipino 323 1.75%
Yes 6,542 35.40% No 17,140 92.74% Personal & Social Skills 3.60 Hispanic 3,374 18.26%
Yes 1,341 7.26% Challenging Behavior 4.50 Native Am 101 0.55%
Social Integration 3.58 Polynesian 37 0.20%
Both Vision and Well Being 4.67 White 11,183 60.51%
Hearing Problems: Other 590 3.19%
No 17,902 96.87%
Yes 579 3.13%
* Includes "Not Assessed".
** Includes DC consumers.
Total active consumers with CDERs: 18,481
Note: CDER information not available for all consumers
Source: CDER Master File of Saturday, April 1, 2017 Table #53

State of California
Department of Developmental Services Thursday, April 6, 2017
Consumer Characteristics at the end of March 2017
Age Group - 62 and Older
Intellectual Disability: Autism: Cerebral Palsy: Epilepsy: Other Developmental
No ID 1,311 11.20% No 11,313 96.61% No 9,444 80.65% No 8,830 75.41% Disabilities:
Mild ID 5,169 44.14% Autism 391 3.34% Yes 2,266 19.35% Yes 2,880 24.59% No 10,785 92.10%
Moderate 2,408 20.56% PDD 6 0.05% Only 328 2.80% Only 163 1.39% Yes 925 7.90%
Severe 1,330 11.36% Only 89 0.76% Only 440 3.76%
Profound 1,377 11.76%
Unspecfd 115 0.98%
Only 6,457 55.14%
Severe Behaviors: Medical Problems: Gender: Recency of Evaluations:
No 11,017 94.08% No 5,378 45.93% Female 5,671 48.43% Under 12 Months 9,978 85.21%
Yes 693 5.92% Yes 6,332 54.07% Male 6,039 51.57% 12 to 18 Months 1,155 9.86%
18 to 24 Months 271 2.31%
24 to 36 Months 222 1.90%
Special Conditions Unable to Walk English Spoken: Over 36 Months 84 0.72%
or Behaviors: (Without Support): (as Primary Language)
None 10,166* 86.81% No 6,049 51.66% No 952 8.13%
One 1,035 8.84% Yes 5,661 48.34% Yes 10,758 91.87% Age Groups:
Two 345 2.95% (Ages 0-2 not collected on CDER)
3 or More 164 1.40% 62 and Older 11,710 100.00%
Special Health Care Residence Type:
Requirements: Home Prnt/Grdn 1,841 15.72%
Risk Factors: No 5,685 48.55% Community Care 4,278 36.53%
None 9,537* 81.44% Yes 6,025** 51.45% Indep Living 2,987 25.51%
One 1,619 13.83% ICF 1,657 14.15%
Two 384 3.28% Dev Center 196 1.67%
3 or More 170 1.45% Technology Dependent: SNF 617 5.27%
No 10,938 93.41% Other 134 1.14%
Yes 772** 6.59%
Dual Diagnoses:
No 8,780 74.98%
Yes 2,930 25.02% Vision Problems:
No 9,031 77.12% Evaluation Scale Averages: Ethnicity:
Yes 2,679 22.88% (1=Disable 5=Able) Asian 367 3.13%
Behavioral Medication: Black/Af Am 949 8.10%
No 7,248 61.90% Hearing Problems: Practical Independence 4.13 Filipino 144 1.23%
Yes 4,462 38.10% No 10,826 92.45% Personal & Social Skills 3.43 Hispanic 1,702 14.53%
Yes 884 7.55% Challenging Behavior 4.54 Native Am 55 0.47%
Social Integration 3.51 Polynesian 10 0.09%
Both Vision and Well Being 4.72 White 8,220 70.20%
Hearing Problems: Other 263 2.25%
No 11,330 96.75%
Yes 380 3.25%
* Includes "Not Assessed".
** Includes DC consumers.
Total active consumers with CDERs: 11,710
Note: CDER information not available for all consumers
Source: CDER Master File of Saturday, April 1, 2017 Table #54