Embed Size (px)
Citation preview
State of North Carolina 2009 Compensation & Benefits Report
presented December 2008 Office of State Personnel
Thomas H. Wright State Personnel Director
Table of Contents
I. Executive Summary 1
II. Introduction 2
North Carolina’s Pay Philosophy
III. Total Compensation 4 Total Compensation Model
IV. Economic Review 5 Wage and Salary Trends Consumer Price and Employment Cost Indices Compensation Trends Recruitment and Retention
V. Base Pay - Labor Market Analysis 9 Methodology Market Analysis Average Salary Overall Comparison Survey Findings for Selected Benchmark Classes Comparison to Southeastern States
Comparison to Contiguous States Comparison of NC Base Pay Increases to Local Municipalities
Comparison of Pay Increases of State Employees and NC Teachers New Graduates Starting Pay Analysis
Additional Analysis Turnover Rates and Cost Use of Salary Adjustment Funding VI. Benefits Analysis 19
Paid Time Off Analysis Vacation, Sick Leave & Holidays
Health Insurance Comparison to Southeastern States
Comparison to Local Government Practices Supplemental Insurance Products (Post-Tax and Pre-Tax Plans) Statewide Flexible Benefits Program (NC Flex) Retirement Supplemental Retirement Programs
VII. Base Pay and Salary Adjustment Fund Recommendations 25
VIII. Benefit Recommendations 26
APPENDIX 29 History of Legislative Increases for N.C. Employees Benchmark Classes - Labor Market Data Summary
1
CCOOMMPPEENNSSAATTIIOONN && BBEENNEEFFIITTSS RREEPPOORRTT:: DDEECCEEMMBBEERR 22000088
“The only unique asset that a business has for gaining a sustained competitive advantage over rivals is its workforce – the skills and dedication of its employees. There is no other sustainable advantage in the modern, high-tech, global economy.” –Robert Reich “If you spend the same amount of time and energy developing people as you do on budgeting, strategic planning and financial monitoring, the payoff will come in sustainable competitive advantage.” --Larry Bossidy and Ram Charan
I. EXECUTIVE SUMMARY As with all employers attempting to attract top talent in a tight job market, North Carolina must continue to maintain competitiveness through its total compensation programs and recognize that its employees – or “human capital” – are its most valuable asset. The past three years have seen across-the-board legislative increases that have generally shored up some overall market gaps -- including a 2.75% legislative cost-of-living adjustment in 2008. However, these cost-of-living adjustments have not been reflective of such relevant economic indicators the Consumer Price Index or average market movement. More importantly, across-the-board increases “reward” employees with the same percentage increase regardless of their level of contribution or their job’s value to the employing organization. For North Carolina to manage its talent effectively, its compensation programs must change from a “one size fits all” mentality to a performance culture that assigns more value to high-performing employees in key roles. While some job classifications’ average salaries have seen benefit of staying current with labor market through such compensation mechanisms as Career-banding, others have lagged behind. The State must consider all feasible options -- including incentive pay, variable pay, bonus pay programs, and proactive compensation planning and management -- to enhance the recruitment and retention of employees across the state’s many diverse occupational groups. More attention must be paid to critical labor market shortages and addressing North Carolina’s competitive position in a rapidly changing talent market. Health care options have improved since the introduction of the PPO program, but continue to be costly. Serious State Health Plan budget deficits in 2008 may mean changes in cost or coverage for state employees. Paid time off options can be improved, allowing a direct benefit to employees without high costs to the State. In continuing difficult financial times, we must pursue creative ways to be able to attract and maintain high performing employees. This is especially critical as the “Baby Boomer” generation begins to age out of the labor market over the next several years. The average age of the state workforce is steadily increasing and the need to recruit a new generation of employees is paramount. This next generation wants more flexibility in their total rewards package (direct compensation, benefits, development and work-life programs). Legislative support for pay innovations and funding for strategic compensation studies, competency-based pay systems, performance-based reward systems, improving benefits and attention to work life balance issues will clearly move North Carolina closer to its goal as an employer of choice while maintaining a commitment to cost-effective systems for managing its investment in its human capital.
2
Recommendations made from data analysis in this report are as follows: • Promote and support workforce planning, total compensation and employee engagement programs to
recruit and retain talent. Consider the state’s workforce as “human capital” and make appropriate investments to maintain and increase its quality. This is considered to be especially critical as the “baby boomer” generation continues to age out of the state’s workforce.
• Provide an allocation to each agency and university to use to reward employees based on
performance and competencies. This allocation differs from the traditional career-growth increase and performance bonus.
• Allow agencies and universities the flexibility to design performance and competency based pay
systems based on their organizational needs and culture, with consultation from the Office of State Personnel. OSP has created a Performance Solutions web site (www.performancesolutions.nc.gov) and has a staff of professionals dedicated to helping agencies and universities meet these needs.
• Allow development of Career-banding to continue, permitting the more progressive agencies to
facilitate rewarding their employees for development and assuming new duties. • In order to keep state employees’ salaries in line with overall labor market trends, the report
recommends a cost-of-living increase as funds will allow, preferably in line with average market movement.
• Change the State Health Plan Year from July 1 - June 30 to January 1 - December 31, so that SPA
employees can better plan their out-of-pocket expenses and strategies for NC Flex contributions and other benefit programs.
• Increase the employer's portion of the state health plan premium and give employees flexibility in
choosing how it is allocated (i.e. family coverage, medical savings accounts, supplemental retirement plans, etc.) according to individual benefits needs and preferences.
• Match a portion of employees' 401(k) contributions to be more competitive with local governments
and other Southeastern states (such as neighboring states Georgia and Virginia). • Centralize coordination of supplemental benefits and consolidate supplemental benefit plan offerings
in a menu approach for portability and cost savings. Allow employees to select plan products that meet their needs.
• Combine Leave Accrual categories 0-2 years of service and 2 years of service but less than 5 into
one category of 0-5 years of service. Increase the Vacation accrual rate by ¼ day per year; increase the Sick leave accrual rate by 2 days per year; increase the number of Holidays by one day in years where eleven are granted.
II. INTRODUCTION This Compensation & Benefits report responds to the requirements expressed in NCGS 126-7(b) [State Personnel Act] to guide the Governor and the General Assembly in making funding appropriations for State employees’ salary increases. The results of the compensation survey are presented to the
3
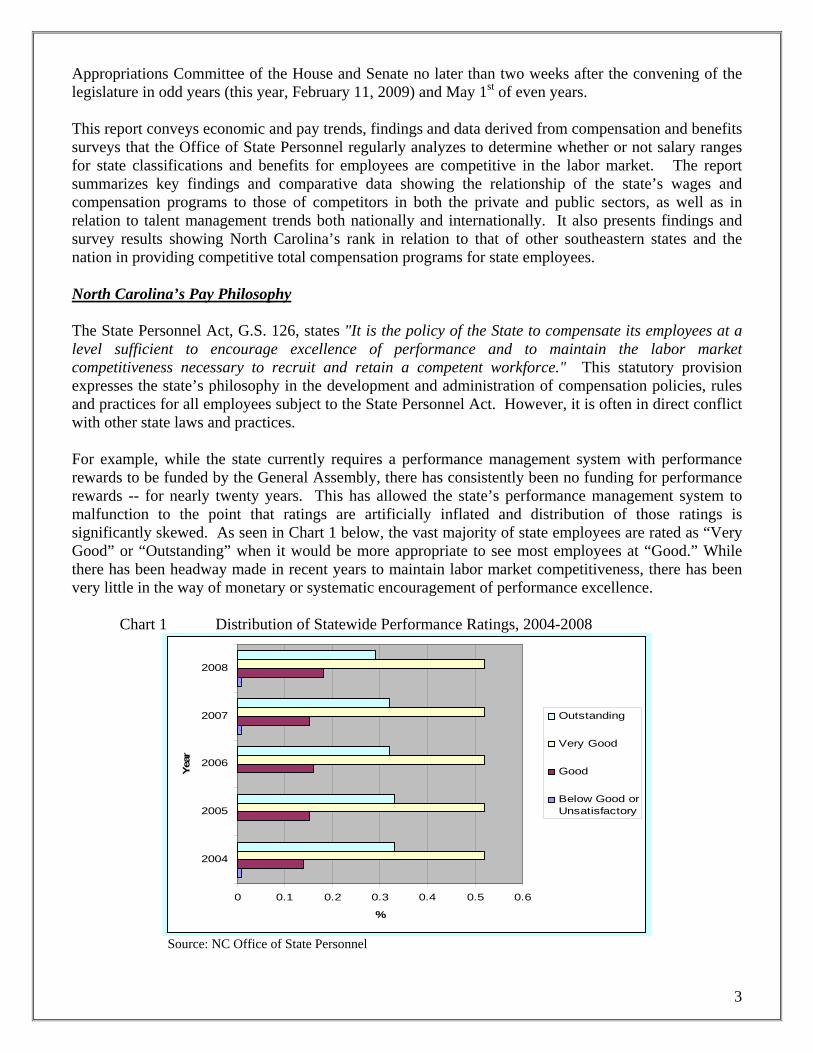
Appropriations Committee of the House and Senate no later than two weeks after the convening of the legislature in odd years (this year, February 11, 2009) and May 1st of even years. This report conveys economic and pay trends, findings and data derived from compensation and benefits surveys that the Office of State Personnel regularly analyzes to determine whether or not salary ranges for state classifications and benefits for employees are competitive in the labor market. The report summarizes key findings and comparative data showing the relationship of the state’s wages and compensation programs to those of competitors in both the private and public sectors, as well as in relation to talent management trends both nationally and internationally. It also presents findings and survey results showing North Carolina’s rank in relation to that of other southeastern states and the nation in providing competitive total compensation programs for state employees. North Carolina’s Pay Philosophy The State Personnel Act, G.S. 126, states "It is the policy of the State to compensate its employees at a level sufficient to encourage excellence of performance and to maintain the labor market competitiveness necessary to recruit and retain a competent workforce." This statutory provision expresses the state’s philosophy in the development and administration of compensation policies, rules and practices for all employees subject to the State Personnel Act. However, it is often in direct conflict with other state laws and practices. For example, while the state currently requires a performance management system with performance rewards to be funded by the General Assembly, there has consistently been no funding for performance rewards -- for nearly twenty years. This has allowed the state’s performance management system to malfunction to the point that ratings are artificially inflated and distribution of those ratings is significantly skewed. As seen in Chart 1 below, the vast majority of state employees are rated as “Very Good” or “Outstanding” when it would be more appropriate to see most employees at “Good.” While there has been headway made in recent years to maintain labor market competitiveness, there has been very little in the way of monetary or systematic encouragement of performance excellence.
Chart 1 Distribution of Statewide Performance Ratings, 2004-2008
0 0.1 0.2 0.3 0.4 0.5 0.6
2004
2005
2006
2007
2008
Year
%
Outstanding
Very Good
Good
Below Good orUnsatisfactory
Source: NC Office of State Personnel
4
III. TOTAL COMPENSATION The concept of Total Compensation is integral to any review or discussion of the state’s compensation system. Total compensation measures an employee’s base salary, benefits and other perquisites that the employer provides. When comparing compensation with that of other employers, whether public or private, the focus is on total compensation rather than base pay. This report includes comparisons of base pay as well as fringe benefits. It is important for employees to be knowledgeable of the value of their employment in terms of base pay, benefits, and other pay-related assets. When analyzing compensation surveys, base pay is often the common denominator in developing a comparative standard by which we can determine whether or not North Carolina state government compensation is competitive in various labor markets.
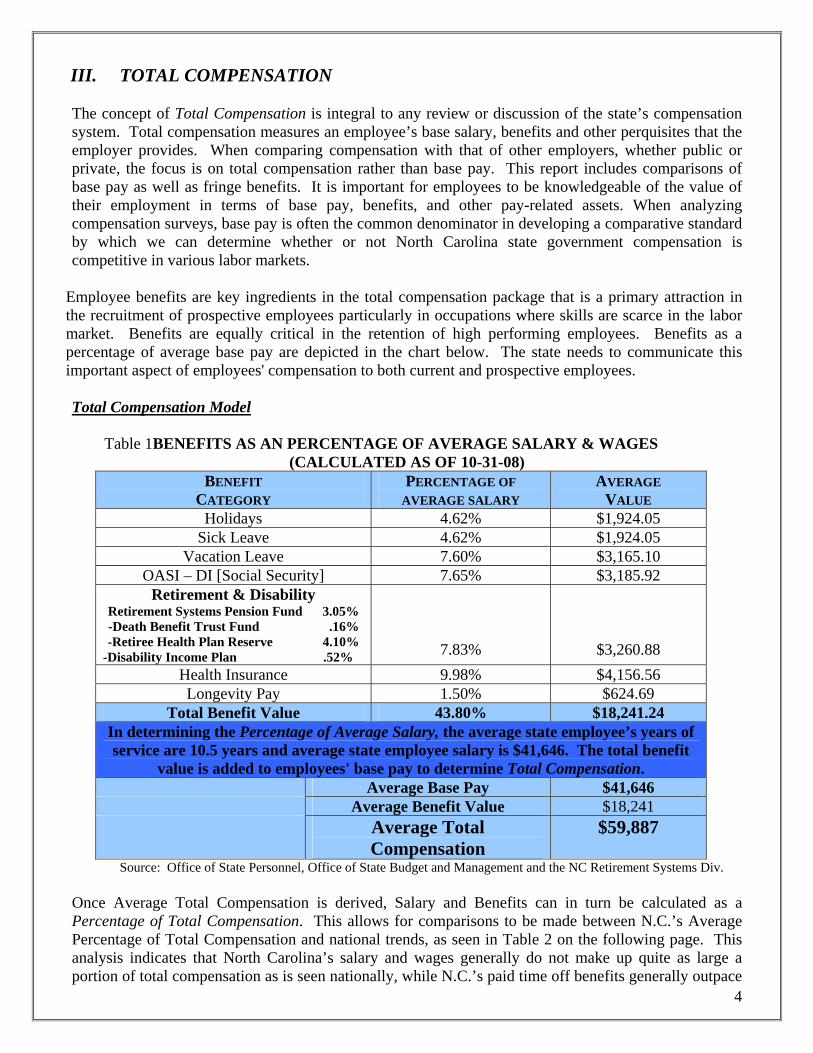
Employee benefits are key ingredients in the total compensation package that is a primary attraction in the recruitment of prospective employees particularly in occupations where skills are scarce in the labor market. Benefits are equally critical in the retention of high performing employees. Benefits as a percentage of average base pay are depicted in the chart below. The state needs to communicate this important aspect of employees' compensation to both current and prospective employees. Total Compensation Model Table 1BENEFITS AS AN PERCENTAGE OF AVERAGE SALARY & WAGES
(CALCULATED AS OF 10-31-08) BENEFIT
CATEGORY PERCENTAGE OF
AVERAGE SALARY AVERAGE
VALUE Holidays 4.62% $1,924.05
Sick Leave 4.62% $1,924.05 Vacation Leave 7.60% $3,165.10
OASI – DI [Social Security] 7.65% $3,185.92 Retirement & Disability
Retirement Systems Pension Fund 3.05% -Death Benefit Trust Fund .16% -Retiree Health Plan Reserve 4.10%
-Disability Income Plan .52%
7.83%
$3,260.88 Health Insurance 9.98% $4,156.56 Longevity Pay 1.50% $624.69
Total Benefit Value 43.80% $18,241.24 In determining the Percentage of Average Salary, the average state employee’s years of service are 10.5 years and average state employee salary is $41,646. The total benefit
value is added to employees' base pay to determine Total Compensation. Average Base Pay $41,646 Average Benefit Value $18,241 Average Total
Compensation $59,887
Source: Office of State Personnel, Office of State Budget and Management and the NC Retirement Systems Div. Once Average Total Compensation is derived, Salary and Benefits can in turn be calculated as a Percentage of Total Compensation. This allows for comparisons to be made between N.C.’s Average Percentage of Total Compensation and national trends, as seen in Table 2 on the following page. This analysis indicates that North Carolina’s salary and wages generally do not make up quite as large a portion of total compensation as is seen nationally, while N.C.’s paid time off benefits generally outpace
5
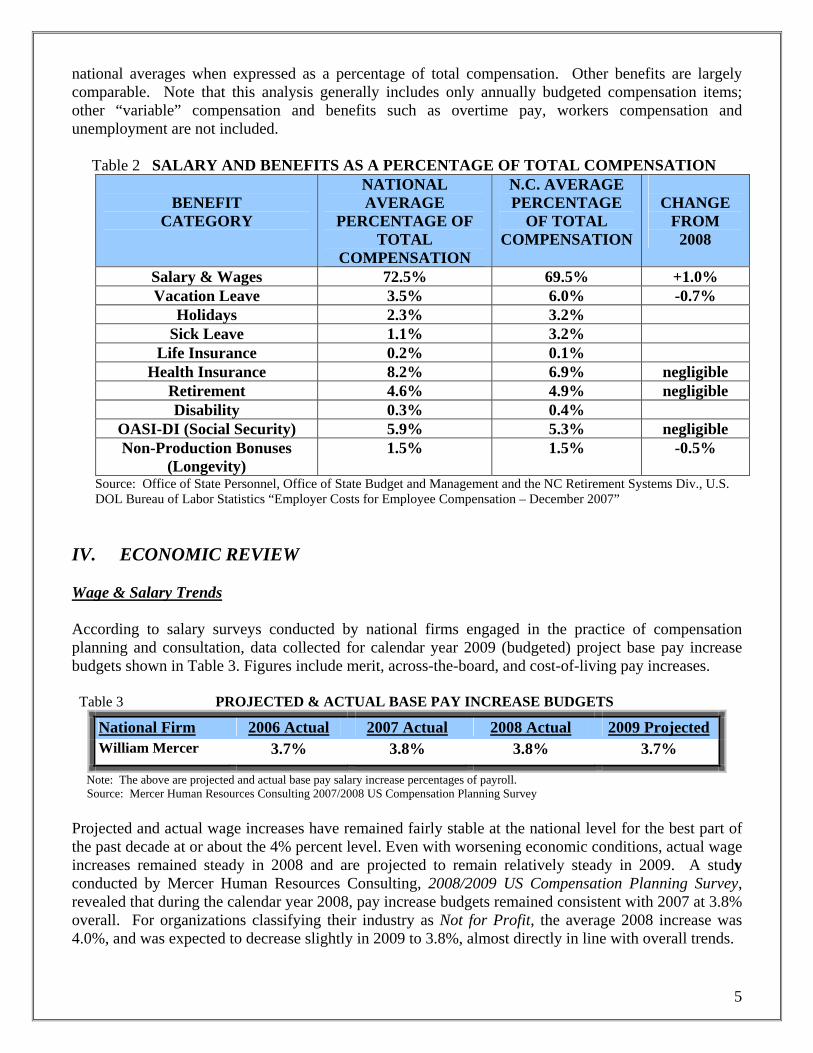
national averages when expressed as a percentage of total compensation. Other benefits are largely comparable. Note that this analysis generally includes only annually budgeted compensation items; other “variable” compensation and benefits such as overtime pay, workers compensation and unemployment are not included. Table 2 SALARY AND BENEFITS AS A PERCENTAGE OF TOTAL COMPENSATION
BENEFIT
CATEGORY
NATIONAL AVERAGE
PERCENTAGE OF TOTAL
COMPENSATION
N.C. AVERAGE PERCENTAGE
OF TOTAL COMPENSATION
CHANGE
FROM 2008
Salary & Wages 72.5% 69.5% +1.0% Vacation Leave 3.5% 6.0% -0.7%
Holidays 2.3% 3.2% Sick Leave 1.1% 3.2%
Life Insurance 0.2% 0.1% Health Insurance 8.2% 6.9% negligible
Retirement 4.6% 4.9% negligible Disability 0.3% 0.4%
OASI-DI (Social Security) 5.9% 5.3% negligible Non-Production Bonuses
(Longevity) 1.5% 1.5% -0.5%
Source: Office of State Personnel, Office of State Budget and Management and the NC Retirement Systems Div., U.S. DOL Bureau of Labor Statistics “Employer Costs for Employee Compensation – December 2007” IV. ECONOMIC REVIEW Wage & Salary Trends According to salary surveys conducted by national firms engaged in the practice of compensation planning and consultation, data collected for calendar year 2009 (budgeted) project base pay increase budgets shown in Table 3. Figures include merit, across-the-board, and cost-of-living pay increases. Table 3 PROJECTED & ACTUAL BASE PAY INCREASE BUDGETS
National Firm 2006 Actual 2007 Actual 2008 Actual 2009 Projected William Mercer 3.7% 3.8% 3.8% 3.7%
Note: The above are projected and actual base pay salary increase percentages of payroll. Source: Mercer Human Resources Consulting 2007/2008 US Compensation Planning Survey Projected and actual wage increases have remained fairly stable at the national level for the best part of the past decade at or about the 4% percent level. Even with worsening economic conditions, actual wage increases remained steady in 2008 and are projected to remain relatively steady in 2009. A study conducted by Mercer Human Resources Consulting, 2008/2009 US Compensation Planning Survey, revealed that during the calendar year 2008, pay increase budgets remained consistent with 2007 at 3.8% overall. For organizations classifying their industry as Not for Profit, the average 2008 increase was 4.0%, and was expected to decrease slightly in 2009 to 3.8%, almost directly in line with overall trends.
6
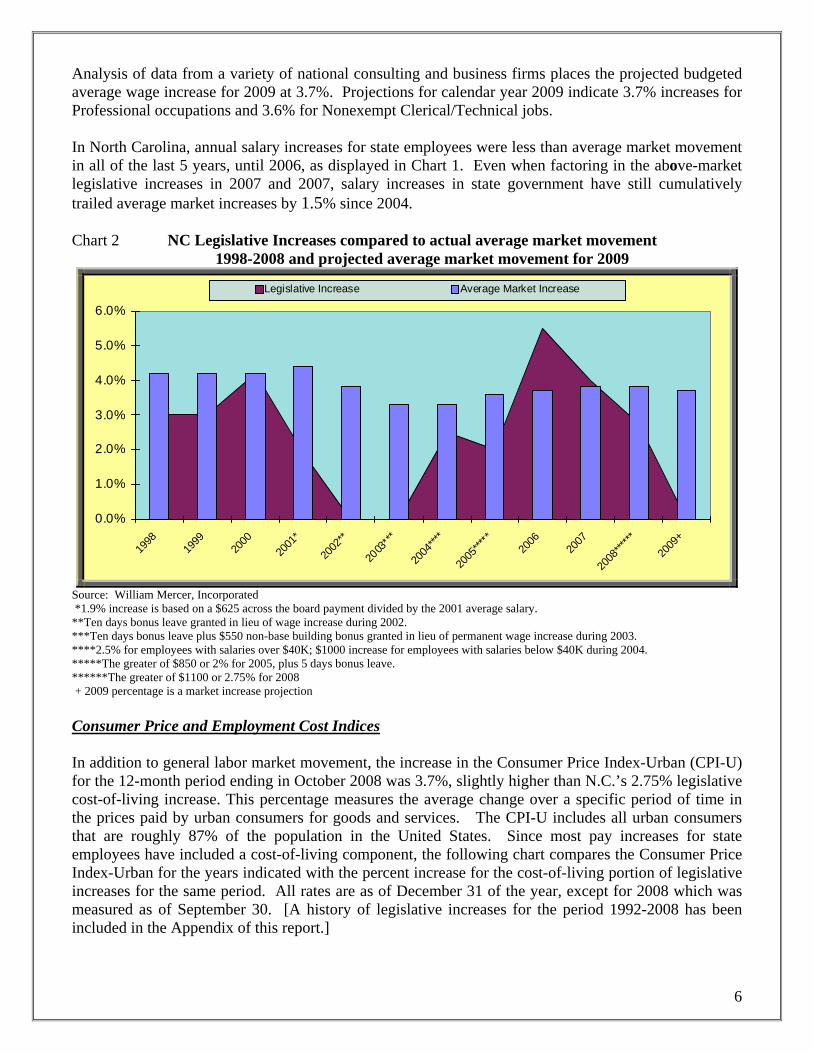
Analysis of data from a variety of national consulting and business firms places the projected budgeted average wage increase for 2009 at 3.7%. Projections for calendar year 2009 indicate 3.7% increases for Professional occupations and 3.6% for Nonexempt Clerical/Technical jobs. In North Carolina, annual salary increases for state employees were less than average market movement in all of the last 5 years, until 2006, as displayed in Chart 1. Even when factoring in the above-market legislative increases in 2007 and 2007, salary increases in state government have still cumulatively trailed average market increases by 1.5% since 2004. Chart 2 NC Legislative Increases compared to actual average market movement 1998-2008 and projected average market movement for 2009
0.0%
1.0%
2.0%
3.0%
4.0%
5.0%
6.0%
1998
1999
2000
2001
*
2002
**
2003
***
2004
****
2005
*****
2006
2007
2008
******
2009
+
Legislative Increase Average Market Increase
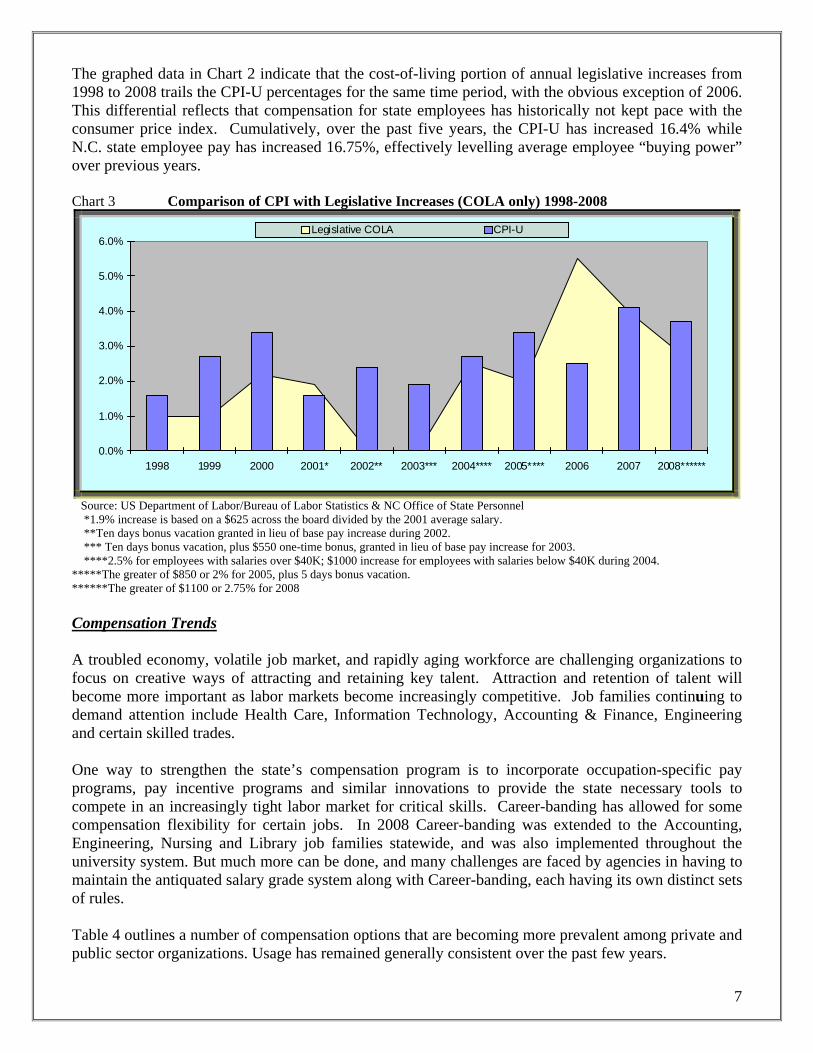
Source: William Mercer, Incorporated *1.9% increase is based on a $625 across the board payment divided by the 2001 average salary. **Ten days bonus leave granted in lieu of wage increase during 2002. ***Ten days bonus leave plus $550 non-base building bonus granted in lieu of permanent wage increase during 2003. ****2.5% for employees with salaries over $40K; $1000 increase for employees with salaries below $40K during 2004. *****The greater of $850 or 2% for 2005, plus 5 days bonus leave. ******The greater of $1100 or 2.75% for 2008 + 2009 percentage is a market increase projection Consumer Price and Employment Cost Indices In addition to general labor market movement, the increase in the Consumer Price Index-Urban (CPI-U) for the 12-month period ending in October 2008 was 3.7%, slightly higher than N.C.’s 2.75% legislative cost-of-living increase. This percentage measures the average change over a specific period of time in the prices paid by urban consumers for goods and services. The CPI-U includes all urban consumers that are roughly 87% of the population in the United States. Since most pay increases for state employees have included a cost-of-living component, the following chart compares the Consumer Price Index-Urban for the years indicated with the percent increase for the cost-of-living portion of legislative increases for the same period. All rates are as of December 31 of the year, except for 2008 which was measured as of September 30. [A history of legislative increases for the period 1992-2008 has been included in the Appendix of this report.]
7
The graphed data in Chart 2 indicate that the cost-of-living portion of annual legislative increases from 1998 to 2008 trails the CPI-U percentages for the same time period, with the obvious exception of 2006. This differential reflects that compensation for state employees has historically not kept pace with the consumer price index. Cumulatively, over the past five years, the CPI-U has increased 16.4% while N.C. state employee pay has increased 16.75%, effectively levelling average employee “buying power” over previous years. Chart 3 Comparison of CPI with Legislative Increases (COLA only) 1998-2008
0.0%
1.0%
2.0%
3.0%
4.0%
5.0%
6.0%
1998 1999 2000 2001* 2002** 2003*** 2004**** 2005**** 2006 2007 2008******
Legislative COLA CPI-U
Source: US Department of Labor/Bureau of Labor Statistics & NC Office of State Personnel *1.9% increase is based on a $625 across the board divided by the 2001 average salary. **Ten days bonus vacation granted in lieu of base pay increase during 2002. *** Ten days bonus vacation, plus $550 one-time bonus, granted in lieu of base pay increase for 2003. ****2.5% for employees with salaries over $40K; $1000 increase for employees with salaries below $40K during 2004. *****The greater of $850 or 2% for 2005, plus 5 days bonus vacation. ******The greater of $1100 or 2.75% for 2008 Compensation Trends A troubled economy, volatile job market, and rapidly aging workforce are challenging organizations to focus on creative ways of attracting and retaining key talent. Attraction and retention of talent will become more important as labor markets become increasingly competitive. Job families continuing to demand attention include Health Care, Information Technology, Accounting & Finance, Engineering and certain skilled trades. One way to strengthen the state’s compensation program is to incorporate occupation-specific pay programs, pay incentive programs and similar innovations to provide the state necessary tools to compete in an increasingly tight labor market for critical skills. Career-banding has allowed for some compensation flexibility for certain jobs. In 2008 Career-banding was extended to the Accounting, Engineering, Nursing and Library job families statewide, and was also implemented throughout the university system. But much more can be done, and many challenges are faced by agencies in having to maintain the antiquated salary grade system along with Career-banding, each having its own distinct sets of rules. Table 4 outlines a number of compensation options that are becoming more prevalent among private and public sector organizations. Usage has remained generally consistent over the past few years.
8
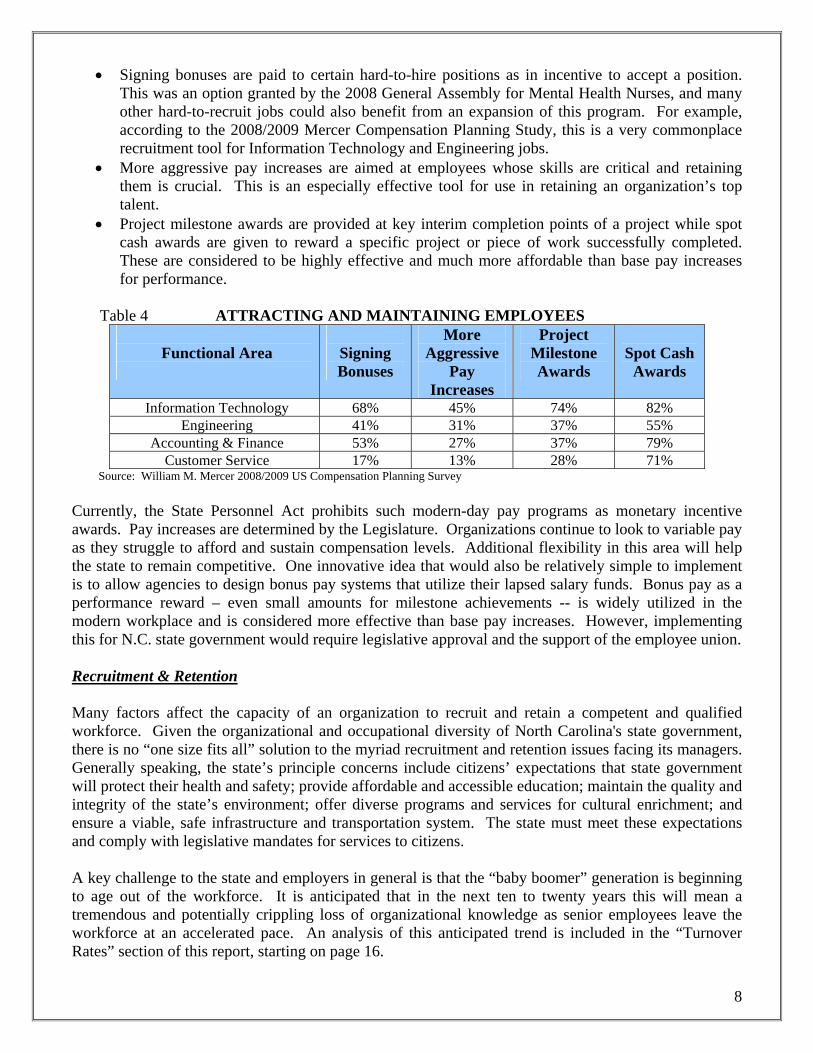
• Signing bonuses are paid to certain hard-to-hire positions as in incentive to accept a position. This was an option granted by the 2008 General Assembly for Mental Health Nurses, and many other hard-to-recruit jobs could also benefit from an expansion of this program. For example, according to the 2008/2009 Mercer Compensation Planning Study, this is a very commonplace recruitment tool for Information Technology and Engineering jobs.
• More aggressive pay increases are aimed at employees whose skills are critical and retaining them is crucial. This is an especially effective tool for use in retaining an organization’s top talent.
• Project milestone awards are provided at key interim completion points of a project while spot cash awards are given to reward a specific project or piece of work successfully completed. These are considered to be highly effective and much more affordable than base pay increases for performance.
Table 4 ATTRACTING AND MAINTAINING EMPLOYEES
Functional Area
Signing Bonuses
More Aggressive
Pay Increases
Project Milestone Awards
Spot Cash
Awards
Information Technology 68% 45% 74% 82% Engineering 41% 31% 37% 55%
Accounting & Finance 53% 27% 37% 79% Customer Service 17% 13% 28% 71%
Source: William M. Mercer 2008/2009 US Compensation Planning Survey
Currently, the State Personnel Act prohibits such modern-day pay programs as monetary incentive awards. Pay increases are determined by the Legislature. Organizations continue to look to variable pay as they struggle to afford and sustain compensation levels. Additional flexibility in this area will help the state to remain competitive. One innovative idea that would also be relatively simple to implement is to allow agencies to design bonus pay systems that utilize their lapsed salary funds. Bonus pay as a performance reward – even small amounts for milestone achievements -- is widely utilized in the modern workplace and is considered more effective than base pay increases. However, implementing this for N.C. state government would require legislative approval and the support of the employee union. Recruitment & Retention Many factors affect the capacity of an organization to recruit and retain a competent and qualified workforce. Given the organizational and occupational diversity of North Carolina's state government, there is no “one size fits all” solution to the myriad recruitment and retention issues facing its managers. Generally speaking, the state’s principle concerns include citizens’ expectations that state government will protect their health and safety; provide affordable and accessible education; maintain the quality and integrity of the state’s environment; offer diverse programs and services for cultural enrichment; and ensure a viable, safe infrastructure and transportation system. The state must meet these expectations and comply with legislative mandates for services to citizens. A key challenge to the state and employers in general is that the “baby boomer” generation is beginning to age out of the workforce. It is anticipated that in the next ten to twenty years this will mean a tremendous and potentially crippling loss of organizational knowledge as senior employees leave the workforce at an accelerated pace. An analysis of this anticipated trend is included in the “Turnover Rates” section of this report, starting on page 16.
9
Compensation and benefits are obviously key factors in the recruitment and retention of employees for any organization. In North Carolina, pay for state employees has not been consistent for a number of years with various indices that measure cost-of-living and market movement. Also, North Carolina is significantly behind private and public industry by not offering a match in the State’s 401(k) program. In a report from the Society of Human Resources Management (SHRM), two North Carolina metropolitan areas are in the top 20 for highest projected job growth in the decade from 2003 to 2013 (Raleigh-Durham and Charlotte at numbers 9 and 12, respectively), thus competition for qualified employees will grow. A joint SHRM/CNNfn (Cable News Network-Financial Network) Job Benefits Survey Report indicates the top five benefits most important to overall employee job satisfaction are health care/medical benefits, paid time off, retirement benefits (e.g., defined contribution plans and defined benefit plans, such as 401(k)), dental insurance and a prescription drug plan. As one example, medical and allied health occupations continue to present particular recruitment and retention concerns. A national shortage of nursing professionals since 1999 has exacerbated the state’s chronic difficulty in recruiting and retaining these direct care professionals in the state’s psychiatric and prison hospitals, student health services, and similar clinical settings. As reported in past reviews, there are a limited number of psychiatric nurses, as it is a specialized field and many nurses elect to work in other nursing fields. Finally, the mental health reform movement in North Carolina has prompted recommendations to close or consolidate the state’s existing psychiatric hospitals. This will likely further diminish the already too few number of nurses who might be interested in employment with the State. As cited in Section IV of this report, a potentially important step forward was made when the Legislature approved sign-on bonuses for mental health nurses. This has long been a common recruitment tool in the private sector that for years has not been allowed in N.C. state government. The state must continue to explore additional options for recruiting and retaining key roles such as mental health nurses, based on practices that are commonly utilized by our competitors as well as innovative techniques of our own. V. BASE PAY - LABOR MARKET ANALYSIS Methodology Public and private sector organizations rely upon salary surveys to ensure that they are making informed decisions about employee compensation in terms of cost-effectiveness, recruitment and retention. Sound compensation practices ultimately result in a workforce comprised of competent, skilled employees across multiple occupational areas. Their collective knowledge, skills and competencies directly relate to the accomplishment of the organization’s mission and vision. Salary surveys are therefore critical in pricing jobs, diagnosing compensation problems, determining wage parity with market competitors, and in monitoring internal pay equity. Survey data is also essential to organizations in terms of analyzing pay trends, identifying effective pay practices, and establishing a systematic method for setting competitive pay ranges for job classes. This report on North Carolina’s compensation practices conforms to these purposes for conducting salary and benefits surveys. The methodology for analyzing data and identifying pay trends is equally important. The information presented in this report derives from multiple national and local surveys, and it reflects benchmark classes that were deliberately selected to represent each of the twelve occupational groups in the state’s pay plan. The survey sample included 61 benchmark classes – a cross-section spanning ten major job families -- that represent nearly 1/3 of all employees subject to the State Personnel Act. After identifying the benchmark classes, appropriate labor markets were determined.
10
Current turnover and vacancy rate data for each class are included in the report. Market data was collected from the following published sources:
• William Mercer Human Resource Consulting – 2008/2009 US Compensation Planning Survey – A Study of Pay Increases, Incentive Compensation, and Emerging Practices. More than 1,000 organizations provided data for the 2008/2009 US Compensation Planning Survey, representing pay practices of more than 12 million workers. Data representing similar jobs in government, as well as local private industry, were used in comparisons to the State of North Carolina.
• Watson Wyatt 2007/2008 Survey Report on Hospital and Healthcare Professionals,
Nursing and Allied Services Personnel Compensation. A comprehensive document with data from 1,301 organizations reporting on 756,761 incumbents in hundreds of positions.
• Watson Wyatt 2007/2008 Survey Report on Hospital and Healthcare Management
Compensation. A survey of 936 organizations reporting data on 70,107 incumbents in hospital positions other than nursing and allied services.
• Watson Wyatt 2007/2008 Survey Report on Engineering, Design & Drafting Personnel
Compensation. A survey based on data from 926 organizations with 99,423 incumbents.
• Watson Wyatt 2008/2009 Survey Report on Technician and Skilled Trades Personnel Compensation. A survey based on data from 862 organizations with 498,298 incumbents.
• Watson Wyatt 2008/2009 Survey Report on Office Personnel Compensation. A survey
based on data from 981 organizations with 460,475 incumbents.
• Watson Wyatt ECS survey of Professional and Scientific Personnel – A computer based survey of salaries in geographic areas for professional and scientific personnel.
• Watson Wyatt 2006/2007 Report on Employee Benefits. Survey results regarding a wide
range of benefits from 596 organizations responsible for 4.2 million employees.
• CompBase USA – Data compiled from 369 companies compiling data on over 500 non-exempt and exempt jobs in the Administrative, Human Resources, Marketing/Sales, Accounting/Finance, Purchasing/Materials, Information Technology, Maintenance/Facilities, Production/Assembly/Fabrication and Technical Support Fields.
• Capital Associated Industries – 2008 North Carolina Wage & Salary Survey – Wage and
salary information from designated areas in North Carolina, with pacesetter organizations (600 or more employees) in an area including Wake, Durham, Orange and Alamance counties. Survey provides area-to-area compensation rates.
• League of Municipalities Survey 2007 - A compilation of salary data for specific municipal
jobs located throughout the state.
11
• MAPS Group for the Institute of Government – County Salaries in North Carolina – 2008 - Salaries and wage profiles by position and information about fringe benefits offered by North Carolina counties.
• 2006 Hay Benefits Report – An analysis of benefits, perquisites and personnel policies for
exempt employees in 760 industrial, financial and service organizations throughout the United States. Provides major findings and trends.
• World at Work - Salary Budget Survey – 3,272 member responses to a survey presented in
both industry and sub-industry and regional categories identifying trends, structures and average salaries broken out in FLSA employment categories (non-exempt hourly non-union, non-exempt salaried, exempt salaried and officers/executives).
• Southeastern Salary Conference, 2004 to 2008; salary and benefits information gathered from
surveys from fourteen southeastern states (Alabama, Arkansas, Florida, Georgia, Kentucky, Louisiana, Mississippi, Missouri, North Carolina, Oklahoma, South Carolina, Tennessee, Virginia and West Virginia.)
• Society of Human Resource Management (SHRM) 2006 Workplace Forecast – A Strategic
Outlook – Information based on a survey of human resource professionals and their views on the key issues in demographics, employment, international affairs, politics, society and science and technology that will have the greatest impact on the workplace in the next decade.
• National Association of Colleges and Employers Salary Survey – NACE compiles data from
career planning and placement offices of colleges and universities across the US. This report consists of starting salary offers made to new graduates by employing organizations in business, industry, and government and by nonprofit and educational institutes.
• Compdata Surveys – Compensation Data 2008 – Carolinas – Pay and Benefits Survey
Results – survey analysis, pay practices and benefit practices for 223 companies in North and South Carolina, covering 491 jobs in both states.
• CompAnalyst – web-based compensation survey tool from Salary.com with data on over 3200
benchmark jobs in 243 geographic areas. Professional survey methodology standards were used to collect and analyze available salary survey data or to conduct surveys to gather pertinent market information. Survey methodology recognizes the following concepts that have been defined for informational purposes:
• Labor Market Rate is the average rate of pay that competitors have reported through surveying in a classification similar to that found in state government. • Labor Market Pay Gap is the relationship expressed in percentage terms between the state’s average salary for a benchmark class and the average wage reported for a relevant labor market for that class.
• Turnover Rate is a percentage reflecting all separations from employment for both voluntary and involuntary reasons compared to the total number of employees over a span of 1 year.
12
• Vacancy Rate is the percent of positions by classification that are vacant among the total number of positions covered by the State Personnel Act for any specific period of time.
Market Analysis
Average Salary Overall Comparison
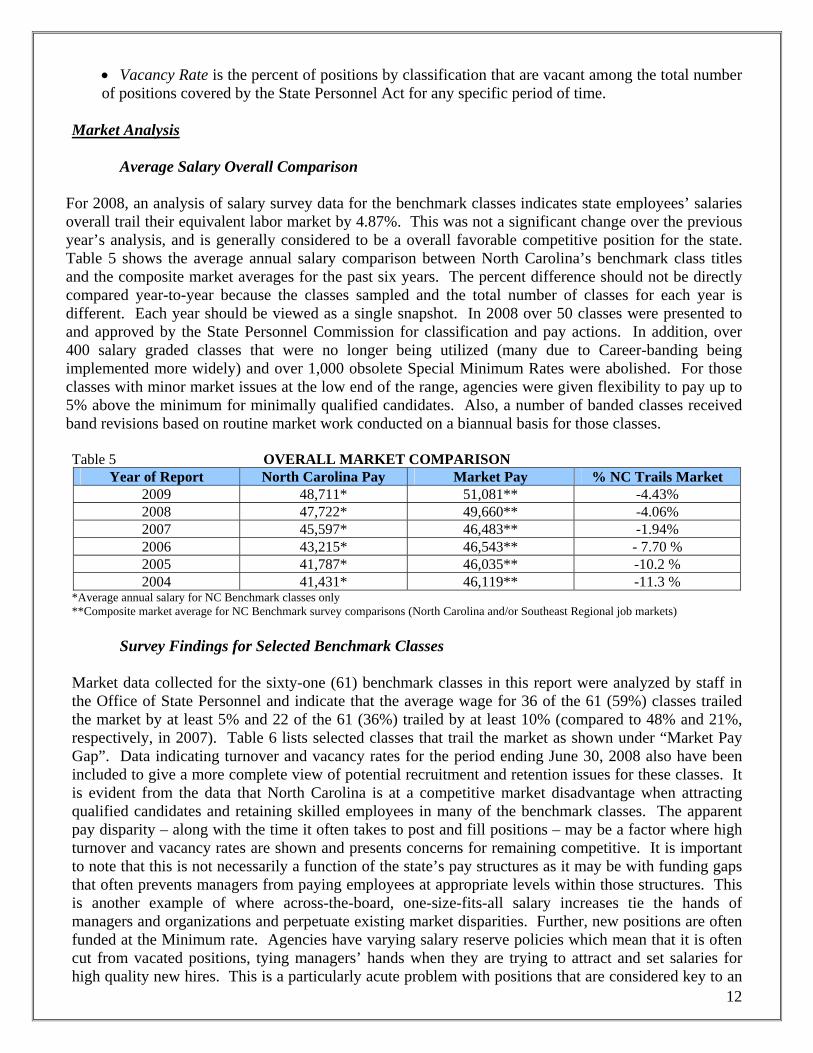
For 2008, an analysis of salary survey data for the benchmark classes indicates state employees’ salaries overall trail their equivalent labor market by 4.87%. This was not a significant change over the previous year’s analysis, and is generally considered to be a overall favorable competitive position for the state. Table 5 shows the average annual salary comparison between North Carolina’s benchmark class titles and the composite market averages for the past six years. The percent difference should not be directly compared year-to-year because the classes sampled and the total number of classes for each year is different. Each year should be viewed as a single snapshot. In 2008 over 50 classes were presented to and approved by the State Personnel Commission for classification and pay actions. In addition, over 400 salary graded classes that were no longer being utilized (many due to Career-banding being implemented more widely) and over 1,000 obsolete Special Minimum Rates were abolished. For those classes with minor market issues at the low end of the range, agencies were given flexibility to pay up to 5% above the minimum for minimally qualified candidates. Also, a number of banded classes received band revisions based on routine market work conducted on a biannual basis for those classes. Table 5 OVERALL MARKET COMPARISON
Year of Report North Carolina Pay Market Pay % NC Trails Market 2009 48,711* 51,081** -4.43% 2008 47,722* 49,660** -4.06% 2007 45,597* 46,483** -1.94% 2006 43,215* 46,543** - 7.70 % 2005 41,787* 46,035** -10.2 % 2004 41,431* 46,119** -11.3 %
*Average annual salary for NC Benchmark classes only **Composite market average for NC Benchmark survey comparisons (North Carolina and/or Southeast Regional job markets)
Survey Findings for Selected Benchmark Classes Market data collected for the sixty-one (61) benchmark classes in this report were analyzed by staff in the Office of State Personnel and indicate that the average wage for 36 of the 61 (59%) classes trailed the market by at least 5% and 22 of the 61 (36%) trailed by at least 10% (compared to 48% and 21%, respectively, in 2007). Table 6 lists selected classes that trail the market as shown under “Market Pay Gap”. Data indicating turnover and vacancy rates for the period ending June 30, 2008 also have been included to give a more complete view of potential recruitment and retention issues for these classes. It is evident from the data that North Carolina is at a competitive market disadvantage when attracting qualified candidates and retaining skilled employees in many of the benchmark classes. The apparent pay disparity – along with the time it often takes to post and fill positions – may be a factor where high turnover and vacancy rates are shown and presents concerns for remaining competitive. It is important to note that this is not necessarily a function of the state’s pay structures as it may be with funding gaps that often prevents managers from paying employees at appropriate levels within those structures. This is another example of where across-the-board, one-size-fits-all salary increases tie the hands of managers and organizations and perpetuate existing market disparities. Further, new positions are often funded at the Minimum rate. Agencies have varying salary reserve policies which mean that it is often cut from vacated positions, tying managers’ hands when they are trying to attract and set salaries for high quality new hires. This is a particularly acute problem with positions that are considered key to an
13
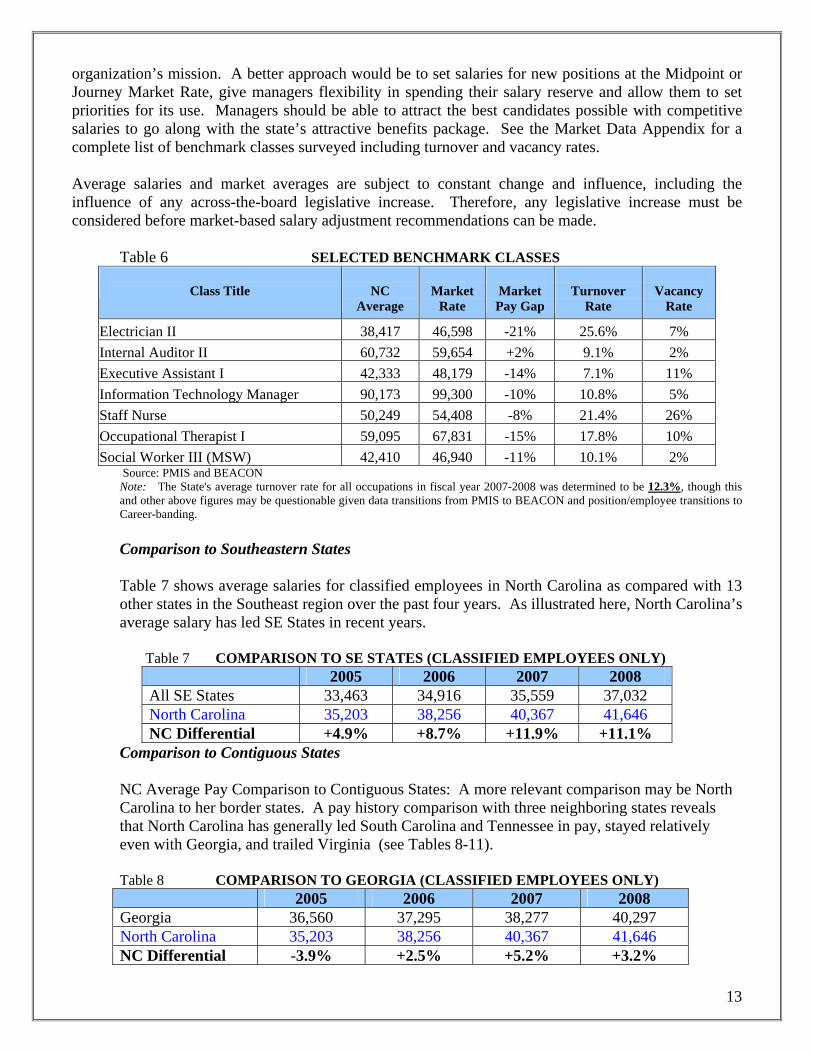
organization’s mission. A better approach would be to set salaries for new positions at the Midpoint or Journey Market Rate, give managers flexibility in spending their salary reserve and allow them to set priorities for its use. Managers should be able to attract the best candidates possible with competitive salaries to go along with the state’s attractive benefits package. See the Market Data Appendix for a complete list of benchmark classes surveyed including turnover and vacancy rates. Average salaries and market averages are subject to constant change and influence, including the influence of any across-the-board legislative increase. Therefore, any legislative increase must be considered before market-based salary adjustment recommendations can be made. Table 6 SELECTED BENCHMARK CLASSES
Class Title
NC
Average
Market
Rate
Market Pay Gap
Turnover
Rate
Vacancy
Rate
Electrician II 38,417 46,598 -21% 25.6% 7% Internal Auditor II 60,732 59,654 +2% 9.1% 2% Executive Assistant I 42,333 48,179 -14% 7.1% 11% Information Technology Manager 90,173 99,300 -10% 10.8% 5% Staff Nurse 50,249 54,408 -8% 21.4% 26% Occupational Therapist I 59,095 67,831 -15% 17.8% 10% Social Worker III (MSW) 42,410 46,940 -11% 10.1% 2%
Source: PMIS and BEACON Note: The State's average turnover rate for all occupations in fiscal year 2007-2008 was determined to be 12.3%, though this and other above figures may be questionable given data transitions from PMIS to BEACON and position/employee transitions to Career-banding. Comparison to Southeastern States Table 7 shows average salaries for classified employees in North Carolina as compared with 13 other states in the Southeast region over the past four years. As illustrated here, North Carolina’s average salary has led SE States in recent years.
Table 7 COMPARISON TO SE STATES (CLASSIFIED EMPLOYEES ONLY)
2005 2006 2007 2008 All SE States 33,463 34,916 35,559 37,032 North Carolina 35,203 38,256 40,367 41,646 NC Differential +4.9% +8.7% +11.9% +11.1%
Comparison to Contiguous States NC Average Pay Comparison to Contiguous States: A more relevant comparison may be North Carolina to her border states. A pay history comparison with three neighboring states reveals that North Carolina has generally led South Carolina and Tennessee in pay, stayed relatively even with Georgia, and trailed Virginia (see Tables 8-11). Table 8 COMPARISON TO GEORGIA (CLASSIFIED EMPLOYEES ONLY) 2005 2006 2007 2008 Georgia 36,560 37,295 38,277 40,297 North Carolina 35,203 38,256 40,367 41,646 NC Differential -3.9% +2.5% +5.2% +3.2%
14
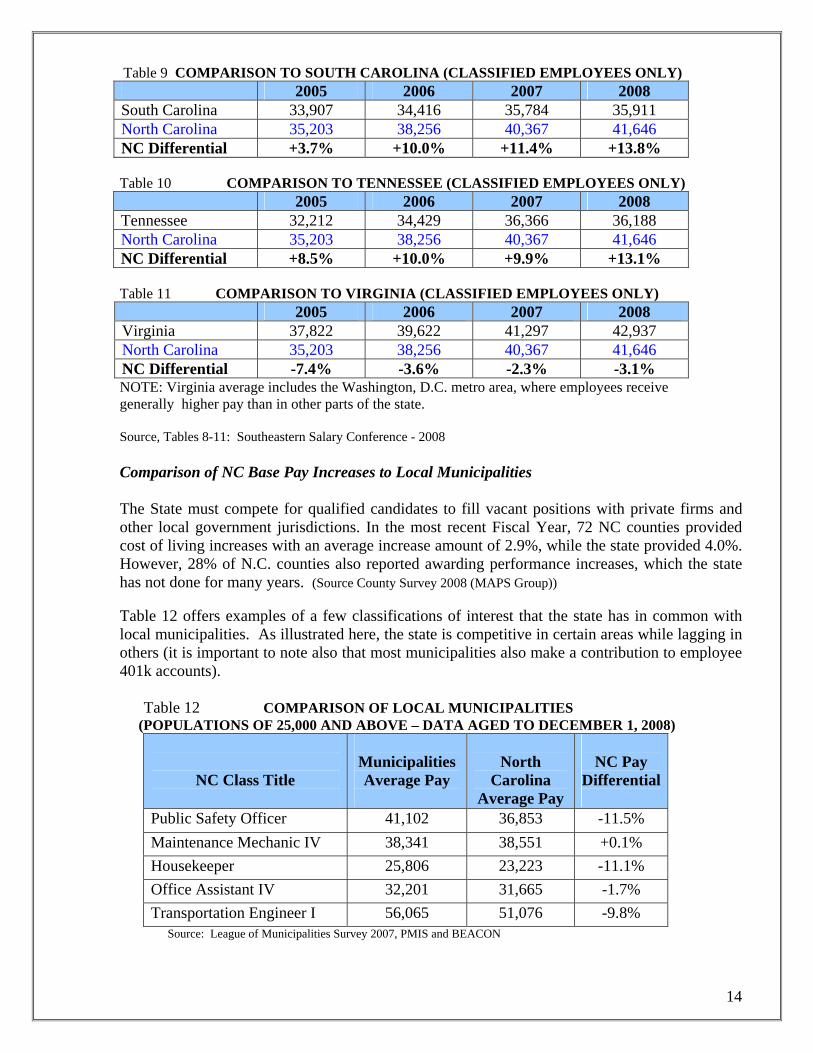
Table 9 COMPARISON TO SOUTH CAROLINA (CLASSIFIED EMPLOYEES ONLY) 2005 2006 2007 2008 South Carolina 33,907 34,416 35,784 35,911 North Carolina 35,203 38,256 40,367 41,646 NC Differential +3.7% +10.0% +11.4% +13.8%
Table 10 COMPARISON TO TENNESSEE (CLASSIFIED EMPLOYEES ONLY) 2005 2006 2007 2008 Tennessee 32,212 34,429 36,366 36,188 North Carolina 35,203 38,256 40,367 41,646 NC Differential +8.5% +10.0% +9.9% +13.1%
Table 11 COMPARISON TO VIRGINIA (CLASSIFIED EMPLOYEES ONLY) 2005 2006 2007 2008 Virginia 37,822 39,622 41,297 42,937 North Carolina 35,203 38,256 40,367 41,646 NC Differential -7.4% -3.6% -2.3% -3.1% NOTE: Virginia average includes the Washington, D.C. metro area, where employees receive generally higher pay than in other parts of the state. Source, Tables 8-11: Southeastern Salary Conference - 2008 Comparison of NC Base Pay Increases to Local Municipalities The State must compete for qualified candidates to fill vacant positions with private firms and other local government jurisdictions. In the most recent Fiscal Year, 72 NC counties provided cost of living increases with an average increase amount of 2.9%, while the state provided 4.0%. However, 28% of N.C. counties also reported awarding performance increases, which the state has not done for many years. (Source County Survey 2008 (MAPS Group)) Table 12 offers examples of a few classifications of interest that the state has in common with local municipalities. As illustrated here, the state is competitive in certain areas while lagging in others (it is important to note also that most municipalities also make a contribution to employee 401k accounts). Table 12 COMPARISON OF LOCAL MUNICIPALITIES
(POPULATIONS OF 25,000 AND ABOVE – DATA AGED TO DECEMBER 1, 2008)
NC Class Title
Municipalities Average Pay
North
Carolina Average Pay
NC Pay
Differential
Public Safety Officer 41,102 36,853 -11.5% Maintenance Mechanic IV 38,341 38,551 +0.1% Housekeeper 25,806 23,223 -11.1% Office Assistant IV 32,201 31,665 -1.7% Transportation Engineer I 56,065 51,076 -9.8%
Source: League of Municipalities Survey 2007, PMIS and BEACON
15
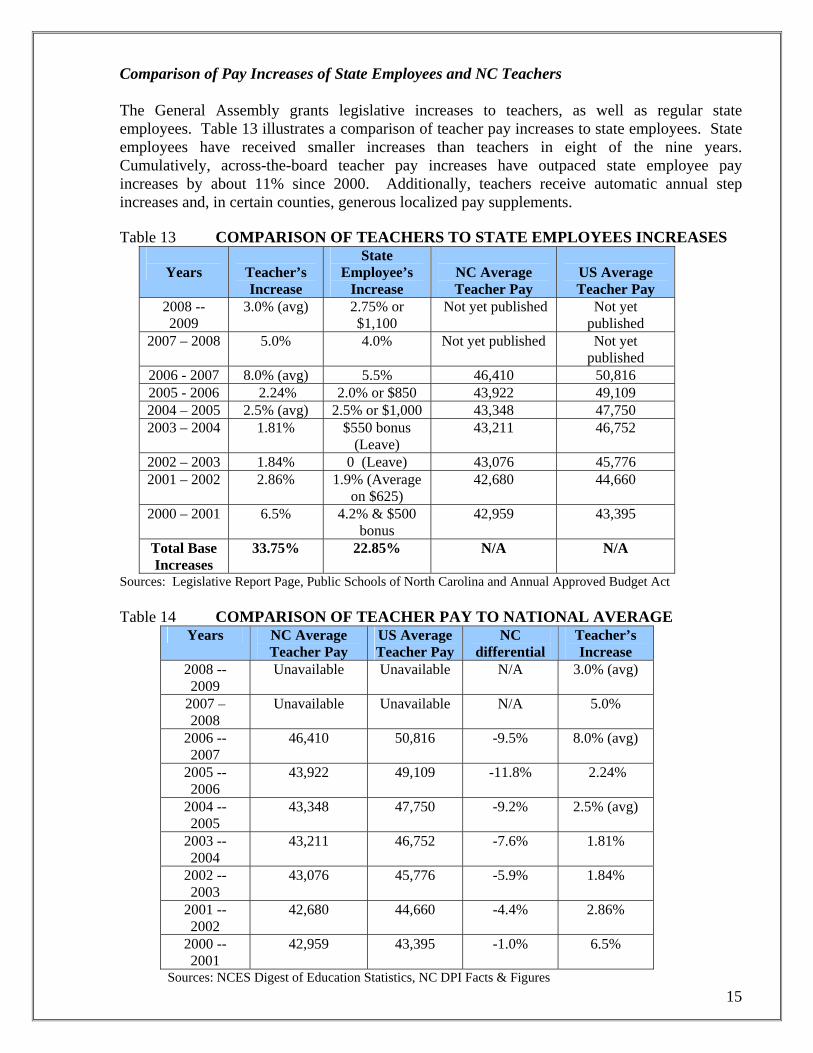
Comparison of Pay Increases of State Employees and NC Teachers The General Assembly grants legislative increases to teachers, as well as regular state employees. Table 13 illustrates a comparison of teacher pay increases to state employees. State employees have received smaller increases than teachers in eight of the nine years. Cumulatively, across-the-board teacher pay increases have outpaced state employee pay increases by about 11% since 2000. Additionally, teachers receive automatic annual step increases and, in certain counties, generous localized pay supplements. Table 13 COMPARISON OF TEACHERS TO STATE EMPLOYEES INCREASES
Years
Teacher’s Increase
State Employee’s
Increase
NC Average Teacher Pay
US Average Teacher Pay
2008 -- 2009
3.0% (avg) 2.75% or $1,100
Not yet published Not yet published
2007 – 2008 5.0% 4.0% Not yet published Not yet published
2006 - 2007 8.0% (avg) 5.5% 46,410 50,816 2005 - 2006 2.24% 2.0% or $850 43,922 49,109 2004 – 2005 2.5% (avg) 2.5% or $1,000 43,348 47,750 2003 – 2004 1.81% $550 bonus
(Leave) 43,211 46,752
2002 – 2003 1.84% 0 (Leave) 43,076 45,776 2001 – 2002 2.86% 1.9% (Average
on $625) 42,680 44,660
2000 – 2001 6.5% 4.2% & $500 bonus
42,959 43,395
Total Base Increases
33.75% 22.85% N/A N/A
Sources: Legislative Report Page, Public Schools of North Carolina and Annual Approved Budget Act Table 14 COMPARISON OF TEACHER PAY TO NATIONAL AVERAGE
Years NC Average Teacher Pay
US Average Teacher Pay
NC differential
Teacher’s Increase
2008 -- 2009
Unavailable Unavailable N/A 3.0% (avg)
2007 – 2008
Unavailable Unavailable N/A 5.0%
2006 -- 2007
46,410 50,816 -9.5% 8.0% (avg)
2005 -- 2006
43,922 49,109 -11.8% 2.24%
2004 -- 2005
43,348 47,750 -9.2% 2.5% (avg)
2003 -- 2004
43,211 46,752 -7.6% 1.81%
2002 -- 2003
43,076 45,776 -5.9% 1.84%
2001 -- 2002
42,680 44,660 -4.4% 2.86%
2000 -- 2001
42,959 43,395 -1.0% 6.5%
Sources: NCES Digest of Education Statistics, NC DPI Facts & Figures
16
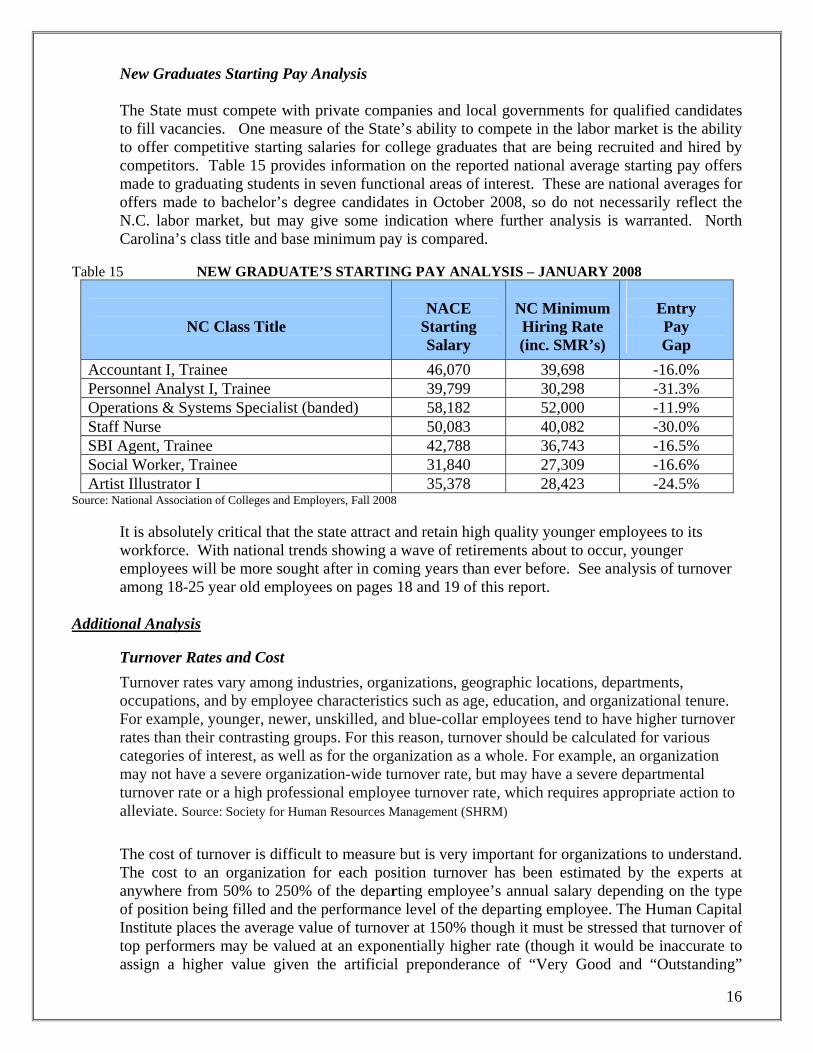
New Graduates Starting Pay Analysis The State must compete with private companies and local governments for qualified candidates to fill vacancies. One measure of the State’s ability to compete in the labor market is the ability to offer competitive starting salaries for college graduates that are being recruited and hired by competitors. Table 15 provides information on the reported national average starting pay offers made to graduating students in seven functional areas of interest. These are national averages for offers made to bachelor’s degree candidates in October 2008, so do not necessarily reflect the N.C. labor market, but may give some indication where further analysis is warranted. North Carolina’s class title and base minimum pay is compared.
Table 15 NEW GRADUATE’S STARTING PAY ANALYSIS – JANUARY 2008
NC Class Title
NACE
Starting Salary
NC Minimum Hiring Rate (inc. SMR’s)
Entry Pay Gap
Accountant I, Trainee 46,070 39,698 -16.0% Personnel Analyst I, Trainee 39,799 30,298 -31.3% Operations & Systems Specialist (banded) 58,182 52,000 -11.9% Staff Nurse 50,083 40,082 -30.0% SBI Agent, Trainee 42,788 36,743 -16.5% Social Worker, Trainee 31,840 27,309 -16.6% Artist Illustrator I 35,378 28,423 -24.5%
Source: National Association of Colleges and Employers, Fall 2008
It is absolutely critical that the state attract and retain high quality younger employees to its workforce. With national trends showing a wave of retirements about to occur, younger employees will be more sought after in coming years than ever before. See analysis of turnover among 18-25 year old employees on pages 18 and 19 of this report.
Additional Analysis
Turnover Rates and Cost Turnover rates vary among industries, organizations, geographic locations, departments, occupations, and by employee characteristics such as age, education, and organizational tenure. For example, younger, newer, unskilled, and blue-collar employees tend to have higher turnover rates than their contrasting groups. For this reason, turnover should be calculated for various categories of interest, as well as for the organization as a whole. For example, an organization may not have a severe organization-wide turnover rate, but may have a severe departmental turnover rate or a high professional employee turnover rate, which requires appropriate action to alleviate. Source: Society for Human Resources Management (SHRM)
The cost of turnover is difficult to measure but is very important for organizations to understand. The cost to an organization for each position turnover has been estimated by the experts at anywhere from 50% to 250% of the departing employee’s annual salary depending on the type of position being filled and the performance level of the departing employee. The Human Capital Institute places the average value of turnover at 150% though it must be stressed that turnover of top performers may be valued at an exponentially higher rate (though it would be inaccurate to assign a higher value given the artificial preponderance of “Very Good and “Outstanding”
17
ratings in our current performance management system). There are many factors included in estimating the cost of turnover. Some obvious costs include advertising the vacancy; salaries of employment screening panels; and managers’ time spent interviewing candidates. Other costs are not so easily quantified such as lost productivity – particularly during the time that a position is left vacant during recruitment -- or lost knowledge from the organization. Other costs include required onboarding, training, and higher rates of mistakes made by new hires. Though the costs may be hard to quantify, they are clearly considerable and should be monitored. The high cost of turnover presents a clear argument for agencies and universities to engage in rigorous workforce and succession planning.
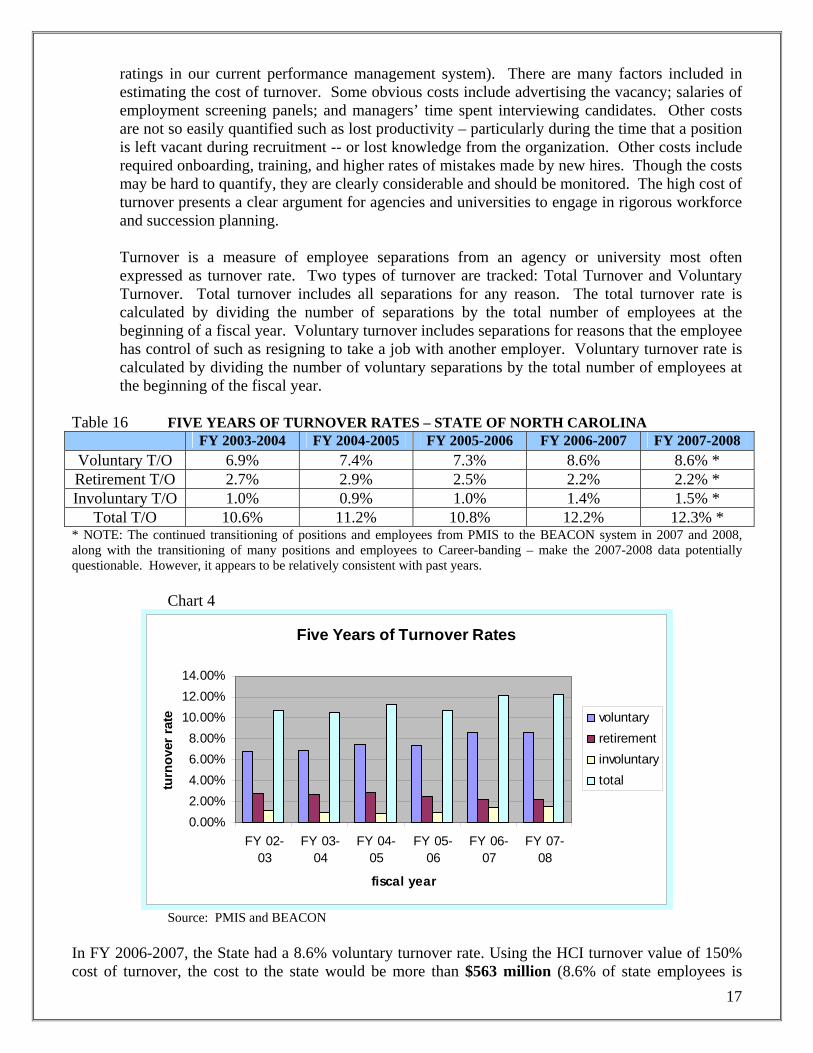
Turnover is a measure of employee separations from an agency or university most often expressed as turnover rate. Two types of turnover are tracked: Total Turnover and Voluntary Turnover. Total turnover includes all separations for any reason. The total turnover rate is calculated by dividing the number of separations by the total number of employees at the beginning of a fiscal year. Voluntary turnover includes separations for reasons that the employee has control of such as resigning to take a job with another employer. Voluntary turnover rate is calculated by dividing the number of voluntary separations by the total number of employees at the beginning of the fiscal year.
Table 16 FIVE YEARS OF TURNOVER RATES – STATE OF NORTH CAROLINA FY 2003-2004 FY 2004-2005 FY 2005-2006 FY 2006-2007 FY 2007-2008 Voluntary T/O 6.9% 7.4% 7.3% 8.6% 8.6% * Retirement T/O 2.7% 2.9% 2.5% 2.2% 2.2% * Involuntary T/O 1.0% 0.9% 1.0% 1.4% 1.5% *
Total T/O 10.6% 11.2% 10.8% 12.2% 12.3% * * NOTE: The continued transitioning of positions and employees from PMIS to the BEACON system in 2007 and 2008, along with the transitioning of many positions and employees to Career-banding – make the 2007-2008 data potentially questionable. However, it appears to be relatively consistent with past years. Chart 4
Five Years of Turnover Rates
0.00%2.00%4.00%6.00%8.00%
10.00%12.00%14.00%
FY 02-03
FY 03-04
FY 04-05
FY 05-06
FY 06-07
FY 07-08
fiscal year
turn
over
rate voluntary
retirementinvoluntarytotal
Source: PMIS and BEACON
In FY 2006-2007, the State had a 8.6% voluntary turnover rate. Using the HCI turnover value of 150% cost of turnover, the cost to the state would be more than $563 million (8.6% of state employees is
18
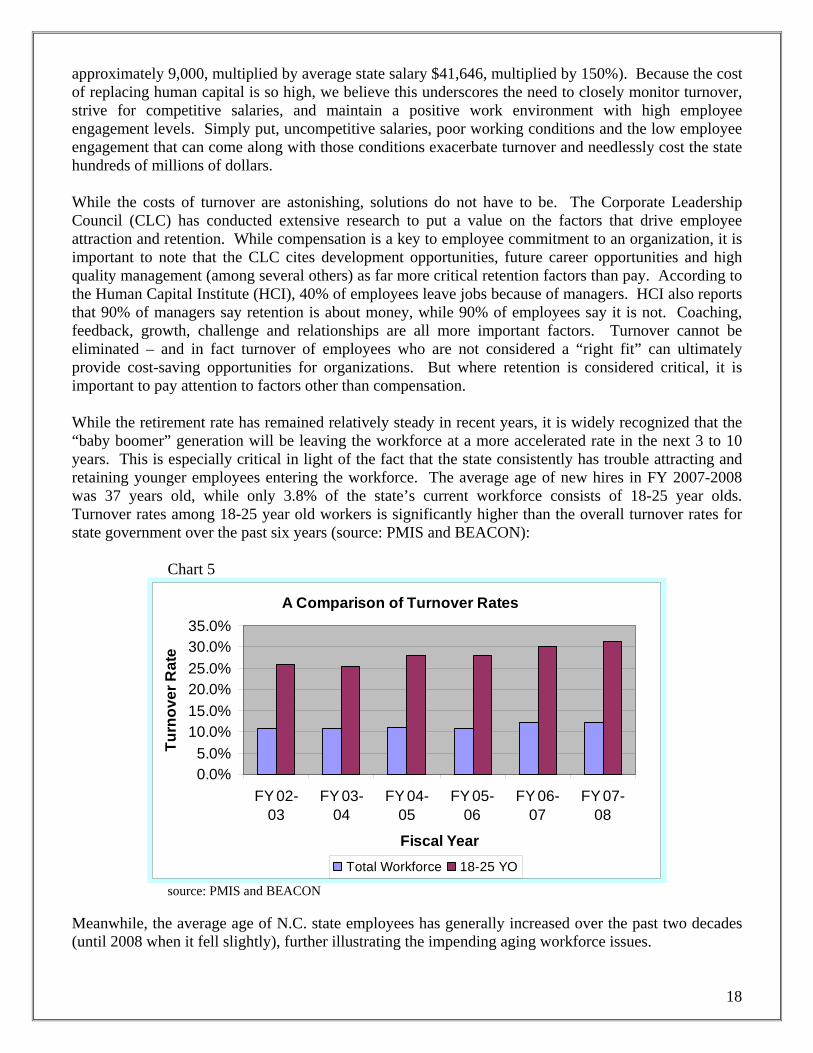
approximately 9,000, multiplied by average state salary $41,646, multiplied by 150%). Because the cost of replacing human capital is so high, we believe this underscores the need to closely monitor turnover, strive for competitive salaries, and maintain a positive work environment with high employee engagement levels. Simply put, uncompetitive salaries, poor working conditions and the low employee engagement that can come along with those conditions exacerbate turnover and needlessly cost the state hundreds of millions of dollars. While the costs of turnover are astonishing, solutions do not have to be. The Corporate Leadership Council (CLC) has conducted extensive research to put a value on the factors that drive employee attraction and retention. While compensation is a key to employee commitment to an organization, it is important to note that the CLC cites development opportunities, future career opportunities and high quality management (among several others) as far more critical retention factors than pay. According to the Human Capital Institute (HCI), 40% of employees leave jobs because of managers. HCI also reports that 90% of managers say retention is about money, while 90% of employees say it is not. Coaching, feedback, growth, challenge and relationships are all more important factors. Turnover cannot be eliminated – and in fact turnover of employees who are not considered a “right fit” can ultimately provide cost-saving opportunities for organizations. But where retention is considered critical, it is important to pay attention to factors other than compensation. While the retirement rate has remained relatively steady in recent years, it is widely recognized that the “baby boomer” generation will be leaving the workforce at a more accelerated rate in the next 3 to 10 years. This is especially critical in light of the fact that the state consistently has trouble attracting and retaining younger employees entering the workforce. The average age of new hires in FY 2007-2008 was 37 years old, while only 3.8% of the state’s current workforce consists of 18-25 year olds. Turnover rates among 18-25 year old workers is significantly higher than the overall turnover rates for state government over the past six years (source: PMIS and BEACON):
Chart 5
A Comparison of Turnover Rates
0.0%5.0%
10.0%15.0%20.0%25.0%30.0%35.0%
FY 02-03
FY 03-04
FY 04-05
FY 05-06
FY 06-07
FY 07-08
Fiscal Year
Turn
over
Rat
e
Total Workforce 18-25 YO
source: PMIS and BEACON
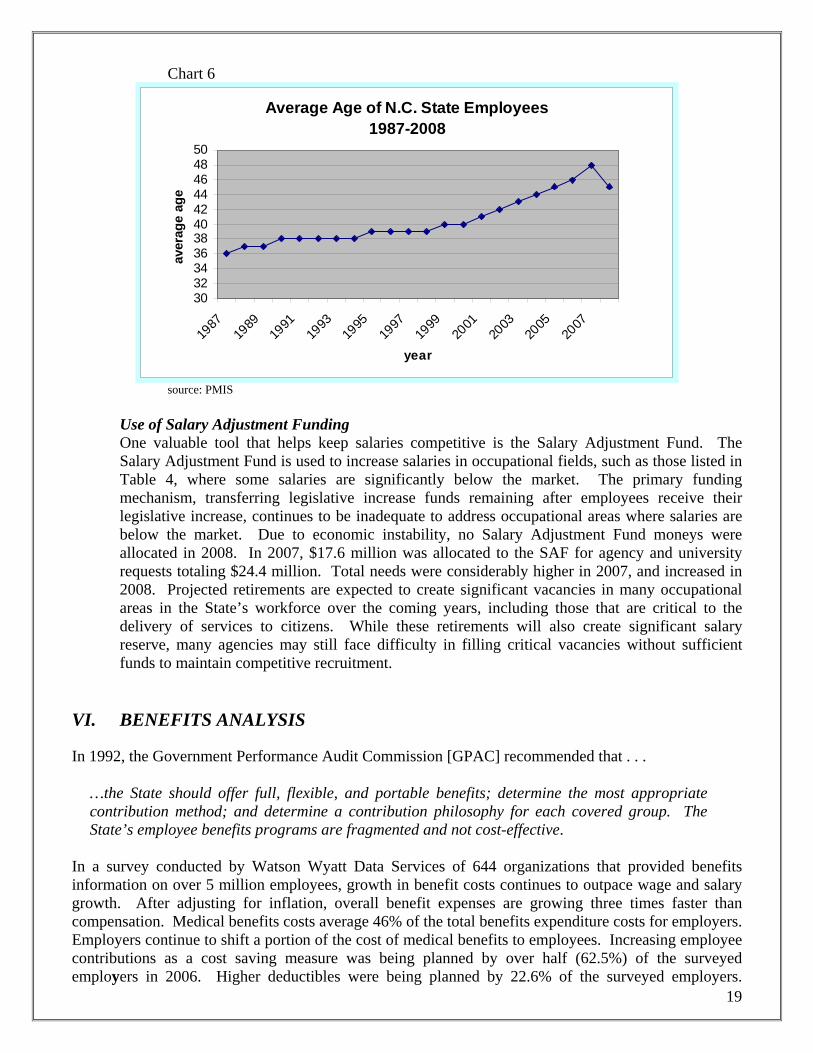
Meanwhile, the average age of N.C. state employees has generally increased over the past two decades (until 2008 when it fell slightly), further illustrating the impending aging workforce issues.
19
Chart 6
Average Age of N.C. State Employees1987-2008
3032343638404244464850
1987
1989
1991
1993
1995
1997
1999
2001
2003
2005
2007
year
aver
age
age
source: PMIS
iculty in filling critical vacancies without sufficient nds to maintain competitive recruitment.
I. BENEFITS ANALYSIS
1992, the Government Performance Audit Commission [GPAC] recommended that . . .
covered group. The State’s employee benefits programs are fragmented and not cost-effective.
Use of Salary Adjustment Funding One valuable tool that helps keep salaries competitive is the Salary Adjustment Fund. The Salary Adjustment Fund is used to increase salaries in occupational fields, such as those listed in Table 4, where some salaries are significantly below the market. The primary funding mechanism, transferring legislative increase funds remaining after employees receive their legislative increase, continues to be inadequate to address occupational areas where salaries are below the market. Due to economic instability, no Salary Adjustment Fund moneys were allocated in 2008. In 2007, $17.6 million was allocated to the SAF for agency and university requests totaling $24.4 million. Total needs were considerably higher in 2007, and increased in 2008. Projected retirements are expected to create significant vacancies in many occupational areas in the State’s workforce over the coming years, including those that are critical to the delivery of services to citizens. While these retirements will also create significant salary reserve, many agencies may still face difffu
V In
…the State should offer full, flexible, and portable benefits; determine the most appropriate contribution method; and determine a contribution philosophy for each
In a survey conducted by Watson Wyatt Data Services of 644 organizations that provided benefits information on over 5 million employees, growth in benefit costs continues to outpace wage and salary growth. After adjusting for inflation, overall benefit expenses are growing three times faster than compensation. Medical benefits costs average 46% of the total benefits expenditure costs for employers. Employers continue to shift a portion of the cost of medical benefits to employees. Increasing employee contributions as a cost saving measure was being planned by over half (62.5%) of the surveyed employers in 2006. Higher deductibles were being planned by 22.6% of the surveyed employers.
20
s was lower than the overall average of the survey participants in all types of edical benefit plans.
mber one key economic trend, and a rise in tiree benefit costs as the second highest economic trend.
al indemnity plan was eliminated in 2008, hich lessened the options available for health coverage.
Overall, surveyed employers planned on passing along 29.9% (same as 2005) of cost increases to their employees through some combination of the three – increased premiums, deductibles and co-payments. A similar pattern of increased cost sharing is found with prescription drugs, where co-pays are being increased by 27.1% of employers in 2006. The 2006 Hay Benefits Report indicated that health care premiums have risen 6.4% for single participants and 7.8% for family coverage. It also reports that the prevalence of completely employer-paid coverage continues to decline with 13% providing 100% employer-paid premiums in 2006 for single coverage and 6% for family coverage compared to 28% and 10% in 2001, and 29% and 12% in 1996. This report showed North Carolina’s premium cost for individuals and familiem In the SHRM 2006 Workplace Forecast Survey, a comparison of “Very Important” job satisfaction aspects showed Benefits as being a close second to Compensation/Pay for employees at all ages. The survey also reflects the rise in health care costs as the nure In 2006, the state’s benefits programs improved somewhat with the addition of PPO options for employee health coverage. However, the State’s traditionw Paid Time Off Analysis Paid time off referred to here is employees’ time off for which they continue to receive pay. Categories of Paid Time Off include Vacation Leave, Sick Leave, and Holiday pay. The contiguous states of South Carolina, Tennessee and Virginia report similar responses to the figure shown for the southeastern states, and so, were not reflected separately. Recommendations follow.
Vacation
s annually). This makes it more difficult to explain our vacation benefits package employees.
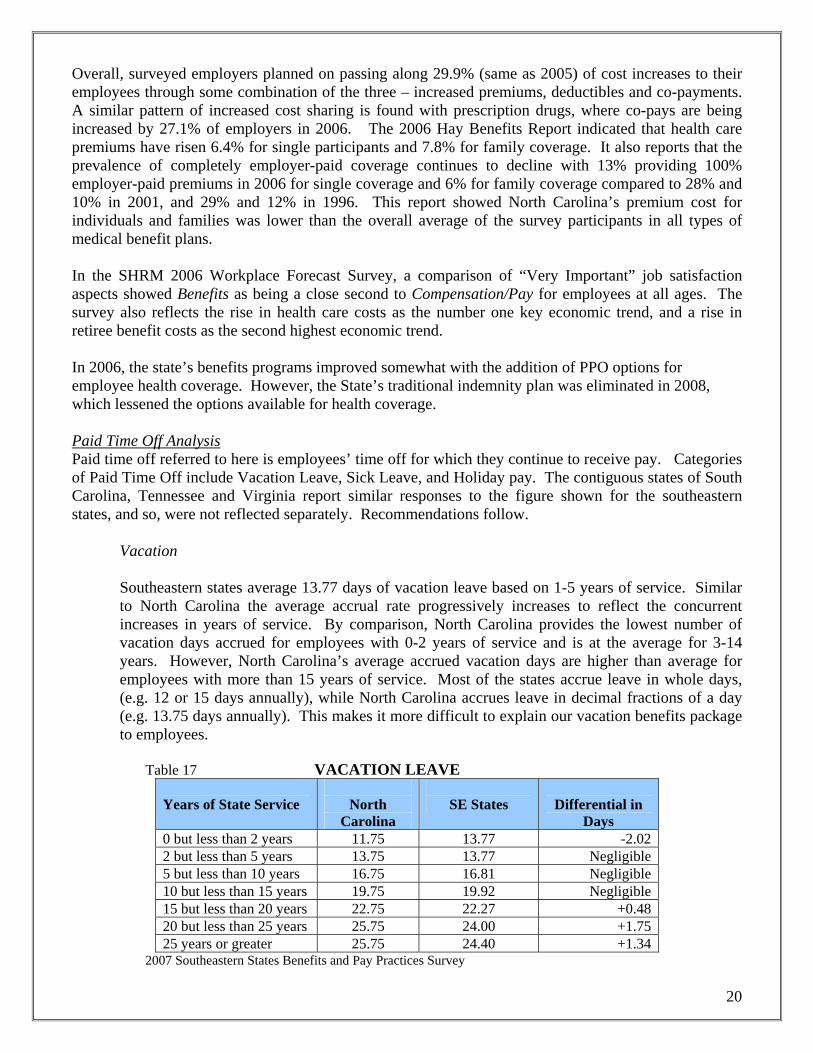
Table 17 VACATION LEAVE
Southeastern states average 13.77 days of vacation leave based on 1-5 years of service. Similar to North Carolina the average accrual rate progressively increases to reflect the concurrent increases in years of service. By comparison, North Carolina provides the lowest number of vacation days accrued for employees with 0-2 years of service and is at the average for 3-14 years. However, North Carolina’s average accrued vacation days are higher than average for employees with more than 15 years of service. Most of the states accrue leave in whole days, (e.g. 12 or 15 days annually), while North Carolina accrues leave in decimal fractions of a day (e.g. 13.75 dayto
Years of State Service
North
Carolina
SE States
Differential in
Days 0 but less than 2 years 11.75 13.77 -2.02 2 but less than 5 years 13.75 13.77 Negligible 5 but less than 10 years 16.75 16.81 Negligible 10 but less than 15 years 19.75 19.92 Negligible 15 but less than 20 years 22.75 22.27 +0.48 20 but less than 25 years 25.75 24.00 +1.75 25 years or greater 25.75 24.40 +1.34
Benefits and Pay Practices Survey 2007 Southeastern States
21
pi] start employees with 12 days but increase the allotment with service time. The most frequently reported number of sick leave days granted per year among
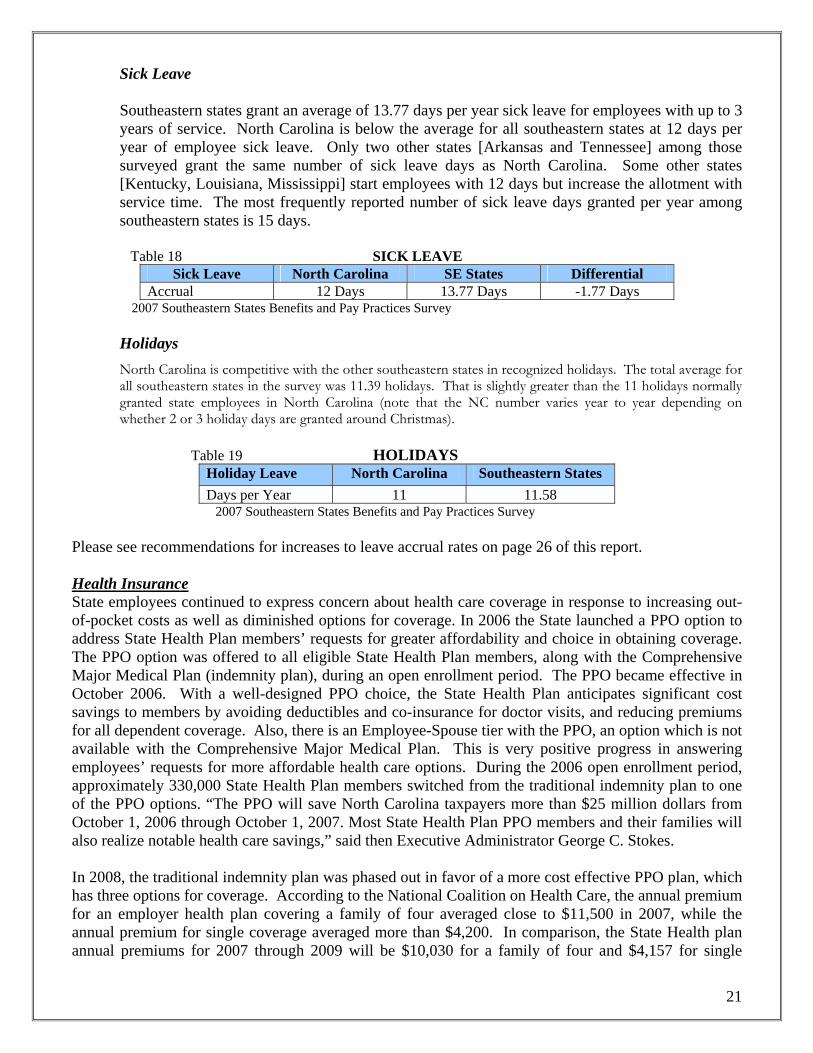
Ta SICK LEA
Sick Leave Southeastern states grant an average of 13.77 days per year sick leave for employees with up to 3 years of service. North Carolina is below the average for all southeastern states at 12 days per year of employee sick leave. Only two other states [Arkansas and Tennessee] among those surveyed grant the same number of sick leave days as North Carolina. Some other states [Kentucky, Louisiana, Mississip
southeastern states is 15 days.
ble 18 VE Sick Leave North Carolina SE States Differential
Accrual 12 Days 13.77 Days -1.77 Days eastern States Benefits and Pay Practices Survey
t is slightly greater than the 11 holidays normally granted state employees in North Carolina (note that the NC number varies year to year depending on
hether da Ta HOLIDAYS
2007 South
Holidays North Carolina is competitive with the other southeastern states in recognized holidays. The total average for all southeastern states in the survey was 11.39 holidays. Tha
w 2 or 3 holiday ys are granted around Christmas).
ble 19 Holiday Leave North Carolina Southeastern States Days per Year 11 11.58
2007 Southeastern States Benefits and Pay Practices Survey Please see recommendations for increases to leave accrual rates on page 26 of this report. Health Insurance State employees continued to express concern about health care coverage in response to increasing out-of-pocket costs as well as diminished options for coverage. In 2006 the State launched a PPO option to address State Health Plan members’ requests for greater affordability and choice in obtaining coverage. The PPO option was offered to all eligible State Health Plan members, along with the Comprehensive Major Medical Plan (indemnity plan), during an open enrollment period. The PPO became effective in October 2006. With a well-designed PPO choice, the State Health Plan anticipates significant cost savings to members by avoiding deductibles and co-insurance for doctor visits, and reducing premiums for all dependent coverage. Also, there is an Employee-Spouse tier with the PPO, an option which is not available with the Comprehensive Major Medical Plan. This is very positive progress in answering employees’ requests for more affordable health care options. During the 2006 open enrollment period, approximately 330,000 State Health Plan members switched from the traditional indemnity plan to one of the PPO options. “The PPO will save North Carolina taxpayers more than $25 million dollars from
ctober 1, 2006 through October 1, 2007. Most State Health Plan PPO members and their families will
and $4,157 for single
Oalso realize notable health care savings,” said then Executive Administrator George C. Stokes. In 2008, the traditional indemnity plan was phased out in favor of a more cost effective PPO plan, which has three options for coverage. According to the National Coalition on Health Care, the annual premium for an employer health plan covering a family of four averaged close to $11,500 in 2007, while the annual premium for single coverage averaged more than $4,200. In comparison, the State Health plan annual premiums for 2007 through 2009 will be $10,030 for a family of four
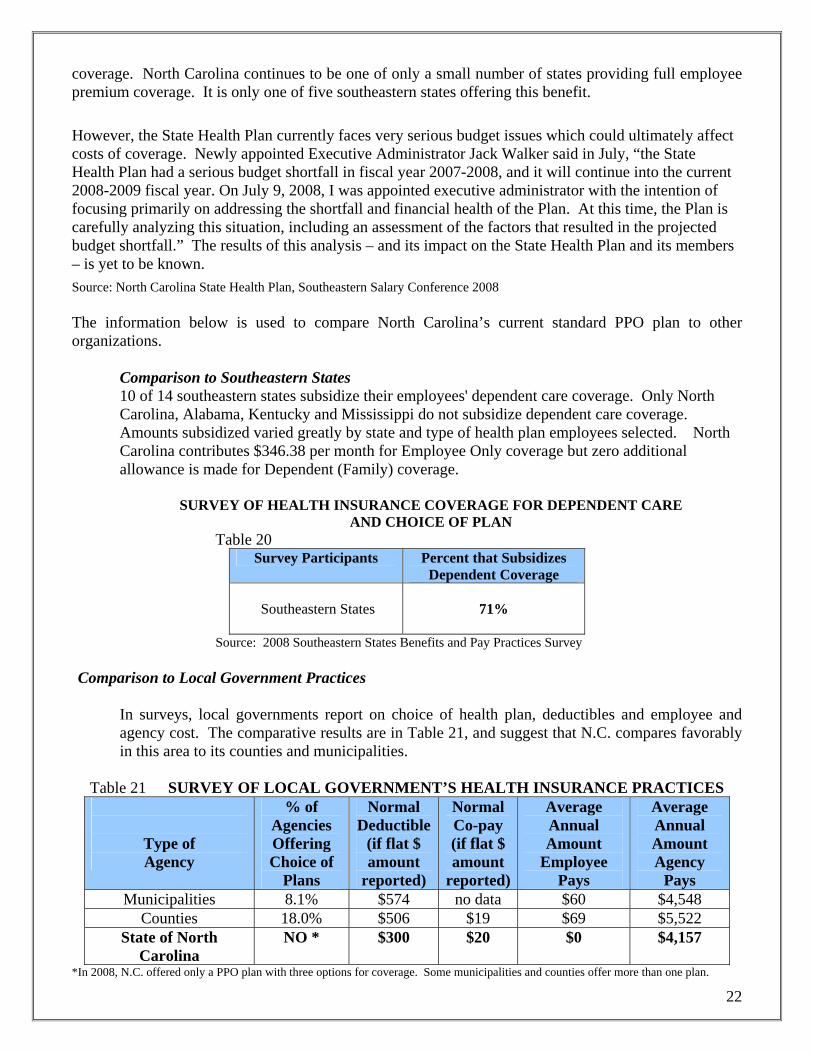
22
coverage. North Carolina continues to be one of only a small number of states providing full employeepremium coverage. It is only one of five southeastern states offering this benefit. However, the State Health Plan currently faces very serious budget issues which could ultimately affect costs of coverage. Newly appointed Executive Administrator Jack Walker said in July, “the State Health Plan had a serious budget shortfall in fiscal year 2007-2008, and it will continue into the current 2008-2009 fiscal year. On July 9, 2008, I was appointed executive administrator with the intention of focusing primarily on addressing the shortfall and financial health of the Plan. At this time, the Plan is carefully analyzing this situation, including an assessment of the factors that resulted in the projected budget shortfall.” The results of this analysis – and its impact on the State Health Plan and its members – is yet to be known. Source: North Carolina State Health Plan, Southeastern Salary Conference 2008 The inorganiz
rth bsidize dependent care coverage.
AmountsCarolina allowance is m endent (F
SURVEY O NCE ENDENT CARE AND CHOIC
Table
formation below is used to compare North Carolina’s current standard PPO plan to other ations. Comparison to Southeastern States 10 of 14 southeastern states subsidize their employees' dependent care coverage. Only NoCarolina, Alabama, Kentucky and Mississippi do not su
subsidized varied greatly by state and type of health plan employees selected. North contributes $346.38 per month for Employee Only coverage but zero additional
amily) coverage. ade for Dep
COVERAGE FOR DEPE OF PLAN
F HEALTH INSURA
20 Survey Participants Percent that Subsidizes
Dependent Coverage
Southeastern States
71%
Comp
y in this area to its countie ici
Table 21 EY OF L OVE T’ H I E PR S
Source: 2008 Southeastern States Benefits and Pay Practices Survey
arison to Local Government Practices
In surveys, local governments report on choice of health plan, deductibles and employee and agency cost. The comparative results are in Table 21, and suggest that N.C. compares favorabl
s and mun
OCAL G
palities.
SURV RNMEN S HEALT NSURANC ACTICE
Type of Agency
% of Agencies O fferingChoice of
Plans
Normal Deductible
(if flat $ amount
reported)
Normal Co-pay (if flat $ amount
reported)
Average Annual Amount
Employee Pays
Average Annual Amount Agency
Pays Municipalities 8.1% $574 no data $60 $4,548
Counties 18.0% $506 $19 $69 $5,522 State of North
Carolina NO * $300 $20 $0 $4,157
*In 2008, N.C. offered only a PPO plan with three options for coverage. Some municipalities and counties offer more than one plan.
23
dard PPO plan. Source: North Carolina League of
he above information applies to employee only coverage; NC data applies to the stanTMunicipalities 2006 Survey of Municipal Fringe Benefits (biannual report) and County Salaries in North Carolina 2008 Supplemental Insurance Products (Post-Tax & Pre-Tax Plan) In 1985, GS 58-31-60 was passed establishing an Employee Insurance Committee designed to review insurance products currently offered through payroll deduction to the State employees in the Employee
DHHS into one committee so
the two Two important benefits, term life insurance and short-
Benefit Representatives to be made available to all mployees. In 2005, a pre-tax Voluntary Term Life Plan was available to all State employees.
Insurance Committee’s Payroll Unit. These committees are responsible for selecting the type of insurance products that reflect the needs and desires of the employees in the Employee Insurance Committee’s Payroll unit. In the past, there were several attempts made by various committees to address establishing a statewide insurance committee similar to the statewide Flexible Benefits Program Advisory Committee and locating centralized administration in the Office of State Personnel or any other appropriate agency. In the report of the Senate Select Committee on State Employee Insurance Issues dated April 18, 1996, a draft bill with an act to amend the laws governing employee insurance committees was prepared. Legislation was passed to combine the 22 insurance committees withinthose employees within the department could have the same post-tax supplemental products. This enables employee’s portability of their benefits within that department, and reduced rates for employees. The legislation was accordingly passed and changes were implemented. We are now facing a similar situation where employees cannot carry over some of their benefits to other agencies when they get transferred or hired by a different agency/university, as agencies/universities may have different benefits. term disability, are often requested by agencye Statewide Flexible Benefits Program (NC Flex) In 2005, NC Flex piloted an online enrollment program with participants from two agencies, two universities, and two community colleges. The pilot was a success in all participating organizations, with the entire enrollment process completed online, without any paperwork involved. Phase II of the online enrollment process has started by adding more community colleges, universities, and non-central
d by the this program dministered by the Office of State Personnel.
The Sta
ble Spending Account expenses)
use a Debit
• n
• ending on the plan option chosen, these plans cover eye exams and materials such as eyeglass lenses, frames, and contact lenses.
payroll agencies. Currently there are over 161,000 participants, from the agencies, universities, and community colleges who have taken advantage of the pre-tax savings offerea
te's Flexible Benefits Program now includes the following pre-tax plans:
• Health Care Flexible Spending Account allows for a pre-tax payroll deduction to place money in an account to pay for eligible health and dental care expenses not covered by insurance (note: employees may opt to use a Debit Convenience Card for eligi
• Dependent Day Care Flexible Spending Account allows for a pre-tax payroll deduction to place money in an account to pay for day care expenses (note: employees may opt toConvenience Card for eligible Spending Account expenses). Dental Plan has two options available, High Option and Low Option. Depending on the plachosen, these options cover expenses for preventive, basic, major, and orthodontia. Vision Care Plan has two options, Plan 1 and Plan 2. Dep
24
• ty, when first eligible.
• d
diseases, such as Muscular Dystrophy, Multiple Sclerosis, Tuberculosis, Sickle Cell Anemia and Fibrosis. Upon initial enrollment for new hires, no evidence of insurability is required.
• Voluntary Accidental Death & Dismemberment Insurance pays a benefit if a loss is suffered as the result of a covered accident, as well as a disabling injury. Voluntary Group Term Life Insurance provides new employees the option to purchase up to $100,000 of term life insurance without providing evidence of insurabiliEmployees may elect coverage in increments of $10,000, with a minimum of $20,000 and a maximum of $500,000, not to exceed five times the base annual earnings. Cancer Insurance offers two plan options, High Option and Low Option, depending on the desired coverage and benefit paid. This plan also provides benefits for 29 other specifie
Cystic
Retirement
The percent factor used by southeastern states to calculate retirement benefits ranges from 1.6% to 2.5%times Average Final Compensation. North Carolin
a's factor used to calculate pension benefits is 1.82%.
ix southeastern states (Alabama, Georgia, Kentucky, Louisiana, Oklahoma and West Virginia) have a
ncludes contributions to the retirement systems ension fund, death benefit trust fund, retiree health plan reserve and disability income plan. The state’s
currently 3.05%.
Sfactor that is higher than North Carolina’s 1.82%. In North Carolina, the 2007-2008 employer contribution on behalf of employees in the Teachers & State Employees Retirement System (TSERS) is 7.83%. This ipcontribution to the pension fund only is Supplemental Retirement Programs Besides the traditional retirement program, the State offers voluntary supplemental retirement prog(a 401(k) plan, a 457(b) plan and a 403(b) plan.) North Carolina does not match employee contributions. According to Mercer Consulting, 78% of public and private
rams
organizations offer an employer match that averages 4% of an employee’s pay. The key driver in determining the value of a
the
n to 01(k) e or law enforcement employees. Clearly, the State of North Carolina is behind market by
e. Table HREE SO GOV K) P
Deferred Contribution plan is the amount of an employer’s contributions.
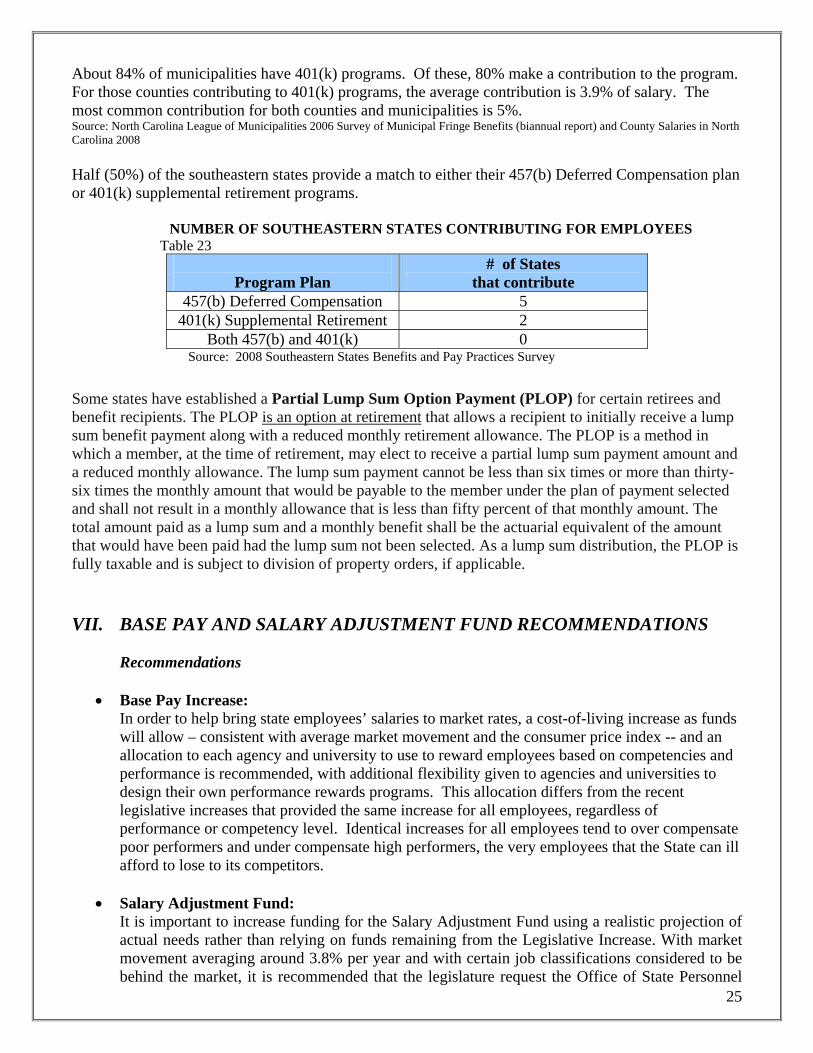
The following are the results reported for the 100 North Carolina County governments. A review ofpast three years reveal that more than half of North Carolina’s 100 counties have consistently made matching 401(k) contributions (see Table 23). This year, 67% of the counties offered an employer match or contribution averaging 3.81%. North Carolina State Government provides no contributio4 xcept fnot offering a match, which greatly affects the State’s perception as being an employer of choic
22 T -YEAR COMPARI N OF COUNTY ERNMENT 401( LANS
Program Plan
% Counties in 2005 Contributing
to 401(k) Programs
% Counties in 2006Contributing to
401(k) Programs*
% Counties in 2007 Contributing to
401(k) Programs*
% Counties in 2008Contributing to
401(k) Programs*
401(k) contributions in 49% 49%
NC Counties
67%
62%
Source: County Survey 2008 (MAPS Group) – *only counties reporting data were used in calculation
25
unties contributing to 401(k) programs, the average contribution is 3.9% of salary. The
Half (50%) of n plan or 401( retirement programs.
NUMBER TERN STATES CO EMPLOYEES
Tab
About 84% of municipalities have 401(k) programs. Of these, 80% make a contribution to the program. or those coF
most common contribution for both counties and municipalities is 5%. Source: North Carolina League of Municipalities 2006 Survey of Municipal Fringe Benefits (biannual report) and County Salaries in North Carolina 2008
the southeastern states provide a match to either their 457(b) Deferred Compensatiok) supplemental
OF SOUTHEAS NTRIBUTING FORle 23
Program Plan
# of States that contribute
457(b) Deferred Compensation 5 401(k) Supplemental Retirement 2
Both 457(b) and 401(k) 0 Source: 2008 Southeastern States Benefits and Pay Practices Survey Some states have established a Partial Lump Sum Option Payment (PLOP) for certain retirees and benefit recipients. The PLOP is an option at retirement that allows a recipient to initially receive a lump sum benefit payment along with a reduced monthly retirement allowance. The PLOP is a method in which a member, at the time of retirement, may elect to receive a partial lump sum payment amount ana reduced monthly allowance. The lump sum payment cannot be less than six times or more than thirtysix times the monthly amount that would be payable to the member under the plan of payment selected and shall not result in a monthly allowance that is less than fifty percent o
d -
f that monthly amount. The tal amount paid as a lump sum and a monthly benefit shall be the actuarial equivalent of the amount at would have been paid had the lump sum not been selected. As a lump sum distribution, the PLOP is
II. BASE PAY AND SALARY ADJUSTMENT FUND RECOMMENDATIONS
•
ds d an
encies and
e same increase for all employees, regardless of performance or competency level. Identical increases for all employees tend to over compensate
mpensate high performers, the very employees that the State can ill
•
ent averaging around 3.8% per year and with certain job classifications considered to be ehind the market, it is recommended that the legislature request the Office of State Personnel
tothfully taxable and is subject to division of property orders, if applicable.
V
Recommendations
Base Pay Increase: In order to help bring state employees’ salaries to market rates, a cost-of-living increase as funwill allow – consistent with average market movement and the consumer price index -- anallocation to each agency and university to use to reward employees based on competperformance is recommended, with additional flexibility given to agencies and universities to design their own performance rewards programs. This allocation differs from the recent legislative increases that provided th
poor performers and under coafford to lose to its competitors.
Salary Adjustment Fund: It is important to increase funding for the Salary Adjustment Fund using a realistic projection of actual needs rather than relying on funds remaining from the Legislative Increase. With market movemb
26
d that restrictive language be removed from the Base Budget Act that irects specific transactions that can be funded from the Salary Adjustment fund so that agencies
tical needs that sometimes do not fit the restrictive
•
Expand the number of compensation programs available to State workers, such as Signing Bonuses, Performance Bonuses, Employee & Team Incentive Pay, etc. in order to match the
rs. VIII.
Match a portion of employees' 401(k) contributions. State matching may be phased in by
ng
• Change the State Health Plan Year from July 1 - June 30 to January 1 - December 31, so that
• Centralize coordination of supplemental benefits and centralize coordination of supplemental
pproach for portability and cost savings. Allow employees to select plan products that meet their needs.
• In o
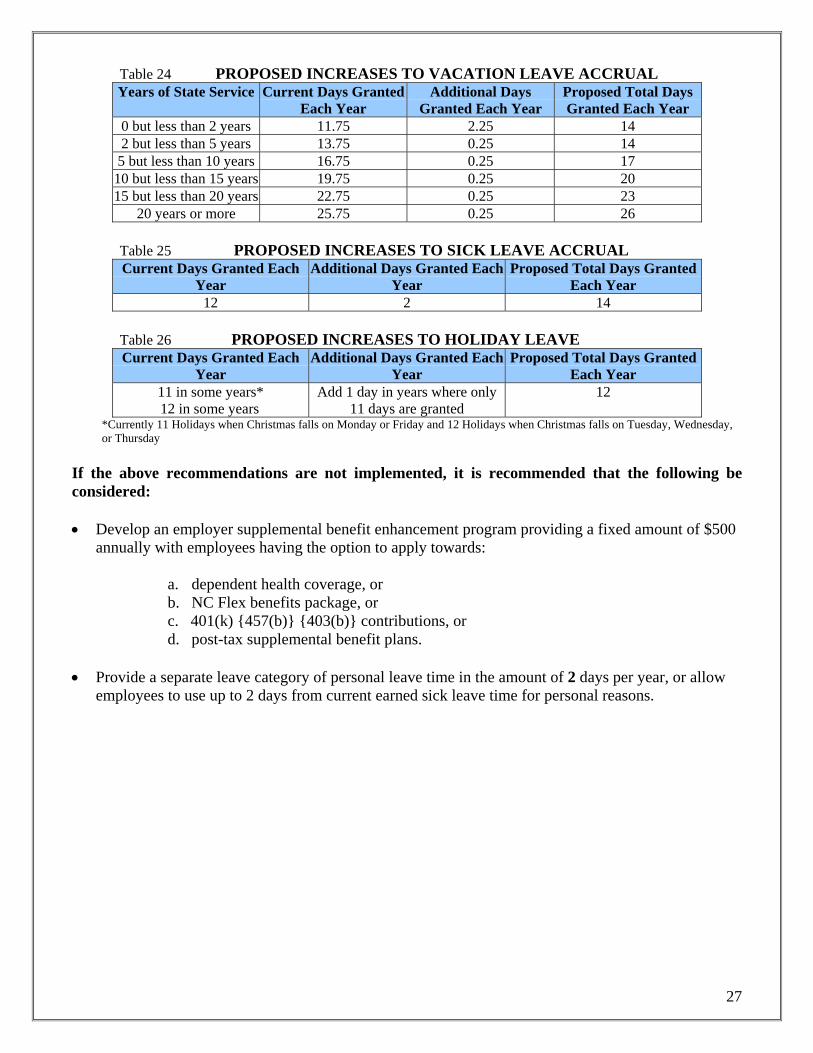
1.
bine Leave Accrual categories 0-2 and 2 but less than 5 into one. Increase the leave accrual rate by an additional ¼ day per year in
2. Increase the Sick leave accrual rate by 2 days per annum, making North Carolina’s benefits
. Increase the number of holidays by one day in years where eleven are presently granted (see
Table 26) in order to achieve consistency from year to year and with other southeastern states.
provide market-based data to support additional funding for the Salary Adjustment Fund each year. It is also recommendedcan focus the money on their most criLegislative language. Additional Compensation Programs:
variety of offerings by many of our competito
BENEFIT RECOMMENDATIONS
•granting 1% in the current year and an additional 1% each of the next years to 5% total matchicontribution by the State for non-law enforcement employees.
SPA employees can better plan their out-of-pocket expenses and their strategy for taking advantage of the NC Flex program as well as other benefit programs.
benefits and consolidate supplemental benefit plan offerings in a menu a
rder to be competitive in the market, we recommend the following:
In order to bring North Carolina in line with other southeastern states and make its vacation benefit more attractive to prospective employees, com
order to bring the total days granted per year to an even number that is easier for prospectiveemployees to understand (see Table 24).
package more attractive and matching other southeastern states in sick leave benefits (see Table 25).
3
27
OSED IN ASES TO VACATION LEAVE ACCRUAL Table 24 PROP CREYears of State Service Current Days Granted
Each Year Additional Days
Granted Each Year Proposed Total Days Granted Each Year
0 but less than 2 years 11.75 2.25 14 2 but less than 5 years 13.75 0.25 14
5 b rs ut less than 10 yea 16.75 0.25 17 10 but less than 15 years 19.75 0.25 20 1 an 2 5 but less th 0 years 22.75 0.25 23
20 years or more 25.75 0.25 26 Table 25 PROPOSED INCREASES TO SICK LEAVE ACCRUAL Current Days Granted Each
Year Additional Days Granted Each
Year Proposed Total Days Granted
Each Year 12 2 14
Table OSED Y LEAVE 26 PROP INCREASES TO HOLIDACurrent Days Granted Each
Year Addit Each ional Days Granted
Year Proposed Total Days Granted
Each Year 11 in some years* Add 1 day in years where only 12
12 in some years 11 days are granted *Currently 11 Holidays when Christmas falls on Monday or Friday and 12 Holidays when Christmas falls on Tuesday, Wednesday, or Thursday
con
• Develop an em hancement program providing a fixed amount of $500 annually w apply towards:
b. NC Flex benefits package, or
Provide a separate leave category of personal leave time in the amount of 2 days per year, or allow employees to use up to 2 days from current earned sick leave time for personal reasons.
If the above recommendations are not implemented, it is recommended that the following be
sidered:
ployer supplemental benefit enith employees having the option to
a. dependent health coverage, or
c. 401(k) {457(b)} {403(b)} contributions, or d. post-tax supplemental benefit plans.
•

28
This page intentionally left blank.
History of Legislative Increases, 1992-2008 List of Benchmark Classes
29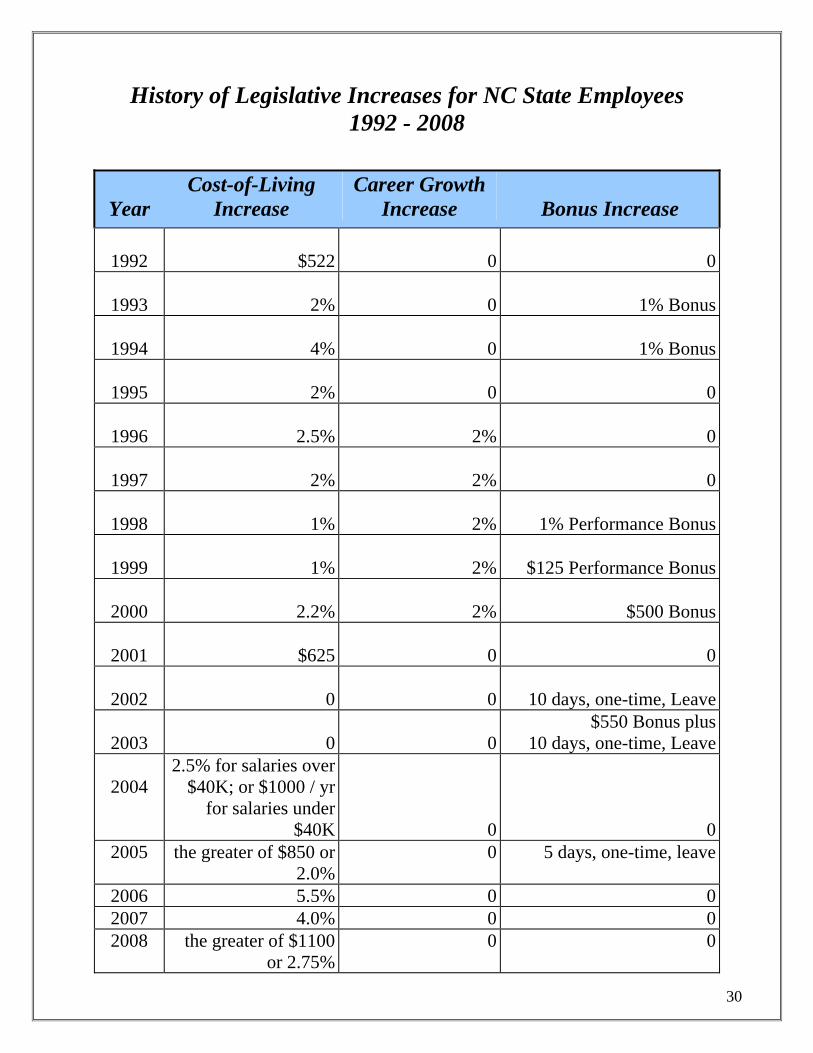
30
History of Legislative Increases for NC State Employees 1992 - 2008
Year
Cost-of-Living Increase
Career Growth Increase
Bonus Increase
1992 $522 0 0
1993 2% 0 1% Bonus
1994 4% 0 1% Bonus
1995 2% 0 0
1996 2.5% 2% 0
1997 2% 2% 0
1998 1% 2% 1% Performance Bonus
1999 1% 2% $125 Performance Bonus
2000 2.2% 2% $500 Bonus
2001 $625 0 0
2002 0 0 10 days, one-time, Leave
2003 0 0
$550 Bonus plus 10 days, one-time, Leave
2004
2.5% for salaries over $40K; or $1000 / yr
for salaries under $40K 0 0
2005 the greater of $850 or 2.0%
0 5 days, one-time, leave
2006 5.5% 0 02007 4.0% 0 02008 the greater of $1100
or 2.75%0 0
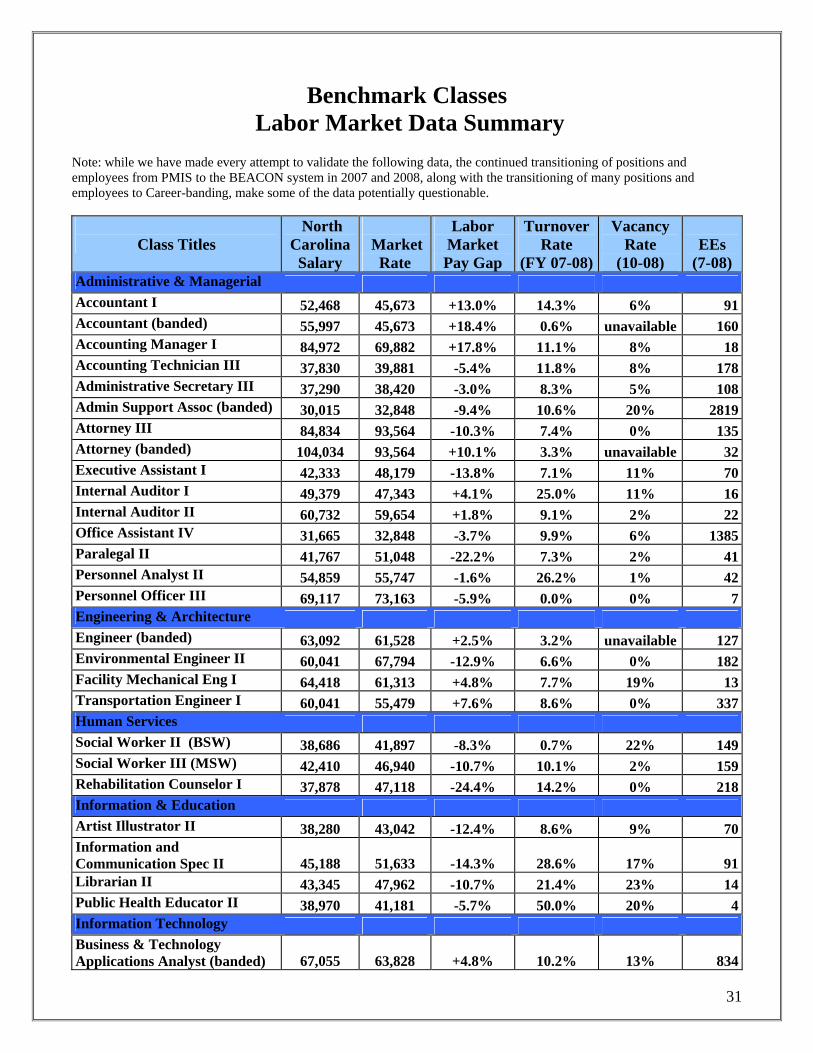
31
Benchmark Classes Labor Market Data Summary
Note: while we have made every attempt to validate the following data, the continued transitioning of positions and employees from PMIS to the BEACON system in 2007 and 2008, along with the transitioning of many positions and employees to Career-banding, make some of the data potentially questionable.
Class Titles
North Carolina Salary
Market
Rate
Labor Market Pay Gap
Turnover Rate
(FY 07-08)
Vacancy Rate
(10-08)
EEs
(7-08) Administrative & Managerial Accountant I 52,468 45,673 +13.0% 14.3% 6% 91Accountant (banded) 55,997 45,673 +18.4% 0.6% unavailable 160Accounting Manager I 84,972 69,882 +17.8% 11.1% 8% 18Accounting Technician III 37,830 39,881 -5.4% 11.8% 8% 178Administrative Secretary III 37,290 38,420 -3.0% 8.3% 5% 108Admin Support Assoc (banded) 30,015 32,848 -9.4% 10.6% 20% 2819Attorney III 84,834 93,564 -10.3% 7.4% 0% 135Attorney (banded) 104,034 93,564 +10.1% 3.3% unavailable 32Executive Assistant I 42,333 48,179 -13.8% 7.1% 11% 70Internal Auditor I 49,379 47,343 +4.1% 25.0% 11% 16Internal Auditor II 60,732 59,654 +1.8% 9.1% 2% 22Office Assistant IV 31,665 32,848 -3.7% 9.9% 6% 1385Paralegal II 41,767 51,048 -22.2% 7.3% 2% 41Personnel Analyst II 54,859 55,747 -1.6% 26.2% 1% 42Personnel Officer III 69,117 73,163 -5.9% 0.0% 0% 7Engineering & Architecture Engineer (banded) 63,092 61,528 +2.5% 3.2% unavailable 127Environmental Engineer II 60,041 67,794 -12.9% 6.6% 0% 182Facility Mechanical Eng I 64,418 61,313 +4.8% 7.7% 19% 13Transportation Engineer I 60,041 55,479 +7.6% 8.6% 0% 337Human Services Social Worker II (BSW) 38,686 41,897 -8.3% 0.7% 22% 149Social Worker III (MSW) 42,410 46,940 -10.7% 10.1% 2% 159Rehabilitation Counselor I 37,878 47,118 -24.4% 14.2% 0% 218Information & Education Artist Illustrator II 38,280 43,042 -12.4% 8.6% 9% 70Information and Communication Spec II 45,188 51,633 -14.3% 28.6% 17% 91Librarian II 43,345 47,962 -10.7% 21.4% 23% 14Public Health Educator II 38,970 41,181 -5.7% 50.0% 20% 4Information Technology Business & Technology Applications Analyst (banded) 67,055 63,828 +4.8% 10.2% 13% 834
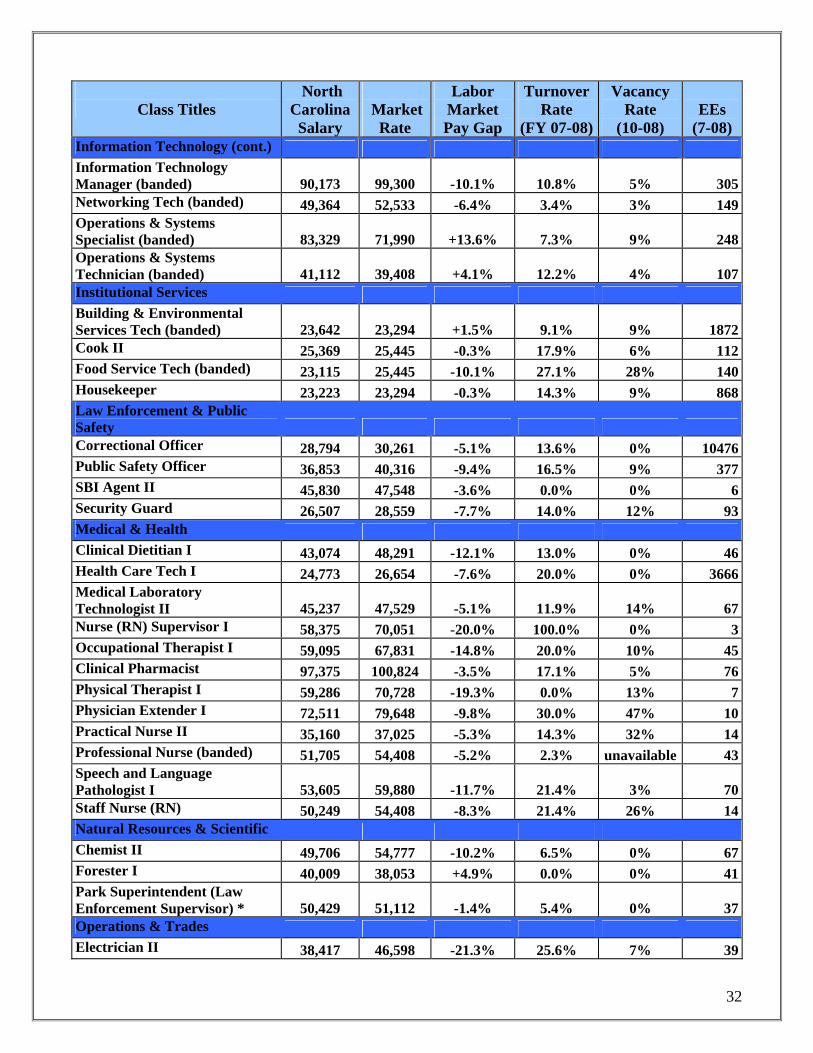
32
Class Titles North
Carolina Salary
Market
Rate
Labor Market Pay Gap
Turnover Rate
(FY 07-08)
Vacancy Rate
(10-08)
EEs
(7-08) Information Technology (cont.) Information Technology Manager (banded) 90,173 99,300 -10.1% 10.8% 5% 305Networking Tech (banded) 49,364 52,533 -6.4% 3.4% 3% 149Operations & Systems Specialist (banded) 83,329 71,990 +13.6% 7.3% 9% 248Operations & Systems Technician (banded) 41,112 39,408 +4.1% 12.2% 4% 107Institutional Services Building & Environmental Services Tech (banded) 23,642 23,294 +1.5% 9.1% 9% 1872Cook II 25,369 25,445 -0.3% 17.9% 6% 112Food Service Tech (banded) 23,115 25,445 -10.1% 27.1% 28% 140Housekeeper 23,223 23,294 -0.3% 14.3% 9% 868Law Enforcement & Public Safety Correctional Officer 28,794 30,261 -5.1% 13.6% 0% 10476Public Safety Officer 36,853 40,316 -9.4% 16.5% 9% 377SBI Agent II 45,830 47,548 -3.6% 0.0% 0% 6Security Guard 26,507 28,559 -7.7% 14.0% 12% 93Medical & Health Clinical Dietitian I 43,074 48,291 -12.1% 13.0% 0% 46Health Care Tech I 24,773 26,654 -7.6% 20.0% 0% 3666Medical Laboratory Technologist II 45,237 47,529 -5.1% 11.9% 14% 67Nurse (RN) Supervisor I 58,375 70,051 -20.0% 100.0% 0% 3Occupational Therapist I 59,095 67,831 -14.8% 20.0% 10% 45Clinical Pharmacist 97,375 100,824 -3.5% 17.1% 5% 76Physical Therapist I 59,286 70,728 -19.3% 0.0% 13% 7Physician Extender I 72,511 79,648 -9.8% 30.0% 47% 10Practical Nurse II 35,160 37,025 -5.3% 14.3% 32% 14Professional Nurse (banded) 51,705 54,408 -5.2% 2.3% unavailable 43Speech and Language Pathologist I 53,605 59,880 -11.7% 21.4% 3% 70Staff Nurse (RN) 50,249 54,408 -8.3% 21.4% 26% 14Natural Resources & Scientific Chemist II 49,706 54,777 -10.2% 6.5% 0% 67Forester I 40,009 38,053 +4.9% 0.0% 0% 41Park Superintendent (Law Enforcement Supervisor) * 50,429 51,112 -1.4% 5.4% 0% 37Operations & Trades Electrician II 38,417 46,598 -21.3% 25.6% 7% 39
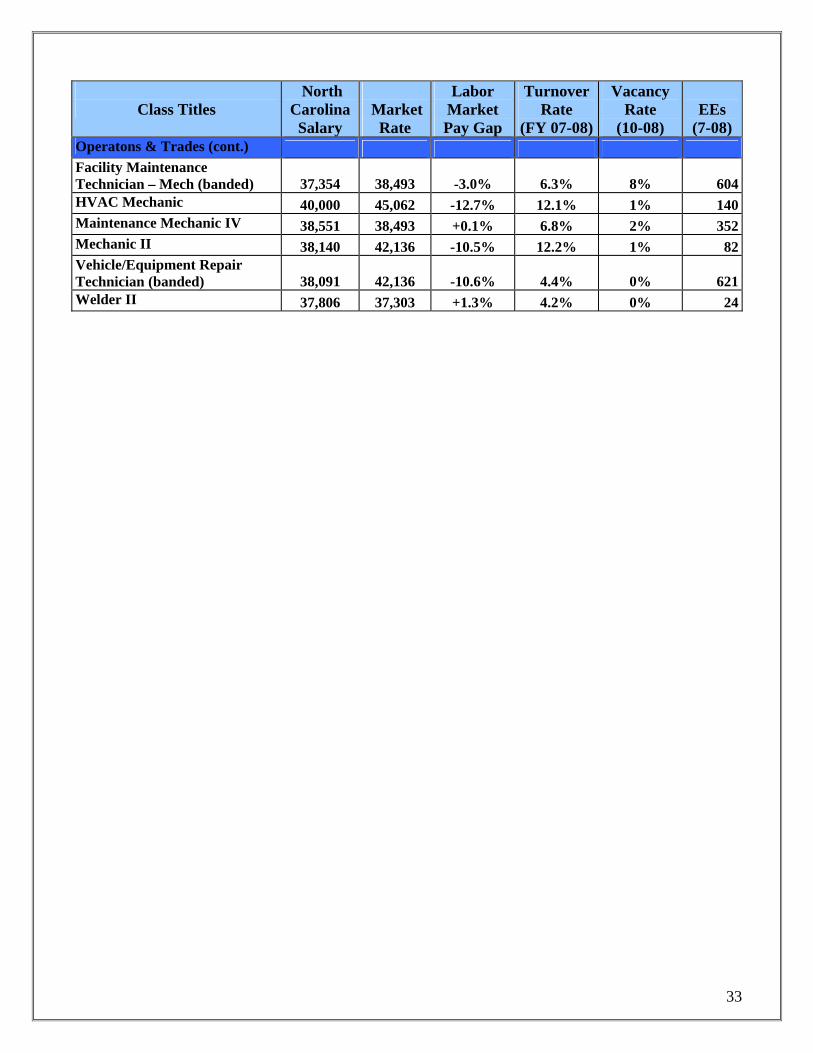
33
Class Titles North
Carolina Salary
Market
Rate
Labor Market Pay Gap
Turnover Rate
(FY 07-08)
Vacancy Rate
(10-08)
EEs
(7-08) Operatons & Trades (cont.) Facility Maintenance Technician – Mech (banded) 37,354 38,493 -3.0% 6.3% 8% 604HVAC Mechanic 40,000 45,062 -12.7% 12.1% 1% 140Maintenance Mechanic IV 38,551 38,493 +0.1% 6.8% 2% 352Mechanic II 38,140 42,136 -10.5% 12.2% 1% 82Vehicle/Equipment Repair Technician (banded) 38,091 42,136 -10.6% 4.4% 0% 621Welder II 37,806 37,303 +1.3% 4.2% 0% 24