Embed Size (px)
Citation preview
State of New York
DEPARTMENT OF CORRECTIONS AND COMMUNITY SUPERVISION
Building Number 2
Harriman Office Campus
Albany, New York 12226
UNDER CUSTODY REPORT:
Profile of Incarcerated Offender Population
Under Custody on January 1, 2012
Andrew M. Cuomo
Governor Brian Fischer
Commissioner
- i -
Profile of Incarcerated Offender Population
Under Custody on January 1, 2012
Table of Contents
_______________________________________________________________________
Page
Table of Contents .......................................................................................................... i
Executive Summary ..................................................................................................... ii
Introduction ................................................................................................................. 1
Offender Categories…………………………………………………. 2
Section 1: Demographic Characteristics
Gender Distribution ………………………………………………. ... 3
Age Distribution ................................................................................. 4
Race/Ethnic Distribution .................................................................... 5
Region of Commitment ...................................................................... 6
World Region of Birth ........................................................................ 7
Marital Status ...................................................................................... 8
Number of Living Children ................................................................ 9
Religious Affiliation .......................................................................... 10
Veteran Status .................................................................................... 11
Section 2: Criminal History
Minimum Sentence ........................................................................... 12
Maximum Sentence .......................................................................... 14
Commitment Crime .......................................................................... 16
Second Felony Offender Status ........................................................ 18
Prior Adult Criminal Record ............................................................. 20
Length of Time Served in Department Custody ............................... 21
Time to Earliest Release ................................................................... 22
Determinate Sentencing .................................................................... 23

- ii -
Profile of Incarcerated Offender Population
Under Custody on January 1, 2012
Executive Summary
* Not reported
Characteristics Category
Inmates
Under
Custody
Incarcerated
Parolees
Under
Custody
Total Under
Custody
Population January 1, 2012 55,436 543 55,979
Gender Male 95.8% 91.3% 95.8%
Age Average Age 37.5 32.1 37.5
White 23.1% 37.9% 23.3%
Race/Ethnic Status African-American 49.5% 43.5% 49.5%
Hispanic 24.6% 14.7% 24.5%
New York City 47.5% 22.3% 47.2%
Suburban New York 11.6% 10.1% 11.6%
Upstate Urban 23.9% 31.0% 24.0%
Upstate Other 17.0% 36.5% 17.2%
World Region of Birth Foreign Born 10.3% 1.7% 10.2%
Marital Status Never Married 65.5% 77.7% 65.6%
Living Children One or more living children 59.3% 59.1% 59.3%
Catholic 24.9% 26.2% 24.9%
Religious Affiliation Protestant 28.1% 24.9% 28.1%
Islam 11.5% 8.1% 11.5%
Veteran Status Veteran 4.7% 3.3% 4.7%
Median time in months 62.0 24.0 62.0
Average time in months 118.2 28.6 117.4
Median time in months 84.0 42.0 84.0
Average time in months 140.2 49.4 139.3
Violent Felony 63.8% 5.9% 63.2%
Other Coercive 8.0% 6.3% 7.9%
Drug Offenses 13.6% 43.8% 13.9%
Property/Other 12.6% 38.9% 12.8%
Youthful/Juvenile 2.0% 5.2% 2.1%
First Felony 56.1% 45.7% 56.0%
Second Felony 39.6% 54.0% 39.8%
Persistent Felony 4.3% 0.4% 4.3%
No Prior Arrest 15.7% 6.6% 15.6%
No Prior Conviction 7.9% 6.3% 7.9%
Conviction No Jail 18.2% 22.9% 18.2%
Prior Jail 24.6% 37.5% 24.7%
Prior prison term 33.6% 26.8% 33.5%
Median time in months 24.8 1.5 N/A
Average time in months 59.4 1.8 N/A
Median time in months 15.9 * *
Average time in months 50.4 * *
Total 55% 46% 55%
Drug Offenses 88% 92% 88%
Violent Felony 66% 91% 66%
Region
Minimum Sentence
Crime
Second Felony Offender Status
Determinate Sentence
Prior Adult Criminal Record
Time Served in Department Custody
Time to Earliest Release Date
Maximum Sentence
Profile of Incarcerated Offender Population
Under Custody on January 1, 2012
INTRODUCTION
Purpose of the Report
This report profiles the incarcerated offender population by demographic and criminal history
characteristics. It presents information on offenders held under Department of Corrections and
Community Supervision (DOCCS) custody on January 1, 2012.
Additional Offenders Reported Due to the Merger of Corrections and Parole
In April 2011, the former Division of Parole and the former Department of Correctional
Services merged to form the Department of Corrections and Community Supervision (DOCCS). In
past years the Department’s Under Custody reports only included inmates in correctional facilities.
Starting with this report, all inmates will be reported including those participating in the Alt 90 or Alt
45 programs1. In addition, “incarcerated parolees” (offenders under community supervision who are
participating in a parole program at a DOCCS facility) will be included, but reported separately.
Most “incarcerated parolees” are housed in parole program facilities, while some are housed in
correctional facilities. Similarly, most inmates are housed in correctional facilities, while others are
housed in parole program facilities.
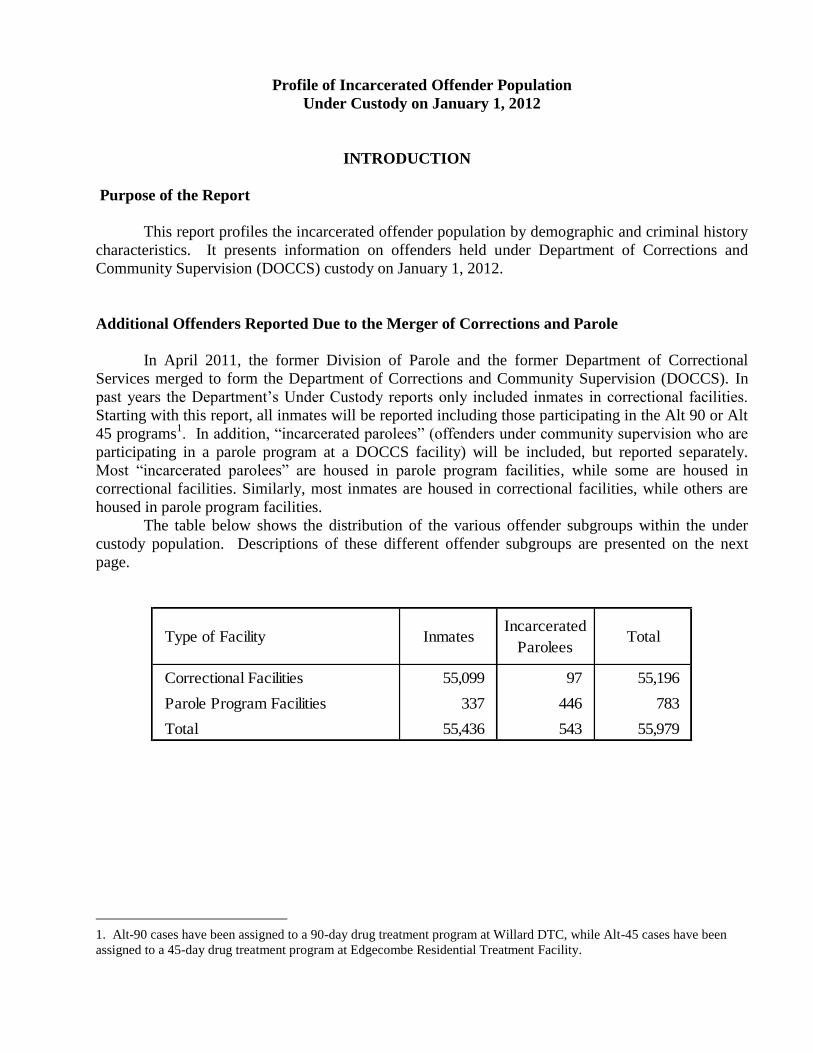
The table below shows the distribution of the various offender subgroups within the under
custody population. Descriptions of these different offender subgroups are presented on the next
page.
Type of Facility InmatesIncarcerated
ParoleesTotal
Correctional Facilities 55,099 97 55,196
Parole Program Facilities 337 446 783
Total 55,436 543 55,979
1. Alt-90 cases have been assigned to a 90-day drug treatment program at Willard DTC, while Alt-45 cases have been
assigned to a 45-day drug treatment program at Edgecombe Residential Treatment Facility.
- 2 -
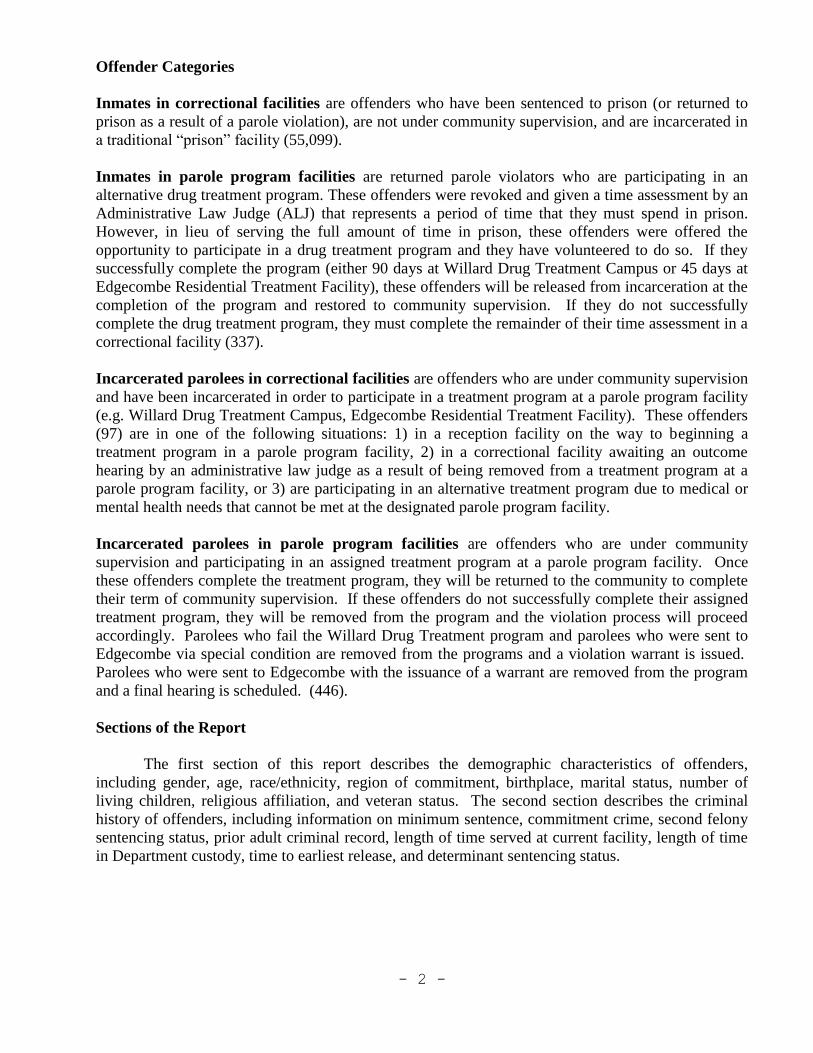
Offender Categories
Inmates in correctional facilities are offenders who have been sentenced to prison (or returned to
prison as a result of a parole violation), are not under community supervision, and are incarcerated in
a traditional “prison” facility (55,099).
Inmates in parole program facilities are returned parole violators who are participating in an
alternative drug treatment program. These offenders were revoked and given a time assessment by an
Administrative Law Judge (ALJ) that represents a period of time that they must spend in prison.
However, in lieu of serving the full amount of time in prison, these offenders were offered the
opportunity to participate in a drug treatment program and they have volunteered to do so. If they
successfully complete the program (either 90 days at Willard Drug Treatment Campus or 45 days at
Edgecombe Residential Treatment Facility), these offenders will be released from incarceration at the
completion of the program and restored to community supervision. If they do not successfully
complete the drug treatment program, they must complete the remainder of their time assessment in a
correctional facility (337).
Incarcerated parolees in correctional facilities are offenders who are under community supervision
and have been incarcerated in order to participate in a treatment program at a parole program facility
(e.g. Willard Drug Treatment Campus, Edgecombe Residential Treatment Facility). These offenders
(97) are in one of the following situations: 1) in a reception facility on the way to beginning a
treatment program in a parole program facility, 2) in a correctional facility awaiting an outcome
hearing by an administrative law judge as a result of being removed from a treatment program at a
parole program facility, or 3) are participating in an alternative treatment program due to medical or
mental health needs that cannot be met at the designated parole program facility.
Incarcerated parolees in parole program facilities are offenders who are under community
supervision and participating in an assigned treatment program at a parole program facility. Once
these offenders complete the treatment program, they will be returned to the community to complete
their term of community supervision. If these offenders do not successfully complete their assigned
treatment program, they will be removed from the program and the violation process will proceed
accordingly. Parolees who fail the Willard Drug Treatment program and parolees who were sent to
Edgecombe via special condition are removed from the programs and a violation warrant is issued.
Parolees who were sent to Edgecombe with the issuance of a warrant are removed from the program
and a final hearing is scheduled. (446).
Sections of the Report
The first section of this report describes the demographic characteristics of offenders,
including gender, age, race/ethnicity, region of commitment, birthplace, marital status, number of
living children, religious affiliation, and veteran status. The second section describes the criminal
history of offenders, including information on minimum sentence, commitment crime, second felony
sentencing status, prior adult criminal record, length of time served at current facility, length of time
in Department custody, time to earliest release, and determinant sentencing status.

- 3 -
Section One
DEMOGRAPHIC CHARACTERISTICS
Gender Distribution
There were 55,979 offenders under custody on January 1, 2012. Of this total, 53,620 (96%)
were male and 2,359 (4%) were female. This is a drop of 1,250 (-2%) total offenders since last year.
The number of male offenders decreased by 1,349 (-2%) and female offenders increased by 99 (4%).
A larger proportion of incarcerated parolees were female (9%) than were inmates (4%).
Figure 1. Proportion of Female Offenders Under Custody by Offender Status
4.2%
8.7%
0%
2%
4%
6%
8%
10%
Inmates Incarcerated Parolees
Table 1. Gender by Offender Status;
Under Custody Population January 1, 2011 and 2012
Gender and Numeric Percent Percent of Percent of
Custody Status Change Change Total 2011 Total 2012
Inmates
Male 54,429 53,124 -1,305 -2.4% 96.1% 95.8%
Female 2,216 2,312 96 4.3% 3.9% 4.2%
Total 56,645 55,436 -1,209 -2.1% 100% 100%
Incarcerated Parolees
Male 540 496 -44 -8.1% 92.5% 91.3%
Female 44 47 3 6.8% 7.5% 8.7%
Total 584 543 -41 -7.0% 100% 100%
Grand Total
Male 54,969 53,620 -1,349 -2.5% 96.1% 95.8%
Female 2,260 2,359 99 4.4% 3.9% 4.2%
Total 57,229 55,979 -1,250 -2.2% 100% 100%
2011 2012
- 4 -
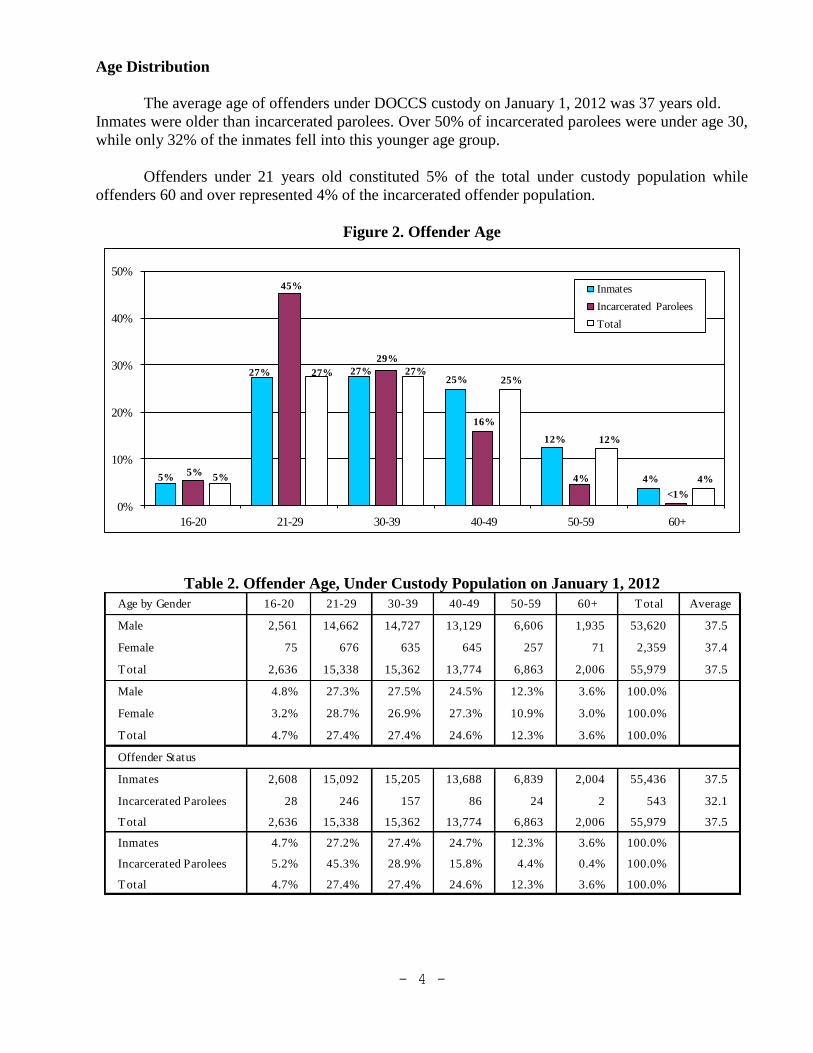
Age Distribution
The average age of offenders under DOCCS custody on January 1, 2012 was 37 years old.
Inmates were older than incarcerated parolees. Over 50% of incarcerated parolees were under age 30,
while only 32% of the inmates fell into this younger age group.
Offenders under 21 years old constituted 5% of the total under custody population while
offenders 60 and over represented 4% of the incarcerated offender population.
Figure 2. Offender Age
5%
27% 27%25%
12%
4%5%
45%
29%
16%
4%
<1%
5%
27% 27%25%
12%
4%
0%
10%
20%
30%
40%
50%
16-20 21-29 30-39 40-49 50-59 60+
Inmates
Incarcerated Parolees
Total
Table 2. Offender Age, Under Custody Population on January 1, 2012
Age by Gender 16-20 21-29 30-39 40-49 50-59 60+ Total Average
Male 2,561 14,662 14,727 13,129 6,606 1,935 53,620 37.5
Female 75 676 635 645 257 71 2,359 37.4
Total 2,636 15,338 15,362 13,774 6,863 2,006 55,979 37.5
Male 4.8% 27.3% 27.5% 24.5% 12.3% 3.6% 100.0%
Female 3.2% 28.7% 26.9% 27.3% 10.9% 3.0% 100.0%
Total 4.7% 27.4% 27.4% 24.6% 12.3% 3.6% 100.0%
Offender Status
Inmates 2,608 15,092 15,205 13,688 6,839 2,004 55,436 37.5
Incarcerated Parolees 28 246 157 86 24 2 543 32.1
Total 2,636 15,338 15,362 13,774 6,863 2,006 55,979 37.5
Inmates 4.7% 27.2% 27.4% 24.7% 12.3% 3.6% 100.0%
Incarcerated Parolees 5.2% 45.3% 28.9% 15.8% 4.4% 0.4% 100.0%
Total 4.7% 27.4% 27.4% 24.6% 12.3% 3.6% 100.0%

- 5 -
Race/Ethnic Distribution
Approximately half of the offenders under custody on January 1, 2012, were African-
American, with just under a quarter Hispanic and another quarter White. The female offender
population had a larger proportion of Whites (39%) than the male offender population (23%). The
incarcerated parolee population was more likely than inmates to be White (38% vs. 23%).
Figure 3. Race/Ethnic Status by Gender
23%
50%
25%
39% 40%
18%
23%
50%
25%
0%
10%
20%
30%
40%
50%
60%
White African American Hispanic
Male
Female
Total
Table 3. Race/Ethnic, by Gender or Offender Status;
Under Custody Population January 1, 2012
Race/ethnic Status by
GenderWhite
African
AmericanHispanic
Native
AmericanAsian Other Unknown Total
Male 12,100 26,751 13,312 308 240 316 593 53,620
Female 924 953 423 22 13 7 17 2,359
Total 13,024 27,704 13,735 330 253 323 610 55,979
Male 22.6% 49.9% 24.8% 0.6% 0.4% 0.6% 1.1% 100.0%
Female 39.2% 40.4% 17.9% 0.9% 0.6% 0.3% 0.7% 100.0%
Total 23.3% 49.5% 24.5% 0.6% 0.5% 0.6% 1.1% 100.0%
Offender Status
Inmates 12,818 27,468 13,655 325 251 322 597 55,436
Incarcerated Parolees 206 236 80 5 2 1 13 543
Total 13,024 27,704 13,735 330 253 323 610 55,979
Inmates 23.1% 49.5% 24.6% 0.6% 0.5% 0.6% 1.1% 100.0%
Incarcerated Parolees 37.9% 43.5% 14.7% 0.9% 0.4% 0.2% 2.4% 100.0%
Total 23.3% 49.5% 24.5% 0.6% 0.5% 0.6% 1.1% 100.0%

- 6 -
Region of Commitment
Approximately half (47%) of the offenders under custody on January 1, 2012, were
committed from New York City and 12% were committed from suburban New York (Nassau,
Rockland, Suffolk, and Westchester counties). Upstate counties with a population center containing
50,000 inhabitants or more (Albany, Broome, Erie, Monroe, Oneida, Onondaga, Niagara, Rensselaer,
and Schenectady counties) comprised 24% of the offender population. The remaining 17% were
sentenced from the other Upstate counties. The incarcerated parolee population was less likely than
inmates to have been committed from New York City and more likely to be committed from upstate
counties.
Figure 4. Region of Commitment by Gender
48%
12%
24%
17%
37%
11%
25%27%
47%
12%
24%
17%
0%
20%
40%
60%
New York City Suburban New York Upstate Urban Upstate Other
Male
Female
Total
Table 4. Region of Commitment by Gender or Offender Status;
Under Custody Population January 1, 2012
Region by GenderNew York
City
Suburban
New York
Upstate
Urban
Upstate
OtherTotal*
Male 25,557 6,219 12,830 9,014 53,620
Female 873 253 599 633 2,358
Total 26,430 6,472 13,429 9,647 55,978
Male 47.7% 11.6% 23.9% 16.8% 100.0%
Female 37.0% 10.7% 25.4% 26.8% 100.0%
Total 47.2% 11.6% 24.0% 17.2% 100.0%
Offender Status
Inmates 26,309 6,417 13,260 9,449 55,435
Incarcerated Parolees 121 55 169 198 543
Total 26,430 6,472 13,429 9,647 55,978
Inmates 47.5% 11.6% 23.9% 17.0% 100.0%
Incarcerated Parolees 22.3% 10.1% 31.1% 36.5% 100.0%
Total 47.2% 11.6% 24.0% 17.2% 100.0% * One inmate from out of state.

- 7 -
World Region of Birth
Ninety percent (90%) of under custody offenders were born in the United States or a United
States Territory. Approximately 10% or 5,728 of under custody offenders reported birth in a foreign
country. Most of these offenders who reported birth in a foreign country were from one of the island
nations in the Caribbean basin.2
Figure 5. World Region of Birth
558
2,854
684736
353
14586
295
54
0
500
1,000
1,500
2,000
2,500
3,000
North
America
Carribean Central
America
South
America
Europe Africa Near East Asia Other
Table 5. World Region of Birth; Under Custody Population January 1, 2012
* Includes offenders committed from United States Territories.
2. For additional information on foreign born inmates see "The Foreign Born Under Custody Population and the Institutional Removal
Program" (2011), New York State Department of Corrections and Community Supervision, Albany, New York 12226. On the DOCCS’
web site at: http://www.doccs.ny.gov/Research/Reports/2011/ForeignBorn_IRP_Report.pdf
World Region by
Gender
United
States*
North
AmericaCarribean
Central
America
South
AmericaEurope Africa Near East Asia
South
PacificUnknown Total
Male 48,057 539 2,755 667 710 331 142 82 288 13 36 53,620
Female 2,157 19 99 17 26 22 3 4 7 4 1 2,359
Total 50,214 558 2,854 684 736 353 145 86 295 17 37 55,979
Male 89.6% 1.0% 5.1% 1.2% 1.3% 0.6% 0.3% 0.2% 0.5% 0.0% 0.1% 100.0%
Female 91.4% 0.8% 4.2% 0.7% 1.1% 0.9% 0.1% 0.2% 0.3% 0.2% 0.0% 100.0%
Total 89.7% 1.0% 5.1% 1.2% 1.3% 0.6% 0.3% 0.2% 0.5% 0.0% 0.1% 100.0%
Offender Status
Inmates 49,690 556 2,853 684 735 352 143 86 293 17 27 55,436
Incarcerated Parolees 524 2 1 0 1 1 2 0 2 0 10 543
Total 50,214 558 2,854 684 736 353 145 86 295 17 37 55,979
Inmates 89.6% 1.0% 5.1% 1.2% 1.3% 0.6% 0.3% 0.2% 0.5% 0.0% 0.0% 100.0%
Incarcerated Parolees 96.5% 0.4% 0.2% 0.0% 0.2% 0.2% 0.4% 0.0% 0.4% 0.0% 1.8% 100.0%
Total 89.7% 1.0% 5.1% 1.2% 1.3% 0.6% 0.3% 0.2% 0.5% 0.0% 0.1% 100.0%

- 8 -
Marital Status
Two-thirds of the offender population reported never being married. The rate was higher
(78%) for incarcerated parolees.
Figure 6. Marital Status
66%
21%
2%
8%
1% 1%
65%
18%
<1%
12%
4%1%
66%
21%
2%
9%
1% 1%
0%
20%
40%
60%
80%
Never Married Married Common Law Seperated/ Divorced
Widowed Not Stated/ Unknown
Male
Female
Total
Table 6. Marital Status; Under Custody Population January 1, 2012
Marriage StatusNever
MarriedMarried
Common
Law
Seperated/
DivorcedWidowed
Not Stated/
UnknownTotal
Male 35,176 11,522 1,305 4,546 505 566 53,620
Female 1,542 429 7 282 84 15 2,359
Total 36,718 11,951 1,312 4,828 589 581 55,979
Male 65.6% 21.5% 2.4% 8.5% 0.9% 1.1% 100.0%
Female 65.4% 18.2% 0.3% 12.0% 3.6% 0.6% 100.0%
Total 65.6% 21.3% 2.3% 8.6% 1.1% 1.0% 100.0%
Offender Status
Inmates 36,296 11,893 1,309 4,780 587 571 55,436
Incarcerated Parolees 422 58 3 48 2 10 543
Total 36,718 11,951 1,312 4,828 589 581 55,979
Inmates 65.5% 21.5% 2.4% 8.6% 1.1% 1.0% 100.0%
Incarcerated Parolees 77.7% 10.7% 0.6% 8.8% 0.4% 1.8% 100.0%
Total 65.6% 21.3% 2.3% 8.6% 1.1% 1.0% 100.0%

- 9 -
Number of Living Children
The majority of offenders under custody (59%) reported that they had at least one living child
at the time of admission to the Department.
Figure 7. Offenders with One or More Living Children
38%
23%
16%
9%11%
3%
29%
22%
19%
12%
17%
1%
38%
23%
16%
9%11%
3%
0%
15%
30%
45%
No Children 1 Child 2 Children 3 Children 4 or More Unknown
Male
Female
Total
Table 7. Number of Children; Under Custody Population January 1, 2012
Number of Children No Children 1 Child 2 Children 3 Children 4 or More Unknown Total
Male 20,517 12,242 8,605 4,823 5,862 1,571 53,620
Female 675 518 458 284 401 23 2,359
Total 21,192 12,760 9,063 5,107 6,263 1,594 55,979
Male 38.3% 22.8% 16.0% 9.0% 10.9% 2.9% 100.0%
Female 28.6% 22.0% 19.4% 12.0% 17.0% 1.0% 100.0%
Total 37.9% 22.8% 16.2% 9.1% 11.2% 2.8% 100.0%
Offender Status
Inmates 20,983 12,643 8,970 5,067 6,192 1,581 55,436
Incarcerated Parolees 209 117 93 40 71 13 543
Total 21,192 12,760 9,063 5,107 6,263 1,594 55,979
Inmates 37.9% 22.8% 16.2% 9.1% 11.2% 2.9% 100.0%
Incarcerated Parolees 38.5% 21.5% 17.1% 7.4% 13.1% 2.4% 100.0%
Total 37.9% 22.8% 16.2% 9.1% 11.2% 2.8% 100.0%

- 10 -
Religious Affiliation
Eighty-five percent (85%) of under custody offenders reported affiliation with a recognized
religion. Twenty-eight percent (28%) were Protestant, 25% were Catholic, 11% were Islam, 21%
other faiths, and 15% did not report affiliation with a religious faith.
Figure 8. Religious Affiliation
25%
27%
12%
32%
42%
9%
25%
28%
11%
0%
10%
20%
30%
40%
50%
Catholic Protestant Islam
Male
Female
Total
Table 8. Religious Affiliation; Under Custody January 1, 2012
Religious Affiliation CatholicProtes -
tantIslam
Nation
of Islam
Rasta-
farianJewish
Asian
Religions
Native
American
Greek
OrthodoxOther
None
ListedTotal
Male 13,206 14,733 6,195 2,128 3,534 3,548 339 440 52 1,552 7,893 53,620
Female 746 992 222 14 18 49 9 11 2 13 283 2,359
Total 13,952 15,725 6,417 2,142 3,552 3,597 348 451 54 1,565 8,176 55,979
Male 24.6% 27.5% 11.6% 4.0% 6.6% 6.6% 0.6% 0.8% 0.1% 2.9% 14.7% 100.0%
Female 31.6% 42.1% 9.4% 0.6% 0.8% 2.1% 0.4% 0.5% 0.1% 0.6% 12.0% 100.0%
Total 24.9% 28.1% 11.5% 3.8% 6.3% 6.4% 0.6% 0.8% 0.1% 2.8% 14.6% 100.0%
Offender Status
Inmates 13,810 15,590 6,373 2,134 3,536 3,580 345 445 52 1,561 8,010 55,436
Incarcerated Parolees 142 135 44 8 16 17 3 6 2 4 166 543
Total 13,952 15,725 6,417 2,142 3,552 3,597 348 451 54 1,565 8,176 55,979
Inmates 24.9% 28.1% 11.5% 3.8% 6.4% 6.5% 0.6% 0.8% 0.1% 2.8% 14.4% 100.0%
Incarcerated Parolees 26.2% 24.9% 8.1% 1.5% 2.9% 3.1% 0.6% 1.1% 0.4% 0.7% 30.6% 100.0%
Total 24.9% 28.1% 11.5% 3.8% 6.3% 6.4% 0.6% 0.8% 0.1% 2.8% 14.6% 100.0%

- 11 -
Veteran Status
Of the 55,979 offenders under custody on January 1, 2012, 5% (2,604) reported military
service. Of this total, the largest number claimed military service in the Post-Vietnam Era (May 1975
to July 1990).
Figure 9. Offender Veterans by Military Service Era
82
546
1,164
505
229
78
0
300
600
900
1,200
1,500
Pre-Vietnam Vietnam
1/1963 to 4/1975
Post-Vietnam
5/1975 to 7/1990
Persian Gulf
8/1990 to 12/2001
Afghanistan/ Iraq
2002 to Present
Undeterminded
Era
Table 9. Veteran Status by Service Era; Under Custody Population January 1, 2012
Veteran Status Not-Veteran Pre-Vietnam
Vietnam
1/1963 to
4/1975
Post-Vietnam
5/1975 to
7/1990
Persian Gulf
8/1990 to
12/2001
Afghanistan/
Iraq 2002 to
Present
Undeterminded
EraTotal
Male 51,039 82 546 1,158 496 222 77 53,620
Female 2,336 0 0 6 9 7 1 2,359
Total 53,375 82 546 1,164 505 229 78 55,979
Male 95.2% 0.2% 1.0% 2.2% 0.9% 0.4% 0.1% 100.0%
Female 99.0% 0.0% 0.0% 0.3% 0.4% 0.3% 0.0% 100.0%
Total 95.3% 0.1% 1.0% 2.1% 0.9% 0.4% 0.1% 100.0%
Offender Status
Inmates 52,850 82 545 1,154 501 226 78 55,436
Incarcerated
Parolees525 0 1 10 4 3 0 543
Total 53,375 82 546 1,164 505 229 78 55,979
Inmates 95.3% 0.1% 1.0% 2.1% 0.9% 0.4% 0.1% 100.0%
Incarcerated
Parolees96.7% 0.0% 0.2% 1.8% 0.7% 0.6% 0.0% 100.0%
Total 95.3% 0.1% 1.0% 2.1% 0.9% 0.4% 0.1% 100.0%
- 12 -
Section Two
CRIMINAL HISTORY
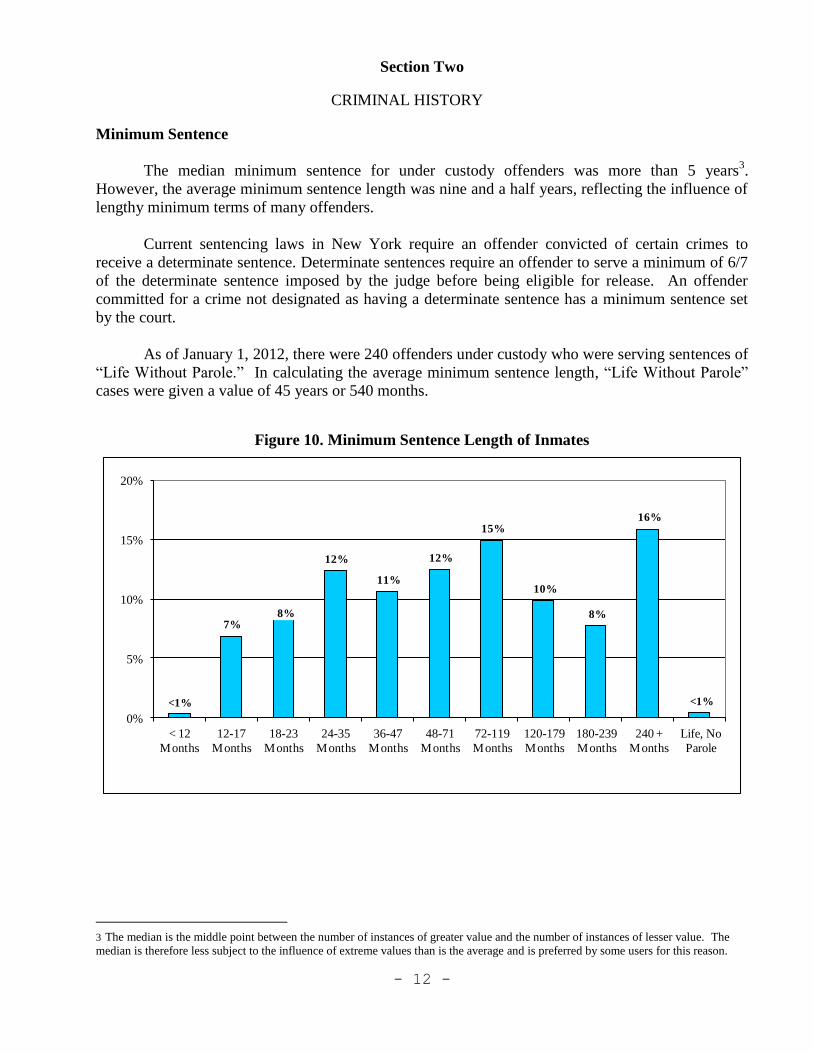
Minimum Sentence
The median minimum sentence for under custody offenders was more than 5 years3.
However, the average minimum sentence length was nine and a half years, reflecting the influence of
lengthy minimum terms of many offenders.
Current sentencing laws in New York require an offender convicted of certain crimes to
receive a determinate sentence. Determinate sentences require an offender to serve a minimum of 6/7
of the determinate sentence imposed by the judge before being eligible for release. An offender
committed for a crime not designated as having a determinate sentence has a minimum sentence set
by the court.
As of January 1, 2012, there were 240 offenders under custody who were serving sentences of
“Life Without Parole.” In calculating the average minimum sentence length, “Life Without Parole”
cases were given a value of 45 years or 540 months.
Figure 10. Minimum Sentence Length of Inmates
<1%
7%8%
12%
11%
12%
15%
10%
8%
16%
<1%
0%
5%
10%
15%
20%
< 12
Months
12-17
Months
18-23
Months
24-35
Months
36-47
Months
48-71
Months
72-119
Months
120-179
Months
180-239
Months
240 +
Months
Life, No
Parole
3 The median is the middle point between the number of instances of greater value and the number of instances of lesser value. The
median is therefore less subject to the influence of extreme values than is the average and is preferred by some users for this reason.
- 13 -
Table 10. Minimum Sentence; Under Custody Population January 1, 2012
Minimum Sentence by
Gender - InmatesMale Female Total Male Female Total
< 12 Months 151 23 174 0.3% 1.0% 0.3%
12-17 Months 3,456 353 3,809 6.5% 15.3% 6.9%
18-23 Months 4,346 288 4,634 8.2% 12.5% 8.4%
24-35 Months 6,502 392 6,894 12.2% 17.0% 12.4%
36-47 Months 5,658 276 5,934 10.7% 11.9% 10.7%
48-71 Months 6,632 318 6,950 12.5% 13.8% 12.5%
72-119 Months 8,060 230 8,290 15.2% 9.9% 15.0%
120-179 Months 5,337 123 5,460 10.0% 5.3% 9.8%
180-239 Months 4,155 124 4,279 7.8% 5.4% 7.7%
240 + Months 8,595 177 8,772 16.2% 7.7% 15.8%
Life, No Parole 232 8 240 0.4% 0.3% 0.4%
Total Inmates 53,124 2,312 55,436 100.0% 100.0% 100.0%
Minimum Sentence by
Gender - ParoleeMale Female Total Male Female Total
< 12 Months 2 0 2 0.4% 0.0% 0.4%
12-17 Months 100 10 110 20.2% 21.3% 20.3%
18-23 Months 111 16 127 22.4% 34.0% 23.4%
24-35 Months 150 15 165 30.2% 31.9% 30.4%
36-47 Months 85 4 89 17.1% 8.5% 16.4%
48-71 Months 29 1 30 5.8% 2.1% 5.5%
72-119 Months 16 1 17 3.2% 2.1% 3.1%
120-179 Months 2 0 2 0.4% 0.0% 0.4%
180-239 Months 1 0 1 0.2% 0.0% 0.2%
240 + Months 0 0 0 0.0% 0.0% 0.0%
Life, No Parole 0 0 0 0.0% 0.0% 0.0%
Total Incarcerated
Parolees496 47 543 100.0% 100.0% 100.0%
Total Count of
Incarcerated Offenders53,620 2,359 55,979 95.8% 4.2% 100.0%
Average and Median
Minimum Sentence
Male
Average
Female
Average
Total
Average
Male
Median
Female
Median
Total
Median
Total Inmates 120.2 74.1 118.2 67.0 36.0 62.0
Total Incarcerated
Parolees28.9 25.0 28.6 24.0 21.0 24.0
Total Incarcerated
Offenders119.3 73.1 117.4 62.0 36.0 62.0
As can be seen in Table 10 above, the median minimum sentence for inmates is 62 months,
but there is a large difference between male inmates whose median minimum sentence is 67 months
and female inmates at 36 months.
For incarcerated parolees the median minimum sentence was 24 months and the differences
between males and female were much smaller, with male median minimum sentence at 24 months
compared with 21 months for female parolees.
- 14 -
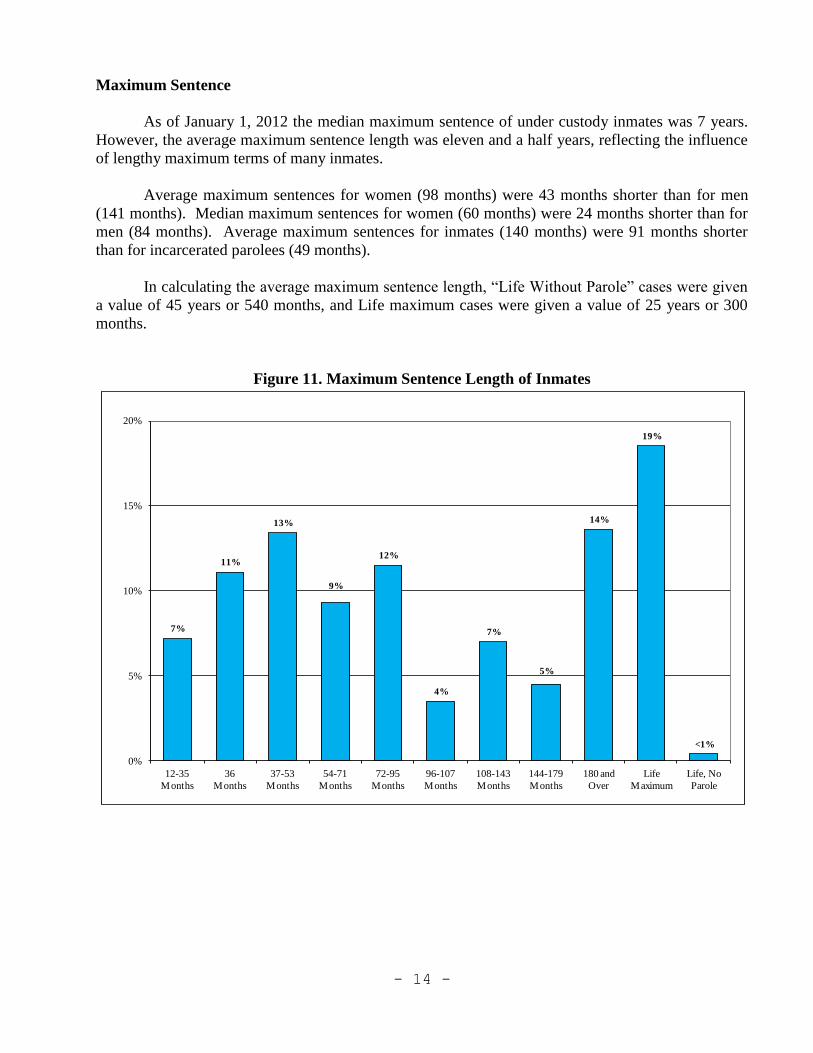
Maximum Sentence
As of January 1, 2012 the median maximum sentence of under custody inmates was 7 years.
However, the average maximum sentence length was eleven and a half years, reflecting the influence
of lengthy maximum terms of many inmates.
Average maximum sentences for women (98 months) were 43 months shorter than for men
(141 months). Median maximum sentences for women (60 months) were 24 months shorter than for
men (84 months). Average maximum sentences for inmates (140 months) were 91 months shorter
than for incarcerated parolees (49 months).
In calculating the average maximum sentence length, “Life Without Parole” cases were given
a value of 45 years or 540 months, and Life maximum cases were given a value of 25 years or 300
months.
Figure 11. Maximum Sentence Length of Inmates
7%
11%
13%
9%
12%
4%
7%
5%
14%
19%
<1%
0%
5%
10%
15%
20%
12-35
Months
36
Months
37-53
Months
54-71
Months
72-95
Months
96-107
Months
108-143
Months
144-179
Months
180 and
Over
Life
Maximum
Life, No
Parole

- 15 -
Table 11. Maximum Sentence; Under Custody Population January 1, 2012
As can be seen in Table 11 above, the median maximum sentence for inmates is 84 months,
but there is a large difference between male inmates whose median maximum sentence is 84 months
and female inmates at 60 months.
For incarcerated parolees the median maximum sentence is 42 months the differences between
males and female were much smaller, with male median maximum sentence at 42 months compared
with 36 months for female incarcerated parolees.
Maximum Sentence by
Gender - InmatesMale Female Total Male Female Total
12 to 35 3,729 256 3,985 7.0% 11.1% 7.2%
36 Months 5,702 460 6,162 10.7% 19.9% 11.1%
37-53 Months 7,079 371 7,450 13.3% 16.0% 13.4%
54-71 Months 4,955 224 5,179 9.3% 9.7% 9.3%
72-95 Months 6,089 264 6,353 11.5% 11.4% 11.5%
96-107 Months 1,868 67 1,935 3.5% 2.9% 3.5%
108-143 Months 3,712 157 3,869 7.0% 6.8% 7.0%
144-179 Months 2,411 84 2,495 4.5% 3.6% 4.5%
180 and Over 7,331 187 7,518 13.8% 8.1% 13.6%
Life Max 10,016 234 10,250 18.9% 10.1% 18.5%
Life, No Parole 232 8 240 0.4% 0.3% 0.4%
Total Inmates 53,124 2,312 55,436 100.0% 100.0% 100.0%
Maximum Sentence by
Gender - ParoleeMale Female Total Male Female Total
12 to 35 96 10 106 19.4% 21.3% 19.5%
36 Months 144 15 159 29.0% 31.9% 29.3%
37-53 Months 136 15 151 27.4% 31.9% 27.8%
54-71 Months 37 2 39 7.5% 4.3% 7.2%
72-95 Months 54 4 58 10.9% 8.5% 10.7%
96-107 Months 3 0 3 0.6% 0.0% 0.6%
108-143 Months 17 0 17 3.4% 0.0% 3.1%
144-179 Months 3 0 3 0.6% 0.0% 0.6%
180 and Over 2 1 3 0.4% 2.1% 0.6%
Life Max 4 0 4 0.8% 0.0% 0.7%
Life, No Parole 0 0 0 0.0% 0.0% 0.0%
Total Inmates 496 47 543 100.0% 100.0% 100.0%
Total Count of
Incarcerated Offenders53,620 2,359 55,979 95.8% 4.2% 100.0%
Average and Median
Maximum Sentence
Male
Average
Female
Average
Total
Average
Male
Median
Female
Median
Total
Median
Total Inmates 142.0 99.2 140.2 84.0 60.0 84.0
Total Incarcerated
Parolees49.8 45.2 49.4 42.0 36.0 42.0
Total Incarcerated
Offenders141.1 98.2 139.3 84.0 60.0 84.0

- 16 -
Commitment Crime
Sixty-three percent (63%) of the offenders under custody on January 1, 2012, were serving a
sentence for a Violent Felony Offense (VFO). Another 14% of offenders were serving a sentence for
a Drug crime. Forty-five percent (45%) of female offenders were serving a sentence for a VFO
compared to 64% for male offenders. In contrast, 27% of female offenders were sentenced for a
property or other crime compared to 13% percent of male offenders. Table 12B lists the commitment
crimes that are included in each of the general categories in Figure 12. Over 82% of incarcerated
parolees were convicted of a drug or property related crime in comparison to 26% of inmates.
Figure 12. Commitment Crime Category
64%
8%
14%13%
2%
44%
10%
18%
27%
2%
63%
8%
14%13%
2%
0%
15%
30%
45%
60%
75%
Violent Felony Other Coercive Drug Offense Property and Other
Youthful/Juvenile Offender
Male Female Total
Table 12A. Crime Category; Under Custody Population January 1, 2012
Commitment Crime TypeViolent
Felony
Other
Coercive
Drug
Offenses
Property
and OtherYO/JO Total
Male 34,339 4,211 7,390 6,570 1,110 53,620
Female 1,061 231 415 611 41 2,359
Total 35,400 4,442 7,805 7,181 1,151 55,979
Male 64.0% 7.9% 13.8% 12.3% 2.1% 100.0%
Female 45.0% 9.8% 17.6% 25.9% 1.7% 100.0%
Total 63.2% 7.9% 13.9% 12.8% 2.1% 100.0%
Offender Status
Inmates 35,368 4,408 7,567 6,970 1,123 55,436
Incarcerated Parolees 32 34 238 211 28 543
Total 35,400 4,442 7,805 7,181 1,151 55,979
Inmates 63.8% 8.0% 13.6% 12.6% 2.0% 100.0%
Incarcerated Parolees 5.9% 6.3% 43.8% 38.9% 5.2% 100.0%
Total 63.2% 7.9% 13.9% 12.8% 2.1% 100.0%

- 17 -
Table 12B. Crime Category by Offender status; Under Custody Population January 1, 2012
Inmate Parolee
Male Female Total Male Female Total
Violent Felony
Murder 7,103 213 7,316 0 0 0
Attempted Murder 1,314 28 1,342 0 0 0
Manslt 1st,Ag 2nd 1,986 156 2,142 1 0 1
Rape 1st 1,719 3 1,722 0 0 0
Robbery 1st 4,427 100 4,527 3 0 3
Robbery 2nd 3,088 115 3,203 9 0 9
Assault 1st 1,898 104 2,002 0 0 0
Assault 2nd 1,422 89 1,511 2 0 2
Burglary 1st 1,092 22 1,114 2 0 2
Burglary 2nd 3,599 121 3,720 5 0 5
Arson 1st,2nd 177 30 207 0 0 0
Sodomy 1st 1,083 6 1,089 0 0 0
Sex Ab 1st,Ag.2 1,211 8 1,219 0 0 0
Weapons Offenses 3,364 41 3,405 10 0 10
Kidnapping 1st,2nd 356 16 372 0 0 0
Other VFO Sex Off 386 5 391 0 0 0
Other Violent 82 4 86 0 0 0
Subtotal 34,307 1,061 35,368 32 0 32
97.0% 3.0% 100.0% 100.0% 0.0% 100.0%
Other Coercive
Manslaughter 2nd 259 41 300 0 0 0
Other Homicide 127 28 155 0 0 0
Robbery 3rd 1,244 42 1,286 14 0 14
Att Assault 2nd 445 28 473 6 0 6
Conspiracy 2,3,4 227 22 249 2 0 2
Other Weapons 617 13 630 9 0 9
Other Sex Offenses 812 19 831 0 0 0
Other Coercive 447 37 484 2 1 3
Subtotal 4,178 230 4,408 33 1 34
94.8% 5.2% 100.0% 97.1% 2.9% 100.0%
Drug Offenses
Drug Sale 4,027 266 4,293 125 7 132
Drug Possession 3,143 131 3,274 95 11 106
Subtotal 7,170 397 7,567 220 18 238
94.8% 5.2% 100.0% 92.4% 7.6% 100.0%
Property and Other
Burglary 3rd 2,098 63 2,161 73 7 80
Grand Larceny 1,217 225 1,442 46 4 50
Forgery 433 76 509 16 7 23
Stolen Property 369 30 399 12 3 15
Drive Intoxicated 866 87 953 18 5 23
Contempt 1st 398 8 406 2 0 2
All Other felonies 936 92 1,028 16 2 18
Business Corruption 70 2 72 0 0 0
Subtotal 6,387 583 6,970 183 28 211
91.6% 8.4% 100.0% 86.7% 13.3% 100.0%
YO/JO
Youthful Offender 903 38 941 28 0 28
Juvenile Offender 179 3 182 0 0 0
Subtotal 1,082 41 1,123 28 0 28
96.3% 3.7% 100.0% 100.0% 0.0% 100.0%
Grand Total 53,124 2,312 55,436 496 47 543
95.8% 4.2% 100.0% 91.3% 8.7% 100.0%
Commitment Crime Type
- 18 -
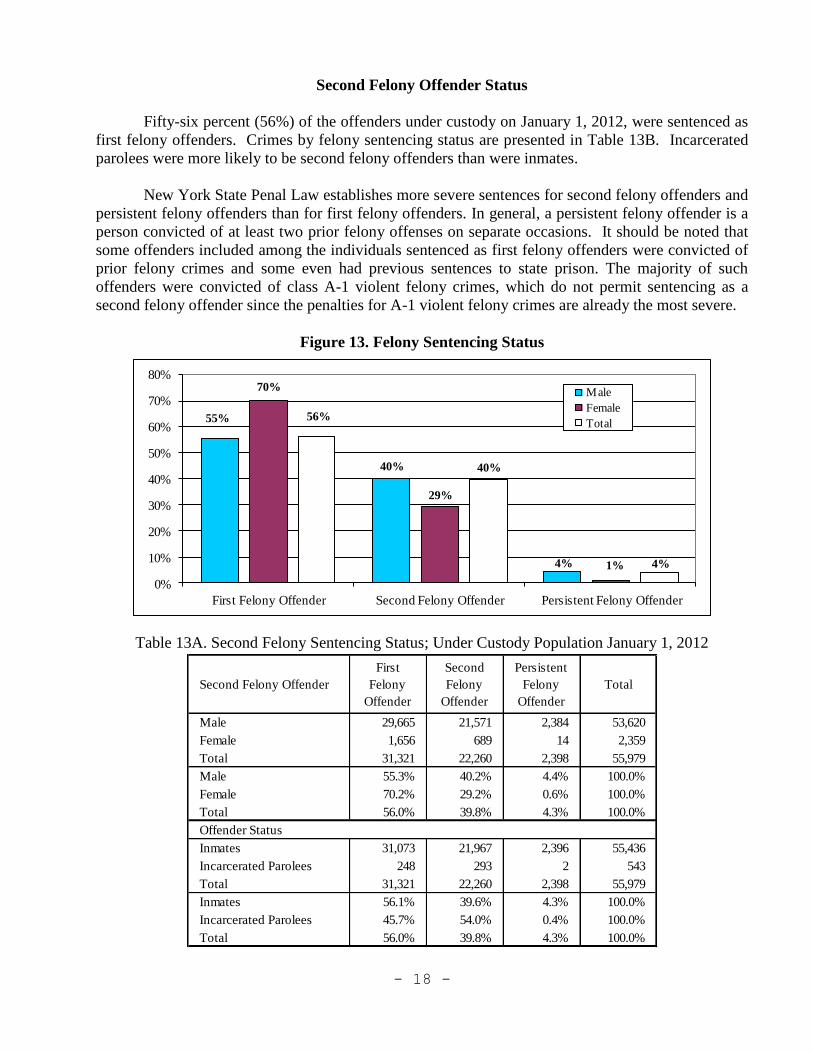
Second Felony Offender Status
Fifty-six percent (56%) of the offenders under custody on January 1, 2012, were sentenced as
first felony offenders. Crimes by felony sentencing status are presented in Table 13B. Incarcerated
parolees were more likely to be second felony offenders than were inmates.
New York State Penal Law establishes more severe sentences for second felony offenders and
persistent felony offenders than for first felony offenders. In general, a persistent felony offender is a
person convicted of at least two prior felony offenses on separate occasions. It should be noted that
some offenders included among the individuals sentenced as first felony offenders were convicted of
prior felony crimes and some even had previous sentences to state prison. The majority of such
offenders were convicted of class A-1 violent felony crimes, which do not permit sentencing as a
second felony offender since the penalties for A-1 violent felony crimes are already the most severe.
Figure 13. Felony Sentencing Status
55%
40%
4%
70%
29%
1%
56%
40%
4%
0%
10%
20%
30%
40%
50%
60%
70%
80%
First Felony Offender Second Felony Offender Persistent Felony Offender
Male
Female
Total
Table 13A. Second Felony Sentencing Status; Under Custody Population January 1, 2012
Second Felony Offender
First
Felony
Offender
Second
Felony
Offender
Persistent
Felony
Offender
Total
Male 29,665 21,571 2,384 53,620
Female 1,656 689 14 2,359
Total 31,321 22,260 2,398 55,979
Male 55.3% 40.2% 4.4% 100.0%
Female 70.2% 29.2% 0.6% 100.0%
Total 56.0% 39.8% 4.3% 100.0%
Offender Status
Inmates 31,073 21,967 2,396 55,436
Incarcerated Parolees 248 293 2 543
Total 31,321 22,260 2,398 55,979
Inmates 56.1% 39.6% 4.3% 100.0%
Incarcerated Parolees 45.7% 54.0% 0.4% 100.0%
Total 56.0% 39.8% 4.3% 100.0%

- 19 -
Table 13B. Second Felony Sentencing Status; Under Custody Population January 1, 2012
Inmate Parolee
Commitment Crime Type
First
Felony
Offender
Second
Felony
Offender
Persistent
Felony
Offender
Total
First
Felony
Offender
Second
Felony
Offender
Persistent
Felony
Offender
Total
Violent Felony
Murder 7,316 0 0 7,316 0 0 0 0
Attempted Murder 888 398 56 1,342 0 0 0 0
Manslt 1st,Ag 2nd 1,611 489 42 2,142 0 1 0 1
Rape 1st 1,021 575 126 1,722 0 0 0 0
Robbery 1st 2,044 1,951 532 4,527 2 1 0 3
Robbery 2nd 1,557 1,282 364 3,203 6 3 0 9
Assault 1st 1,271 639 92 2,002 0 0 0 0
Assault 2nd 748 654 109 1,511 1 1 0 2
Burglary 1st 549 476 89 1,114 1 1 0 2
Burglary 2nd 1,423 1,734 563 3,720 2 2 1 5
Sodomy 1st 770 269 50 1,089 0 0 0 0
Sex Ab 1st,Ag.2 930 251 38 1,219 0 0 0 0
Weapons Offenses 1,823 1,436 146 3,405 6 4 0 10
Kidnapping 1st,2nd 271 82 19 372 0 0 0 0
Other VFO Sex Off 307 80 4 391 0 0 0 0
Other Violent 65 18 3 86 0 0 0 0
Subtotal 22,594 10,334 2,233 35,161 18 13 1 32
64.3% 29.4% 6.4% 100.0% 56.3% 40.6% 3.1% 100.0%
Other Coercive
Manslaughter 2nd 226 67 7 300 0 0 0 0
Other Homicide 130 22 3 155 0 0 0 0
Robbery 3rd 377 885 24 1,286 7 7 0 14
Att Assault 2nd 125 346 2 473 3 3 0 6
Conspiracy 2,3,4 118 124 7 249 2 0 0 2
Other Weapons 116 499 15 630 4 5 0 9
Other Sex Offenses 586 237 8 831 0 0 0 0
Other Coercive 259 219 6 484 2 1 0 3
Subtotal 1,937 2,399 72 4,408 18 16 0 34
43.9% 54.4% 1.6% 100.0% 52.9% 47.1% 0.0% 100.0%
Drug Offenses
Drug Sale 1,219 3,063 11 4,293 52 80 0 132
Drug Possession 1,088 2,181 5 3,274 36 70 0 106
Subtotal 2,307 5,244 16 7,567 88 150 0 238
30.5% 69.3% 0.2% 100.0% 37.0% 63.0% 0.0% 100.0%
Property and Other
Burglary 3rd 587 1,550 24 2,161 36 44 0 80
Grand Larceny 487 936 19 1,442 17 32 1 50
Forgery 132 374 3 509 8 15 0 23
Stolen Property 85 304 10 399 3 12 0 15
Drive Intoxicated 939 10 4 953 22 1 0 23
Contempt 1st 162 241 3 406 0 2 0 2
All Other Felonies 673 551 11 1,235 10 8 0 18
Business Corruption 47 24 1 72 0 0 0 0
Subtotal 3,112 3,990 75 7,177 96 114 1 211
43.4% 55.6% 1.0% 100.0% 45.5% 54.0% 0.5% 100.0%
YO/JO
Youthful Offender 941 0 0 941 28 0 0 28
Juvenile Offender 182 0 0 182 0 0 0 0
Subtotal 1,123 0 0 1,123 28 0 0 28
100.0% 0.0% 0.0% 100.0% 100.0% 0.0% 0.0% 100.0%
Grand Total 31,073 21,967 2,396 55,436 248 293 2 543
56.1% 39.6% 4.3% 100.0% 45.7% 54.0% 0.4% 100.0%

- 20 -
Prior Adult Criminal Record
For this report offenders are placed in a prior adult criminal record category based on their
most extensive contact with the criminal justice system prior to their current incarceration. Thirty-
four percent (34%) of under custody offenders had served a prior prison term. For 25% prior jail was
the most serious contact with the criminal justice system, while 16% had no prior arrest. Women
were more likely than men to have no prior arrests or convictions.
Figure 14. Prior Adult Criminal Record
15%
8%
18%
25%
34%
29%
12%
18% 20%21%
16%
8%
18%
25%
34%
0%
10%
20%
30%
40%
No Prior Arrest No Prior Conviction Conviction, No Jail Prior Jail Term Prior Prison Term
MaleFemaleTotal
Table 14. Prior Adult Criminal Record; Under Custody Population January 1, 2012
Prior RecordNo Prior
Arrest
No Prior
Conviction
Conviction,
No Jail
Prior Jail
Term
Prior Prison
TermTotal*
Male 8,067 4,147 9,761 13,371 18,259 53,605
Female 682 282 426 467 502 2,359
Total 8,749 4,429 10,187 13,838 18,761 55,964
Male 15.0% 7.7% 18.2% 24.9% 34.1% 100.0%
Female 28.9% 12.0% 18.1% 19.8% 21.3% 100.0%
Total 15.6% 7.9% 18.2% 24.7% 33.5% 100.0%
Offender Status
Inmates 8,713 4,395 10,063 13,635 18,616 55,422
Incarcerated Parolees 36 34 124 203 145 542
Total 8,749 4,429 10,187 13,838 18,761 55,964
Inmates 15.7% 7.9% 18.2% 24.6% 33.6% 100.0%
Incarcerated Parolees 6.6% 6.3% 22.9% 37.5% 26.8% 100.0%
Total 15.6% 7.9% 18.2% 24.7% 33.5% 100.0%
*Missing data on 15 cases.

- 21 -
Length of Time Served in Department Custody
About one quarter of the offender population had spent six years or more under custody since
their latest admission to DOCCS, while nearly one-third had spent less than one year under custody.
Offenders under custody on January 1, 2012, had spent an average of 59 months in DOCCS
since their latest admission date. The median length of time served was 25 months. Due to the short
term period of incarceration for incarcerated parolees, all of them had served less than a year as of
January 2012.
Figure 15. Length of Time Served in DOCCS Custody by Inmates Since Last Admission Date
17,843
9,385
5,668
8,099
5,168
3,772
2,888 2,613
0
5,000
10,000
15,000
20,000
LT 1 YR 1 YR 2 YR 3-5 YR 6-9 YR 10-14 YR 15-19 YR 20+ YR
Table 15. DOCCS Time Served in Months; Inmate Under Custody Population January 1, 2012
Time in DOCCS LT 1 YR 1 YR 2 YR 3-5 YR 6-9 YR 10-14 YR 15-19 YR 20+ YR Total
Male 16,737 8,952 5,450 7,838 5,039 3,689 2,838 2,581 53,620
Female 1,106 433 218 261 129 83 50 32 2,359
Total 17,843 9,385 5,668 8,099 5,168 3,772 2,888 2,613 55,979
Male 31.2% 16.7% 10.2% 14.6% 9.4% 6.9% 5.3% 4.8% 100.0%
Female 46.9% 18.4% 9.2% 11.1% 5.5% 3.5% 2.1% 1.4% 100.0%
Total 31.9% 16.8% 10.1% 14.5% 9.2% 6.7% 5.2% 4.7% 100.0%
Offender Status
Inmates 17,843 9,385 5,668 8,099 5,168 3,772 2,888 2,613 55,436
Incarcerated
Parolees543 0 0 0 0 0 0 0 543
Total 18,386 9,385 5,668 8,099 5,168 3,772 2,888 2,613 55,979
Inmates 32.2% 16.9% 10.2% 14.6% 9.3% 6.8% 5.2% 4.7% 100.0%
Incarcerated
Parolees100.0% 0.0% 0.0% 0.0% 0.0% 0.0% 0.0% 0.0% 100.0%
Total 32.8% 16.8% 10.1% 14.5% 9.2% 6.7% 5.2% 4.7% 100.0%
Time Served Since Latest Admission Date in Months Inmate-Average 59.4 Parolee-Average 1.8
Time Served Since Latest Admission Date in Months Inmate-Median 24.8 Parolee-Median 1.5
- 22 -
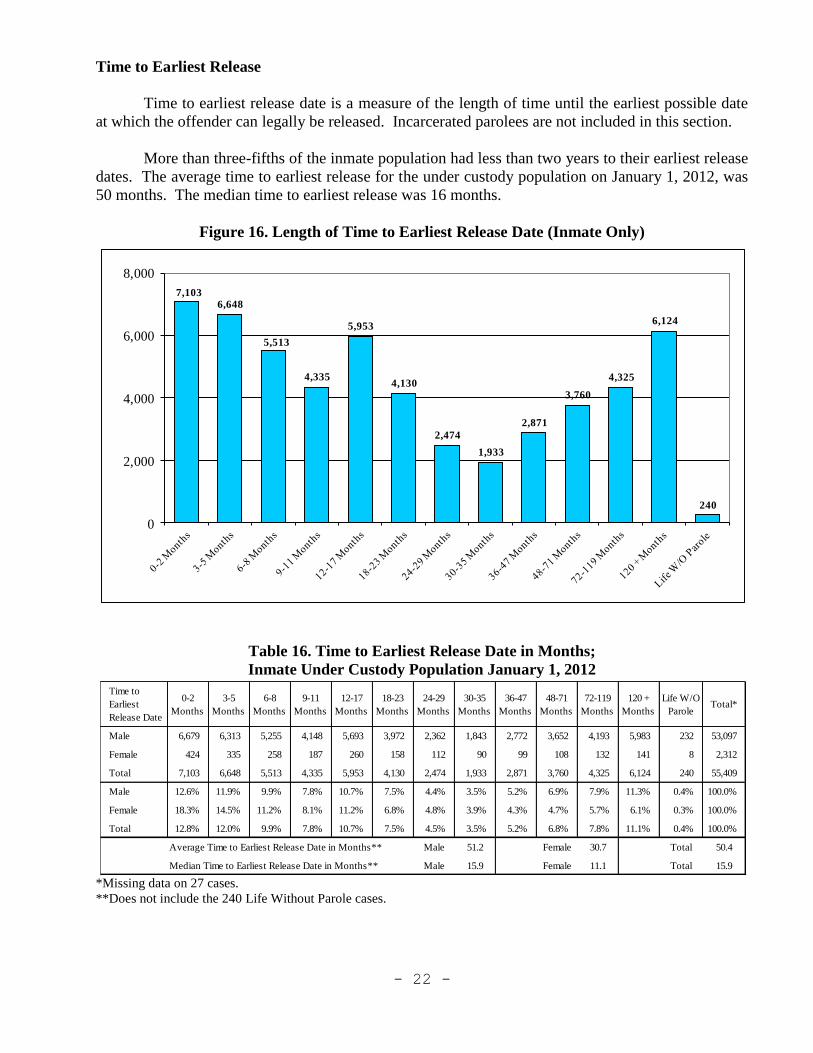
Time to Earliest Release
Time to earliest release date is a measure of the length of time until the earliest possible date
at which the offender can legally be released. Incarcerated parolees are not included in this section.
More than three-fifths of the inmate population had less than two years to their earliest release
dates. The average time to earliest release for the under custody population on January 1, 2012, was
50 months. The median time to earliest release was 16 months.
Figure 16. Length of Time to Earliest Release Date (Inmate Only)
7,1036,648
5,513
4,335
5,953
4,130
2,474
1,933
2,871
3,760
4,325
6,124
240
0
2,000
4,000
6,000
8,000
Table 16. Time to Earliest Release Date in Months;
Inmate Under Custody Population January 1, 2012
*Missing data on 27 cases.
**Does not include the 240 Life Without Parole cases.
Time to
Earliest
Release Date
0-2
Months
3-5
Months
6-8
Months
9-11
Months
12-17
Months
18-23
Months
24-29
Months
30-35
Months
36-47
Months
48-71
Months
72-119
Months
120 +
Months
Life W/O
ParoleTotal*
Male 6,679 6,313 5,255 4,148 5,693 3,972 2,362 1,843 2,772 3,652 4,193 5,983 232 53,097
Female 424 335 258 187 260 158 112 90 99 108 132 141 8 2,312
Total 7,103 6,648 5,513 4,335 5,953 4,130 2,474 1,933 2,871 3,760 4,325 6,124 240 55,409
Male 12.6% 11.9% 9.9% 7.8% 10.7% 7.5% 4.4% 3.5% 5.2% 6.9% 7.9% 11.3% 0.4% 100.0%
Female 18.3% 14.5% 11.2% 8.1% 11.2% 6.8% 4.8% 3.9% 4.3% 4.7% 5.7% 6.1% 0.3% 100.0%
Total 12.8% 12.0% 9.9% 7.8% 10.7% 7.5% 4.5% 3.5% 5.2% 6.8% 7.8% 11.1% 0.4% 100.0%
Average Time to Earliest Release Date in Months** Male 51.2 Female 30.7 Total 50.4
Median Time to Earliest Release Date in Months** Male 15.9 Female 11.1 Total 15.9

- 23 -
Determinate Sentencing
Fifty-five percent (55% or 30,609) of the 55,979 offenders under Department custody on
January 1, 2012, were serving determinate sentences.
As of that date, 88% (6,902) of the offenders committed for drug offenses (7,805) had
determinate sentences while 66% (23,355) of the 35,400 offenders sentenced for Violent Felony
Offenses were serving determinate sentences.
Figure 17. Number of Determinate Sentences
All Determinate
Violent
Drug
14%
19%22%
26%28%
34%
41%47% 49% 52% 54% 55%
14%19%
22%26%
28%30% 32% 34% 35% 38%
40% 42%
0% 0% 0% 0% 0% 3%
9%13% 14% 14%
13% 12%
0
5,000
10,000
15,000
20,000
25,000
30,000
35,000
40,000
2001 2002 2003 2004 2005 2006 2007 2008 2009 2010 2011 2012
Table 17A. Number of Determinate Sentences; Under Custody Population January 1, 2012
Table 17B. Historical Number of Determinate Sentences
Offender StatusViolent
Felony
Other
Coercive
Drug
Offenses
Property
and Other
Offenses
Youthful
Offender
Juvenile
OffenderTotal
Offenders
Indeterminate 12,045 4,113 903 7,176 951 182 25,370
Determinate 23,355 329 6,902 5 18 0 30,609
Total 35,400 4,442 7,805 7,181 969 182 55,979
Indeterminate 34% 93% 12% 100% 98% 100% 45%
Determinate 66% 7% 88% 0% 2% 0% 55%
Parolees
Indeterminate 3 34 18 210 28 0 292
Determinate 29 0 220 1 0 0 250
Total 32 34 238 210 28 0 542
Indeterminate 9% 100% 8% 100% 100% 0% 54%
Determinate 91% 0% 92% 0% 0% 0% 46%
January 1, 2001 2002 2003 2004 2005 2006 2007 2008 2009 2010 2011 2012
Determinate 10,297 12,853 15,171 17,026 18,406 21,756 26,463 29,573 30,103 30,689 30,845 30,609
Percent 14% 19% 22% 26% 28% 34% 41% 47% 49% 52% 54% 55%
Prepared by:
Dan Bernstein
Program Research Specialist III
With assistance by:
Hyejung Kim
Research Intern: Winter 2012-Spring 2012
Division of Program Planning,
Research and Evaluation
December 2012


![New York New York [Big Band]](https://img.pdfslide.us/doc/110x75/55cf9017550346703ba2dc98/new-york-new-york-big-band-56499fb54c27d.jpg)