Embed Size (px)
Citation preview
STATE OF NEW JERSEY Board of Public Utilities
44 South Clinton Avenue, gth Floor Post Office Box 350
Trenton, New Jersey 08625-0350 www.nj.gov/bpu/
IN THE MATTER OF THE PETITION OF PUBLIC ) SERVICE ELECTRIC AND GAS COMPANY FOR ) APPROVAL OF CHANGES IN ITS ELECTRIC GREEN ) PROGRAMS RECOVERY CHARGE AND ITS GAS ) GREEN PROGRAMS RECOVERY CHARGE ("2015 ) PSE&G GREEN PROGRAMS COST RECOVERY ) FILING") )
Parties of Record:
Agenda Date: 09/11/15 Agenda Item: 2F
ENERGY
ORDER IMPLEMENTING PROVISIONAL RATES
DOCKET NOS. ER15070757 AND GR15070758
Alexander C. Stern, Esq., Public Service Electric and Gas Company Stefanie A. Brand, Esq., Director, New Jersey Division of Rate Counsel
BY THE BOARD: 1
On July 2, 2015, Public Service Electric and Gas Company ("PSE&G" or "Company") filed a petition with the New Jersey Board of Public Utilities ("Board") requesting approval of changes in its electric and gas Green Programs Recovery Charges ("GPRC"). By this Decision and Order, the Board considers a stipulation ("Stipulation") entered into by PSE&G, the New Jersey Division of Rate Counsel ("Rate Counsel"), and Board Staff ("Staff') (collectively, the "Parties"), requesting that the Board approve decreases in the electric and gas GPRCs on a provisional basis, subject to refund.
BACKGROUND AND PROCEDURAL HISTORY
On January 13, 2008, b. 2007, c. 340 ("Act") was signed into law on the Nev' Jersey Legislature's findings that energy efficiency and conservation measures and increased use of renewable energy resources must be essential elements of the State's energy future, and that greater reliance on energy efficiency, conservation and renewable energy resources will provide significant benefits to the citizens of New Jersey. The Legislature also found that public utility involvement and competition in the renewable energy, conservation and energy efficiency industries are essential to maximize efficiencies. N.J.S.A. 26:2C-45.
1 Commissioner Upendra J. Chivukula recused himself due to a possible conflict of interest, and did not
participate in the deliberations on this matter.
Pursuant to Section 13 of the Act, codified as N.J.S.A. 48:3-98.1, an electric or gas public utility may, among other things, provide and invest in Class 1 renewable energy resources, energy efficiency and conservation programs in its service territory on a regulated basis. Such investments in Class 1 renewable energy programs and energy efficiency and conservation programs may be eligible for rate treatment approved by the Board including a return on equity, or other incentives or rate mechanisms that decouple utility revenue from sales of electricity and gas. N.J.S.A. 48:3-98.1 (b). Ratemaking treatment may include placing appropriate technology and program cost investments in the utility's rate base, or recovering the utility's technology and program costs through another ratemaking methodology approved by the Board. An electric or gas public utility seeking cost recovery for any renewable energy, energy efficiency and conservation programs pursuant to N.J.S.A. 48:3-98.1 must file a petition with the Board.
PSE&G Programs
Energy Efficiency
By Order dated December 16, 2008 in Docket No. E008060426, the Board authorized PSE&G to invest $45.9 million in the Carbon Abatement Program ("CA Program"). TheCA Program has five sub-programs:
a) Residential Home Energy Tune-Up Program Sub-Program- $25 million b) Residential Programmable Thermostat Installation Sub-Program- $4.4 million c) Small Business Direct Installation Sub-Program- $4 million d) Large Business Best Practices and Technology Demonstration Pilot Sub-Program - $1
million e) Hospital Efficiency - Retrofit Sub-Program- $10 million; & New Construction Sub
Program - $1 million
By Order dated July 16, 2009 in Docket No E009010058, the Board authorized PSE&G to invest approximately $190 million in the Economic Energy Efficiency Stimulus ("EEE" or "E3") Program. Three of the eight sub-programs in the E3 Program were identical to those subprograms in the CA Program:
a) Residential Whole House Efficiency Sub-Program - $10 million b) Small Business Direct Installation Sub-Program- $20 million c) Hospital Efficiency Sub-Program - $ 68 million
The other sub-programs approved under the EEE Program were:
d) Residential Multi-Family Housing Sub-Program- $19 million e) Municipal/Local/State Government Direct Install Sub-Program- $25 million f) Data Center Efficiency Sub-Program - $10 million g) Building Commissioning/O&M Sub-Program - $2 million h) Technology Demonstration Sub-Program- $12 million
2 DOCKET NOS. ER15070757 and GR15070758
The Company was also authorized to invest $24 million in Administrative, Sales, Training and Evaluation, and IT costs.
By Order dated July 14, 2011 in Docket No. E011010030, the Board authorized an extension of the EEE Program ("Extended EEE Program") and additional funding for three (3) sub-programs within the Extended EEE Program. The three sub-programs were the following:
a. Residential Multi-Family Housing Sub-Program - $20 million b. Municipal/local/State Government Direct Installation Sub-Program - $25 million c. Hospital Efficiency Sub-program ("EEE Extension Program") - $50 million
In this extension, the Company was also authorized to invest $8 million in Administration, Program Management, and Quality Assurance/Quality Control Evaluation.
The total expenditures approved were $103 million.
By Order dated April 15, 2015 in Docket No. E014080897, the Board authorized a further extension of the Extended EEE Program with modifications ("EEE Extension II") and additional funding for the Multi-Family Housing, Direct Install and Hospital Efficiency sub-programs. The approved program investment was $95 million. In addition, the Company was authorized to invest a total of $12.4 million in Administration, Program Management, Quality Assurance/Quality Control Evaluation and IT system enhancements.
Demand Response
By Order dated July 1, 2008 in Docket No. E008080544, the Board pursuant to N.J.S.A. 48:3-98.1(a)(3) directed the State's four electric distribution companies, including PSE&G, to submit proposals to the Board by August 1 , 2008 for demand response ("DR") programs to be implemented for the period beginning June 1, 2009. By Order dated July 31, 2009, the Board approved a stipulation that authorized PSE&G to implement a Residential Air Conditioning ("AC") Cycling and a Small Commercial AC Cycling Program with an estimated budget of $65.34 million which was expected to result in an estimated saving of 150 MW for the period 2009-2014.
Solar Programs
By Order dated August 3, 2009 in Docket No. E009020125, the Board authorized PSE&G to invest approximately $514 million in a solar generation program, known as the Solar 4 All ("S4A Program"). The S4A Program consists of two segments: Segment 1- Centralized Solar (40 MW) and Segment 2- Pole-Attached Solar (40 MW). The budget segments were as follows:
a) Segment 1- Capitalized Solar- $256.1 million b) Segment 2- Pole Attached Solar- $258.4 million
By Order dated August 7, 2008 in Docket No. E006100744, the Board directed PSE&G to file a solar renewable energy certificate ("SREC") based financing program by March 31, 2009 ("SREC Financing Order''). Pursuant to the SREC Financing Order, PSE&G's proposed SRECbased financing program could be structured as a modification of the solar loan program approved by the Board on April 16, 2008, provided that the modifications were sufficient to enable the SREC-based financing program to support the transition to a market-based
3 DOCKET NOS. ER15070757 and GR15070758
approach to delivering incentives for solar electric generation. As approved by Board Order dated November 10, 2009 in Docket No. E009030249, the Solar Loan II Program ("SUI Program") is an approximately 51 MW distributed photovoltaic ("PV") solar initiative in which customers or developers install solar PV systems on customers' premises "behind the meter" using PSE&G as a source of capital. The initial investment estimate for the SUI program was $144 million.
The SUI Program included three segments:
a) Greater than 150 kW up to 500 KW (non-residential) - 25 MW b) Up to 150 kW (non-residential) -17MW c) Residential- 9MW
By Order dated May 29, 2013 in Docket Number E012080721, the Board issued an Order approving a Solar 4 All Extension Program ("S4A Extension Program"). The approved S4A Extension Program consisted of four segments (Landfills/Brownfields, Underutilized Government Facilities, Grid Security/Storm Preparedness Pilot and Parking Lot Solar for a total of 45 MWs. The estimated capital investment was approximately $247.2 million (excluding Allowance for Funds Used During Construction).
By Order dated May 29, 2013 in Docket Number E012080726, the Board authorized PSE&G to offer a Solar Loan Ill Program ("SLIII Program") with a program size of 97.5 MW. The SUII Program included five segments:
a) Residential Individual Customer b) Residential-Aggregated by a Third Party c) Non-residential less than or equal to150 kW d) Non-residential greater than 150 kWh (up to 2 MW per project) e) Landfills/Brownfields (up to 5MW per project)
Under the terms of the Orders approving the nine programs (CA Program, EEE Program, Extended EEE Program, EEE Extension II, DR Program, S4A Program, SUI Program, S4A Extension Program and SLIII Program) described above (collectively, the "PSE&G Green Programs"), PSE&G currently recovers the revenue requirements for the programs through its GPRCs. There is a separate component for each of the programs. PSE&G is required to make annual filings to set forth a calculation of the electric and gas recovery charges for estimated revenue requirements for the subsequent year plus the over/under deferred balance for the current year for the programs ("Annual Filing").
4 DOCKET NOS. ER15070757 and GR15070758
2015 FILING
On July 2, 2015, PSE&G filed the Annual Filing and accompanying exhibits for approval of cost recovery for the PSE&G Green Programs ("2015 Annual Filing"f According to the 2015 Annual Filing, the rates proposed for PSE&G's electric and gas components of the GPRC (excluding the EEE Extension II) for the period October 1, 2015 through September 30, 2016 were designed to recover approximately $63.7 million (electric) and $9.6 million (gas) in revenues on an annual basis. As filed, the resultant net annual revenue impact on the Company's electric and gas customers, if approved, is a decrease of $47.7 million and $8.9 million, respectively.
After notice in newspapers in general circulation within the service territory, public hearings were held on August 18, 19, and 20, 2015 in Hackensack, New Brunswick, and Westampton, respectively. Four members of the public expressed general concerns about high utility rates and opposition to shutting off service for lack of payment. No members of the public appeared and commented specifically on this filing.
STIPULATION
Because the Company's filing will not be updated with actual revenues and expenses until after October 1, 2015, and additional time is needed to complete the review of the proposed rates to ensure that the costs are adequately explained, reconciled and addressed, and the resulting rates are reasonable, on August 26, 2015, the Parties entered into a stipulation for provisional electric and gas GPRC rates. The Stipulation provides the following3
:
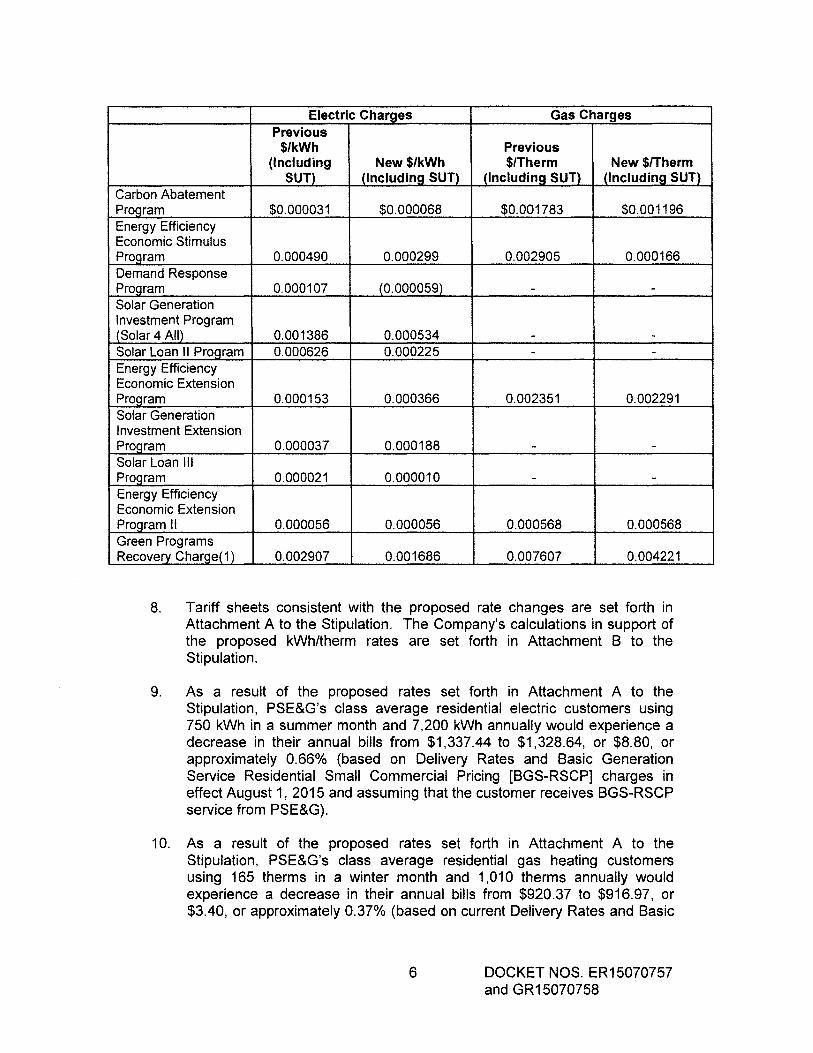
7. The Parties agree to implement the originally proposed electric GPRC revenue decrease of $47.7 million as well as the originally proposed gas GPRC revenue decrease of $8.9 million requested in the 2015 Annual Filing on a provisional basis. The cumulative proposed rate impacts for all nine components of the electric GPRC result in a decrease from $0.002907 per kWh (including New Jersey Sales and Use Tax, (SUT)) to $0.001686 per kWh (including SUT). The cumulative proposed changes for the four components of the gas GPRC, which includes only the CA, EEE, EEE Extension and EEE Extension II components, result in a decrease from $0.007607 per therm (including SUT) to $0.004221 per therm (including SUT). The proposed changes in the individual electric and gas Green Programs Recovery charges are as follows:
2 The EEE Extension II Program costs are not part of the 2015 Annual Filing. Consistent with the Board Order dated April15, 2015 in Docket E014080897, EEE Extension II rates were implemented on May 1, 2015 and will be included for true-up as part of the July 1, 2016 GPRC cost recovery filing. 3 Although described in this Order, should there be a conflict between this summary and the Stipulation, the terms of the Stipulation control, subject to the findings and conclusions contained in the Order.
5 DOCKET NOS. ER15070757 and GR15070758
Electric Charges Gas Charges Previous
$/kWh Previous (Including New $/kWh $/Therm New $/Therm
SUT) (Including SUT) (Including SUT) (Including SUT) Carbon Abatement Program $0.000031 $0.000068 $0.001783 $0.001196 Energy Efficiency Economic Stimulus Program 0.000490 0.000299 0.002905 0.000166 Demand Response Program 0.000107 (0.000059) - -Solar Generation Investment Program (Solar 4 All) 0.001386 0.000534 - -Solar Loan II Program 0.000626 0.000225 - -Energy Efficiency Economic Extension Program 0.000153 0.000366 0.002351 0.002291 Solar Generation Investment Extension Program 0.000037 0.000188 - -Solar Loan Ill Program 0.000021 0.000010 - -Energy Efficiency Economic Extension Program II 0.000056 0.000056 0.000568 0.000568 Green Programs Recovery Charge(1) 0.002907 0.001686 0.007607 0.004221
8. Tariff sheets consistent with the proposed rate changes are set forth in Attachment A to the Stipulation. The Company's calculations in support of the proposed kWh/therm rates are set forth in Attachment B to the Stipulation.
9. As a result of the proposed rates set forth in Attachment A to the Stipulation, PSE&G's class average residential electric customers using 750 kWh in a summer month and 7,200 kWh annually would experience a decrease in their annual bills from $1,337.44 to $1 ,328.64, or $8.80, or approximately 0.66% (based on Delivery Rates and Basic Generation Service Residential Small Commercial Pricing [BGS-RSCP] charges in effect August 1, 2015 and assuming that the customer receives BGS-RSCP service from PSE&G).
10. As a result of the proposed rates set forth in Attachment A to the Stipulation, PSE&G's class average residential gas heating customers using 165 therms in a winter month and 1, 01 0 therms annually would experience a decrease in their annual bills from $920.37 to $916.97, or $3.40, or approximately 0.37% (based on current Delivery Rates and Basic
6 DOCKET NOS. ER15070757 and GR15070758
Gas Supply Service [BGSS-RSG] charges in effect August 1, 2015 and assuming that the customer receives BGSS service from PSE&G).
11. The residential customer bill impacts comparing the current and proposed delivery charges are set forth in Attachment C to the Stipulation for the aforementioned class average customers, as well as for other typical customer usage patterns.
12. The Parties agree that there will be an opportunity for full review at the Office of Administrative Law, if necessary, and final approval by the Board.
13. The Parties agree that PSE&G should be authorized to implement the proposed rates as set forth in Attachment A on a provisional basis in accordance with a written Board Order of approval.
DISCUSSION AND FINDING
The Board has carefully reviewed the record to date in this proceeding, including the petition and the attached Stipulation, which allows the Company to recover costs on a provisional basis. The Board FINDS that the Stipulation is reasonable, in the public interest, and in accordance with the law. Accordingly, the Board HEREBY ADOPTS the Stipulation as its own, as if fully set forth herein.
The Board HEREBY APPROVES, on a provisional basis, subject to refund with interest on any net over-recovered balance, a decrease in the electric GPRC from $0.002907 per kWh to $0.001686 per kWh including SUT. For an average residential customer using approximately 750 in a summer month and 7,200 kWh annually, this change would represent a decrease of $8.80 in the annual bill or approximately 0.66%.
The Board HEREBY APPROVES on a provisional basis, subject to refund with interest on any net over-recovered balance, a decrease in the gas GPRC from $0.007607 per therm to $0.004221 per therm including SUT. For an average residential customer using approximately 165 therms in a winter month and 1,010 therms annually, this change would represent a decrease of $3.40 in the annual bill or approximately 0.37%.
These changes shall become effective as of October 1, 2015. The Board HEREBY ORDERS PSE&G to file revised tariff sheets conforming to the terms of the Stipulation within five (5) days of service of this Board Order.
The Company's costs remain subject to audit by the Board. This Decision and Order shall not preclude nor prohibit the Board from taking any actions determined to be appropriate as a result of any such audit.
7 DOCKET NOS. ER15070757 and GR15070758

The effective date of this Order is September 21, 2015.
/1 'I (j
.. ·it~.JL-' JdSEPH L. FIORDALISO I COMMISSIONER
I
NE KIMASBUR SECRETARY
I HEREBY CERTIFY that the within document ts a true CDfJ'I of the original Ia theftles of the Board of Public Utilities
Ol.~k7;
BOARD OF PUBLIC UTILITIES BY:
8 DOCKET NOS. ER15070757 and GR15070758
IN THE MATTER OF THE PETITION OF PUBLIC SERVICE ELECTRIC AND GAS COMPANY FOR APPROVAL OF CHANGES IN ITS ELECTRIC GREEN PROGRAMS RECOVERY
CHARGE AND ITS GAS GREEN PROGRAMS RECOVERY CHARGE ("2015 PSE&G GREEN PROGRAMS COST RECOVERY FILING")
BPU DOCKET NOS. ER15070757 and GR15070758
Alexander Stern, Esq. Assistant General Regulatory Counsel PSE&G 80 Pa:k Plaza, T5 Newark, NJ 07101
Matthew Weismann, Esq. General Regulatory Counsel- Rates 80 Park Plaza, T5 Newark, NJ 07101
Michele Falcao PSEG Services Corporation 80 Park Plaza, T5G PO Box 570 Newark, NJ 071 02
Stefanie A. Brand, Esq., Director Division of Rate Counsel 140 East Front Street, 41h Floor Post Office Box 003 Trenton, NJ 08625-0003
Brian 0. Lipman, Esq. Litigation Manager Division of Rate Counsel 140 East Front Street, 4th Floor Post Office Box 003 Trenton, NJ 08625-0003
Felicia Thomas-Friel, Esq. Division of Rate Counsel 140 East Front Street, 4th Floor Post Office Box 003 Trenton, NJ 08625-0003
SERVICE LIST
9
Jerome May, Director Board of Public Utilities Division of Energy 44 South Clinton Avenue, 91h Floor Post Office Box 350 Trenton, NJ 08625-0350
Irene Kim Asbury, Secretary Board of Public Utilities 44 South Clinton Avenue, 91h Floor Post Office Box 350 Trenton, NJ 08625-0350
Alice Bator, Bureau Chief Board of Public Utilities Division of Energy 44 South Clinton Avenue, 91h Floor Post Office Box 350 Trenton, NJ 08625-0350
Stacy Peterson Board of Public Utilities Division of Energy 44 South Clinton Avenue, 91h Floor Post Office Box 350 Trenton, NJ 08625-0350
Rachel Boylan, Legal Specialist Board of Public Utilities Counsel's Office 44 South Clinton Avenue, 9th Floor Post Office Box 350 Trenton, NJ 08625-0350
Caroline Vachier, DAG Deputy Attorney General Division of Law 124 Halsey Street Post Office Box 45029 Newark, NJ 07101-45029
DOCKET NOS. ER15070757 and GR15070758
James W. Glassen, Esq. Division of Rate Counsel 140 East Front Street, 4th Floor Post Office Box 003 Trenton, NJ 08625-0003
Sarah H. Steindel, Esq. Division of Rate Counsel 140 East Front Street, 4th Floor Post Office Box 003 Trenton, NJ 08625-0003
Babette Tenzer, DAG Deputy Attorney General Division of Law 124 Halsey Street Post Office Box 45029 Newark, NJ 07101-45029
Patricia Krogman, Esq. Deputy Attorney General Division of Law 124 Halsey Street Post Office Box 45029 Newark, NJ 07101-45029
Alex Moreau, DAG Deputy Attorney General Division of Law 124 Halsey Street Post Office Box 45029 Newark, NJ 07101-45029
10 DOCKET NOS. ER15070757 and GR15070758
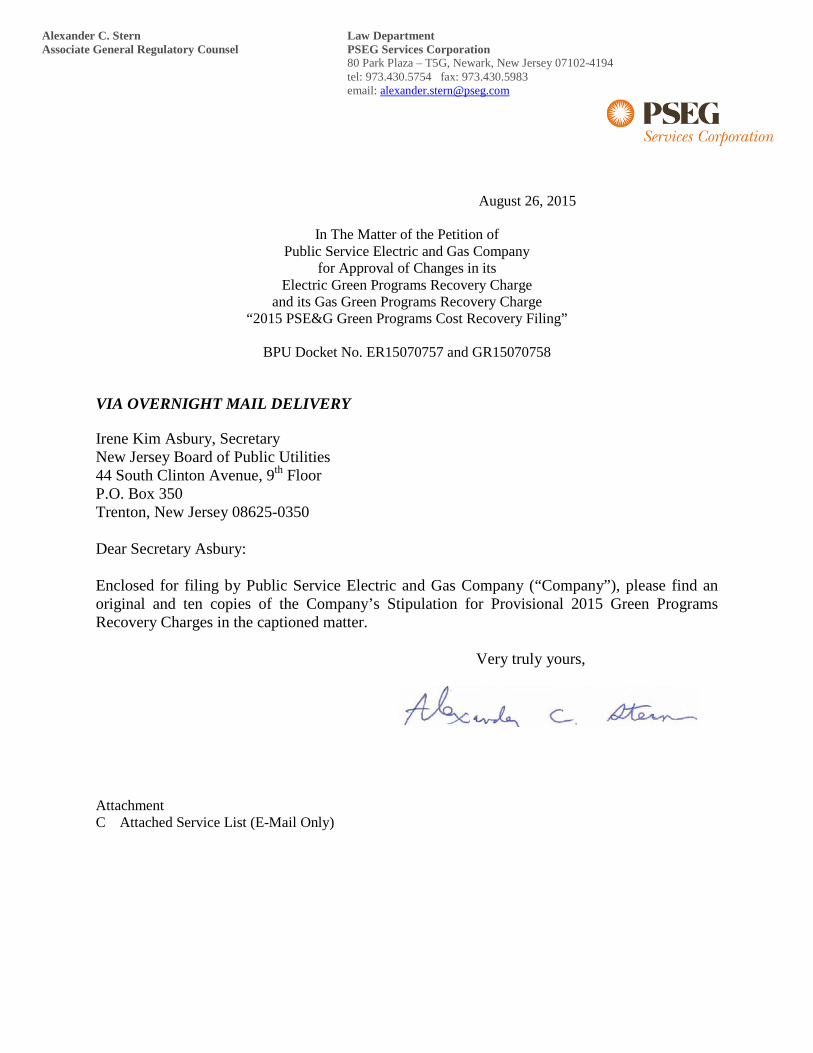
Alexander C. Stern Law Department Associate General Regulatory Counsel PSEG Services Corporation 80 Park Plaza – T5G, Newark, New Jersey 07102-4194 tel: 973.430.5754 fax: 973.430.5983 email: [email protected]
August 26, 2015
In The Matter of the Petition of Public Service Electric and Gas Company
for Approval of Changes in its Electric Green Programs Recovery Charge
and its Gas Green Programs Recovery Charge “2015 PSE&G Green Programs Cost Recovery Filing”
BPU Docket No. ER15070757 and GR15070758
VIA OVERNIGHT MAIL DELIVERY Irene Kim Asbury, Secretary New Jersey Board of Public Utilities 44 South Clinton Avenue, 9th Floor P.O. Box 350 Trenton, New Jersey 08625-0350 Dear Secretary Asbury: Enclosed for filing by Public Service Electric and Gas Company (“Company”), please find an original and ten copies of the Company’s Stipulation for Provisional 2015 Green Programs Recovery Charges in the captioned matter. Very truly yours,
Attachment C Attached Service List (E-Mail Only)
08/14/2015 Public Service Electric and Gas Company Page 1 of 2 GPRC 2015 ER15070757 and GR15070758 BPU Elizabeth Ackerman Board of Public Utilities Div. of Econ Develop & Energy Policy 44 South Clinton Avenue, 9th Flr. P.O. Box 350 Trenton NJ 08625-0350 (609) 292-0072 [email protected]
BPU Irene Kim Asbury Board of Public Utilities 44 South Clinton Avenue, 9th Flr. 9th Floor P.O. Box 350 Trenton NJ 08625-0350 (609) 292-1599 [email protected]
BPU Alice Bator Board of Public Utilities Division of Energy 44 South Clinton Avenue, 9th Flr. P.O. Box 350 Trenton NJ 08625-0350 (609) 943-5805 [email protected]
BPU Mark Beyer Board of Public Utilities 44 South Clinton Avenue, 9th Flr. P.O. Box 350 Trenton NJ 08625-0350 (609) 292-2637 [email protected]
BPU Scott Hunter Board of Public Utilities 44 South Clinton Avenue, 9th Flr. P.O. Box 350 Trenton Nj 08625-0350 (609) 292-1956 [email protected]
BPU Christine Lin Board of Public Utilities 44 South Clinton Avenue, 9th Flr. P.O. Box 350 Trenton NJ 08625-0350 (609) 292-2956 [email protected]
BPU Jerome May Board of Public Utilities Division of Energy 44 South Clinton Avenue, 9th Flr. P.O. Box 350 Trenton NJ 08625-0350 (609) 292-3960 [email protected]
BPU Jacqueline O'Grady Board of Public Utilities 44 South Clinton Avenue, 9th Flr. P.O. Box 350 Trenton NJ 08625-0350 (609) 292-2947 [email protected]
BPU Stacy Peterson Board of Public Utilities Division of Energy 44 South Clinton Avenue, 9th Flr. P.O. Box 350 Trenton NJ 08625-0350 (609) 292-4517 [email protected]
BPU Andrea Reid Board of Public Utilities Division of Energy 44 South Clinton Avenue, 9th Flr. P.O. Box 350 Trenton NJ 08625-0350 (609) 292-4518 [email protected]
DAG Jenique Jones NJ Dept. of Law & Public Safety Division of Law 124 Halsey Street, 5th Flr. P.O. Box 45029 Newark NJ 07101 [email protected]
DAG Patricia A. Krogman DAG NJ Dept of Law & Public Safety Division of Law 124 Halsey Street, 5th Flr. P.O. Box 45029 Newark NJ 07101 (973) 648-3441 [email protected]
DAG Alex Moreau DAG NJ Dept. of Law & Public Safety Division of Law 124 Halsey Street, 5th Flr. P.O. Box 45029 Newark NJ 07101 (973) 648-3762 [email protected]
DAG Babette Tenzer DAG NJ Dept. of Law & Public Safety Division of Law 124 Halsey Street, 5th Flr. P.O. Box 45029 Newark NJ 07101 (973) 648-7811 [email protected]
DAG Caroline Vachier DAG NJ Dept. of Law & Public Safety Division of Law 124 Halsey Street, 5th Flr. P.O. Box 45029 Newark NJ 07101 (973) 648-3709 [email protected]
DAG T. David Wand NJ Dept. of Law & Public Safety Division of Law 124 Halsey Street, 5th Flr. P.O. Box 45029 Newark NJ 07101 (973) 648-3441 [email protected]
PSE&G Michele Falcao PSEG Services Corporation 80 Park Plaza, T5 P.O. Box 570 Newark NJ 07102 973-430-6119 [email protected]
PSE&G Alex Stern Esq. PSEG Services Corporation 80 Park Plaza, T5 P.O. Box 570 Newark NJ 07102 (973) 430-5754 [email protected]
08/14/2015 Public Service Electric and Gas Company Page 2 of 2 GPRC 2015 ER15070757 and GR15070758 PSE&G Matthew M. Weissman Esq. PSEG Services Corporation 80 Park Plaza, T5 P.O. Box 570 Newark NJ 07102 (973) 430-7052 [email protected]
Rate Counsel Stefanie A. Brand Division of Rate Counsel 140 East Front Street, 4th Flr. P.O. Box 003 Trenton NJ 08625 (609) 984-1460 [email protected]
Rate Counsel James Glassen Division of Rate Counsel 140 East Front Street, 4th Flr. P.O. Box 003 Trenton NJ 08625 (609) 984-1460 [email protected]
Rate Counsel Kurt Lewandowski Esq. Division of Rate Counsel 140 East Front Street, 4th Flr. P.O. Box 003 Trenton NJ 08625 (609) 984-1460 [email protected]
Rate Counsel Brian O. Lipman Division of Rate Counsel 140 East Front Street, 4th Flr. P.O. Box 003 Trenton NJ 08625 (609) 984-1460 [email protected]
Rate Counsel Shelly Massey Division of Rate Counsel 140 East Front Street, 4th Flr. P.O. Box 003 Trenton NJ 08625 (609) 984-1460 [email protected]
Rate Counsel Felicia Thomas-Friel Division of Rate Counsel 140 East Front Street, 4th Flr. P.O. Box 003 Trenton NJ 08625 (609) 984-1460 [email protected]
Rate Counsel Consultant Andrea Crane The Columbia Group, Inc. P.O. Box 810 Georgetown CT 06829 (203) 438-2999 [email protected]
Rate Counsel Consultant David Dismukes Acadian Consulting Group 5800 One Perkins Drive Building 5, Suite F Baton Rouge LA 70808 (225) 578-4343 [email protected]
Rate Counsel Consultant Robert Fagan Synapse Energy Economics, Inc. 485 Massachusetts Ave., Suite 2 Cambridge MA 02139 (617) 661-3248 [email protected]
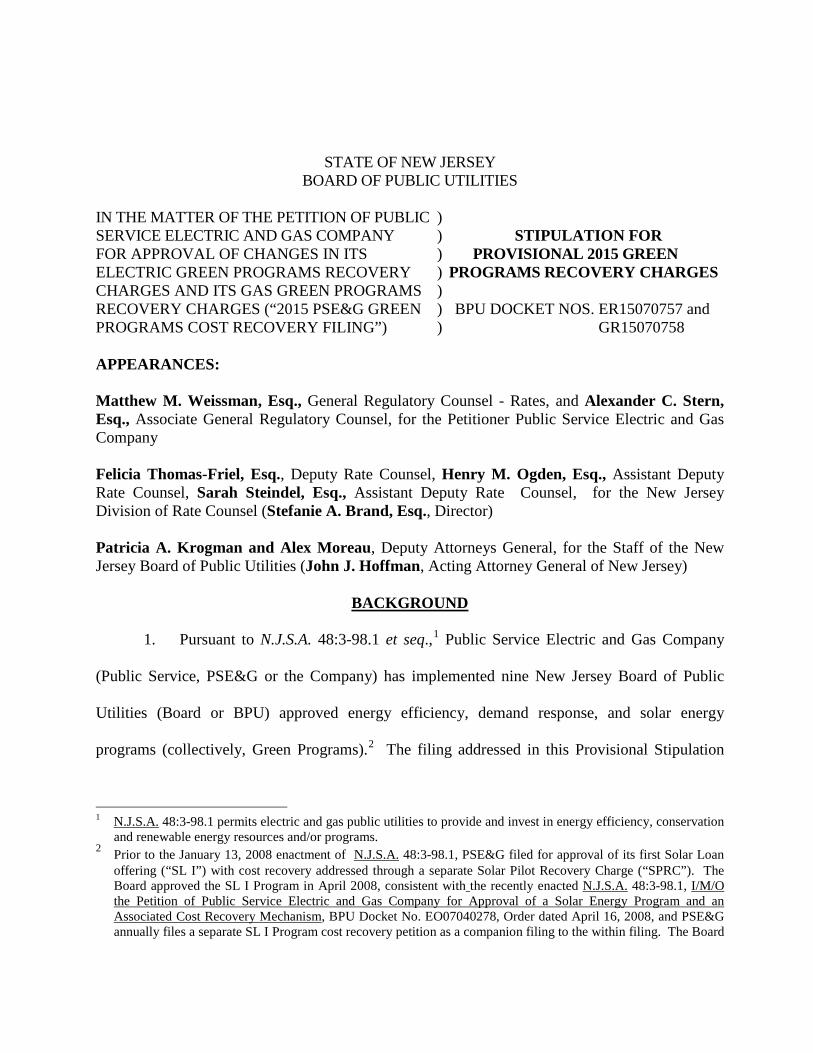
STATE OF NEW JERSEY BOARD OF PUBLIC UTILITIES
IN THE MATTER OF THE PETITION OF PUBLIC ) SERVICE ELECTRIC AND GAS COMPANY ) STIPULATION FOR FOR APPROVAL OF CHANGES IN ITS ) PROVISIONAL 2015 GREEN ELECTRIC GREEN PROGRAMS RECOVERY ) PROGRAMS RECOVERY CHARGES CHARGES AND ITS GAS GREEN PROGRAMS ) RECOVERY CHARGES (“2015 PSE&G GREEN ) BPU DOCKET NOS. ER15070757 and PROGRAMS COST RECOVERY FILING”) ) GR15070758 APPEARANCES: Matthew M. Weissman, Esq., General Regulatory Counsel - Rates, and Alexander C. Stern, Esq., Associate General Regulatory Counsel, for the Petitioner Public Service Electric and Gas Company Felicia Thomas-Friel, Esq., Deputy Rate Counsel, Henry M. Ogden, Esq., Assistant Deputy Rate Counsel, Sarah Steindel, Esq., Assistant Deputy Rate Counsel, for the New Jersey Division of Rate Counsel (Stefanie A. Brand, Esq., Director) Patricia A. Krogman and Alex Moreau, Deputy Attorneys General, for the Staff of the New Jersey Board of Public Utilities (John J. Hoffman, Acting Attorney General of New Jersey)
BACKGROUND
1. Pursuant to N.J.S.A. 48:3-98.1 et seq.,1 Public Service Electric and Gas Company
(Public Service, PSE&G or the Company) has implemented nine New Jersey Board of Public
Utilities (Board or BPU) approved energy efficiency, demand response, and solar energy
programs (collectively, Green Programs).2 The filing addressed in this Provisional Stipulation
1 N.J.S.A. 48:3-98.1 permits electric and gas public utilities to provide and invest in energy efficiency, conservation
and renewable energy resources and/or programs. 2 Prior to the January 13, 2008 enactment of N.J.S.A. 48:3-98.1, PSE&G filed for approval of its first Solar Loan
offering (“SL I”) with cost recovery addressed through a separate Solar Pilot Recovery Charge (“SPRC”). The Board approved the SL I Program in April 2008, consistent with the recently enacted N.J.S.A. 48:3-98.1, I/M/O the Petition of Public Service Electric and Gas Company for Approval of a Solar Energy Program and an Associated Cost Recovery Mechanism, BPU Docket No. EO07040278, Order dated April 16, 2008, and PSE&G annually files a separate SL I Program cost recovery petition as a companion filing to the within filing. The Board
- 2 -
concerns eight of the nine Programs.3 The programs are: (1) the Carbon Abatement Program
(CA); (2) the Energy Efficiency Economic Stimulus Program (EEE); (3) the EEE Extension Program
(EEE Extension); (4) the Demand Response Program (DR); (5) the Solar 4 All Program (S4A”); (6)
the Solar Loan II Program (SLII); (7) the Solar 4 All Extension Program (S4AE); (8) the Solar Loan
III Program (SLIII). PSE&G has implemented the PSE&G Green Programs after BPU approval
to help the State achieve its renewable energy and energy efficiency goals.
2. The Board has approved each of the PSE&G Green Programs and their associated
cost recovery mechanisms. PSE&G recovers the revenue requirements for these Programs
through its electric and gas Green Programs Recovery Charge (hereinafter referred to as the
“GPRC”). There is a separate component of the GPRC for each of the eight Green Programs at
issue herein as well as one additional program recently approved.4
3. On July 2, 2015, PSE&G made the requisite annual filing with the Board requesting
resetting of the Company’s Electric and Gas GPRCs for the eight PSE&G Green Programs
referenced in paragraph 1. Overall, the filing proposed to decrease rates to be paid by the
Company’s electric customers by $47.7 million annually and to decrease rates to be paid by the
Company’s gas customers by $8.9 million annually. The Company proposed an October 1, 2015
effective date for these rate changes.
has established it to be appropriate to case manage the cost recovery filings for PSE&G’s Green Programs and the SL I Program together.
3 On April 15, 2015, the Board approved PSE&G’s EEE Extension II Program, BPU Docket No. EO14080897. EEE Extension II is not part of this current filing. Consistent with the Board Order dated April 16, 2015, EEE Extension II rates were implemented as of May 1, 2015 and will be included for true-up as part of the July 1, 2016 GPRC cost recovery proceeding.
4 The gas GPRC only includes components for the CA, EEE and EEE Extension Programs. As noted in FN 2 EEE Extension II is not part of this current filing, but was added to the GPRC effective May 1, 2015.
- 3 -
4. Public hearings were considered appropriate in recognition that certain program
component costs are proposed to increase even though, overall, the proposal results in rate
decreases for customers. Notice setting forth the Company’s July 2, 2015 request to reset the
GPRC rates, including the date, time and place of the public hearing, was placed in newspapers of
broad circulation within the Company’s gas and electric service territories and was served on the
county executives and clerks of all municipalities within the Company’s gas and electric service
territories.
5. Public hearings were conducted in Hackensack, New Brunswick and Mount Holly
on August 18, 19, and 20, 2015, respectively. Four members of the public expressed general
concerns about high utility rates and opposition to shutting off service for lack of payment. No
members of the public appeared and commented specifically on this filing.
6. Public Service, Board Staff, and the New Jersey Division of Rate Counsel (Rate
Counsel) (collectively, the Parties) have determined that additional time is needed to complete the
review of the Company’s proposed GPRC. However, the Parties also agree that action with
respect to the Company’s GPRC for the 2015-2016 GPRC year, on a provisional basis, is
reasonable at this time and HEREBY STIPULATE AND AGREE as follows:
STIPULATED MATTERS
7. The Parties agree to implement the originally proposed electric GPRC revenue
decrease of $47.7 million as well as the originally proposed gas GPRC revenue decrease of $8.9
million requested in the Petition on a provisional basis. The cumulative proposed rate impacts for
all nine components of the electric GPRC result in a decrease from $0.002907 per kWh (including
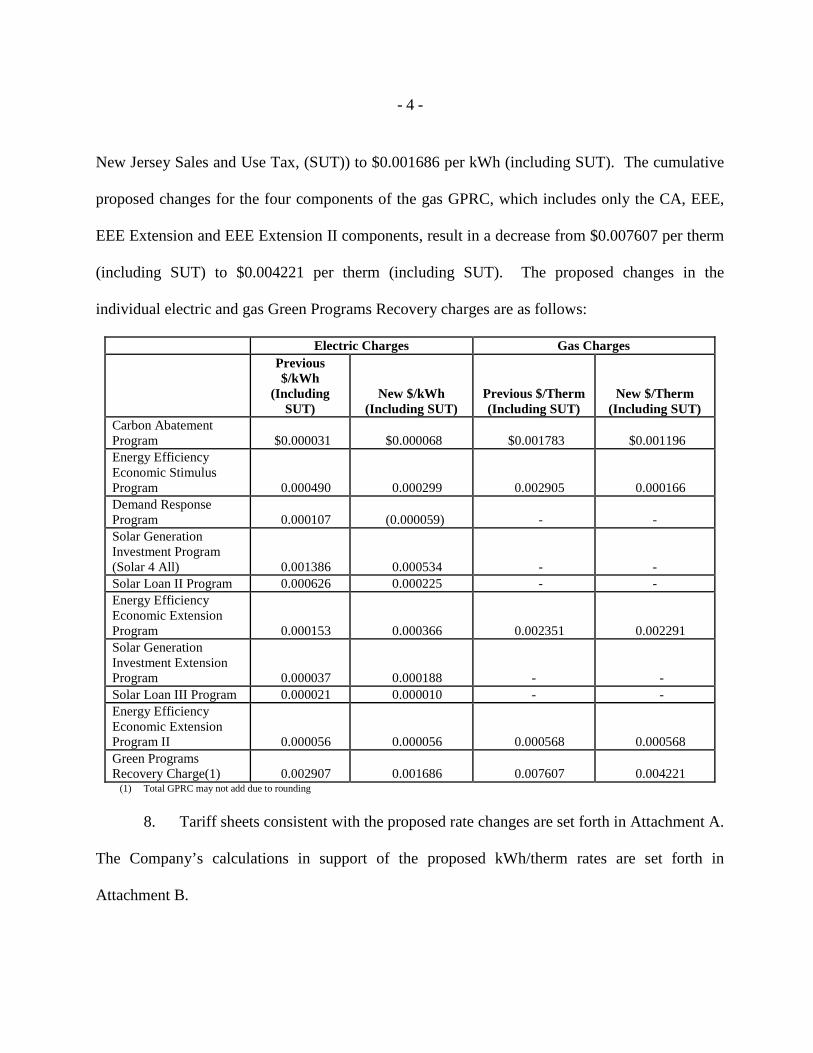
- 4 -
New Jersey Sales and Use Tax, (SUT)) to $0.001686 per kWh (including SUT). The cumulative
proposed changes for the four components of the gas GPRC, which includes only the CA, EEE,
EEE Extension and EEE Extension II components, result in a decrease from $0.007607 per therm
(including SUT) to $0.004221 per therm (including SUT). The proposed changes in the
individual electric and gas Green Programs Recovery charges are as follows:
Electric Charges Gas Charges
Previous $/kWh
(Including SUT)
New $/kWh (Including SUT)
Previous $/Therm (Including SUT)
New $/Therm (Including SUT)
Carbon Abatement Program $0.000031 $0.000068 $0.001783 $0.001196 Energy Efficiency Economic Stimulus Program 0.000490 0.000299 0.002905 0.000166 Demand Response Program 0.000107 (0.000059) - - Solar Generation Investment Program (Solar 4 All) 0.001386 0.000534 - - Solar Loan II Program 0.000626 0.000225 - - Energy Efficiency Economic Extension Program 0.000153 0.000366 0.002351 0.002291 Solar Generation Investment Extension Program 0.000037 0.000188 - - Solar Loan III Program 0.000021 0.000010 - - Energy Efficiency Economic Extension Program II 0.000056 0.000056 0.000568 0.000568 Green Programs Recovery Charge(1) 0.002907 0.001686 0.007607 0.004221
(1) Total GPRC may not add due to rounding
8. Tariff sheets consistent with the proposed rate changes are set forth in Attachment A.
The Company’s calculations in support of the proposed kWh/therm rates are set forth in
Attachment B.
- 5 -
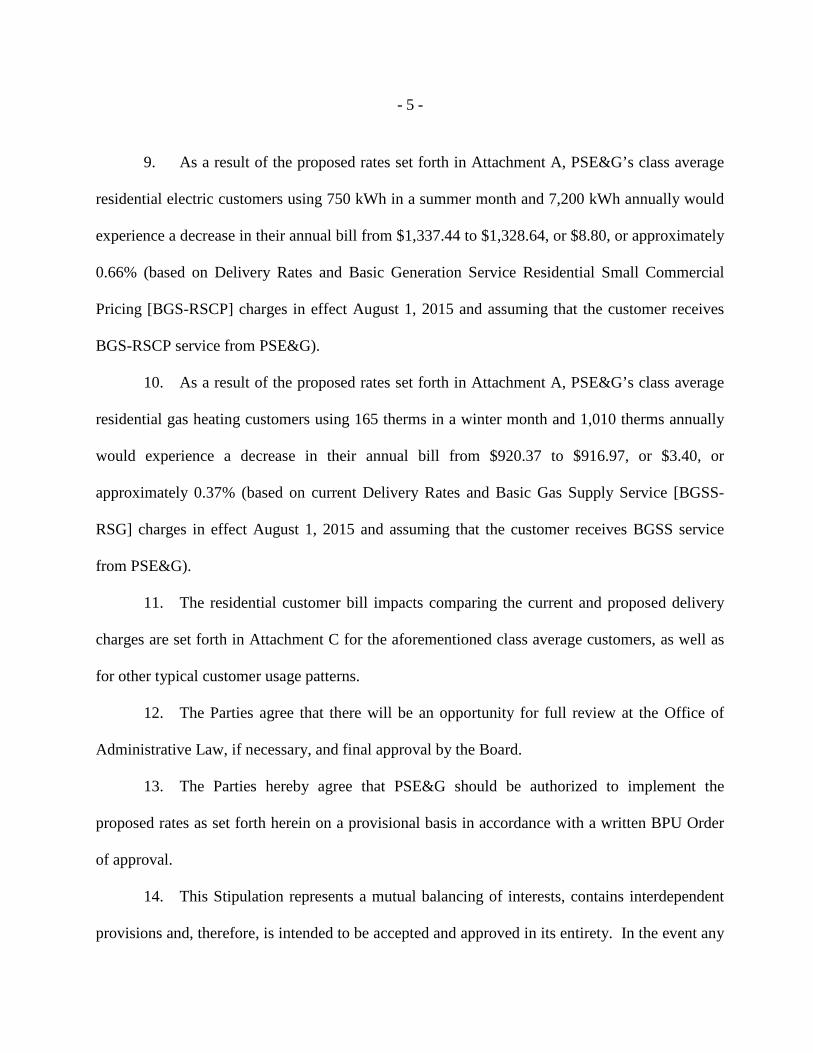
9. As a result of the proposed rates set forth in Attachment A, PSE&G’s class average
residential electric customers using 750 kWh in a summer month and 7,200 kWh annually would
experience a decrease in their annual bill from $1,337.44 to $1,328.64, or $8.80, or approximately
0.66% (based on Delivery Rates and Basic Generation Service Residential Small Commercial
Pricing [BGS-RSCP] charges in effect August 1, 2015 and assuming that the customer receives
BGS-RSCP service from PSE&G).
10. As a result of the proposed rates set forth in Attachment A, PSE&G’s class average
residential gas heating customers using 165 therms in a winter month and 1,010 therms annually
would experience a decrease in their annual bill from $920.37 to $916.97, or $3.40, or
approximately 0.37% (based on current Delivery Rates and Basic Gas Supply Service [BGSS-
RSG] charges in effect August 1, 2015 and assuming that the customer receives BGSS service
from PSE&G).
11. The residential customer bill impacts comparing the current and proposed delivery
charges are set forth in Attachment C for the aforementioned class average customers, as well as
for other typical customer usage patterns.
12. The Parties agree that there will be an opportunity for full review at the Office of
Administrative Law, if necessary, and final approval by the Board.
13. The Parties hereby agree that PSE&G should be authorized to implement the
proposed rates as set forth herein on a provisional basis in accordance with a written BPU Order
of approval.
14. This Stipulation represents a mutual balancing of interests, contains interdependent
provisions and, therefore, is intended to be accepted and approved in its entirety. In the event any

- 6 -
particular aspect of this Stipulation is not accepted and approved in its entirety by the Board, or is
modified by the Board, each party that is adversely affected by the modification can either accept
the modification or declare this Settlement to be null and void, and the Parties shall be placed in
the same position that they were in immediately prior to its execution. More particularly, in the
event this Stipulation is not adopted in its entirety by the Board, then any Party hereto is free to
pursue its then available legal remedies with respect to all issues addressed in this Stipulation as
though this Stipulation had not been signed.
15. It is the intent of the Parties that the provisions hereof be approved by the Board as
being in the public interest. The Parties further agree that they consider the Stipulation to be
binding on them for all purposes herein.
16. The Parties further acknowledge that a Board Order approving this Stipulation will
become effective upon the service of said Board Order, or upon such date after the service thereof
as the Board may specify, in accordance with N.J.S.A. 48:2-40.
17. It is specifically understood and agreed that this Stipulation represents a negotiated
agreement and has been made exclusively for the purpose of these proceedings. Except as
expressly provided herein, Public Service, Board Staff, and Rate Counsel shall not be deemed to
have approved, agreed to, or consented to any principle or methodology underlying or supposed
to underlie any agreement provided herein, in total or by specific item. The Parties further agree
that this Stipulation is in no way binding upon them in any other proceeding, except to enforce the
terms of this Stipulation.

PUBLIC SERVICE ELECTRIC AND GAS COMPANY XXX Revised Sheet No. 65 Superseding B.P.U.N.J. No. 15 ELECTRIC XXX Revised Sheet No. 65
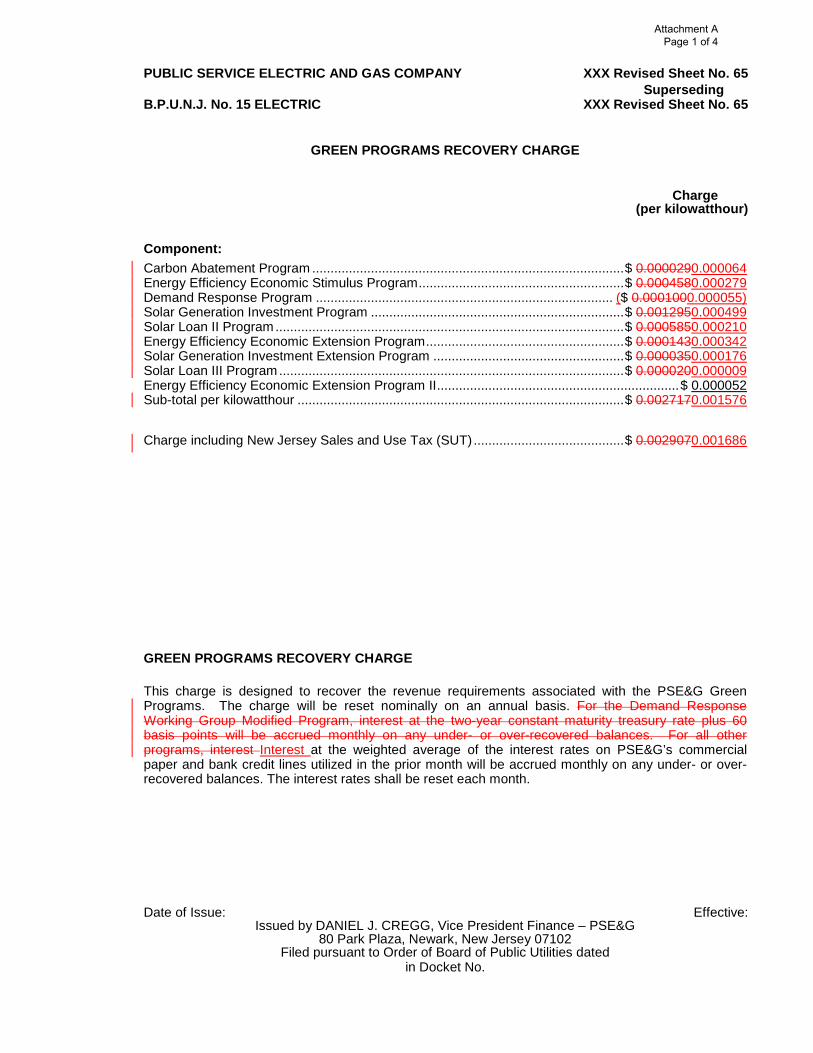
GREEN PROGRAMS RECOVERY CHARGE Charge (per kilowatthour) Component: Carbon Abatement Program ..................................................................................... $ 0.0000290.000064 Energy Efficiency Economic Stimulus Program ........................................................ $ 0.0004580.000279 Demand Response Program ................................................................................. ($ 0.0001000.000055) Solar Generation Investment Program ..................................................................... $ 0.0012950.000499 Solar Loan II Program ............................................................................................... $ 0.0005850.000210 Energy Efficiency Economic Extension Program ...................................................... $ 0.0001430.000342 Solar Generation Investment Extension Program .................................................... $ 0.0000350.000176 Solar Loan III Program .............................................................................................. $ 0.0000200.000009 Energy Efficiency Economic Extension Program II .................................................................. $ 0.000052 Sub-total per kilowatthour ......................................................................................... $ 0.0027170.001576 Charge including New Jersey Sales and Use Tax (SUT) ......................................... $ 0.0029070.001686 GREEN PROGRAMS RECOVERY CHARGE This charge is designed to recover the revenue requirements associated with the PSE&G Green Programs. The charge will be reset nominally on an annual basis. For the Demand Response Working Group Modified Program, interest at the two-year constant maturity treasury rate plus 60 basis points will be accrued monthly on any under- or over-recovered balances. For all other programs, interest Interest at the weighted average of the interest rates on PSE&G’s commercial paper and bank credit lines utilized in the prior month will be accrued monthly on any under- or over- recovered balances. The interest rates shall be reset each month. Date of Issue: Effective:
Issued by DANIEL J. CREGG, Vice President Finance – PSE&G 80 Park Plaza, Newark, New Jersey 07102
Filed pursuant to Order of Board of Public Utilities dated in Docket No.
Attachment A Page 1 of 4
PUBLIC SERVICE ELECTRIC AND GAS COMPANY XXX Revised Sheet No. 65 Superseding B.P.U.N.J. No. 15 ELECTRIC XXX Revised Sheet No. 65
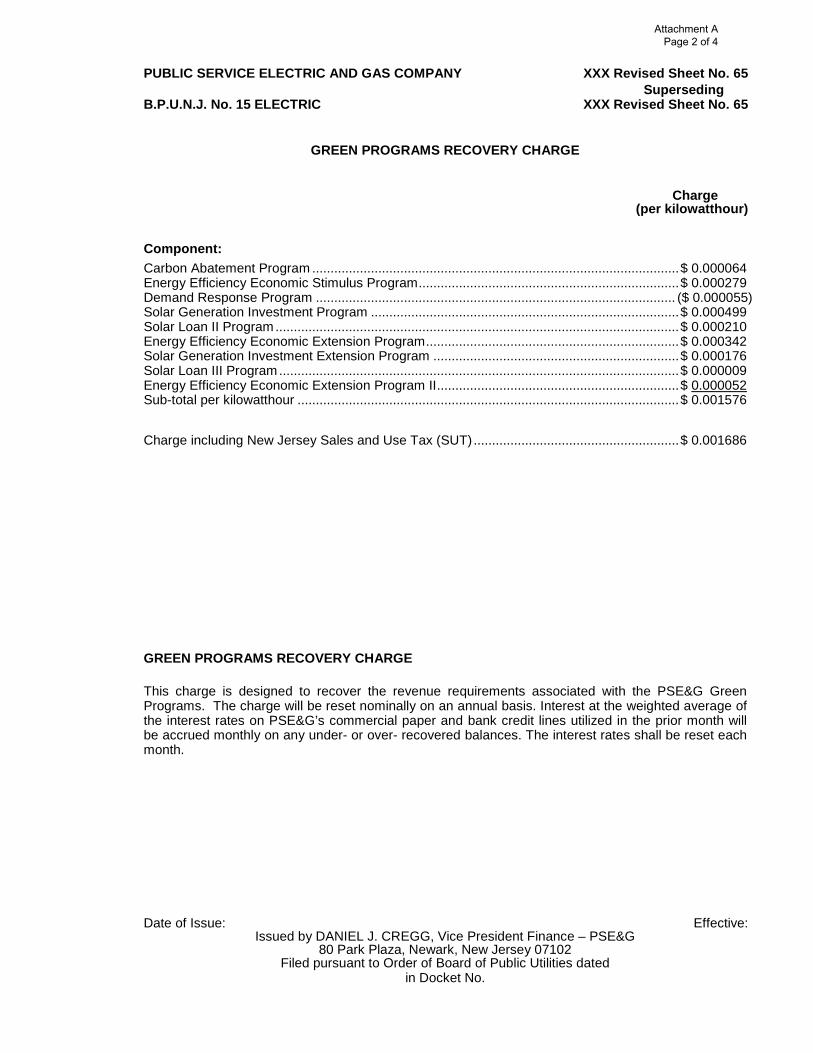
GREEN PROGRAMS RECOVERY CHARGE Charge (per kilowatthour) Component: Carbon Abatement Program .................................................................................................... $ 0.000064 Energy Efficiency Economic Stimulus Program ....................................................................... $ 0.000279 Demand Response Program .................................................................................................. ($ 0.000055) Solar Generation Investment Program .................................................................................... $ 0.000499 Solar Loan II Program .............................................................................................................. $ 0.000210 Energy Efficiency Economic Extension Program ..................................................................... $ 0.000342 Solar Generation Investment Extension Program ................................................................... $ 0.000176 Solar Loan III Program ............................................................................................................. $ 0.000009 Energy Efficiency Economic Extension Program II .................................................................. $ 0.000052 Sub-total per kilowatthour ........................................................................................................ $ 0.001576 Charge including New Jersey Sales and Use Tax (SUT) ........................................................ $ 0.001686 GREEN PROGRAMS RECOVERY CHARGE This charge is designed to recover the revenue requirements associated with the PSE&G Green Programs. The charge will be reset nominally on an annual basis. Interest at the weighted average of the interest rates on PSE&G’s commercial paper and bank credit lines utilized in the prior month will be accrued monthly on any under- or over- recovered balances. The interest rates shall be reset each month. Date of Issue: Effective:
Issued by DANIEL J. CREGG, Vice President Finance – PSE&G 80 Park Plaza, Newark, New Jersey 07102
Filed pursuant to Order of Board of Public Utilities dated in Docket No.
Attachment A Page 2 of 4
PUBLIC SERVICE ELECTRIC AND GAS COMPANY XXX Revised Sheet No. 44 Superseding B.P.U.N.J. No. 15 GAS XXX Revised Sheet No. 44
GREEN PROGRAMS RECOVERY CHARGE
CHARGE APPLICABLE TO RATE SCHEDULES RSG, GSG, LVG, SLG,
TSG-F, TSG-NF, CIG, CSG (per Therm)
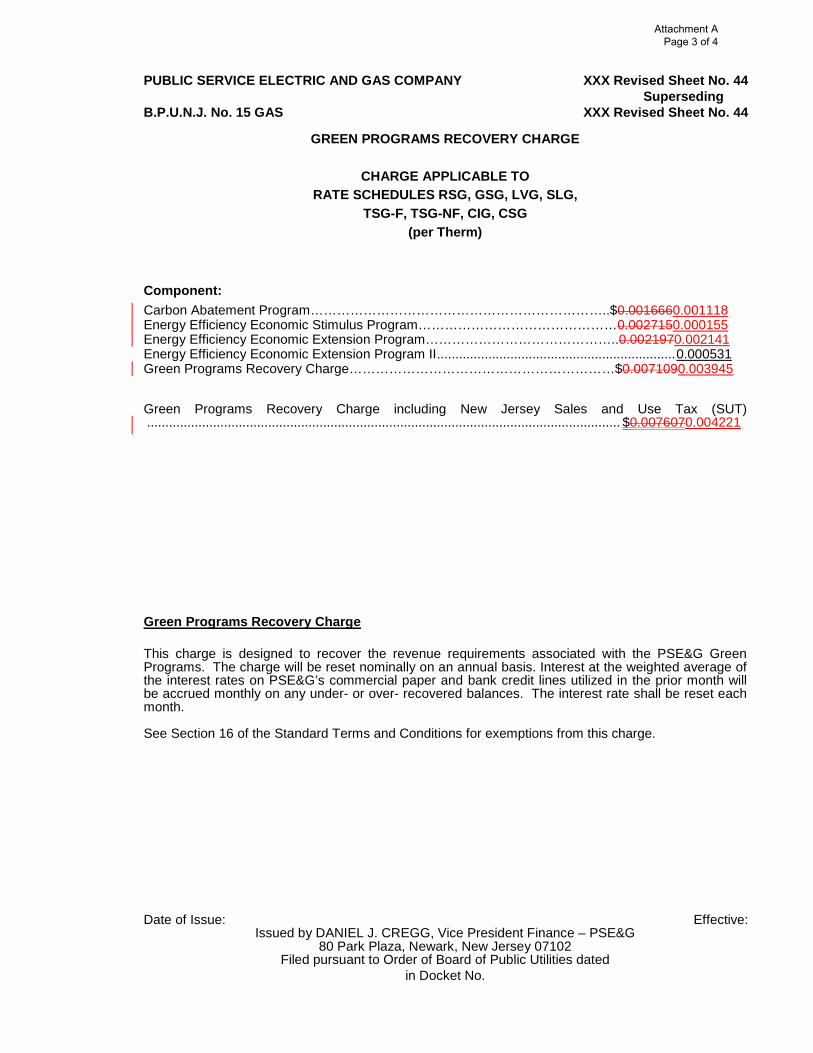
Component: Carbon Abatement Program…………………………………………………………..$0.0016660.001118 Energy Efficiency Economic Stimulus Program………………………………………0.0027150.000155 Energy Efficiency Economic Extension Program……………………………………..0.0021970.002141 Energy Efficiency Economic Extension Program II ................................................................. 0.000531 Green Programs Recovery Charge……………………………………………………$0.0071090.003945 Green Programs Recovery Charge including New Jersey Sales and Use Tax (SUT) ................................................................................................................................. $0.0076070.004221 Green Programs Recovery Charge This charge is designed to recover the revenue requirements associated with the PSE&G Green Programs. The charge will be reset nominally on an annual basis. Interest at the weighted average of the interest rates on PSE&G’s commercial paper and bank credit lines utilized in the prior month will be accrued monthly on any under- or over- recovered balances. The interest rate shall be reset each month. See Section 16 of the Standard Terms and Conditions for exemptions from this charge. Date of Issue: Effective:
Issued by DANIEL J. CREGG, Vice President Finance – PSE&G 80 Park Plaza, Newark, New Jersey 07102
Filed pursuant to Order of Board of Public Utilities dated in Docket No.
Attachment A Page 3 of 4
PUBLIC SERVICE ELECTRIC AND GAS COMPANY XXX Revised Sheet No. 44 Superseding B.P.U.N.J. No. 15 GAS XXX Revised Sheet No. 44
GREEN PROGRAMS RECOVERY CHARGE
CHARGE APPLICABLE TO RATE SCHEDULES RSG, GSG, LVG, SLG,
TSG-F, TSG-NF, CIG, CSG (per Therm)
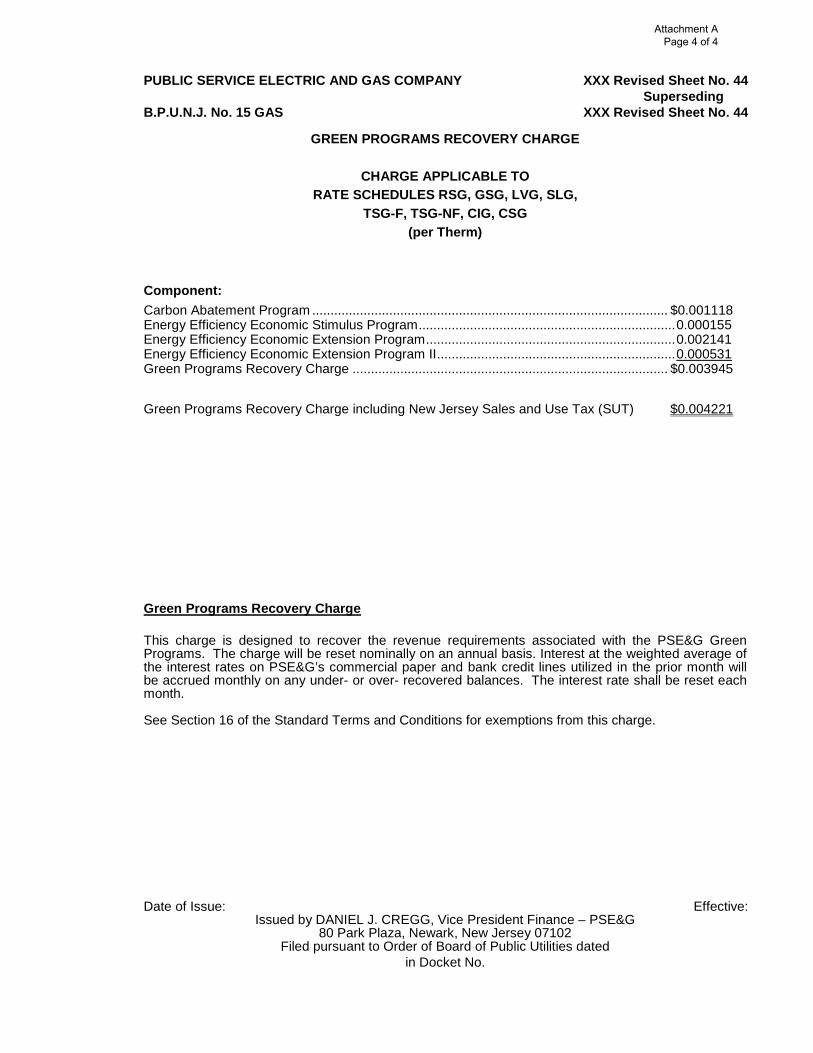
Component: Carbon Abatement Program ................................................................................................. $0.001118 Energy Efficiency Economic Stimulus Program ...................................................................... 0.000155 Energy Efficiency Economic Extension Program .................................................................... 0.002141 Energy Efficiency Economic Extension Program II ................................................................. 0.000531 Green Programs Recovery Charge ...................................................................................... $0.003945 Green Programs Recovery Charge including New Jersey Sales and Use Tax (SUT) $0.004221 Green Programs Recovery Charge This charge is designed to recover the revenue requirements associated with the PSE&G Green Programs. The charge will be reset nominally on an annual basis. Interest at the weighted average of the interest rates on PSE&G’s commercial paper and bank credit lines utilized in the prior month will be accrued monthly on any under- or over- recovered balances. The interest rate shall be reset each month. See Section 16 of the Standard Terms and Conditions for exemptions from this charge. Date of Issue: Effective:
Issued by DANIEL J. CREGG, Vice President Finance – PSE&G 80 Park Plaza, Newark, New Jersey 07102
Filed pursuant to Order of Board of Public Utilities dated in Docket No.
Attachment A Page 4 of 4
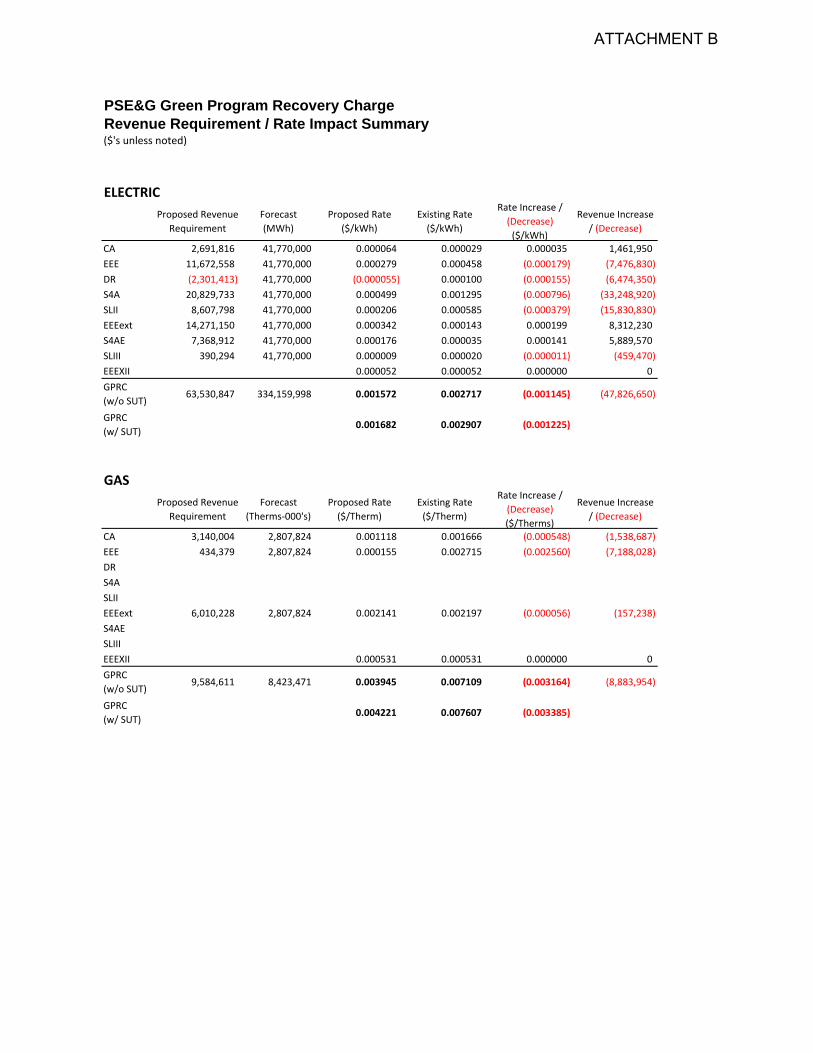
PSE&G Green Program Recovery ChargeRevenue Requirement / Rate Impact Summary($'s unless noted)
ELECTRIC
Proposed Revenue
Requirement
Forecast
(MWh)
Proposed Rate
($/kWh)
Existing Rate
($/kWh)
Rate Increase /
(Decrease)
($/kWh)
Revenue Increase
/ (Decrease)
CA 2,691,816 41,770,000 0.000064 0.000029 0.000035 1,461,950
EEE 11,672,558 41,770,000 0.000279 0.000458 (0.000179) (7,476,830)
DR (2,301,413) 41,770,000 (0.000055) 0.000100 (0.000155) (6,474,350)
S4A 20,829,733 41,770,000 0.000499 0.001295 (0.000796) (33,248,920)
SLII 8,607,798 41,770,000 0.000206 0.000585 (0.000379) (15,830,830)
EEEext 14,271,150 41,770,000 0.000342 0.000143 0.000199 8,312,230
S4AE 7,368,912 41,770,000 0.000176 0.000035 0.000141 5,889,570
SLIII 390,294 41,770,000 0.000009 0.000020 (0.000011) (459,470)
EEEXII 0.000052 0.000052 0.000000 0
GPRC
(w/o SUT)63,530,847 334,159,998 0.001572 0.002717 (0.001145) (47,826,650)
GPRC
(w/ SUT)0.001682 0.002907 (0.001225)
GAS
Proposed Revenue
Requirement
Forecast
(Therms‐000's)
Proposed Rate
($/Therm)
Existing Rate
($/Therm)
Rate Increase /
(Decrease)
($/Therms)
Revenue Increase
/ (Decrease)
CA 3,140,004 2,807,824 0.001118 0.001666 (0.000548) (1,538,687)
EEE 434,379 2,807,824 0.000155 0.002715 (0.002560) (7,188,028)
DR
S4A
SLII
EEEext 6,010,228 2,807,824 0.002141 0.002197 (0.000056) (157,238)
S4AE
SLIII
EEEXII 0.000531 0.000531 0.000000 0
GPRC
(w/o SUT)9,584,611 8,423,471 0.003945 0.007109 (0.003164) (8,883,954)
GPRC
(w/ SUT)0.004221 0.007607 (0.003385)
ATTACHMENT B
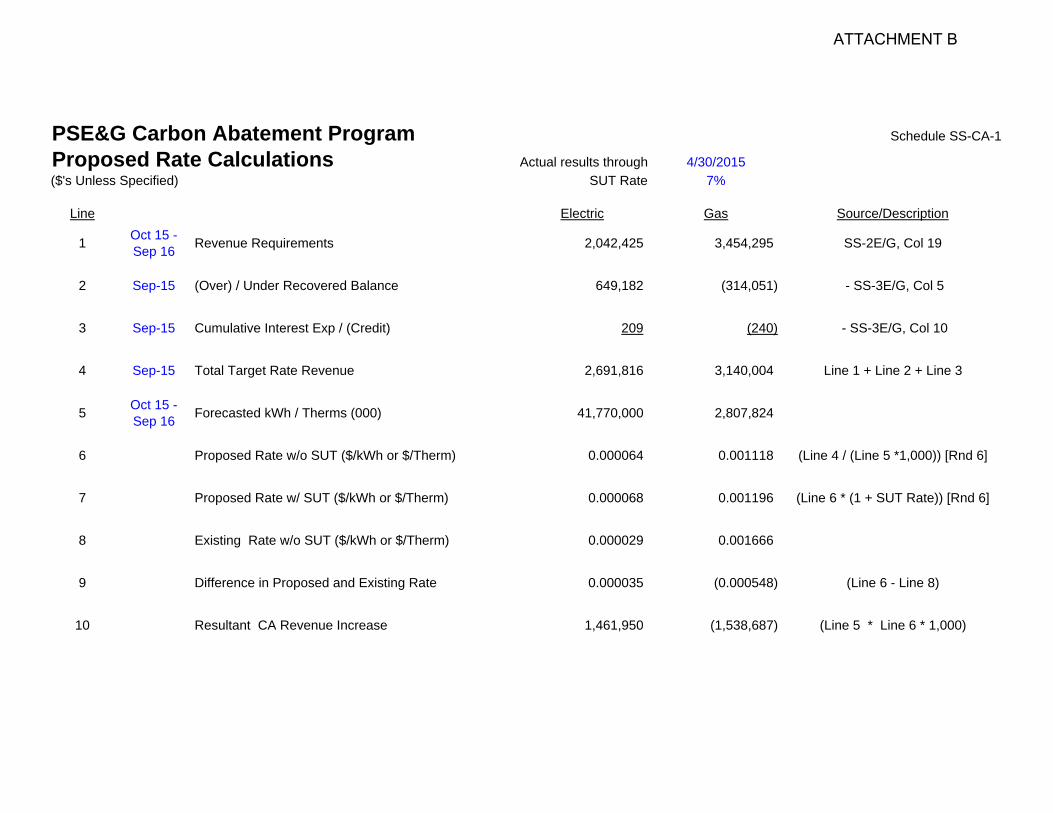
PSE&G Carbon Abatement Program Schedule SS-CA-1
Proposed Rate Calculations Actual results through 4/30/2015($'s Unless Specified) SUT Rate 7%
Line Electric Gas Source/Description
1 Oct 15 - Sep 16 Revenue Requirements 2,042,425 3,454,295 SS-2E/G, Col 19
2 Sep-15 (Over) / Under Recovered Balance 649,182 (314,051) - SS-3E/G, Col 5
3 Sep-15 Cumulative Interest Exp / (Credit) 209 (240) - SS-3E/G, Col 10
4 Sep-15 Total Target Rate Revenue 2,691,816 3,140,004 Line 1 + Line 2 + Line 3
5 Oct 15 - Sep 16 Forecasted kWh / Therms (000) 41,770,000 2,807,824
6 Proposed Rate w/o SUT ($/kWh or $/Therm) 0.000064 0.001118 (Line 4 / (Line 5 *1,000)) [Rnd 6]
7 Proposed Rate w/ SUT ($/kWh or $/Therm) 0.000068 0.001196 (Line 6 * (1 + SUT Rate)) [Rnd 6]
8 Existing Rate w/o SUT ($/kWh or $/Therm) 0.000029 0.001666
9 Difference in Proposed and Existing Rate 0.000035 (0.000548) (Line 6 - Line 8)
10 Resultant CA Revenue Increase 1,461,950 (1,538,687) (Line 5 * Line 6 * 1,000)
ATTACHMENT B
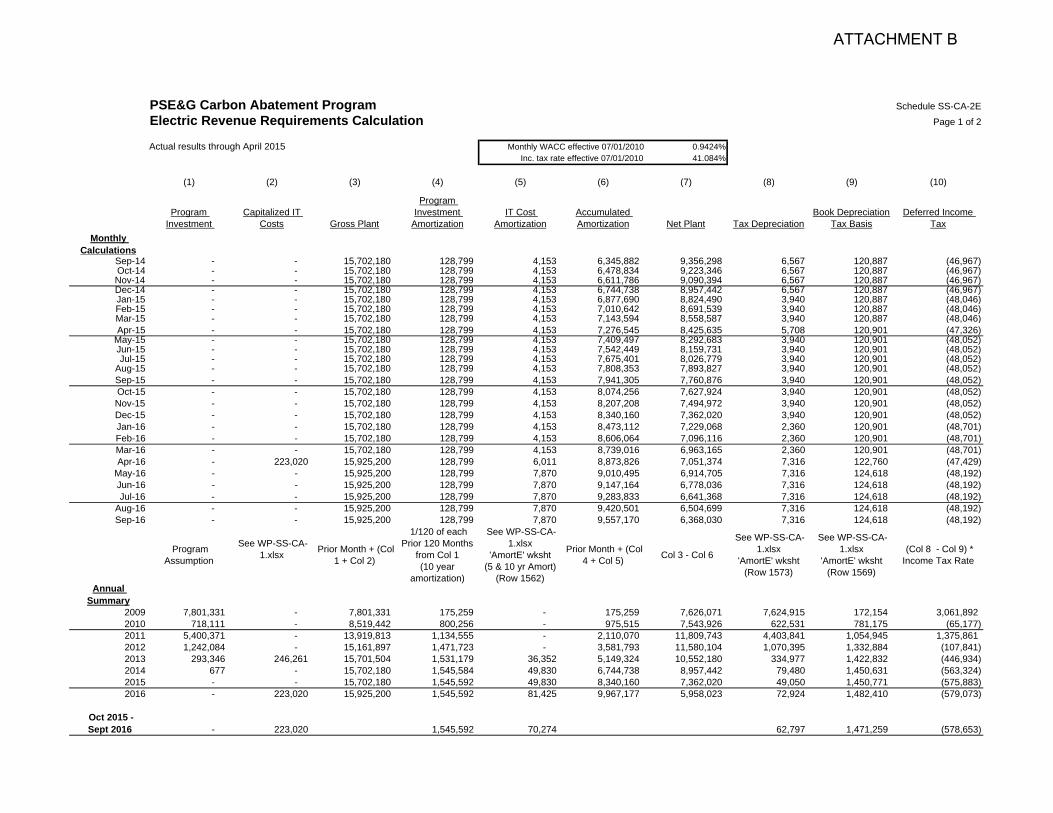
PSE&G Carbon Abatement Program Schedule SS-CA-2EElectric Revenue Requirements Calculation Page 1 of 2
Actual results through April 2015 Monthly WACC effective 07/01/2010 0.9424%Inc. tax rate effective 07/01/2010 41.084%
(1) (2) (3) (4) (5) (6) (7) (8) (9) (10)
Program Investment
Capitalized IT Costs Gross Plant
Program Investment
AmortizationIT Cost
AmortizationAccumulated Amortization Net Plant Tax Depreciation
Book DepreciationTax Basis
Deferred Income Tax
Monthly Calculations
Sep-14 - - 15,702,180 128,799 4,153 6,345,882 9,356,298 6,567 120,887 (46,967) Oct-14 - - 15,702,180 128,799 4,153 6,478,834 9,223,346 6,567 120,887 (46,967) Nov-14 - - 15,702,180 128,799 4,153 6,611,786 9,090,394 6,567 120,887 (46,967) Dec-14 - - 15,702,180 128,799 4,153 6,744,738 8,957,442 6,567 120,887 (46,967) Jan-15 - - 15,702,180 128,799 4,153 6,877,690 8,824,490 3,940 120,887 (48,046) Feb-15 - - 15,702,180 128,799 4,153 7,010,642 8,691,539 3,940 120,887 (48,046) Mar-15 - - 15,702,180 128,799 4,153 7,143,594 8,558,587 3,940 120,887 (48,046) Apr-15 - - 15,702,180 128,799 4,153 7,276,545 8,425,635 5,708 120,901 (47,326)
May-15 - - 15,702,180 128,799 4,153 7,409,497 8,292,683 3,940 120,901 (48,052) Jun-15 - - 15,702,180 128,799 4,153 7,542,449 8,159,731 3,940 120,901 (48,052) Jul-15 - - 15,702,180 128,799 4,153 7,675,401 8,026,779 3,940 120,901 (48,052)
Aug-15 - - 15,702,180 128,799 4,153 7,808,353 7,893,827 3,940 120,901 (48,052) Sep-15 - - 15,702,180 128,799 4,153 7,941,305 7,760,876 3,940 120,901 (48,052) Oct-15 - - 15,702,180 128,799 4,153 8,074,256 7,627,924 3,940 120,901 (48,052) Nov-15 - - 15,702,180 128,799 4,153 8,207,208 7,494,972 3,940 120,901 (48,052) Dec-15 - - 15,702,180 128,799 4,153 8,340,160 7,362,020 3,940 120,901 (48,052) Jan-16 - - 15,702,180 128,799 4,153 8,473,112 7,229,068 2,360 120,901 (48,701) Feb-16 - - 15,702,180 128,799 4,153 8,606,064 7,096,116 2,360 120,901 (48,701) Mar-16 - - 15,702,180 128,799 4,153 8,739,016 6,963,165 2,360 120,901 (48,701) Apr-16 - 223,020 15,925,200 128,799 6,011 8,873,826 7,051,374 7,316 122,760 (47,429)
May-16 - - 15,925,200 128,799 7,870 9,010,495 6,914,705 7,316 124,618 (48,192) Jun-16 - - 15,925,200 128,799 7,870 9,147,164 6,778,036 7,316 124,618 (48,192) Jul-16 - - 15,925,200 128,799 7,870 9,283,833 6,641,368 7,316 124,618 (48,192)
Aug-16 - - 15,925,200 128,799 7,870 9,420,501 6,504,699 7,316 124,618 (48,192) Sep-16 - - 15,925,200 128,799 7,870 9,557,170 6,368,030 7,316 124,618 (48,192)
Program Assumption
See WP-SS-CA-1.xlsx Prior Month + (Col
1 + Col 2)
1/120 of each Prior 120 Months
from Col 1(10 year
amortization)
See WP-SS-CA-1.xlsx
'AmortE' wksht(5 & 10 yr Amort)
(Row 1562)
Prior Month + (Col 4 + Col 5) Col 3 - Col 6
See WP-SS-CA-1.xlsx
'AmortE' wksht(Row 1573)
See WP-SS-CA-1.xlsx
'AmortE' wksht(Row 1569)
(Col 8 - Col 9) * Income Tax Rate
Annual Summary
2009 7,801,331 - 7,801,331 175,259 - 175,259 7,626,071 7,624,915 172,154 3,061,892 2010 718,111 - 8,519,442 800,256 - 975,515 7,543,926 622,531 781,175 (65,177) 2011 5,400,371 - 13,919,813 1,134,555 - 2,110,070 11,809,743 4,403,841 1,054,945 1,375,861 2012 1,242,084 - 15,161,897 1,471,723 - 3,581,793 11,580,104 1,070,395 1,332,884 (107,841) 2013 293,346 246,261 15,701,504 1,531,179 36,352 5,149,324 10,552,180 334,977 1,422,832 (446,934) 2014 677 - 15,702,180 1,545,584 49,830 6,744,738 8,957,442 79,480 1,450,631 (563,324) 2015 - - 15,702,180 1,545,592 49,830 8,340,160 7,362,020 49,050 1,450,771 (575,883) 2016 - 223,020 15,925,200 1,545,592 81,425 9,967,177 5,958,023 72,924 1,482,410 (579,073)
Oct 2015 - Sept 2016 - 223,020 1,545,592 70,274 62,797 1,471,259 (578,653)
ATTACHMENT B
Monthly Calculations
Sep-14Oct-14Nov-14Dec-14Jan-15Feb-15Mar-15Apr-15
May-15Jun-15Jul-15
Aug-15Sep-15Oct-15Nov-15Dec-15Jan-16Feb-16Mar-16Apr-16
May-16Jun-16Jul-16
Aug-16Sep-16
Annual Summary
20092010201120122013201420152016
Oct 2015 - Sept 2016
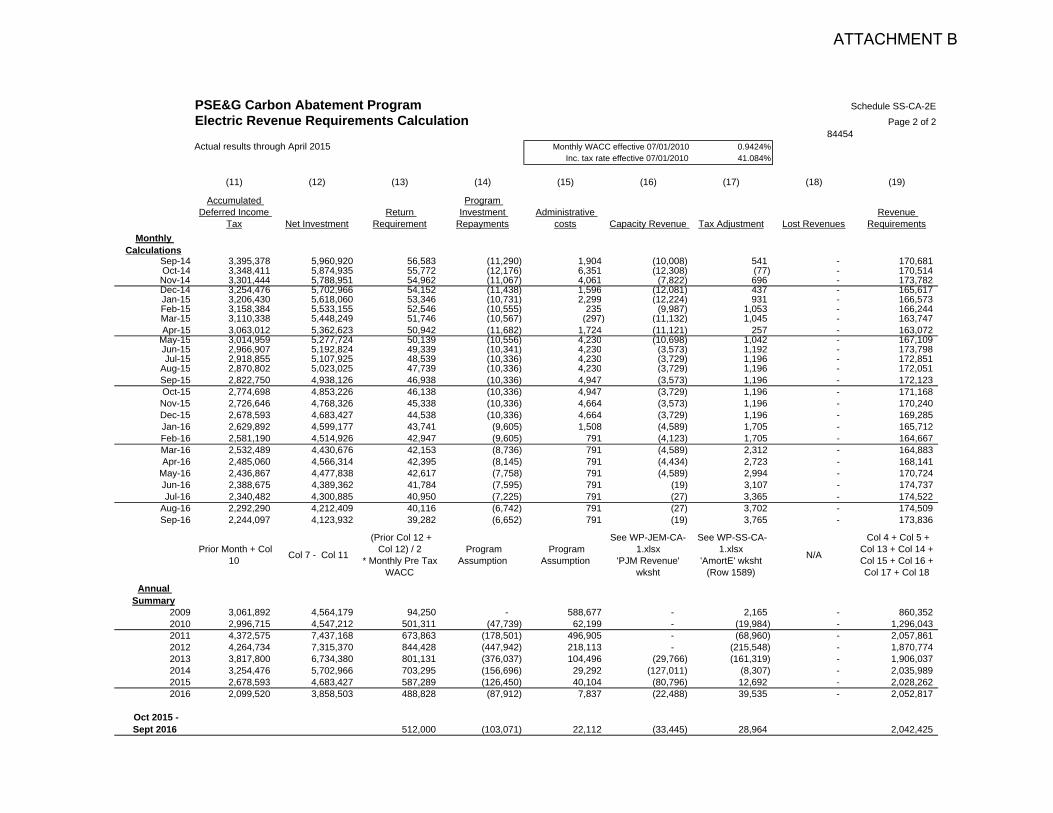
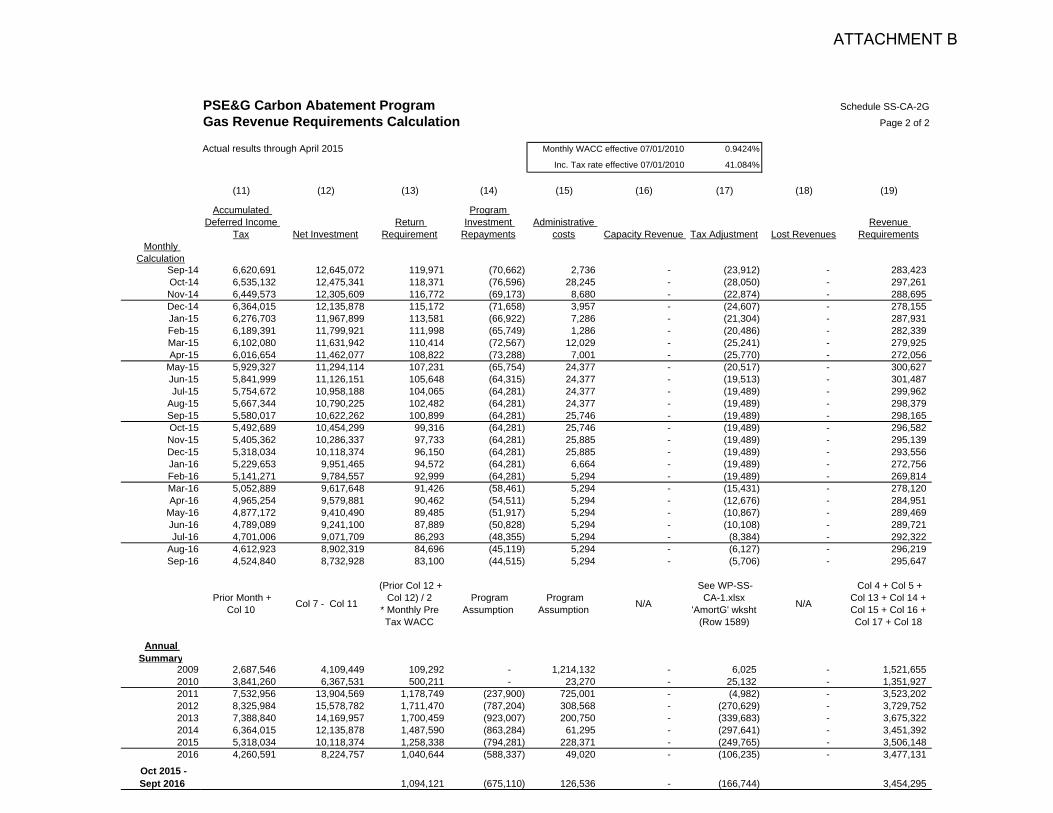
PSE&G Carbon Abatement Program Schedule SS-CA-2EElectric Revenue Requirements Calculation Page 2 of 2
84454Actual results through April 2015 Monthly WACC effective 07/01/2010 0.9424%
Inc. tax rate effective 07/01/2010 41.084%
(11) (12) (13) (14) (15) (16) (17) (18) (19)
Accumulated Deferred Income
Tax Net InvestmentReturn
Requirement
Program Investment
RepaymentsAdministrative
costs Capacity Revenue Tax Adjustment Lost RevenuesRevenue
Requirements
3,395,378 5,960,920 56,583 (11,290) 1,904 (10,008) 541 - 170,681 3,348,411 5,874,935 55,772 (12,176) 6,351 (12,308) (77) - 170,514 3,301,444 5,788,951 54,962 (11,067) 4,061 (7,822) 696 - 173,782 3,254,476 5,702,966 54,152 (11,438) 1,596 (12,081) 437 - 165,617 3,206,430 5,618,060 53,346 (10,731) 2,299 (12,224) 931 - 166,573 3,158,384 5,533,155 52,546 (10,555) 235 (9,987) 1,053 - 166,244 3,110,338 5,448,249 51,746 (10,567) (297) (11,132) 1,045 - 163,747 3,063,012 5,362,623 50,942 (11,682) 1,724 (11,121) 257 - 163,072 3,014,959 5,277,724 50,139 (10,556) 4,230 (10,698) 1,042 - 167,109 2,966,907 5,192,824 49,339 (10,341) 4,230 (3,573) 1,192 - 173,798 2,918,855 5,107,925 48,539 (10,336) 4,230 (3,729) 1,196 - 172,851 2,870,802 5,023,025 47,739 (10,336) 4,230 (3,729) 1,196 - 172,051 2,822,750 4,938,126 46,938 (10,336) 4,947 (3,573) 1,196 - 172,123 2,774,698 4,853,226 46,138 (10,336) 4,947 (3,729) 1,196 - 171,168 2,726,646 4,768,326 45,338 (10,336) 4,664 (3,573) 1,196 - 170,240 2,678,593 4,683,427 44,538 (10,336) 4,664 (3,729) 1,196 - 169,285 2,629,892 4,599,177 43,741 (9,605) 1,508 (4,589) 1,705 - 165,712 2,581,190 4,514,926 42,947 (9,605) 791 (4,123) 1,705 - 164,667 2,532,489 4,430,676 42,153 (8,736) 791 (4,589) 2,312 - 164,883 2,485,060 4,566,314 42,395 (8,145) 791 (4,434) 2,723 - 168,141 2,436,867 4,477,838 42,617 (7,758) 791 (4,589) 2,994 - 170,724 2,388,675 4,389,362 41,784 (7,595) 791 (19) 3,107 - 174,737 2,340,482 4,300,885 40,950 (7,225) 791 (27) 3,365 - 174,522 2,292,290 4,212,409 40,116 (6,742) 791 (27) 3,702 - 174,509 2,244,097 4,123,932 39,282 (6,652) 791 (19) 3,765 - 173,836
Prior Month + Col 10 Col 7 - Col 11
(Prior Col 12 + Col 12) / 2
* Monthly Pre Tax WACC
Program Assumption
Program Assumption
See WP-JEM-CA-1.xlsx
'PJM Revenue' wksht
See WP-SS-CA-1.xlsx
'AmortE' wksht(Row 1589)
N/A
Col 4 + Col 5 + Col 13 + Col 14 + Col 15 + Col 16 + Col 17 + Col 18
3,061,892 4,564,179 94,250 - 588,677 - 2,165 - 860,352 2,996,715 4,547,212 501,311 (47,739) 62,199 - (19,984) - 1,296,043 4,372,575 7,437,168 673,863 (178,501) 496,905 - (68,960) - 2,057,861 4,264,734 7,315,370 844,428 (447,942) 218,113 - (215,548) - 1,870,774 3,817,800 6,734,380 801,131 (376,037) 104,496 (29,766) (161,319) - 1,906,037 3,254,476 5,702,966 703,295 (156,696) 29,292 (127,011) (8,307) - 2,035,989 2,678,593 4,683,427 587,289 (126,450) 40,104 (80,796) 12,692 - 2,028,262 2,099,520 3,858,503 488,828 (87,912) 7,837 (22,488) 39,535 - 2,052,817
512,000 (103,071) 22,112 (33,445) 28,964 2,042,425
ATTACHMENT B
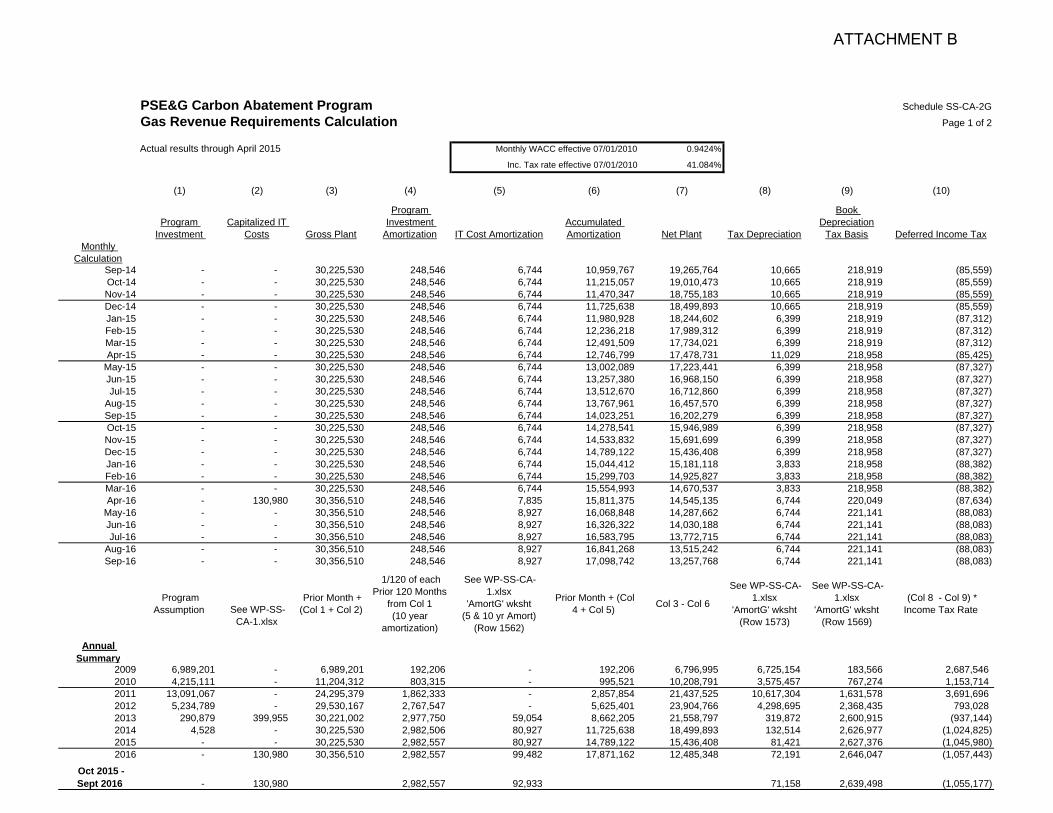
PSE&G Carbon Abatement Program Schedule SS-CA-2G
Gas Revenue Requirements Calculation Page 1 of 2
Actual results through April 2015 Monthly WACC effective 07/01/2010 0.9424%
Inc. Tax rate effective 07/01/2010 41.084%
(1) (2) (3) (4) (5) (6) (7) (8) (9) (10)
Program Investment
Capitalized IT Costs Gross Plant
Program Investment
Amortization IT Cost AmortizationAccumulated Amortization Net Plant Tax Depreciation
Book Depreciation
Tax Basis Deferred Income TaxMonthly
CalculationSep-14 - - 30,225,530 248,546 6,744 10,959,767 19,265,764 10,665 218,919 (85,559) Oct-14 - - 30,225,530 248,546 6,744 11,215,057 19,010,473 10,665 218,919 (85,559) Nov-14 - - 30,225,530 248,546 6,744 11,470,347 18,755,183 10,665 218,919 (85,559) Dec-14 - - 30,225,530 248,546 6,744 11,725,638 18,499,893 10,665 218,919 (85,559) Jan-15 - - 30,225,530 248,546 6,744 11,980,928 18,244,602 6,399 218,919 (87,312) Feb-15 - - 30,225,530 248,546 6,744 12,236,218 17,989,312 6,399 218,919 (87,312) Mar-15 - - 30,225,530 248,546 6,744 12,491,509 17,734,021 6,399 218,919 (87,312) Apr-15 - - 30,225,530 248,546 6,744 12,746,799 17,478,731 11,029 218,958 (85,425)
May-15 - - 30,225,530 248,546 6,744 13,002,089 17,223,441 6,399 218,958 (87,327) Jun-15 - - 30,225,530 248,546 6,744 13,257,380 16,968,150 6,399 218,958 (87,327) Jul-15 - - 30,225,530 248,546 6,744 13,512,670 16,712,860 6,399 218,958 (87,327)
Aug-15 - - 30,225,530 248,546 6,744 13,767,961 16,457,570 6,399 218,958 (87,327) Sep-15 - - 30,225,530 248,546 6,744 14,023,251 16,202,279 6,399 218,958 (87,327) Oct-15 - - 30,225,530 248,546 6,744 14,278,541 15,946,989 6,399 218,958 (87,327) Nov-15 - - 30,225,530 248,546 6,744 14,533,832 15,691,699 6,399 218,958 (87,327) Dec-15 - - 30,225,530 248,546 6,744 14,789,122 15,436,408 6,399 218,958 (87,327) Jan-16 - - 30,225,530 248,546 6,744 15,044,412 15,181,118 3,833 218,958 (88,382) Feb-16 - - 30,225,530 248,546 6,744 15,299,703 14,925,827 3,833 218,958 (88,382) Mar-16 - - 30,225,530 248,546 6,744 15,554,993 14,670,537 3,833 218,958 (88,382) Apr-16 - 130,980 30,356,510 248,546 7,835 15,811,375 14,545,135 6,744 220,049 (87,634)
May-16 - - 30,356,510 248,546 8,927 16,068,848 14,287,662 6,744 221,141 (88,083) Jun-16 - - 30,356,510 248,546 8,927 16,326,322 14,030,188 6,744 221,141 (88,083) Jul-16 - - 30,356,510 248,546 8,927 16,583,795 13,772,715 6,744 221,141 (88,083)
Aug-16 - - 30,356,510 248,546 8,927 16,841,268 13,515,242 6,744 221,141 (88,083) Sep-16 - - 30,356,510 248,546 8,927 17,098,742 13,257,768 6,744 221,141 (88,083)
Program Assumption See WP-SS-
CA-1.xlsx
Prior Month + (Col 1 + Col 2)
1/120 of each Prior 120 Months
from Col 1(10 year
amortization)
See WP-SS-CA-1.xlsx
'AmortG' wksht(5 & 10 yr Amort)
(Row 1562)
Prior Month + (Col 4 + Col 5) Col 3 - Col 6
See WP-SS-CA-1.xlsx
'AmortG' wksht(Row 1573)
See WP-SS-CA-1.xlsx
'AmortG' wksht(Row 1569)
(Col 8 - Col 9) * Income Tax Rate
Annual Summary
2009 6,989,201 - 6,989,201 192,206 - 192,206 6,796,995 6,725,154 183,566 2,687,546 2010 4,215,111 - 11,204,312 803,315 - 995,521 10,208,791 3,575,457 767,274 1,153,714 2011 13,091,067 - 24,295,379 1,862,333 - 2,857,854 21,437,525 10,617,304 1,631,578 3,691,696 2012 5,234,789 - 29,530,167 2,767,547 - 5,625,401 23,904,766 4,298,695 2,368,435 793,028 2013 290,879 399,955 30,221,002 2,977,750 59,054 8,662,205 21,558,797 319,872 2,600,915 (937,144) 2014 4,528 - 30,225,530 2,982,506 80,927 11,725,638 18,499,893 132,514 2,626,977 (1,024,825) 2015 - - 30,225,530 2,982,557 80,927 14,789,122 15,436,408 81,421 2,627,376 (1,045,980) 2016 - 130,980 30,356,510 2,982,557 99,482 17,871,162 12,485,348 72,191 2,646,047 (1,057,443)
Oct 2015 - Sept 2016 - 130,980 2,982,557 92,933 71,158 2,639,498 (1,055,177)
ATTACHMENT B
Monthly Calculation
Sep-14Oct-14Nov-14Dec-14Jan-15Feb-15Mar-15Apr-15
May-15Jun-15Jul-15
Aug-15Sep-15Oct-15Nov-15Dec-15Jan-16Feb-16Mar-16Apr-16
May-16Jun-16Jul-16
Aug-16Sep-16
Annual Summary
20092010201120122013201420152016
Oct 2015 - Sept 2016
PSE&G Carbon Abatement Program Schedule SS-CA-2G
Gas Revenue Requirements Calculation Page 2 of 2
Actual results through April 2015 Monthly WACC effective 07/01/2010 0.9424%
Inc. Tax rate effective 07/01/2010 41.084%
(11) (12) (13) (14) (15) (16) (17) (18) (19)
Accumulated Deferred Income
Tax Net InvestmentReturn
Requirement
Program Investment
RepaymentsAdministrative
costs Capacity Revenue Tax Adjustment Lost RevenuesRevenue
Requirements
6,620,691 12,645,072 119,971 (70,662) 2,736 - (23,912) - 283,423 6,535,132 12,475,341 118,371 (76,596) 28,245 - (28,050) - 297,261 6,449,573 12,305,609 116,772 (69,173) 8,680 - (22,874) - 288,695 6,364,015 12,135,878 115,172 (71,658) 3,957 - (24,607) - 278,155 6,276,703 11,967,899 113,581 (66,922) 7,286 - (21,304) - 287,931 6,189,391 11,799,921 111,998 (65,749) 1,286 - (20,486) - 282,339 6,102,080 11,631,942 110,414 (72,567) 12,029 - (25,241) - 279,925 6,016,654 11,462,077 108,822 (73,288) 7,001 - (25,770) - 272,056 5,929,327 11,294,114 107,231 (65,754) 24,377 - (20,517) - 300,627 5,841,999 11,126,151 105,648 (64,315) 24,377 - (19,513) - 301,487 5,754,672 10,958,188 104,065 (64,281) 24,377 - (19,489) - 299,962 5,667,344 10,790,225 102,482 (64,281) 24,377 - (19,489) - 298,379 5,580,017 10,622,262 100,899 (64,281) 25,746 - (19,489) - 298,165 5,492,689 10,454,299 99,316 (64,281) 25,746 - (19,489) - 296,582 5,405,362 10,286,337 97,733 (64,281) 25,885 - (19,489) - 295,139 5,318,034 10,118,374 96,150 (64,281) 25,885 - (19,489) - 293,556 5,229,653 9,951,465 94,572 (64,281) 6,664 - (19,489) - 272,756 5,141,271 9,784,557 92,999 (64,281) 5,294 - (19,489) - 269,814 5,052,889 9,617,648 91,426 (58,461) 5,294 - (15,431) - 278,120 4,965,254 9,579,881 90,462 (54,511) 5,294 - (12,676) - 284,951 4,877,172 9,410,490 89,485 (51,917) 5,294 - (10,867) - 289,469 4,789,089 9,241,100 87,889 (50,828) 5,294 - (10,108) - 289,721 4,701,006 9,071,709 86,293 (48,355) 5,294 - (8,384) - 292,322 4,612,923 8,902,319 84,696 (45,119) 5,294 - (6,127) - 296,219 4,524,840 8,732,928 83,100 (44,515) 5,294 - (5,706) - 295,647
Prior Month + Col 10 Col 7 - Col 11
(Prior Col 12 + Col 12) / 2
* Monthly Pre Tax WACC
Program Assumption
Program Assumption N/A
See WP-SS-CA-1.xlsx
'AmortG' wksht(Row 1589)
N/A
Col 4 + Col 5 + Col 13 + Col 14 + Col 15 + Col 16 + Col 17 + Col 18
2,687,546 4,109,449 109,292 - 1,214,132 - 6,025 - 1,521,655 3,841,260 6,367,531 500,211 - 23,270 - 25,132 - 1,351,927 7,532,956 13,904,569 1,178,749 (237,900) 725,001 - (4,982) - 3,523,202 8,325,984 15,578,782 1,711,470 (787,204) 308,568 - (270,629) - 3,729,752 7,388,840 14,169,957 1,700,459 (923,007) 200,750 - (339,683) - 3,675,322 6,364,015 12,135,878 1,487,590 (863,284) 61,295 - (297,641) - 3,451,392 5,318,034 10,118,374 1,258,338 (794,281) 228,371 - (249,765) - 3,506,148 4,260,591 8,224,757 1,040,644 (588,337) 49,020 - (106,235) - 3,477,131
1,094,121 (675,110) 126,536 - (166,744) 3,454,295
ATTACHMENT B
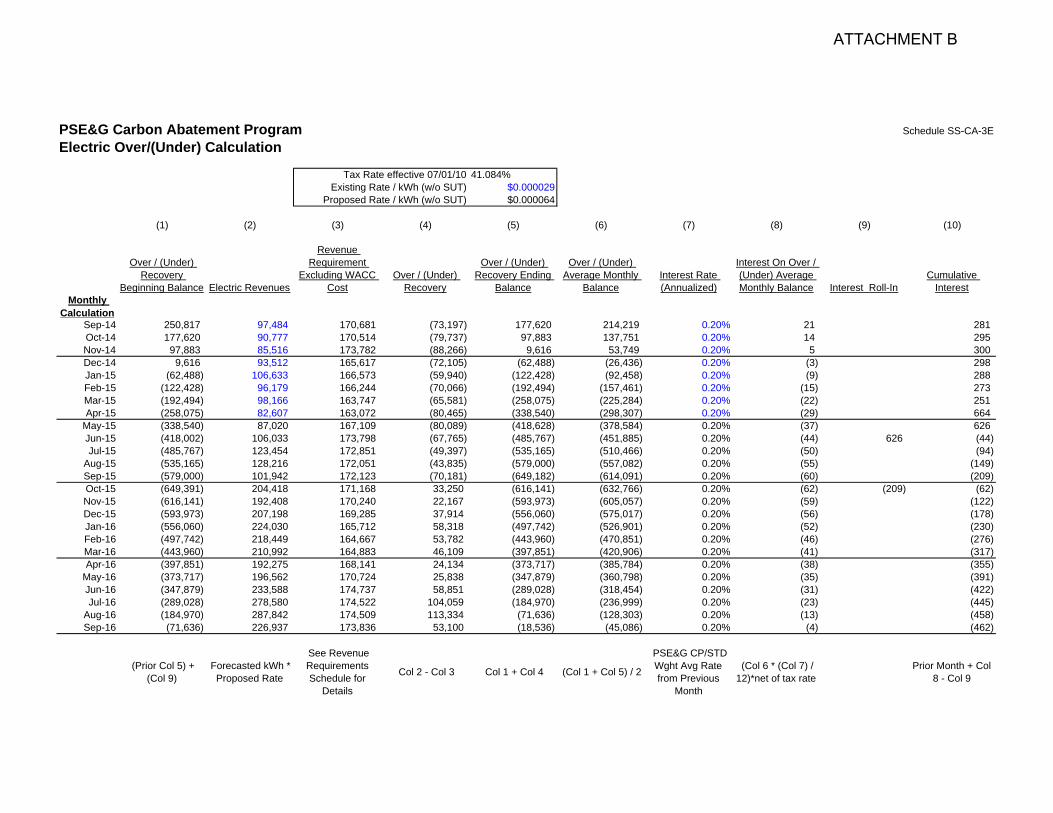
PSE&G Carbon Abatement Program Schedule SS-CA-3E
Electric Over/(Under) Calculation
Tax Rate Tax Rate effective 07/01/10 41.084%Existing Rate / kWh (w/o SUT) $0.000029
Proposed Rate / kWh (w/o SUT) $0.000064
(1) (2) (3) (4) (5) (6) (7) (8) (9) (10)
Over / (Under) Recovery
Beginning Balance Electric Revenues
Revenue Requirement
Excluding WACC Cost
Over / (Under) Recovery
Over / (Under) Recovery Ending
Balance
Over / (Under) Average Monthly
BalanceInterest Rate (Annualized)
Interest On Over / (Under) Average Monthly Balance Interest Roll-In
Cumulative Interest
Monthly Calculation
Sep-14 250,817 97,484 170,681 (73,197) 177,620 214,219 0.20% 21 281 Oct-14 177,620 90,777 170,514 (79,737) 97,883 137,751 0.20% 14 295 Nov-14 97,883 85,516 173,782 (88,266) 9,616 53,749 0.20% 5 300 Dec-14 9,616 93,512 165,617 (72,105) (62,488) (26,436) 0.20% (3) 298 Jan-15 (62,488) 106,633 166,573 (59,940) (122,428) (92,458) 0.20% (9) 288 Feb-15 (122,428) 96,179 166,244 (70,066) (192,494) (157,461) 0.20% (15) 273 Mar-15 (192,494) 98,166 163,747 (65,581) (258,075) (225,284) 0.20% (22) 251 Apr-15 (258,075) 82,607 163,072 (80,465) (338,540) (298,307) 0.20% (29) 664
May-15 (338,540) 87,020 167,109 (80,089) (418,628) (378,584) 0.20% (37) 626 Jun-15 (418,002) 106,033 173,798 (67,765) (485,767) (451,885) 0.20% (44) 626 (44) Jul-15 (485,767) 123,454 172,851 (49,397) (535,165) (510,466) 0.20% (50) (94)
Aug-15 (535,165) 128,216 172,051 (43,835) (579,000) (557,082) 0.20% (55) (149) Sep-15 (579,000) 101,942 172,123 (70,181) (649,182) (614,091) 0.20% (60) (209) Oct-15 (649,391) 204,418 171,168 33,250 (616,141) (632,766) 0.20% (62) (209) (62) Nov-15 (616,141) 192,408 170,240 22,167 (593,973) (605,057) 0.20% (59) (122) Dec-15 (593,973) 207,198 169,285 37,914 (556,060) (575,017) 0.20% (56) (178) Jan-16 (556,060) 224,030 165,712 58,318 (497,742) (526,901) 0.20% (52) (230) Feb-16 (497,742) 218,449 164,667 53,782 (443,960) (470,851) 0.20% (46) (276) Mar-16 (443,960) 210,992 164,883 46,109 (397,851) (420,906) 0.20% (41) (317) Apr-16 (397,851) 192,275 168,141 24,134 (373,717) (385,784) 0.20% (38) (355)
May-16 (373,717) 196,562 170,724 25,838 (347,879) (360,798) 0.20% (35) (391) Jun-16 (347,879) 233,588 174,737 58,851 (289,028) (318,454) 0.20% (31) (422) Jul-16 (289,028) 278,580 174,522 104,059 (184,970) (236,999) 0.20% (23) (445)
Aug-16 (184,970) 287,842 174,509 113,334 (71,636) (128,303) 0.20% (13) (458) Sep-16 (71,636) 226,937 173,836 53,100 (18,536) (45,086) 0.20% (4) (462)
(Prior Col 5) + (Col 9)
Forecasted kWh * Proposed Rate
See Revenue Requirements Schedule for
Details
Col 2 - Col 3 Col 1 + Col 4 (Col 1 + Col 5) / 2
PSE&G CP/STD Wght Avg Rate from Previous
Month
(Col 6 * (Col 7) / 12)*net of tax rate
Prior Month + Col 8 - Col 9
ATTACHMENT B
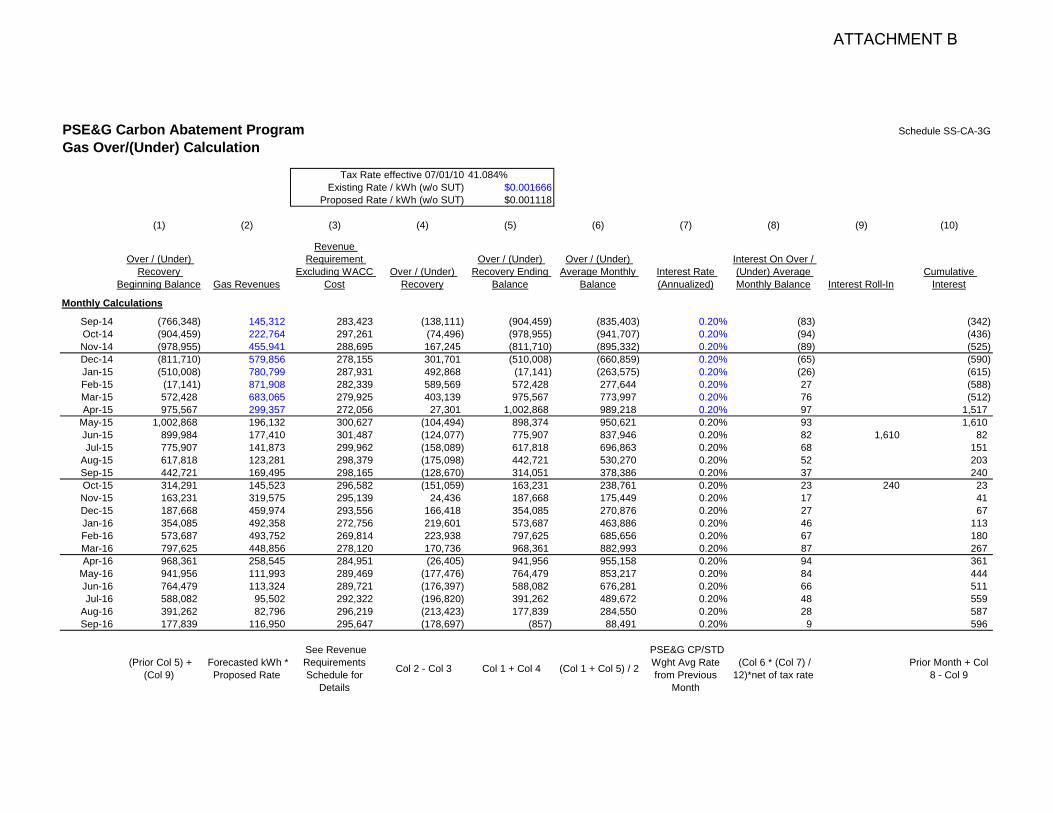
PSE&G Carbon Abatement Program Schedule SS-CA-3G
Gas Over/(Under) Calculation
Tax Rate Tax Rate effective 07/01/10 41.084%Existing Rate / kWh (w/o SUT) $0.001666
Proposed Rate / kWh (w/o SUT) $0.001118
(1) (2) (3) (4) (5) (6) (7) (8) (9) (10)
Over / (Under) Recovery
Beginning Balance Gas Revenues
Revenue Requirement
Excluding WACC Cost
Over / (Under) Recovery
Over / (Under) Recovery Ending
Balance
Over / (Under) Average Monthly
BalanceInterest Rate (Annualized)
Interest On Over / (Under) Average Monthly Balance Interest Roll-In
Cumulative Interest
Monthly Calculations
Sep-14 (766,348) 145,312 283,423 (138,111) (904,459) (835,403) 0.20% (83) (342) Oct-14 (904,459) 222,764 297,261 (74,496) (978,955) (941,707) 0.20% (94) (436) Nov-14 (978,955) 455,941 288,695 167,245 (811,710) (895,332) 0.20% (89) (525) Dec-14 (811,710) 579,856 278,155 301,701 (510,008) (660,859) 0.20% (65) (590) Jan-15 (510,008) 780,799 287,931 492,868 (17,141) (263,575) 0.20% (26) (615) Feb-15 (17,141) 871,908 282,339 589,569 572,428 277,644 0.20% 27 (588) Mar-15 572,428 683,065 279,925 403,139 975,567 773,997 0.20% 76 (512) Apr-15 975,567 299,357 272,056 27,301 1,002,868 989,218 0.20% 97 1,517
May-15 1,002,868 196,132 300,627 (104,494) 898,374 950,621 0.20% 93 1,610 Jun-15 899,984 177,410 301,487 (124,077) 775,907 837,946 0.20% 82 1,610 82 Jul-15 775,907 141,873 299,962 (158,089) 617,818 696,863 0.20% 68 151
Aug-15 617,818 123,281 298,379 (175,098) 442,721 530,270 0.20% 52 203 Sep-15 442,721 169,495 298,165 (128,670) 314,051 378,386 0.20% 37 240 Oct-15 314,291 145,523 296,582 (151,059) 163,231 238,761 0.20% 23 240 23 Nov-15 163,231 319,575 295,139 24,436 187,668 175,449 0.20% 17 41 Dec-15 187,668 459,974 293,556 166,418 354,085 270,876 0.20% 27 67 Jan-16 354,085 492,358 272,756 219,601 573,687 463,886 0.20% 46 113 Feb-16 573,687 493,752 269,814 223,938 797,625 685,656 0.20% 67 180 Mar-16 797,625 448,856 278,120 170,736 968,361 882,993 0.20% 87 267 Apr-16 968,361 258,545 284,951 (26,405) 941,956 955,158 0.20% 94 361
May-16 941,956 111,993 289,469 (177,476) 764,479 853,217 0.20% 84 444 Jun-16 764,479 113,324 289,721 (176,397) 588,082 676,281 0.20% 66 511 Jul-16 588,082 95,502 292,322 (196,820) 391,262 489,672 0.20% 48 559
Aug-16 391,262 82,796 296,219 (213,423) 177,839 284,550 0.20% 28 587 Sep-16 177,839 116,950 295,647 (178,697) (857) 88,491 0.20% 9 596
(Prior Col 5) + (Col 9)
Forecasted kWh * Proposed Rate
See Revenue Requirements Schedule for
Details
Col 2 - Col 3 Col 1 + Col 4 (Col 1 + Col 5) / 2
PSE&G CP/STD Wght Avg Rate from Previous
Month
(Col 6 * (Col 7) / 12)*net of tax rate
Prior Month + Col 8 - Col 9
ATTACHMENT B
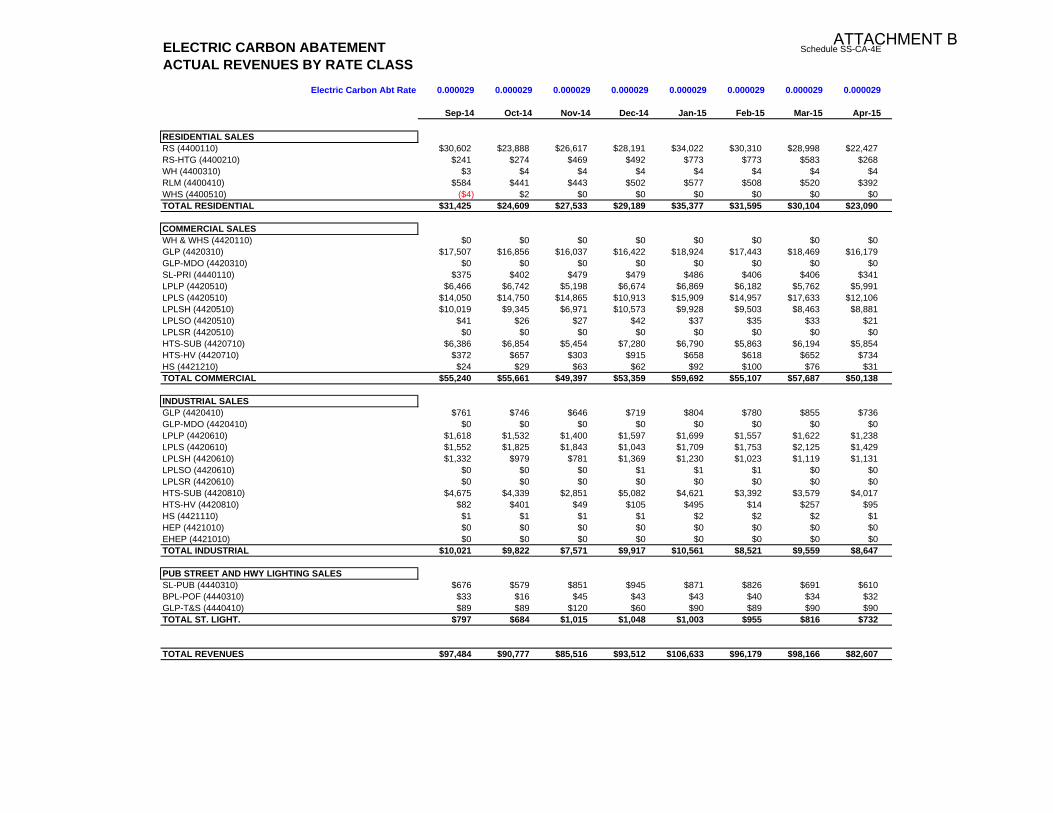
ELECTRIC CARBON ABATEMENT Schedule SS-CA-4E
ACTUAL REVENUES BY RATE CLASSElectric Carbon Abt Rate 0.000029 0.000029 0.000029 0.000029 0.000029 0.000029 0.000029 0.000029
Sep-14 Oct-14 Nov-14 Dec-14 Jan-15 Feb-15 Mar-15 Apr-15
RESIDENTIAL SALESRS (4400110) $30,602 $23,888 $26,617 $28,191 $34,022 $30,310 $28,998 $22,427RS-HTG (4400210) $241 $274 $469 $492 $773 $773 $583 $268WH (4400310) $3 $4 $4 $4 $4 $4 $4 $4RLM (4400410) $584 $441 $443 $502 $577 $508 $520 $392WHS (4400510) ($4) $2 $0 $0 $0 $0 $0 $0TOTAL RESIDENTIAL $31,425 $24,609 $27,533 $29,189 $35,377 $31,595 $30,104 $23,090
COMMERCIAL SALESWH & WHS (4420110) $0 $0 $0 $0 $0 $0 $0 $0GLP (4420310) $17,507 $16,856 $16,037 $16,422 $18,924 $17,443 $18,469 $16,179GLP-MDO (4420310) $0 $0 $0 $0 $0 $0 $0 $0SL-PRI (4440110) $375 $402 $479 $479 $486 $406 $406 $341LPLP (4420510) $6,466 $6,742 $5,198 $6,674 $6,869 $6,182 $5,762 $5,991LPLS (4420510) $14,050 $14,750 $14,865 $10,913 $15,909 $14,957 $17,633 $12,106LPLSH (4420510) $10,019 $9,345 $6,971 $10,573 $9,928 $9,503 $8,463 $8,881LPLSO (4420510) $41 $26 $27 $42 $37 $35 $33 $21LPLSR (4420510) $0 $0 $0 $0 $0 $0 $0 $0HTS-SUB (4420710) $6,386 $6,854 $5,454 $7,280 $6,790 $5,863 $6,194 $5,854HTS-HV (4420710) $372 $657 $303 $915 $658 $618 $652 $734HS (4421210) $24 $29 $63 $62 $92 $100 $76 $31TOTAL COMMERCIAL $55,240 $55,661 $49,397 $53,359 $59,692 $55,107 $57,687 $50,138
INDUSTRIAL SALESGLP (4420410) $761 $746 $646 $719 $804 $780 $855 $736GLP-MDO (4420410) $0 $0 $0 $0 $0 $0 $0 $0LPLP (4420610) $1,618 $1,532 $1,400 $1,597 $1,699 $1,557 $1,622 $1,238LPLS (4420610) $1,552 $1,825 $1,843 $1,043 $1,709 $1,753 $2,125 $1,429LPLSH (4420610) $1,332 $979 $781 $1,369 $1,230 $1,023 $1,119 $1,131LPLSO (4420610) $0 $0 $0 $1 $1 $1 $0 $0LPLSR (4420610) $0 $0 $0 $0 $0 $0 $0 $0HTS-SUB (4420810) $4,675 $4,339 $2,851 $5,082 $4,621 $3,392 $3,579 $4,017HTS-HV (4420810) $82 $401 $49 $105 $495 $14 $257 $95HS (4421110) $1 $1 $1 $1 $2 $2 $2 $1HEP (4421010) $0 $0 $0 $0 $0 $0 $0 $0EHEP (4421010) $0 $0 $0 $0 $0 $0 $0 $0TOTAL INDUSTRIAL $10,021 $9,822 $7,571 $9,917 $10,561 $8,521 $9,559 $8,647
PUB STREET AND HWY LIGHTING SALESSL-PUB (4440310) $676 $579 $851 $945 $871 $826 $691 $610BPL-POF (4440310) $33 $16 $45 $43 $43 $40 $34 $32GLP-T&S (4440410) $89 $89 $120 $60 $90 $89 $90 $90TOTAL ST. LIGHT. $797 $684 $1,015 $1,048 $1,003 $955 $816 $732
TOTAL REVENUES $97,484 $90,777 $85,516 $93,512 $106,633 $96,179 $98,166 $82,607
ATTACHMENT B
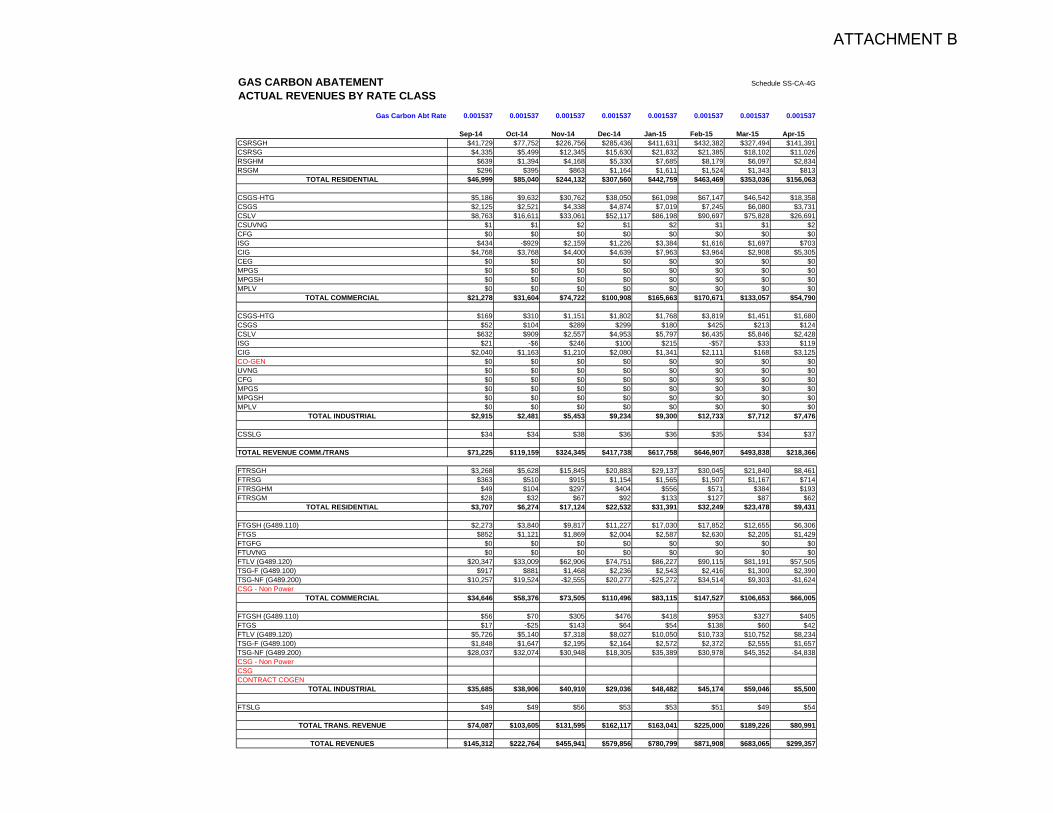
GAS CARBON ABATEMENT Schedule SS-CA-4G
ACTUAL REVENUES BY RATE CLASSGas Carbon Abt Rate 0.001537 0.001537 0.001537 0.001537 0.001537 0.001537 0.001537 0.001537
Sep-14 Oct-14 Nov-14 Dec-14 Jan-15 Feb-15 Mar-15 Apr-15CSRSGH $41,729 $77,752 $226,756 $285,436 $411,631 $432,382 $327,494 $141,391CSRSG $4,335 $5,499 $12,345 $15,630 $21,832 $21,385 $18,102 $11,026RSGHM $639 $1,394 $4,168 $5,330 $7,685 $8,179 $6,097 $2,834RSGM $296 $395 $863 $1,164 $1,611 $1,524 $1,343 $813
TOTAL RESIDENTIAL $46,999 $85,040 $244,132 $307,560 $442,759 $463,469 $353,036 $156,063
CSGS-HTG $5,186 $9,632 $30,762 $38,050 $61,098 $67,147 $46,542 $18,358CSGS $2,125 $2,521 $4,338 $4,874 $7,019 $7,245 $6,080 $3,731CSLV $8,763 $16,611 $33,061 $52,117 $86,198 $90,697 $75,828 $26,691CSUVNG $1 $1 $2 $1 $2 $1 $1 $2CFG $0 $0 $0 $0 $0 $0 $0 $0ISG $434 -$929 $2,159 $1,226 $3,384 $1,616 $1,697 $703CIG $4,768 $3,768 $4,400 $4,639 $7,963 $3,964 $2,908 $5,305CEG $0 $0 $0 $0 $0 $0 $0 $0MPGS $0 $0 $0 $0 $0 $0 $0 $0MPGSH $0 $0 $0 $0 $0 $0 $0 $0MPLV $0 $0 $0 $0 $0 $0 $0 $0
TOTAL COMMERCIAL $21,278 $31,604 $74,722 $100,908 $165,663 $170,671 $133,057 $54,790
CSGS-HTG $169 $310 $1,151 $1,802 $1,768 $3,819 $1,451 $1,680CSGS $52 $104 $289 $299 $180 $425 $213 $124CSLV $632 $909 $2,557 $4,953 $5,797 $6,435 $5,846 $2,428ISG $21 -$6 $246 $100 $215 -$57 $33 $119CIG $2,040 $1,163 $1,210 $2,080 $1,341 $2,111 $168 $3,125CO-GEN $0 $0 $0 $0 $0 $0 $0 $0UVNG $0 $0 $0 $0 $0 $0 $0 $0CFG $0 $0 $0 $0 $0 $0 $0 $0MPGS $0 $0 $0 $0 $0 $0 $0 $0MPGSH $0 $0 $0 $0 $0 $0 $0 $0MPLV $0 $0 $0 $0 $0 $0 $0 $0
TOTAL INDUSTRIAL $2,915 $2,481 $5,453 $9,234 $9,300 $12,733 $7,712 $7,476
CSSLG $34 $34 $38 $36 $36 $35 $34 $37
TOTAL REVENUE COMM./TRANS $71,225 $119,159 $324,345 $417,738 $617,758 $646,907 $493,838 $218,366
FTRSGH $3,268 $5,628 $15,845 $20,883 $29,137 $30,045 $21,840 $8,461FTRSG $363 $510 $915 $1,154 $1,565 $1,507 $1,167 $714FTRSGHM $49 $104 $297 $404 $556 $571 $384 $193FTRSGM $28 $32 $67 $92 $133 $127 $87 $62
TOTAL RESIDENTIAL $3,707 $6,274 $17,124 $22,532 $31,391 $32,249 $23,478 $9,431
FTGSH (G489.110) $2,273 $3,840 $9,817 $11,227 $17,030 $17,852 $12,655 $6,306FTGS $852 $1,121 $1,869 $2,004 $2,587 $2,630 $2,205 $1,429FTGFG $0 $0 $0 $0 $0 $0 $0 $0FTUVNG $0 $0 $0 $0 $0 $0 $0 $0FTLV (G489.120) $20,347 $33,009 $62,906 $74,751 $86,227 $90,115 $81,191 $57,505TSG-F (G489.100) $917 $881 $1,468 $2,236 $2,543 $2,416 $1,300 $2,390TSG-NF (G489.200) $10,257 $19,524 -$2,555 $20,277 -$25,272 $34,514 $9,303 -$1,624CSG - Non Power
TOTAL COMMERCIAL $34,646 $58,376 $73,505 $110,496 $83,115 $147,527 $106,653 $66,005
FTGSH (G489.110) $56 $70 $305 $476 $418 $953 $327 $405FTGS $17 -$25 $143 $64 $54 $138 $60 $42FTLV (G489.120) $5,726 $5,140 $7,318 $8,027 $10,050 $10,733 $10,752 $8,234TSG-F (G489.100) $1,848 $1,647 $2,195 $2,164 $2,572 $2,372 $2,555 $1,657TSG-NF (G489.200) $28,037 $32,074 $30,948 $18,305 $35,389 $30,978 $45,352 -$4,838CSG - Non PowerCSGCONTRACT COGEN
TOTAL INDUSTRIAL $35,685 $38,906 $40,910 $29,036 $48,482 $45,174 $59,046 $5,500
FTSLG $49 $49 $56 $53 $53 $51 $49 $54
TOTAL TRANS. REVENUE $74,087 $103,605 $131,595 $162,117 $163,041 $225,000 $189,226 $80,991
TOTAL REVENUES $145,312 $222,764 $455,941 $579,856 $780,799 $871,908 $683,065 $299,357
ATTACHMENT B
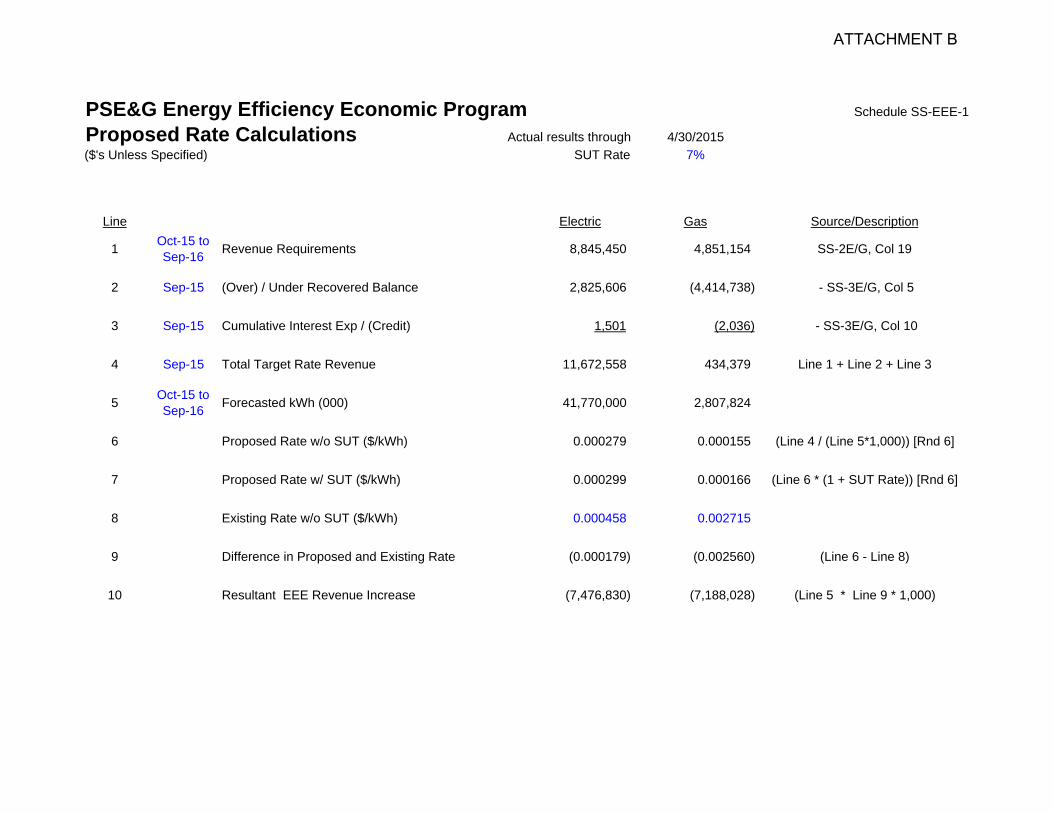
PSE&G Energy Efficiency Economic Program Schedule SS-EEE-1
Proposed Rate Calculations Actual results through 4/30/2015($'s Unless Specified) SUT Rate 7%
Line Electric Gas Source/Description
1 Oct-15 to Sep-16 Revenue Requirements 8,845,450 4,851,154 SS-2E/G, Col 19
2 Sep-15 (Over) / Under Recovered Balance 2,825,606 (4,414,738) - SS-3E/G, Col 5
3 Sep-15 Cumulative Interest Exp / (Credit) 1,501 (2,036) - SS-3E/G, Col 10
4 Sep-15 Total Target Rate Revenue 11,672,558 434,379 Line 1 + Line 2 + Line 3
5 Oct-15 to Sep-16 Forecasted kWh (000) 41,770,000 2,807,824
6 Proposed Rate w/o SUT ($/kWh) 0.000279 0.000155 (Line 4 / (Line 5*1,000)) [Rnd 6]
7 Proposed Rate w/ SUT ($/kWh) 0.000299 0.000166 (Line 6 * (1 + SUT Rate)) [Rnd 6]
8 Existing Rate w/o SUT ($/kWh) 0.000458 0.002715
9 Difference in Proposed and Existing Rate (0.000179) (0.002560) (Line 6 - Line 8)
10 Resultant EEE Revenue Increase (7,476,830) (7,188,028) (Line 5 * Line 9 * 1,000)
ATTACHMENT B
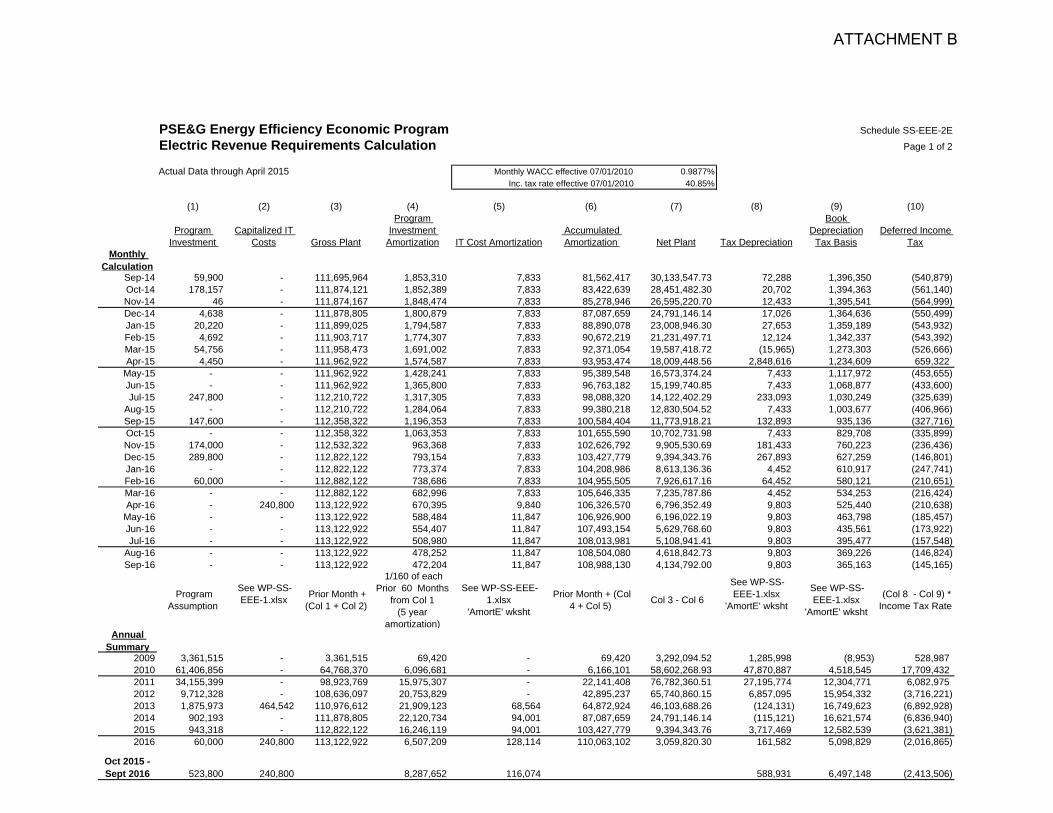
PSE&G Energy Efficiency Economic Program Schedule SS-EEE-2E
Electric Revenue Requirements Calculation Page 1 of 2
Actual Data through April 2015 Monthly WACC effective 07/01/2010 0.9877%Inc. tax rate effective 07/01/2010 40.85%
(1) (2) (3) (4) (5) (6) (7) (8) (9) (10)
Program Investment
Capitalized IT Costs Gross Plant
Program Investment
Amortization IT Cost Amortization Accumulated Amortization Net Plant Tax Depreciation
Book Depreciation
Tax BasisDeferred Income
TaxMonthly
CalculationSep-14 59,900 - 111,695,964 1,853,310 7,833 81,562,417 30,133,547.73 72,288 1,396,350 (540,879) Oct-14 178,157 - 111,874,121 1,852,389 7,833 83,422,639 28,451,482.30 20,702 1,394,363 (561,140) Nov-14 46 - 111,874,167 1,848,474 7,833 85,278,946 26,595,220.70 12,433 1,395,541 (564,999) Dec-14 4,638 - 111,878,805 1,800,879 7,833 87,087,659 24,791,146.14 17,026 1,364,636 (550,499) Jan-15 20,220 - 111,899,025 1,794,587 7,833 88,890,078 23,008,946.30 27,653 1,359,189 (543,932) Feb-15 4,692 - 111,903,717 1,774,307 7,833 90,672,219 21,231,497.71 12,124 1,342,337 (543,392) Mar-15 54,756 - 111,958,473 1,691,002 7,833 92,371,054 19,587,418.72 (15,965) 1,273,303 (526,666) Apr-15 4,450 - 111,962,922 1,574,587 7,833 93,953,474 18,009,448.56 2,848,616 1,234,609 659,322
May-15 - - 111,962,922 1,428,241 7,833 95,389,548 16,573,374.24 7,433 1,117,972 (453,655) Jun-15 - - 111,962,922 1,365,800 7,833 96,763,182 15,199,740.85 7,433 1,068,877 (433,600) Jul-15 247,800 - 112,210,722 1,317,305 7,833 98,088,320 14,122,402.29 233,093 1,030,249 (325,639)
Aug-15 - - 112,210,722 1,284,064 7,833 99,380,218 12,830,504.52 7,433 1,003,677 (406,966) Sep-15 147,600 - 112,358,322 1,196,353 7,833 100,584,404 11,773,918.21 132,893 935,136 (327,716) Oct-15 - - 112,358,322 1,063,353 7,833 101,655,590 10,702,731.98 7,433 829,708 (335,899) Nov-15 174,000 - 112,532,322 963,368 7,833 102,626,792 9,905,530.69 181,433 760,223 (236,436) Dec-15 289,800 - 112,822,122 793,154 7,833 103,427,779 9,394,343.76 267,893 627,259 (146,801) Jan-16 - - 112,822,122 773,374 7,833 104,208,986 8,613,136.36 4,452 610,917 (247,741) Feb-16 60,000 - 112,882,122 738,686 7,833 104,955,505 7,926,617.16 64,452 580,121 (210,651) Mar-16 - - 112,882,122 682,996 7,833 105,646,335 7,235,787.86 4,452 534,253 (216,424) Apr-16 - 240,800 113,122,922 670,395 9,840 106,326,570 6,796,352.49 9,803 525,440 (210,638)
May-16 - - 113,122,922 588,484 11,847 106,926,900 6,196,022.19 9,803 463,798 (185,457) Jun-16 - - 113,122,922 554,407 11,847 107,493,154 5,629,768.60 9,803 435,561 (173,922) Jul-16 - - 113,122,922 508,980 11,847 108,013,981 5,108,941.41 9,803 395,477 (157,548)
Aug-16 - - 113,122,922 478,252 11,847 108,504,080 4,618,842.73 9,803 369,226 (146,824) Sep-16 - - 113,122,922 472,204 11,847 108,988,130 4,134,792.00 9,803 365,163 (145,165)
Program Assumption
See WP-SS-EEE-1.xlsx Prior Month +
(Col 1 + Col 2)
1/160 of each Prior 60 Months
from Col 1(5 year
amortization)
See WP-SS-EEE-1.xlsx
'AmortE' wksht
Prior Month + (Col 4 + Col 5) Col 3 - Col 6
See WP-SS-EEE-1.xlsx
'AmortE' wksht
See WP-SS-EEE-1.xlsx
'AmortE' wksht
(Col 8 - Col 9) * Income Tax Rate
Annual Summary
2009 3,361,515 - 3,361,515 69,420 - 69,420 3,292,094.52 1,285,998 (8,953) 528,987 2010 61,406,856 - 64,768,370 6,096,681 - 6,166,101 58,602,268.93 47,870,887 4,518,545 17,709,432 2011 34,155,399 - 98,923,769 15,975,307 - 22,141,408 76,782,360.51 27,195,774 12,304,771 6,082,975 2012 9,712,328 - 108,636,097 20,753,829 - 42,895,237 65,740,860.15 6,857,095 15,954,332 (3,716,221) 2013 1,875,973 464,542 110,976,612 21,909,123 68,564 64,872,924 46,103,688.26 (124,131) 16,749,623 (6,892,928) 2014 902,193 - 111,878,805 22,120,734 94,001 87,087,659 24,791,146.14 (115,121) 16,621,574 (6,836,940) 2015 943,318 - 112,822,122 16,246,119 94,001 103,427,779 9,394,343.76 3,717,469 12,582,539 (3,621,381) 2016 60,000 240,800 113,122,922 6,507,209 128,114 110,063,102 3,059,820.30 161,582 5,098,829 (2,016,865)
Oct 2015 - Sept 2016 523,800 240,800 8,287,652 116,074 588,931 6,497,148 (2,413,506)
ATTACHMENT B
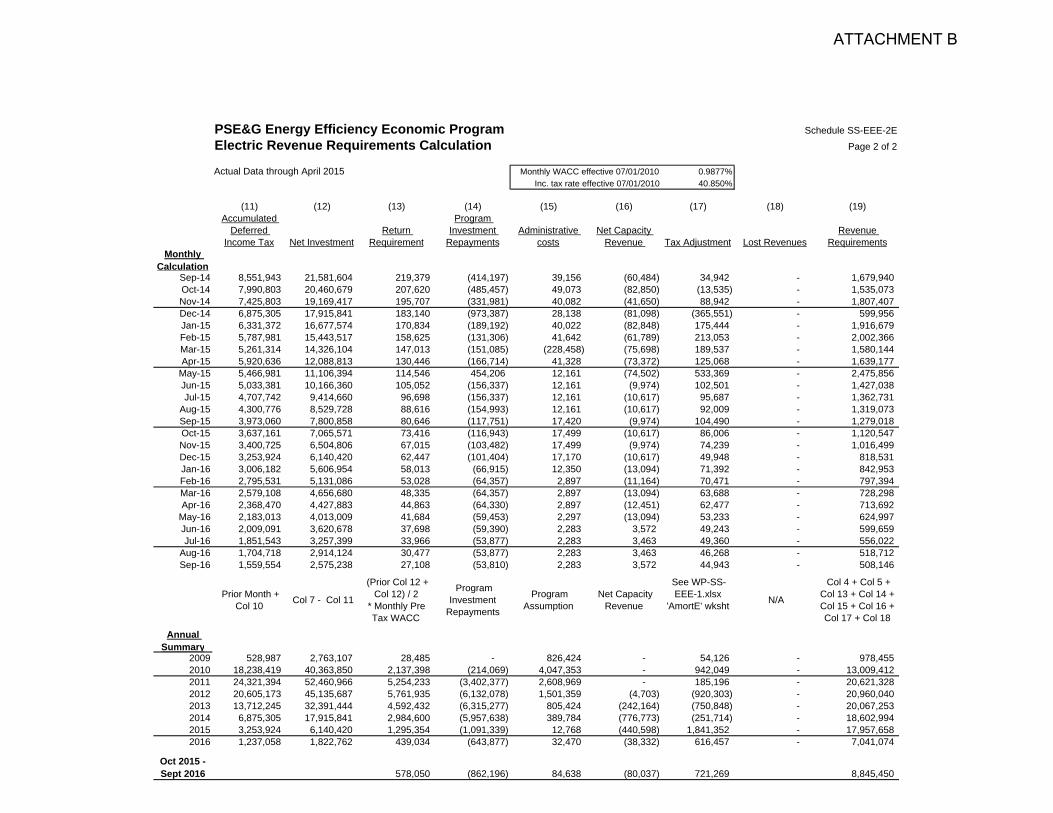
Monthly Calculation
Sep-14Oct-14Nov-14Dec-14Jan-15Feb-15Mar-15Apr-15
May-15Jun-15Jul-15
Aug-15Sep-15Oct-15Nov-15Dec-15Jan-16Feb-16Mar-16Apr-16
May-16Jun-16Jul-16
Aug-16Sep-16
Annual Summary
20092010201120122013201420152016
Oct 2015 - Sept 2016
PSE&G Energy Efficiency Economic Program Schedule SS-EEE-2E
Electric Revenue Requirements Calculation Page 2 of 2
Actual Data through April 2015 Monthly WACC effective 07/01/2010 0.9877%Inc. tax rate effective 07/01/2010 40.850%
(11) (12) (13) (14) (15) (16) (17) (18) (19)Accumulated
Deferred Income Tax Net Investment
Return Requirement
Program Investment
RepaymentsAdministrative
costsNet Capacity
Revenue Tax Adjustment Lost RevenuesRevenue
Requirements
8,551,943 21,581,604 219,379 (414,197) 39,156 (60,484) 34,942 - 1,679,940 7,990,803 20,460,679 207,620 (485,457) 49,073 (82,850) (13,535) - 1,535,073 7,425,803 19,169,417 195,707 (331,981) 40,082 (41,650) 88,942 - 1,807,407 6,875,305 17,915,841 183,140 (973,387) 28,138 (81,098) (365,551) - 599,956 6,331,372 16,677,574 170,834 (189,192) 40,022 (82,848) 175,444 - 1,916,679 5,787,981 15,443,517 158,625 (131,306) 41,642 (61,789) 213,053 - 2,002,366 5,261,314 14,326,104 147,013 (151,085) (228,458) (75,698) 189,537 - 1,580,144 5,920,636 12,088,813 130,446 (166,714) 41,328 (73,372) 125,068 - 1,639,177 5,466,981 11,106,394 114,546 454,206 12,161 (74,502) 533,369 - 2,475,856 5,033,381 10,166,360 105,052 (156,337) 12,161 (9,974) 102,501 - 1,427,038 4,707,742 9,414,660 96,698 (156,337) 12,161 (10,617) 95,687 - 1,362,731 4,300,776 8,529,728 88,616 (154,993) 12,161 (10,617) 92,009 - 1,319,073 3,973,060 7,800,858 80,646 (117,751) 17,420 (9,974) 104,490 - 1,279,018 3,637,161 7,065,571 73,416 (116,943) 17,499 (10,617) 86,006 - 1,120,547 3,400,725 6,504,806 67,015 (103,482) 17,499 (9,974) 74,239 - 1,016,499 3,253,924 6,140,420 62,447 (101,404) 17,170 (10,617) 49,948 - 818,531 3,006,182 5,606,954 58,013 (66,915) 12,350 (13,094) 71,392 - 842,953 2,795,531 5,131,086 53,028 (64,357) 2,897 (11,164) 70,471 - 797,394 2,579,108 4,656,680 48,335 (64,357) 2,897 (13,094) 63,688 - 728,298 2,368,470 4,427,883 44,863 (64,330) 2,897 (12,451) 62,477 - 713,692 2,183,013 4,013,009 41,684 (59,453) 2,297 (13,094) 53,233 - 624,997 2,009,091 3,620,678 37,698 (59,390) 2,283 3,572 49,243 - 599,659 1,851,543 3,257,399 33,966 (53,877) 2,283 3,463 49,360 - 556,022 1,704,718 2,914,124 30,477 (53,877) 2,283 3,463 46,268 - 518,712 1,559,554 2,575,238 27,108 (53,810) 2,283 3,572 44,943 - 508,146
Prior Month + Col 10 Col 7 - Col 11
(Prior Col 12 + Col 12) / 2
* Monthly Pre Tax WACC
Program Investment
Repayments
Program Assumption
Net Capacity Revenue
See WP-SS-EEE-1.xlsx
'AmortE' wksht N/A
Col 4 + Col 5 + Col 13 + Col 14 + Col 15 + Col 16 + Col 17 + Col 18
528,987 2,763,107 28,485 - 826,424 - 54,126 - 978,455 18,238,419 40,363,850 2,137,398 (214,069) 4,047,353 - 942,049 - 13,009,412 24,321,394 52,460,966 5,254,233 (3,402,377) 2,608,969 - 185,196 - 20,621,328 20,605,173 45,135,687 5,761,935 (6,132,078) 1,501,359 (4,703) (920,303) - 20,960,040 13,712,245 32,391,444 4,592,432 (6,315,277) 805,424 (242,164) (750,848) - 20,067,253 6,875,305 17,915,841 2,984,600 (5,957,638) 389,784 (776,773) (251,714) - 18,602,994 3,253,924 6,140,420 1,295,354 (1,091,339) 12,768 (440,598) 1,841,352 - 17,957,658 1,237,058 1,822,762 439,034 (643,877) 32,470 (38,332) 616,457 - 7,041,074
578,050 (862,196) 84,638 (80,037) 721,269 8,845,450
ATTACHMENT B
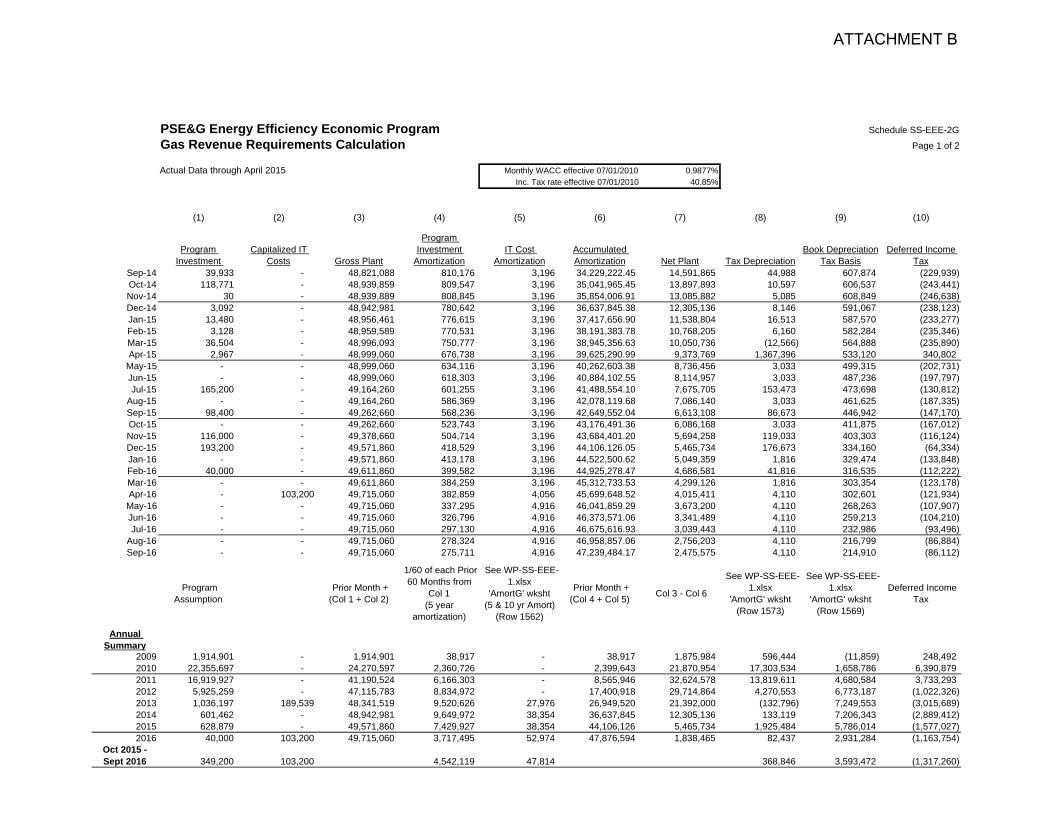
PSE&G Energy Efficiency Economic Program Schedule SS-EEE-2G
Gas Revenue Requirements Calculation Page 1 of 2
Actual Data through April 2015 Monthly WACC effective 07/01/2010 0.9877%Inc. Tax rate effective 07/01/2010 40.85%
(1) (2) (3) (4) (5) (6) (7) (8) (9) (10)
Program Investment
Capitalized IT Costs Gross Plant
Program Investment
AmortizationIT Cost
AmortizationAccumulated Amortization Net Plant Tax Depreciation
Book DepreciationTax Basis
Deferred Income Tax
Sep-14 39,933 - 48,821,088 810,176 3,196 34,229,222.45 14,591,865 44,988 607,874 (229,939) Oct-14 118,771 - 48,939,859 809,547 3,196 35,041,965.45 13,897,893 10,597 606,537 (243,441) Nov-14 30 - 48,939,889 808,845 3,196 35,854,006.91 13,085,882 5,085 608,849 (246,638) Dec-14 3,092 - 48,942,981 780,642 3,196 36,637,845.38 12,305,136 8,146 591,067 (238,123) Jan-15 13,480 - 48,956,461 776,615 3,196 37,417,656.90 11,538,804 16,513 587,570 (233,277) Feb-15 3,128 - 48,959,589 770,531 3,196 38,191,383.78 10,768,205 6,160 582,284 (235,346) Mar-15 36,504 - 48,996,093 750,777 3,196 38,945,356.63 10,050,736 (12,566) 564,888 (235,890) Apr-15 2,967 - 48,999,060 676,738 3,196 39,625,290.99 9,373,769 1,367,396 533,120 340,802 May-15 - - 48,999,060 634,116 3,196 40,262,603.38 8,736,456 3,033 499,315 (202,731) Jun-15 - - 48,999,060 618,303 3,196 40,884,102.55 8,114,957 3,033 487,236 (197,797) Jul-15 165,200 - 49,164,260 601,255 3,196 41,488,554.10 7,675,705 153,473 473,698 (130,812)
Aug-15 - - 49,164,260 586,369 3,196 42,078,119.68 7,086,140 3,033 461,625 (187,335) Sep-15 98,400 - 49,262,660 568,236 3,196 42,649,552.04 6,613,108 86,673 446,942 (147,170) Oct-15 - - 49,262,660 523,743 3,196 43,176,491.36 6,086,168 3,033 411,875 (167,012) Nov-15 116,000 - 49,378,660 504,714 3,196 43,684,401.20 5,694,258 119,033 403,303 (116,124) Dec-15 193,200 - 49,571,860 418,529 3,196 44,106,126.05 5,465,734 176,673 334,160 (64,334) Jan-16 - - 49,571,860 413,178 3,196 44,522,500.62 5,049,359 1,816 329,474 (133,848) Feb-16 40,000 - 49,611,860 399,582 3,196 44,925,278.47 4,686,581 41,816 316,535 (112,222) Mar-16 - - 49,611,860 384,259 3,196 45,312,733.53 4,299,126 1,816 303,354 (123,178) Apr-16 - 103,200 49,715,060 382,859 4,056 45,699,648.52 4,015,411 4,110 302,601 (121,934) May-16 - - 49,715,060 337,295 4,916 46,041,859.29 3,673,200 4,110 268,263 (107,907) Jun-16 - - 49,715,060 326,796 4,916 46,373,571.06 3,341,489 4,110 259,213 (104,210) Jul-16 - - 49,715,060 297,130 4,916 46,675,616.93 3,039,443 4,110 232,986 (93,496)
Aug-16 - - 49,715,060 278,324 4,916 46,958,857.06 2,756,203 4,110 216,799 (86,884) Sep-16 - - 49,715,060 275,711 4,916 47,239,484.17 2,475,575 4,110 214,910 (86,112)
Program Assumption
Prior Month + (Col 1 + Col 2)
1/60 of each Prior 60 Months from
Col 1(5 year
amortization)
See WP-SS-EEE-1.xlsx
'AmortG' wksht(5 & 10 yr Amort)
(Row 1562)
Prior Month + (Col 4 + Col 5) Col 3 - Col 6
See WP-SS-EEE-1.xlsx
'AmortG' wksht(Row 1573)
See WP-SS-EEE-1.xlsx
'AmortG' wksht(Row 1569)
Deferred Income Tax
Annual Summary
2009 1,914,901 - 1,914,901 38,917 - 38,917 1,875,984 596,444 (11,859) 248,492 2010 22,355,697 - 24,270,597 2,360,726 - 2,399,643 21,870,954 17,303,534 1,658,786 6,390,879 2011 16,919,927 - 41,190,524 6,166,303 - 8,565,946 32,624,578 13,819,611 4,680,584 3,733,293 2012 5,925,259 - 47,115,783 8,834,972 - 17,400,918 29,714,864 4,270,553 6,773,187 (1,022,326) 2013 1,036,197 189,539 48,341,519 9,520,626 27,976 26,949,520 21,392,000 (132,796) 7,249,553 (3,015,689) 2014 601,462 - 48,942,981 9,649,972 38,354 36,637,845 12,305,136 133,119 7,206,343 (2,889,412) 2015 628,879 - 49,571,860 7,429,927 38,354 44,106,126 5,465,734 1,925,484 5,786,014 (1,577,027) 2016 40,000 103,200 49,715,060 3,717,495 52,974 47,876,594 1,838,465 82,437 2,931,284 (1,163,754)
Oct 2015 - Sept 2016 349,200 103,200 4,542,119 47,814 368,846 3,593,472 (1,317,260)
ATTACHMENT B
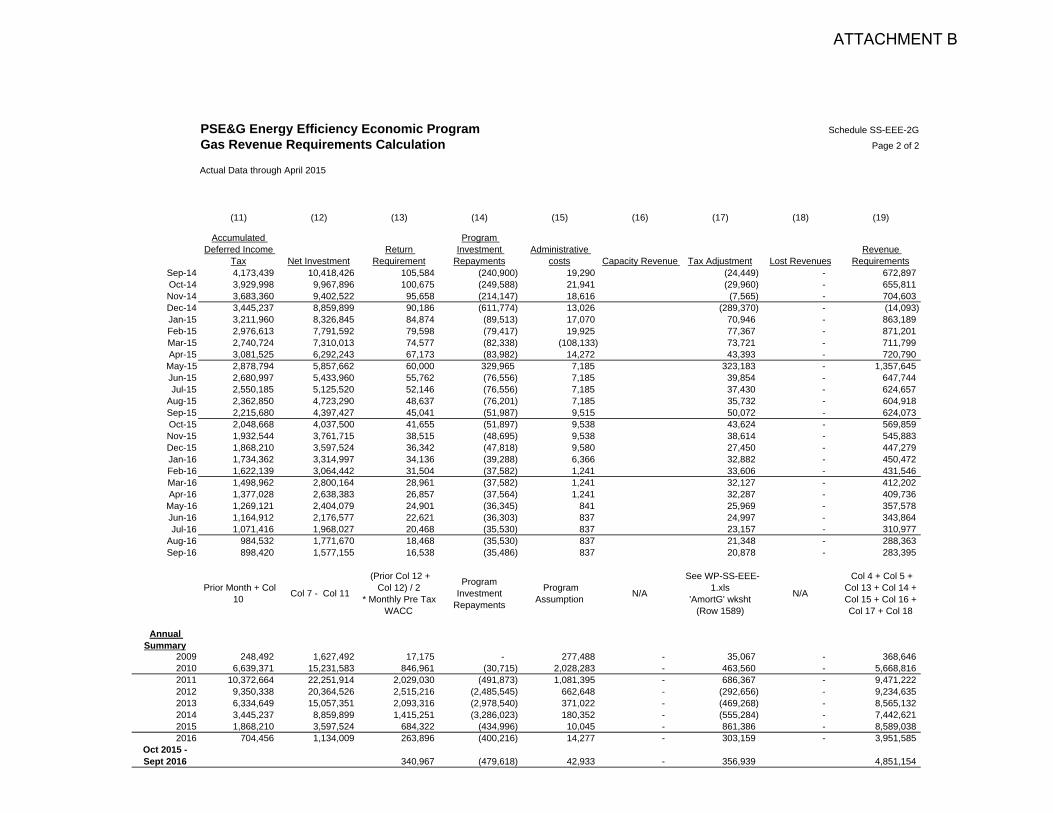
Sep-14Oct-14Nov-14Dec-14Jan-15Feb-15Mar-15Apr-15May-15Jun-15Jul-15
Aug-15Sep-15Oct-15Nov-15Dec-15Jan-16Feb-16Mar-16Apr-16May-16Jun-16Jul-16
Aug-16Sep-16
Annual Summary
20092010201120122013201420152016
Oct 2015 - Sept 2016
PSE&G Energy Efficiency Economic Program Schedule SS-EEE-2G
Gas Revenue Requirements Calculation Page 2 of 2
Actual Data through April 2015
(11) (12) (13) (14) (15) (16) (17) (18) (19)
Accumulated Deferred Income
Tax Net InvestmentReturn
Requirement
Program Investment
RepaymentsAdministrative
costs Capacity Revenue Tax Adjustment Lost RevenuesRevenue
Requirements4,173,439 10,418,426 105,584 (240,900) 19,290 (24,449) - 672,897 3,929,998 9,967,896 100,675 (249,588) 21,941 (29,960) - 655,811 3,683,360 9,402,522 95,658 (214,147) 18,616 (7,565) - 704,603 3,445,237 8,859,899 90,186 (611,774) 13,026 (289,370) - (14,093) 3,211,960 8,326,845 84,874 (89,513) 17,070 70,946 - 863,189 2,976,613 7,791,592 79,598 (79,417) 19,925 77,367 - 871,201 2,740,724 7,310,013 74,577 (82,338) (108,133) 73,721 - 711,799 3,081,525 6,292,243 67,173 (83,982) 14,272 43,393 - 720,790 2,878,794 5,857,662 60,000 329,965 7,185 323,183 - 1,357,645 2,680,997 5,433,960 55,762 (76,556) 7,185 39,854 - 647,744 2,550,185 5,125,520 52,146 (76,556) 7,185 37,430 - 624,657 2,362,850 4,723,290 48,637 (76,201) 7,185 35,732 - 604,918 2,215,680 4,397,427 45,041 (51,987) 9,515 50,072 - 624,073 2,048,668 4,037,500 41,655 (51,897) 9,538 43,624 - 569,859 1,932,544 3,761,715 38,515 (48,695) 9,538 38,614 - 545,883 1,868,210 3,597,524 36,342 (47,818) 9,580 27,450 - 447,279 1,734,362 3,314,997 34,136 (39,288) 6,366 32,882 - 450,472 1,622,139 3,064,442 31,504 (37,582) 1,241 33,606 - 431,546 1,498,962 2,800,164 28,961 (37,582) 1,241 32,127 - 412,202 1,377,028 2,638,383 26,857 (37,564) 1,241 32,287 - 409,736 1,269,121 2,404,079 24,901 (36,345) 841 25,969 - 357,578 1,164,912 2,176,577 22,621 (36,303) 837 24,997 - 343,864 1,071,416 1,968,027 20,468 (35,530) 837 23,157 - 310,977
984,532 1,771,670 18,468 (35,530) 837 21,348 - 288,363 898,420 1,577,155 16,538 (35,486) 837 20,878 - 283,395
Prior Month + Col 10 Col 7 - Col 11
(Prior Col 12 + Col 12) / 2
* Monthly Pre Tax WACC
Program Investment
Repayments
Program Assumption N/A
See WP-SS-EEE-1.xls
'AmortG' wksht(Row 1589)
N/A
Col 4 + Col 5 + Col 13 + Col 14 + Col 15 + Col 16 + Col 17 + Col 18
248,492 1,627,492 17,175 - 277,488 - 35,067 - 368,646 6,639,371 15,231,583 846,961 (30,715) 2,028,283 - 463,560 - 5,668,816
10,372,664 22,251,914 2,029,030 (491,873) 1,081,395 - 686,367 - 9,471,222 9,350,338 20,364,526 2,515,216 (2,485,545) 662,648 - (292,656) - 9,234,635 6,334,649 15,057,351 2,093,316 (2,978,540) 371,022 - (469,268) - 8,565,132 3,445,237 8,859,899 1,415,251 (3,286,023) 180,352 - (555,284) - 7,442,621 1,868,210 3,597,524 684,322 (434,996) 10,045 - 861,386 - 8,589,038
704,456 1,134,009 263,896 (400,216) 14,277 - 303,159 - 3,951,585
340,967 (479,618) 42,933 - 356,939 4,851,154
ATTACHMENT B
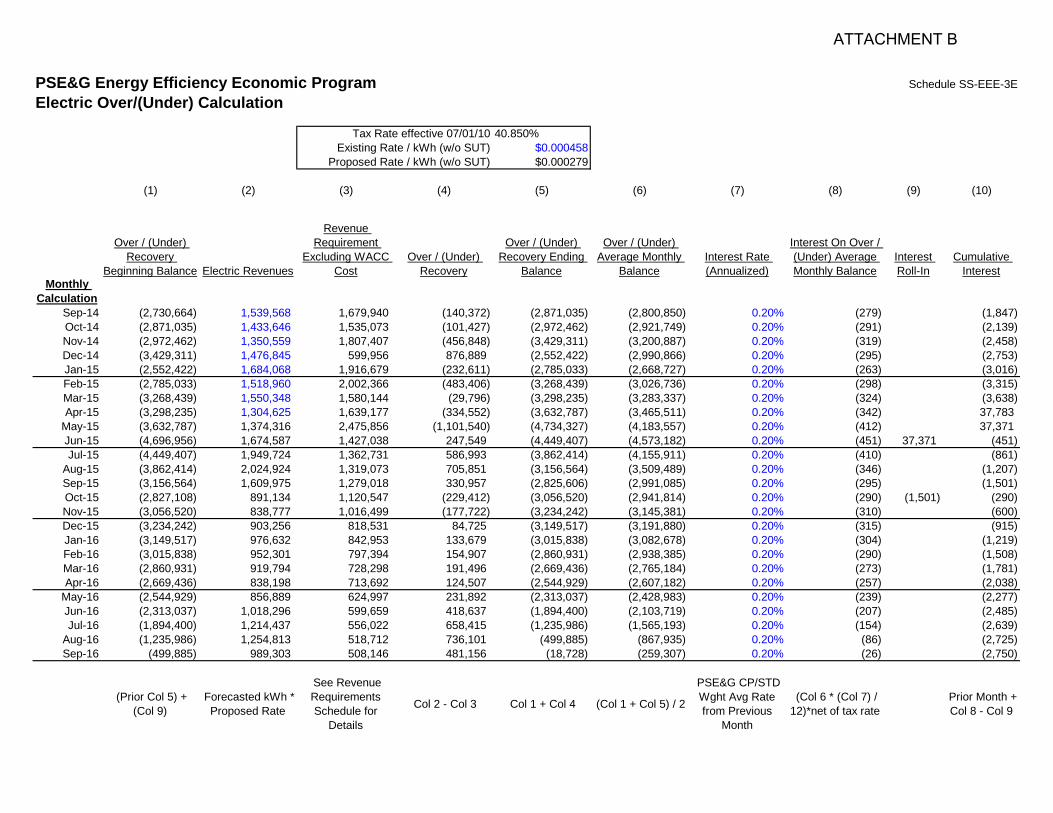
PSE&G Energy Efficiency Economic Program Schedule SS-EEE-3E
Electric Over/(Under) CalculationTax Rate prior to 07/01/10 41.084%
Tax Rate effective 07/01/10 40.850%Existing Rate / kWh (w/o SUT) $0.000458
Proposed Rate / kWh (w/o SUT) $0.000279
(1) (2) (3) (4) (5) (6) (7) (8) (9) (10)
Over / (Under) Recovery
Beginning Balance Electric Revenues
Revenue Requirement
Excluding WACC Cost
Over / (Under) Recovery
Over / (Under) Recovery Ending
Balance
Over / (Under) Average Monthly
BalanceInterest Rate (Annualized)
Interest On Over / (Under) Average Monthly Balance
Interest Roll-In
Cumulative Interest
Monthly Calculation
Sep-14 (2,730,664) 1,539,568 1,679,940 (140,372) (2,871,035) (2,800,850) 0.20% (279) (1,847) Oct-14 (2,871,035) 1,433,646 1,535,073 (101,427) (2,972,462) (2,921,749) 0.20% (291) (2,139) Nov-14 (2,972,462) 1,350,559 1,807,407 (456,848) (3,429,311) (3,200,887) 0.20% (319) (2,458) Dec-14 (3,429,311) 1,476,845 599,956 876,889 (2,552,422) (2,990,866) 0.20% (295) (2,753) Jan-15 (2,552,422) 1,684,068 1,916,679 (232,611) (2,785,033) (2,668,727) 0.20% (263) (3,016) Feb-15 (2,785,033) 1,518,960 2,002,366 (483,406) (3,268,439) (3,026,736) 0.20% (298) (3,315) Mar-15 (3,268,439) 1,550,348 1,580,144 (29,796) (3,298,235) (3,283,337) 0.20% (324) (3,638) Apr-15 (3,298,235) 1,304,625 1,639,177 (334,552) (3,632,787) (3,465,511) 0.20% (342) 37,783
May-15 (3,632,787) 1,374,316 2,475,856 (1,101,540) (4,734,327) (4,183,557) 0.20% (412) 37,371 Jun-15 (4,696,956) 1,674,587 1,427,038 247,549 (4,449,407) (4,573,182) 0.20% (451) 37,371 (451) Jul-15 (4,449,407) 1,949,724 1,362,731 586,993 (3,862,414) (4,155,911) 0.20% (410) (861)
Aug-15 (3,862,414) 2,024,924 1,319,073 705,851 (3,156,564) (3,509,489) 0.20% (346) (1,207) Sep-15 (3,156,564) 1,609,975 1,279,018 330,957 (2,825,606) (2,991,085) 0.20% (295) (1,501) Oct-15 (2,827,108) 891,134 1,120,547 (229,412) (3,056,520) (2,941,814) 0.20% (290) (1,501) (290) Nov-15 (3,056,520) 838,777 1,016,499 (177,722) (3,234,242) (3,145,381) 0.20% (310) (600) Dec-15 (3,234,242) 903,256 818,531 84,725 (3,149,517) (3,191,880) 0.20% (315) (915) Jan-16 (3,149,517) 976,632 842,953 133,679 (3,015,838) (3,082,678) 0.20% (304) (1,219) Feb-16 (3,015,838) 952,301 797,394 154,907 (2,860,931) (2,938,385) 0.20% (290) (1,508) Mar-16 (2,860,931) 919,794 728,298 191,496 (2,669,436) (2,765,184) 0.20% (273) (1,781) Apr-16 (2,669,436) 838,198 713,692 124,507 (2,544,929) (2,607,182) 0.20% (257) (2,038)
May-16 (2,544,929) 856,889 624,997 231,892 (2,313,037) (2,428,983) 0.20% (239) (2,277) Jun-16 (2,313,037) 1,018,296 599,659 418,637 (1,894,400) (2,103,719) 0.20% (207) (2,485) Jul-16 (1,894,400) 1,214,437 556,022 658,415 (1,235,986) (1,565,193) 0.20% (154) (2,639)
Aug-16 (1,235,986) 1,254,813 518,712 736,101 (499,885) (867,935) 0.20% (86) (2,725) Sep-16 (499,885) 989,303 508,146 481,156 (18,728) (259,307) 0.20% (26) (2,750)
(Prior Col 5) + (Col 9)
Forecasted kWh * Proposed Rate
See Revenue Requirements Schedule for
Details
Col 2 - Col 3 Col 1 + Col 4 (Col 1 + Col 5) / 2
PSE&G CP/STD Wght Avg Rate from Previous
Month
(Col 6 * (Col 7) / 12)*net of tax rate
Prior Month + Col 8 - Col 9
ATTACHMENT B
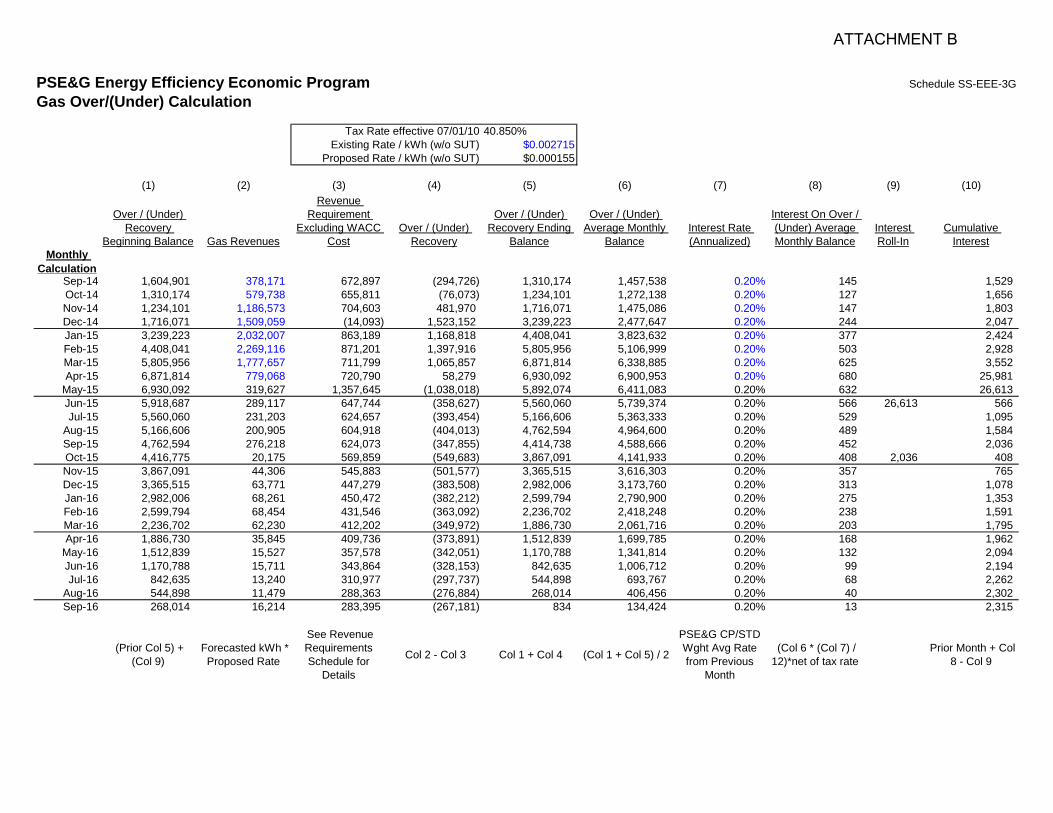
PSE&G Energy Efficiency Economic Program Schedule SS-EEE-3G
Gas Over/(Under) CalculationTax Rate prior to 07/01/10 41.084%
Tax Rate effective 07/01/10 40.850%Existing Rate / kWh (w/o SUT) $0.002715
Proposed Rate / kWh (w/o SUT) $0.000155
(1) (2) (3) (4) (5) (6) (7) (8) (9) (10)
Over / (Under) Recovery
Beginning Balance Gas Revenues
Revenue Requirement
Excluding WACC Cost
Over / (Under) Recovery
Over / (Under) Recovery Ending
Balance
Over / (Under) Average Monthly
BalanceInterest Rate (Annualized)
Interest On Over / (Under) Average Monthly Balance
Interest Roll-In
Cumulative Interest
Monthly Calculation
Sep-14 1,604,901 378,171 672,897 (294,726) 1,310,174 1,457,538 0.20% 145 1,529 Oct-14 1,310,174 579,738 655,811 (76,073) 1,234,101 1,272,138 0.20% 127 1,656 Nov-14 1,234,101 1,186,573 704,603 481,970 1,716,071 1,475,086 0.20% 147 1,803 Dec-14 1,716,071 1,509,059 (14,093) 1,523,152 3,239,223 2,477,647 0.20% 244 2,047 Jan-15 3,239,223 2,032,007 863,189 1,168,818 4,408,041 3,823,632 0.20% 377 2,424 Feb-15 4,408,041 2,269,116 871,201 1,397,916 5,805,956 5,106,999 0.20% 503 2,928 Mar-15 5,805,956 1,777,657 711,799 1,065,857 6,871,814 6,338,885 0.20% 625 3,552 Apr-15 6,871,814 779,068 720,790 58,279 6,930,092 6,900,953 0.20% 680 25,981
May-15 6,930,092 319,627 1,357,645 (1,038,018) 5,892,074 6,411,083 0.20% 632 26,613 Jun-15 5,918,687 289,117 647,744 (358,627) 5,560,060 5,739,374 0.20% 566 26,613 566 Jul-15 5,560,060 231,203 624,657 (393,454) 5,166,606 5,363,333 0.20% 529 1,095
Aug-15 5,166,606 200,905 604,918 (404,013) 4,762,594 4,964,600 0.20% 489 1,584 Sep-15 4,762,594 276,218 624,073 (347,855) 4,414,738 4,588,666 0.20% 452 2,036 Oct-15 4,416,775 20,175 569,859 (549,683) 3,867,091 4,141,933 0.20% 408 2,036 408 Nov-15 3,867,091 44,306 545,883 (501,577) 3,365,515 3,616,303 0.20% 357 765 Dec-15 3,365,515 63,771 447,279 (383,508) 2,982,006 3,173,760 0.20% 313 1,078 Jan-16 2,982,006 68,261 450,472 (382,212) 2,599,794 2,790,900 0.20% 275 1,353 Feb-16 2,599,794 68,454 431,546 (363,092) 2,236,702 2,418,248 0.20% 238 1,591 Mar-16 2,236,702 62,230 412,202 (349,972) 1,886,730 2,061,716 0.20% 203 1,795 Apr-16 1,886,730 35,845 409,736 (373,891) 1,512,839 1,699,785 0.20% 168 1,962
May-16 1,512,839 15,527 357,578 (342,051) 1,170,788 1,341,814 0.20% 132 2,094 Jun-16 1,170,788 15,711 343,864 (328,153) 842,635 1,006,712 0.20% 99 2,194 Jul-16 842,635 13,240 310,977 (297,737) 544,898 693,767 0.20% 68 2,262
Aug-16 544,898 11,479 288,363 (276,884) 268,014 406,456 0.20% 40 2,302 Sep-16 268,014 16,214 283,395 (267,181) 834 134,424 0.20% 13 2,315
(Prior Col 5) + (Col 9)
Forecasted kWh * Proposed Rate
See Revenue Requirements Schedule for
Details
Col 2 - Col 3 Col 1 + Col 4 (Col 1 + Col 5) / 2
PSE&G CP/STD Wght Avg Rate from Previous
Month
(Col 6 * (Col 7) / 12)*net of tax rate
Prior Month + Col 8 - Col 9
ATTACHMENT B
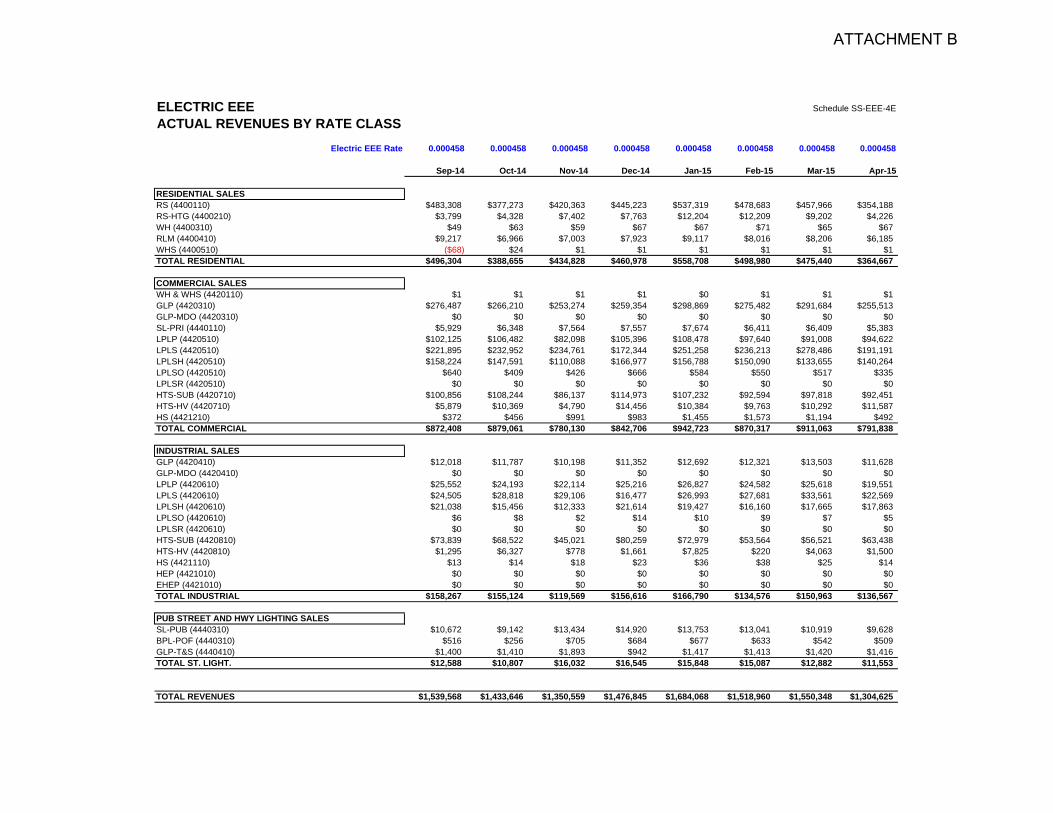
ELECTRIC EEE Schedule SS-EEE-4E
ACTUAL REVENUES BY RATE CLASSElectric EEE Rate 0.000458 0.000458 0.000458 0.000458 0.000458 0.000458 0.000458 0.000458
Sep-14 Oct-14 Nov-14 Dec-14 Jan-15 Feb-15 Mar-15 Apr-15
RESIDENTIAL SALESRS (4400110) $483,308 $377,273 $420,363 $445,223 $537,319 $478,683 $457,966 $354,188RS-HTG (4400210) $3,799 $4,328 $7,402 $7,763 $12,204 $12,209 $9,202 $4,226WH (4400310) $49 $63 $59 $67 $67 $71 $65 $67RLM (4400410) $9,217 $6,966 $7,003 $7,923 $9,117 $8,016 $8,206 $6,185WHS (4400510) ($68) $24 $1 $1 $1 $1 $1 $1TOTAL RESIDENTIAL $496,304 $388,655 $434,828 $460,978 $558,708 $498,980 $475,440 $364,667
COMMERCIAL SALESWH & WHS (4420110) $1 $1 $1 $1 $0 $1 $1 $1GLP (4420310) $276,487 $266,210 $253,274 $259,354 $298,869 $275,482 $291,684 $255,513GLP-MDO (4420310) $0 $0 $0 $0 $0 $0 $0 $0SL-PRI (4440110) $5,929 $6,348 $7,564 $7,557 $7,674 $6,411 $6,409 $5,383LPLP (4420510) $102,125 $106,482 $82,098 $105,396 $108,478 $97,640 $91,008 $94,622LPLS (4420510) $221,895 $232,952 $234,761 $172,344 $251,258 $236,213 $278,486 $191,191LPLSH (4420510) $158,224 $147,591 $110,088 $166,977 $156,788 $150,090 $133,655 $140,264LPLSO (4420510) $640 $409 $426 $666 $584 $550 $517 $335LPLSR (4420510) $0 $0 $0 $0 $0 $0 $0 $0HTS-SUB (4420710) $100,856 $108,244 $86,137 $114,973 $107,232 $92,594 $97,818 $92,451HTS-HV (4420710) $5,879 $10,369 $4,790 $14,456 $10,384 $9,763 $10,292 $11,587HS (4421210) $372 $456 $991 $983 $1,455 $1,573 $1,194 $492TOTAL COMMERCIAL $872,408 $879,061 $780,130 $842,706 $942,723 $870,317 $911,063 $791,838
INDUSTRIAL SALESGLP (4420410) $12,018 $11,787 $10,198 $11,352 $12,692 $12,321 $13,503 $11,628GLP-MDO (4420410) $0 $0 $0 $0 $0 $0 $0 $0LPLP (4420610) $25,552 $24,193 $22,114 $25,216 $26,827 $24,582 $25,618 $19,551LPLS (4420610) $24,505 $28,818 $29,106 $16,477 $26,993 $27,681 $33,561 $22,569LPLSH (4420610) $21,038 $15,456 $12,333 $21,614 $19,427 $16,160 $17,665 $17,863LPLSO (4420610) $6 $8 $2 $14 $10 $9 $7 $5LPLSR (4420610) $0 $0 $0 $0 $0 $0 $0 $0HTS-SUB (4420810) $73,839 $68,522 $45,021 $80,259 $72,979 $53,564 $56,521 $63,438HTS-HV (4420810) $1,295 $6,327 $778 $1,661 $7,825 $220 $4,063 $1,500HS (4421110) $13 $14 $18 $23 $36 $38 $25 $14HEP (4421010) $0 $0 $0 $0 $0 $0 $0 $0EHEP (4421010) $0 $0 $0 $0 $0 $0 $0 $0TOTAL INDUSTRIAL $158,267 $155,124 $119,569 $156,616 $166,790 $134,576 $150,963 $136,567
PUB STREET AND HWY LIGHTING SALESSL-PUB (4440310) $10,672 $9,142 $13,434 $14,920 $13,753 $13,041 $10,919 $9,628BPL-POF (4440310) $516 $256 $705 $684 $677 $633 $542 $509GLP-T&S (4440410) $1,400 $1,410 $1,893 $942 $1,417 $1,413 $1,420 $1,416TOTAL ST. LIGHT. $12,588 $10,807 $16,032 $16,545 $15,848 $15,087 $12,882 $11,553
TOTAL REVENUES $1,539,568 $1,433,646 $1,350,559 $1,476,845 $1,684,068 $1,518,960 $1,550,348 $1,304,625
ATTACHMENT B
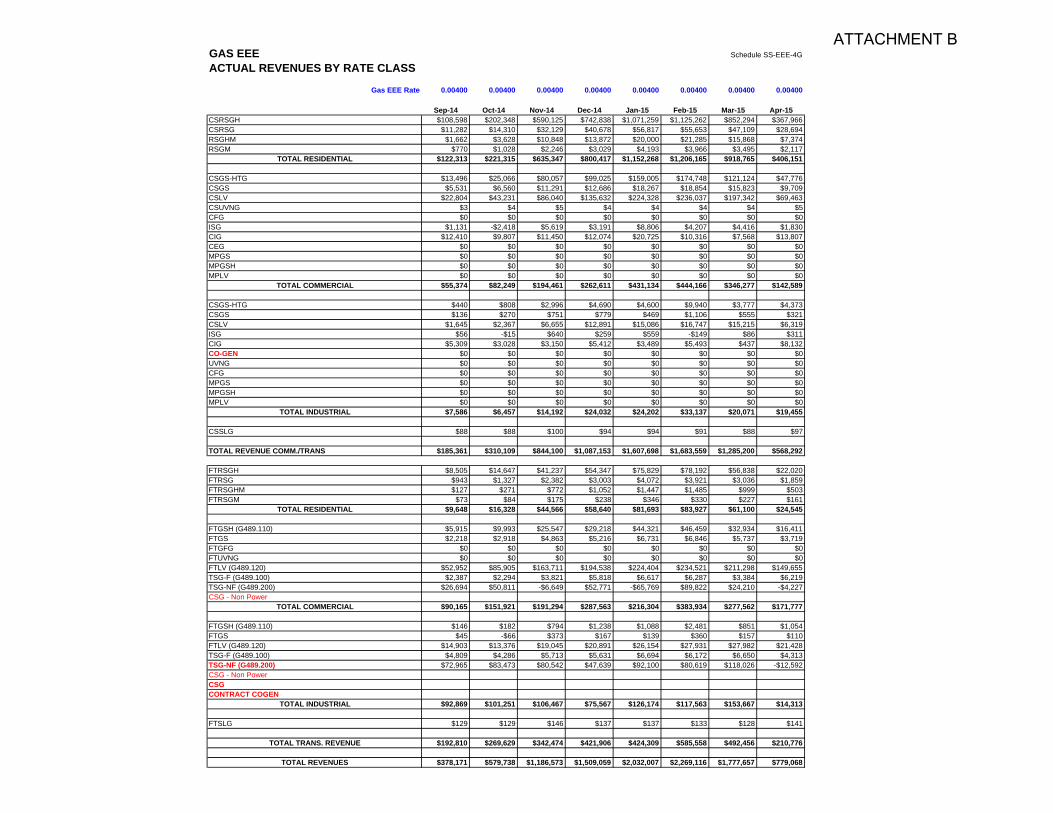
GAS EEE Schedule SS-EEE-4G
ACTUAL REVENUES BY RATE CLASS
Gas EEE Rate 0.00400 0.00400 0.00400 0.00400 0.00400 0.00400 0.00400 0.00400
Sep-14 Oct-14 Nov-14 Dec-14 Jan-15 Feb-15 Mar-15 Apr-15CSRSGH $108,598 $202,348 $590,125 $742,838 $1,071,259 $1,125,262 $852,294 $367,966CSRSG $11,282 $14,310 $32,129 $40,678 $56,817 $55,653 $47,109 $28,694RSGHM $1,662 $3,628 $10,848 $13,872 $20,000 $21,285 $15,868 $7,374RSGM $770 $1,028 $2,246 $3,029 $4,193 $3,966 $3,495 $2,117
TOTAL RESIDENTIAL $122,313 $221,315 $635,347 $800,417 $1,152,268 $1,206,165 $918,765 $406,151
CSGS-HTG $13,496 $25,066 $80,057 $99,025 $159,005 $174,748 $121,124 $47,776CSGS $5,531 $6,560 $11,291 $12,686 $18,267 $18,854 $15,823 $9,709CSLV $22,804 $43,231 $86,040 $135,632 $224,328 $236,037 $197,342 $69,463CSUVNG $3 $4 $5 $4 $4 $4 $4 $5CFG $0 $0 $0 $0 $0 $0 $0 $0ISG $1,131 -$2,418 $5,619 $3,191 $8,806 $4,207 $4,416 $1,830CIG $12,410 $9,807 $11,450 $12,074 $20,725 $10,316 $7,568 $13,807CEG $0 $0 $0 $0 $0 $0 $0 $0MPGS $0 $0 $0 $0 $0 $0 $0 $0MPGSH $0 $0 $0 $0 $0 $0 $0 $0MPLV $0 $0 $0 $0 $0 $0 $0 $0
TOTAL COMMERCIAL $55,374 $82,249 $194,461 $262,611 $431,134 $444,166 $346,277 $142,589
CSGS-HTG $440 $808 $2,996 $4,690 $4,600 $9,940 $3,777 $4,373CSGS $136 $270 $751 $779 $469 $1,106 $555 $321CSLV $1,645 $2,367 $6,655 $12,891 $15,086 $16,747 $15,215 $6,319ISG $56 -$15 $640 $259 $559 -$149 $86 $311CIG $5,309 $3,028 $3,150 $5,412 $3,489 $5,493 $437 $8,132CO-GEN $0 $0 $0 $0 $0 $0 $0 $0UVNG $0 $0 $0 $0 $0 $0 $0 $0CFG $0 $0 $0 $0 $0 $0 $0 $0MPGS $0 $0 $0 $0 $0 $0 $0 $0MPGSH $0 $0 $0 $0 $0 $0 $0 $0MPLV $0 $0 $0 $0 $0 $0 $0 $0
TOTAL INDUSTRIAL $7,586 $6,457 $14,192 $24,032 $24,202 $33,137 $20,071 $19,455
CSSLG $88 $88 $100 $94 $94 $91 $88 $97
TOTAL REVENUE COMM./TRANS $185,361 $310,109 $844,100 $1,087,153 $1,607,698 $1,683,559 $1,285,200 $568,292
FTRSGH $8,505 $14,647 $41,237 $54,347 $75,829 $78,192 $56,838 $22,020FTRSG $943 $1,327 $2,382 $3,003 $4,072 $3,921 $3,036 $1,859FTRSGHM $127 $271 $772 $1,052 $1,447 $1,485 $999 $503FTRSGM $73 $84 $175 $238 $346 $330 $227 $161
TOTAL RESIDENTIAL $9,648 $16,328 $44,566 $58,640 $81,693 $83,927 $61,100 $24,545
FTGSH (G489.110) $5,915 $9,993 $25,547 $29,218 $44,321 $46,459 $32,934 $16,411FTGS $2,218 $2,918 $4,863 $5,216 $6,731 $6,846 $5,737 $3,719FTGFG $0 $0 $0 $0 $0 $0 $0 $0FTUVNG $0 $0 $0 $0 $0 $0 $0 $0FTLV (G489.120) $52,952 $85,905 $163,711 $194,538 $224,404 $234,521 $211,298 $149,655TSG-F (G489.100) $2,387 $2,294 $3,821 $5,818 $6,617 $6,287 $3,384 $6,219TSG-NF (G489.200) $26,694 $50,811 -$6,649 $52,771 -$65,769 $89,822 $24,210 -$4,227CSG - Non Power
TOTAL COMMERCIAL $90,165 $151,921 $191,294 $287,563 $216,304 $383,934 $277,562 $171,777
FTGSH (G489.110) $146 $182 $794 $1,238 $1,088 $2,481 $851 $1,054FTGS $45 -$66 $373 $167 $139 $360 $157 $110FTLV (G489.120) $14,903 $13,376 $19,045 $20,891 $26,154 $27,931 $27,982 $21,428TSG-F (G489.100) $4,809 $4,286 $5,713 $5,631 $6,694 $6,172 $6,650 $4,313TSG-NF (G489.200) $72,965 $83,473 $80,542 $47,639 $92,100 $80,619 $118,026 -$12,592CSG - Non PowerCSGCONTRACT COGEN
TOTAL INDUSTRIAL $92,869 $101,251 $106,467 $75,567 $126,174 $117,563 $153,667 $14,313
FTSLG $129 $129 $146 $137 $137 $133 $128 $141
TOTAL TRANS. REVENUE $192,810 $269,629 $342,474 $421,906 $424,309 $585,558 $492,456 $210,776
TOTAL REVENUES $378,171 $579,738 $1,186,573 $1,509,059 $2,032,007 $2,269,116 $1,777,657 $779,068
ATTACHMENT B
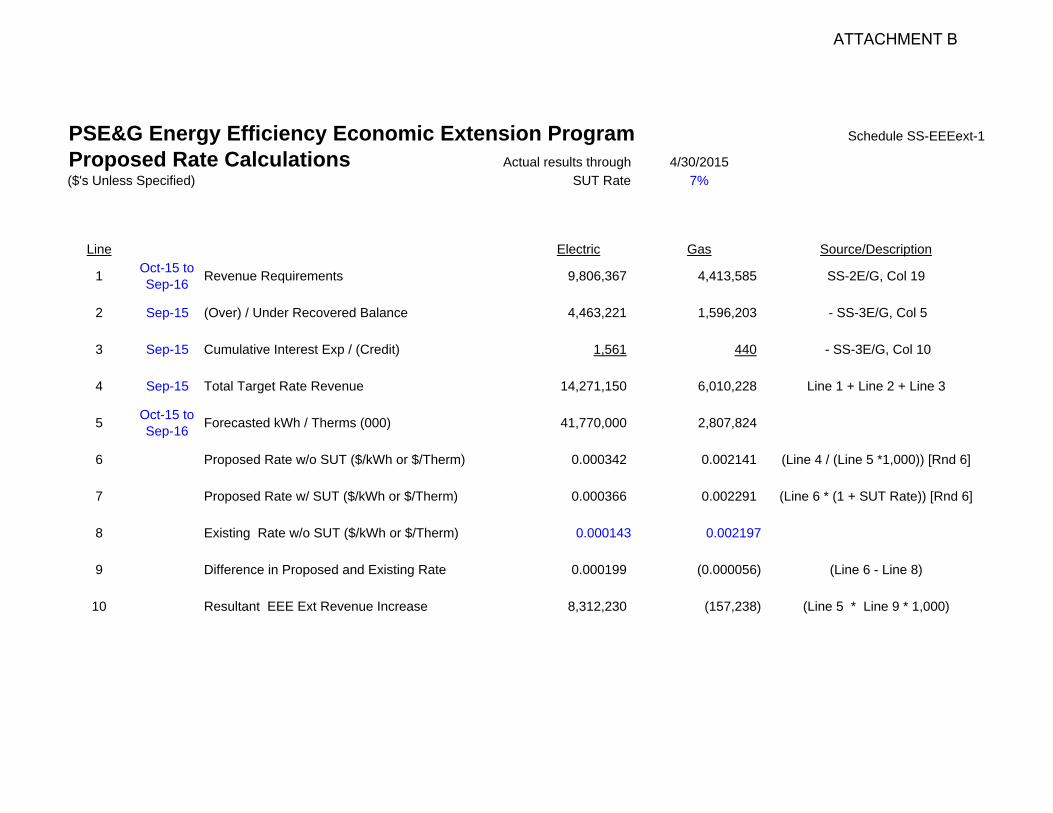
PSE&G Energy Efficiency Economic Extension Program Schedule SS-EEEext-1
Proposed Rate Calculations Actual results through 4/30/2015($'s Unless Specified) SUT Rate 7%
Line Electric Gas Source/Description
1 Oct-15 to Sep-16 Revenue Requirements 9,806,367 4,413,585 SS-2E/G, Col 19
2 Sep-15 (Over) / Under Recovered Balance 4,463,221 1,596,203 - SS-3E/G, Col 5
3 Sep-15 Cumulative Interest Exp / (Credit) 1,561 440 - SS-3E/G, Col 10
4 Sep-15 Total Target Rate Revenue 14,271,150 6,010,228 Line 1 + Line 2 + Line 3
5 Oct-15 to Sep-16 Forecasted kWh / Therms (000) 41,770,000 2,807,824
6 Proposed Rate w/o SUT ($/kWh or $/Therm) 0.000342 0.002141 (Line 4 / (Line 5 *1,000)) [Rnd 6]
7 Proposed Rate w/ SUT ($/kWh or $/Therm) 0.000366 0.002291 (Line 6 * (1 + SUT Rate)) [Rnd 6]
8 Existing Rate w/o SUT ($/kWh or $/Therm) 0.000143 0.002197
9 Difference in Proposed and Existing Rate 0.000199 (0.000056) (Line 6 - Line 8)
10 Resultant EEE Ext Revenue Increase 8,312,230 (157,238) (Line 5 * Line 9 * 1,000)
ATTACHMENT B
PSE&G Energy Efficiency Economic Extension Program Schedule SS-EEEext-2E
Electric Revenue Requirements Calculation Page 1 of 2
Actual Results thru April 2015 Monthly WACC effective 07/01/2010 0.9877%Inc. tax rate effective 07/01/2010 40.85%
(1) (2) (3) (4) (5) (6) (7) (8) (9) (10)
Program Investment
Capitalized IT Costs Gross Plant
Program Investment
AmortizationIT Cost
Amortization Accumulated Amortization Net Plant Tax Depreciation
Book DepreciationTax Basis
Deferred Income Tax
Monthly Calculations
Sep-14 1,765,965 - 52,984,083 883,068 - 10,969,727 42,014,356 1,409,574 676,993 299,259 Oct-14 1,143,577 - 54,127,660 902,128 - 11,871,855 42,255,806 458,004 684,626 (92,575) Nov-14 458,714 - 54,586,374 909,773 - 12,781,628 41,804,747 333,265 690,181 (145,800) Dec-14 4,222,904 - 58,809,278 980,155 - 13,761,782 45,047,496 1,022,098 707,216 128,630 Jan-15 50,456 - 58,859,735 980,996 - 14,742,778 44,116,957 28,887 707,697 (277,294) Feb-15 402,306 - 59,262,041 987,701 - 15,730,478 43,531,562 380,473 714,038 (136,261) Mar-15 349,070 - 59,611,111 993,519 - 16,723,997 42,887,114 349,070 719,856 (151,466) Apr-15 65,764 - 59,676,875 994,615 - 17,718,612 41,958,264 2,139,939 755,522 565,534 May-15 1,312,397 - 60,989,272 1,016,488 - 18,735,099 42,254,172 1,312,397 777,395 218,548 Jun-15 524,939 - 61,514,211 1,025,237 - 19,760,336 41,753,874 524,939 786,144 (106,702) Jul-15 952,199 - 62,466,409 1,041,107 - 20,801,443 41,664,966 952,199 802,014 61,350
Aug-15 581,740 - 63,048,149 1,050,802 - 21,852,246 41,195,904 (921,566) 786,655 (697,808) Sep-15 887,701 - 63,935,851 1,065,598 - 22,917,843 41,018,008 (10,693) 786,476 (325,644) Oct-15 14,022 - 63,949,873 1,065,831 - 23,983,674 39,966,198 (2,240,120) 749,141 (1,221,113) Nov-15 14,022 - 63,963,895 1,066,065 - 25,049,739 38,914,155 14,022 749,375 (300,392) Dec-15 14,549 - 63,978,443 1,066,307 - 26,116,047 37,862,396 14,549 749,617 (300,276) Jan-16 - - 63,978,443 1,066,307 - 27,182,354 36,796,089 (23,856) 749,220 (315,801) Feb-16 - - 63,978,443 1,066,307 - 28,248,661 35,729,782 - 749,220 (306,056) Mar-16 - - 63,978,443 1,066,307 - 29,314,969 34,663,474 - 749,220 (306,056) Apr-16 - - 63,978,443 1,066,307 - 30,381,276 33,597,167 - 749,220 (306,056) May-16 - - 63,978,443 1,066,307 - 31,447,584 32,530,860 - 749,220 (306,056) Jun-16 - - 63,978,443 1,066,307 - 32,513,891 31,464,552 - 749,220 (306,056) Jul-16 - - 63,978,443 1,066,307 - 33,580,198 30,398,245 - 749,220 (306,056)
Aug-16 - - 63,978,443 1,066,307 - 34,646,506 29,331,937 - 749,220 (306,056) Sep-16 - - 63,978,443 1,066,307 - 35,712,813 28,265,630 - 749,220 (306,056)
Program Assumption
See WP-SS-EEEext-1.xls
'ITCap-E' wksht(Col 12)
Prior Month + (Col 1 + Col 2)
1/144 of each Prior 144 Months
from Col 1(12 year
amortization)
See WP-SS-EEEext-1.xls
'AmortE' wksht(5 & 10 yr Amort)
(Row 1562)
Prior Month + (Col 4 + Col 5) Col 3 - Col 6
See WP-SS-EEEext-1.xls
'AmortE' wksht(Row 1573)
See WP-SS-EEEext-1.xls
'AmortE' wksht
(Col 8 - Col 9) * Income Tax Rate
Annual Summary
2012 8,555,418 - 8,555,418 369,204 - 369,204 8,186,214 6,625,205 285,987 2,589,571 2013 29,014,589 - 37,570,006 3,761,353 - 4,130,557 33,439,450 23,902,817 2,986,914 8,544,146 2014 21,239,272 - 58,809,278 9,631,225 - 13,761,782 45,047,496 11,904,925 7,360,506 1,856,395 2015 5,169,165 - 63,978,443 12,354,264 - 26,116,047 37,862,396 2,544,094 9,083,932 (2,671,524) 2016 - - 63,978,443 12,795,689 - 38,911,735 25,066,708 (23,856) 8,990,637 (3,682,420)
Oct 2015 - Sept 2016 42,592 12,794,970 - (2,235,405) 8,991,111 (4,586,032)
ATTACHMENT B
Monthly Calculations
Sep-14Oct-14Nov-14Dec-14Jan-15Feb-15Mar-15Apr-15May-15Jun-15Jul-15
Aug-15Sep-15Oct-15Nov-15Dec-15Jan-16Feb-16Mar-16Apr-16May-16Jun-16Jul-16
Aug-16Sep-16
Annual Summary
20122013201420152016
Oct 2015 - Sept 2016
PSE&G Energy Efficiency Economic Extension Program Schedule SS-EEEext-2E
Electric Revenue Requirements Calculation Page 2 of 2
Actual Results thru April 2015 Monthly WACC effective 07/01/2010 0.9877%Inc. tax rate effective 07/01/2010 40.85%
(11) (12) (13) (14) (15) (16) (17) (18) (19)Accumulated
Deferred Income Tax Net Investment
Return Requirement
Program Investment
RepaymentsAdministrative
costsNet Capacity
Revenue Tax Adjustment Lost RevenuesRevenue
Requirements
13,099,858 28,914,498 282,698 (377,428) 211,214 (9,618) (118,339) 871,595 13,007,283 29,248,523 287,229 (409,791) 175,426 (25,603) (132,799) 796,591 12,861,483 28,943,264 287,371 (492,455) 134,684 (130) (188,444) 650,799 12,990,112 32,057,384 301,243 (415,855) 142,289 (23,989) (98,701) 885,142 12,712,818 31,404,138 313,395 (437,114) 111,291 (26,471) (113,134) 828,964 12,576,557 30,955,005 307,951 (448,347) 145,909 (22,664) (120,640) 849,910 12,425,091 30,462,023 303,299 (439,782) (74,024) (24,491) (114,725) 643,796 12,990,625 28,967,638 293,484 (429,125) 184,033 (20,985) (131,239) 890,783 13,209,173 29,044,999 286,487 (394,596) 62,079 (14,439) (107,393) 848,625 13,102,471 28,651,403 284,925 (394,877) 48,579 (3,495) (107,588) 852,781 13,163,821 28,501,145 282,239 (390,687) 39,579 (4,053) (104,694) 863,491 12,466,013 28,729,891 282,627 (421,883) 39,579 (4,053) (108,935) 838,138 12,140,369 28,877,639 284,486 (438,569) 31,506 (3,495) (110,117) 829,409 10,919,256 29,046,942 286,052 (496,602) 15,044 (4,053) (124,250) 742,022 10,618,864 28,295,291 283,176 (483,172) 10,648 (3,495) (114,975) 758,247 10,318,589 27,543,808 275,753 (477,504) 4,218 (4,053) (111,061) 753,660 10,002,787 26,793,302 268,336 (456,444) 4,218 (11,868) (96,242) 774,307 9,696,731 26,033,051 260,875 (431,644) 1,291 (10,195) (79,114) 807,521 9,390,675 25,272,800 253,366 (425,254) 1,291 (11,868) (74,702) 809,142 9,084,618 24,512,549 245,857 (412,637) 1,291 (11,310) (65,988) 823,522 8,778,562 23,752,297 238,349 (402,411) 1,291 (11,868) (58,926) 832,743 8,472,506 22,992,046 230,840 (393,128) 1,291 (20,337) (52,515) 832,459 8,166,450 22,231,795 223,331 (362,028) 1,291 (21,195) (31,036) 876,670 7,860,393 21,471,544 215,822 (358,728) 1,291 (21,195) (28,757) 874,740 7,554,337 20,711,293 208,314 (327,234) 1,291 (20,337) (7,007) 921,335
Prior Month + Col 10 Col 7 - Col 11
(Prior Col 12 + Col 12) / 2
* Monthly Pre Tax WACC
Program Assumption
Program Assumption
See WP-JEM-EEEext-1.xls
See WP-SS-EEEext-1.xls
'AmortE' wksht N/A
Col 4 + Col 5 + Col 13 + Col 14 + Col 15 + Col 16 + Col 17 + Col 18
1,402,961 6,783,253 114,718 - 761,016 - 57,471 - 1,302,408 11,133,717 22,305,732 1,268,688 (754,648) 1,507,244 32,953 13,668 - 5,829,259 12,990,112 32,057,384 3,151,441 (3,898,533) 2,142,835 (64,203) (1,124,195) - 9,838,570 10,318,589 27,543,808 3,483,875 (5,252,258) 618,443 (135,747) (1,368,752) - 9,699,824 6,636,168 18,430,540 2,724,978 (4,499,082) 14,547 (202,900) (479,309) - 10,353,924
2,990,071 (5,026,785) 44,458 (151,773) (844,574) 9,806,367
ATTACHMENT B
PSE&G Energy Efficiency Economic Extension Program Schedule SS-EEEext-2G
Gas Revenue Requirements Calculation Page 1 of 2
Actual results through April 2015 Monthly WACC effective 07/01/2010 0.9877%Inc. Tax rate effective 07/01/2010 40.85%
(1) (2) (3) (4) (5) (6) (7) (8) (9) (10)
Program Investment
Capitalized IT Costs Gross Plant
Program Investment
AmortizationIT Cost
AmortizationAccumulated Amortization Net Plant
Tax Depreciation
Book Depreciation
Tax BasisDeferred
Income TaxMonthly
CalculationsSep-14 671,610 - 24,510,375 408,506 - 5,396,961 19,113,414 507,415 306,573 82,044 Oct-14 392,663 - 24,903,039 415,051 - 5,812,012 19,091,027 9,943 306,739 (121,241) Nov-14 70,236 - 24,973,275 416,221 - 6,228,233 18,745,042 56,298 307,677 (102,688) Dec-14 2,491,916 - 27,465,191 457,753 - 6,685,986 20,779,204 82,114 309,045 (92,702) Jan-15 3,296 - 27,468,487 457,808 - 7,143,795 20,324,692 899 309,060 (125,884) Feb-15 208,633 - 27,677,120 461,285 - 7,605,080 20,072,040 206,207 312,497 (43,419) Mar-15 251,632 - 27,928,751 465,479 - 8,070,559 19,858,192 251,632 316,691 (26,577) Apr-15 85,875 - 28,014,626 466,910 - 8,537,470 19,477,157 1,349,232 339,178 412,607
May-15 676,998 - 28,691,625 478,194 - 9,015,663 19,675,961 676,998 350,462 133,390 Jun-15 272,887 - 28,964,512 482,742 - 9,498,405 19,466,107 272,887 355,010 (33,547) Jul-15 552,796 - 29,517,307 491,955 - 9,990,360 19,526,947 552,796 364,223 77,032
Aug-15 435,153 - 29,952,460 499,208 - 10,489,568 19,462,892 (684,573) 352,813 (423,772) Sep-15 459,802 - 30,412,262 506,871 - 10,996,439 19,415,823 (3,008) 352,763 (145,332) Oct-15 17,846 - 30,430,108 507,168 - 11,503,607 18,926,501 (1,148,732) 333,618 (605,540) Nov-15 17,846 - 30,447,954 507,466 - 12,011,073 18,436,881 12,492 333,826 (131,265) Dec-15 18,516 - 30,466,470 507,775 - 12,518,848 17,947,623 12,961 334,042 (131,161) Jan-16 - - 30,466,470 507,775 - 13,026,622 17,439,848 - 334,042 (136,456) Feb-16 - - 30,466,470 507,775 - 13,534,397 16,932,074 - 334,042 (136,456) Mar-16 - - 30,466,470 507,775 - 14,042,171 16,424,299 - 334,042 (136,456) Apr-16 - - 30,466,470 507,775 - 14,549,946 15,916,525 - 334,042 (136,456)
May-16 - - 30,466,470 507,775 - 15,057,720 15,408,750 - 334,042 (136,456) Jun-16 - - 30,466,470 507,775 - 15,565,495 14,900,976 - 334,042 (136,456) Jul-16 - - 30,466,470 507,775 - 16,073,269 14,393,201 - 334,042 (136,456)
Aug-16 - - 30,466,470 507,775 - 16,581,044 13,885,427 - 334,042 (136,456)
Program Assumption
Prior Month + (Col 1 + Col 2)
1/60 of each Prior Months
from Col 1(5 year
amortization)
See WP-SS-EEEext-1.xlsx'AmortG' wksht
(5 & 10 yr Amort)(Row 1562)
Prior Month + (Col 4 + Col 5) Col 3 - Col 6
See WP-SS-EEEext-1.xlsx'AmortG' wksht
(Row 1573)
See WP-SS-EEEext-1.xlsx'AmortG' wksht
(Row 1569)
(Col 8 - Col 9) * Income Tax
Rate
Annual Summary
2012 4,990,287 - 4,990,287 229,928 - 229,928 4,760,360 3,879,345 179,112 1,511,545 2013 13,066,590 - 18,056,877 1,970,061 - 2,199,989 15,856,888 10,784,007 1,566,920 3,765,180 2014 9,408,314 - 27,465,191 4,485,997 - 6,685,986 20,779,204 3,879,376 3,339,850 220,397 2015 3,001,280 - 30,466,470 5,832,861 - 12,518,848 17,947,623 1,499,792 4,054,184 (1,043,469) 2016 - - 30,466,470 6,093,294 - 18,612,142 11,854,329 - 4,008,504 (1,637,474)
Oct 2015 - Sept 2016 54,209 6,092,379 - (1,123,278) 4,007,864 (2,096,072)
ATTACHMENT B
Monthly Calculations
Sep-14Oct-14Nov-14Dec-14Jan-15Feb-15Mar-15Apr-15
May-15Jun-15Jul-15
Aug-15Sep-15Oct-15Nov-15Dec-15Jan-16Feb-16Mar-16Apr-16
May-16Jun-16Jul-16
Aug-16
Annual Summary
20122013201420152016
Oct 2015 - Sept 2016
PSE&G Energy Efficiency Economic Extension Program Schedule SS-EEEext-2G
Gas Revenue Requirements Calculation Page 2 of 2
Actual results through April 2015 Monthly WACC effective 07/01/2010 0.9877%Inc. Tax rate effective 07/01/2010 40.85%
(11) (12) (13) (14) (15) (16) (17) (18) (19)Accumulated
Deferred Income Tax Net Investment
Return Requirement
Program Investment
RepaymentsAdministrative
costsCapacity Revenue Tax Adjustment Lost Revenues
Revenue Requirements
5,813,753 13,299,661 130,463 (136,043) 111,361 (23,557) 490,730 5,692,512 13,398,515 131,845 (149,964) 95,220 (28,765) 463,386 5,589,823 13,155,218 131,132 (215,467) 67,124 (73,843) 325,167 5,497,122 15,282,083 140,433 (181,645) 74,701 (22,747) 468,495 5,371,238 14,953,454 149,314 (206,558) 70,018 (39,925) 430,658 5,327,818 14,744,221 146,658 (195,306) 80,241 (32,126) 460,752 5,301,242 14,556,951 144,699 (208,897) 30,402 (41,512) 390,172 5,713,849 13,763,308 139,855 (207,712) 114,491 (55,236) 458,309 5,847,239 13,828,723 136,259 (172,178) 39,157 (30,695) 450,736 5,813,692 13,652,415 135,711 (172,484) 37,657 (30,906) 452,720 5,890,724 13,636,223 134,761 (172,018) 36,657 (30,585) 460,769 5,466,951 13,995,941 136,457 (196,066) 36,657 (34,304) 441,952 5,321,619 14,094,204 138,719 (208,003) 24,056 (37,221) 424,422 4,716,079 14,210,422 139,778 (239,750) 10,563 (45,718) 372,042 4,584,814 13,852,067 138,582 (238,257) 4,968 (44,626) 368,133 4,453,653 13,493,970 135,044 (237,628) 1,586 (44,127) 362,651 4,317,196 13,122,652 131,442 (235,750) 1,586 (42,830) 362,223 4,180,740 12,751,333 127,775 (232,994) 188 (40,927) 361,816 4,044,284 12,380,015 124,107 (232,284) 188 (40,437) 359,349 3,907,828 12,008,697 120,440 (228,468) 188 (37,801) 362,132 3,771,372 11,637,378 116,773 (227,332) 188 (37,017) 360,386 3,634,916 11,266,060 113,105 (226,301) 188 (36,305) 358,462 3,498,460 10,894,742 109,438 (213,005) 188 (27,122) 377,273 3,362,003 10,523,423 105,770 (212,638) 188 (26,869) 374,225
Prior Month + Col 10 Col 7 - Col 11
(Prior Col 12 + Col 12) / 2
* Monthly Pre Tax WACC
Program Assumption
Program Assumption N/A
See WP-SS-EEEext-1.xlsx'AmortG' wksht
(Row 1589)
N/A
Col 4 + Col 5 + Col 13 + Col 14 + Col 15 + Col 16 + Col 17 +
Col 18
760,938 3,999,422 72,242 - 287,616 - 35,094 - 624,879 5,276,725 10,580,163 665,996 (232,463) 702,723 - 117,874 - 3,224,191 5,497,122 15,282,083 1,463,712 (1,643,024) 978,429 - (343,152) - 4,941,963 4,453,653 13,493,970 1,675,839 (2,454,856) 486,452 - (466,981) - 5,073,315 2,816,179 9,038,150 1,335,258 (2,587,396) 3,087 - (347,108) - 4,497,134
1,464,358 (2,722,650) 20,204 - (440,707) 4,413,585
ATTACHMENT B
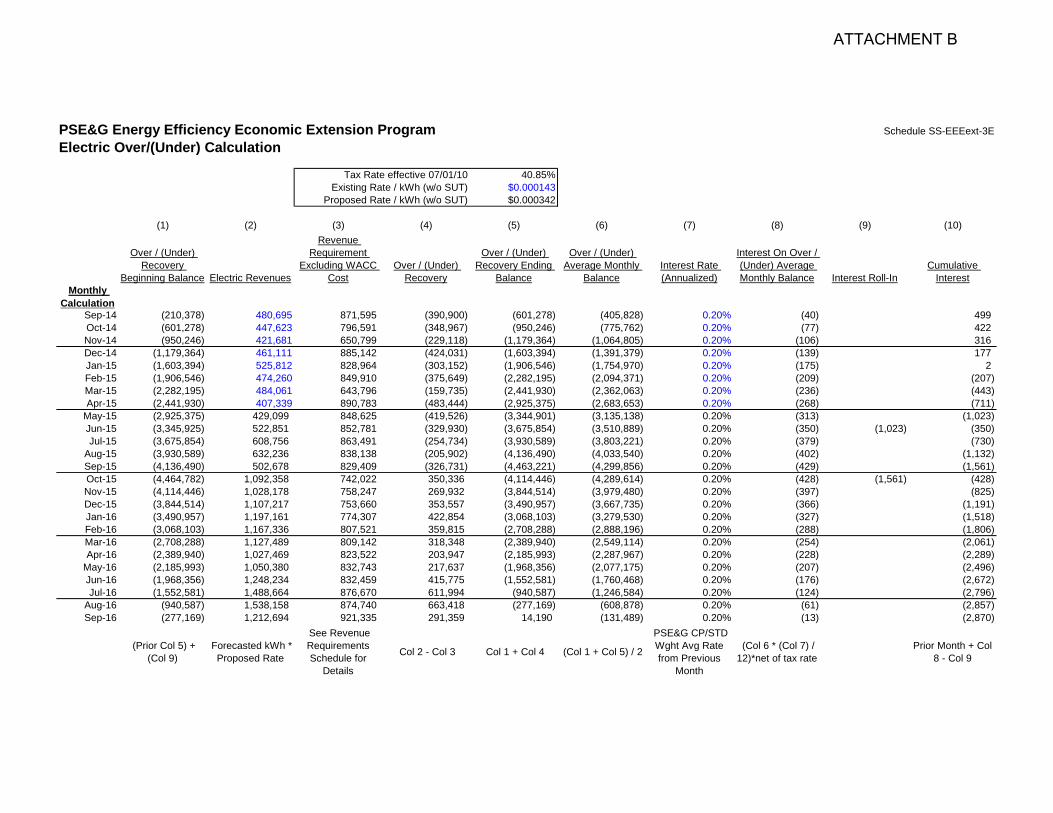
PSE&G Energy Efficiency Economic Extension Program Schedule SS-EEEext-3E
Electric Over/(Under) Calculation
Tax Rate #REF! Tax Rate effective 07/01/10 40.85%Existing Rate / kWh (w/o SUT) $0.000143
Proposed Rate / kWh (w/o SUT) $0.000342
(1) (2) (3) (4) (5) (6) (7) (8) (9) (10)
Over / (Under) Recovery
Beginning Balance Electric Revenues
Revenue Requirement
Excluding WACC Cost
Over / (Under) Recovery
Over / (Under) Recovery Ending
Balance
Over / (Under) Average Monthly
BalanceInterest Rate (Annualized)
Interest On Over / (Under) Average Monthly Balance Interest Roll-In
Cumulative Interest
Monthly Calculation
Sep-14 (210,378) 480,695 871,595 (390,900) (601,278) (405,828) 0.20% (40) 499 Oct-14 (601,278) 447,623 796,591 (348,967) (950,246) (775,762) 0.20% (77) 422 Nov-14 (950,246) 421,681 650,799 (229,118) (1,179,364) (1,064,805) 0.20% (106) 316 Dec-14 (1,179,364) 461,111 885,142 (424,031) (1,603,394) (1,391,379) 0.20% (139) 177 Jan-15 (1,603,394) 525,812 828,964 (303,152) (1,906,546) (1,754,970) 0.20% (175) 2 Feb-15 (1,906,546) 474,260 849,910 (375,649) (2,282,195) (2,094,371) 0.20% (209) (207) Mar-15 (2,282,195) 484,061 643,796 (159,735) (2,441,930) (2,362,063) 0.20% (236) (443) Apr-15 (2,441,930) 407,339 890,783 (483,444) (2,925,375) (2,683,653) 0.20% (268) (711)
May-15 (2,925,375) 429,099 848,625 (419,526) (3,344,901) (3,135,138) 0.20% (313) (1,023) Jun-15 (3,345,925) 522,851 852,781 (329,930) (3,675,854) (3,510,889) 0.20% (350) (1,023) (350) Jul-15 (3,675,854) 608,756 863,491 (254,734) (3,930,589) (3,803,221) 0.20% (379) (730)
Aug-15 (3,930,589) 632,236 838,138 (205,902) (4,136,490) (4,033,540) 0.20% (402) (1,132) Sep-15 (4,136,490) 502,678 829,409 (326,731) (4,463,221) (4,299,856) 0.20% (429) (1,561) Oct-15 (4,464,782) 1,092,358 742,022 350,336 (4,114,446) (4,289,614) 0.20% (428) (1,561) (428) Nov-15 (4,114,446) 1,028,178 758,247 269,932 (3,844,514) (3,979,480) 0.20% (397) (825) Dec-15 (3,844,514) 1,107,217 753,660 353,557 (3,490,957) (3,667,735) 0.20% (366) (1,191) Jan-16 (3,490,957) 1,197,161 774,307 422,854 (3,068,103) (3,279,530) 0.20% (327) (1,518) Feb-16 (3,068,103) 1,167,336 807,521 359,815 (2,708,288) (2,888,196) 0.20% (288) (1,806) Mar-16 (2,708,288) 1,127,489 809,142 318,348 (2,389,940) (2,549,114) 0.20% (254) (2,061) Apr-16 (2,389,940) 1,027,469 823,522 203,947 (2,185,993) (2,287,967) 0.20% (228) (2,289)
May-16 (2,185,993) 1,050,380 832,743 217,637 (1,968,356) (2,077,175) 0.20% (207) (2,496) Jun-16 (1,968,356) 1,248,234 832,459 415,775 (1,552,581) (1,760,468) 0.20% (176) (2,672) Jul-16 (1,552,581) 1,488,664 876,670 611,994 (940,587) (1,246,584) 0.20% (124) (2,796)
Aug-16 (940,587) 1,538,158 874,740 663,418 (277,169) (608,878) 0.20% (61) (2,857) Sep-16 (277,169) 1,212,694 921,335 291,359 14,190 (131,489) 0.20% (13) (2,870)
(Prior Col 5) + (Col 9)
Forecasted kWh * Proposed Rate
See Revenue Requirements Schedule for
Details
Col 2 - Col 3 Col 1 + Col 4 (Col 1 + Col 5) / 2
PSE&G CP/STD Wght Avg Rate from Previous
Month
(Col 6 * (Col 7) / 12)*net of tax rate
Prior Month + Col 8 - Col 9
ATTACHMENT B
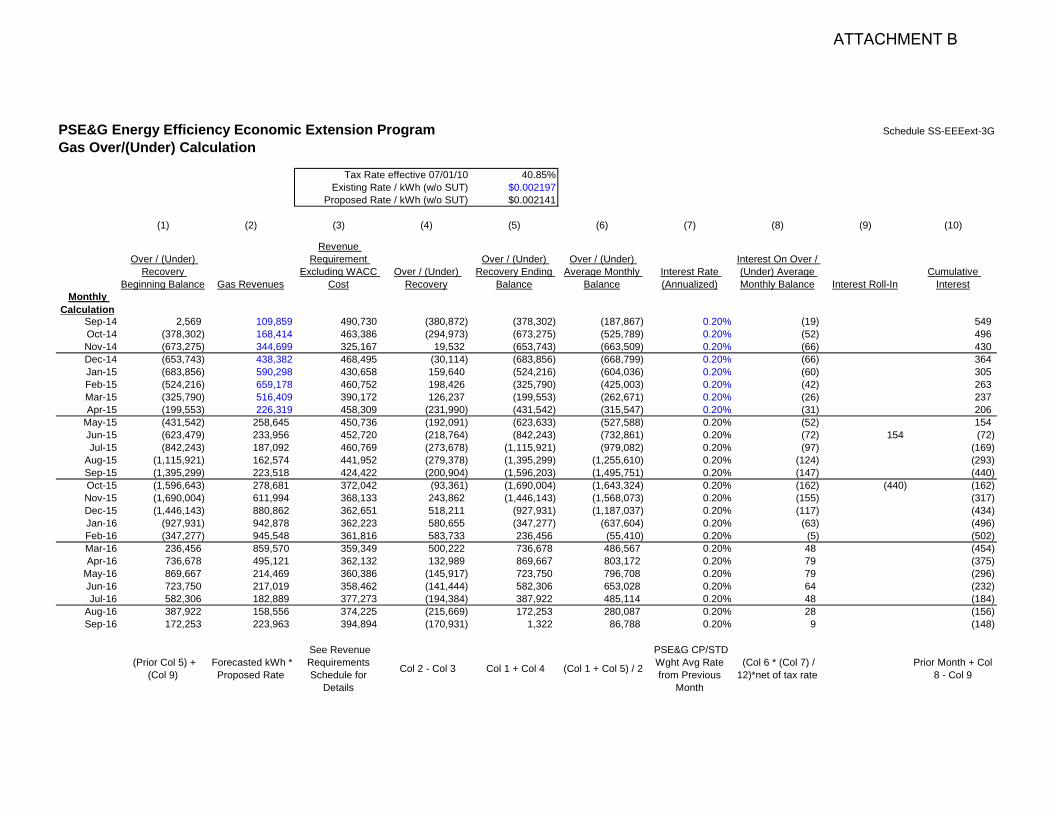
PSE&G Energy Efficiency Economic Extension Program Schedule SS-EEEext-3G
Gas Over/(Under) Calculation
Tax Rate Tax Rate effective 07/01/10 40.85%Existing Rate / kWh (w/o SUT) $0.002197
Proposed Rate / kWh (w/o SUT) $0.002141
(1) (2) (3) (4) (5) (6) (7) (8) (9) (10)
Over / (Under) Recovery
Beginning Balance Gas Revenues
Revenue Requirement
Excluding WACC Cost
Over / (Under) Recovery
Over / (Under) Recovery Ending
Balance
Over / (Under) Average Monthly
BalanceInterest Rate (Annualized)
Interest On Over / (Under) Average Monthly Balance Interest Roll-In
Cumulative Interest
Monthly Calculation
Sep-14 2,569 109,859 490,730 (380,872) (378,302) (187,867) 0.20% (19) 549 Oct-14 (378,302) 168,414 463,386 (294,973) (673,275) (525,789) 0.20% (52) 496 Nov-14 (673,275) 344,699 325,167 19,532 (653,743) (663,509) 0.20% (66) 430 Dec-14 (653,743) 438,382 468,495 (30,114) (683,856) (668,799) 0.20% (66) 364 Jan-15 (683,856) 590,298 430,658 159,640 (524,216) (604,036) 0.20% (60) 305 Feb-15 (524,216) 659,178 460,752 198,426 (325,790) (425,003) 0.20% (42) 263 Mar-15 (325,790) 516,409 390,172 126,237 (199,553) (262,671) 0.20% (26) 237 Apr-15 (199,553) 226,319 458,309 (231,990) (431,542) (315,547) 0.20% (31) 206
May-15 (431,542) 258,645 450,736 (192,091) (623,633) (527,588) 0.20% (52) 154 Jun-15 (623,479) 233,956 452,720 (218,764) (842,243) (732,861) 0.20% (72) 154 (72) Jul-15 (842,243) 187,092 460,769 (273,678) (1,115,921) (979,082) 0.20% (97) (169)
Aug-15 (1,115,921) 162,574 441,952 (279,378) (1,395,299) (1,255,610) 0.20% (124) (293) Sep-15 (1,395,299) 223,518 424,422 (200,904) (1,596,203) (1,495,751) 0.20% (147) (440) Oct-15 (1,596,643) 278,681 372,042 (93,361) (1,690,004) (1,643,324) 0.20% (162) (440) (162) Nov-15 (1,690,004) 611,994 368,133 243,862 (1,446,143) (1,568,073) 0.20% (155) (317) Dec-15 (1,446,143) 880,862 362,651 518,211 (927,931) (1,187,037) 0.20% (117) (434) Jan-16 (927,931) 942,878 362,223 580,655 (347,277) (637,604) 0.20% (63) (496) Feb-16 (347,277) 945,548 361,816 583,733 236,456 (55,410) 0.20% (5) (502) Mar-16 236,456 859,570 359,349 500,222 736,678 486,567 0.20% 48 (454) Apr-16 736,678 495,121 362,132 132,989 869,667 803,172 0.20% 79 (375)
May-16 869,667 214,469 360,386 (145,917) 723,750 796,708 0.20% 79 (296) Jun-16 723,750 217,019 358,462 (141,444) 582,306 653,028 0.20% 64 (232) Jul-16 582,306 182,889 377,273 (194,384) 387,922 485,114 0.20% 48 (184)
Aug-16 387,922 158,556 374,225 (215,669) 172,253 280,087 0.20% 28 (156) Sep-16 172,253 223,963 394,894 (170,931) 1,322 86,788 0.20% 9 (148)
(Prior Col 5) + (Col 9)
Forecasted kWh * Proposed Rate
See Revenue Requirements Schedule for
Details
Col 2 - Col 3 Col 1 + Col 4 (Col 1 + Col 5) / 2
PSE&G CP/STD Wght Avg Rate from Previous
Month
(Col 6 * (Col 7) / 12)*net of tax rate
Prior Month + Col 8 - Col 9
ATTACHMENT B
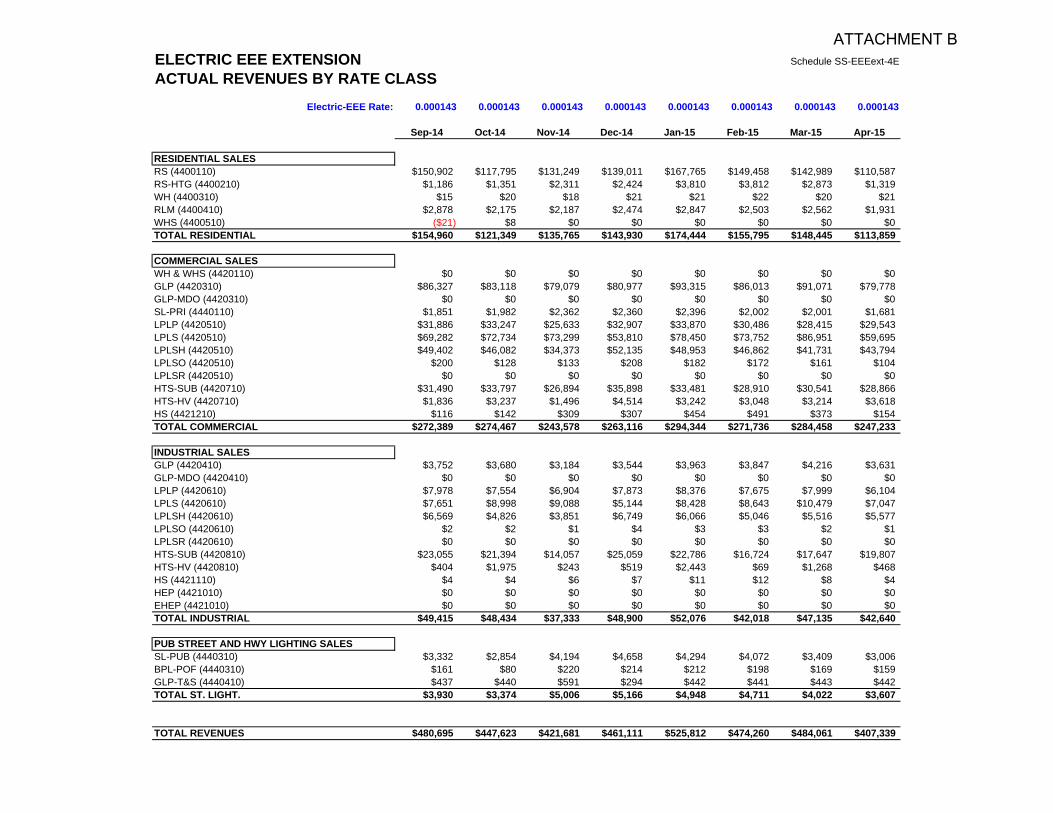
ELECTRIC EEE EXTENSION Schedule SS-EEEext-4E
ACTUAL REVENUES BY RATE CLASSElectric-EEE Rate: 0.000143 0.000143 0.000143 0.000143 0.000143 0.000143 0.000143 0.000143
Sep-14 Oct-14 Nov-14 Dec-14 Jan-15 Feb-15 Mar-15 Apr-15
RESIDENTIAL SALESRS (4400110) $150,902 $117,795 $131,249 $139,011 $167,765 $149,458 $142,989 $110,587RS-HTG (4400210) $1,186 $1,351 $2,311 $2,424 $3,810 $3,812 $2,873 $1,319WH (4400310) $15 $20 $18 $21 $21 $22 $20 $21RLM (4400410) $2,878 $2,175 $2,187 $2,474 $2,847 $2,503 $2,562 $1,931WHS (4400510) ($21) $8 $0 $0 $0 $0 $0 $0TOTAL RESIDENTIAL $154,960 $121,349 $135,765 $143,930 $174,444 $155,795 $148,445 $113,859
COMMERCIAL SALESWH & WHS (4420110) $0 $0 $0 $0 $0 $0 $0 $0GLP (4420310) $86,327 $83,118 $79,079 $80,977 $93,315 $86,013 $91,071 $79,778GLP-MDO (4420310) $0 $0 $0 $0 $0 $0 $0 $0SL-PRI (4440110) $1,851 $1,982 $2,362 $2,360 $2,396 $2,002 $2,001 $1,681LPLP (4420510) $31,886 $33,247 $25,633 $32,907 $33,870 $30,486 $28,415 $29,543LPLS (4420510) $69,282 $72,734 $73,299 $53,810 $78,450 $73,752 $86,951 $59,695LPLSH (4420510) $49,402 $46,082 $34,373 $52,135 $48,953 $46,862 $41,731 $43,794LPLSO (4420510) $200 $128 $133 $208 $182 $172 $161 $104LPLSR (4420510) $0 $0 $0 $0 $0 $0 $0 $0HTS-SUB (4420710) $31,490 $33,797 $26,894 $35,898 $33,481 $28,910 $30,541 $28,866HTS-HV (4420710) $1,836 $3,237 $1,496 $4,514 $3,242 $3,048 $3,214 $3,618HS (4421210) $116 $142 $309 $307 $454 $491 $373 $154TOTAL COMMERCIAL $272,389 $274,467 $243,578 $263,116 $294,344 $271,736 $284,458 $247,233
INDUSTRIAL SALESGLP (4420410) $3,752 $3,680 $3,184 $3,544 $3,963 $3,847 $4,216 $3,631GLP-MDO (4420410) $0 $0 $0 $0 $0 $0 $0 $0LPLP (4420610) $7,978 $7,554 $6,904 $7,873 $8,376 $7,675 $7,999 $6,104LPLS (4420610) $7,651 $8,998 $9,088 $5,144 $8,428 $8,643 $10,479 $7,047LPLSH (4420610) $6,569 $4,826 $3,851 $6,749 $6,066 $5,046 $5,516 $5,577LPLSO (4420610) $2 $2 $1 $4 $3 $3 $2 $1LPLSR (4420610) $0 $0 $0 $0 $0 $0 $0 $0HTS-SUB (4420810) $23,055 $21,394 $14,057 $25,059 $22,786 $16,724 $17,647 $19,807HTS-HV (4420810) $404 $1,975 $243 $519 $2,443 $69 $1,268 $468HS (4421110) $4 $4 $6 $7 $11 $12 $8 $4HEP (4421010) $0 $0 $0 $0 $0 $0 $0 $0EHEP (4421010) $0 $0 $0 $0 $0 $0 $0 $0TOTAL INDUSTRIAL $49,415 $48,434 $37,333 $48,900 $52,076 $42,018 $47,135 $42,640
PUB STREET AND HWY LIGHTING SALESSL-PUB (4440310) $3,332 $2,854 $4,194 $4,658 $4,294 $4,072 $3,409 $3,006BPL-POF (4440310) $161 $80 $220 $214 $212 $198 $169 $159GLP-T&S (4440410) $437 $440 $591 $294 $442 $441 $443 $442TOTAL ST. LIGHT. $3,930 $3,374 $5,006 $5,166 $4,948 $4,711 $4,022 $3,607
TOTAL REVENUES $480,695 $447,623 $421,681 $461,111 $525,812 $474,260 $484,061 $407,339
ATTACHMENT B
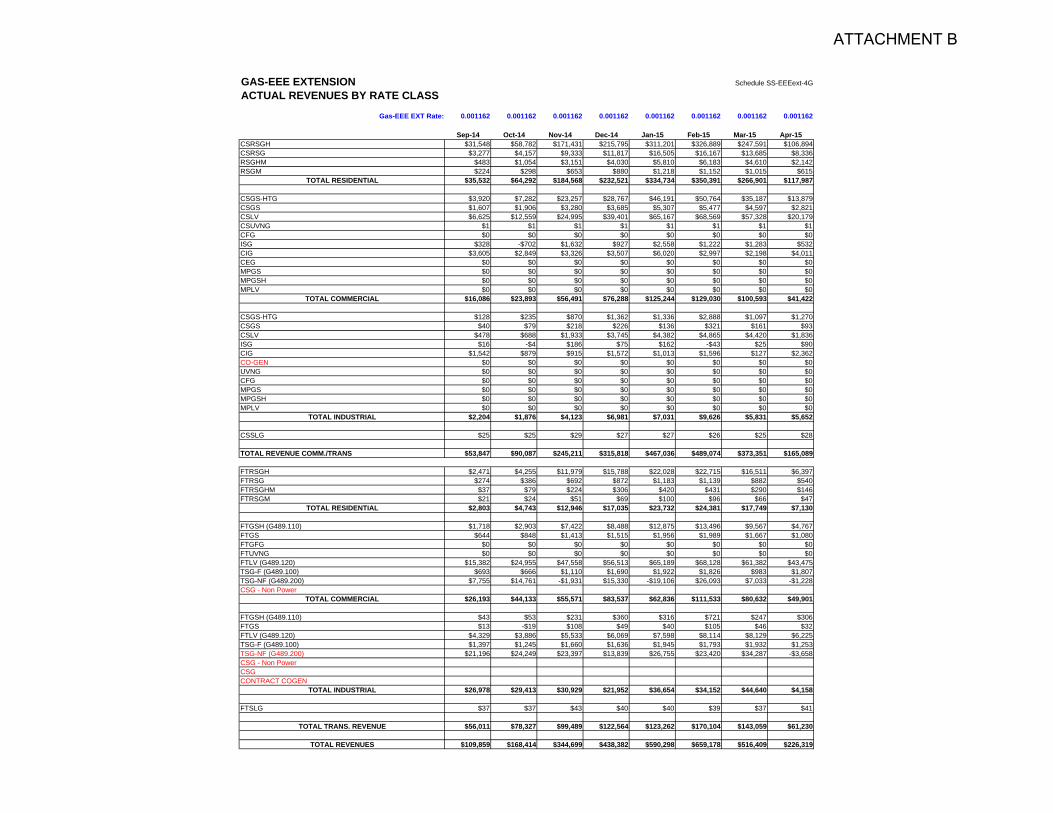
GAS-EEE EXTENSION Schedule SS-EEEext-4G
ACTUAL REVENUES BY RATE CLASS
Gas-EEE EXT Rate: 0.001162 0.001162 0.001162 0.001162 0.001162 0.001162 0.001162 0.001162
Sep-14 Oct-14 Nov-14 Dec-14 Jan-15 Feb-15 Mar-15 Apr-15CSRSGH $31,548 $58,782 $171,431 $215,795 $311,201 $326,889 $247,591 $106,894CSRSG $3,277 $4,157 $9,333 $11,817 $16,505 $16,167 $13,685 $8,336RSGHM $483 $1,054 $3,151 $4,030 $5,810 $6,183 $4,610 $2,142RSGM $224 $298 $653 $880 $1,218 $1,152 $1,015 $615
TOTAL RESIDENTIAL $35,532 $64,292 $184,568 $232,521 $334,734 $350,391 $266,901 $117,987
CSGS-HTG $3,920 $7,282 $23,257 $28,767 $46,191 $50,764 $35,187 $13,879CSGS $1,607 $1,906 $3,280 $3,685 $5,307 $5,477 $4,597 $2,821CSLV $6,625 $12,559 $24,995 $39,401 $65,167 $68,569 $57,328 $20,179CSUVNG $1 $1 $1 $1 $1 $1 $1 $1CFG $0 $0 $0 $0 $0 $0 $0 $0ISG $328 -$702 $1,632 $927 $2,558 $1,222 $1,283 $532CIG $3,605 $2,849 $3,326 $3,507 $6,020 $2,997 $2,198 $4,011CEG $0 $0 $0 $0 $0 $0 $0 $0MPGS $0 $0 $0 $0 $0 $0 $0 $0MPGSH $0 $0 $0 $0 $0 $0 $0 $0MPLV $0 $0 $0 $0 $0 $0 $0 $0
TOTAL COMMERCIAL $16,086 $23,893 $56,491 $76,288 $125,244 $129,030 $100,593 $41,422
CSGS-HTG $128 $235 $870 $1,362 $1,336 $2,888 $1,097 $1,270CSGS $40 $79 $218 $226 $136 $321 $161 $93CSLV $478 $688 $1,933 $3,745 $4,382 $4,865 $4,420 $1,836ISG $16 -$4 $186 $75 $162 -$43 $25 $90CIG $1,542 $879 $915 $1,572 $1,013 $1,596 $127 $2,362CO-GEN $0 $0 $0 $0 $0 $0 $0 $0UVNG $0 $0 $0 $0 $0 $0 $0 $0CFG $0 $0 $0 $0 $0 $0 $0 $0MPGS $0 $0 $0 $0 $0 $0 $0 $0MPGSH $0 $0 $0 $0 $0 $0 $0 $0MPLV $0 $0 $0 $0 $0 $0 $0 $0
TOTAL INDUSTRIAL $2,204 $1,876 $4,123 $6,981 $7,031 $9,626 $5,831 $5,652
CSSLG $25 $25 $29 $27 $27 $26 $25 $28
TOTAL REVENUE COMM./TRANS $53,847 $90,087 $245,211 $315,818 $467,036 $489,074 $373,351 $165,089
FTRSGH $2,471 $4,255 $11,979 $15,788 $22,028 $22,715 $16,511 $6,397FTRSG $274 $386 $692 $872 $1,183 $1,139 $882 $540FTRSGHM $37 $79 $224 $306 $420 $431 $290 $146FTRSGM $21 $24 $51 $69 $100 $96 $66 $47
TOTAL RESIDENTIAL $2,803 $4,743 $12,946 $17,035 $23,732 $24,381 $17,749 $7,130
FTGSH (G489.110) $1,718 $2,903 $7,422 $8,488 $12,875 $13,496 $9,567 $4,767FTGS $644 $848 $1,413 $1,515 $1,956 $1,989 $1,667 $1,080FTGFG $0 $0 $0 $0 $0 $0 $0 $0FTUVNG $0 $0 $0 $0 $0 $0 $0 $0FTLV (G489.120) $15,382 $24,955 $47,558 $56,513 $65,189 $68,128 $61,382 $43,475TSG-F (G489.100) $693 $666 $1,110 $1,690 $1,922 $1,826 $983 $1,807TSG-NF (G489.200) $7,755 $14,761 -$1,931 $15,330 -$19,106 $26,093 $7,033 -$1,228CSG - Non Power
TOTAL COMMERCIAL $26,193 $44,133 $55,571 $83,537 $62,836 $111,533 $80,632 $49,901
FTGSH (G489.110) $43 $53 $231 $360 $316 $721 $247 $306FTGS $13 -$19 $108 $49 $40 $105 $46 $32FTLV (G489.120) $4,329 $3,886 $5,533 $6,069 $7,598 $8,114 $8,129 $6,225TSG-F (G489.100) $1,397 $1,245 $1,660 $1,636 $1,945 $1,793 $1,932 $1,253TSG-NF (G489.200) $21,196 $24,249 $23,397 $13,839 $26,755 $23,420 $34,287 -$3,658CSG - Non PowerCSGCONTRACT COGEN
TOTAL INDUSTRIAL $26,978 $29,413 $30,929 $21,952 $36,654 $34,152 $44,640 $4,158
FTSLG $37 $37 $43 $40 $40 $39 $37 $41
TOTAL TRANS. REVENUE $56,011 $78,327 $99,489 $122,564 $123,262 $170,104 $143,059 $61,230
TOTAL REVENUES $109,859 $168,414 $344,699 $438,382 $590,298 $659,178 $516,409 $226,319
ATTACHMENT B
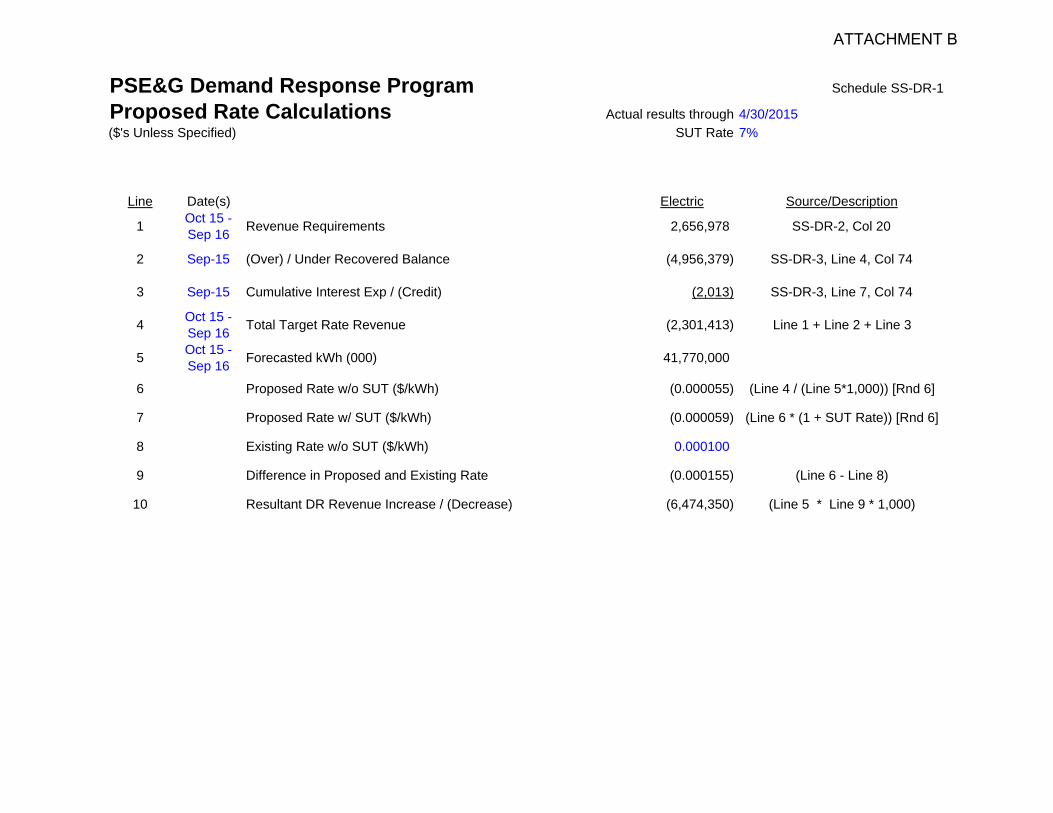
PSE&G Demand Response Program Schedule SS-DR-1
Proposed Rate Calculations Actual results through 4/30/2015($'s Unless Specified) SUT Rate 7%
Line Date(s) Electric Source/Description
1 Oct 15 - Sep 16 Revenue Requirements 2,656,978 SS-DR-2, Col 20
2 Sep-15 (Over) / Under Recovered Balance (4,956,379) SS-DR-3, Line 4, Col 74
3 Sep-15 Cumulative Interest Exp / (Credit) (2,013) SS-DR-3, Line 7, Col 74
4 Oct 15 - Sep 16 Total Target Rate Revenue (2,301,413) Line 1 + Line 2 + Line 3
5 Oct 15 - Sep 16 Forecasted kWh (000) 41,770,000
6 Proposed Rate w/o SUT ($/kWh) (0.000055) (Line 4 / (Line 5*1,000)) [Rnd 6]
7 Proposed Rate w/ SUT ($/kWh) (0.000059) (Line 6 * (1 + SUT Rate)) [Rnd 6]
8 Existing Rate w/o SUT ($/kWh) 0.000100
9 Difference in Proposed and Existing Rate (0.000155) (Line 6 - Line 8)
10 Resultant DR Revenue Increase / (Decrease) (6,474,350) (Line 5 * Line 9 * 1,000)
ATTACHMENT B
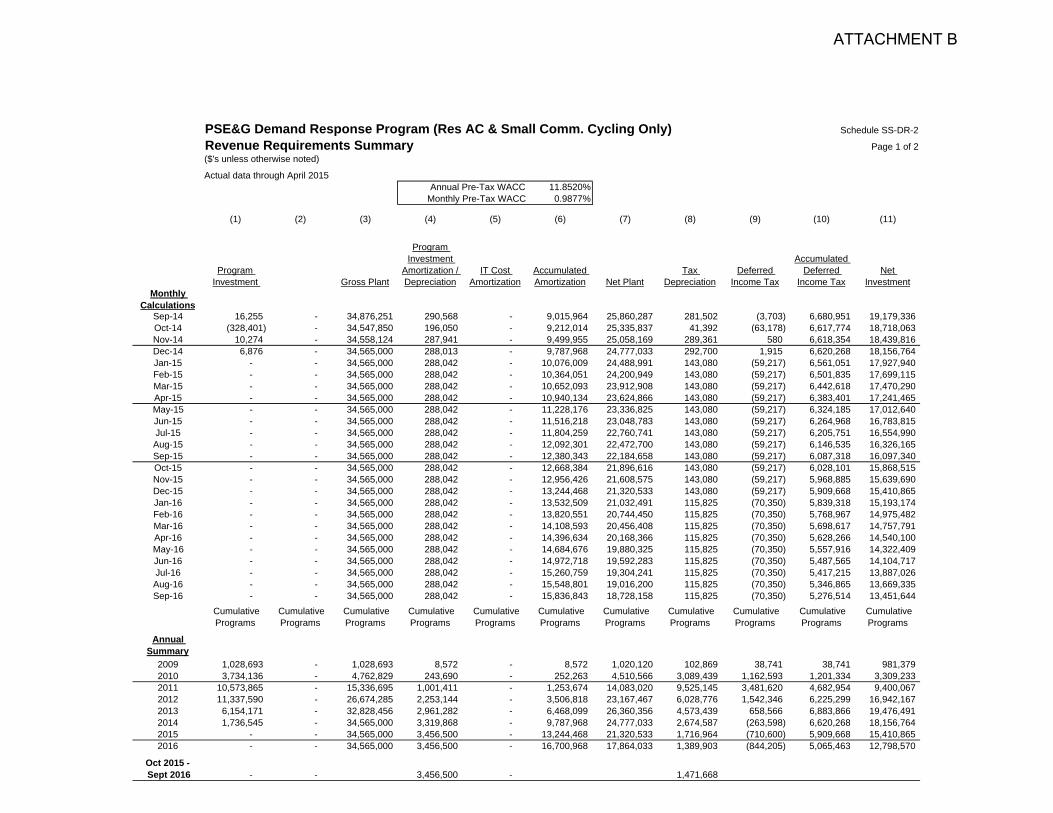
PSE&G Demand Response Program (Res AC & Small Comm. Cycling Only) Schedule SS-DR-2
Revenue Requirements Summary Page 1 of 2($'s unless otherwise noted)
Actual data through April 2015Annual Pre-Tax WACC 11.8520%
Monthly Pre-Tax WACC 0.9877%
(1) (2) (3) (4) (5) (6) (7) (8) (9) (10) (11)
Program Investment Gross Plant
Program Investment
Amortization / Depreciation
IT Cost Amortization
Accumulated Amortization Net Plant
Tax Depreciation
Deferred Income Tax
Accumulated Deferred
Income TaxNet
InvestmentMonthly
CalculationsSep-14 16,255 - 34,876,251 290,568 - 9,015,964 25,860,287 281,502 (3,703) 6,680,951 19,179,336 Oct-14 (328,401) - 34,547,850 196,050 - 9,212,014 25,335,837 41,392 (63,178) 6,617,774 18,718,063 Nov-14 10,274 - 34,558,124 287,941 - 9,499,955 25,058,169 289,361 580 6,618,354 18,439,816 Dec-14 6,876 - 34,565,000 288,013 - 9,787,968 24,777,033 292,700 1,915 6,620,268 18,156,764 Jan-15 - - 34,565,000 288,042 - 10,076,009 24,488,991 143,080 (59,217) 6,561,051 17,927,940 Feb-15 - - 34,565,000 288,042 - 10,364,051 24,200,949 143,080 (59,217) 6,501,835 17,699,115 Mar-15 - - 34,565,000 288,042 - 10,652,093 23,912,908 143,080 (59,217) 6,442,618 17,470,290 Apr-15 - - 34,565,000 288,042 - 10,940,134 23,624,866 143,080 (59,217) 6,383,401 17,241,465 May-15 - - 34,565,000 288,042 - 11,228,176 23,336,825 143,080 (59,217) 6,324,185 17,012,640 Jun-15 - - 34,565,000 288,042 - 11,516,218 23,048,783 143,080 (59,217) 6,264,968 16,783,815 Jul-15 - - 34,565,000 288,042 - 11,804,259 22,760,741 143,080 (59,217) 6,205,751 16,554,990 Aug-15 - - 34,565,000 288,042 - 12,092,301 22,472,700 143,080 (59,217) 6,146,535 16,326,165 Sep-15 - - 34,565,000 288,042 - 12,380,343 22,184,658 143,080 (59,217) 6,087,318 16,097,340 Oct-15 - - 34,565,000 288,042 - 12,668,384 21,896,616 143,080 (59,217) 6,028,101 15,868,515 Nov-15 - - 34,565,000 288,042 - 12,956,426 21,608,575 143,080 (59,217) 5,968,885 15,639,690 Dec-15 - - 34,565,000 288,042 - 13,244,468 21,320,533 143,080 (59,217) 5,909,668 15,410,865 Jan-16 - - 34,565,000 288,042 - 13,532,509 21,032,491 115,825 (70,350) 5,839,318 15,193,174 Feb-16 - - 34,565,000 288,042 - 13,820,551 20,744,450 115,825 (70,350) 5,768,967 14,975,482 Mar-16 - - 34,565,000 288,042 - 14,108,593 20,456,408 115,825 (70,350) 5,698,617 14,757,791 Apr-16 - - 34,565,000 288,042 - 14,396,634 20,168,366 115,825 (70,350) 5,628,266 14,540,100 May-16 - - 34,565,000 288,042 - 14,684,676 19,880,325 115,825 (70,350) 5,557,916 14,322,409 Jun-16 - - 34,565,000 288,042 - 14,972,718 19,592,283 115,825 (70,350) 5,487,565 14,104,717 Jul-16 - - 34,565,000 288,042 - 15,260,759 19,304,241 115,825 (70,350) 5,417,215 13,887,026 Aug-16 - - 34,565,000 288,042 - 15,548,801 19,016,200 115,825 (70,350) 5,346,865 13,669,335 Sep-16 - - 34,565,000 288,042 - 15,836,843 18,728,158 115,825 (70,350) 5,276,514 13,451,644
Cumulative Programs
Cumulative Programs
Cumulative Programs
Cumulative Programs
Cumulative Programs
Cumulative Programs
Cumulative Programs
Cumulative Programs
Cumulative Programs
Cumulative Programs
Cumulative Programs
Annual Summary
2009 1,028,693 - 1,028,693 8,572 - 8,572 1,020,120 102,869 38,741 38,741 981,379 2010 3,734,136 - 4,762,829 243,690 - 252,263 4,510,566 3,089,439 1,162,593 1,201,334 3,309,233 2011 10,573,865 - 15,336,695 1,001,411 - 1,253,674 14,083,020 9,525,145 3,481,620 4,682,954 9,400,067 2012 11,337,590 - 26,674,285 2,253,144 - 3,506,818 23,167,467 6,028,776 1,542,346 6,225,299 16,942,167 2013 6,154,171 - 32,828,456 2,961,282 - 6,468,099 26,360,356 4,573,439 658,566 6,883,866 19,476,491 2014 1,736,545 - 34,565,000 3,319,868 - 9,787,968 24,777,033 2,674,587 (263,598) 6,620,268 18,156,764 2015 - - 34,565,000 3,456,500 - 13,244,468 21,320,533 1,716,964 (710,600) 5,909,668 15,410,865 2016 - - 34,565,000 3,456,500 - 16,700,968 17,864,033 1,389,903 (844,205) 5,065,463 12,798,570
Oct 2015 - Sept 2016 - - 3,456,500 - 1,471,668
ATTACHMENT B
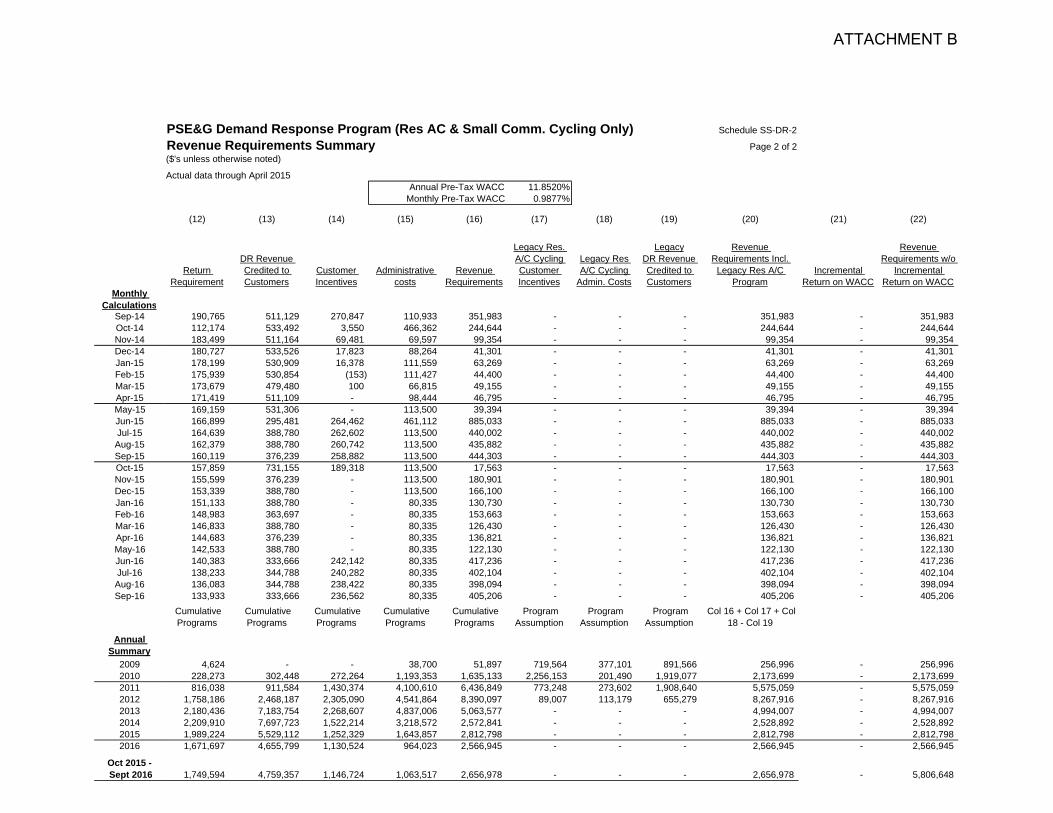
Monthly Calculations
Sep-14Oct-14Nov-14Dec-14Jan-15Feb-15Mar-15Apr-15May-15Jun-15Jul-15Aug-15Sep-15Oct-15Nov-15Dec-15Jan-16Feb-16Mar-16Apr-16May-16Jun-16Jul-16Aug-16Sep-16
Annual Summary
20092010201120122013201420152016
Oct 2015 - Sept 2016
PSE&G Demand Response Program (Res AC & Small Comm. Cycling Only) Schedule SS-DR-2
Revenue Requirements Summary Page 2 of 2($'s unless otherwise noted)
Actual data through April 2015Annual Pre-Tax WACC 11.8520%
Monthly Pre-Tax WACC 0.9877%
(12) (13) (14) (15) (16) (17) (18) (19) (20) (21) (22)
Return Requirement
DR Revenue Credited to Customers
Customer Incentives
Administrative costs
Revenue Requirements
Legacy Res. A/C Cycling Customer Incentives
Legacy Res A/C Cycling
Admin. Costs
LegacyDR Revenue Credited to Customers
Revenue Requirements Incl.
Legacy Res A/C Program
Incremental Return on WACC
Revenue Requirements w/o
Incremental Return on WACC
190,765 511,129 270,847 110,933 351,983 - - - 351,983 - 351,983 112,174 533,492 3,550 466,362 244,644 - - - 244,644 - 244,644 183,499 511,164 69,481 69,597 99,354 - - - 99,354 - 99,354 180,727 533,526 17,823 88,264 41,301 - - - 41,301 - 41,301 178,199 530,909 16,378 111,559 63,269 - - - 63,269 - 63,269 175,939 530,854 (153) 111,427 44,400 - - - 44,400 - 44,400 173,679 479,480 100 66,815 49,155 - - - 49,155 - 49,155 171,419 511,109 - 98,444 46,795 - - - 46,795 - 46,795 169,159 531,306 - 113,500 39,394 - - - 39,394 - 39,394 166,899 295,481 264,462 461,112 885,033 - - - 885,033 - 885,033 164,639 388,780 262,602 113,500 440,002 - - - 440,002 - 440,002 162,379 388,780 260,742 113,500 435,882 - - - 435,882 - 435,882 160,119 376,239 258,882 113,500 444,303 - - - 444,303 - 444,303 157,859 731,155 189,318 113,500 17,563 - - - 17,563 - 17,563 155,599 376,239 - 113,500 180,901 - - - 180,901 - 180,901 153,339 388,780 - 113,500 166,100 - - - 166,100 - 166,100 151,133 388,780 - 80,335 130,730 - - - 130,730 - 130,730 148,983 363,697 - 80,335 153,663 - - - 153,663 - 153,663 146,833 388,780 - 80,335 126,430 - - - 126,430 - 126,430 144,683 376,239 - 80,335 136,821 - - - 136,821 - 136,821 142,533 388,780 - 80,335 122,130 - - - 122,130 - 122,130 140,383 333,666 242,142 80,335 417,236 - - - 417,236 - 417,236 138,233 344,788 240,282 80,335 402,104 - - - 402,104 - 402,104 136,083 344,788 238,422 80,335 398,094 - - - 398,094 - 398,094 133,933 333,666 236,562 80,335 405,206 - - - 405,206 - 405,206
Cumulative Programs
Cumulative Programs
Cumulative Programs
Cumulative Programs
Cumulative Programs
Program Assumption
Program Assumption
Program Assumption
Col 16 + Col 17 + Col 18 - Col 19
4,624 - - 38,700 51,897 719,564 377,101 891,566 256,996 - 256,996 228,273 302,448 272,264 1,193,353 1,635,133 2,256,153 201,490 1,919,077 2,173,699 - 2,173,699 816,038 911,584 1,430,374 4,100,610 6,436,849 773,248 273,602 1,908,640 5,575,059 - 5,575,059
1,758,186 2,468,187 2,305,090 4,541,864 8,390,097 89,007 113,179 655,279 8,267,916 - 8,267,916 2,180,436 7,183,754 2,268,607 4,837,006 5,063,577 - - - 4,994,007 - 4,994,007 2,209,910 7,697,723 1,522,214 3,218,572 2,572,841 - - - 2,528,892 - 2,528,892 1,989,224 5,529,112 1,252,329 1,643,857 2,812,798 - - - 2,812,798 - 2,812,798 1,671,697 4,655,799 1,130,524 964,023 2,566,945 - - - 2,566,945 - 2,566,945
1,749,594 4,759,357 1,146,724 1,063,517 2,656,978 - - - 2,656,978 - 5,806,648
ATTACHMENT B
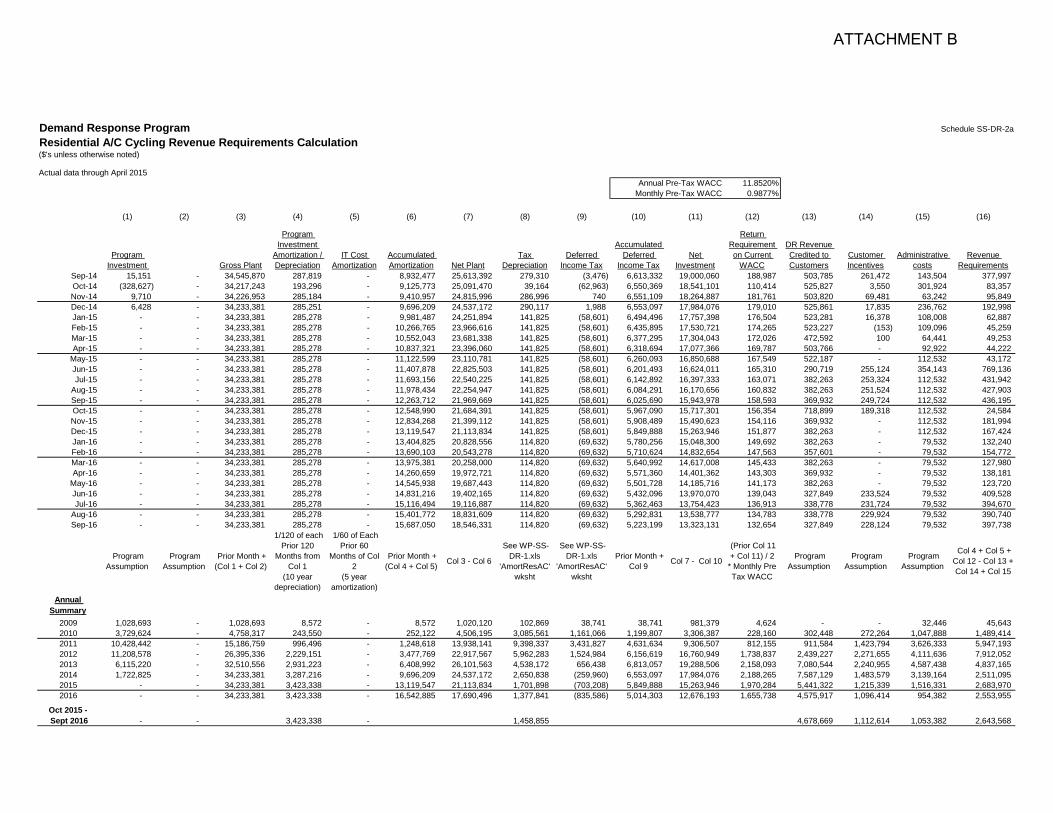
Demand Response Program Schedule SS-DR-2a
Residential A/C Cycling Revenue Requirements Calculation($'s unless otherwise noted)
Actual data through April 2015Annual Pre-Tax WACC 11.8520%
Monthly Pre-Tax WACC 0.9877%
(1) (2) (3) (4) (5) (6) (7) (8) (9) (10) (11) (12) (13) (14) (15) (16)
Program Investment Gross Plant
Program Investment
Amortization / Depreciation
IT Cost Amortization
Accumulated Amortization Net Plant
Tax Depreciation
Deferred Income Tax
Accumulated Deferred
Income TaxNet
Investment
Return Requirement on Current
WACC
DR Revenue Credited to Customers
Customer Incentives
Administrative costs
Revenue Requirements
Sep-14 15,151 - 34,545,870 287,819 - 8,932,477 25,613,392 279,310 (3,476) 6,613,332 19,000,060 188,987 503,785 261,472 143,504 377,997 Oct-14 (328,627) - 34,217,243 193,296 - 9,125,773 25,091,470 39,164 (62,963) 6,550,369 18,541,101 110,414 525,827 3,550 301,924 83,357 Nov-14 9,710 - 34,226,953 285,184 - 9,410,957 24,815,996 286,996 740 6,551,109 18,264,887 181,761 503,820 69,481 63,242 95,849 Dec-14 6,428 - 34,233,381 285,251 - 9,696,209 24,537,172 290,117 1,988 6,553,097 17,984,076 179,010 525,861 17,835 236,762 192,998 Jan-15 - - 34,233,381 285,278 - 9,981,487 24,251,894 141,825 (58,601) 6,494,496 17,757,398 176,504 523,281 16,378 108,008 62,887 Feb-15 - - 34,233,381 285,278 - 10,266,765 23,966,616 141,825 (58,601) 6,435,895 17,530,721 174,265 523,227 (153) 109,096 45,259 Mar-15 - - 34,233,381 285,278 - 10,552,043 23,681,338 141,825 (58,601) 6,377,295 17,304,043 172,026 472,592 100 64,441 49,253 Apr-15 - - 34,233,381 285,278 - 10,837,321 23,396,060 141,825 (58,601) 6,318,694 17,077,366 169,787 503,766 - 92,922 44,222
May-15 - - 34,233,381 285,278 - 11,122,599 23,110,781 141,825 (58,601) 6,260,093 16,850,688 167,549 522,187 - 112,532 43,172 Jun-15 - - 34,233,381 285,278 - 11,407,878 22,825,503 141,825 (58,601) 6,201,493 16,624,011 165,310 290,719 255,124 354,143 769,136 Jul-15 - - 34,233,381 285,278 - 11,693,156 22,540,225 141,825 (58,601) 6,142,892 16,397,333 163,071 382,263 253,324 112,532 431,942
Aug-15 - - 34,233,381 285,278 - 11,978,434 22,254,947 141,825 (58,601) 6,084,291 16,170,656 160,832 382,263 251,524 112,532 427,903 Sep-15 - - 34,233,381 285,278 - 12,263,712 21,969,669 141,825 (58,601) 6,025,690 15,943,978 158,593 369,932 249,724 112,532 436,195 Oct-15 - - 34,233,381 285,278 - 12,548,990 21,684,391 141,825 (58,601) 5,967,090 15,717,301 156,354 718,899 189,318 112,532 24,584 Nov-15 - - 34,233,381 285,278 - 12,834,268 21,399,112 141,825 (58,601) 5,908,489 15,490,623 154,116 369,932 - 112,532 181,994 Dec-15 - - 34,233,381 285,278 - 13,119,547 21,113,834 141,825 (58,601) 5,849,888 15,263,946 151,877 382,263 - 112,532 167,424 Jan-16 - - 34,233,381 285,278 - 13,404,825 20,828,556 114,820 (69,632) 5,780,256 15,048,300 149,692 382,263 - 79,532 132,240 Feb-16 - - 34,233,381 285,278 - 13,690,103 20,543,278 114,820 (69,632) 5,710,624 14,832,654 147,563 357,601 - 79,532 154,772 Mar-16 - - 34,233,381 285,278 - 13,975,381 20,258,000 114,820 (69,632) 5,640,992 14,617,008 145,433 382,263 - 79,532 127,980 Apr-16 - - 34,233,381 285,278 - 14,260,659 19,972,721 114,820 (69,632) 5,571,360 14,401,362 143,303 369,932 - 79,532 138,181
May-16 - - 34,233,381 285,278 - 14,545,938 19,687,443 114,820 (69,632) 5,501,728 14,185,716 141,173 382,263 - 79,532 123,720 Jun-16 - - 34,233,381 285,278 - 14,831,216 19,402,165 114,820 (69,632) 5,432,096 13,970,070 139,043 327,849 233,524 79,532 409,528 Jul-16 - - 34,233,381 285,278 - 15,116,494 19,116,887 114,820 (69,632) 5,362,463 13,754,423 136,913 338,778 231,724 79,532 394,670
Aug-16 - - 34,233,381 285,278 - 15,401,772 18,831,609 114,820 (69,632) 5,292,831 13,538,777 134,783 338,778 229,924 79,532 390,740 Sep-16 - - 34,233,381 285,278 - 15,687,050 18,546,331 114,820 (69,632) 5,223,199 13,323,131 132,654 327,849 228,124 79,532 397,738
Program Assumption
Program Assumption
Prior Month + (Col 1 + Col 2)
1/120 of each Prior 120
Months from Col 1
(10 year depreciation)
1/60 of Each Prior 60
Months of Col 2
(5 year amortization)
Prior Month + (Col 4 + Col 5) Col 3 - Col 6
See WP-SS-DR-1.xls
'AmortResAC' wksht
See WP-SS-DR-1.xls
'AmortResAC' wksht
Prior Month + Col 9 Col 7 - Col 10
(Prior Col 11 + Col 11) / 2* Monthly Pre Tax WACC
Program Assumption
Program Assumption
Program Assumption
Col 4 + Col 5 + Col 12 - Col 13 + Col 14 + Col 15
Annual Summary
2009 1,028,693 - 1,028,693 8,572 - 8,572 1,020,120 102,869 38,741 38,741 981,379 4,624 - - 32,446 45,643 2010 3,729,624 - 4,758,317 243,550 - 252,122 4,506,195 3,085,561 1,161,066 1,199,807 3,306,387 228,160 302,448 272,264 1,047,888 1,489,414 2011 10,428,442 - 15,186,759 996,496 - 1,248,618 13,938,141 9,398,337 3,431,827 4,631,634 9,306,507 812,155 911,584 1,423,794 3,626,333 5,947,193 2012 11,208,578 - 26,395,336 2,229,151 - 3,477,769 22,917,567 5,962,283 1,524,984 6,156,619 16,760,949 1,738,837 2,439,227 2,271,655 4,111,636 7,912,052 2013 6,115,220 - 32,510,556 2,931,223 - 6,408,992 26,101,563 4,538,172 656,438 6,813,057 19,288,506 2,158,093 7,080,544 2,240,955 4,587,438 4,837,165 2014 1,722,825 - 34,233,381 3,287,216 - 9,696,209 24,537,172 2,650,838 (259,960) 6,553,097 17,984,076 2,188,265 7,587,129 1,483,579 3,139,164 2,511,095 2015 - - 34,233,381 3,423,338 - 13,119,547 21,113,834 1,701,898 (703,208) 5,849,888 15,263,946 1,970,284 5,441,322 1,215,339 1,516,331 2,683,970 2016 - - 34,233,381 3,423,338 - 16,542,885 17,690,496 1,377,841 (835,586) 5,014,303 12,676,193 1,655,738 4,575,917 1,096,414 954,382 2,553,955
Oct 2015 - Sept 2016 - - 3,423,338 - 1,458,855 4,678,669 1,112,614 1,053,382 2,643,568
ATTACHMENT B
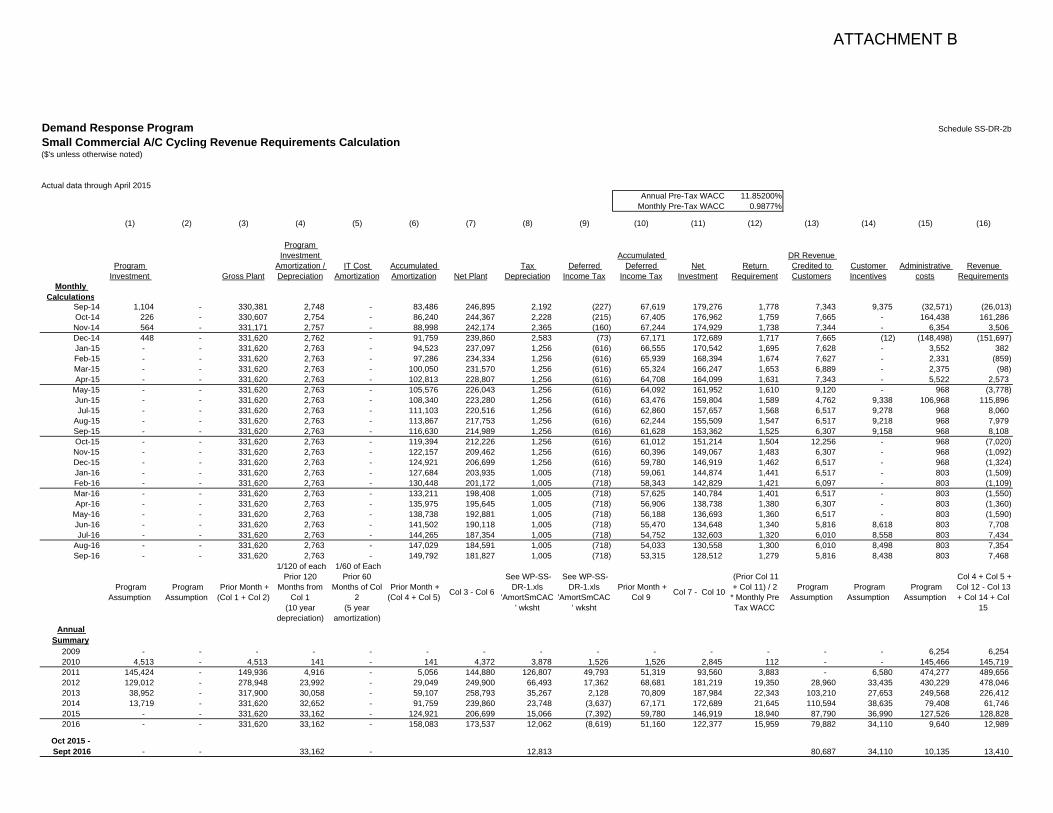
Demand Response Program Schedule SS-DR-2b
Small Commercial A/C Cycling Revenue Requirements Calculation($'s unless otherwise noted)
Actual data through April 2015Annual Pre-Tax WACC 11.85200%
Monthly Pre-Tax WACC 0.9877%
(1) (2) (3) (4) (5) (6) (7) (8) (9) (10) (11) (12) (13) (14) (15) (16)
Program Investment Gross Plant
Program Investment
Amortization / Depreciation
IT Cost Amortization
Accumulated Amortization Net Plant
Tax Depreciation
Deferred Income Tax
Accumulated Deferred
Income TaxNet
InvestmentReturn
Requirement
DR Revenue Credited to Customers
Customer Incentives
Administrative costs
Revenue Requirements
Monthly Calculations
Sep-14 1,104 - 330,381 2,748 - 83,486 246,895 2,192 (227) 67,619 179,276 1,778 7,343 9,375 (32,571) (26,013) Oct-14 226 - 330,607 2,754 - 86,240 244,367 2,228 (215) 67,405 176,962 1,759 7,665 - 164,438 161,286 Nov-14 564 - 331,171 2,757 - 88,998 242,174 2,365 (160) 67,244 174,929 1,738 7,344 - 6,354 3,506 Dec-14 448 - 331,620 2,762 - 91,759 239,860 2,583 (73) 67,171 172,689 1,717 7,665 (12) (148,498) (151,697) Jan-15 - - 331,620 2,763 - 94,523 237,097 1,256 (616) 66,555 170,542 1,695 7,628 - 3,552 382 Feb-15 - - 331,620 2,763 - 97,286 234,334 1,256 (616) 65,939 168,394 1,674 7,627 - 2,331 (859) Mar-15 - - 331,620 2,763 - 100,050 231,570 1,256 (616) 65,324 166,247 1,653 6,889 - 2,375 (98) Apr-15 - - 331,620 2,763 - 102,813 228,807 1,256 (616) 64,708 164,099 1,631 7,343 - 5,522 2,573
May-15 - - 331,620 2,763 - 105,576 226,043 1,256 (616) 64,092 161,952 1,610 9,120 - 968 (3,778) Jun-15 - - 331,620 2,763 - 108,340 223,280 1,256 (616) 63,476 159,804 1,589 4,762 9,338 106,968 115,896 Jul-15 - - 331,620 2,763 - 111,103 220,516 1,256 (616) 62,860 157,657 1,568 6,517 9,278 968 8,060
Aug-15 - - 331,620 2,763 - 113,867 217,753 1,256 (616) 62,244 155,509 1,547 6,517 9,218 968 7,979 Sep-15 - - 331,620 2,763 - 116,630 214,989 1,256 (616) 61,628 153,362 1,525 6,307 9,158 968 8,108 Oct-15 - - 331,620 2,763 - 119,394 212,226 1,256 (616) 61,012 151,214 1,504 12,256 - 968 (7,020) Nov-15 - - 331,620 2,763 - 122,157 209,462 1,256 (616) 60,396 149,067 1,483 6,307 - 968 (1,092) Dec-15 - - 331,620 2,763 - 124,921 206,699 1,256 (616) 59,780 146,919 1,462 6,517 - 968 (1,324) Jan-16 - - 331,620 2,763 - 127,684 203,935 1,005 (718) 59,061 144,874 1,441 6,517 - 803 (1,509) Feb-16 - - 331,620 2,763 - 130,448 201,172 1,005 (718) 58,343 142,829 1,421 6,097 - 803 (1,109) Mar-16 - - 331,620 2,763 - 133,211 198,408 1,005 (718) 57,625 140,784 1,401 6,517 - 803 (1,550) Apr-16 - - 331,620 2,763 - 135,975 195,645 1,005 (718) 56,906 138,738 1,380 6,307 - 803 (1,360)
May-16 - - 331,620 2,763 - 138,738 192,881 1,005 (718) 56,188 136,693 1,360 6,517 - 803 (1,590) Jun-16 - - 331,620 2,763 - 141,502 190,118 1,005 (718) 55,470 134,648 1,340 5,816 8,618 803 7,708 Jul-16 - - 331,620 2,763 - 144,265 187,354 1,005 (718) 54,752 132,603 1,320 6,010 8,558 803 7,434
Aug-16 - - 331,620 2,763 - 147,029 184,591 1,005 (718) 54,033 130,558 1,300 6,010 8,498 803 7,354 Sep-16 - - 331,620 2,763 - 149,792 181,827 1,005 (718) 53,315 128,512 1,279 5,816 8,438 803 7,468
Program Assumption
Program Assumption
Prior Month + (Col 1 + Col 2)
1/120 of each Prior 120
Months from Col 1
(10 year depreciation)
1/60 of Each Prior 60
Months of Col 2
(5 year amortization)
Prior Month + (Col 4 + Col 5) Col 3 - Col 6
See WP-SS-DR-1.xls
'AmortSmCAC' wksht
See WP-SS-DR-1.xls
'AmortSmCAC' wksht
Prior Month + Col 9 Col 7 - Col 10
(Prior Col 11 + Col 11) / 2* Monthly Pre Tax WACC
Program Assumption
Program Assumption
Program Assumption
Col 4 + Col 5 + Col 12 - Col 13 + Col 14 + Col
15
Annual Summary
2009 - - - - - - - - - - - - - - 6,254 6,254 2010 4,513 - 4,513 141 - 141 4,372 3,878 1,526 1,526 2,845 112 - - 145,466 145,719 2011 145,424 - 149,936 4,916 - 5,056 144,880 126,807 49,793 51,319 93,560 3,883 - 6,580 474,277 489,656 2012 129,012 - 278,948 23,992 - 29,049 249,900 66,493 17,362 68,681 181,219 19,350 28,960 33,435 430,229 478,046 2013 38,952 - 317,900 30,058 - 59,107 258,793 35,267 2,128 70,809 187,984 22,343 103,210 27,653 249,568 226,412 2014 13,719 - 331,620 32,652 - 91,759 239,860 23,748 (3,637) 67,171 172,689 21,645 110,594 38,635 79,408 61,746 2015 - - 331,620 33,162 - 124,921 206,699 15,066 (7,392) 59,780 146,919 18,940 87,790 36,990 127,526 128,828 2016 - - 331,620 33,162 - 158,083 173,537 12,062 (8,619) 51,160 122,377 15,959 79,882 34,110 9,640 12,989
Oct 2015 - Sept 2016 - - 33,162 - 12,813 80,687 34,110 10,135 13,410
ATTACHMENT B
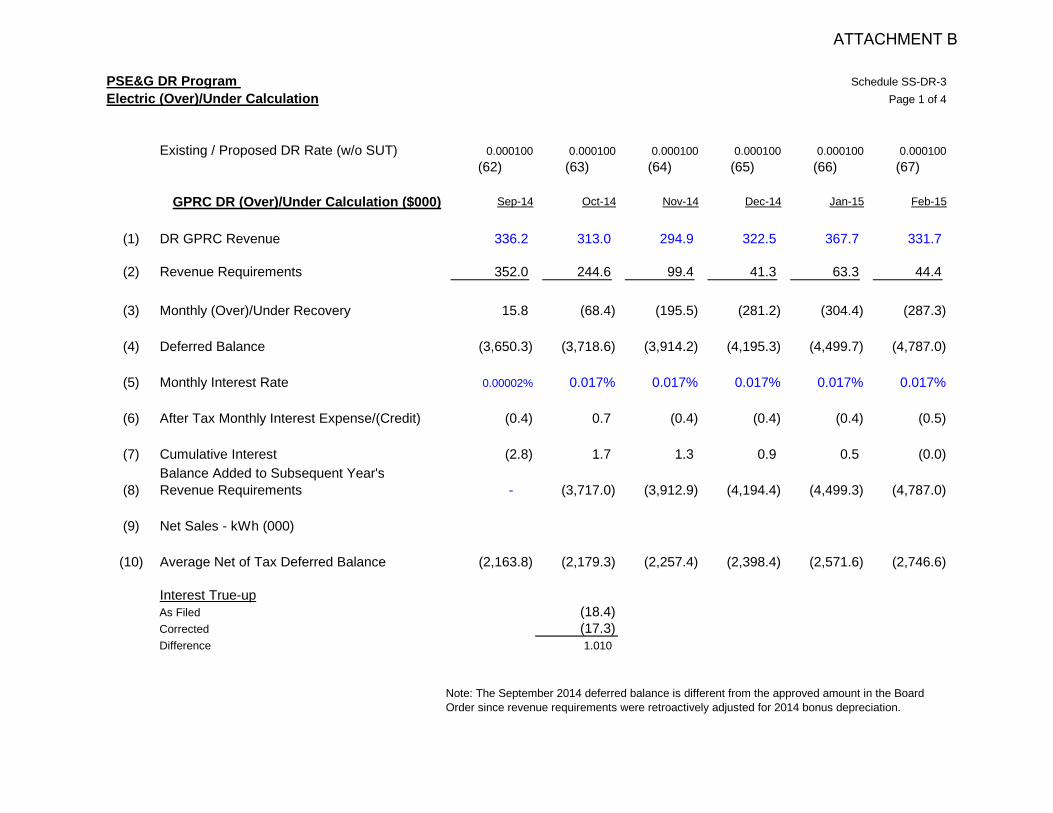
PSE&G DR Program Schedule SS-DR-3Electric (Over)/Under Calculation Page 1 of 4
Existing / Proposed DR Rate (w/o SUT) 0.000100 0.000100 0.000100 0.000100 0.000100 0.000100(62) (63) (64) (65) (66) (67)
GPRC DR (Over)/Under Calculation ($000) Sep-14 Oct-14 Nov-14 Dec-14 Jan-15 Feb-15
(1) DR GPRC Revenue 336.2 313.0 294.9 322.5 367.7 331.7
(2) Revenue Requirements 352.0 244.6 99.4 41.3 63.3 44.4
(3) Monthly (Over)/Under Recovery 15.8 (68.4) (195.5) (281.2) (304.4) (287.3)
(4) Deferred Balance (3,650.3) (3,718.6) (3,914.2) (4,195.3) (4,499.7) (4,787.0)
(5) Monthly Interest Rate 0.00002% 0.017% 0.017% 0.017% 0.017% 0.017%
(6) After Tax Monthly Interest Expense/(Credit) (0.4) 0.7 (0.4) (0.4) (0.4) (0.5)
(7) Cumulative Interest (2.8) 1.7 1.3 0.9 0.5 (0.0)
(8)Balance Added to Subsequent Year's Revenue Requirements - (3,717.0) (3,912.9) (4,194.4) (4,499.3) (4,787.0)
(9) Net Sales - kWh (000)
(10) Average Net of Tax Deferred Balance (2,163.8) (2,179.3) (2,257.4) (2,398.4) (2,571.6) (2,746.6)
Interest True-upAs Filed (18.4) Corrected (17.3) Difference 1.010
Note: The September 2014 deferred balance is different from the approved amount in the Board Order since revenue requirements were retroactively adjusted for 2014 bonus depreciation.
ATTACHMENT B
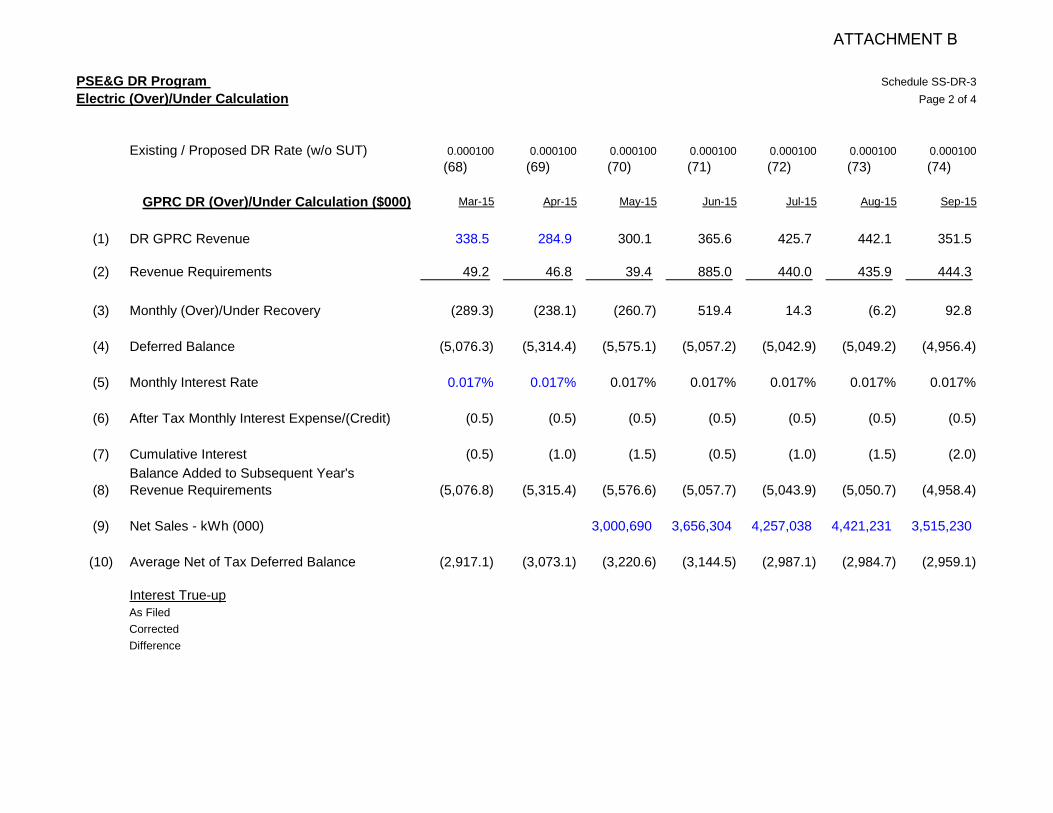
PSE&G DR Program Electric (Over)/Under Calculation
Existing / Proposed DR Rate (w/o SUT)
GPRC DR (Over)/Under Calculation ($000)
(1) DR GPRC Revenue
(2) Revenue Requirements
(3) Monthly (Over)/Under Recovery
(4) Deferred Balance
(5) Monthly Interest Rate
(6) After Tax Monthly Interest Expense/(Credit)
(7) Cumulative Interest
(8)Balance Added to Subsequent Year's Revenue Requirements
(9) Net Sales - kWh (000)
(10) Average Net of Tax Deferred Balance
Interest True-upAs FiledCorrectedDifference
Schedule SS-DR-3Page 2 of 4
0.000100 0.000100 0.000100 0.000100 0.000100 0.000100 0.000100(68) (69) (70) (71) (72) (73) (74)
Mar-15 Apr-15 May-15 Jun-15 Jul-15 Aug-15 Sep-15
338.5 284.9 300.1 365.6 425.7 442.1 351.5
49.2 46.8 39.4 885.0 440.0 435.9 444.3
(289.3) (238.1) (260.7) 519.4 14.3 (6.2) 92.8
(5,076.3) (5,314.4) (5,575.1) (5,057.2) (5,042.9) (5,049.2) (4,956.4)
0.017% 0.017% 0.017% 0.017% 0.017% 0.017% 0.017%
(0.5) (0.5) (0.5) (0.5) (0.5) (0.5) (0.5)
(0.5) (1.0) (1.5) (0.5) (1.0) (1.5) (2.0)
(5,076.8) (5,315.4) (5,576.6) (5,057.7) (5,043.9) (5,050.7) (4,958.4)
3,000,690 3,656,304 4,257,038 4,421,231 3,515,230
(2,917.1) (3,073.1) (3,220.6) (3,144.5) (2,987.1) (2,984.7) (2,959.1)
ATTACHMENT B
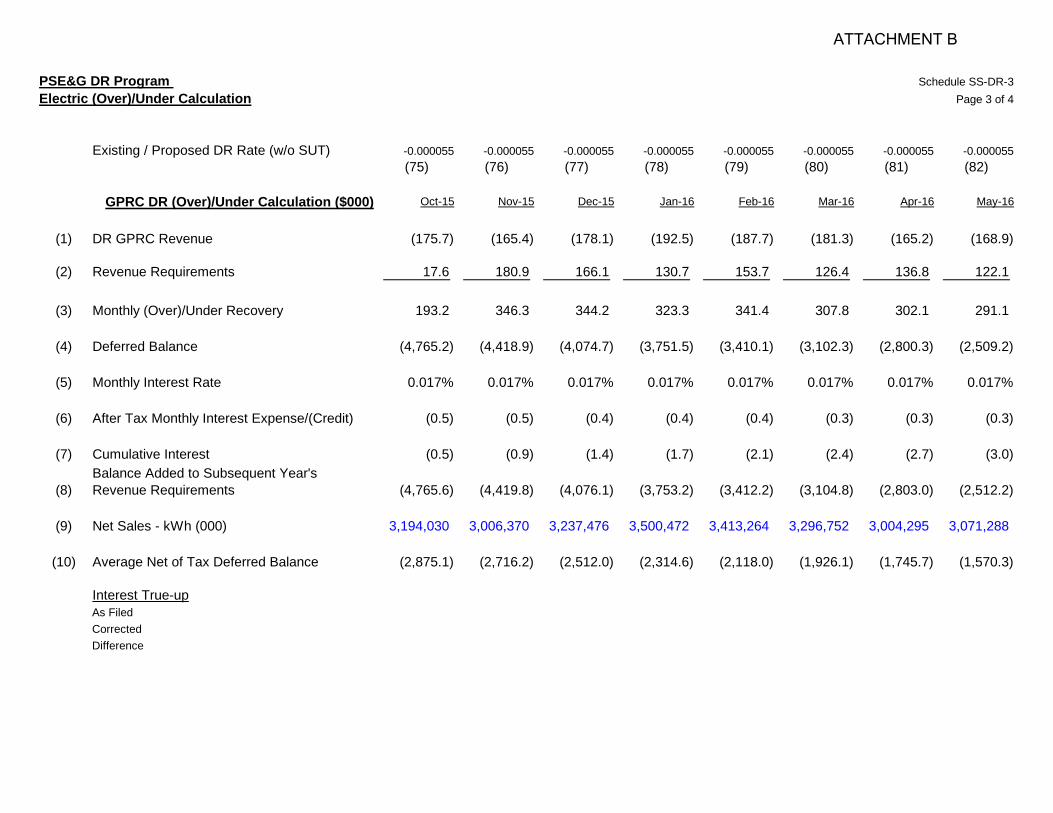
PSE&G DR Program Electric (Over)/Under Calculation
Existing / Proposed DR Rate (w/o SUT)
GPRC DR (Over)/Under Calculation ($000)
(1) DR GPRC Revenue
(2) Revenue Requirements
(3) Monthly (Over)/Under Recovery
(4) Deferred Balance
(5) Monthly Interest Rate
(6) After Tax Monthly Interest Expense/(Credit)
(7) Cumulative Interest
(8)Balance Added to Subsequent Year's Revenue Requirements
(9) Net Sales - kWh (000)
(10) Average Net of Tax Deferred Balance
Interest True-upAs FiledCorrectedDifference
Schedule SS-DR-3Page 3 of 4
-0.000055 -0.000055 -0.000055 -0.000055 -0.000055 -0.000055 -0.000055 -0.000055(75) (76) (77) (78) (79) (80) (81) (82)
Oct-15 Nov-15 Dec-15 Jan-16 Feb-16 Mar-16 Apr-16 May-16
(175.7) (165.4) (178.1) (192.5) (187.7) (181.3) (165.2) (168.9)
17.6 180.9 166.1 130.7 153.7 126.4 136.8 122.1
193.2 346.3 344.2 323.3 341.4 307.8 302.1 291.1
(4,765.2) (4,418.9) (4,074.7) (3,751.5) (3,410.1) (3,102.3) (2,800.3) (2,509.2)
0.017% 0.017% 0.017% 0.017% 0.017% 0.017% 0.017% 0.017%
(0.5) (0.5) (0.4) (0.4) (0.4) (0.3) (0.3) (0.3)
(0.5) (0.9) (1.4) (1.7) (2.1) (2.4) (2.7) (3.0)
(4,765.6) (4,419.8) (4,076.1) (3,753.2) (3,412.2) (3,104.8) (2,803.0) (2,512.2)
3,194,030 3,006,370 3,237,476 3,500,472 3,413,264 3,296,752 3,004,295 3,071,288
(2,875.1) (2,716.2) (2,512.0) (2,314.6) (2,118.0) (1,926.1) (1,745.7) (1,570.3)
ATTACHMENT B
PSE&G DR Program Electric (Over)/Under Calculation
Existing / Proposed DR Rate (w/o SUT)
GPRC DR (Over)/Under Calculation ($000)
(1) DR GPRC Revenue
(2) Revenue Requirements
(3) Monthly (Over)/Under Recovery
(4) Deferred Balance
(5) Monthly Interest Rate
(6) After Tax Monthly Interest Expense/(Credit)
(7) Cumulative Interest
(8)Balance Added to Subsequent Year's Revenue Requirements
(9) Net Sales - kWh (000)
(10) Average Net of Tax Deferred Balance
Interest True-upAs FiledCorrectedDifference
Schedule SS-DR-3Page 4 of 4
-0.000055 -0.000055 -0.000055 -0.000055(83) (84) (85) (86)
Jun-16 Jul-16 Aug-16 Sep-16
(200.7) (239.4) (247.4) (195.0) DR Rate * Row 9
417.2 402.1 398.1 405.2 From SS-2, Col 20
618.0 641.5 645.5 600.2 Row 2 - Row 1
(1,891.3) (1,249.8) (604.3) (4.1) Prev Row 4 + Row 3
0.017% 0.017% 0.017% 0.017% Annual Interest Rate / 12
(0.2) (0.2) (0.1) (0.0) (Prev Row 4 + Row 4) / 2(1 - Tax Rate) * Row 5
(3.2) (3.3) (3.4) (3.5) Prev Row 7 + Row 6
(1,894.4) (1,253.1) (607.7) (7.5) Row 4 + Row 7 + 11
3,649,807 4,352,820 4,497,538 3,545,888
(1,301.4) (929.0) (548.3) (179.9) (Prev Row 4 + Row 4) / 2 *(1 - Tax Rate)
ATTACHMENT B
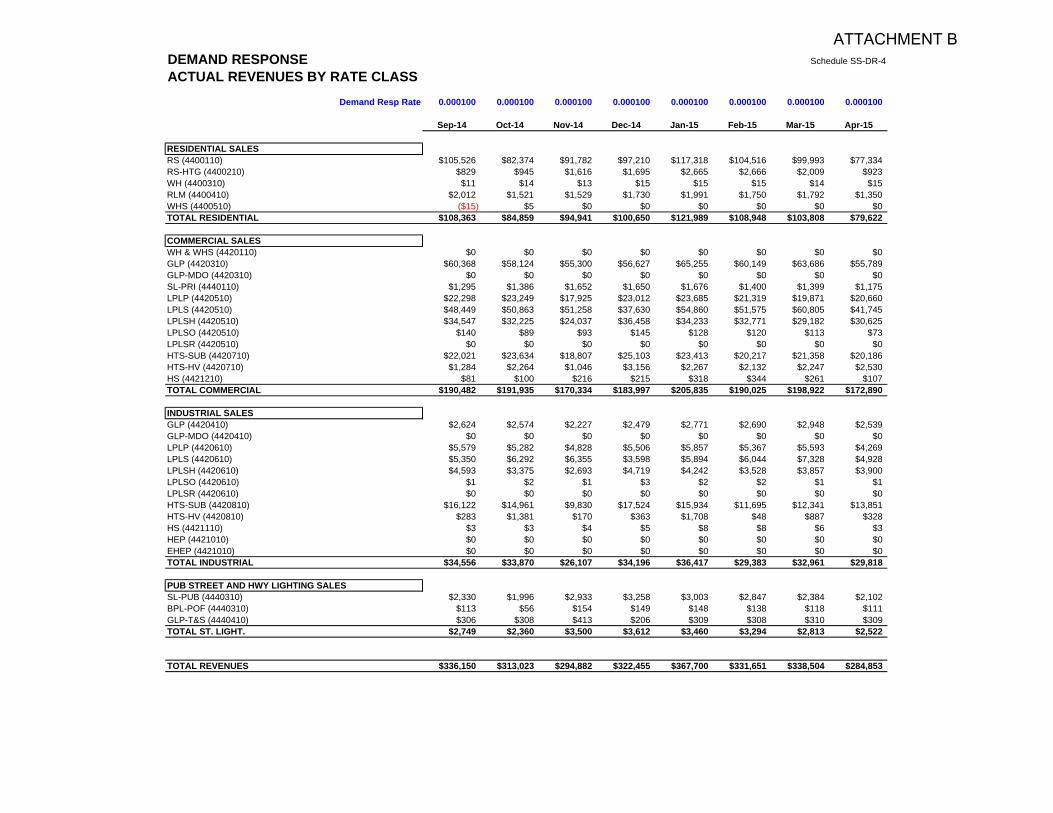
DEMAND RESPONSE Schedule SS-DR-4
ACTUAL REVENUES BY RATE CLASSDemand Resp Rate 0.000100 0.000100 0.000100 0.000100 0.000100 0.000100 0.000100 0.000100
Sep-14 Oct-14 Nov-14 Dec-14 Jan-15 Feb-15 Mar-15 Apr-15
RESIDENTIAL SALESRS (4400110) $105,526 $82,374 $91,782 $97,210 $117,318 $104,516 $99,993 $77,334RS-HTG (4400210) $829 $945 $1,616 $1,695 $2,665 $2,666 $2,009 $923WH (4400310) $11 $14 $13 $15 $15 $15 $14 $15RLM (4400410) $2,012 $1,521 $1,529 $1,730 $1,991 $1,750 $1,792 $1,350WHS (4400510) ($15) $5 $0 $0 $0 $0 $0 $0TOTAL RESIDENTIAL $108,363 $84,859 $94,941 $100,650 $121,989 $108,948 $103,808 $79,622
COMMERCIAL SALESWH & WHS (4420110) $0 $0 $0 $0 $0 $0 $0 $0GLP (4420310) $60,368 $58,124 $55,300 $56,627 $65,255 $60,149 $63,686 $55,789GLP-MDO (4420310) $0 $0 $0 $0 $0 $0 $0 $0SL-PRI (4440110) $1,295 $1,386 $1,652 $1,650 $1,676 $1,400 $1,399 $1,175LPLP (4420510) $22,298 $23,249 $17,925 $23,012 $23,685 $21,319 $19,871 $20,660LPLS (4420510) $48,449 $50,863 $51,258 $37,630 $54,860 $51,575 $60,805 $41,745LPLSH (4420510) $34,547 $32,225 $24,037 $36,458 $34,233 $32,771 $29,182 $30,625LPLSO (4420510) $140 $89 $93 $145 $128 $120 $113 $73LPLSR (4420510) $0 $0 $0 $0 $0 $0 $0 $0HTS-SUB (4420710) $22,021 $23,634 $18,807 $25,103 $23,413 $20,217 $21,358 $20,186HTS-HV (4420710) $1,284 $2,264 $1,046 $3,156 $2,267 $2,132 $2,247 $2,530HS (4421210) $81 $100 $216 $215 $318 $344 $261 $107TOTAL COMMERCIAL $190,482 $191,935 $170,334 $183,997 $205,835 $190,025 $198,922 $172,890
INDUSTRIAL SALESGLP (4420410) $2,624 $2,574 $2,227 $2,479 $2,771 $2,690 $2,948 $2,539GLP-MDO (4420410) $0 $0 $0 $0 $0 $0 $0 $0LPLP (4420610) $5,579 $5,282 $4,828 $5,506 $5,857 $5,367 $5,593 $4,269LPLS (4420610) $5,350 $6,292 $6,355 $3,598 $5,894 $6,044 $7,328 $4,928LPLSH (4420610) $4,593 $3,375 $2,693 $4,719 $4,242 $3,528 $3,857 $3,900LPLSO (4420610) $1 $2 $1 $3 $2 $2 $1 $1LPLSR (4420610) $0 $0 $0 $0 $0 $0 $0 $0HTS-SUB (4420810) $16,122 $14,961 $9,830 $17,524 $15,934 $11,695 $12,341 $13,851HTS-HV (4420810) $283 $1,381 $170 $363 $1,708 $48 $887 $328HS (4421110) $3 $3 $4 $5 $8 $8 $6 $3HEP (4421010) $0 $0 $0 $0 $0 $0 $0 $0EHEP (4421010) $0 $0 $0 $0 $0 $0 $0 $0TOTAL INDUSTRIAL $34,556 $33,870 $26,107 $34,196 $36,417 $29,383 $32,961 $29,818
PUB STREET AND HWY LIGHTING SALESSL-PUB (4440310) $2,330 $1,996 $2,933 $3,258 $3,003 $2,847 $2,384 $2,102BPL-POF (4440310) $113 $56 $154 $149 $148 $138 $118 $111GLP-T&S (4440410) $306 $308 $413 $206 $309 $308 $310 $309TOTAL ST. LIGHT. $2,749 $2,360 $3,500 $3,612 $3,460 $3,294 $2,813 $2,522
TOTAL REVENUES $336,150 $313,023 $294,882 $322,455 $367,700 $331,651 $338,504 $284,853
ATTACHMENT B
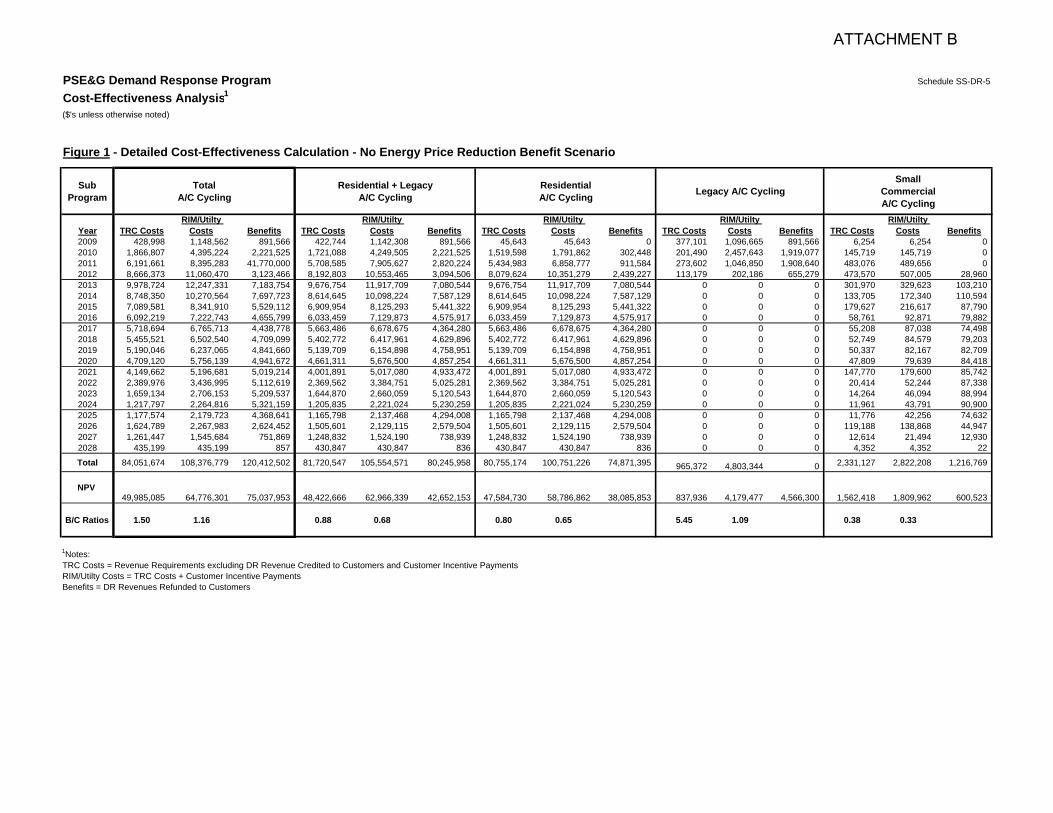
PSE&G Demand Response Program Schedule SS-DR-5
Cost-Effectiveness Analysis1
($'s unless otherwise noted)
Figure 1 - Detailed Cost-Effectiveness Calculation - No Energy Price Reduction Benefit Scenario
Sub Program
TotalA/C Cycling
Residential + LegacyA/C Cycling
ResidentialA/C Cycling Legacy A/C Cycling
Small Commercial A/C Cycling
Year TRC CostsRIM/Utilty
Costs Benefits TRC CostsRIM/Utilty
Costs Benefits TRC CostsRIM/Utilty
Costs Benefits TRC CostsRIM/Utilty
Costs Benefits TRC CostsRIM/Utilty
Costs Benefits2009 428,998 1,148,562 891,566 422,744 1,142,308 891,566 45,643 45,643 0 377,101 1,096,665 891,566 6,254 6,254 02010 1,866,807 4,395,224 2,221,525 1,721,088 4,249,505 2,221,525 1,519,598 1,791,862 302,448 201,490 2,457,643 1,919,077 145,719 145,719 02011 6,191,661 8,395,283 41,770,000 5,708,585 7,905,627 2,820,224 5,434,983 6,858,777 911,584 273,602 1,046,850 1,908,640 483,076 489,656 02012 8,666,373 11,060,470 3,123,466 8,192,803 10,553,465 3,094,506 8,079,624 10,351,279 2,439,227 113,179 202,186 655,279 473,570 507,005 28,9602013 9,978,724 12,247,331 7,183,754 9,676,754 11,917,709 7,080,544 9,676,754 11,917,709 7,080,544 0 0 0 301,970 329,623 103,2102014 8,748,350 10,270,564 7,697,723 8,614,645 10,098,224 7,587,129 8,614,645 10,098,224 7,587,129 0 0 0 133,705 172,340 110,5942015 7,089,581 8,341,910 5,529,112 6,909,954 8,125,293 5,441,322 6,909,954 8,125,293 5,441,322 0 0 0 179,627 216,617 87,7902016 6,092,219 7,222,743 4,655,799 6,033,459 7,129,873 4,575,917 6,033,459 7,129,873 4,575,917 0 0 0 58,761 92,871 79,8822017 5,718,694 6,765,713 4,438,778 5,663,486 6,678,675 4,364,280 5,663,486 6,678,675 4,364,280 0 0 0 55,208 87,038 74,4982018 5,455,521 6,502,540 4,709,099 5,402,772 6,417,961 4,629,896 5,402,772 6,417,961 4,629,896 0 0 0 52,749 84,579 79,2032019 5,190,046 6,237,065 4,841,660 5,139,709 6,154,898 4,758,951 5,139,709 6,154,898 4,758,951 0 0 0 50,337 82,167 82,7092020 4,709,120 5,756,139 4,941,672 4,661,311 5,676,500 4,857,254 4,661,311 5,676,500 4,857,254 0 0 0 47,809 79,639 84,4182021 4,149,662 5,196,681 5,019,214 4,001,891 5,017,080 4,933,472 4,001,891 5,017,080 4,933,472 0 0 0 147,770 179,600 85,7422022 2,389,976 3,436,995 5,112,619 2,369,562 3,384,751 5,025,281 2,369,562 3,384,751 5,025,281 0 0 0 20,414 52,244 87,3382023 1,659,134 2,706,153 5,209,537 1,644,870 2,660,059 5,120,543 1,644,870 2,660,059 5,120,543 0 0 0 14,264 46,094 88,9942024 1,217,797 2,264,816 5,321,159 1,205,835 2,221,024 5,230,259 1,205,835 2,221,024 5,230,259 0 0 0 11,961 43,791 90,9002025 1,177,574 2,179,723 4,368,641 1,165,798 2,137,468 4,294,008 1,165,798 2,137,468 4,294,008 0 0 0 11,776 42,256 74,6322026 1,624,789 2,267,983 2,624,452 1,505,601 2,129,115 2,579,504 1,505,601 2,129,115 2,579,504 0 0 0 119,188 138,868 44,9472027 1,261,447 1,545,684 751,869 1,248,832 1,524,190 738,939 1,248,832 1,524,190 738,939 0 0 0 12,614 21,494 12,9302028 435,199 435,199 857 430,847 430,847 836 430,847 430,847 836 0 0 0 4,352 4,352 22
Total 84,051,674 108,376,779 120,412,502 81,720,547 105,554,571 80,245,958 80,755,174 100,751,226 74,871,395 965,372 4,803,344 0 2,331,127 2,822,208 1,216,769
NPV 49,985,085 64,776,301 75,037,953 48,422,666 62,966,339 42,652,153 47,584,730 58,786,862 38,085,853 837,936 4,179,477 4,566,300 1,562,418 1,809,962 600,523
B/C Ratios 1.50 1.16 0.88 0.68 0.80 0.65 5.45 1.09 0.38 0.33
1Notes:TRC Costs = Revenue Requirements excluding DR Revenue Credited to Customers and Customer Incentive PaymentsRIM/Utilty Costs = TRC Costs + Customer Incentive PaymentsBenefits = DR Revenues Refunded to Customers
ATTACHMENT B
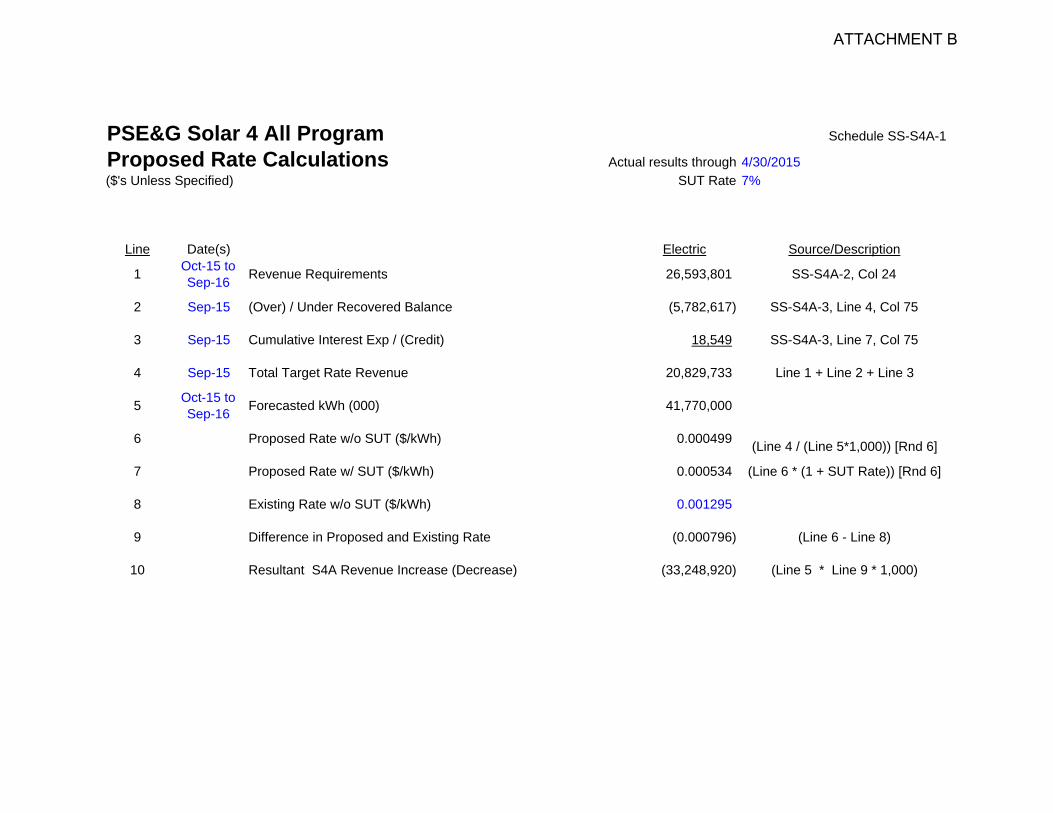
PSE&G Solar 4 All Program Schedule SS-S4A-1
Proposed Rate Calculations Actual results through 4/30/2015($'s Unless Specified) SUT Rate 7%
Line Date(s) Electric Source/Description
1 Oct-15 to Sep-16 Revenue Requirements 26,593,801 SS-S4A-2, Col 24
2 Sep-15 (Over) / Under Recovered Balance (5,782,617) SS-S4A-3, Line 4, Col 75
3 Sep-15 Cumulative Interest Exp / (Credit) 18,549 SS-S4A-3, Line 7, Col 75
4 Sep-15 Total Target Rate Revenue 20,829,733 Line 1 + Line 2 + Line 3
5 Oct-15 to Sep-16 Forecasted kWh (000) 41,770,000
6 Proposed Rate w/o SUT ($/kWh) 0.000499 (Line 4 / (Line 5*1,000)) [Rnd 6]
7 Proposed Rate w/ SUT ($/kWh) 0.000534 (Line 6 * (1 + SUT Rate)) [Rnd 6]
8 Existing Rate w/o SUT ($/kWh) 0.001295
9 Difference in Proposed and Existing Rate (0.000796) (Line 6 - Line 8)
10 Resultant S4A Revenue Increase (Decrease) (33,248,920) (Line 5 * Line 9 * 1,000)
ATTACHMENT B
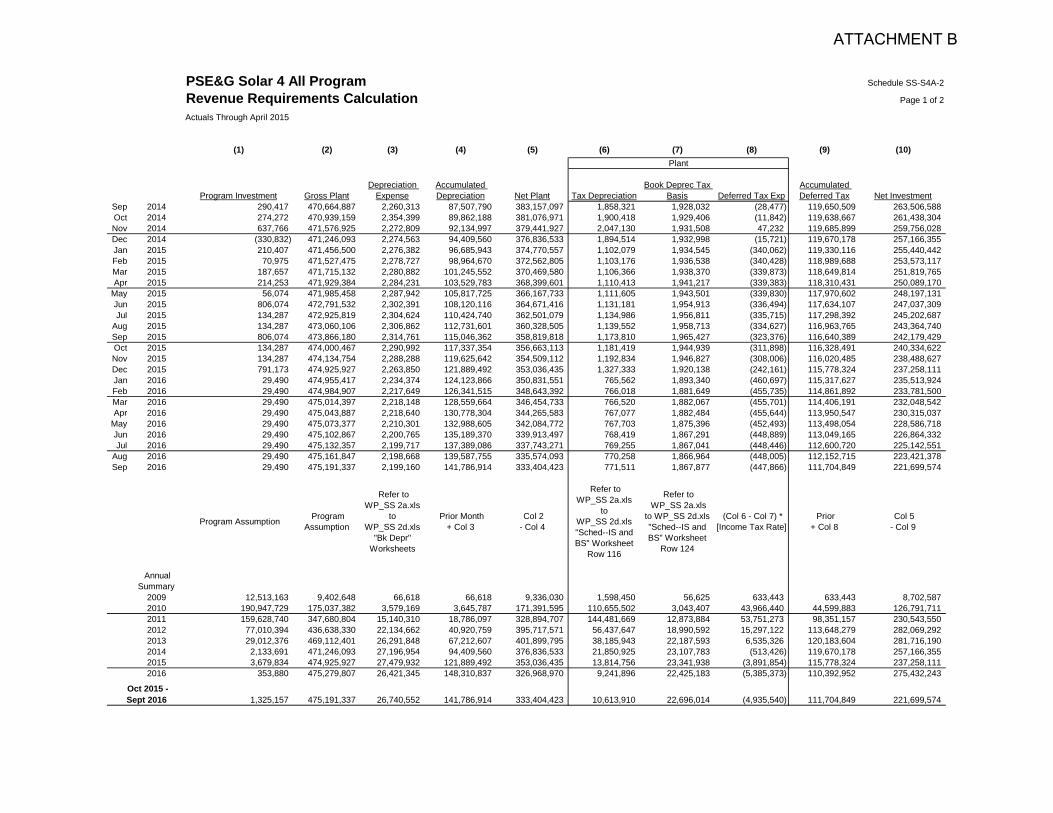
PSE&G Solar 4 All Program Schedule SS-S4A-2
Revenue Requirements Calculation Page 1 of 2
Actuals Through April 2015
(1) (2) (3) (4) (5) (6) (7) (8) (9) (10)Plant
Program Investment Gross PlantDepreciation
ExpenseAccumulated Depreciation Net Plant Tax Depreciation
Book Deprec Tax Basis Deferred Tax Exp
Accumulated Deferred Tax Net Investment
Sep 2014 290,417 470,664,887 2,260,313 87,507,790 383,157,097 1,858,321 1,928,032 (28,477) 119,650,509 263,506,588 Oct 2014 274,272 470,939,159 2,354,399 89,862,188 381,076,971 1,900,418 1,929,406 (11,842) 119,638,667 261,438,304 Nov 2014 637,766 471,576,925 2,272,809 92,134,997 379,441,927 2,047,130 1,931,508 47,232 119,685,899 259,756,028 Dec 2014 (330,832) 471,246,093 2,274,563 94,409,560 376,836,533 1,894,514 1,932,998 (15,721) 119,670,178 257,166,355 Jan 2015 210,407 471,456,500 2,276,382 96,685,943 374,770,557 1,102,079 1,934,545 (340,062) 119,330,116 255,440,442 Feb 2015 70,975 471,527,475 2,278,727 98,964,670 372,562,805 1,103,176 1,936,538 (340,428) 118,989,688 253,573,117 Mar 2015 187,657 471,715,132 2,280,882 101,245,552 370,469,580 1,106,366 1,938,370 (339,873) 118,649,814 251,819,765 Apr 2015 214,253 471,929,384 2,284,231 103,529,783 368,399,601 1,110,413 1,941,217 (339,383) 118,310,431 250,089,170
May 2015 56,074 471,985,458 2,287,942 105,817,725 366,167,733 1,111,605 1,943,501 (339,830) 117,970,602 248,197,131 Jun 2015 806,074 472,791,532 2,302,391 108,120,116 364,671,416 1,131,181 1,954,913 (336,494) 117,634,107 247,037,309 Jul 2015 134,287 472,925,819 2,304,624 110,424,740 362,501,079 1,134,986 1,956,811 (335,715) 117,298,392 245,202,687
Aug 2015 134,287 473,060,106 2,306,862 112,731,601 360,328,505 1,139,552 1,958,713 (334,627) 116,963,765 243,364,740 Sep 2015 806,074 473,866,180 2,314,761 115,046,362 358,819,818 1,173,810 1,965,427 (323,376) 116,640,389 242,179,429 Oct 2015 134,287 474,000,467 2,290,992 117,337,354 356,663,113 1,181,419 1,944,939 (311,898) 116,328,491 240,334,622 Nov 2015 134,287 474,134,754 2,288,288 119,625,642 354,509,112 1,192,834 1,946,827 (308,006) 116,020,485 238,488,627 Dec 2015 791,173 474,925,927 2,263,850 121,889,492 353,036,435 1,327,333 1,920,138 (242,161) 115,778,324 237,258,111 Jan 2016 29,490 474,955,417 2,234,374 124,123,866 350,831,551 765,562 1,893,340 (460,697) 115,317,627 235,513,924 Feb 2016 29,490 474,984,907 2,217,649 126,341,515 348,643,392 766,018 1,881,649 (455,735) 114,861,892 233,781,500 Mar 2016 29,490 475,014,397 2,218,148 128,559,664 346,454,733 766,520 1,882,067 (455,701) 114,406,191 232,048,542 Apr 2016 29,490 475,043,887 2,218,640 130,778,304 344,265,583 767,077 1,882,484 (455,644) 113,950,547 230,315,037
May 2016 29,490 475,073,377 2,210,301 132,988,605 342,084,772 767,703 1,875,396 (452,493) 113,498,054 228,586,718 Jun 2016 29,490 475,102,867 2,200,765 135,189,370 339,913,497 768,419 1,867,291 (448,889) 113,049,165 226,864,332 Jul 2016 29,490 475,132,357 2,199,717 137,389,086 337,743,271 769,255 1,867,041 (448,446) 112,600,720 225,142,551
Aug 2016 29,490 475,161,847 2,198,668 139,587,755 335,574,093 770,258 1,866,964 (448,005) 112,152,715 223,421,378 Sep 2016 29,490 475,191,337 2,199,160 141,786,914 333,404,423 771,511 1,867,877 (447,866) 111,704,849 221,699,574
Program Assumption Program Assumption
Refer to WP_SS 2a.xls
toWP_SS 2d.xls
"Bk Depr" Worksheets
Prior Month+ Col 3
Col 2- Col 4
Refer to WP_SS 2a.xls
toWP_SS 2d.xls"Sched--IS and BS" Worksheet
Row 116
Refer to WP_SS 2a.xls
to WP_SS 2d.xls"Sched--IS and BS" Worksheet
Row 124
(Col 6 - Col 7) * [Income Tax Rate]
Prior+ Col 8
Col 5- Col 9
Annual Summary
2009 12,513,163 9,402,648 66,618 66,618 9,336,030 1,598,450 56,625 633,443 633,443 8,702,587 2010 190,947,729 175,037,382 3,579,169 3,645,787 171,391,595 110,655,502 3,043,407 43,966,440 44,599,883 126,791,711 2011 159,628,740 347,680,804 15,140,310 18,786,097 328,894,707 144,481,669 12,873,884 53,751,273 98,351,157 230,543,550 2012 77,010,394 436,638,330 22,134,662 40,920,759 395,717,571 56,437,647 18,990,592 15,297,122 113,648,279 282,069,292 2013 29,012,376 469,112,401 26,291,848 67,212,607 401,899,795 38,185,943 22,187,593 6,535,326 120,183,604 281,716,190 2014 2,133,691 471,246,093 27,196,954 94,409,560 376,836,533 21,850,925 23,107,783 (513,426) 119,670,178 257,166,355 2015 3,679,834 474,925,927 27,479,932 121,889,492 353,036,435 13,814,756 23,341,938 (3,891,854) 115,778,324 237,258,111 2016 353,880 475,279,807 26,421,345 148,310,837 326,968,970 9,241,896 22,425,183 (5,385,373) 110,392,952 275,432,243
1,325,157 475,191,337 26,740,552 141,786,914 333,404,423 10,613,910 22,696,014 (4,935,540) 111,704,849 221,699,574 Oct 2015 - Sept 2016
ATTACHMENT B
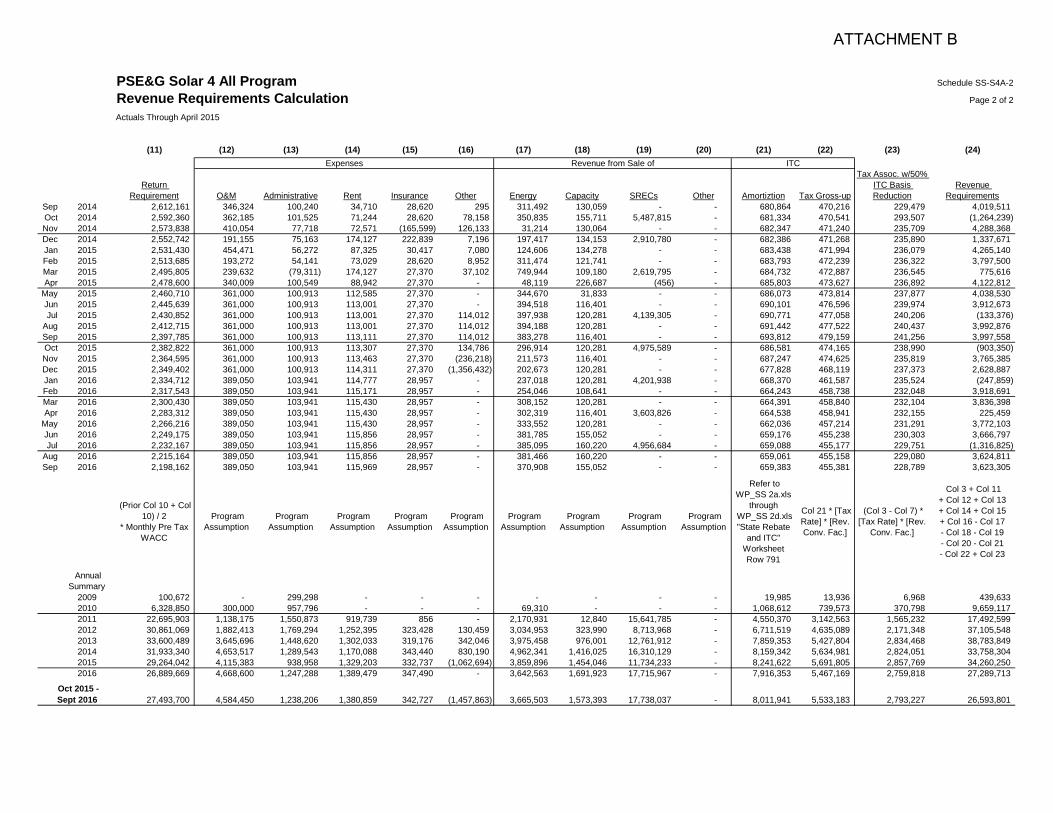
Sep 2014Oct 2014Nov 2014Dec 2014Jan 2015Feb 2015Mar 2015Apr 2015
May 2015Jun 2015Jul 2015
Aug 2015Sep 2015Oct 2015Nov 2015Dec 2015Jan 2016Feb 2016Mar 2016Apr 2016
May 2016Jun 2016Jul 2016
Aug 2016Sep 2016
Annual Summary
20092010201120122013201420152016
Oct 2015 - Sept 2016
PSE&G Solar 4 All Program Schedule SS-S4A-2
Revenue Requirements Calculation Page 2 of 2
Actuals Through April 2015
(11) (12) (13) (14) (15) (16) (17) (18) (19) (20) (21) (22) (23) (24)Expenses Revenue from Sale of ITC
Return Requirement O&M Administrative Rent Insurance Other Energy Capacity SRECs Other Amortiztion Tax Gross-up
Tax Assoc. w/50% ITC Basis Reduction
Revenue Requirements
2,612,161 346,324 100,240 34,710 28,620 295 311,492 130,059 - - 680,864 470,216 229,479 4,019,511 2,592,360 362,185 101,525 71,244 28,620 78,158 350,835 155,711 5,487,815 - 681,334 470,541 293,507 (1,264,239) 2,573,838 410,054 77,718 72,571 (165,599) 126,133 31,214 130,064 - - 682,347 471,240 235,709 4,288,368 2,552,742 191,155 75,163 174,127 222,839 7,196 197,417 134,153 2,910,780 - 682,386 471,268 235,890 1,337,671 2,531,430 454,471 56,272 87,325 30,417 7,080 124,606 134,278 - - 683,438 471,994 236,079 4,265,140 2,513,685 193,272 54,141 73,029 28,620 8,952 311,474 121,741 - - 683,793 472,239 236,322 3,797,500 2,495,805 239,632 (79,311) 174,127 27,370 37,102 749,944 109,180 2,619,795 - 684,732 472,887 236,545 775,616 2,478,600 340,009 100,549 88,942 27,370 - 48,119 226,687 (456) - 685,803 473,627 236,892 4,122,812 2,460,710 361,000 100,913 112,585 27,370 - 344,670 31,833 - - 686,073 473,814 237,877 4,038,530 2,445,639 361,000 100,913 113,001 27,370 - 394,518 116,401 - - 690,101 476,596 239,974 3,912,673 2,430,852 361,000 100,913 113,001 27,370 114,012 397,938 120,281 4,139,305 - 690,771 477,058 240,206 (133,376) 2,412,715 361,000 100,913 113,001 27,370 114,012 394,188 120,281 - - 691,442 477,522 240,437 3,992,876 2,397,785 361,000 100,913 113,111 27,370 114,012 383,278 116,401 - - 693,812 479,159 241,256 3,997,558 2,382,822 361,000 100,913 113,307 27,370 134,786 296,914 120,281 4,975,589 - 686,581 474,165 238,990 (903,350) 2,364,595 361,000 100,913 113,463 27,370 (236,218) 211,573 116,401 - - 687,247 474,625 235,819 3,765,385 2,349,402 361,000 100,913 114,311 27,370 (1,356,432) 202,673 120,281 - - 677,828 468,119 237,373 2,628,887 2,334,712 389,050 103,941 114,777 28,957 - 237,018 120,281 4,201,938 - 668,370 461,587 235,524 (247,859) 2,317,543 389,050 103,941 115,171 28,957 - 254,046 108,641 - - 664,243 458,738 232,048 3,918,691 2,300,430 389,050 103,941 115,430 28,957 - 308,152 120,281 - - 664,391 458,840 232,104 3,836,398 2,283,312 389,050 103,941 115,430 28,957 - 302,319 116,401 3,603,826 - 664,538 458,941 232,155 225,459 2,266,216 389,050 103,941 115,430 28,957 - 333,552 120,281 - - 662,036 457,214 231,291 3,772,103 2,249,175 389,050 103,941 115,856 28,957 - 381,785 155,052 - - 659,176 455,238 230,303 3,666,797 2,232,167 389,050 103,941 115,856 28,957 - 385,095 160,220 4,956,684 - 659,088 455,177 229,751 (1,316,825) 2,215,164 389,050 103,941 115,856 28,957 - 381,466 160,220 - - 659,061 455,158 229,080 3,624,811 2,198,162 389,050 103,941 115,969 28,957 - 370,908 155,052 - - 659,383 455,381 228,789 3,623,305
(Prior Col 10 + Col 10) / 2
* Monthly Pre Tax WACC
Program Assumption
Program Assumption
Program Assumption
Program Assumption
Program Assumption
Program Assumption
Program Assumption
Program Assumption
Program Assumption
Refer toWP_SS 2a.xls
through WP_SS 2d.xls"State Rebate
and ITC" WorksheetRow 791
Col 21 * [Tax Rate] * [Rev. Conv. Fac.]
(Col 3 - Col 7) * [Tax Rate] * [Rev.
Conv. Fac.]
Col 3 + Col 11+ Col 12 + Col 13+ Col 14 + Col 15+ Col 16 - Col 17- Col 18 - Col 19- Col 20 - Col 21- Col 22 + Col 23
100,672 - 299,298 - - - - - - - 19,985 13,936 6,968 439,633 6,328,850 300,000 957,796 - - - 69,310 - - - 1,068,612 739,573 370,798 9,659,117
22,695,903 1,138,175 1,550,873 919,739 856 - 2,170,931 12,840 15,641,785 - 4,550,370 3,142,563 1,565,232 17,492,599 30,861,069 1,882,413 1,769,294 1,252,395 323,428 130,459 3,034,953 323,990 8,713,968 - 6,711,519 4,635,089 2,171,348 37,105,548 33,600,489 3,645,696 1,448,620 1,302,033 319,176 342,046 3,975,458 976,001 12,761,912 - 7,859,353 5,427,804 2,834,468 38,783,849 31,933,340 4,653,517 1,289,543 1,170,088 343,440 830,190 4,962,341 1,416,025 16,310,129 - 8,159,342 5,634,981 2,824,051 33,758,304 29,264,042 4,115,383 938,958 1,329,203 332,737 (1,062,694) 3,859,896 1,454,046 11,734,233 - 8,241,622 5,691,805 2,857,769 34,260,250 26,889,669 4,668,600 1,247,288 1,389,479 347,490 - 3,642,563 1,691,923 17,715,967 - 7,916,353 5,467,169 2,759,818 27,289,713
27,493,700 4,584,450 1,238,206 1,380,859 342,727 (1,457,863) 3,665,503 1,573,393 17,738,037 - 8,011,941 5,533,183 2,793,227 26,593,801
ATTACHMENT B
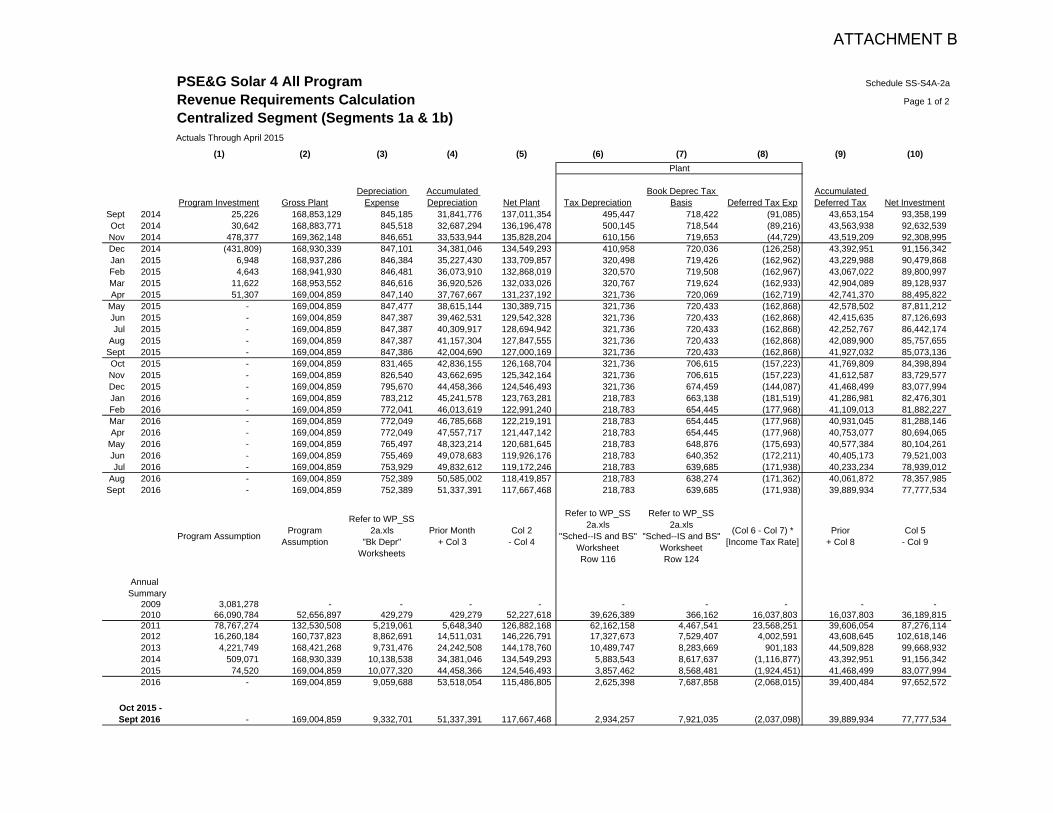
PSE&G Solar 4 All Program Schedule SS-S4A-2a
Revenue Requirements Calculation Page 1 of 2
Centralized Segment (Segments 1a & 1b)Actuals Through April 2015
(1) (2) (3) (4) (5) (6) (7) (8) (9) (10)
Program Investment Gross PlantDepreciation
ExpenseAccumulated Depreciation Net Plant Tax Depreciation
Book Deprec Tax Basis Deferred Tax Exp
Accumulated Deferred Tax Net Investment
Sept 2014 25,226 168,853,129 845,185 31,841,776 137,011,354 495,447 718,422 (91,085) 43,653,154 93,358,199 Oct 2014 30,642 168,883,771 845,518 32,687,294 136,196,478 500,145 718,544 (89,216) 43,563,938 92,632,539 Nov 2014 478,377 169,362,148 846,651 33,533,944 135,828,204 610,156 719,653 (44,729) 43,519,209 92,308,995 Dec 2014 (431,809) 168,930,339 847,101 34,381,046 134,549,293 410,958 720,036 (126,258) 43,392,951 91,156,342 Jan 2015 6,948 168,937,286 846,384 35,227,430 133,709,857 320,498 719,426 (162,962) 43,229,988 90,479,868 Feb 2015 4,643 168,941,930 846,481 36,073,910 132,868,019 320,570 719,508 (162,967) 43,067,022 89,800,997 Mar 2015 11,622 168,953,552 846,616 36,920,526 132,033,026 320,767 719,624 (162,933) 42,904,089 89,128,937 Apr 2015 51,307 169,004,859 847,140 37,767,667 131,237,192 321,736 720,069 (162,719) 42,741,370 88,495,822
May 2015 - 169,004,859 847,477 38,615,144 130,389,715 321,736 720,433 (162,868) 42,578,502 87,811,212 Jun 2015 - 169,004,859 847,387 39,462,531 129,542,328 321,736 720,433 (162,868) 42,415,635 87,126,693 Jul 2015 - 169,004,859 847,387 40,309,917 128,694,942 321,736 720,433 (162,868) 42,252,767 86,442,174
Aug 2015 - 169,004,859 847,387 41,157,304 127,847,555 321,736 720,433 (162,868) 42,089,900 85,757,655 Sept 2015 - 169,004,859 847,386 42,004,690 127,000,169 321,736 720,433 (162,868) 41,927,032 85,073,136 Oct 2015 - 169,004,859 831,465 42,836,155 126,168,704 321,736 706,615 (157,223) 41,769,809 84,398,894 Nov 2015 - 169,004,859 826,540 43,662,695 125,342,164 321,736 706,615 (157,223) 41,612,587 83,729,577 Dec 2015 - 169,004,859 795,670 44,458,366 124,546,493 321,736 674,459 (144,087) 41,468,499 83,077,994 Jan 2016 - 169,004,859 783,212 45,241,578 123,763,281 218,783 663,138 (181,519) 41,286,981 82,476,301 Feb 2016 - 169,004,859 772,041 46,013,619 122,991,240 218,783 654,445 (177,968) 41,109,013 81,882,227 Mar 2016 - 169,004,859 772,049 46,785,668 122,219,191 218,783 654,445 (177,968) 40,931,045 81,288,146 Apr 2016 - 169,004,859 772,049 47,557,717 121,447,142 218,783 654,445 (177,968) 40,753,077 80,694,065
May 2016 - 169,004,859 765,497 48,323,214 120,681,645 218,783 648,876 (175,693) 40,577,384 80,104,261 Jun 2016 - 169,004,859 755,469 49,078,683 119,926,176 218,783 640,352 (172,211) 40,405,173 79,521,003 Jul 2016 - 169,004,859 753,929 49,832,612 119,172,246 218,783 639,685 (171,938) 40,233,234 78,939,012
Aug 2016 - 169,004,859 752,389 50,585,002 118,419,857 218,783 638,274 (171,362) 40,061,872 78,357,985 Sept 2016 - 169,004,859 752,389 51,337,391 117,667,468 218,783 639,685 (171,938) 39,889,934 77,777,534
Program Assumption Program Assumption
Refer to WP_SS 2a.xls
"Bk Depr" Worksheets
Prior Month+ Col 3
Col 2- Col 4
Refer to WP_SS 2a.xls
"Sched--IS and BS" WorksheetRow 116
Refer to WP_SS 2a.xls
"Sched--IS and BS" WorksheetRow 124
(Col 6 - Col 7) * [Income Tax Rate]
Prior+ Col 8
Col 5- Col 9
Annual Summary
2009 3,081,278 - - - - - - - - - 2010 66,090,784 52,656,897 429,279 429,279 52,227,618 39,626,389 366,162 16,037,803 16,037,803 36,189,815 2011 78,767,274 132,530,508 5,219,061 5,648,340 126,882,168 62,162,158 4,467,541 23,568,251 39,606,054 87,276,114 2012 16,260,184 160,737,823 8,862,691 14,511,031 146,226,791 17,327,673 7,529,407 4,002,591 43,608,645 102,618,146 2013 4,221,749 168,421,268 9,731,476 24,242,508 144,178,760 10,489,747 8,283,669 901,183 44,509,828 99,668,932 2014 509,071 168,930,339 10,138,538 34,381,046 134,549,293 5,883,543 8,617,637 (1,116,877) 43,392,951 91,156,342 2015 74,520 169,004,859 10,077,320 44,458,366 124,546,493 3,857,462 8,568,481 (1,924,451) 41,468,499 83,077,994 2016 - 169,004,859 9,059,688 53,518,054 115,486,805 2,625,398 7,687,858 (2,068,015) 39,400,484 97,652,572
- 169,004,859 9,332,701 51,337,391 117,667,468 2,934,257 7,921,035 (2,037,098) 39,889,934 77,777,534 Oct 2015 - Sept 2016
Plant
ATTACHMENT B
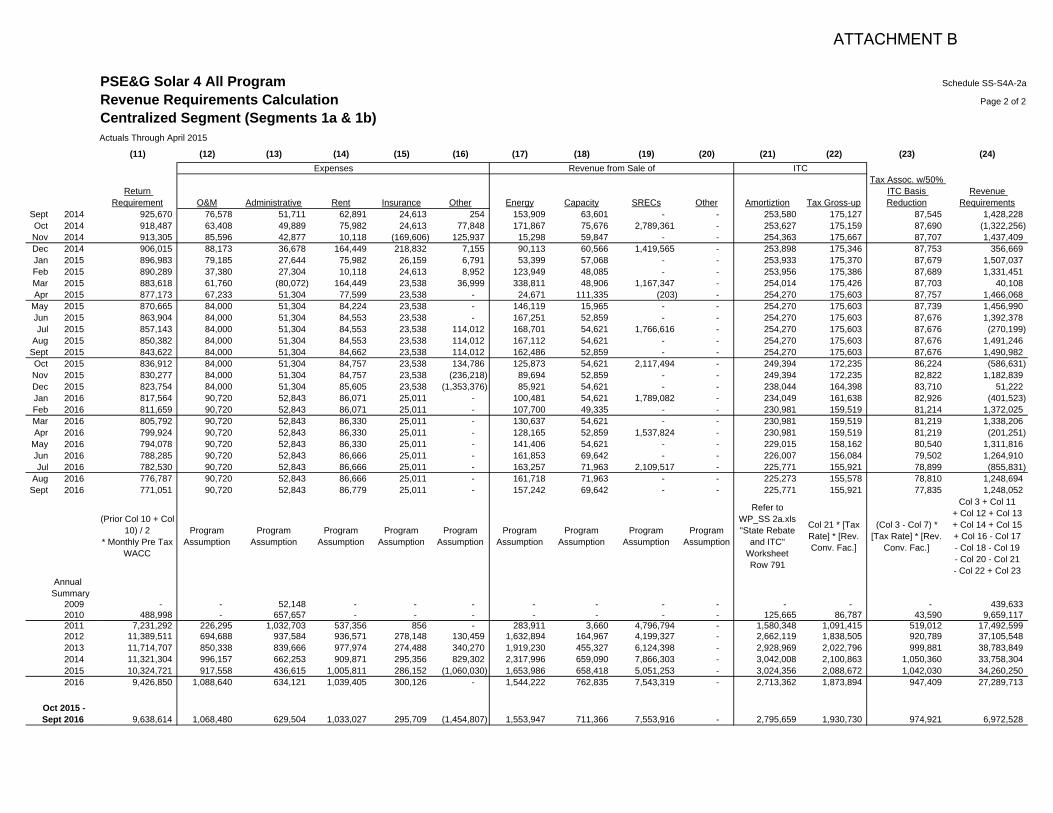
Sept 2014Oct 2014Nov 2014Dec 2014Jan 2015Feb 2015Mar 2015Apr 2015
May 2015Jun 2015Jul 2015
Aug 2015Sept 2015Oct 2015Nov 2015Dec 2015Jan 2016Feb 2016Mar 2016Apr 2016
May 2016Jun 2016Jul 2016
Aug 2016Sept 2016
Annual Summary
20092010201120122013201420152016
Oct 2015 - Sept 2016
PSE&G Solar 4 All Program Schedule SS-S4A-2a
Revenue Requirements Calculation Page 2 of 2
Centralized Segment (Segments 1a & 1b)Actuals Through April 2015
(11) (12) (13) (14) (15) (16) (17) (18) (19) (20) (21) (22) (23) (24)
Return Requirement O&M Administrative Rent Insurance Other Energy Capacity SRECs Other Amortiztion Tax Gross-up
Tax Assoc. w/50% ITC Basis Reduction
Revenue Requirements
925,670 76,578 51,711 62,891 24,613 254 153,909 63,601 - - 253,580 175,127 87,545 1,428,228 918,487 63,408 49,889 75,982 24,613 77,848 171,867 75,676 2,789,361 - 253,627 175,159 87,690 (1,322,256) 913,305 85,596 42,877 10,118 (169,606) 125,937 15,298 59,847 - - 254,363 175,667 87,707 1,437,409 906,015 88,173 36,678 164,449 218,832 7,155 90,113 60,566 1,419,565 - 253,898 175,346 87,753 356,669 896,983 79,185 27,644 75,982 26,159 6,791 53,399 57,068 - - 253,933 175,370 87,679 1,507,037 890,289 37,380 27,304 10,118 24,613 8,952 123,949 48,085 - - 253,956 175,386 87,689 1,331,451 883,618 61,760 (80,072) 164,449 23,538 36,999 338,811 48,906 1,167,347 - 254,014 175,426 87,703 40,108 877,173 67,233 51,304 77,599 23,538 - 24,671 111,335 (203) - 254,270 175,603 87,757 1,466,068 870,665 84,000 51,304 84,224 23,538 - 146,119 15,965 - - 254,270 175,603 87,739 1,456,990 863,904 84,000 51,304 84,553 23,538 - 167,251 52,859 - - 254,270 175,603 87,676 1,392,378 857,143 84,000 51,304 84,553 23,538 114,012 168,701 54,621 1,766,616 - 254,270 175,603 87,676 (270,199) 850,382 84,000 51,304 84,553 23,538 114,012 167,112 54,621 - - 254,270 175,603 87,676 1,491,246 843,622 84,000 51,304 84,662 23,538 114,012 162,486 52,859 - - 254,270 175,603 87,676 1,490,982 836,912 84,000 51,304 84,757 23,538 134,786 125,873 54,621 2,117,494 - 249,394 172,235 86,224 (586,631) 830,277 84,000 51,304 84,757 23,538 (236,218) 89,694 52,859 - - 249,394 172,235 82,822 1,182,839 823,754 84,000 51,304 85,605 23,538 (1,353,376) 85,921 54,621 - - 238,044 164,398 83,710 51,222 817,564 90,720 52,843 86,071 25,011 - 100,481 54,621 1,789,082 - 234,049 161,638 82,926 (401,523) 811,659 90,720 52,843 86,071 25,011 - 107,700 49,335 - - 230,981 159,519 81,214 1,372,025 805,792 90,720 52,843 86,330 25,011 - 130,637 54,621 - - 230,981 159,519 81,219 1,338,206 799,924 90,720 52,843 86,330 25,011 - 128,165 52,859 1,537,824 - 230,981 159,519 81,219 (201,251) 794,078 90,720 52,843 86,330 25,011 - 141,406 54,621 - - 229,015 158,162 80,540 1,311,816 788,285 90,720 52,843 86,666 25,011 - 161,853 69,642 - - 226,007 156,084 79,502 1,264,910 782,530 90,720 52,843 86,666 25,011 - 163,257 71,963 2,109,517 - 225,771 155,921 78,899 (855,831) 776,787 90,720 52,843 86,666 25,011 - 161,718 71,963 - - 225,273 155,578 78,810 1,248,694 771,051 90,720 52,843 86,779 25,011 - 157,242 69,642 - - 225,771 155,921 77,835 1,248,052
(Prior Col 10 + Col 10) / 2
* Monthly Pre Tax WACC
Program Assumption
Program Assumption
Program Assumption
Program Assumption
Program Assumption
Program Assumption
Program Assumption
Program Assumption
Program Assumption
Refer to WP_SS 2a.xls"State Rebate
and ITC" WorksheetRow 791
Col 21 * [Tax Rate] * [Rev. Conv. Fac.]
(Col 3 - Col 7) * [Tax Rate] * [Rev.
Conv. Fac.]
Col 3 + Col 11+ Col 12 + Col 13+ Col 14 + Col 15+ Col 16 - Col 17- Col 18 - Col 19- Col 20 - Col 21- Col 22 + Col 23
- - 52,148 - - - - - - - - - - 439,633 488,998 - 657,657 - - - - - - - 125,665 86,787 43,590 9,659,117
7,231,292 226,295 1,032,703 537,356 856 - 283,911 3,660 4,796,794 - 1,580,348 1,091,415 519,012 17,492,599 11,389,511 694,688 937,584 936,571 278,148 130,459 1,632,894 164,967 4,199,327 - 2,662,119 1,838,505 920,789 37,105,548 11,714,707 850,338 839,666 977,974 274,488 340,270 1,919,230 455,327 6,124,398 - 2,928,969 2,022,796 999,881 38,783,849 11,321,304 996,157 662,253 909,871 295,356 829,302 2,317,996 659,090 7,866,303 - 3,042,008 2,100,863 1,050,360 33,758,304 10,324,721 917,558 436,615 1,005,811 286,152 (1,060,030) 1,653,986 658,418 5,051,253 - 3,024,356 2,088,672 1,042,030 34,260,250 9,426,850 1,088,640 634,121 1,039,405 300,126 - 1,544,222 762,835 7,543,319 - 2,713,362 1,873,894 947,409 27,289,713
9,638,614 1,068,480 629,504 1,033,027 295,709 (1,454,807) 1,553,947 711,366 7,553,916 - 2,795,659 1,930,730 974,921 6,972,528
Expenses Revenue from Sale of ITC
ATTACHMENT B
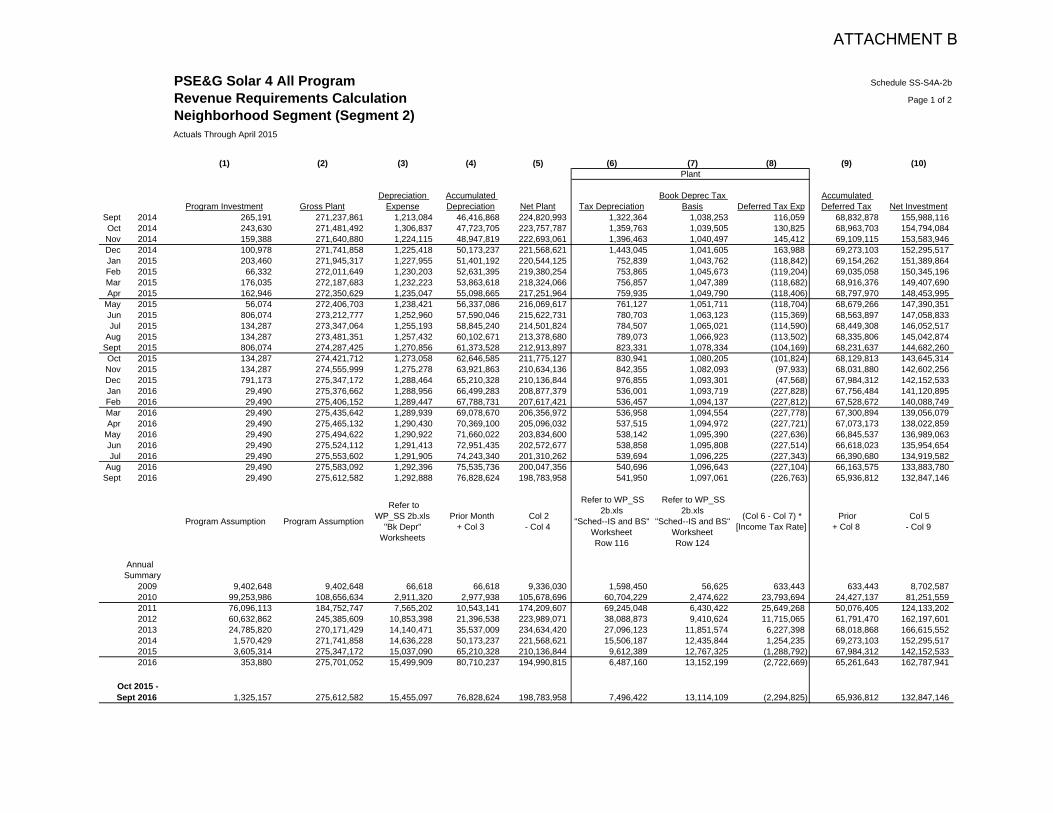
PSE&G Solar 4 All Program Schedule SS-S4A-2b
Revenue Requirements Calculation Page 1 of 2
Neighborhood Segment (Segment 2)Actuals Through April 2015
(1) (2) (3) (4) (5) (6) (7) (8) (9) (10)Plant
Program Investment Gross PlantDepreciation
ExpenseAccumulated Depreciation Net Plant Tax Depreciation
Book Deprec Tax Basis Deferred Tax Exp
Accumulated Deferred Tax Net Investment
Sept 2014 265,191 271,237,861 1,213,084 46,416,868 224,820,993 1,322,364 1,038,253 116,059 68,832,878 155,988,116 Oct 2014 243,630 271,481,492 1,306,837 47,723,705 223,757,787 1,359,763 1,039,505 130,825 68,963,703 154,794,084 Nov 2014 159,388 271,640,880 1,224,115 48,947,819 222,693,061 1,396,463 1,040,497 145,412 69,109,115 153,583,946 Dec 2014 100,978 271,741,858 1,225,418 50,173,237 221,568,621 1,443,045 1,041,605 163,988 69,273,103 152,295,517 Jan 2015 203,460 271,945,317 1,227,955 51,401,192 220,544,125 752,839 1,043,762 (118,842) 69,154,262 151,389,864 Feb 2015 66,332 272,011,649 1,230,203 52,631,395 219,380,254 753,865 1,045,673 (119,204) 69,035,058 150,345,196 Mar 2015 176,035 272,187,683 1,232,223 53,863,618 218,324,066 756,857 1,047,389 (118,682) 68,916,376 149,407,690 Apr 2015 162,946 272,350,629 1,235,047 55,098,665 217,251,964 759,935 1,049,790 (118,406) 68,797,970 148,453,995
May 2015 56,074 272,406,703 1,238,421 56,337,086 216,069,617 761,127 1,051,711 (118,704) 68,679,266 147,390,351 Jun 2015 806,074 273,212,777 1,252,960 57,590,046 215,622,731 780,703 1,063,123 (115,369) 68,563,897 147,058,833 Jul 2015 134,287 273,347,064 1,255,193 58,845,240 214,501,824 784,507 1,065,021 (114,590) 68,449,308 146,052,517
Aug 2015 134,287 273,481,351 1,257,432 60,102,671 213,378,680 789,073 1,066,923 (113,502) 68,335,806 145,042,874 Sept 2015 806,074 274,287,425 1,270,856 61,373,528 212,913,897 823,331 1,078,334 (104,169) 68,231,637 144,682,260 Oct 2015 134,287 274,421,712 1,273,058 62,646,585 211,775,127 830,941 1,080,205 (101,824) 68,129,813 143,645,314 Nov 2015 134,287 274,555,999 1,275,278 63,921,863 210,634,136 842,355 1,082,093 (97,933) 68,031,880 142,602,256 Dec 2015 791,173 275,347,172 1,288,464 65,210,328 210,136,844 976,855 1,093,301 (47,568) 67,984,312 142,152,533 Jan 2016 29,490 275,376,662 1,288,956 66,499,283 208,877,379 536,001 1,093,719 (227,828) 67,756,484 141,120,895 Feb 2016 29,490 275,406,152 1,289,447 67,788,731 207,617,421 536,457 1,094,137 (227,812) 67,528,672 140,088,749 Mar 2016 29,490 275,435,642 1,289,939 69,078,670 206,356,972 536,958 1,094,554 (227,778) 67,300,894 139,056,079 Apr 2016 29,490 275,465,132 1,290,430 70,369,100 205,096,032 537,515 1,094,972 (227,721) 67,073,173 138,022,859
May 2016 29,490 275,494,622 1,290,922 71,660,022 203,834,600 538,142 1,095,390 (227,636) 66,845,537 136,989,063 Jun 2016 29,490 275,524,112 1,291,413 72,951,435 202,572,677 538,858 1,095,808 (227,514) 66,618,023 135,954,654 Jul 2016 29,490 275,553,602 1,291,905 74,243,340 201,310,262 539,694 1,096,225 (227,343) 66,390,680 134,919,582
Aug 2016 29,490 275,583,092 1,292,396 75,535,736 200,047,356 540,696 1,096,643 (227,104) 66,163,575 133,883,780 Sept 2016 29,490 275,612,582 1,292,888 76,828,624 198,783,958 541,950 1,097,061 (226,763) 65,936,812 132,847,146
Program Assumption Program Assumption
Refer to WP_SS 2b.xls
"Bk Depr" Worksheets
Prior Month+ Col 3
Col 2- Col 4
Refer to WP_SS 2b.xls
"Sched--IS and BS" WorksheetRow 116
Refer to WP_SS 2b.xls
"Sched--IS and BS" WorksheetRow 124
(Col 6 - Col 7) * [Income Tax Rate]
Prior+ Col 8
Col 5- Col 9
Annual Summary
2009 9,402,648 9,402,648 66,618 66,618 9,336,030 1,598,450 56,625 633,443 633,443 8,702,587 2010 99,253,986 108,656,634 2,911,320 2,977,938 105,678,696 60,704,229 2,474,622 23,793,694 24,427,137 81,251,559 2011 76,096,113 184,752,747 7,565,202 10,543,141 174,209,607 69,245,048 6,430,422 25,649,268 50,076,405 124,133,202 2012 60,632,862 245,385,609 10,853,398 21,396,538 223,989,071 38,088,873 9,410,624 11,715,065 61,791,470 162,197,601 2013 24,785,820 270,171,429 14,140,471 35,537,009 234,634,420 27,096,123 11,851,574 6,227,398 68,018,868 166,615,552 2014 1,570,429 271,741,858 14,636,228 50,173,237 221,568,621 15,506,187 12,435,844 1,254,235 69,273,103 152,295,517 2015 3,605,314 275,347,172 15,037,090 65,210,328 210,136,844 9,612,389 12,767,325 (1,288,792) 67,984,312 142,152,533 2016 353,880 275,701,052 15,499,909 80,710,237 194,990,815 6,487,160 13,152,199 (2,722,669) 65,261,643 162,787,941
1,325,157 275,612,582 15,455,097 76,828,624 198,783,958 7,496,422 13,114,109 (2,294,825) 65,936,812 132,847,146 Oct 2015 - Sept 2016
ATTACHMENT B
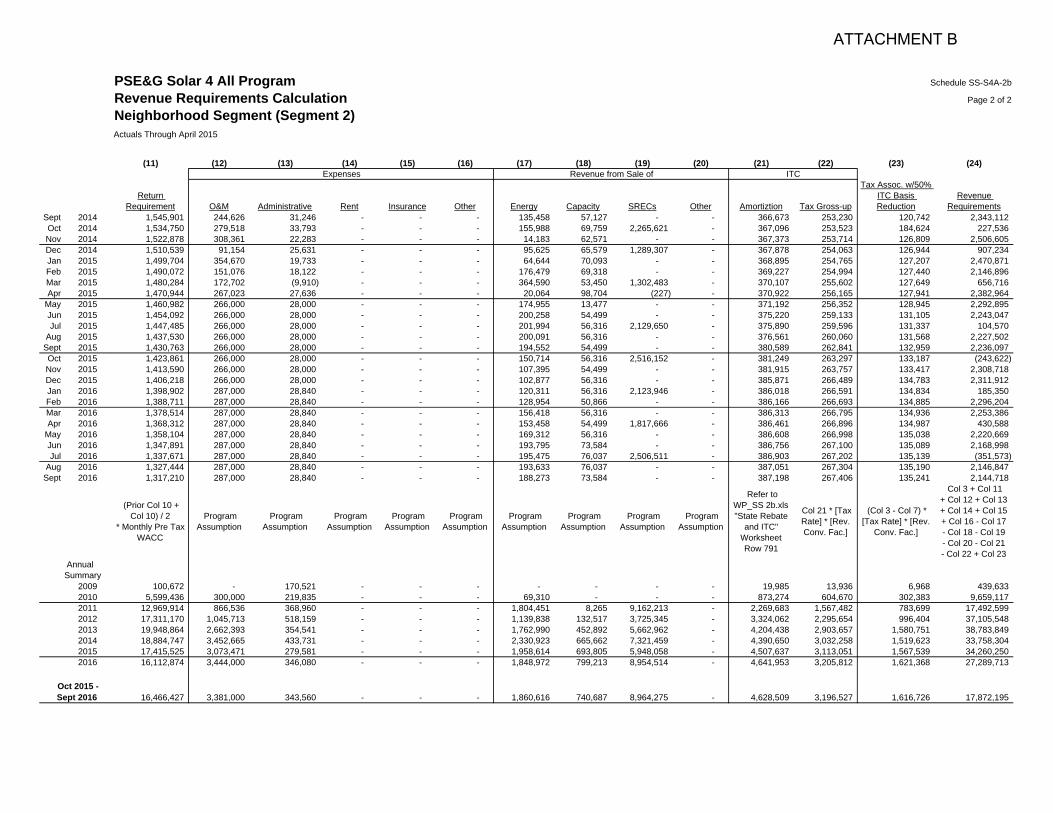
Sept 2014Oct 2014Nov 2014Dec 2014Jan 2015Feb 2015Mar 2015Apr 2015
May 2015Jun 2015Jul 2015
Aug 2015Sept 2015Oct 2015Nov 2015Dec 2015Jan 2016Feb 2016Mar 2016Apr 2016
May 2016Jun 2016Jul 2016
Aug 2016Sept 2016
Annual Summary
20092010201120122013201420152016
Oct 2015 - Sept 2016
PSE&G Solar 4 All Program Schedule SS-S4A-2b
Revenue Requirements Calculation Page 2 of 2
Neighborhood Segment (Segment 2)Actuals Through April 2015
(11) (12) (13) (14) (15) (16) (17) (18) (19) (20) (21) (22) (23) (24)Expenses Revenue from Sale of ITC
Return Requirement O&M Administrative Rent Insurance Other Energy Capacity SRECs Other Amortiztion Tax Gross-up
Tax Assoc. w/50% ITC Basis Reduction
Revenue Requirements
1,545,901 244,626 31,246 - - - 135,458 57,127 - - 366,673 253,230 120,742 2,343,112 1,534,750 279,518 33,793 - - - 155,988 69,759 2,265,621 - 367,096 253,523 184,624 227,536 1,522,878 308,361 22,283 - - - 14,183 62,571 - - 367,373 253,714 126,809 2,506,605 1,510,539 91,154 25,631 - - - 95,625 65,579 1,289,307 - 367,878 254,063 126,944 907,234 1,499,704 354,670 19,733 - - - 64,644 70,093 - - 368,895 254,765 127,207 2,470,871 1,490,072 151,076 18,122 - - - 176,479 69,318 - - 369,227 254,994 127,440 2,146,896 1,480,284 172,702 (9,910) - - - 364,590 53,450 1,302,483 - 370,107 255,602 127,649 656,716 1,470,944 267,023 27,636 - - - 20,064 98,704 (227) - 370,922 256,165 127,941 2,382,964 1,460,982 266,000 28,000 - - - 174,955 13,477 - - 371,192 256,352 128,945 2,292,895 1,454,092 266,000 28,000 - - - 200,258 54,499 - - 375,220 259,133 131,105 2,243,047 1,447,485 266,000 28,000 - - - 201,994 56,316 2,129,650 - 375,890 259,596 131,337 104,570 1,437,530 266,000 28,000 - - - 200,091 56,316 - - 376,561 260,060 131,568 2,227,502 1,430,763 266,000 28,000 - - - 194,552 54,499 - - 380,589 262,841 132,959 2,236,097 1,423,861 266,000 28,000 - - - 150,714 56,316 2,516,152 - 381,249 263,297 133,187 (243,622) 1,413,590 266,000 28,000 - - - 107,395 54,499 - - 381,915 263,757 133,417 2,308,718 1,406,218 266,000 28,000 - - - 102,877 56,316 - - 385,871 266,489 134,783 2,311,912 1,398,902 287,000 28,840 - - - 120,311 56,316 2,123,946 - 386,018 266,591 134,834 185,350 1,388,711 287,000 28,840 - - - 128,954 50,866 - - 386,166 266,693 134,885 2,296,204 1,378,514 287,000 28,840 - - - 156,418 56,316 - - 386,313 266,795 134,936 2,253,386 1,368,312 287,000 28,840 - - - 153,458 54,499 1,817,666 - 386,461 266,896 134,987 430,588 1,358,104 287,000 28,840 - - - 169,312 56,316 - - 386,608 266,998 135,038 2,220,669 1,347,891 287,000 28,840 - - - 193,795 73,584 - - 386,756 267,100 135,089 2,168,998 1,337,671 287,000 28,840 - - - 195,475 76,037 2,506,511 - 386,903 267,202 135,139 (351,573) 1,327,444 287,000 28,840 - - - 193,633 76,037 - - 387,051 267,304 135,190 2,146,847 1,317,210 287,000 28,840 - - - 188,273 73,584 - - 387,198 267,406 135,241 2,144,718
(Prior Col 10 + Col 10) / 2
* Monthly Pre Tax WACC
Program Assumption
Program Assumption
Program Assumption
Program Assumption
Program Assumption
Program Assumption
Program Assumption
Program Assumption
Program Assumption
Refer to WP_SS 2b.xls"State Rebate
and ITC" WorksheetRow 791
Col 21 * [Tax Rate] * [Rev. Conv. Fac.]
(Col 3 - Col 7) * [Tax Rate] * [Rev.
Conv. Fac.]
Col 3 + Col 11+ Col 12 + Col 13+ Col 14 + Col 15+ Col 16 - Col 17- Col 18 - Col 19- Col 20 - Col 21- Col 22 + Col 23
100,672 - 170,521 - - - - - - - 19,985 13,936 6,968 439,633 5,599,436 300,000 219,835 - - - 69,310 - - - 873,274 604,670 302,383 9,659,117
12,969,914 866,536 368,960 - - - 1,804,451 8,265 9,162,213 - 2,269,683 1,567,482 783,699 17,492,599 17,311,170 1,045,713 518,159 - - - 1,139,838 132,517 3,725,345 - 3,324,062 2,295,654 996,404 37,105,548 19,948,864 2,662,393 354,541 - - - 1,762,990 452,892 5,662,962 - 4,204,438 2,903,657 1,580,751 38,783,849 18,884,747 3,452,665 433,731 - - - 2,330,923 665,662 7,321,459 - 4,390,650 3,032,258 1,519,623 33,758,304 17,415,525 3,073,471 279,581 - - - 1,958,614 693,805 5,948,058 - 4,507,637 3,113,051 1,567,539 34,260,250 16,112,874 3,444,000 346,080 - - - 1,848,972 799,213 8,954,514 - 4,641,953 3,205,812 1,621,368 27,289,713
16,466,427 3,381,000 343,560 - - - 1,860,616 740,687 8,964,275 - 4,628,509 3,196,527 1,616,726 17,872,195
ATTACHMENT B
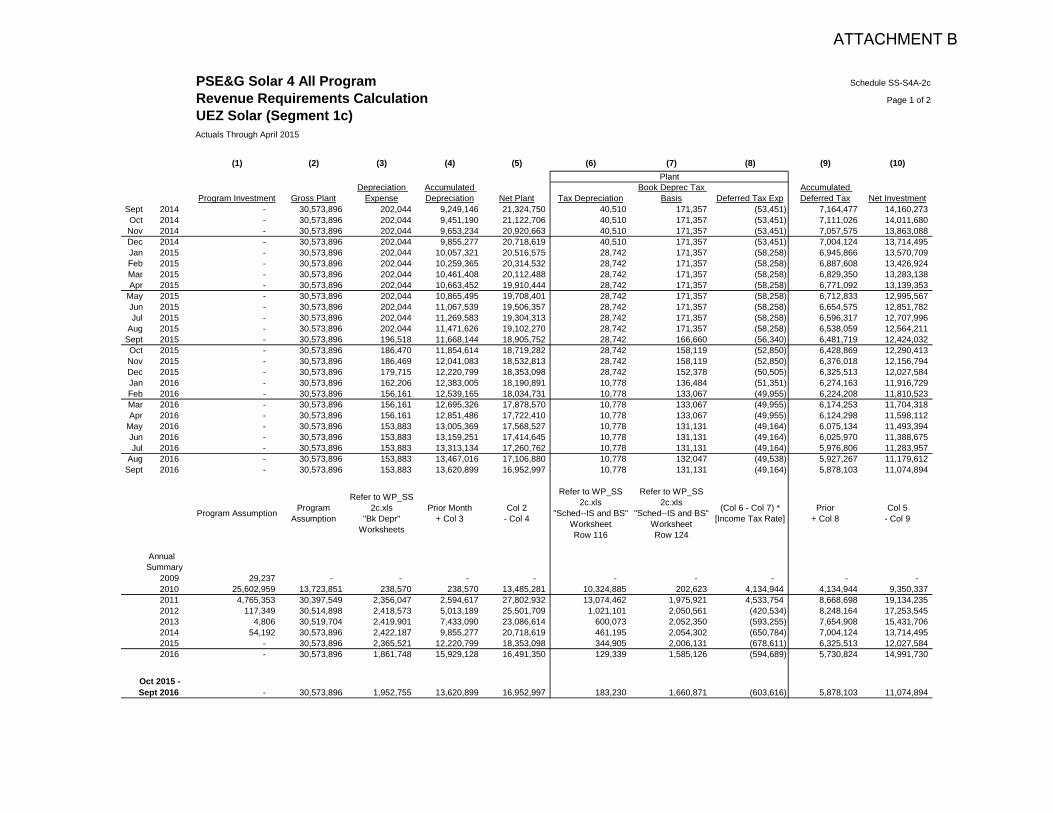
PSE&G Solar 4 All Program Schedule SS-S4A-2c
Revenue Requirements Calculation Page 1 of 2
UEZ Solar (Segment 1c)Actuals Through April 2015
(1) (2) (3) (4) (5) (6) (7) (8) (9) (10)
Program Investment Gross PlantDepreciation
ExpenseAccumulated Depreciation Net Plant Tax Depreciation
Book Deprec Tax Basis Deferred Tax Exp
Accumulated Deferred Tax Net Investment
Sept 2014 - 30,573,896 202,044 9,249,146 21,324,750 40,510 171,357 (53,451) 7,164,477 14,160,273 Oct 2014 - 30,573,896 202,044 9,451,190 21,122,706 40,510 171,357 (53,451) 7,111,026 14,011,680 Nov 2014 - 30,573,896 202,044 9,653,234 20,920,663 40,510 171,357 (53,451) 7,057,575 13,863,088 Dec 2014 - 30,573,896 202,044 9,855,277 20,718,619 40,510 171,357 (53,451) 7,004,124 13,714,495 Jan 2015 - 30,573,896 202,044 10,057,321 20,516,575 28,742 171,357 (58,258) 6,945,866 13,570,709 Feb 2015 - 30,573,896 202,044 10,259,365 20,314,532 28,742 171,357 (58,258) 6,887,608 13,426,924 Mar 2015 - 30,573,896 202,044 10,461,408 20,112,488 28,742 171,357 (58,258) 6,829,350 13,283,138 Apr 2015 - 30,573,896 202,044 10,663,452 19,910,444 28,742 171,357 (58,258) 6,771,092 13,139,353
May 2015 - 30,573,896 202,044 10,865,495 19,708,401 28,742 171,357 (58,258) 6,712,833 12,995,567 Jun 2015 - 30,573,896 202,044 11,067,539 19,506,357 28,742 171,357 (58,258) 6,654,575 12,851,782 Jul 2015 - 30,573,896 202,044 11,269,583 19,304,313 28,742 171,357 (58,258) 6,596,317 12,707,996
Aug 2015 - 30,573,896 202,044 11,471,626 19,102,270 28,742 171,357 (58,258) 6,538,059 12,564,211 Sept 2015 - 30,573,896 196,518 11,668,144 18,905,752 28,742 166,660 (56,340) 6,481,719 12,424,032 Oct 2015 - 30,573,896 186,470 11,854,614 18,719,282 28,742 158,119 (52,850) 6,428,869 12,290,413 Nov 2015 - 30,573,896 186,469 12,041,083 18,532,813 28,742 158,119 (52,850) 6,376,018 12,156,794 Dec 2015 - 30,573,896 179,715 12,220,799 18,353,098 28,742 152,378 (50,505) 6,325,513 12,027,584 Jan 2016 - 30,573,896 162,206 12,383,005 18,190,891 10,778 136,484 (51,351) 6,274,163 11,916,729 Feb 2016 - 30,573,896 156,161 12,539,165 18,034,731 10,778 133,067 (49,955) 6,224,208 11,810,523 Mar 2016 - 30,573,896 156,161 12,695,326 17,878,570 10,778 133,067 (49,955) 6,174,253 11,704,318 Apr 2016 - 30,573,896 156,161 12,851,486 17,722,410 10,778 133,067 (49,955) 6,124,298 11,598,112
May 2016 - 30,573,896 153,883 13,005,369 17,568,527 10,778 131,131 (49,164) 6,075,134 11,493,394 Jun 2016 - 30,573,896 153,883 13,159,251 17,414,645 10,778 131,131 (49,164) 6,025,970 11,388,675 Jul 2016 - 30,573,896 153,883 13,313,134 17,260,762 10,778 131,131 (49,164) 5,976,806 11,283,957
Aug 2016 - 30,573,896 153,883 13,467,016 17,106,880 10,778 132,047 (49,538) 5,927,267 11,179,612 Sept 2016 - 30,573,896 153,883 13,620,899 16,952,997 10,778 131,131 (49,164) 5,878,103 11,074,894
Program Assumption Program Assumption
Refer to WP_SS 2c.xls
"Bk Depr" Worksheets
Prior Month+ Col 3
Col 2- Col 4
Refer to WP_SS 2c.xls
"Sched--IS and BS" WorksheetRow 116
Refer to WP_SS 2c.xls
"Sched--IS and BS" WorksheetRow 124
(Col 6 - Col 7) * [Income Tax Rate]
Prior+ Col 8
Col 5- Col 9
Annual Summary
2009 29,237 - - - - - - - - - 2010 25,602,959 13,723,851 238,570 238,570 13,485,281 10,324,885 202,623 4,134,944 4,134,944 9,350,337 2011 4,765,353 30,397,549 2,356,047 2,594,617 27,802,932 13,074,462 1,975,921 4,533,754 8,668,698 19,134,235 2012 117,349 30,514,898 2,418,573 5,013,189 25,501,709 1,021,101 2,050,561 (420,534) 8,248,164 17,253,545 2013 4,806 30,519,704 2,419,901 7,433,090 23,086,614 600,073 2,052,350 (593,255) 7,654,908 15,431,706 2014 54,192 30,573,896 2,422,187 9,855,277 20,718,619 461,195 2,054,302 (650,784) 7,004,124 13,714,495 2015 - 30,573,896 2,365,521 12,220,799 18,353,098 344,905 2,006,131 (678,611) 6,325,513 12,027,584 2016 - 30,573,896 1,861,748 15,929,128 16,491,350 129,339 1,585,126 (594,689) 5,730,824 14,991,730
- 30,573,896 1,952,755 13,620,899 16,952,997 183,230 1,660,871 (603,616) 5,878,103 11,074,894 Oct 2015 - Sept 2016
Plant
ATTACHMENT B
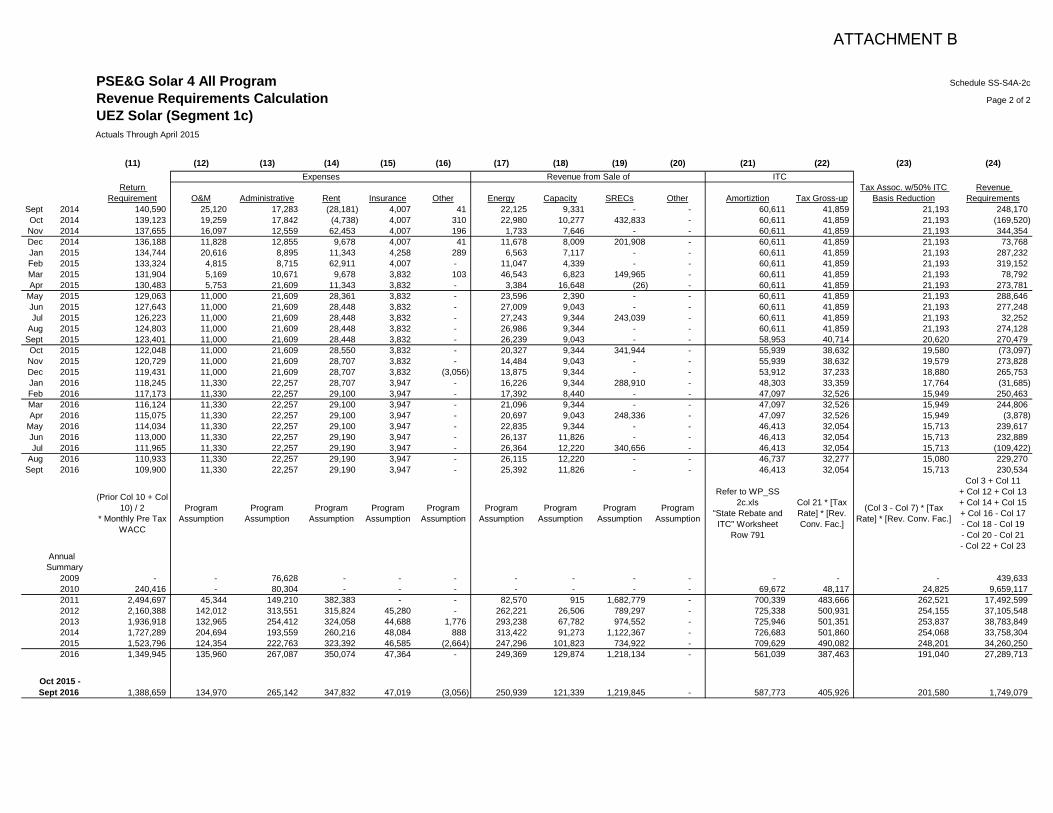
Sept 2014Oct 2014Nov 2014Dec 2014Jan 2015Feb 2015Mar 2015Apr 2015
May 2015Jun 2015Jul 2015
Aug 2015Sept 2015Oct 2015Nov 2015Dec 2015Jan 2016Feb 2016Mar 2016Apr 2016
May 2016Jun 2016Jul 2016
Aug 2016Sept 2016
Annual Summary
20092010201120122013201420152016
Oct 2015 - Sept 2016
PSE&G Solar 4 All Program Schedule SS-S4A-2c
Revenue Requirements Calculation Page 2 of 2
UEZ Solar (Segment 1c)Actuals Through April 2015
(11) (12) (13) (14) (15) (16) (17) (18) (19) (20) (21) (22) (23) (24)
Return Requirement O&M Administrative Rent Insurance Other Energy Capacity SRECs Other Amortiztion Tax Gross-up
Tax Assoc. w/50% ITC Basis Reduction
Revenue Requirements
140,590 25,120 17,283 (28,181) 4,007 41 22,125 9,331 - - 60,611 41,859 21,193 248,170 139,123 19,259 17,842 (4,738) 4,007 310 22,980 10,277 432,833 - 60,611 41,859 21,193 (169,520) 137,655 16,097 12,559 62,453 4,007 196 1,733 7,646 - - 60,611 41,859 21,193 344,354 136,188 11,828 12,855 9,678 4,007 41 11,678 8,009 201,908 - 60,611 41,859 21,193 73,768 134,744 20,616 8,895 11,343 4,258 289 6,563 7,117 - - 60,611 41,859 21,193 287,232 133,324 4,815 8,715 62,911 4,007 - 11,047 4,339 - - 60,611 41,859 21,193 319,152 131,904 5,169 10,671 9,678 3,832 103 46,543 6,823 149,965 - 60,611 41,859 21,193 78,792 130,483 5,753 21,609 11,343 3,832 - 3,384 16,648 (26) - 60,611 41,859 21,193 273,781 129,063 11,000 21,609 28,361 3,832 - 23,596 2,390 - - 60,611 41,859 21,193 288,646 127,643 11,000 21,609 28,448 3,832 - 27,009 9,043 - - 60,611 41,859 21,193 277,248 126,223 11,000 21,609 28,448 3,832 - 27,243 9,344 243,039 - 60,611 41,859 21,193 32,252 124,803 11,000 21,609 28,448 3,832 - 26,986 9,344 - - 60,611 41,859 21,193 274,128 123,401 11,000 21,609 28,448 3,832 - 26,239 9,043 - - 58,953 40,714 20,620 270,479 122,048 11,000 21,609 28,550 3,832 - 20,327 9,344 341,944 - 55,939 38,632 19,580 (73,097) 120,729 11,000 21,609 28,707 3,832 - 14,484 9,043 - - 55,939 38,632 19,579 273,828 119,431 11,000 21,609 28,707 3,832 (3,056) 13,875 9,344 - - 53,912 37,233 18,880 265,753 118,245 11,330 22,257 28,707 3,947 - 16,226 9,344 288,910 - 48,303 33,359 17,764 (31,685) 117,173 11,330 22,257 29,100 3,947 - 17,392 8,440 - - 47,097 32,526 15,949 250,463 116,124 11,330 22,257 29,100 3,947 - 21,096 9,344 - - 47,097 32,526 15,949 244,806 115,075 11,330 22,257 29,100 3,947 - 20,697 9,043 248,336 - 47,097 32,526 15,949 (3,878) 114,034 11,330 22,257 29,100 3,947 - 22,835 9,344 - - 46,413 32,054 15,713 239,617 113,000 11,330 22,257 29,190 3,947 - 26,137 11,826 - - 46,413 32,054 15,713 232,889 111,965 11,330 22,257 29,190 3,947 - 26,364 12,220 340,656 - 46,413 32,054 15,713 (109,422) 110,933 11,330 22,257 29,190 3,947 - 26,115 12,220 - - 46,737 32,277 15,080 229,270 109,900 11,330 22,257 29,190 3,947 - 25,392 11,826 - - 46,413 32,054 15,713 230,534
(Prior Col 10 + Col 10) / 2
* Monthly Pre Tax WACC
Program Assumption
Program Assumption
Program Assumption
Program Assumption
Program Assumption
Program Assumption
Program Assumption
Program Assumption
Program Assumption
Refer to WP_SS 2c.xls
"State Rebate and ITC" Worksheet
Row 791
Col 21 * [Tax Rate] * [Rev. Conv. Fac.]
(Col 3 - Col 7) * [Tax Rate] * [Rev. Conv. Fac.]
Col 3 + Col 11+ Col 12 + Col 13+ Col 14 + Col 15+ Col 16 - Col 17- Col 18 - Col 19- Col 20 - Col 21- Col 22 + Col 23
- - 76,628 - - - - - - - - - - 439,633 240,416 - 80,304 - - - - - - - 69,672 48,117 24,825 9,659,117
2,494,697 45,344 149,210 382,383 - - 82,570 915 1,682,779 - 700,339 483,666 262,521 17,492,599 2,160,388 142,012 313,551 315,824 45,280 - 262,221 26,506 789,297 - 725,338 500,931 254,155 37,105,548 1,936,918 132,965 254,412 324,058 44,688 1,776 293,238 67,782 974,552 - 725,946 501,351 253,837 38,783,849 1,727,289 204,694 193,559 260,216 48,084 888 313,422 91,273 1,122,367 - 726,683 501,860 254,068 33,758,304 1,523,796 124,354 222,763 323,392 46,585 (2,664) 247,296 101,823 734,922 - 709,629 490,082 248,201 34,260,250 1,349,945 135,960 267,087 350,074 47,364 - 249,369 129,874 1,218,134 - 561,039 387,463 191,040 27,289,713
1,388,659 134,970 265,142 347,832 47,019 (3,056) 250,939 121,339 1,219,845 - 587,773 405,926 201,580 1,749,079
Expenses Revenue from Sale of ITC
ATTACHMENT B
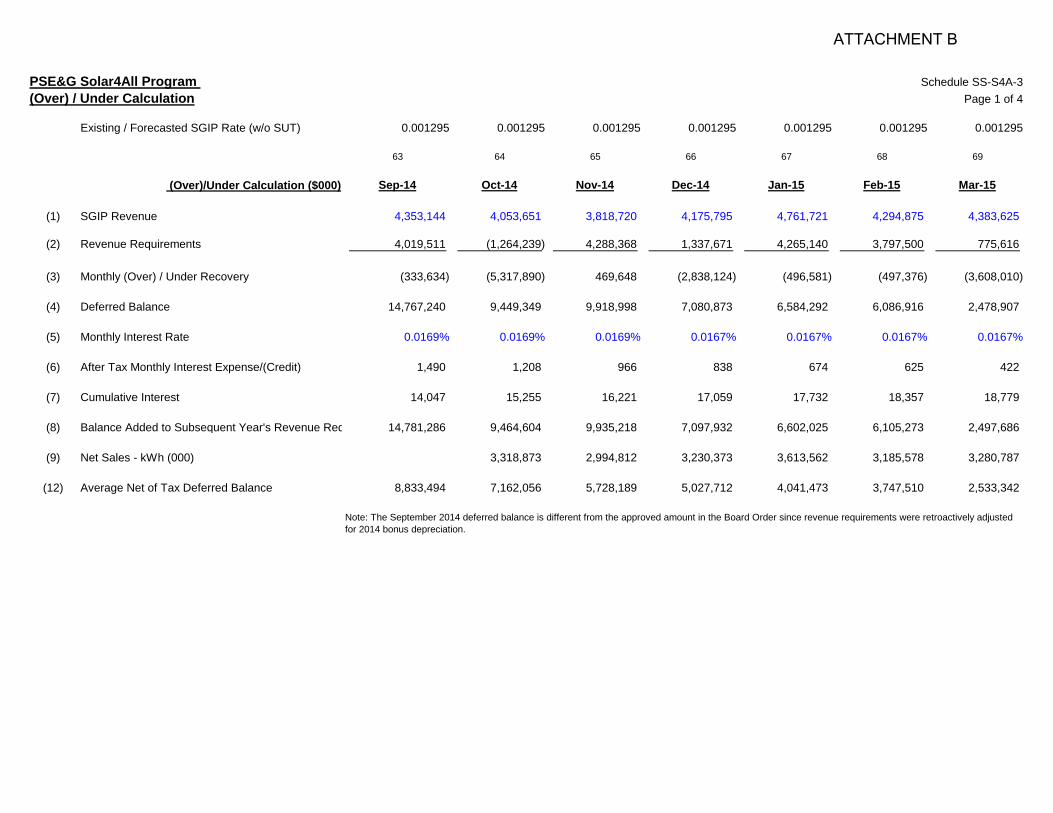
PSE&G Solar4All Program (Over) / Under Calculation
Existing / Forecasted SGIP Rate (w/o SUT)
(Over)/Under Calculation ($000)
(1) SGIP Revenue
(2) Revenue Requirements
(3) Monthly (Over) / Under Recovery
(4) Deferred Balance
(5) Monthly Interest Rate
(6) After Tax Monthly Interest Expense/(Credit)
(7) Cumulative Interest
(8) Balance Added to Subsequent Year's Revenue Req
(9) Net Sales - kWh (000)
(12) Average Net of Tax Deferred Balance
Schedule SS-S4A-3Page 1 of 4
0.001295 0.001295 0.001295 0.001295 0.001295 0.001295 0.001295
63 64 65 66 67 68 69
Sep-14 Oct-14 Nov-14 Dec-14 Jan-15 Feb-15 Mar-15
4,353,144 4,053,651 3,818,720 4,175,795 4,761,721 4,294,875 4,383,625
4,019,511 (1,264,239) 4,288,368 1,337,671 4,265,140 3,797,500 775,616
(333,634) (5,317,890) 469,648 (2,838,124) (496,581) (497,376) (3,608,010)
14,767,240 9,449,349 9,918,998 7,080,873 6,584,292 6,086,916 2,478,907
0.0169% 0.0169% 0.0169% 0.0167% 0.0167% 0.0167% 0.0167%
1,490 1,208 966 838 674 625 422
14,047 15,255 16,221 17,059 17,732 18,357 18,779
14,781,286 9,464,604 9,935,218 7,097,932 6,602,025 6,105,273 2,497,686
3,318,873 2,994,812 3,230,373 3,613,562 3,185,578 3,280,787
8,833,494 7,162,056 5,728,189 5,027,712 4,041,473 3,747,510 2,533,342
Note: The September 2014 deferred balance is different from the approved amount in the Board Order since revenue requirements were retroactively adjusted for 2014 bonus depreciation.
ATTACHMENT B
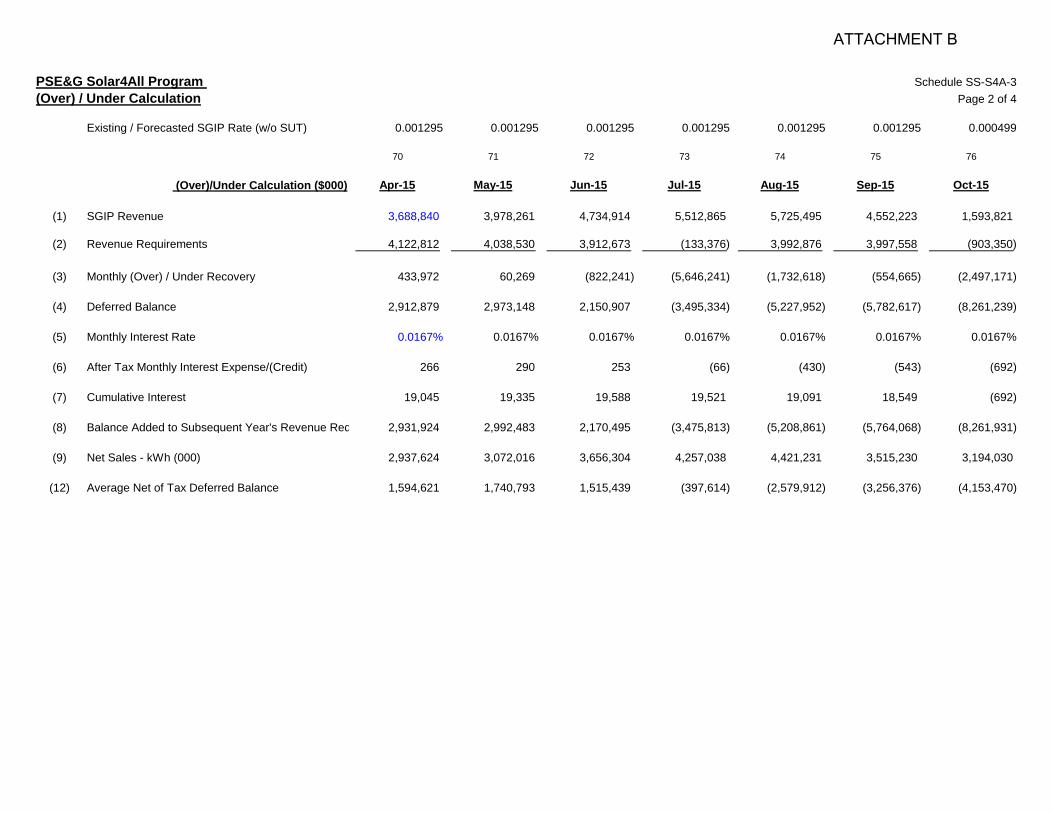
PSE&G Solar4All Program (Over) / Under Calculation
Existing / Forecasted SGIP Rate (w/o SUT)
(Over)/Under Calculation ($000)
(1) SGIP Revenue
(2) Revenue Requirements
(3) Monthly (Over) / Under Recovery
(4) Deferred Balance
(5) Monthly Interest Rate
(6) After Tax Monthly Interest Expense/(Credit)
(7) Cumulative Interest
(8) Balance Added to Subsequent Year's Revenue Req
(9) Net Sales - kWh (000)
(12) Average Net of Tax Deferred Balance
Schedule SS-S4A-3Page 2 of 4
0.001295 0.001295 0.001295 0.001295 0.001295 0.001295 0.000499
70 71 72 73 74 75 76
Apr-15 May-15 Jun-15 Jul-15 Aug-15 Sep-15 Oct-15
3,688,840 3,978,261 4,734,914 5,512,865 5,725,495 4,552,223 1,593,821
4,122,812 4,038,530 3,912,673 (133,376) 3,992,876 3,997,558 (903,350)
433,972 60,269 (822,241) (5,646,241) (1,732,618) (554,665) (2,497,171)
2,912,879 2,973,148 2,150,907 (3,495,334) (5,227,952) (5,782,617) (8,261,239)
0.0167% 0.0167% 0.0167% 0.0167% 0.0167% 0.0167% 0.0167%
266 290 253 (66) (430) (543) (692)
19,045 19,335 19,588 19,521 19,091 18,549 (692)
2,931,924 2,992,483 2,170,495 (3,475,813) (5,208,861) (5,764,068) (8,261,931)
2,937,624 3,072,016 3,656,304 4,257,038 4,421,231 3,515,230 3,194,030
1,594,621 1,740,793 1,515,439 (397,614) (2,579,912) (3,256,376) (4,153,470)
ATTACHMENT B
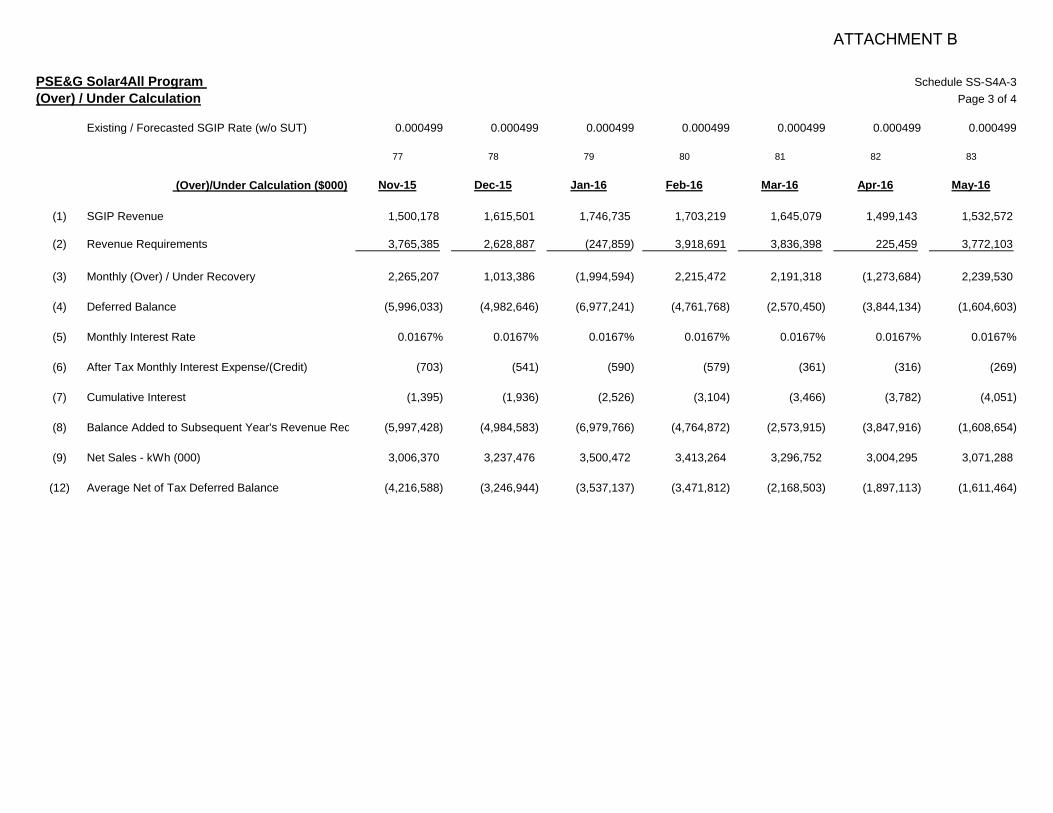
PSE&G Solar4All Program (Over) / Under Calculation
Existing / Forecasted SGIP Rate (w/o SUT)
(Over)/Under Calculation ($000)
(1) SGIP Revenue
(2) Revenue Requirements
(3) Monthly (Over) / Under Recovery
(4) Deferred Balance
(5) Monthly Interest Rate
(6) After Tax Monthly Interest Expense/(Credit)
(7) Cumulative Interest
(8) Balance Added to Subsequent Year's Revenue Req
(9) Net Sales - kWh (000)
(12) Average Net of Tax Deferred Balance
Schedule SS-S4A-3Page 3 of 4
0.000499 0.000499 0.000499 0.000499 0.000499 0.000499 0.000499
77 78 79 80 81 82 83
Nov-15 Dec-15 Jan-16 Feb-16 Mar-16 Apr-16 May-16
1,500,178 1,615,501 1,746,735 1,703,219 1,645,079 1,499,143 1,532,572
3,765,385 2,628,887 (247,859) 3,918,691 3,836,398 225,459 3,772,103
2,265,207 1,013,386 (1,994,594) 2,215,472 2,191,318 (1,273,684) 2,239,530
(5,996,033) (4,982,646) (6,977,241) (4,761,768) (2,570,450) (3,844,134) (1,604,603)
0.0167% 0.0167% 0.0167% 0.0167% 0.0167% 0.0167% 0.0167%
(703) (541) (590) (579) (361) (316) (269)
(1,395) (1,936) (2,526) (3,104) (3,466) (3,782) (4,051)
(5,997,428) (4,984,583) (6,979,766) (4,764,872) (2,573,915) (3,847,916) (1,608,654)
3,006,370 3,237,476 3,500,472 3,413,264 3,296,752 3,004,295 3,071,288
(4,216,588) (3,246,944) (3,537,137) (3,471,812) (2,168,503) (1,897,113) (1,611,464)
ATTACHMENT B
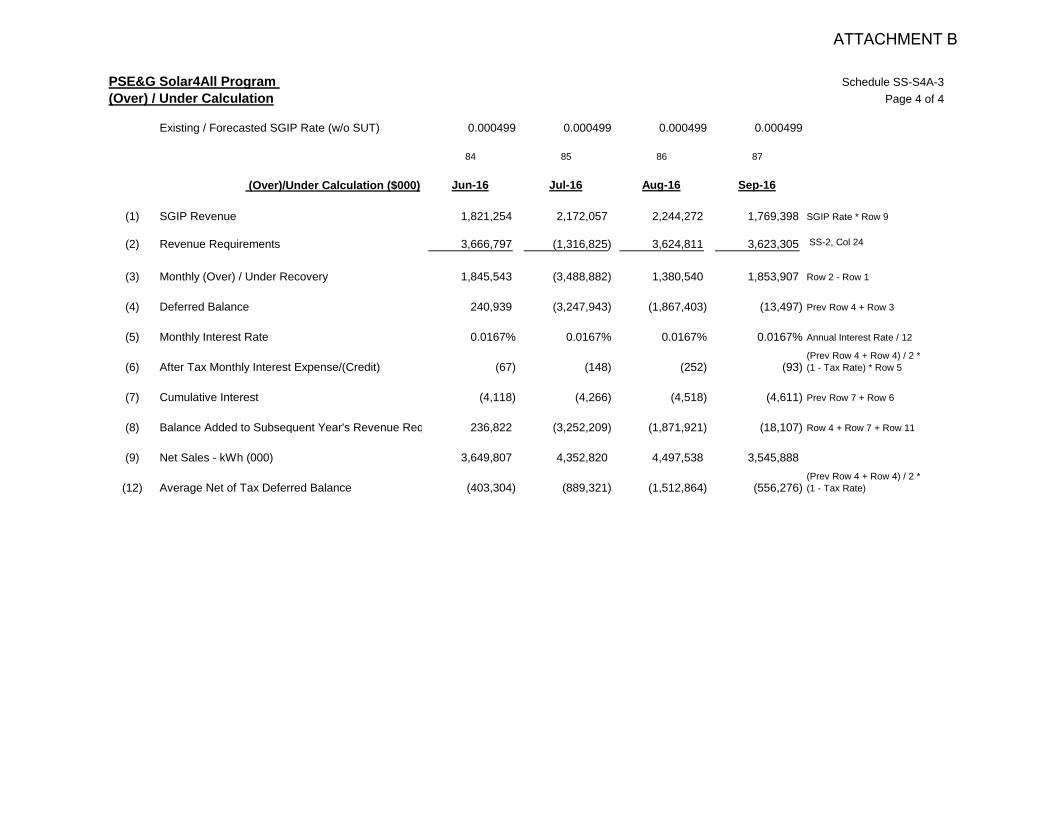
PSE&G Solar4All Program (Over) / Under Calculation
Existing / Forecasted SGIP Rate (w/o SUT)
(Over)/Under Calculation ($000)
(1) SGIP Revenue
(2) Revenue Requirements
(3) Monthly (Over) / Under Recovery
(4) Deferred Balance
(5) Monthly Interest Rate
(6) After Tax Monthly Interest Expense/(Credit)
(7) Cumulative Interest
(8) Balance Added to Subsequent Year's Revenue Req
(9) Net Sales - kWh (000)
(12) Average Net of Tax Deferred Balance
Schedule SS-S4A-3Page 4 of 4
0.000499 0.000499 0.000499 0.000499
84 85 86 87
Jun-16 Jul-16 Aug-16 Sep-16
1,821,254 2,172,057 2,244,272 1,769,398 SGIP Rate * Row 9
3,666,797 (1,316,825) 3,624,811 3,623,305 SS-2, Col 24
1,845,543 (3,488,882) 1,380,540 1,853,907 Row 2 - Row 1
240,939 (3,247,943) (1,867,403) (13,497) Prev Row 4 + Row 3
0.0167% 0.0167% 0.0167% 0.0167% Annual Interest Rate / 12
(67) (148) (252) (93) (Prev Row 4 + Row 4) / 2 *(1 - Tax Rate) * Row 5
(4,118) (4,266) (4,518) (4,611) Prev Row 7 + Row 6
236,822 (3,252,209) (1,871,921) (18,107) Row 4 + Row 7 + Row 11
3,649,807 4,352,820 4,497,538 3,545,888
(403,304) (889,321) (1,512,864) (556,276) (Prev Row 4 + Row 4) / 2 *(1 - Tax Rate)
ATTACHMENT B
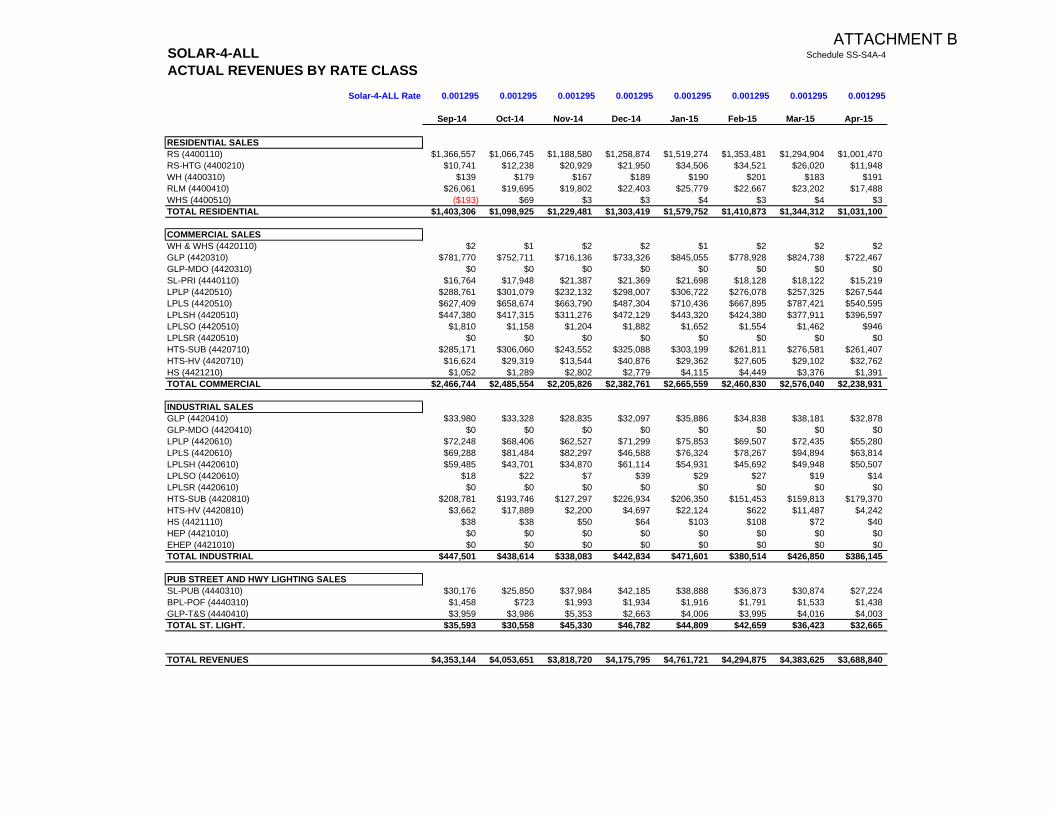
SOLAR-4-ALL Schedule SS-S4A-4
ACTUAL REVENUES BY RATE CLASSSolar-4-ALL Rate 0.001295 0.001295 0.001295 0.001295 0.001295 0.001295 0.001295 0.001295
Sep-14 Oct-14 Nov-14 Dec-14 Jan-15 Feb-15 Mar-15 Apr-15
RESIDENTIAL SALESRS (4400110) $1,366,557 $1,066,745 $1,188,580 $1,258,874 $1,519,274 $1,353,481 $1,294,904 $1,001,470RS-HTG (4400210) $10,741 $12,238 $20,929 $21,950 $34,506 $34,521 $26,020 $11,948WH (4400310) $139 $179 $167 $189 $190 $201 $183 $191RLM (4400410) $26,061 $19,695 $19,802 $22,403 $25,779 $22,667 $23,202 $17,488WHS (4400510) ($193) $69 $3 $3 $4 $3 $4 $3TOTAL RESIDENTIAL $1,403,306 $1,098,925 $1,229,481 $1,303,419 $1,579,752 $1,410,873 $1,344,312 $1,031,100
COMMERCIAL SALESWH & WHS (4420110) $2 $1 $2 $2 $1 $2 $2 $2GLP (4420310) $781,770 $752,711 $716,136 $733,326 $845,055 $778,928 $824,738 $722,467GLP-MDO (4420310) $0 $0 $0 $0 $0 $0 $0 $0SL-PRI (4440110) $16,764 $17,948 $21,387 $21,369 $21,698 $18,128 $18,122 $15,219LPLP (4420510) $288,761 $301,079 $232,132 $298,007 $306,722 $276,078 $257,325 $267,544LPLS (4420510) $627,409 $658,674 $663,790 $487,304 $710,436 $667,895 $787,421 $540,595LPLSH (4420510) $447,380 $417,315 $311,276 $472,129 $443,320 $424,380 $377,911 $396,597LPLSO (4420510) $1,810 $1,158 $1,204 $1,882 $1,652 $1,554 $1,462 $946LPLSR (4420510) $0 $0 $0 $0 $0 $0 $0 $0HTS-SUB (4420710) $285,171 $306,060 $243,552 $325,088 $303,199 $261,811 $276,581 $261,407HTS-HV (4420710) $16,624 $29,319 $13,544 $40,876 $29,362 $27,605 $29,102 $32,762HS (4421210) $1,052 $1,289 $2,802 $2,779 $4,115 $4,449 $3,376 $1,391TOTAL COMMERCIAL $2,466,744 $2,485,554 $2,205,826 $2,382,761 $2,665,559 $2,460,830 $2,576,040 $2,238,931
INDUSTRIAL SALESGLP (4420410) $33,980 $33,328 $28,835 $32,097 $35,886 $34,838 $38,181 $32,878GLP-MDO (4420410) $0 $0 $0 $0 $0 $0 $0 $0LPLP (4420610) $72,248 $68,406 $62,527 $71,299 $75,853 $69,507 $72,435 $55,280LPLS (4420610) $69,288 $81,484 $82,297 $46,588 $76,324 $78,267 $94,894 $63,814LPLSH (4420610) $59,485 $43,701 $34,870 $61,114 $54,931 $45,692 $49,948 $50,507LPLSO (4420610) $18 $22 $7 $39 $29 $27 $19 $14LPLSR (4420610) $0 $0 $0 $0 $0 $0 $0 $0HTS-SUB (4420810) $208,781 $193,746 $127,297 $226,934 $206,350 $151,453 $159,813 $179,370HTS-HV (4420810) $3,662 $17,889 $2,200 $4,697 $22,124 $622 $11,487 $4,242HS (4421110) $38 $38 $50 $64 $103 $108 $72 $40HEP (4421010) $0 $0 $0 $0 $0 $0 $0 $0EHEP (4421010) $0 $0 $0 $0 $0 $0 $0 $0TOTAL INDUSTRIAL $447,501 $438,614 $338,083 $442,834 $471,601 $380,514 $426,850 $386,145
PUB STREET AND HWY LIGHTING SALESSL-PUB (4440310) $30,176 $25,850 $37,984 $42,185 $38,888 $36,873 $30,874 $27,224BPL-POF (4440310) $1,458 $723 $1,993 $1,934 $1,916 $1,791 $1,533 $1,438GLP-T&S (4440410) $3,959 $3,986 $5,353 $2,663 $4,006 $3,995 $4,016 $4,003TOTAL ST. LIGHT. $35,593 $30,558 $45,330 $46,782 $44,809 $42,659 $36,423 $32,665
TOTAL REVENUES $4,353,144 $4,053,651 $3,818,720 $4,175,795 $4,761,721 $4,294,875 $4,383,625 $3,688,840
ATTACHMENT B
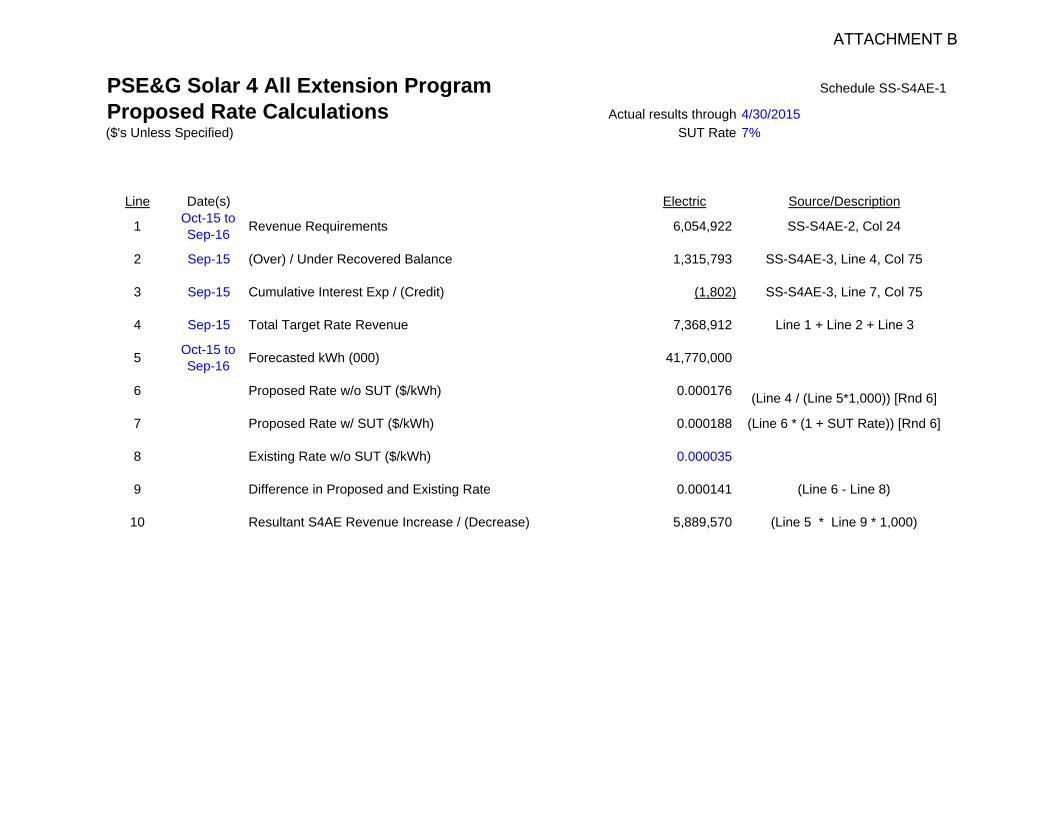
PSE&G Solar 4 All Extension Program Schedule SS-S4AE-1
Proposed Rate Calculations Actual results through 4/30/2015($'s Unless Specified) SUT Rate 7%
Line Date(s) Electric Source/Description
1 Oct-15 to Sep-16 Revenue Requirements 6,054,922 SS-S4AE-2, Col 24
2 Sep-15 (Over) / Under Recovered Balance 1,315,793 SS-S4AE-3, Line 4, Col 75
3 Sep-15 Cumulative Interest Exp / (Credit) (1,802) SS-S4AE-3, Line 7, Col 75
4 Sep-15 Total Target Rate Revenue 7,368,912 Line 1 + Line 2 + Line 3
5 Oct-15 to Sep-16 Forecasted kWh (000) 41,770,000
6 Proposed Rate w/o SUT ($/kWh) 0.000176 (Line 4 / (Line 5*1,000)) [Rnd 6]
7 Proposed Rate w/ SUT ($/kWh) 0.000188 (Line 6 * (1 + SUT Rate)) [Rnd 6]
8 Existing Rate w/o SUT ($/kWh) 0.000035
9 Difference in Proposed and Existing Rate 0.000141 (Line 6 - Line 8)
10 Resultant S4AE Revenue Increase / (Decrease) 5,889,570 (Line 5 * Line 9 * 1,000)
ATTACHMENT B
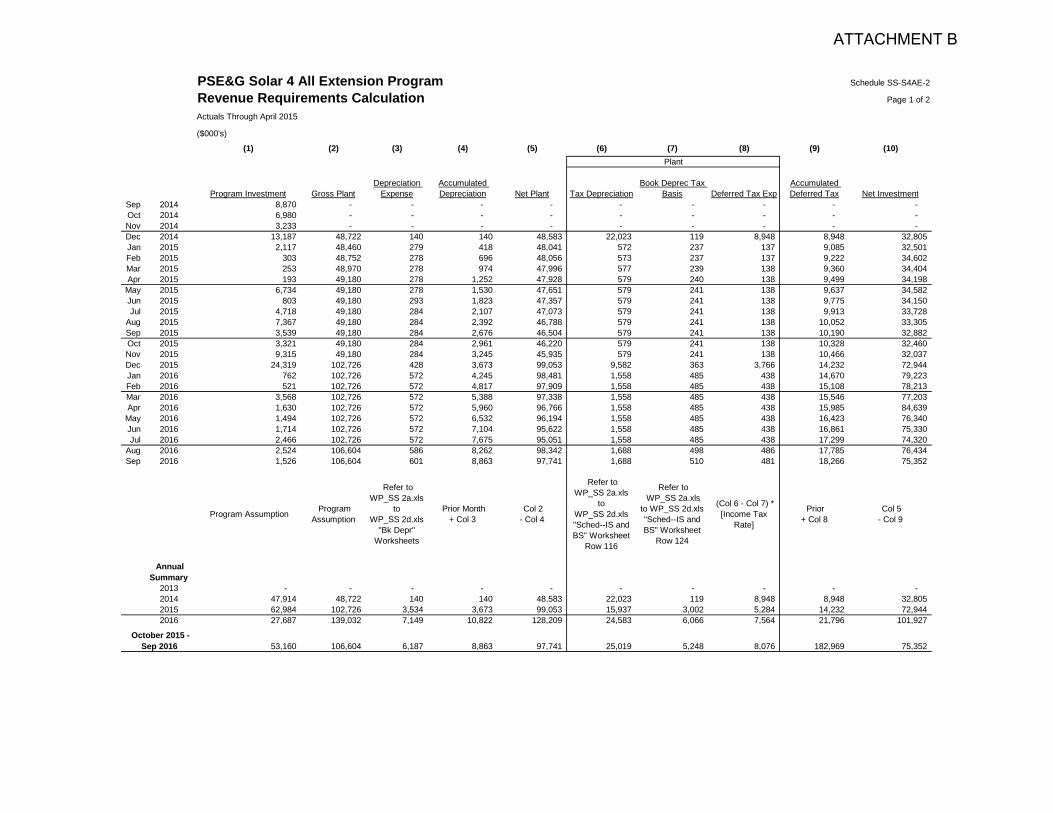
PSE&G Solar 4 All Extension Program Schedule SS-S4AE-2
Revenue Requirements Calculation Page 1 of 2
Actuals Through April 2015
($000's)
(1) (2) (3) (4) (5) (6) (7) (8) (9) (10)Plant
Program Investment Gross PlantDepreciation
ExpenseAccumulated Depreciation Net Plant Tax Depreciation
Book Deprec Tax Basis Deferred Tax Exp
Accumulated Deferred Tax Net Investment
Sep 2014 8,870 - - - - - - - - - Oct 2014 6,980 - - - - - - - - - Nov 2014 3,233 - - - - - - - - - Dec 2014 13,187 48,722 140 140 48,583 22,023 119 8,948 8,948 32,805 Jan 2015 2,117 48,460 279 418 48,041 572 237 137 9,085 32,501 Feb 2015 303 48,752 278 696 48,056 573 237 137 9,222 34,602 Mar 2015 253 48,970 278 974 47,996 577 239 138 9,360 34,404 Apr 2015 193 49,180 278 1,252 47,928 579 240 138 9,499 34,198
May 2015 6,734 49,180 278 1,530 47,651 579 241 138 9,637 34,582 Jun 2015 803 49,180 293 1,823 47,357 579 241 138 9,775 34,150 Jul 2015 4,718 49,180 284 2,107 47,073 579 241 138 9,913 33,728
Aug 2015 7,367 49,180 284 2,392 46,788 579 241 138 10,052 33,305 Sep 2015 3,539 49,180 284 2,676 46,504 579 241 138 10,190 32,882 Oct 2015 3,321 49,180 284 2,961 46,220 579 241 138 10,328 32,460 Nov 2015 9,315 49,180 284 3,245 45,935 579 241 138 10,466 32,037 Dec 2015 24,319 102,726 428 3,673 99,053 9,582 363 3,766 14,232 72,944 Jan 2016 762 102,726 572 4,245 98,481 1,558 485 438 14,670 79,223 Feb 2016 521 102,726 572 4,817 97,909 1,558 485 438 15,108 78,213 Mar 2016 3,568 102,726 572 5,388 97,338 1,558 485 438 15,546 77,203 Apr 2016 1,630 102,726 572 5,960 96,766 1,558 485 438 15,985 84,639
May 2016 1,494 102,726 572 6,532 96,194 1,558 485 438 16,423 76,340 Jun 2016 1,714 102,726 572 7,104 95,622 1,558 485 438 16,861 75,330 Jul 2016 2,466 102,726 572 7,675 95,051 1,558 485 438 17,299 74,320
Aug 2016 2,524 106,604 586 8,262 98,342 1,688 498 486 17,785 76,434 Sep 2016 1,526 106,604 601 8,863 97,741 1,688 510 481 18,266 75,352
Program Assumption Program Assumption
Refer to WP_SS 2a.xls
toWP_SS 2d.xls
"Bk Depr" Worksheets
Prior Month+ Col 3
Col 2- Col 4
Refer to WP_SS 2a.xls
toWP_SS 2d.xls"Sched--IS and BS" Worksheet
Row 116
Refer to WP_SS 2a.xls
to WP_SS 2d.xls"Sched--IS and BS" Worksheet
Row 124
(Col 6 - Col 7) * [Income Tax
Rate]
Prior+ Col 8
Col 5- Col 9
Annual Summary
2013 - - - - - - - - - - 2014 47,914 48,722 140 140 48,583 22,023 119 8,948 8,948 32,805 2015 62,984 102,726 3,534 3,673 99,053 15,937 3,002 5,284 14,232 72,944 2016 27,687 139,032 7,149 10,822 128,209 24,583 6,066 7,564 21,796 101,927
53,160 106,604 6,187 8,863 97,741 25,019 5,248 8,076 182,969 75,352 October 2015 -
Sep 2016
ATTACHMENT B
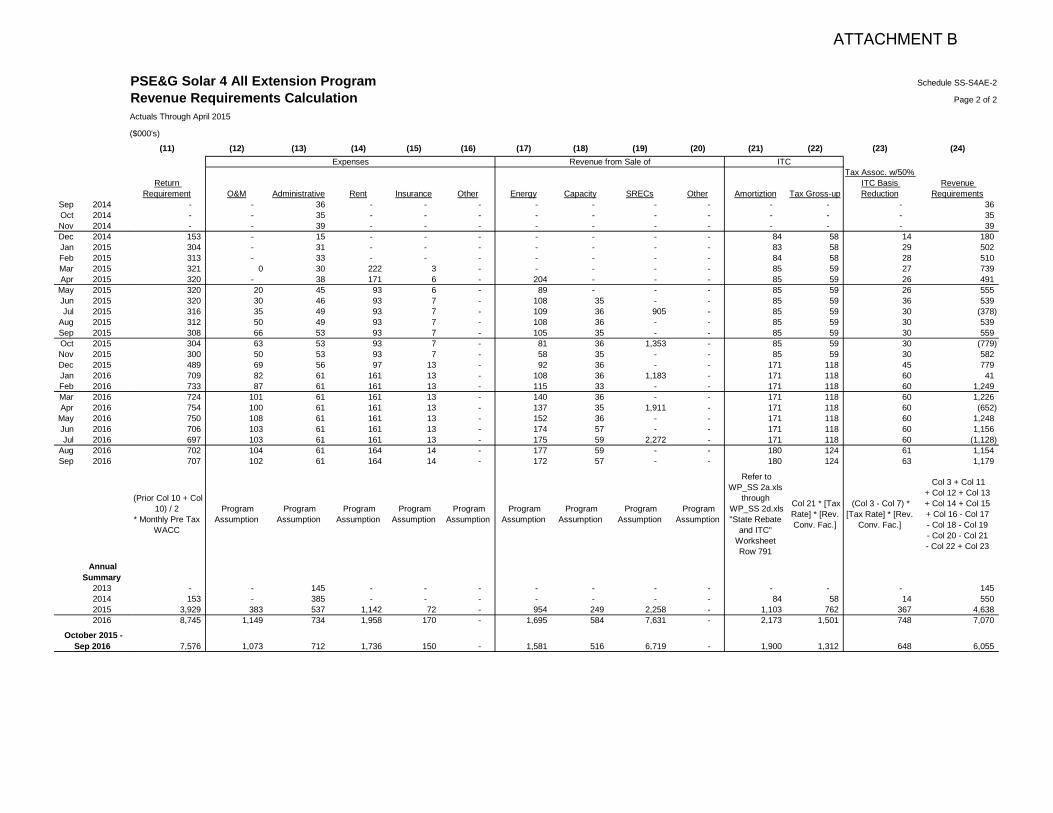
Sep 2014Oct 2014Nov 2014Dec 2014Jan 2015Feb 2015Mar 2015Apr 2015
May 2015Jun 2015Jul 2015
Aug 2015Sep 2015Oct 2015Nov 2015Dec 2015Jan 2016Feb 2016Mar 2016Apr 2016
May 2016Jun 2016Jul 2016
Aug 2016Sep 2016
Annual Summary
2013201420152016
October 2015 - Sep 2016
PSE&G Solar 4 All Extension Program Schedule SS-S4AE-2
Revenue Requirements Calculation Page 2 of 2
Actuals Through April 2015
($000's)
(11) (12) (13) (14) (15) (16) (17) (18) (19) (20) (21) (22) (23) (24)Expenses Revenue from Sale of ITC
Return Requirement O&M Administrative Rent Insurance Other Energy Capacity SRECs Other Amortiztion Tax Gross-up
Tax Assoc. w/50% ITC Basis Reduction
Revenue Requirements
- - 36 - - - - - - - - - - 36 - - 35 - - - - - - - - - - 35 - - 39 - - - - - - - - - - 39 153 - 15 - - - - - - - 84 58 14 180 304 - 31 - - - - - - - 83 58 29 502 313 - 33 - - - - - - - 84 58 28 510 321 0 30 222 3 - - - - - 85 59 27 739 320 - 38 171 6 - 204 - - - 85 59 26 491 320 20 45 93 6 - 89 - - - 85 59 26 555 320 30 46 93 7 - 108 35 - - 85 59 36 539 316 35 49 93 7 - 109 36 905 - 85 59 30 (378) 312 50 49 93 7 - 108 36 - - 85 59 30 539 308 66 53 93 7 - 105 35 - - 85 59 30 559 304 63 53 93 7 - 81 36 1,353 - 85 59 30 (779) 300 50 53 93 7 - 58 35 - - 85 59 30 582 489 69 56 97 13 - 92 36 - - 171 118 45 779 709 82 61 161 13 - 108 36 1,183 - 171 118 60 41 733 87 61 161 13 - 115 33 - - 171 118 60 1,249 724 101 61 161 13 - 140 36 - - 171 118 60 1,226 754 100 61 161 13 - 137 35 1,911 - 171 118 60 (652) 750 108 61 161 13 - 152 36 - - 171 118 60 1,248 706 103 61 161 13 - 174 57 - - 171 118 60 1,156 697 103 61 161 13 - 175 59 2,272 - 171 118 60 (1,128) 702 104 61 164 14 - 177 59 - - 180 124 61 1,154 707 102 61 164 14 - 172 57 - - 180 124 63 1,179
(Prior Col 10 + Col 10) / 2
* Monthly Pre Tax WACC
Program Assumption
Program Assumption
Program Assumption
Program Assumption
Program Assumption
Program Assumption
Program Assumption
Program Assumption
Program Assumption
Refer toWP_SS 2a.xls
through WP_SS 2d.xls"State Rebate
and ITC" WorksheetRow 791
Col 21 * [Tax Rate] * [Rev. Conv. Fac.]
(Col 3 - Col 7) * [Tax Rate] * [Rev.
Conv. Fac.]
Col 3 + Col 11+ Col 12 + Col 13+ Col 14 + Col 15+ Col 16 - Col 17- Col 18 - Col 19- Col 20 - Col 21- Col 22 + Col 23
- - 145 - - - - - - - - - - 145 153 - 385 - - - - - - - 84 58 14 550
3,929 383 537 1,142 72 - 954 249 2,258 - 1,103 762 367 4,638 8,745 1,149 734 1,958 170 - 1,695 584 7,631 - 2,173 1,501 748 7,070
7,576 1,073 712 1,736 150 - 1,581 516 6,719 - 1,900 1,312 648 6,055
ATTACHMENT B
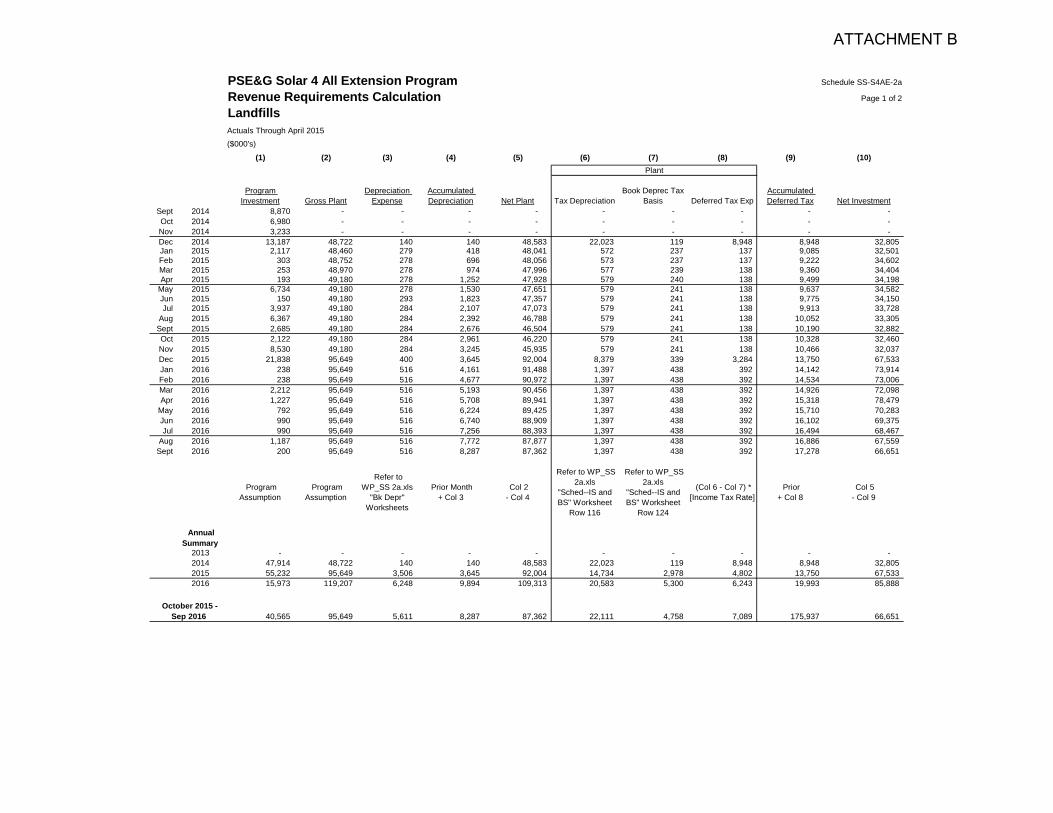
PSE&G Solar 4 All Extension Program Schedule SS-S4AE-2a
Revenue Requirements Calculation Page 1 of 2
LandfillsActuals Through April 2015($000's)
(1) (2) (3) (4) (5) (6) (7) (8) (9) (10)Plant
Program Investment Gross Plant
Depreciation Expense
Accumulated Depreciation Net Plant Tax Depreciation
Book Deprec Tax Basis Deferred Tax Exp
Accumulated Deferred Tax Net Investment
Sept 2014 8,870 - - - - - - - - - Oct 2014 6,980 - - - - - - - - - Nov 2014 3,233 - - - - - - - - - Dec 2014 13,187 48,722 140 140 48,583 22,023 119 8,948 8,948 32,805 Jan 2015 2,117 48,460 279 418 48,041 572 237 137 9,085 32,501 Feb 2015 303 48,752 278 696 48,056 573 237 137 9,222 34,602 Mar 2015 253 48,970 278 974 47,996 577 239 138 9,360 34,404 Apr 2015 193 49,180 278 1,252 47,928 579 240 138 9,499 34,198
May 2015 6,734 49,180 278 1,530 47,651 579 241 138 9,637 34,582 Jun 2015 150 49,180 293 1,823 47,357 579 241 138 9,775 34,150 Jul 2015 3,937 49,180 284 2,107 47,073 579 241 138 9,913 33,728
Aug 2015 6,367 49,180 284 2,392 46,788 579 241 138 10,052 33,305 Sept 2015 2,685 49,180 284 2,676 46,504 579 241 138 10,190 32,882 Oct 2015 2,122 49,180 284 2,961 46,220 579 241 138 10,328 32,460 Nov 2015 8,530 49,180 284 3,245 45,935 579 241 138 10,466 32,037 Dec 2015 21,838 95,649 400 3,645 92,004 8,379 339 3,284 13,750 67,533 Jan 2016 238 95,649 516 4,161 91,488 1,397 438 392 14,142 73,914 Feb 2016 238 95,649 516 4,677 90,972 1,397 438 392 14,534 73,006 Mar 2016 2,212 95,649 516 5,193 90,456 1,397 438 392 14,926 72,098 Apr 2016 1,227 95,649 516 5,708 89,941 1,397 438 392 15,318 78,479
May 2016 792 95,649 516 6,224 89,425 1,397 438 392 15,710 70,283 Jun 2016 990 95,649 516 6,740 88,909 1,397 438 392 16,102 69,375 Jul 2016 990 95,649 516 7,256 88,393 1,397 438 392 16,494 68,467
Aug 2016 1,187 95,649 516 7,772 87,877 1,397 438 392 16,886 67,559 Sept 2016 200 95,649 516 8,287 87,362 1,397 438 392 17,278 66,651
Program Assumption
Program Assumption
Refer to WP_SS 2a.xls
"Bk Depr" Worksheets
Prior Month+ Col 3
Col 2- Col 4
Refer to WP_SS 2a.xls
"Sched--IS and BS" Worksheet
Row 116
Refer to WP_SS 2a.xls
"Sched--IS and BS" Worksheet
Row 124
(Col 6 - Col 7) * [Income Tax Rate]
Prior+ Col 8
Col 5- Col 9
Annual Summary
2013 - - - - - - - - - - 2014 47,914 48,722 140 140 48,583 22,023 119 8,948 8,948 32,805 2015 55,232 95,649 3,506 3,645 92,004 14,734 2,978 4,802 13,750 67,533 2016 15,973 119,207 6,248 9,894 109,313 20,583 5,300 6,243 19,993 85,888
40,565 95,649 5,611 8,287 87,362 22,111 4,758 7,089 175,937 66,651 October 2015 -
Sep 2016
ATTACHMENT B
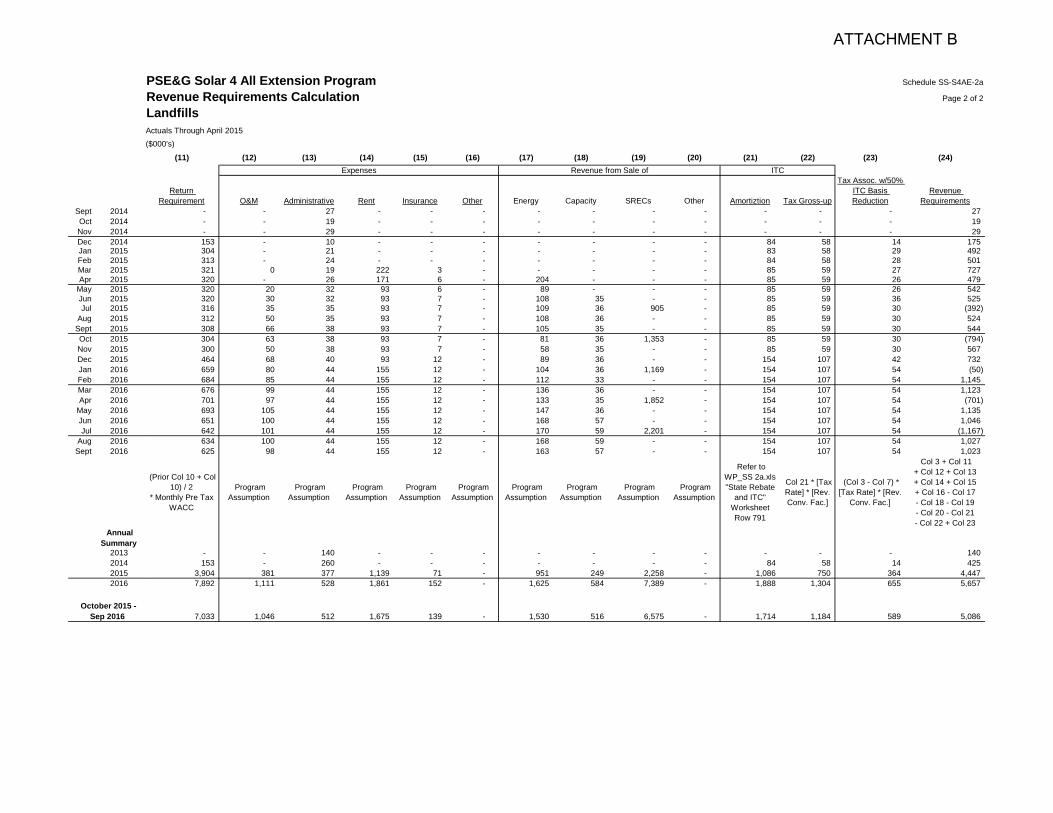
Sept 2014Oct 2014Nov 2014Dec 2014Jan 2015Feb 2015Mar 2015Apr 2015
May 2015Jun 2015Jul 2015
Aug 2015Sept 2015Oct 2015Nov 2015Dec 2015Jan 2016Feb 2016Mar 2016Apr 2016
May 2016Jun 2016Jul 2016
Aug 2016Sept 2016
Annual Summary
2013201420152016
October 2015 - Sep 2016
PSE&G Solar 4 All Extension Program Schedule SS-S4AE-2a
Revenue Requirements Calculation Page 2 of 2
LandfillsActuals Through April 2015($000's)
(11) (12) (13) (14) (15) (16) (17) (18) (19) (20) (21) (22) (23) (24)Expenses Revenue from Sale of ITC
Return Requirement O&M Administrative Rent Insurance Other Energy Capacity SRECs Other Amortiztion Tax Gross-up
Tax Assoc. w/50% ITC Basis Reduction
Revenue Requirements
- - 27 - - - - - - - - - - 27 - - 19 - - - - - - - - - - 19 - - 29 - - - - - - - - - - 29 153 - 10 - - - - - - - 84 58 14 175 304 - 21 - - - - - - - 83 58 29 492 313 - 24 - - - - - - - 84 58 28 501 321 0 19 222 3 - - - - - 85 59 27 727 320 - 26 171 6 - 204 - - - 85 59 26 479 320 20 32 93 6 - 89 - - - 85 59 26 542 320 30 32 93 7 - 108 35 - - 85 59 36 525 316 35 35 93 7 - 109 36 905 - 85 59 30 (392) 312 50 35 93 7 - 108 36 - - 85 59 30 524 308 66 38 93 7 - 105 35 - - 85 59 30 544 304 63 38 93 7 - 81 36 1,353 - 85 59 30 (794) 300 50 38 93 7 - 58 35 - - 85 59 30 567 464 68 40 93 12 - 89 36 - - 154 107 42 732 659 80 44 155 12 - 104 36 1,169 - 154 107 54 (50) 684 85 44 155 12 - 112 33 - - 154 107 54 1,145 676 99 44 155 12 - 136 36 - - 154 107 54 1,123 701 97 44 155 12 - 133 35 1,852 - 154 107 54 (701) 693 105 44 155 12 - 147 36 - - 154 107 54 1,135 651 100 44 155 12 - 168 57 - - 154 107 54 1,046 642 101 44 155 12 - 170 59 2,201 - 154 107 54 (1,167) 634 100 44 155 12 - 168 59 - - 154 107 54 1,027 625 98 44 155 12 - 163 57 - - 154 107 54 1,023
(Prior Col 10 + Col 10) / 2
* Monthly Pre Tax WACC
Program Assumption
Program Assumption
Program Assumption
Program Assumption
Program Assumption
Program Assumption
Program Assumption
Program Assumption
Program Assumption
Refer to WP_SS 2a.xls"State Rebate
and ITC" WorksheetRow 791
Col 21 * [Tax Rate] * [Rev. Conv. Fac.]
(Col 3 - Col 7) * [Tax Rate] * [Rev.
Conv. Fac.]
Col 3 + Col 11+ Col 12 + Col 13+ Col 14 + Col 15+ Col 16 - Col 17- Col 18 - Col 19- Col 20 - Col 21- Col 22 + Col 23
- - 140 - - - - - - - - - - 140 153 - 260 - - - - - - - 84 58 14 425
3,904 381 377 1,139 71 - 951 249 2,258 - 1,086 750 364 4,447 7,892 1,111 528 1,861 152 - 1,625 584 7,389 - 1,888 1,304 655 5,657
7,033 1,046 512 1,675 139 - 1,530 516 6,575 - 1,714 1,184 589 5,086
ATTACHMENT B
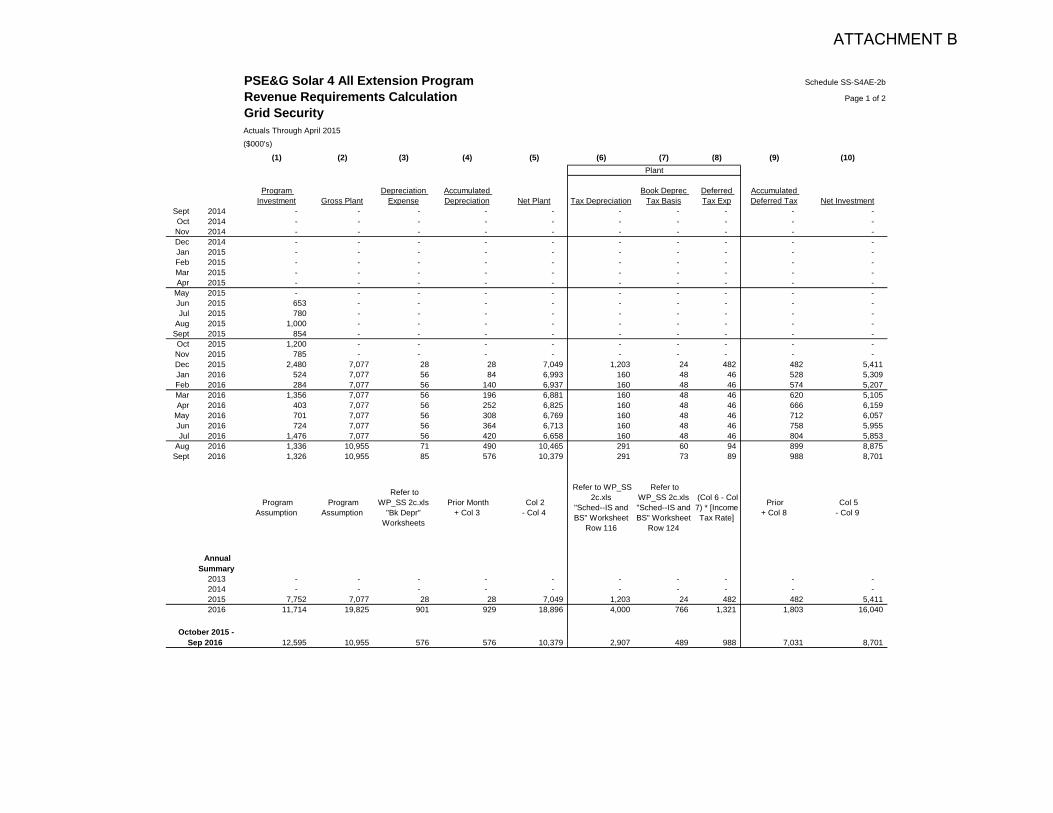
PSE&G Solar 4 All Extension Program Schedule SS-S4AE-2b
Revenue Requirements Calculation Page 1 of 2
Grid SecurityActuals Through April 2015($000's)
(1) (2) (3) (4) (5) (6) (7) (8) (9) (10)Plant
Program Investment Gross Plant
Depreciation Expense
Accumulated Depreciation Net Plant Tax Depreciation
Book Deprec Tax Basis
Deferred Tax Exp
Accumulated Deferred Tax Net Investment
Sept 2014 - - - - - - - - - - Oct 2014 - - - - - - - - - - Nov 2014 - - - - - - - - - - Dec 2014 - - - - - - - - - - Jan 2015 - - - - - - - - - - Feb 2015 - - - - - - - - - - Mar 2015 - - - - - - - - - - Apr 2015 - - - - - - - - - -
May 2015 - - - - - - - - - - Jun 2015 653 - - - - - - - - - Jul 2015 780 - - - - - - - - -
Aug 2015 1,000 - - - - - - - - - Sept 2015 854 - - - - - - - - - Oct 2015 1,200 - - - - - - - - - Nov 2015 785 - - - - - - - - - Dec 2015 2,480 7,077 28 28 7,049 1,203 24 482 482 5,411 Jan 2016 524 7,077 56 84 6,993 160 48 46 528 5,309 Feb 2016 284 7,077 56 140 6,937 160 48 46 574 5,207 Mar 2016 1,356 7,077 56 196 6,881 160 48 46 620 5,105 Apr 2016 403 7,077 56 252 6,825 160 48 46 666 6,159
May 2016 701 7,077 56 308 6,769 160 48 46 712 6,057 Jun 2016 724 7,077 56 364 6,713 160 48 46 758 5,955 Jul 2016 1,476 7,077 56 420 6,658 160 48 46 804 5,853
Aug 2016 1,336 10,955 71 490 10,465 291 60 94 899 8,875 Sept 2016 1,326 10,955 85 576 10,379 291 73 89 988 8,701
Program Assumption
Program Assumption
Refer to WP_SS 2c.xls
"Bk Depr" Worksheets
Prior Month+ Col 3
Col 2- Col 4
Refer to WP_SS 2c.xls
"Sched--IS and BS" Worksheet
Row 116
Refer to WP_SS 2c.xls"Sched--IS and BS" Worksheet
Row 124
(Col 6 - Col 7) * [Income Tax Rate]
Prior+ Col 8
Col 5- Col 9
Annual Summary
2013 - - - - - - - - - - 2014 - - - - - - - - - - 2015 7,752 7,077 28 28 7,049 1,203 24 482 482 5,411 2016 11,714 19,825 901 929 18,896 4,000 766 1,321 1,803 16,040
12,595 10,955 576 576 10,379 2,907 489 988 7,031 8,701 October 2015 -
Sep 2016
ATTACHMENT B
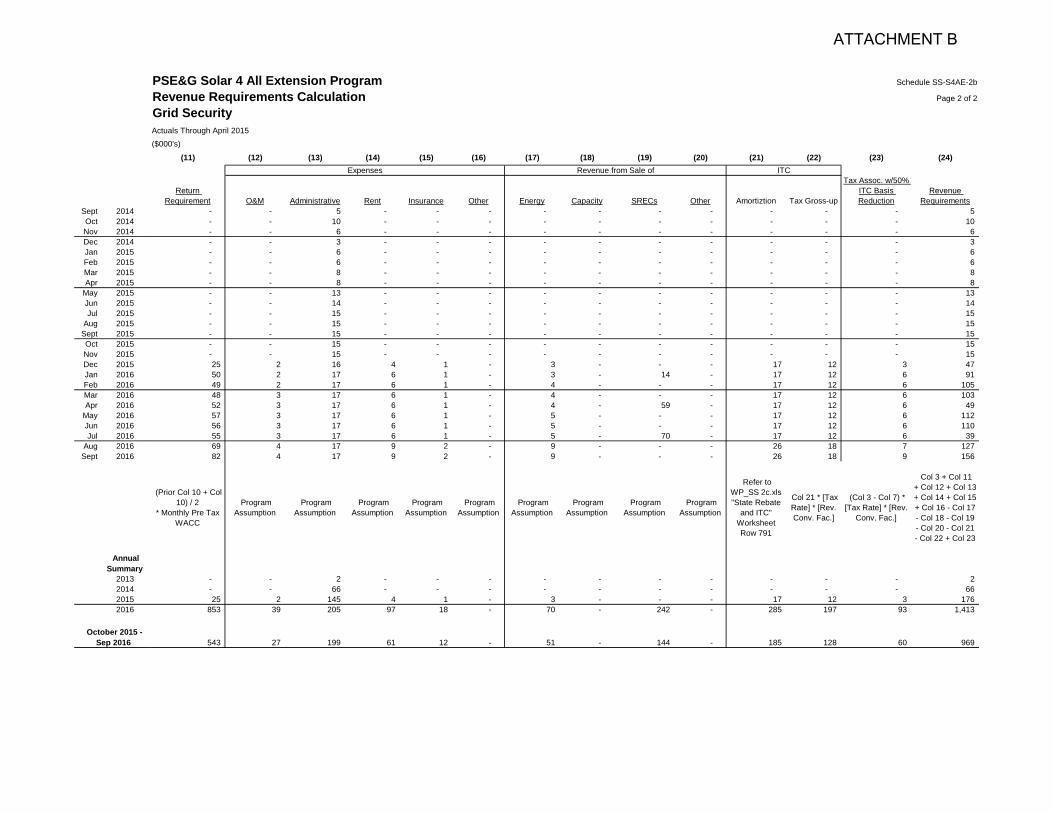
Sept 2014Oct 2014Nov 2014Dec 2014Jan 2015Feb 2015Mar 2015Apr 2015
May 2015Jun 2015Jul 2015
Aug 2015Sept 2015Oct 2015Nov 2015Dec 2015Jan 2016Feb 2016Mar 2016Apr 2016
May 2016Jun 2016Jul 2016
Aug 2016Sept 2016
Annual Summary
2013201420152016
October 2015 - Sep 2016
PSE&G Solar 4 All Extension Program Schedule SS-S4AE-2b
Revenue Requirements Calculation Page 2 of 2
Grid SecurityActuals Through April 2015($000's)
(11) (12) (13) (14) (15) (16) (17) (18) (19) (20) (21) (22) (23) (24)Expenses Revenue from Sale of ITC
Return Requirement O&M Administrative Rent Insurance Other Energy Capacity SRECs Other Amortiztion Tax Gross-up
Tax Assoc. w/50% ITC Basis Reduction
Revenue Requirements
- - 5 - - - - - - - - - - 5 - - 10 - - - - - - - - - - 10 - - 6 - - - - - - - - - - 6 - - 3 - - - - - - - - - - 3 - - 6 - - - - - - - - - - 6 - - 6 - - - - - - - - - - 6 - - 8 - - - - - - - - - - 8 - - 8 - - - - - - - - - - 8 - - 13 - - - - - - - - - - 13 - - 14 - - - - - - - - - - 14 - - 15 - - - - - - - - - - 15 - - 15 - - - - - - - - - - 15 - - 15 - - - - - - - - - - 15 - - 15 - - - - - - - - - - 15 - - 15 - - - - - - - - - - 15 25 2 16 4 1 - 3 - - - 17 12 3 47 50 2 17 6 1 - 3 - 14 - 17 12 6 91 49 2 17 6 1 - 4 - - - 17 12 6 105 48 3 17 6 1 - 4 - - - 17 12 6 103 52 3 17 6 1 - 4 - 59 - 17 12 6 49 57 3 17 6 1 - 5 - - - 17 12 6 112 56 3 17 6 1 - 5 - - - 17 12 6 110 55 3 17 6 1 - 5 - 70 - 17 12 6 39 69 4 17 9 2 - 9 - - - 26 18 7 127 82 4 17 9 2 - 9 - - - 26 18 9 156
(Prior Col 10 + Col 10) / 2
* Monthly Pre Tax WACC
Program Assumption
Program Assumption
Program Assumption
Program Assumption
Program Assumption
Program Assumption
Program Assumption
Program Assumption
Program Assumption
Refer to WP_SS 2c.xls"State Rebate
and ITC" WorksheetRow 791
Col 21 * [Tax Rate] * [Rev. Conv. Fac.]
(Col 3 - Col 7) * [Tax Rate] * [Rev.
Conv. Fac.]
Col 3 + Col 11+ Col 12 + Col 13+ Col 14 + Col 15+ Col 16 - Col 17- Col 18 - Col 19- Col 20 - Col 21- Col 22 + Col 23
- - 2 - - - - - - - - - - 2 - - 66 - - - - - - - - - - 66 25 2 145 4 1 - 3 - - - 17 12 3 176
853 39 205 97 18 - 70 - 242 - 285 197 93 1,413
543 27 199 61 12 - 51 - 144 - 185 128 60 969
ATTACHMENT B
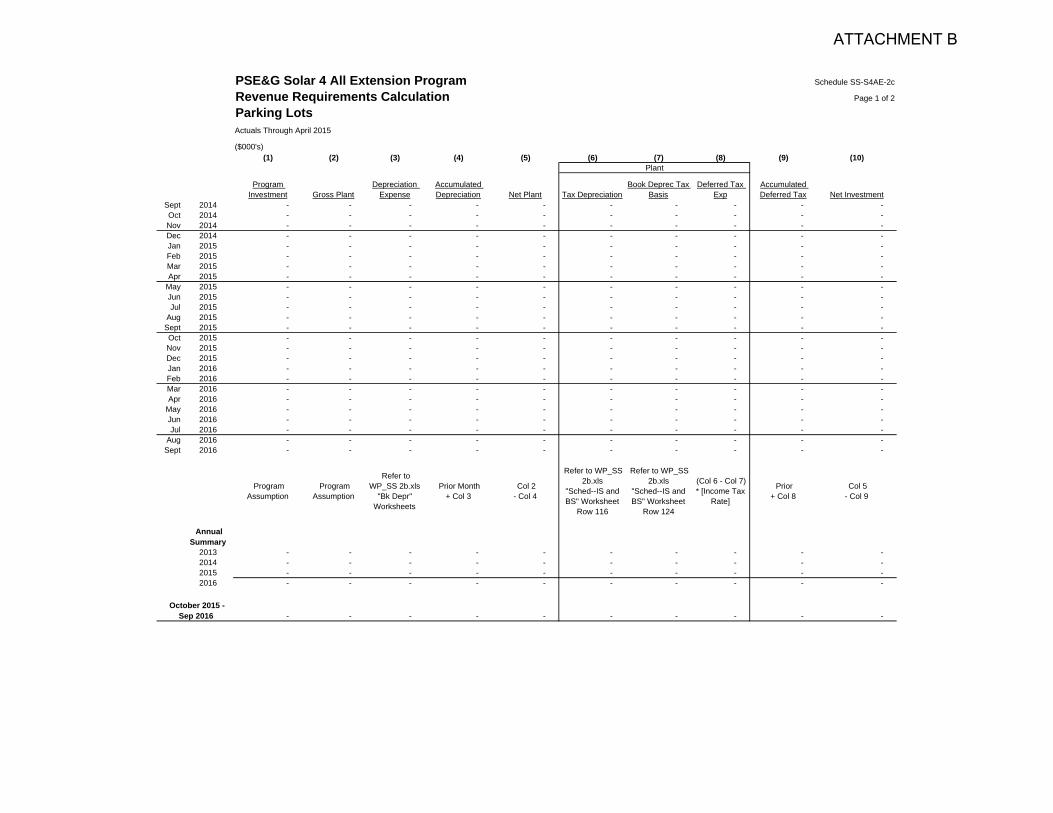
PSE&G Solar 4 All Extension Program Schedule SS-S4AE-2c
Revenue Requirements Calculation Page 1 of 2
Parking LotsActuals Through April 2015
($000's)(1) (2) (3) (4) (5) (6) (7) (8) (9) (10)
Plant
Program Investment Gross Plant
Depreciation Expense
Accumulated Depreciation Net Plant Tax Depreciation
Book Deprec Tax Basis
Deferred Tax Exp
Accumulated Deferred Tax Net Investment
Sept 2014 - - - - - - - - - - Oct 2014 - - - - - - - - - - Nov 2014 - - - - - - - - - - Dec 2014 - - - - - - - - - - Jan 2015 - - - - - - - - - - Feb 2015 - - - - - - - - - - Mar 2015 - - - - - - - - - - Apr 2015 - - - - - - - - - -
May 2015 - - - - - - - - - - Jun 2015 - - - - - - - - - - Jul 2015 - - - - - - - - - -
Aug 2015 - - - - - - - - - - Sept 2015 - - - - - - - - - - Oct 2015 - - - - - - - - - - Nov 2015 - - - - - - - - - - Dec 2015 - - - - - - - - - - Jan 2016 - - - - - - - - - - Feb 2016 - - - - - - - - - - Mar 2016 - - - - - - - - - - Apr 2016 - - - - - - - - - -
May 2016 - - - - - - - - - - Jun 2016 - - - - - - - - - - Jul 2016 - - - - - - - - - -
Aug 2016 - - - - - - - - - - Sept 2016 - - - - - - - - - -
Program Assumption
Program Assumption
Refer to WP_SS 2b.xls
"Bk Depr" Worksheets
Prior Month+ Col 3
Col 2- Col 4
Refer to WP_SS 2b.xls
"Sched--IS and BS" Worksheet
Row 116
Refer to WP_SS 2b.xls
"Sched--IS and BS" Worksheet
Row 124
(Col 6 - Col 7) * [Income Tax
Rate]
Prior+ Col 8
Col 5- Col 9
Annual Summary
2013 - - - - - - - - - - 2014 - - - - - - - - - - 2015 - - - - - - - - - - 2016 - - - - - - - - - -
- - - - - - - - - - October 2015 -
Sep 2016
ATTACHMENT B
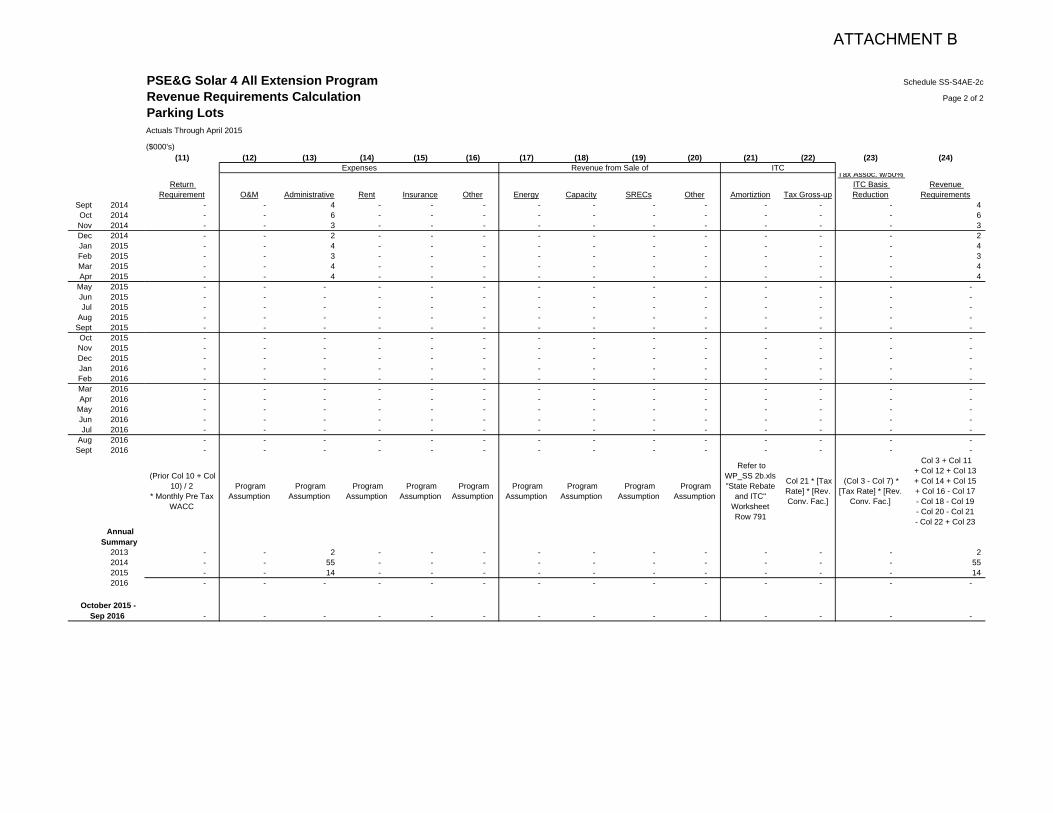
Sept 2014Oct 2014Nov 2014Dec 2014Jan 2015Feb 2015Mar 2015Apr 2015
May 2015Jun 2015Jul 2015
Aug 2015Sept 2015Oct 2015Nov 2015Dec 2015Jan 2016Feb 2016Mar 2016Apr 2016
May 2016Jun 2016Jul 2016
Aug 2016Sept 2016
Annual Summary
2013201420152016
October 2015 - Sep 2016
PSE&G Solar 4 All Extension Program Schedule SS-S4AE-2c
Revenue Requirements Calculation Page 2 of 2
Parking LotsActuals Through April 2015
($000's)(11) (12) (13) (14) (15) (16) (17) (18) (19) (20) (21) (22) (23) (24)
Expenses Revenue from Sale of ITC
Return Requirement O&M Administrative Rent Insurance Other Energy Capacity SRECs Other Amortiztion Tax Gross-up
Tax Assoc. w/50% ITC Basis Reduction
Revenue Requirements
- - 4 - - - - - - - - - - 4 - - 6 - - - - - - - - - - 6 - - 3 - - - - - - - - - - 3 - - 2 - - - - - - - - - - 2 - - 4 - - - - - - - - - - 4 - - 3 - - - - - - - - - - 3 - - 4 - - - - - - - - - - 4 - - 4 - - - - - - - - - - 4 - - - - - - - - - - - - - - - - - - - - - - - - - - - - - - - - - - - - - - - - - - - - - - - - - - - - - - - - - - - - - - - - - - - - - - - - - - - - - - - - - - - - - - - - - - - - - - - - - - - - - - - - - - - - - - - - - - - - - - - - - - - - - - - - - - - - - - - - - - - - - - - - - - - - - - - - - - - - - - - - - - - - - - - - - - - - - - - - - - - - - - - - - - - - - - - - - - - - - - - - - - - - - - - - - - - - - - - - - - - - - - - - - - - - - - - - - - - - - -
(Prior Col 10 + Col 10) / 2
* Monthly Pre Tax WACC
Program Assumption
Program Assumption
Program Assumption
Program Assumption
Program Assumption
Program Assumption
Program Assumption
Program Assumption
Program Assumption
Refer to WP_SS 2b.xls"State Rebate
and ITC" WorksheetRow 791
Col 21 * [Tax Rate] * [Rev. Conv. Fac.]
(Col 3 - Col 7) * [Tax Rate] * [Rev.
Conv. Fac.]
Col 3 + Col 11+ Col 12 + Col 13+ Col 14 + Col 15+ Col 16 - Col 17- Col 18 - Col 19- Col 20 - Col 21- Col 22 + Col 23
- - 2 - - - - - - - - - - 2 - - 55 - - - - - - - - - - 55 - - 14 - - - - - - - - - - 14 - - - - - - - - - - - - - -
- - - - - - - - - - - - - -
ATTACHMENT B
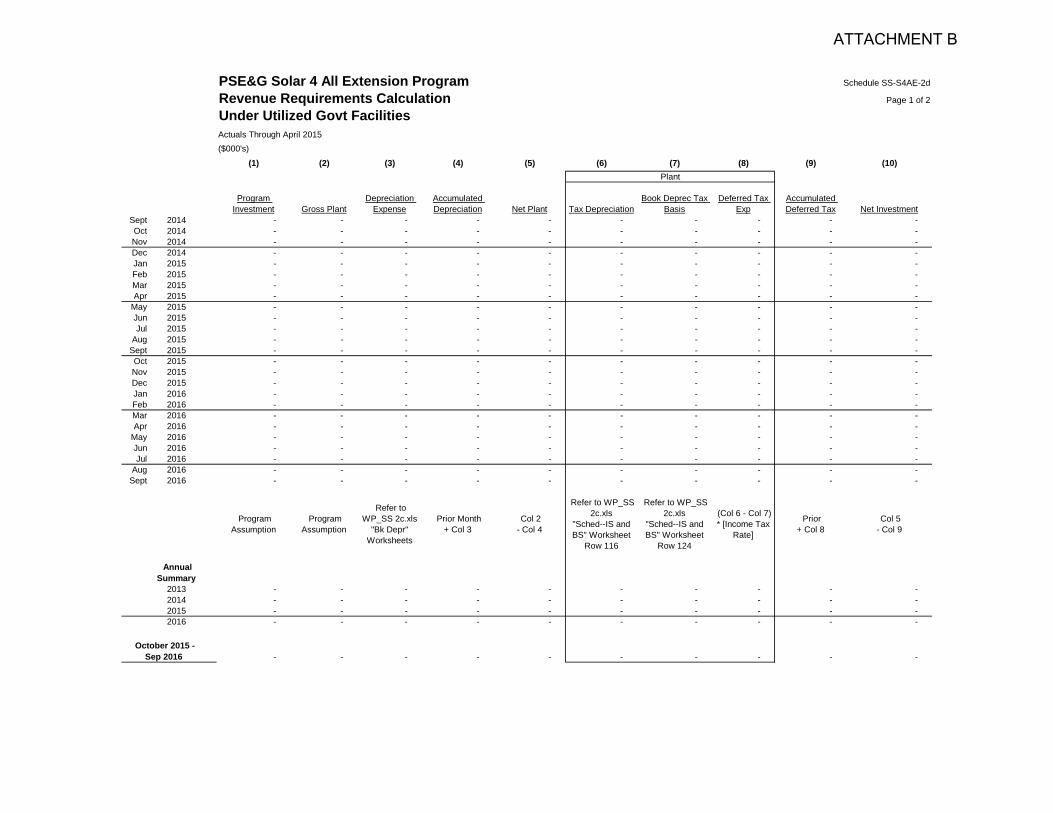
PSE&G Solar 4 All Extension Program Schedule SS-S4AE-2d
Revenue Requirements Calculation Page 1 of 2
Under Utilized Govt FacilitiesActuals Through April 2015($000's)
(1) (2) (3) (4) (5) (6) (7) (8) (9) (10)Plant
Program Investment Gross Plant
Depreciation Expense
Accumulated Depreciation Net Plant Tax Depreciation
Book Deprec Tax Basis
Deferred Tax Exp
Accumulated Deferred Tax Net Investment
Sept 2014 - - - - - - - - - - Oct 2014 - - - - - - - - - - Nov 2014 - - - - - - - - - - Dec 2014 - - - - - - - - - - Jan 2015 - - - - - - - - - - Feb 2015 - - - - - - - - - - Mar 2015 - - - - - - - - - - Apr 2015 - - - - - - - - - -
May 2015 - - - - - - - - - - Jun 2015 - - - - - - - - - - Jul 2015 - - - - - - - - - -
Aug 2015 - - - - - - - - - - Sept 2015 - - - - - - - - - - Oct 2015 - - - - - - - - - - Nov 2015 - - - - - - - - - - Dec 2015 - - - - - - - - - - Jan 2016 - - - - - - - - - - Feb 2016 - - - - - - - - - - Mar 2016 - - - - - - - - - - Apr 2016 - - - - - - - - - -
May 2016 - - - - - - - - - - Jun 2016 - - - - - - - - - - Jul 2016 - - - - - - - - - -
Aug 2016 - - - - - - - - - - Sept 2016 - - - - - - - - - -
Program Assumption
Program Assumption
Refer to WP_SS 2c.xls
"Bk Depr" Worksheets
Prior Month+ Col 3
Col 2- Col 4
Refer to WP_SS 2c.xls
"Sched--IS and BS" Worksheet
Row 116
Refer to WP_SS 2c.xls
"Sched--IS and BS" Worksheet
Row 124
(Col 6 - Col 7) * [Income Tax
Rate]
Prior+ Col 8
Col 5- Col 9
Annual Summary
2013 - - - - - - - - - - 2014 - - - - - - - - - - 2015 - - - - - - - - - - 2016 - - - - - - - - - -
- - - - - - - - - - October 2015 -
Sep 2016
ATTACHMENT B
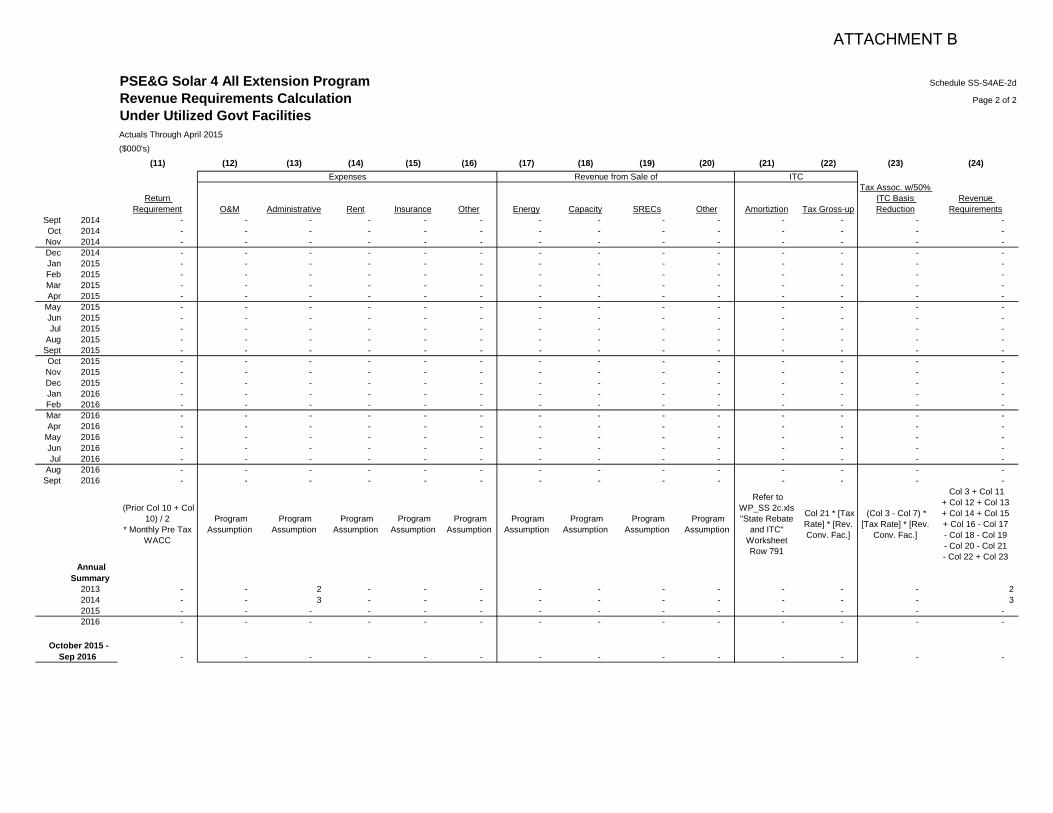
Sept 2014Oct 2014Nov 2014Dec 2014Jan 2015Feb 2015Mar 2015Apr 2015
May 2015Jun 2015Jul 2015
Aug 2015Sept 2015Oct 2015Nov 2015Dec 2015Jan 2016Feb 2016Mar 2016Apr 2016
May 2016Jun 2016Jul 2016
Aug 2016Sept 2016
Annual Summary
2013201420152016
October 2015 - Sep 2016
PSE&G Solar 4 All Extension Program Schedule SS-S4AE-2d
Revenue Requirements Calculation Page 2 of 2
Under Utilized Govt FacilitiesActuals Through April 2015($000's)
(11) (12) (13) (14) (15) (16) (17) (18) (19) (20) (21) (22) (23) (24)Expenses Revenue from Sale of ITC
Return Requirement O&M Administrative Rent Insurance Other Energy Capacity SRECs Other Amortiztion Tax Gross-up
Tax Assoc. w/50% ITC Basis Reduction
Revenue Requirements
- - - - - - - - - - - - - - - - - - - - - - - - - - - - - - - - - - - - - - - - - - - - - - - - - - - - - - - - - - - - - - - - - - - - - - - - - - - - - - - - - - - - - - - - - - - - - - - - - - - - - - - - - - - - - - - - - - - - - - - - - - - - - - - - - - - - - - - - - - - - - - - - - - - - - - - - - - - - - - - - - - - - - - - - - - - - - - - - - - - - - - - - - - - - - - - - - - - - - - - - - - - - - - - - - - - - - - - - - - - - - - - - - - - - - - - - - - - - - - - - - - - - - - - - - - - - - - - - - - - - - - - - - - - - - - - - - - - - - - - - - - - - - - - - - - - - - - - - - - - - - - - - - - - - - - - - - - - - - - - - - - - - - - - - - - - - - - - - - - - - - - - - - - - - - -
(Prior Col 10 + Col 10) / 2
* Monthly Pre Tax WACC
Program Assumption
Program Assumption
Program Assumption
Program Assumption
Program Assumption
Program Assumption
Program Assumption
Program Assumption
Program Assumption
Refer to WP_SS 2c.xls"State Rebate
and ITC" WorksheetRow 791
Col 21 * [Tax Rate] * [Rev. Conv. Fac.]
(Col 3 - Col 7) * [Tax Rate] * [Rev.
Conv. Fac.]
Col 3 + Col 11+ Col 12 + Col 13+ Col 14 + Col 15+ Col 16 - Col 17- Col 18 - Col 19- Col 20 - Col 21- Col 22 + Col 23
- - 2 - - - - - - - - - - 2 - - 3 - - - - - - - - - - 3 - - - - - - - - - - - - - - - - - - - - - - - - - - - -
- - - - - - - - - - - - - -
ATTACHMENT B
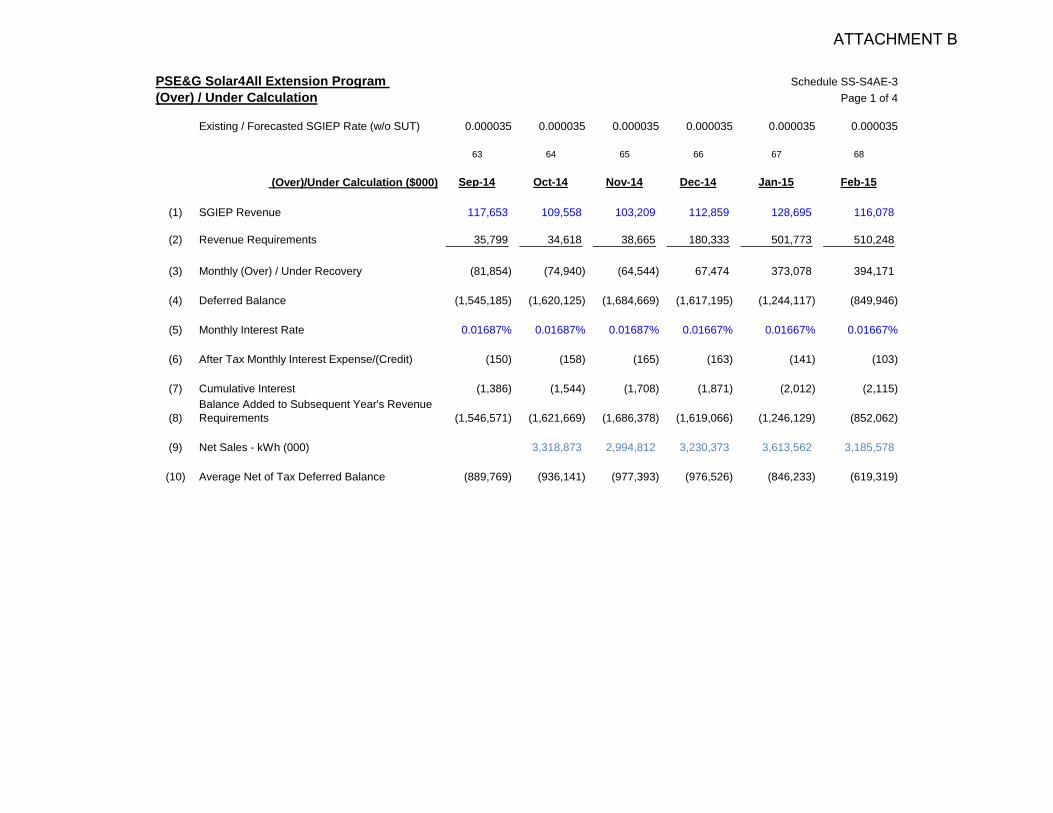
PSE&G Solar4All Extension Program (Over) / Under Calculation
Existing / Forecasted SGIEP Rate (w/o SUT)
(Over)/Under Calculation ($000)
(1) SGIEP Revenue
(2) Revenue Requirements
(3) Monthly (Over) / Under Recovery
(4) Deferred Balance
(5) Monthly Interest Rate
(6) After Tax Monthly Interest Expense/(Credit)
(7) Cumulative Interest
(8)Balance Added to Subsequent Year's Revenue Requirements
(9) Net Sales - kWh (000)
(10) Average Net of Tax Deferred Balance
Schedule SS-S4AE-3Page 1 of 4
0.000035 0.000035 0.000035 0.000035 0.000035 0.000035
63 64 65 66 67 68
Sep-14 Oct-14 Nov-14 Dec-14 Jan-15 Feb-15
117,653 109,558 103,209 112,859 128,695 116,078
35,799 34,618 38,665 180,333 501,773 510,248
(81,854) (74,940) (64,544) 67,474 373,078 394,171
(1,545,185) (1,620,125) (1,684,669) (1,617,195) (1,244,117) (849,946)
0.01687% 0.01687% 0.01687% 0.01667% 0.01667% 0.01667%
(150) (158) (165) (163) (141) (103)
(1,386) (1,544) (1,708) (1,871) (2,012) (2,115)
(1,546,571) (1,621,669) (1,686,378) (1,619,066) (1,246,129) (852,062)
3,318,873 2,994,812 3,230,373 3,613,562 3,185,578
(889,769) (936,141) (977,393) (976,526) (846,233) (619,319)
ATTACHMENT B
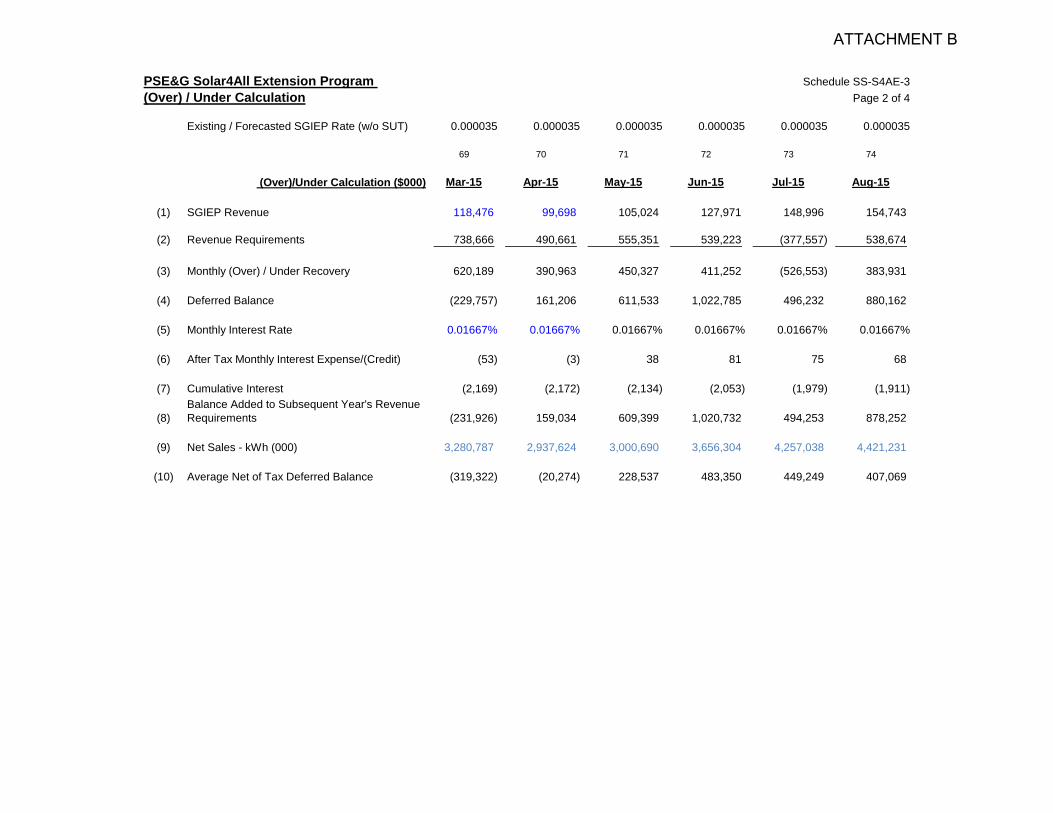
PSE&G Solar4All Extension Program (Over) / Under Calculation
Existing / Forecasted SGIEP Rate (w/o SUT)
(Over)/Under Calculation ($000)
(1) SGIEP Revenue
(2) Revenue Requirements
(3) Monthly (Over) / Under Recovery
(4) Deferred Balance
(5) Monthly Interest Rate
(6) After Tax Monthly Interest Expense/(Credit)
(7) Cumulative Interest
(8)Balance Added to Subsequent Year's Revenue Requirements
(9) Net Sales - kWh (000)
(10) Average Net of Tax Deferred Balance
Schedule SS-S4AE-3Page 2 of 4
0.000035 0.000035 0.000035 0.000035 0.000035 0.000035
69 70 71 72 73 74
Mar-15 Apr-15 May-15 Jun-15 Jul-15 Aug-15
118,476 99,698 105,024 127,971 148,996 154,743
738,666 490,661 555,351 539,223 (377,557) 538,674
620,189 390,963 450,327 411,252 (526,553) 383,931
(229,757) 161,206 611,533 1,022,785 496,232 880,162
0.01667% 0.01667% 0.01667% 0.01667% 0.01667% 0.01667%
(53) (3) 38 81 75 68
(2,169) (2,172) (2,134) (2,053) (1,979) (1,911)
(231,926) 159,034 609,399 1,020,732 494,253 878,252
3,280,787 2,937,624 3,000,690 3,656,304 4,257,038 4,421,231
(319,322) (20,274) 228,537 483,350 449,249 407,069
ATTACHMENT B
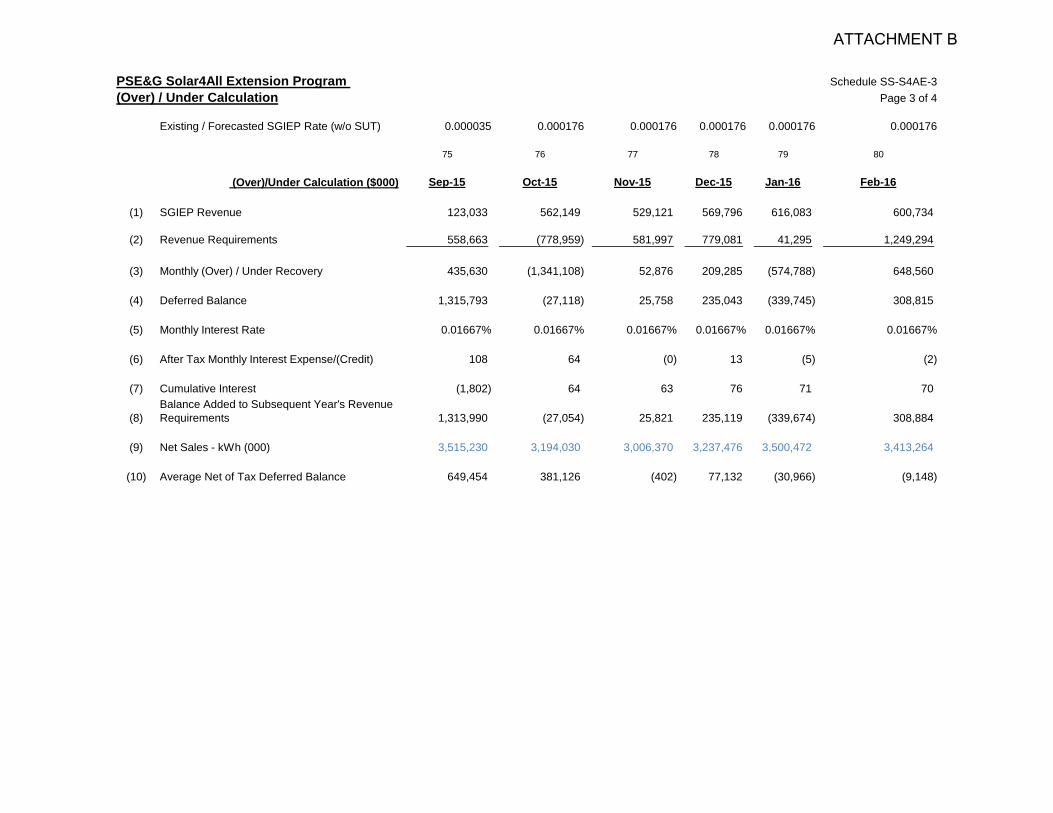
PSE&G Solar4All Extension Program (Over) / Under Calculation
Existing / Forecasted SGIEP Rate (w/o SUT)
(Over)/Under Calculation ($000)
(1) SGIEP Revenue
(2) Revenue Requirements
(3) Monthly (Over) / Under Recovery
(4) Deferred Balance
(5) Monthly Interest Rate
(6) After Tax Monthly Interest Expense/(Credit)
(7) Cumulative Interest
(8)Balance Added to Subsequent Year's Revenue Requirements
(9) Net Sales - kWh (000)
(10) Average Net of Tax Deferred Balance
Schedule SS-S4AE-3Page 3 of 4
0.000035 0.000176 0.000176 0.000176 0.000176 0.000176
75 76 77 78 79 80
Sep-15 Oct-15 Nov-15 Dec-15 Jan-16 Feb-16
123,033 562,149 529,121 569,796 616,083 600,734
558,663 (778,959) 581,997 779,081 41,295 1,249,294
435,630 (1,341,108) 52,876 209,285 (574,788) 648,560
1,315,793 (27,118) 25,758 235,043 (339,745) 308,815
0.01667% 0.01667% 0.01667% 0.01667% 0.01667% 0.01667%
108 64 (0) 13 (5) (2)
(1,802) 64 63 76 71 70
1,313,990 (27,054) 25,821 235,119 (339,674) 308,884
3,515,230 3,194,030 3,006,370 3,237,476 3,500,472 3,413,264
649,454 381,126 (402) 77,132 (30,966) (9,148)
ATTACHMENT B
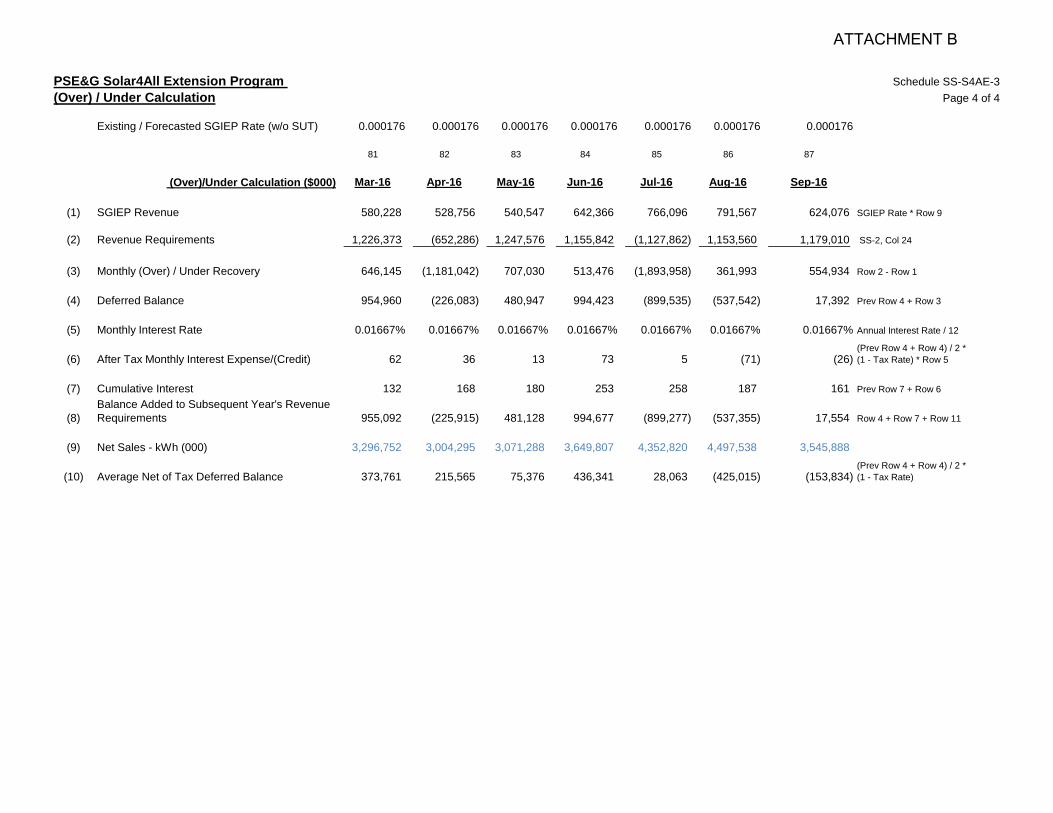
PSE&G Solar4All Extension Program (Over) / Under Calculation
Existing / Forecasted SGIEP Rate (w/o SUT)
(Over)/Under Calculation ($000)
(1) SGIEP Revenue
(2) Revenue Requirements
(3) Monthly (Over) / Under Recovery
(4) Deferred Balance
(5) Monthly Interest Rate
(6) After Tax Monthly Interest Expense/(Credit)
(7) Cumulative Interest
(8)Balance Added to Subsequent Year's Revenue Requirements
(9) Net Sales - kWh (000)
(10) Average Net of Tax Deferred Balance
Schedule SS-S4AE-3Page 4 of 4
0.000176 0.000176 0.000176 0.000176 0.000176 0.000176 0.000176
81 82 83 84 85 86 87
Mar-16 Apr-16 May-16 Jun-16 Jul-16 Aug-16 Sep-16
580,228 528,756 540,547 642,366 766,096 791,567 624,076 SGIEP Rate * Row 9
1,226,373 (652,286) 1,247,576 1,155,842 (1,127,862) 1,153,560 1,179,010 SS-2, Col 24
646,145 (1,181,042) 707,030 513,476 (1,893,958) 361,993 554,934 Row 2 - Row 1
954,960 (226,083) 480,947 994,423 (899,535) (537,542) 17,392 Prev Row 4 + Row 3
0.01667% 0.01667% 0.01667% 0.01667% 0.01667% 0.01667% 0.01667% Annual Interest Rate / 12
62 36 13 73 5 (71) (26) (Prev Row 4 + Row 4) / 2 *(1 - Tax Rate) * Row 5
132 168 180 253 258 187 161 Prev Row 7 + Row 6
955,092 (225,915) 481,128 994,677 (899,277) (537,355) 17,554 Row 4 + Row 7 + Row 11
3,296,752 3,004,295 3,071,288 3,649,807 4,352,820 4,497,538 3,545,888
373,761 215,565 75,376 436,341 28,063 (425,015) (153,834) (Prev Row 4 + Row 4) / 2 *(1 - Tax Rate)
ATTACHMENT B
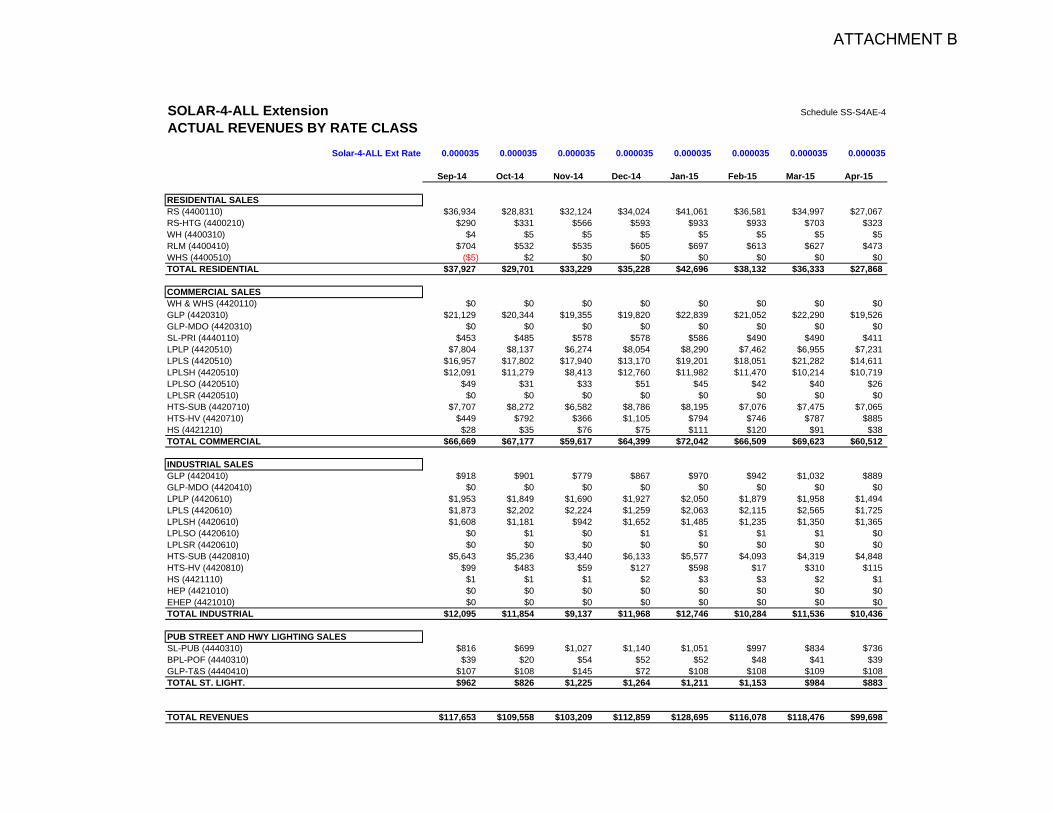
SOLAR-4-ALL Extension Schedule SS-S4AE-4
ACTUAL REVENUES BY RATE CLASSSolar-4-ALL Ext Rate 0.000035 0.000035 0.000035 0.000035 0.000035 0.000035 0.000035 0.000035
Sep-14 Oct-14 Nov-14 Dec-14 Jan-15 Feb-15 Mar-15 Apr-15
RESIDENTIAL SALESRS (4400110) $36,934 $28,831 $32,124 $34,024 $41,061 $36,581 $34,997 $27,067RS-HTG (4400210) $290 $331 $566 $593 $933 $933 $703 $323WH (4400310) $4 $5 $5 $5 $5 $5 $5 $5RLM (4400410) $704 $532 $535 $605 $697 $613 $627 $473WHS (4400510) ($5) $2 $0 $0 $0 $0 $0 $0TOTAL RESIDENTIAL $37,927 $29,701 $33,229 $35,228 $42,696 $38,132 $36,333 $27,868
COMMERCIAL SALESWH & WHS (4420110) $0 $0 $0 $0 $0 $0 $0 $0GLP (4420310) $21,129 $20,344 $19,355 $19,820 $22,839 $21,052 $22,290 $19,526GLP-MDO (4420310) $0 $0 $0 $0 $0 $0 $0 $0SL-PRI (4440110) $453 $485 $578 $578 $586 $490 $490 $411LPLP (4420510) $7,804 $8,137 $6,274 $8,054 $8,290 $7,462 $6,955 $7,231LPLS (4420510) $16,957 $17,802 $17,940 $13,170 $19,201 $18,051 $21,282 $14,611LPLSH (4420510) $12,091 $11,279 $8,413 $12,760 $11,982 $11,470 $10,214 $10,719LPLSO (4420510) $49 $31 $33 $51 $45 $42 $40 $26LPLSR (4420510) $0 $0 $0 $0 $0 $0 $0 $0HTS-SUB (4420710) $7,707 $8,272 $6,582 $8,786 $8,195 $7,076 $7,475 $7,065HTS-HV (4420710) $449 $792 $366 $1,105 $794 $746 $787 $885HS (4421210) $28 $35 $76 $75 $111 $120 $91 $38TOTAL COMMERCIAL $66,669 $67,177 $59,617 $64,399 $72,042 $66,509 $69,623 $60,512
INDUSTRIAL SALESGLP (4420410) $918 $901 $779 $867 $970 $942 $1,032 $889GLP-MDO (4420410) $0 $0 $0 $0 $0 $0 $0 $0LPLP (4420610) $1,953 $1,849 $1,690 $1,927 $2,050 $1,879 $1,958 $1,494LPLS (4420610) $1,873 $2,202 $2,224 $1,259 $2,063 $2,115 $2,565 $1,725LPLSH (4420610) $1,608 $1,181 $942 $1,652 $1,485 $1,235 $1,350 $1,365LPLSO (4420610) $0 $1 $0 $1 $1 $1 $1 $0LPLSR (4420610) $0 $0 $0 $0 $0 $0 $0 $0HTS-SUB (4420810) $5,643 $5,236 $3,440 $6,133 $5,577 $4,093 $4,319 $4,848HTS-HV (4420810) $99 $483 $59 $127 $598 $17 $310 $115HS (4421110) $1 $1 $1 $2 $3 $3 $2 $1HEP (4421010) $0 $0 $0 $0 $0 $0 $0 $0EHEP (4421010) $0 $0 $0 $0 $0 $0 $0 $0TOTAL INDUSTRIAL $12,095 $11,854 $9,137 $11,968 $12,746 $10,284 $11,536 $10,436
PUB STREET AND HWY LIGHTING SALESSL-PUB (4440310) $816 $699 $1,027 $1,140 $1,051 $997 $834 $736BPL-POF (4440310) $39 $20 $54 $52 $52 $48 $41 $39GLP-T&S (4440410) $107 $108 $145 $72 $108 $108 $109 $108TOTAL ST. LIGHT. $962 $826 $1,225 $1,264 $1,211 $1,153 $984 $883
TOTAL REVENUES $117,653 $109,558 $103,209 $112,859 $128,695 $116,078 $118,476 $99,698
ATTACHMENT B
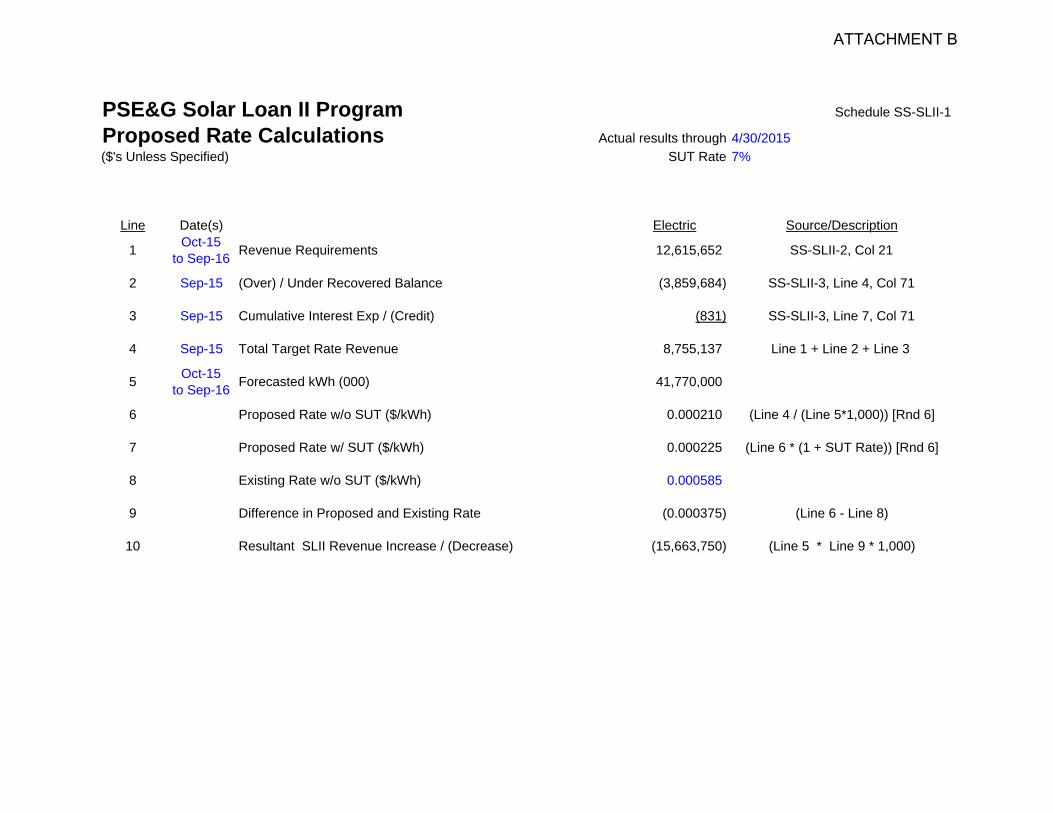
PSE&G Solar Loan II Program Schedule SS-SLII-1
Proposed Rate Calculations Actual results through 4/30/2015($'s Unless Specified) SUT Rate 7%
Line Date(s) Electric Source/Description
1 Oct-15to Sep-16 Revenue Requirements 12,615,652 SS-SLII-2, Col 21
2 Sep-15 (Over) / Under Recovered Balance (3,859,684) SS-SLII-3, Line 4, Col 71
3 Sep-15 Cumulative Interest Exp / (Credit) (831) SS-SLII-3, Line 7, Col 71
4 Sep-15 Total Target Rate Revenue 8,755,137 Line 1 + Line 2 + Line 3
5 Oct-15to Sep-16 Forecasted kWh (000) 41,770,000
6 Proposed Rate w/o SUT ($/kWh) 0.000210 (Line 4 / (Line 5*1,000)) [Rnd 6]
7 Proposed Rate w/ SUT ($/kWh) 0.000225 (Line 6 * (1 + SUT Rate)) [Rnd 6]
8 Existing Rate w/o SUT ($/kWh) 0.000585
9 Difference in Proposed and Existing Rate (0.000375) (Line 6 - Line 8)
10 Resultant SLII Revenue Increase / (Decrease) (15,663,750) (Line 5 * Line 9 * 1,000)
ATTACHMENT B
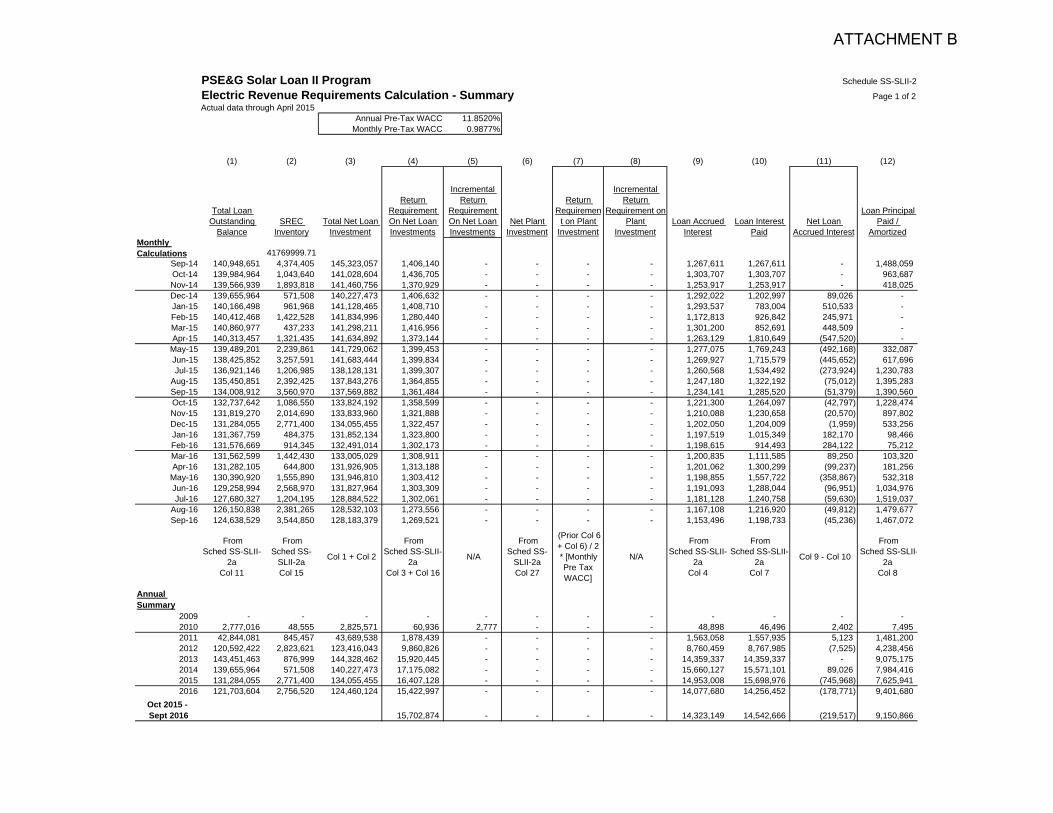
PSE&G Solar Loan II Program Schedule SS-SLII-2
Electric Revenue Requirements Calculation - Summary Page 1 of 2Actual data through April 2015
Annual Pre-Tax WACC 11.8520%Monthly Pre-Tax WACC 0.9877%
(1) (2) (3) (4) (5) (6) (7) (8) (9) (10) (11) (12)
Total Loan Outstanding
BalanceSREC
InventoryTotal Net Loan
Investment
Return Requirement On Net Loan Investments
Incremental Return
Requirement On Net Loan Investments
Net Plant Investment
Return Requiremen
t on Plant Investment
Incremental Return
Requirement on Plant
InvestmentLoan Accrued
InterestLoan Interest
PaidNet Loan
Accrued Interest
Loan Principal Paid /
AmortizedMonthly Calculations 41769999.71
Sep-14 140,948,651 4,374,405 145,323,057 1,406,140 - - - - 1,267,611 1,267,611 - 1,488,059 Oct-14 139,984,964 1,043,640 141,028,604 1,436,705 - - - - 1,303,707 1,303,707 - 963,687 Nov-14 139,566,939 1,893,818 141,460,756 1,370,929 - - - - 1,253,917 1,253,917 - 418,025 Dec-14 139,655,964 571,508 140,227,473 1,406,632 - - - - 1,292,022 1,202,997 89,026 - Jan-15 140,166,498 961,968 141,128,465 1,408,710 - - - - 1,293,537 783,004 510,533 - Feb-15 140,412,468 1,422,528 141,834,996 1,280,440 - - - - 1,172,813 926,842 245,971 - Mar-15 140,860,977 437,233 141,298,211 1,416,956 - - - - 1,301,200 852,691 448,509 - Apr-15 140,313,457 1,321,435 141,634,892 1,373,144 - - - - 1,263,129 1,810,649 (547,520) -
May-15 139,489,201 2,239,861 141,729,062 1,399,453 - - - - 1,277,075 1,769,243 (492,168) 332,087 Jun-15 138,425,852 3,257,591 141,683,444 1,399,834 - - - - 1,269,927 1,715,579 (445,652) 617,696 Jul-15 136,921,146 1,206,985 138,128,131 1,399,307 - - - - 1,260,568 1,534,492 (273,924) 1,230,783
Aug-15 135,450,851 2,392,425 137,843,276 1,364,855 - - - - 1,247,180 1,322,192 (75,012) 1,395,283 Sep-15 134,008,912 3,560,970 137,569,882 1,361,484 - - - - 1,234,141 1,285,520 (51,379) 1,390,560 Oct-15 132,737,642 1,086,550 133,824,192 1,358,599 - - - - 1,221,300 1,264,097 (42,797) 1,228,474 Nov-15 131,819,270 2,014,690 133,833,960 1,321,888 - - - - 1,210,088 1,230,658 (20,570) 897,802 Dec-15 131,284,055 2,771,400 134,055,455 1,322,457 - - - - 1,202,050 1,204,009 (1,959) 533,256 Jan-16 131,367,759 484,375 131,852,134 1,323,800 - - - - 1,197,519 1,015,349 182,170 98,466 Feb-16 131,576,669 914,345 132,491,014 1,302,173 - - - - 1,198,615 914,493 284,122 75,212 Mar-16 131,562,599 1,442,430 133,005,029 1,308,911 - - - - 1,200,835 1,111,585 89,250 103,320 Apr-16 131,282,105 644,800 131,926,905 1,313,188 - - - - 1,201,062 1,300,299 (99,237) 181,256
May-16 130,390,920 1,555,890 131,946,810 1,303,412 - - - - 1,198,855 1,557,722 (358,867) 532,318 Jun-16 129,258,994 2,568,970 131,827,964 1,303,309 - - - - 1,191,093 1,288,044 (96,951) 1,034,976 Jul-16 127,680,327 1,204,195 128,884,522 1,302,061 - - - - 1,181,128 1,240,758 (59,630) 1,519,037
Aug-16 126,150,838 2,381,265 128,532,103 1,273,556 - - - - 1,167,108 1,216,920 (49,812) 1,479,677 Sep-16 124,638,529 3,544,850 128,183,379 1,269,521 - - - - 1,153,496 1,198,733 (45,236) 1,467,072
FromSched SS-SLII-
2aCol 11
FromSched SS-
SLII-2aCol 15
Col 1 + Col 2
FromSched SS-SLII-
2aCol 3 + Col 16
N/A
FromSched SS-
SLII-2aCol 27
(Prior Col 6 + Col 6) / 2* [Monthly Pre Tax WACC]
N/A
FromSched SS-SLII-
2aCol 4
FromSched SS-SLII-
2aCol 7
Col 9 - Col 10
FromSched SS-SLII-
2aCol 8
Annual Summary
2009 - - - - - - - - - - - - 2010 2,777,016 48,555 2,825,571 60,936 2,777 - - - 48,898 46,496 2,402 7,495 2011 42,844,081 845,457 43,689,538 1,878,439 - - - - 1,563,058 1,557,935 5,123 1,481,200 2012 120,592,422 2,823,621 123,416,043 9,860,826 - - - - 8,760,459 8,767,985 (7,525) 4,238,456 2013 143,451,463 876,999 144,328,462 15,920,445 - - - - 14,359,337 14,359,337 - 9,075,175 2014 139,655,964 571,508 140,227,473 17,175,082 - - - - 15,660,127 15,571,101 89,026 7,984,416 2015 131,284,055 2,771,400 134,055,455 16,407,128 - - - - 14,953,008 15,698,976 (745,968) 7,625,941 2016 121,703,604 2,756,520 124,460,124 15,422,997 - - - - 14,077,680 14,256,452 (178,771) 9,401,680
Oct 2015 - Sept 2016 15,702,874 - - - - 14,323,149 14,542,666 (219,517) 9,150,866
ATTACHMENT B
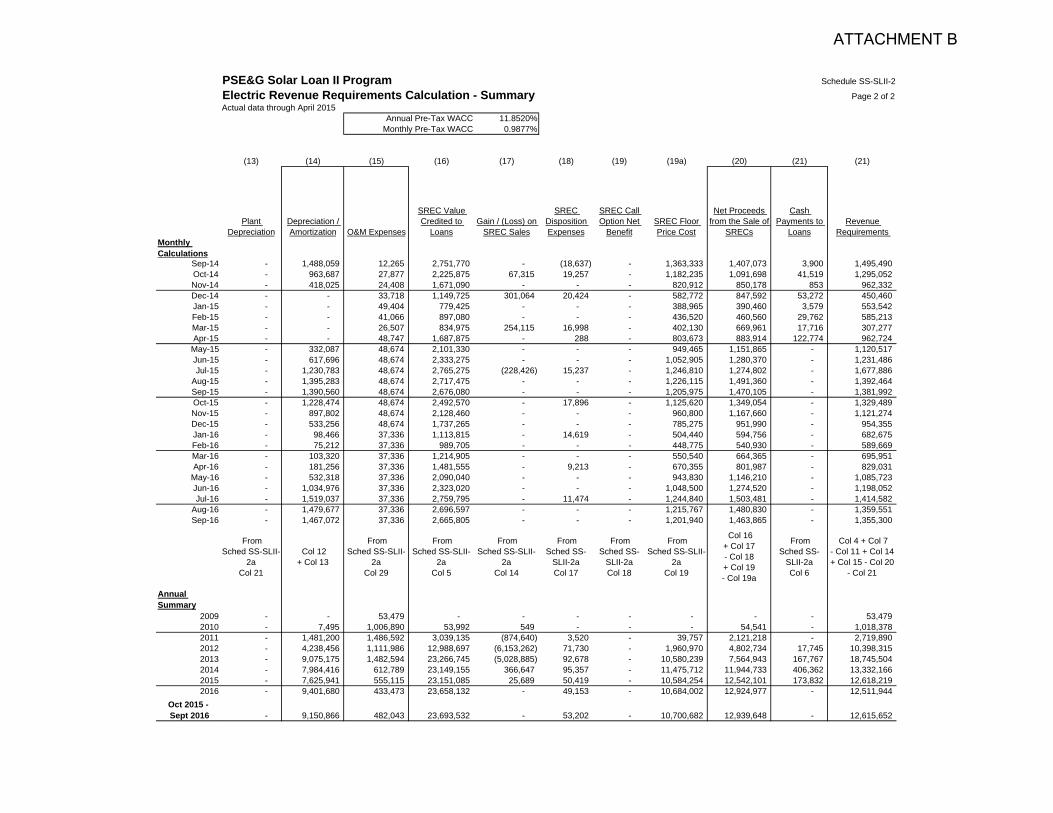
Monthly Calculations
Sep-14Oct-14Nov-14Dec-14Jan-15Feb-15Mar-15Apr-15
May-15Jun-15Jul-15
Aug-15Sep-15Oct-15Nov-15Dec-15Jan-16Feb-16Mar-16Apr-16
May-16Jun-16Jul-16
Aug-16Sep-16
Annual Summary
20092010201120122013201420152016
Oct 2015 - Sept 2016
PSE&G Solar Loan II Program Schedule SS-SLII-2
Electric Revenue Requirements Calculation - Summary Page 2 of 2Actual data through April 2015
Annual Pre-Tax WACC 11.8520%Monthly Pre-Tax WACC 0.9877%
Residential Interest Rate 0.00% 0.000%
(13) (14) (15) (16) (17) (18) (19) (19a) (20) (21) (21)
Plant Depreciation
Depreciation / Amortization O&M Expenses
SREC Value Credited to
LoansGain / (Loss) on
SREC Sales
SREC Disposition Expenses
SREC Call Option Net
BenefitSREC Floor Price Cost
Net Proceeds from the Sale of
SRECs
Cash Payments to
LoansRevenue
Requirements
- 1,488,059 12,265 2,751,770 - (18,637) - 1,363,333 1,407,073 3,900 1,495,490 - 963,687 27,877 2,225,875 67,315 19,257 - 1,182,235 1,091,698 41,519 1,295,052 - 418,025 24,408 1,671,090 - - - 820,912 850,178 853 962,332 - - 33,718 1,149,725 301,064 20,424 - 582,772 847,592 53,272 450,460 - - 49,404 779,425 - - - 388,965 390,460 3,579 553,542 - - 41,066 897,080 - - - 436,520 460,560 29,762 585,213 - - 26,507 834,975 254,115 16,998 - 402,130 669,961 17,716 307,277 - - 48,747 1,687,875 - 288 - 803,673 883,914 122,774 962,724 - 332,087 48,674 2,101,330 - - - 949,465 1,151,865 - 1,120,517 - 617,696 48,674 2,333,275 - - - 1,052,905 1,280,370 - 1,231,486 - 1,230,783 48,674 2,765,275 (228,426) 15,237 - 1,246,810 1,274,802 - 1,677,886 - 1,395,283 48,674 2,717,475 - - - 1,226,115 1,491,360 - 1,392,464 - 1,390,560 48,674 2,676,080 - - - 1,205,975 1,470,105 - 1,381,992 - 1,228,474 48,674 2,492,570 - 17,896 - 1,125,620 1,349,054 - 1,329,489 - 897,802 48,674 2,128,460 - - - 960,800 1,167,660 - 1,121,274 - 533,256 48,674 1,737,265 - - - 785,275 951,990 - 954,355 - 98,466 37,336 1,113,815 - 14,619 - 504,440 594,756 - 682,675 - 75,212 37,336 989,705 - - - 448,775 540,930 - 589,669 - 103,320 37,336 1,214,905 - - - 550,540 664,365 - 695,951 - 181,256 37,336 1,481,555 - 9,213 - 670,355 801,987 - 829,031 - 532,318 37,336 2,090,040 - - - 943,830 1,146,210 - 1,085,723 - 1,034,976 37,336 2,323,020 - - - 1,048,500 1,274,520 - 1,198,052 - 1,519,037 37,336 2,759,795 - 11,474 - 1,244,840 1,503,481 - 1,414,582 - 1,479,677 37,336 2,696,597 - - - 1,215,767 1,480,830 - 1,359,551 - 1,467,072 37,336 2,665,805 - - - 1,201,940 1,463,865 - 1,355,300
FromSched SS-SLII-
2aCol 21
Col 12+ Col 13
FromSched SS-SLII-
2aCol 29
FromSched SS-SLII-
2aCol 5
FromSched SS-SLII-
2aCol 14
FromSched SS-
SLII-2aCol 17
FromSched SS-
SLII-2aCol 18
FromSched SS-SLII-
2aCol 19
Col 16+ Col 17- Col 18+ Col 19- Col 19a
FromSched SS-
SLII-2aCol 6
Col 4 + Col 7- Col 11 + Col 14+ Col 15 - Col 20
- Col 21
- - 53,479 - - - - - - - 53,479 - 7,495 1,006,890 53,992 549 - - - 54,541 - 1,018,378 - 1,481,200 1,486,592 3,039,135 (874,640) 3,520 - 39,757 2,121,218 - 2,719,890 - 4,238,456 1,111,986 12,988,697 (6,153,262) 71,730 - 1,960,970 4,802,734 17,745 10,398,315 - 9,075,175 1,482,594 23,266,745 (5,028,885) 92,678 - 10,580,239 7,564,943 167,767 18,745,504 - 7,984,416 612,789 23,149,155 366,647 95,357 - 11,475,712 11,944,733 406,362 13,332,166 - 7,625,941 555,115 23,151,085 25,689 50,419 - 10,584,254 12,542,101 173,832 12,618,219 - 9,401,680 433,473 23,658,132 - 49,153 - 10,684,002 12,924,977 - 12,511,944
- 9,150,866 482,043 23,693,532 - 53,202 - 10,700,682 12,939,648 - 12,615,652
ATTACHMENT B
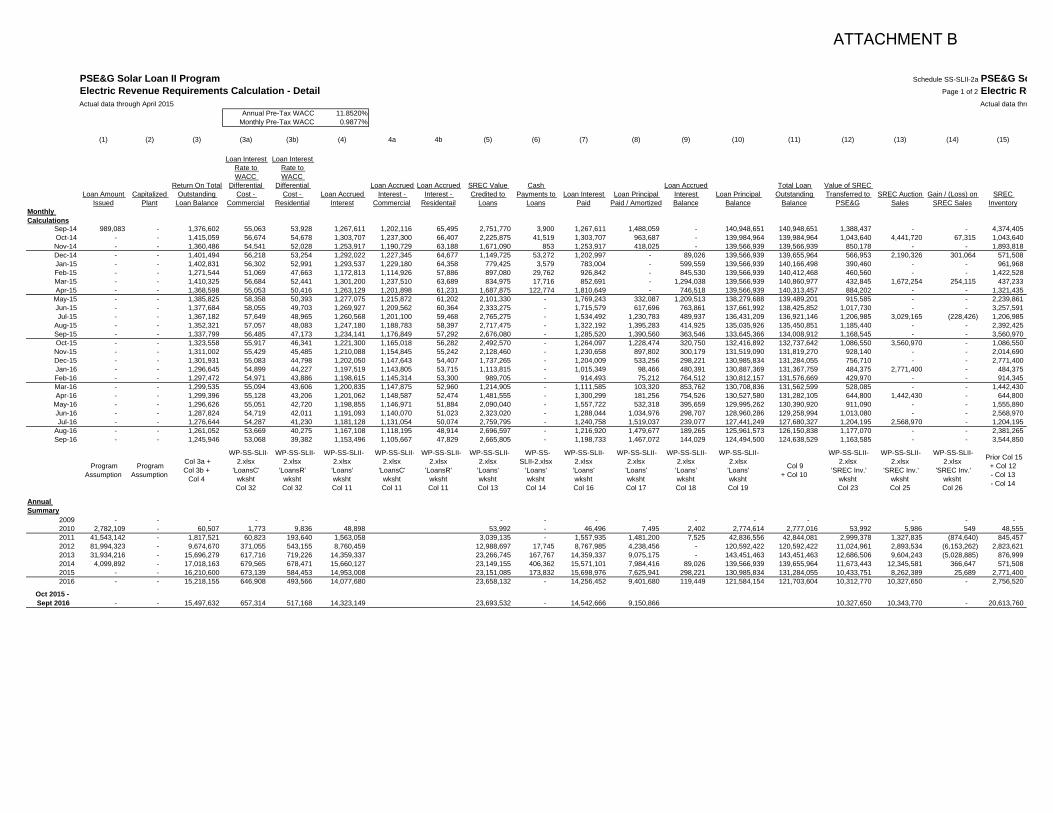
PSE&G Solar Loan II Program Schedule SS-SLII-2a PSE&G SoElectric Revenue Requirements Calculation - Detail Page 1 of 2 Electric ReActual data through April 2015 Actual data thro
Annual Pre-Tax WACC 11.8520%Monthly Pre-Tax WACC 0.9877%
(1) (2) (3) (3a) (3b) (4) 4a 4b (5) (6) (7) (8) (9) (10) (11) (12) (13) (14) (15)
Loan Amount Issued
Capitalized Plant
Return On Total Outstanding
Loan Balance
Loan Interest Rate to WACC
Differential Cost -
Commercial
Loan Interest Rate to WACC
Differential Cost -
ResidentialLoan Accrued
Interest
Loan Accrued Interest -
Commercial
Loan Accrued Interest -
Residentail
SREC Value Credited to
Loans
Cash Payments to
LoansLoan Interest
PaidLoan Principal
Paid / Amortized
Loan Accrued Interest Balance
Loan Principal Balance
Total Loan Outstanding
Balance
Value of SREC Transferred to
PSE&GSREC Auction
SalesGain / (Loss) on
SREC SalesSREC
InventoryMonthly Calculations
Sep-14 989,083 - 1,376,602 55,063 53,928 1,267,611 1,202,116 65,495 2,751,770 3,900 1,267,611 1,488,059 - 140,948,651 140,948,651 1,388,437 - - 4,374,405 Oct-14 - - 1,415,059 56,674 54,678 1,303,707 1,237,300 66,407 2,225,875 41,519 1,303,707 963,687 - 139,984,964 139,984,964 1,043,640 4,441,720 67,315 1,043,640 Nov-14 - - 1,360,486 54,541 52,028 1,253,917 1,190,729 63,188 1,671,090 853 1,253,917 418,025 - 139,566,939 139,566,939 850,178 - - 1,893,818 Dec-14 - - 1,401,494 56,218 53,254 1,292,022 1,227,345 64,677 1,149,725 53,272 1,202,997 - 89,026 139,566,939 139,655,964 566,953 2,190,326 301,064 571,508 Jan-15 - - 1,402,831 56,302 52,991 1,293,537 1,229,180 64,358 779,425 3,579 783,004 - 599,559 139,566,939 140,166,498 390,460 - - 961,968 Feb-15 - - 1,271,544 51,069 47,663 1,172,813 1,114,926 57,886 897,080 29,762 926,842 - 845,530 139,566,939 140,412,468 460,560 - - 1,422,528 Mar-15 - - 1,410,325 56,684 52,441 1,301,200 1,237,510 63,689 834,975 17,716 852,691 - 1,294,038 139,566,939 140,860,977 432,845 1,672,254 254,115 437,233 Apr-15 - - 1,368,598 55,053 50,416 1,263,129 1,201,898 61,231 1,687,875 122,774 1,810,649 - 746,518 139,566,939 140,313,457 884,202 - - 1,321,435
May-15 - - 1,385,825 58,358 50,393 1,277,075 1,215,872 61,202 2,101,330 - 1,769,243 332,087 1,209,513 138,279,688 139,489,201 915,585 - - 2,239,861 Jun-15 - - 1,377,684 58,055 49,703 1,269,927 1,209,562 60,364 2,333,275 - 1,715,579 617,696 763,861 137,661,992 138,425,852 1,017,730 - - 3,257,591 Jul-15 - - 1,367,182 57,649 48,965 1,260,568 1,201,100 59,468 2,765,275 - 1,534,492 1,230,783 489,937 136,431,209 136,921,146 1,206,985 3,029,165 (228,426) 1,206,985
Aug-15 - - 1,352,321 57,057 48,083 1,247,180 1,188,783 58,397 2,717,475 - 1,322,192 1,395,283 414,925 135,035,926 135,450,851 1,185,440 - - 2,392,425 Sep-15 - - 1,337,799 56,485 47,173 1,234,141 1,176,849 57,292 2,676,080 - 1,285,520 1,390,560 363,546 133,645,366 134,008,912 1,168,545 - - 3,560,970 Oct-15 - - 1,323,558 55,917 46,341 1,221,300 1,165,018 56,282 2,492,570 - 1,264,097 1,228,474 320,750 132,416,892 132,737,642 1,086,550 3,560,970 - 1,086,550 Nov-15 - - 1,311,002 55,429 45,485 1,210,088 1,154,845 55,242 2,128,460 - 1,230,658 897,802 300,179 131,519,090 131,819,270 928,140 - - 2,014,690 Dec-15 - - 1,301,931 55,083 44,798 1,202,050 1,147,643 54,407 1,737,265 - 1,204,009 533,256 298,221 130,985,834 131,284,055 756,710 - - 2,771,400 Jan-16 - - 1,296,645 54,899 44,227 1,197,519 1,143,805 53,715 1,113,815 - 1,015,349 98,466 480,391 130,887,369 131,367,759 484,375 2,771,400 - 484,375 Feb-16 - - 1,297,472 54,971 43,886 1,198,615 1,145,314 53,300 989,705 - 914,493 75,212 764,512 130,812,157 131,576,669 429,970 - - 914,345 Mar-16 - - 1,299,535 55,094 43,606 1,200,835 1,147,875 52,960 1,214,905 - 1,111,585 103,320 853,762 130,708,836 131,562,599 528,085 - - 1,442,430 Apr-16 - - 1,299,396 55,128 43,206 1,201,062 1,148,587 52,474 1,481,555 - 1,300,299 181,256 754,526 130,527,580 131,282,105 644,800 1,442,430 - 644,800
May-16 - - 1,296,626 55,051 42,720 1,198,855 1,146,971 51,884 2,090,040 - 1,557,722 532,318 395,659 129,995,262 130,390,920 911,090 - - 1,555,890 Jun-16 - - 1,287,824 54,719 42,011 1,191,093 1,140,070 51,023 2,323,020 - 1,288,044 1,034,976 298,707 128,960,286 129,258,994 1,013,080 - - 2,568,970 Jul-16 - - 1,276,644 54,287 41,230 1,181,128 1,131,054 50,074 2,759,795 - 1,240,758 1,519,037 239,077 127,441,249 127,680,327 1,204,195 2,568,970 - 1,204,195
Aug-16 - - 1,261,052 53,669 40,275 1,167,108 1,118,195 48,914 2,696,597 - 1,216,920 1,479,677 189,265 125,961,573 126,150,838 1,177,070 - - 2,381,265 Sep-16 - - 1,245,946 53,068 39,382 1,153,496 1,105,667 47,829 2,665,805 - 1,198,733 1,467,072 144,029 124,494,500 124,638,529 1,163,585 - - 3,544,850
Program Assumption
Program Assumption
Col 3a +Col 3b +
Col 4
WP-SS-SLII-2.xlsx
'LoansC' wkshtCol 32
WP-SS-SLII-2.xlsx
'LoansR' wkshtCol 32
WP-SS-SLII-2.xlsx'Loans'wkshtCol 11
WP-SS-SLII-2.xlsx
'LoansC' wkshtCol 11
WP-SS-SLII-2.xlsx
'LoansR' wkshtCol 11
WP-SS-SLII-2.xlsx'Loans'wkshtCol 13
WP-SS-SLII-2.xlsx
'Loans'wkshtCol 14
WP-SS-SLII-2.xlsx'Loans'wkshtCol 16
WP-SS-SLII-2.xlsx'Loans'wkshtCol 17
WP-SS-SLII-2.xlsx'Loans'wkshtCol 18
WP-SS-SLII-2.xlsx'Loans'wkshtCol 19
Col 9+ Col 10
WP-SS-SLII-2.xlsx
'SREC Inv.'wkshtCol 23
WP-SS-SLII-2.xlsx
'SREC Inv.'wkshtCol 25
WP-SS-SLII-2.xlsx
'SREC Inv.'wkshtCol 26
Prior Col 15+ Col 12- Col 13- Col 14
Annual Summary
2009 - - - - - - - - - - - - - - - - - 2010 2,782,109 - 60,507 1,773 9,836 48,898 53,992 - 46,496 7,495 2,402 2,774,614 2,777,016 53,992 5,986 549 48,555 2011 41,543,142 - 1,817,521 60,823 193,640 1,563,058 3,039,135 - 1,557,935 1,481,200 7,525 42,836,556 42,844,081 2,999,378 1,327,835 (874,640) 845,457 2012 81,994,323 - 9,674,670 371,055 543,155 8,760,459 12,988,697 17,745 8,767,985 4,238,456 - 120,592,422 120,592,422 11,024,961 2,893,534 (6,153,262) 2,823,621 2013 31,934,216 - 15,696,279 617,716 719,226 14,359,337 23,266,745 167,767 14,359,337 9,075,175 - 143,451,463 143,451,463 12,686,506 9,604,243 (5,028,885) 876,999 2014 4,099,892 - 17,018,163 679,565 678,471 15,660,127 23,149,155 406,362 15,571,101 7,984,416 89,026 139,566,939 139,655,964 11,673,443 12,345,581 366,647 571,508 2015 - - 16,210,600 673,139 584,453 14,953,008 23,151,085 173,832 15,698,976 7,625,941 298,221 130,985,834 131,284,055 10,433,751 8,262,389 25,689 2,771,400 2016 - - 15,218,155 646,908 493,566 14,077,680 23,658,132 - 14,256,452 9,401,680 119,449 121,584,154 121,703,604 10,312,770 10,327,650 - 2,756,520
Oct 2015 - Sept 2016 - - 15,497,632 657,314 517,168 14,323,149 23,693,532 - 14,542,666 9,150,866 10,327,650 10,343,770 - 20,613,760
ATTACHMENT B
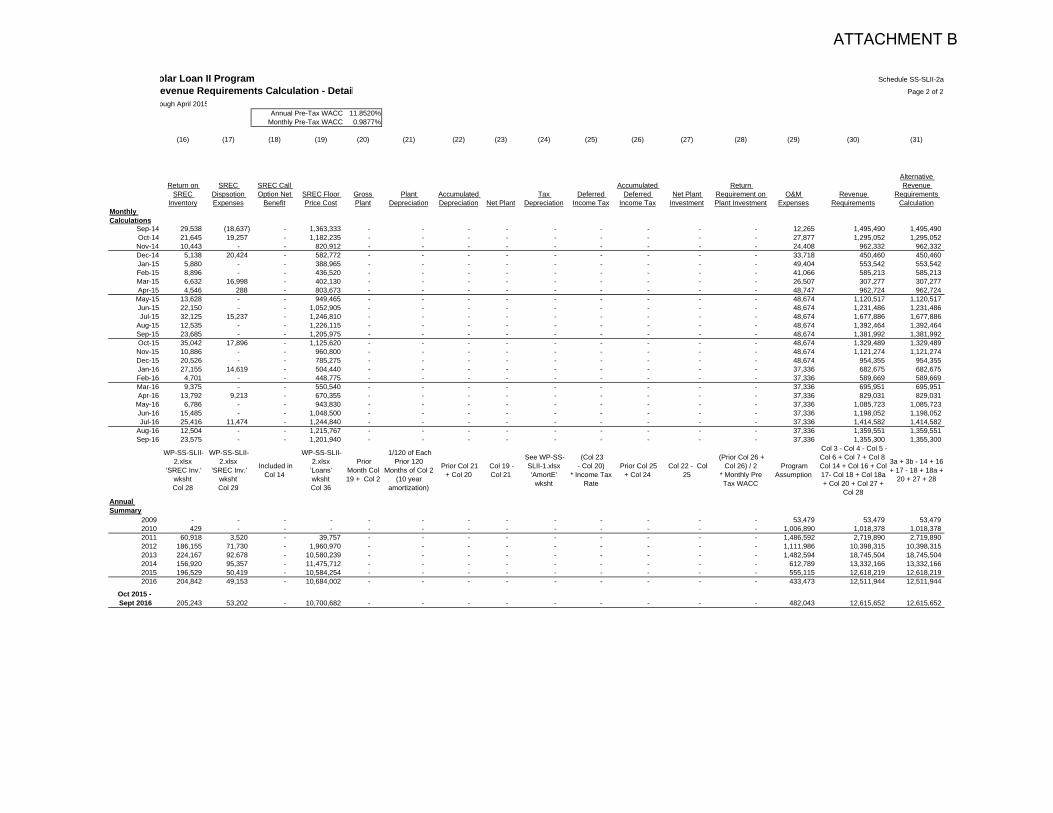
Monthly Calculations
Sep-14Oct-14Nov-14Dec-14Jan-15Feb-15Mar-15Apr-15
May-15Jun-15Jul-15
Aug-15Sep-15Oct-15Nov-15Dec-15Jan-16Feb-16Mar-16Apr-16
May-16Jun-16Jul-16
Aug-16Sep-16
Annual Summary
20092010201120122013201420152016
Oct 2015 - Sept 2016
olar Loan II Program Schedule SS-SLII-2a
evenue Requirements Calculation - Detail Page 2 of 2
ough April 2015Annual Pre-Tax WACC 11.8520%
Monthly Pre-Tax WACC 0.9877%
(16) (17) (18) (19) (20) (21) (22) (23) (24) (25) (26) (27) (28) (29) (30) (31)
Return on SREC
Inventory
SREC Dispsotion Expenses
SREC Call Option Net
BenefitSREC Floor Price Cost
Gross Plant
Plant Depreciation
Accumulated Depreciation Net Plant
Tax Depreciation
Deferred Income Tax
Accumulated Deferred
Income TaxNet Plant
Investment
Return Requirement on Plant Investment
O&M Expenses
Revenue Requirements
Alternative Revenue
Requirements Calculation
29,538 (18,637) - 1,363,333 - - - - - - - - - 12,265 1,495,490 1,495,490 21,645 19,257 - 1,182,235 - - - - - - - - - 27,877 1,295,052 1,295,052 10,443 - - 820,912 - - - - - - - - - 24,408 962,332 962,332 5,138 20,424 - 582,772 - - - - - - - - - 33,718 450,460 450,460 5,880 - - 388,965 - - - - - - - - - 49,404 553,542 553,542 8,896 - - 436,520 - - - - - - - - - 41,066 585,213 585,213 6,632 16,998 - 402,130 - - - - - - - - - 26,507 307,277 307,277 4,546 288 - 803,673 - - - - - - - - - 48,747 962,724 962,724
13,628 - - 949,465 - - - - - - - - - 48,674 1,120,517 1,120,517 22,150 - - 1,052,905 - - - - - - - - - 48,674 1,231,486 1,231,486 32,125 15,237 - 1,246,810 - - - - - - - - - 48,674 1,677,886 1,677,886 12,535 - - 1,226,115 - - - - - - - - - 48,674 1,392,464 1,392,464 23,685 - - 1,205,975 - - - - - - - - - 48,674 1,381,992 1,381,992 35,042 17,896 - 1,125,620 - - - - - - - - - 48,674 1,329,489 1,329,489 10,886 - - 960,800 - - - - - - - - - 48,674 1,121,274 1,121,274 20,526 - - 785,275 - - - - - - - - - 48,674 954,355 954,355 27,155 14,619 - 504,440 - - - - - - - - - 37,336 682,675 682,675 4,701 - - 448,775 - - - - - - - - - 37,336 589,669 589,669 9,375 - - 550,540 - - - - - - - - - 37,336 695,951 695,951
13,792 9,213 - 670,355 - - - - - - - - - 37,336 829,031 829,031 6,786 - - 943,830 - - - - - - - - - 37,336 1,085,723 1,085,723
15,485 - - 1,048,500 - - - - - - - - - 37,336 1,198,052 1,198,052 25,416 11,474 - 1,244,840 - - - - - - - - - 37,336 1,414,582 1,414,582 12,504 - - 1,215,767 - - - - - - - - - 37,336 1,359,551 1,359,551 23,575 - - 1,201,940 - - - - - - - - - 37,336 1,355,300 1,355,300
WP-SS-SLII-2.xlsx
'SREC Inv.'wkshtCol 28
WP-SS-SLII-2.xlsx
'SREC Inv.'wkshtCol 29
Included in Col 14
WP-SS-SLII-2.xlsx'Loans'wkshtCol 36
Prior Month Col 19 + Col 2
1/120 of Each Prior 120
Months of Col 2(10 year
amortization)
Prior Col 21+ Col 20
Col 19 - Col 21
See WP-SS-SLII-1.xlsx'AmortE'
wksht
(Col 23- Col 20)
* Income Tax Rate
Prior Col 25 + Col 24
Col 22 - Col 25
(Prior Col 26 + Col 26) / 2
* Monthly Pre Tax WACC
Program Assumption
Col 3 - Col 4 - Col 5 - Col 6 + Col 7 + Col 8 -Col 14 + Col 16 + Col 17- Col 18 + Col 18a + Col 20 + Col 27 +
Col 28
3a + 3b - 14 + 16 + 17 - 18 + 18a +
20 + 27 + 28
- - - - - - - - - - - - - 53,479 53,479 53,479 429 - - - - - - - - - - - - 1,006,890 1,018,378 1,018,378
60,918 3,520 - 39,757 - - - - - - - - - 1,486,592 2,719,890 2,719,890 186,155 71,730 - 1,960,970 - - - - - - - - - 1,111,986 10,398,315 10,398,315 224,167 92,678 - 10,580,239 - - - - - - - - - 1,482,594 18,745,504 18,745,504 156,920 95,357 - 11,475,712 - - - - - - - - - 612,789 13,332,166 13,332,166 196,529 50,419 - 10,584,254 - - - - - - - - - 555,115 12,618,219 12,618,219 204,842 49,153 - 10,684,002 - - - - - - - - - 433,473 12,511,944 12,511,944
205,243 53,202 - 10,700,682 - - - - - - - - - 482,043 12,615,652 12,615,652
ATTACHMENT B
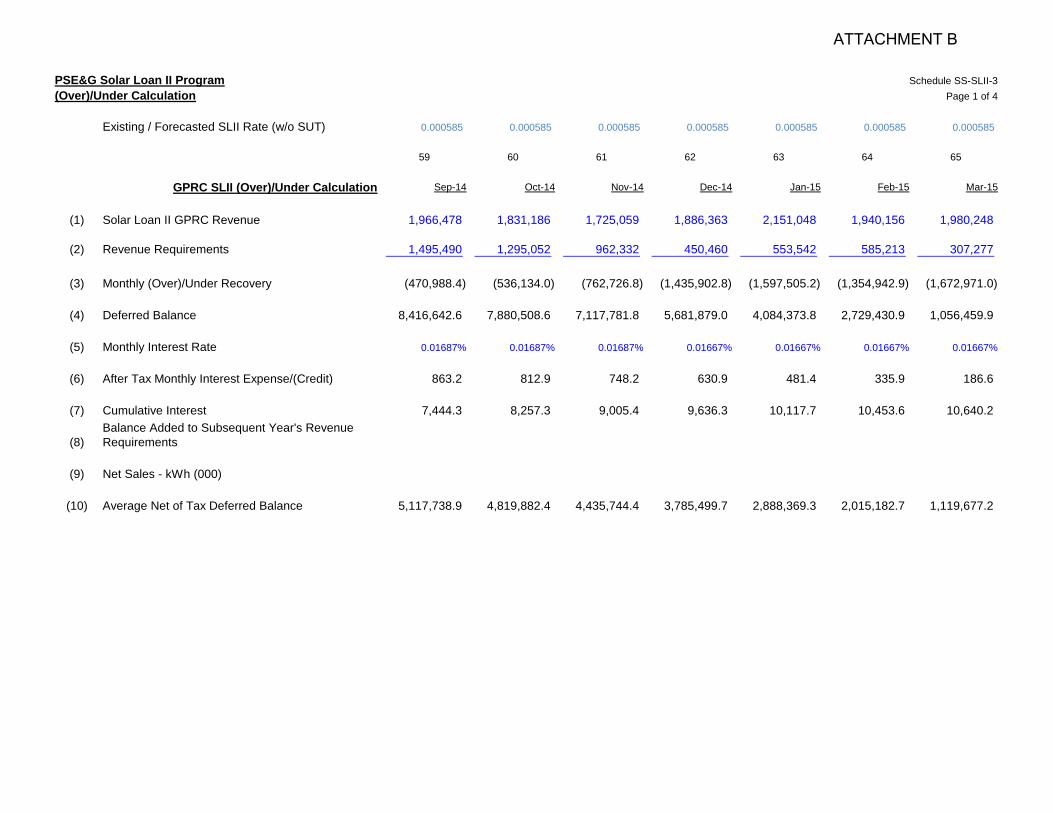
PSE&G Solar Loan II Program(Over)/Under Calculation
Existing / Forecasted SLII Rate (w/o SUT)
GPRC SLII (Over)/Under Calculation
(1) Solar Loan II GPRC Revenue
(2) Revenue Requirements
(3) Monthly (Over)/Under Recovery
(4) Deferred Balance
(5) Monthly Interest Rate
(6) After Tax Monthly Interest Expense/(Credit)
(7) Cumulative Interest
(8)Balance Added to Subsequent Year's Revenue Requirements
(9) Net Sales - kWh (000)
(10) Average Net of Tax Deferred Balance
Schedule SS-SLII-3Page 1 of 4
0.000585 0.000585 0.000585 0.000585 0.000585 0.000585 0.000585
59 60 61 62 63 64 65
Sep-14 Oct-14 Nov-14 Dec-14 Jan-15 Feb-15 Mar-15
1,966,478 1,831,186 1,725,059 1,886,363 2,151,048 1,940,156 1,980,248
1,495,490 1,295,052 962,332 450,460 553,542 585,213 307,277
(470,988.4) (536,134.0) (762,726.8) (1,435,902.8) (1,597,505.2) (1,354,942.9) (1,672,971.0)
8,416,642.6 7,880,508.6 7,117,781.8 5,681,879.0 4,084,373.8 2,729,430.9 1,056,459.9
0.01687% 0.01687% 0.01687% 0.01667% 0.01667% 0.01667% 0.01667%
863.2 812.9 748.2 630.9 481.4 335.9 186.6
7,444.3 8,257.3 9,005.4 9,636.3 10,117.7 10,453.6 10,640.2
5,117,738.9 4,819,882.4 4,435,744.4 3,785,499.7 2,888,369.3 2,015,182.7 1,119,677.2
ATTACHMENT B
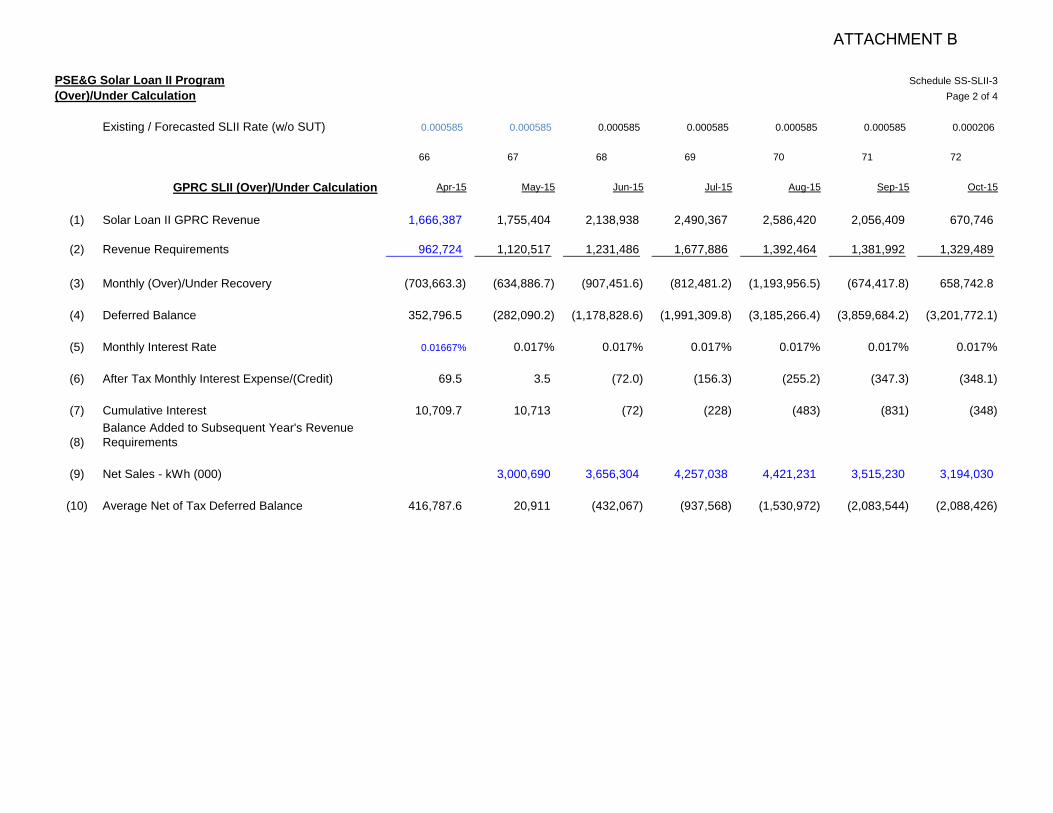
PSE&G Solar Loan II Program(Over)/Under Calculation
Existing / Forecasted SLII Rate (w/o SUT)
GPRC SLII (Over)/Under Calculation
(1) Solar Loan II GPRC Revenue
(2) Revenue Requirements
(3) Monthly (Over)/Under Recovery
(4) Deferred Balance
(5) Monthly Interest Rate
(6) After Tax Monthly Interest Expense/(Credit)
(7) Cumulative Interest
(8)Balance Added to Subsequent Year's Revenue Requirements
(9) Net Sales - kWh (000)
(10) Average Net of Tax Deferred Balance
Schedule SS-SLII-3Page 2 of 4
0.000585 0.000585 0.000585 0.000585 0.000585 0.000585 0.000206
66 67 68 69 70 71 72
Apr-15 May-15 Jun-15 Jul-15 Aug-15 Sep-15 Oct-15
1,666,387 1,755,404 2,138,938 2,490,367 2,586,420 2,056,409 670,746
962,724 1,120,517 1,231,486 1,677,886 1,392,464 1,381,992 1,329,489
(703,663.3) (634,886.7) (907,451.6) (812,481.2) (1,193,956.5) (674,417.8) 658,742.8
352,796.5 (282,090.2) (1,178,828.6) (1,991,309.8) (3,185,266.4) (3,859,684.2) (3,201,772.1)
0.01667% 0.017% 0.017% 0.017% 0.017% 0.017% 0.017%
69.5 3.5 (72.0) (156.3) (255.2) (347.3) (348.1)
10,709.7 10,713 (72) (228) (483) (831) (348)
3,000,690 3,656,304 4,257,038 4,421,231 3,515,230 3,194,030
416,787.6 20,911 (432,067) (937,568) (1,530,972) (2,083,544) (2,088,426)
ATTACHMENT B
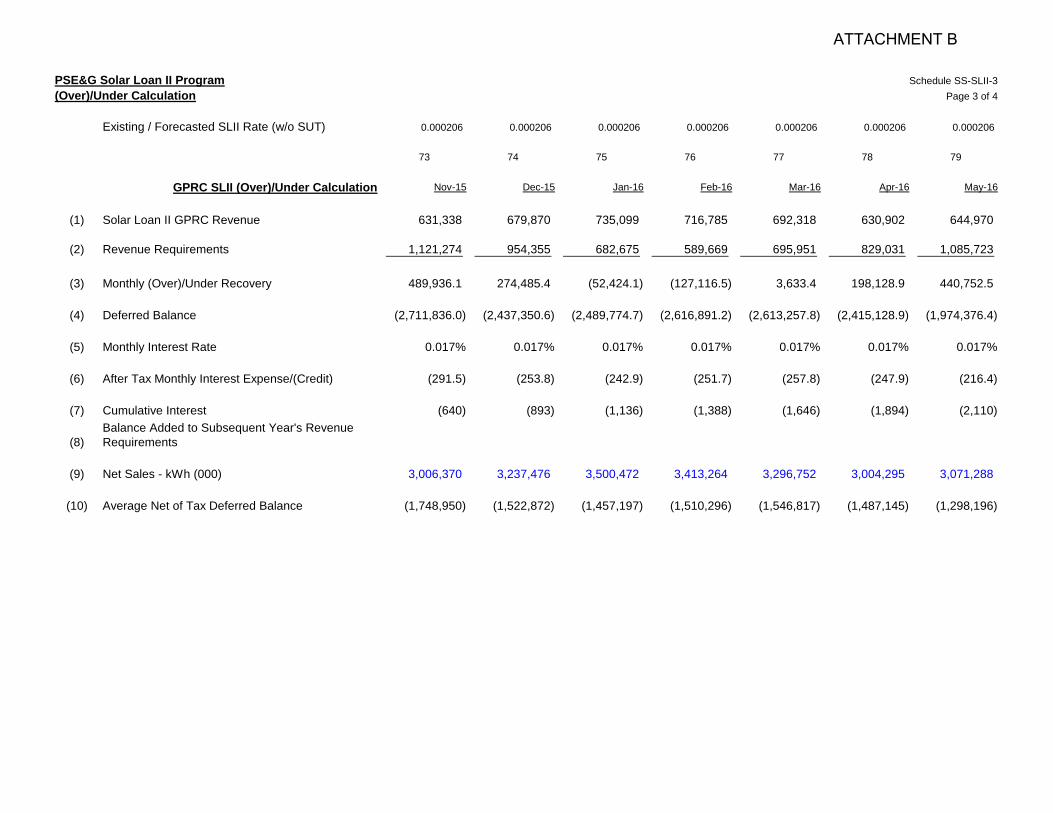
PSE&G Solar Loan II Program(Over)/Under Calculation
Existing / Forecasted SLII Rate (w/o SUT)
GPRC SLII (Over)/Under Calculation
(1) Solar Loan II GPRC Revenue
(2) Revenue Requirements
(3) Monthly (Over)/Under Recovery
(4) Deferred Balance
(5) Monthly Interest Rate
(6) After Tax Monthly Interest Expense/(Credit)
(7) Cumulative Interest
(8)Balance Added to Subsequent Year's Revenue Requirements
(9) Net Sales - kWh (000)
(10) Average Net of Tax Deferred Balance
Schedule SS-SLII-3Page 3 of 4
0.000206 0.000206 0.000206 0.000206 0.000206 0.000206 0.000206
73 74 75 76 77 78 79
Nov-15 Dec-15 Jan-16 Feb-16 Mar-16 Apr-16 May-16
631,338 679,870 735,099 716,785 692,318 630,902 644,970
1,121,274 954,355 682,675 589,669 695,951 829,031 1,085,723
489,936.1 274,485.4 (52,424.1) (127,116.5) 3,633.4 198,128.9 440,752.5
(2,711,836.0) (2,437,350.6) (2,489,774.7) (2,616,891.2) (2,613,257.8) (2,415,128.9) (1,974,376.4)
0.017% 0.017% 0.017% 0.017% 0.017% 0.017% 0.017%
(291.5) (253.8) (242.9) (251.7) (257.8) (247.9) (216.4)
(640) (893) (1,136) (1,388) (1,646) (1,894) (2,110)
3,006,370 3,237,476 3,500,472 3,413,264 3,296,752 3,004,295 3,071,288
(1,748,950) (1,522,872) (1,457,197) (1,510,296) (1,546,817) (1,487,145) (1,298,196)
ATTACHMENT B
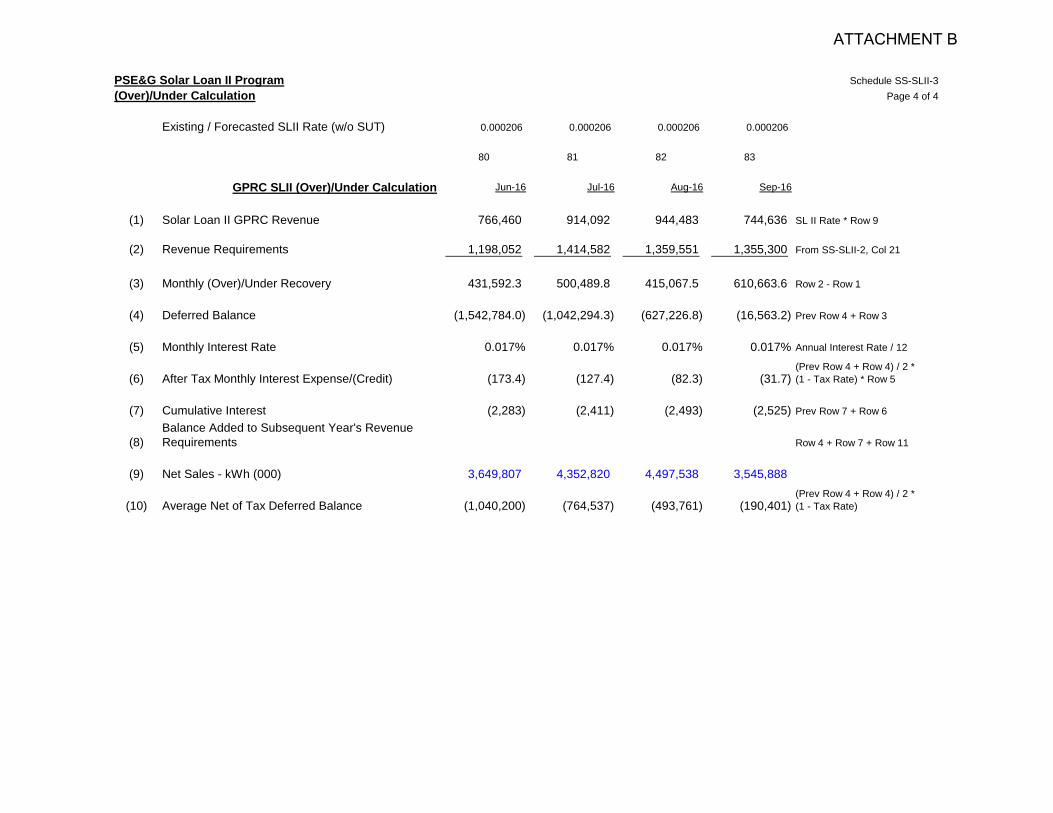
PSE&G Solar Loan II Program(Over)/Under Calculation
Existing / Forecasted SLII Rate (w/o SUT)
GPRC SLII (Over)/Under Calculation
(1) Solar Loan II GPRC Revenue
(2) Revenue Requirements
(3) Monthly (Over)/Under Recovery
(4) Deferred Balance
(5) Monthly Interest Rate
(6) After Tax Monthly Interest Expense/(Credit)
(7) Cumulative Interest
(8)Balance Added to Subsequent Year's Revenue Requirements
(9) Net Sales - kWh (000)
(10) Average Net of Tax Deferred Balance
Schedule SS-SLII-3Page 4 of 4
0.000206 0.000206 0.000206 0.000206
80 81 82 83
Jun-16 Jul-16 Aug-16 Sep-16
766,460 914,092 944,483 744,636 SL II Rate * Row 9
1,198,052 1,414,582 1,359,551 1,355,300 From SS-SLII-2, Col 21
431,592.3 500,489.8 415,067.5 610,663.6 Row 2 - Row 1
(1,542,784.0) (1,042,294.3) (627,226.8) (16,563.2) Prev Row 4 + Row 3
0.017% 0.017% 0.017% 0.017% Annual Interest Rate / 12
(173.4) (127.4) (82.3) (31.7) (Prev Row 4 + Row 4) / 2 *(1 - Tax Rate) * Row 5
(2,283) (2,411) (2,493) (2,525) Prev Row 7 + Row 6
Row 4 + Row 7 + Row 11
3,649,807 4,352,820 4,497,538 3,545,888
(1,040,200) (764,537) (493,761) (190,401) (Prev Row 4 + Row 4) / 2 *(1 - Tax Rate)
ATTACHMENT B
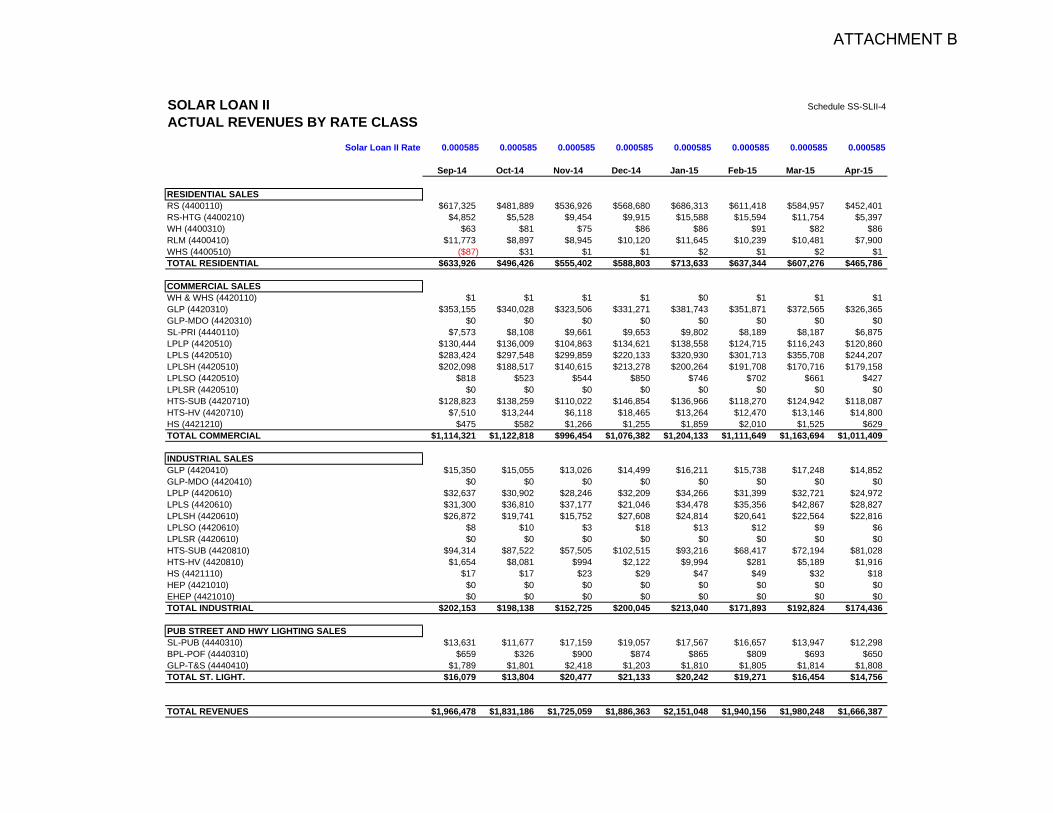
SOLAR LOAN II Schedule SS-SLII-4
ACTUAL REVENUES BY RATE CLASSSolar Loan II Rate 0.000585 0.000585 0.000585 0.000585 0.000585 0.000585 0.000585 0.000585
Sep-14 Oct-14 Nov-14 Dec-14 Jan-15 Feb-15 Mar-15 Apr-15
RESIDENTIAL SALESRS (4400110) $617,325 $481,889 $536,926 $568,680 $686,313 $611,418 $584,957 $452,401RS-HTG (4400210) $4,852 $5,528 $9,454 $9,915 $15,588 $15,594 $11,754 $5,397WH (4400310) $63 $81 $75 $86 $86 $91 $82 $86RLM (4400410) $11,773 $8,897 $8,945 $10,120 $11,645 $10,239 $10,481 $7,900WHS (4400510) ($87) $31 $1 $1 $2 $1 $2 $1TOTAL RESIDENTIAL $633,926 $496,426 $555,402 $588,803 $713,633 $637,344 $607,276 $465,786
COMMERCIAL SALESWH & WHS (4420110) $1 $1 $1 $1 $0 $1 $1 $1GLP (4420310) $353,155 $340,028 $323,506 $331,271 $381,743 $351,871 $372,565 $326,365GLP-MDO (4420310) $0 $0 $0 $0 $0 $0 $0 $0SL-PRI (4440110) $7,573 $8,108 $9,661 $9,653 $9,802 $8,189 $8,187 $6,875LPLP (4420510) $130,444 $136,009 $104,863 $134,621 $138,558 $124,715 $116,243 $120,860LPLS (4420510) $283,424 $297,548 $299,859 $220,133 $320,930 $301,713 $355,708 $244,207LPLSH (4420510) $202,098 $188,517 $140,615 $213,278 $200,264 $191,708 $170,716 $179,158LPLSO (4420510) $818 $523 $544 $850 $746 $702 $661 $427LPLSR (4420510) $0 $0 $0 $0 $0 $0 $0 $0HTS-SUB (4420710) $128,823 $138,259 $110,022 $146,854 $136,966 $118,270 $124,942 $118,087HTS-HV (4420710) $7,510 $13,244 $6,118 $18,465 $13,264 $12,470 $13,146 $14,800HS (4421210) $475 $582 $1,266 $1,255 $1,859 $2,010 $1,525 $629TOTAL COMMERCIAL $1,114,321 $1,122,818 $996,454 $1,076,382 $1,204,133 $1,111,649 $1,163,694 $1,011,409
INDUSTRIAL SALESGLP (4420410) $15,350 $15,055 $13,026 $14,499 $16,211 $15,738 $17,248 $14,852GLP-MDO (4420410) $0 $0 $0 $0 $0 $0 $0 $0LPLP (4420610) $32,637 $30,902 $28,246 $32,209 $34,266 $31,399 $32,721 $24,972LPLS (4420610) $31,300 $36,810 $37,177 $21,046 $34,478 $35,356 $42,867 $28,827LPLSH (4420610) $26,872 $19,741 $15,752 $27,608 $24,814 $20,641 $22,564 $22,816LPLSO (4420610) $8 $10 $3 $18 $13 $12 $9 $6LPLSR (4420610) $0 $0 $0 $0 $0 $0 $0 $0HTS-SUB (4420810) $94,314 $87,522 $57,505 $102,515 $93,216 $68,417 $72,194 $81,028HTS-HV (4420810) $1,654 $8,081 $994 $2,122 $9,994 $281 $5,189 $1,916HS (4421110) $17 $17 $23 $29 $47 $49 $32 $18HEP (4421010) $0 $0 $0 $0 $0 $0 $0 $0EHEP (4421010) $0 $0 $0 $0 $0 $0 $0 $0TOTAL INDUSTRIAL $202,153 $198,138 $152,725 $200,045 $213,040 $171,893 $192,824 $174,436
PUB STREET AND HWY LIGHTING SALESSL-PUB (4440310) $13,631 $11,677 $17,159 $19,057 $17,567 $16,657 $13,947 $12,298BPL-POF (4440310) $659 $326 $900 $874 $865 $809 $693 $650GLP-T&S (4440410) $1,789 $1,801 $2,418 $1,203 $1,810 $1,805 $1,814 $1,808TOTAL ST. LIGHT. $16,079 $13,804 $20,477 $21,133 $20,242 $19,271 $16,454 $14,756
TOTAL REVENUES $1,966,478 $1,831,186 $1,725,059 $1,886,363 $2,151,048 $1,940,156 $1,980,248 $1,666,387
ATTACHMENT B
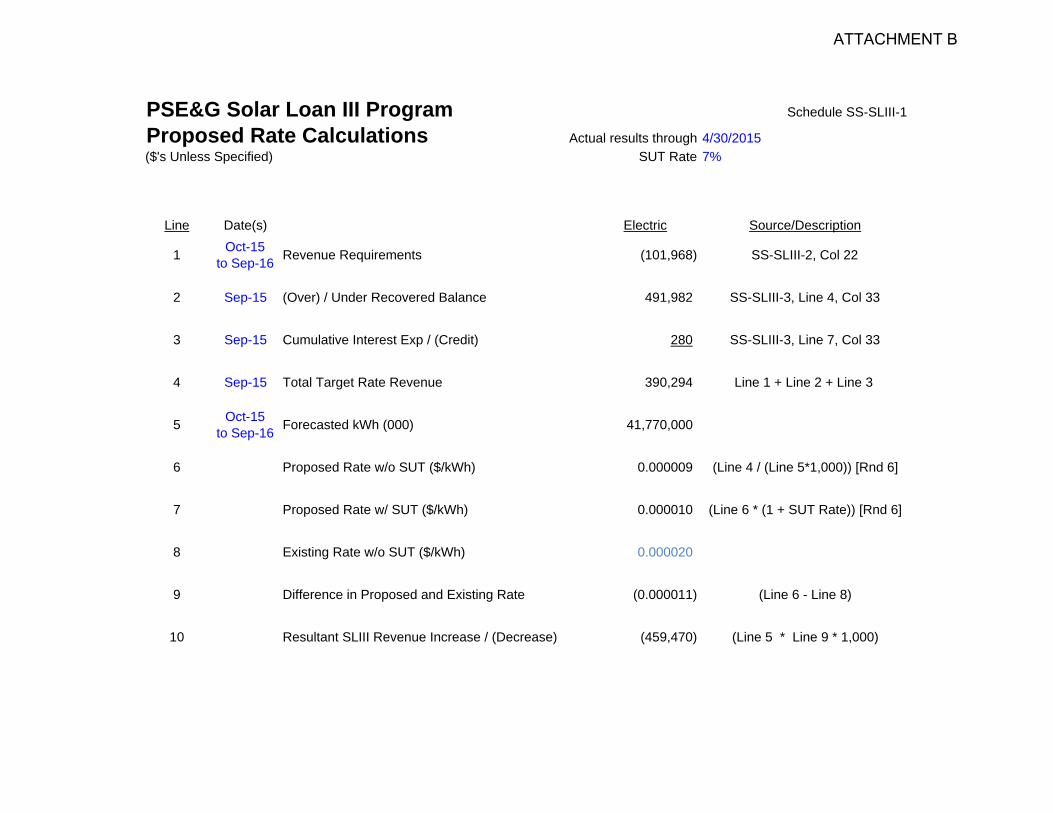
PSE&G Solar Loan III Program Schedule SS-SLIII-1
Proposed Rate Calculations Actual results through 4/30/2015($'s Unless Specified) SUT Rate 7%
Line Date(s) Electric Source/Description
1 Oct-15to Sep-16 Revenue Requirements (101,968) SS-SLIII-2, Col 22
2 Sep-15 (Over) / Under Recovered Balance 491,982 SS-SLIII-3, Line 4, Col 33
3 Sep-15 Cumulative Interest Exp / (Credit) 280 SS-SLIII-3, Line 7, Col 33
4 Sep-15 Total Target Rate Revenue 390,294 Line 1 + Line 2 + Line 3
5 Oct-15to Sep-16 Forecasted kWh (000) 41,770,000
6 Proposed Rate w/o SUT ($/kWh) 0.000009 (Line 4 / (Line 5*1,000)) [Rnd 6]
7 Proposed Rate w/ SUT ($/kWh) 0.000010 (Line 6 * (1 + SUT Rate)) [Rnd 6]
8 Existing Rate w/o SUT ($/kWh) 0.000020
9 Difference in Proposed and Existing Rate (0.000011) (Line 6 - Line 8)
10 Resultant SLIII Revenue Increase / (Decrease) (459,470) (Line 5 * Line 9 * 1,000)
ATTACHMENT B
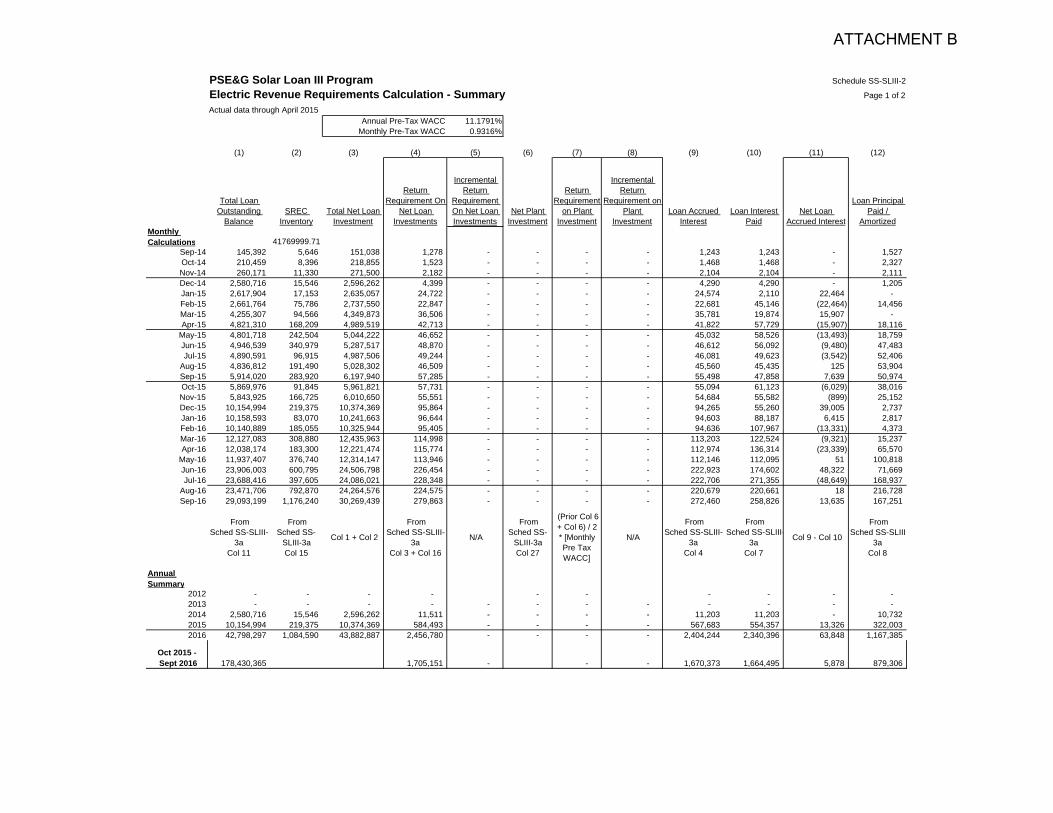
PSE&G Solar Loan III Program Schedule SS-SLIII-2
Electric Revenue Requirements Calculation - Summary Page 1 of 2
Actual data through April 2015Annual Pre-Tax WACC 11.1791%
Monthly Pre-Tax WACC 0.9316%
(1) (2) (3) (4) (5) (6) (7) (8) (9) (10) (11) (12)
Total Loan Outstanding
BalanceSREC
InventoryTotal Net Loan
Investment
Return Requirement On
Net Loan Investments
Incremental Return
Requirement On Net Loan Investments
Net Plant Investment
Return Requirement
on Plant Investment
Incremental Return
Requirement on Plant
InvestmentLoan Accrued
InterestLoan Interest
PaidNet Loan
Accrued Interest
Loan Principal Paid /
AmortizedMonthly Calculations 41769999.71
Sep-14 145,392 5,646 151,038 1,278 - - - - 1,243 1,243 - 1,527 Oct-14 210,459 8,396 218,855 1,523 - - - - 1,468 1,468 - 2,327 Nov-14 260,171 11,330 271,500 2,182 - - - - 2,104 2,104 - 2,111 Dec-14 2,580,716 15,546 2,596,262 4,399 - - - - 4,290 4,290 - 1,205 Jan-15 2,617,904 17,153 2,635,057 24,722 - - - - 24,574 2,110 22,464 - Feb-15 2,661,764 75,786 2,737,550 22,847 - - - - 22,681 45,146 (22,464) 14,456 Mar-15 4,255,307 94,566 4,349,873 36,506 - - - - 35,781 19,874 15,907 - Apr-15 4,821,310 168,209 4,989,519 42,713 - - - - 41,822 57,729 (15,907) 18,116
May-15 4,801,718 242,504 5,044,222 46,652 - - - - 45,032 58,526 (13,493) 18,759 Jun-15 4,946,539 340,979 5,287,517 48,870 - - - - 46,612 56,092 (9,480) 47,483 Jul-15 4,890,591 96,915 4,987,506 49,244 - - - - 46,081 49,623 (3,542) 52,406
Aug-15 4,836,812 191,490 5,028,302 46,509 - - - - 45,560 45,435 125 53,904 Sep-15 5,914,020 283,920 6,197,940 57,285 - - - - 55,498 47,858 7,639 50,974 Oct-15 5,869,976 91,845 5,961,821 57,731 - - - - 55,094 61,123 (6,029) 38,016 Nov-15 5,843,925 166,725 6,010,650 55,551 - - - - 54,684 55,582 (899) 25,152 Dec-15 10,154,994 219,375 10,374,369 95,864 - - - - 94,265 55,260 39,005 2,737 Jan-16 10,158,593 83,070 10,241,663 96,644 - - - - 94,603 88,187 6,415 2,817 Feb-16 10,140,889 185,055 10,325,944 95,405 - - - - 94,636 107,967 (13,331) 4,373 Mar-16 12,127,083 308,880 12,435,963 114,998 - - - - 113,203 122,524 (9,321) 15,237 Apr-16 12,038,174 183,300 12,221,474 115,774 - - - - 112,974 136,314 (23,339) 65,570
May-16 11,937,407 376,740 12,314,147 113,946 - - - - 112,146 112,095 51 100,818 Jun-16 23,906,003 600,795 24,506,798 226,454 - - - - 222,923 174,602 48,322 71,669 Jul-16 23,688,416 397,605 24,086,021 228,348 - - - - 222,706 271,355 (48,649) 168,937
Aug-16 23,471,706 792,870 24,264,576 224,575 - - - - 220,679 220,661 18 216,728 Sep-16 29,093,199 1,176,240 30,269,439 279,863 - - - - 272,460 258,826 13,635 167,251
FromSched SS-SLIII-
3aCol 11
FromSched SS-
SLIII-3aCol 15
Col 1 + Col 2
FromSched SS-SLIII-
3aCol 3 + Col 16
N/A
FromSched SS-
SLIII-3aCol 27
(Prior Col 6 + Col 6) / 2* [Monthly Pre Tax WACC]
N/A
FromSched SS-SLIII-
3aCol 4
FromSched SS-SLIII-
3aCol 7
Col 9 - Col 10
FromSched SS-SLIII-
3aCol 8
Annual Summary
2012 - - - - - - - - - - 2013 - - - - - - - - - - - - 2014 2,580,716 15,546 2,596,262 11,511 - - - - 11,203 11,203 - 10,732 2015 10,154,994 219,375 10,374,369 584,493 - - - - 567,683 554,357 13,326 322,003 2016 42,798,297 1,084,590 43,882,887 2,456,780 - - - - 2,404,244 2,340,396 63,848 1,167,385
Oct 2015 - Sept 2016 178,430,365 1,705,151 - - - 1,670,373 1,664,495 5,878 879,306
ATTACHMENT B
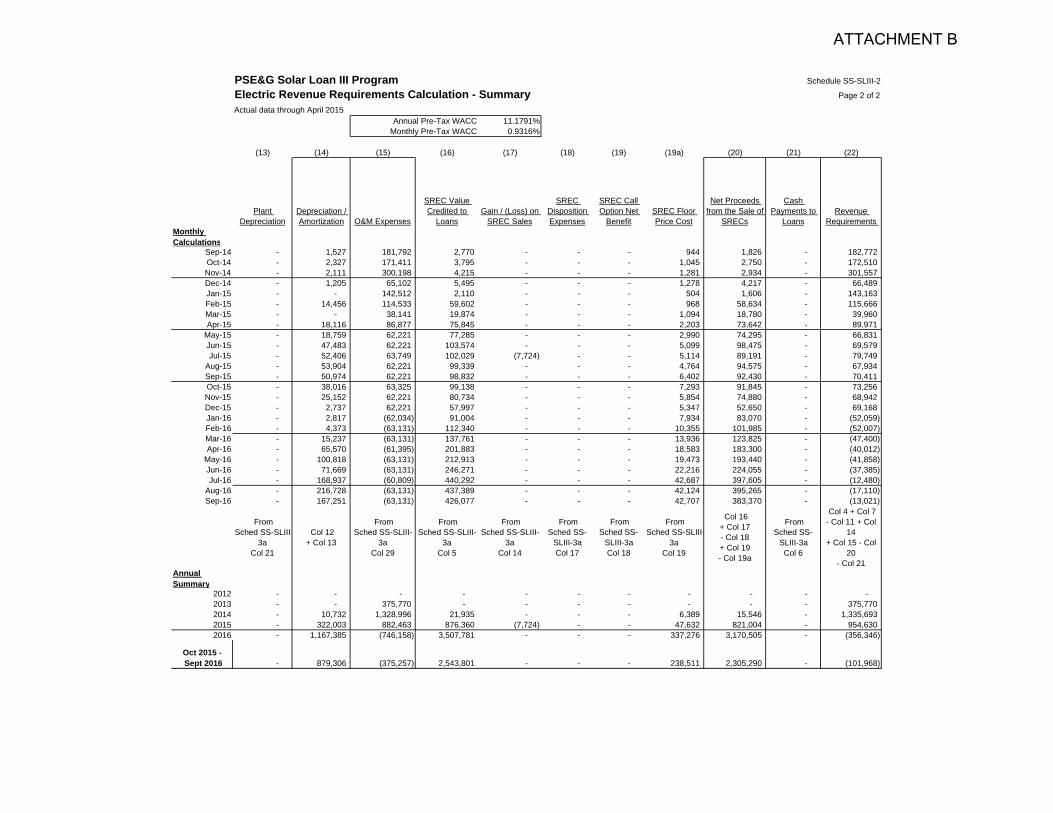
Monthly Calculations
Sep-14Oct-14Nov-14Dec-14Jan-15Feb-15Mar-15Apr-15
May-15Jun-15Jul-15
Aug-15Sep-15Oct-15Nov-15Dec-15Jan-16Feb-16Mar-16Apr-16
May-16Jun-16Jul-16
Aug-16Sep-16
Annual Summary
20122013201420152016
Oct 2015 - Sept 2016
PSE&G Solar Loan III Program Schedule SS-SLIII-2
Electric Revenue Requirements Calculation - Summary Page 2 of 2
Actual data through April 2015Annual Pre-Tax WACC 11.1791%
Monthly Pre-Tax WACC 0.9316%
(13) (14) (15) (16) (17) (18) (19) (19a) (20) (21) (22)
Plant Depreciation
Depreciation / Amortization O&M Expenses
SREC Value Credited to
LoansGain / (Loss) on
SREC Sales
SREC Disposition Expenses
SREC Call Option Net
BenefitSREC Floor Price Cost
Net Proceeds from the Sale of
SRECs
Cash Payments to
LoansRevenue
Requirements
- 1,527 181,792 2,770 - - - 944 1,826 - 182,772 - 2,327 171,411 3,795 - - - 1,045 2,750 - 172,510 - 2,111 300,198 4,215 - - - 1,281 2,934 - 301,557 - 1,205 65,102 5,495 - - - 1,278 4,217 - 66,489 - - 142,512 2,110 - - - 504 1,606 - 143,163 - 14,456 114,533 59,602 - - - 968 58,634 - 115,666 - - 38,141 19,874 - - - 1,094 18,780 - 39,960 - 18,116 86,877 75,845 - - - 2,203 73,642 - 89,971 - 18,759 62,221 77,285 - - - 2,990 74,295 - 66,831 - 47,483 62,221 103,574 - - - 5,099 98,475 - 69,579 - 52,406 63,749 102,029 (7,724) - - 5,114 89,191 - 79,749 - 53,904 62,221 99,339 - - - 4,764 94,575 - 67,934 - 50,974 62,221 98,832 - - - 6,402 92,430 - 70,411 - 38,016 63,325 99,138 - - - 7,293 91,845 - 73,256 - 25,152 62,221 80,734 - - - 5,854 74,880 - 68,942 - 2,737 62,221 57,997 - - - 5,347 52,650 - 69,168 - 2,817 (62,034) 91,004 - - - 7,934 83,070 - (52,059) - 4,373 (63,131) 112,340 - - - 10,355 101,985 - (52,007) - 15,237 (63,131) 137,761 - - - 13,936 123,825 - (47,400) - 65,570 (61,395) 201,883 - - - 18,583 183,300 - (40,012) - 100,818 (63,131) 212,913 - - - 19,473 193,440 - (41,858) - 71,669 (63,131) 246,271 - - - 22,216 224,055 - (37,385) - 168,937 (60,809) 440,292 - - - 42,687 397,605 - (12,480) - 216,728 (63,131) 437,389 - - - 42,124 395,265 - (17,110) - 167,251 (63,131) 426,077 - - - 42,707 383,370 - (13,021)
FromSched SS-SLIII-
3aCol 21
Col 12+ Col 13
FromSched SS-SLIII-
3aCol 29
FromSched SS-SLIII-
3aCol 5
FromSched SS-SLIII-
3aCol 14
FromSched SS-
SLIII-3aCol 17
FromSched SS-
SLIII-3aCol 18
FromSched SS-SLIII-
3aCol 19
Col 16+ Col 17- Col 18+ Col 19- Col 19a
FromSched SS-
SLIII-3aCol 6
Col 4 + Col 7- Col 11 + Col
14+ Col 15 - Col
20- Col 21
- - - - - - - - - - - - - 375,770 - - - - - - - 375,770 - 10,732 1,328,996 21,935 - - - 6,389 15,546 - 1,335,693 - 322,003 882,463 876,360 (7,724) - - 47,632 821,004 - 954,630 - 1,167,385 (746,158) 3,507,781 - - - 337,276 3,170,505 - (356,346)
- 879,306 (375,257) 2,543,801 - - - 238,511 2,305,290 - (101,968)
ATTACHMENT B
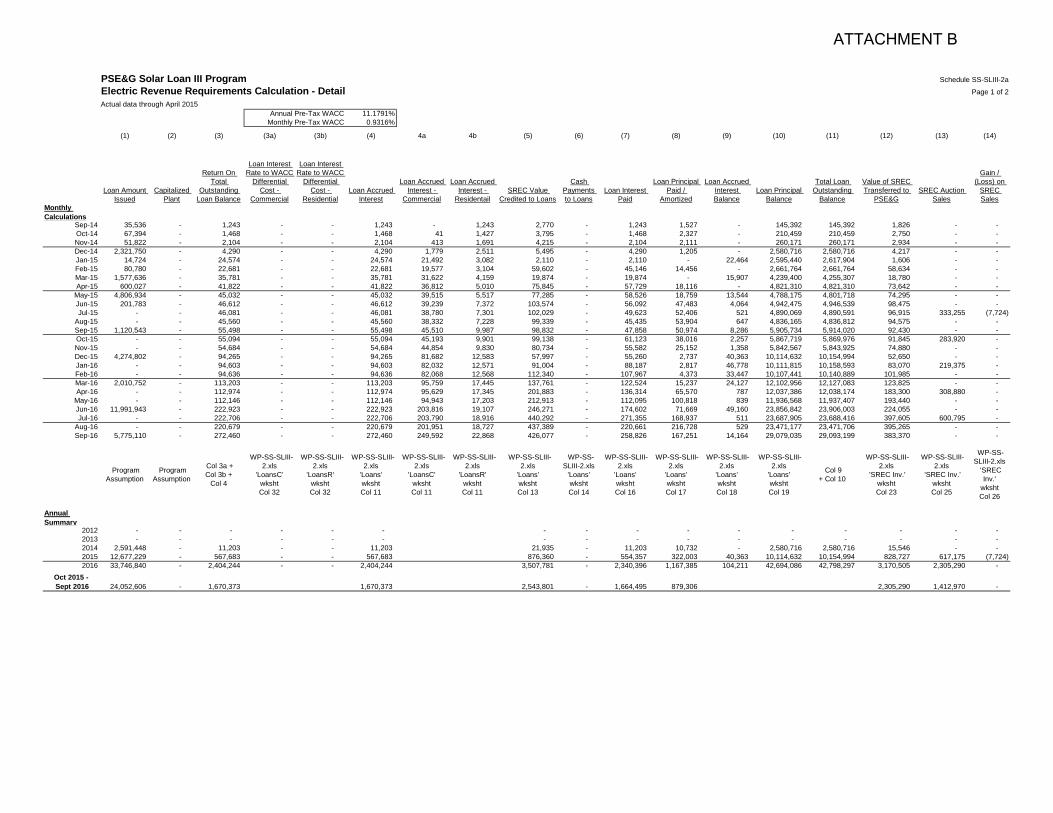
PSE&G Solar Loan III Program Schedule SS-SLIII-2a
Electric Revenue Requirements Calculation - Detail Page 1 of 2
Actual data through April 2015Annual Pre-Tax WACC 11.1791%
Monthly Pre-Tax WACC 0.9316%
(1) (2) (3) (3a) (3b) (4) 4a 4b (5) (6) (7) (8) (9) (10) (11) (12) (13) (14)
Loan Amount Issued
Capitalized Plant
Return On Total
Outstanding Loan Balance
Loan Interest Rate to WACC
Differential Cost -
Commercial
Loan Interest Rate to WACC
Differential Cost -
ResidentialLoan Accrued
Interest
Loan Accrued Interest -
Commercial
Loan Accrued Interest -
ResidentailSREC Value
Credited to Loans
Cash Payments to Loans
Loan Interest Paid
Loan Principal Paid /
Amortized
Loan Accrued Interest Balance
Loan Principal Balance
Total Loan Outstanding
Balance
Value of SREC Transferred to
PSE&GSREC Auction
Sales
Gain / (Loss) on
SREC Sales
Monthly Calculations
Sep-14 35,536 - 1,243 - - 1,243 - 1,243 2,770 - 1,243 1,527 - 145,392 145,392 1,826 - - Oct-14 67,394 - 1,468 - - 1,468 41 1,427 3,795 - 1,468 2,327 - 210,459 210,459 2,750 - - Nov-14 51,822 - 2,104 - - 2,104 413 1,691 4,215 - 2,104 2,111 - 260,171 260,171 2,934 - - Dec-14 2,321,750 - 4,290 - - 4,290 1,779 2,511 5,495 - 4,290 1,205 - 2,580,716 2,580,716 4,217 - - Jan-15 14,724 - 24,574 - - 24,574 21,492 3,082 2,110 - 2,110 - 22,464 2,595,440 2,617,904 1,606 - - Feb-15 80,780 - 22,681 - - 22,681 19,577 3,104 59,602 - 45,146 14,456 - 2,661,764 2,661,764 58,634 - - Mar-15 1,577,636 - 35,781 - - 35,781 31,622 4,159 19,874 - 19,874 - 15,907 4,239,400 4,255,307 18,780 - - Apr-15 600,027 - 41,822 - - 41,822 36,812 5,010 75,845 - 57,729 18,116 - 4,821,310 4,821,310 73,642 - -
May-15 4,806,934 - 45,032 - - 45,032 39,515 5,517 77,285 - 58,526 18,759 13,544 4,788,175 4,801,718 74,295 - - Jun-15 201,783 - 46,612 - - 46,612 39,239 7,372 103,574 - 56,092 47,483 4,064 4,942,475 4,946,539 98,475 - - Jul-15 - - 46,081 - - 46,081 38,780 7,301 102,029 - 49,623 52,406 521 4,890,069 4,890,591 96,915 333,255 (7,724)
Aug-15 - - 45,560 - - 45,560 38,332 7,228 99,339 - 45,435 53,904 647 4,836,165 4,836,812 94,575 - - Sep-15 1,120,543 - 55,498 - - 55,498 45,510 9,987 98,832 - 47,858 50,974 8,286 5,905,734 5,914,020 92,430 - - Oct-15 - - 55,094 - - 55,094 45,193 9,901 99,138 - 61,123 38,016 2,257 5,867,719 5,869,976 91,845 283,920 - Nov-15 - - 54,684 - - 54,684 44,854 9,830 80,734 - 55,582 25,152 1,358 5,842,567 5,843,925 74,880 - - Dec-15 4,274,802 - 94,265 - - 94,265 81,682 12,583 57,997 - 55,260 2,737 40,363 10,114,632 10,154,994 52,650 - - Jan-16 - - 94,603 - - 94,603 82,032 12,571 91,004 - 88,187 2,817 46,778 10,111,815 10,158,593 83,070 219,375 - Feb-16 - - 94,636 - - 94,636 82,068 12,568 112,340 - 107,967 4,373 33,447 10,107,441 10,140,889 101,985 - - Mar-16 2,010,752 - 113,203 - - 113,203 95,759 17,445 137,761 - 122,524 15,237 24,127 12,102,956 12,127,083 123,825 - - Apr-16 - - 112,974 - - 112,974 95,629 17,345 201,883 - 136,314 65,570 787 12,037,386 12,038,174 183,300 308,880 -
May-16 - - 112,146 - - 112,146 94,943 17,203 212,913 - 112,095 100,818 839 11,936,568 11,937,407 193,440 - - Jun-16 11,991,943 - 222,923 - - 222,923 203,816 19,107 246,271 - 174,602 71,669 49,160 23,856,842 23,906,003 224,055 - - Jul-16 - - 222,706 - - 222,706 203,790 18,916 440,292 - 271,355 168,937 511 23,687,905 23,688,416 397,605 600,795 -
Aug-16 - - 220,679 - - 220,679 201,951 18,727 437,389 - 220,661 216,728 529 23,471,177 23,471,706 395,265 - - Sep-16 5,775,110 - 272,460 - - 272,460 249,592 22,868 426,077 - 258,826 167,251 14,164 29,079,035 29,093,199 383,370 - -
Program Assumption
Program Assumption
Col 3a +Col 3b +
Col 4
WP-SS-SLIII-2.xls
'LoansC' wkshtCol 32
WP-SS-SLIII-2.xls
'LoansR' wkshtCol 32
WP-SS-SLIII-2.xls
'Loans'wkshtCol 11
WP-SS-SLIII-2.xls
'LoansC' wkshtCol 11
WP-SS-SLIII-2.xls
'LoansR' wkshtCol 11
WP-SS-SLIII-2.xls
'Loans'wkshtCol 13
WP-SS-SLIII-2.xls
'Loans'wkshtCol 14
WP-SS-SLIII-2.xls
'Loans'wkshtCol 16
WP-SS-SLIII-2.xls
'Loans'wkshtCol 17
WP-SS-SLIII-2.xls
'Loans'wkshtCol 18
WP-SS-SLIII-2.xls
'Loans'wkshtCol 19
Col 9+ Col 10
WP-SS-SLIII-2.xls
'SREC Inv.'wkshtCol 23
WP-SS-SLIII-2.xls
'SREC Inv.'wkshtCol 25
WP-SS-SLIII-2.xls
'SREC Inv.'
wkshtCol 26
Annual Summary
2012 - - - - - - - - - - - - - - - - 2013 - - - - - - - - - - - - - - - - 2014 2,591,448 - 11,203 - - 11,203 21,935 - 11,203 10,732 - 2,580,716 2,580,716 15,546 - - 2015 12,677,229 - 567,683 - - 567,683 876,360 - 554,357 322,003 40,363 10,114,632 10,154,994 828,727 617,175 (7,724) 2016 33,746,840 - 2,404,244 - - 2,404,244 3,507,781 - 2,340,396 1,167,385 104,211 42,694,086 42,798,297 3,170,505 2,305,290 -
Oct 2015 - Sept 2016 24,052,606 - 1,670,373 1,670,373 2,543,801 - 1,664,495 879,306 2,305,290 1,412,970 -
ATTACHMENT B
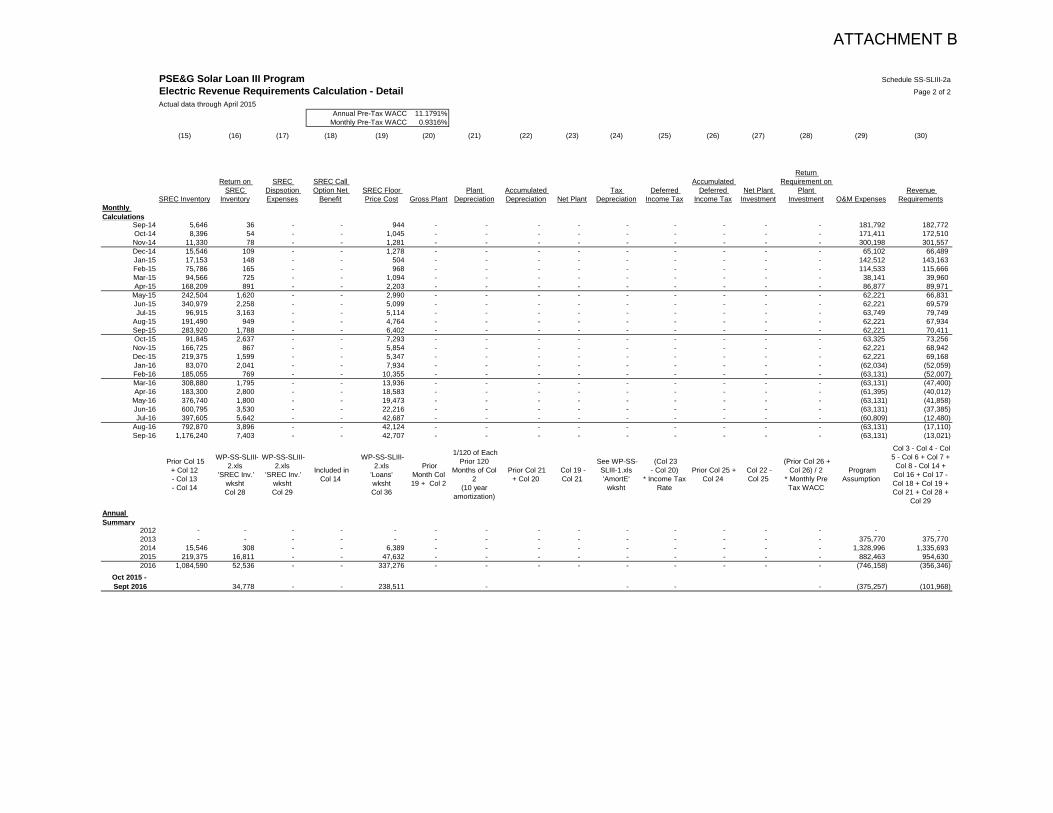
Monthly Calculations
Sep-14Oct-14Nov-14Dec-14Jan-15Feb-15Mar-15Apr-15
May-15Jun-15Jul-15
Aug-15Sep-15Oct-15Nov-15Dec-15Jan-16Feb-16Mar-16Apr-16
May-16Jun-16Jul-16
Aug-16Sep-16
Annual Summary
20122013201420152016
Oct 2015 - Sept 2016
PSE&G Solar Loan III Program Schedule SS-SLIII-2a
Electric Revenue Requirements Calculation - Detail Page 2 of 2
Actual data through April 2015Annual Pre-Tax WACC 11.1791%
Monthly Pre-Tax WACC 0.9316%
(15) (16) (17) (18) (19) (20) (21) (22) (23) (24) (25) (26) (27) (28) (29) (30)
SREC Inventory
Return on SREC
Inventory
SREC Dispsotion Expenses
SREC Call Option Net
BenefitSREC Floor Price Cost Gross Plant
Plant Depreciation
Accumulated Depreciation Net Plant
Tax Depreciation
Deferred Income Tax
Accumulated Deferred
Income TaxNet Plant
Investment
Return Requirement on
Plant Investment O&M Expenses
Revenue Requirements
5,646 36 - - 944 - - - - - - - - - 181,792 182,772 8,396 54 - - 1,045 - - - - - - - - - 171,411 172,510
11,330 78 - - 1,281 - - - - - - - - - 300,198 301,557 15,546 109 - - 1,278 - - - - - - - - - 65,102 66,489 17,153 148 - - 504 - - - - - - - - - 142,512 143,163 75,786 165 - - 968 - - - - - - - - - 114,533 115,666 94,566 725 - - 1,094 - - - - - - - - - 38,141 39,960
168,209 891 - - 2,203 - - - - - - - - - 86,877 89,971 242,504 1,620 - - 2,990 - - - - - - - - - 62,221 66,831 340,979 2,258 - - 5,099 - - - - - - - - - 62,221 69,579 96,915 3,163 - - 5,114 - - - - - - - - - 63,749 79,749
191,490 949 - - 4,764 - - - - - - - - - 62,221 67,934 283,920 1,788 - - 6,402 - - - - - - - - - 62,221 70,411
91,845 2,637 - - 7,293 - - - - - - - - - 63,325 73,256 166,725 867 - - 5,854 - - - - - - - - - 62,221 68,942 219,375 1,599 - - 5,347 - - - - - - - - - 62,221 69,168 83,070 2,041 - - 7,934 - - - - - - - - - (62,034) (52,059)
185,055 769 - - 10,355 - - - - - - - - - (63,131) (52,007) 308,880 1,795 - - 13,936 - - - - - - - - - (63,131) (47,400) 183,300 2,800 - - 18,583 - - - - - - - - - (61,395) (40,012) 376,740 1,800 - - 19,473 - - - - - - - - - (63,131) (41,858) 600,795 3,530 - - 22,216 - - - - - - - - - (63,131) (37,385) 397,605 5,642 - - 42,687 - - - - - - - - - (60,809) (12,480) 792,870 3,896 - - 42,124 - - - - - - - - - (63,131) (17,110)
1,176,240 7,403 - - 42,707 - - - - - - - - - (63,131) (13,021)
Prior Col 15+ Col 12- Col 13- Col 14
WP-SS-SLIII-2.xls
'SREC Inv.'wkshtCol 28
WP-SS-SLIII-2.xls
'SREC Inv.'wkshtCol 29
Included in Col 14
WP-SS-SLIII-2.xls
'Loans'wkshtCol 36
Prior Month Col 19 + Col 2
1/120 of Each Prior 120
Months of Col 2
(10 year amortization)
Prior Col 21+ Col 20
Col 19 - Col 21
See WP-SS-SLIII-1.xls'AmortE'
wksht
(Col 23- Col 20)
* Income Tax Rate
Prior Col 25 + Col 24
Col 22 - Col 25
(Prior Col 26 + Col 26) / 2
* Monthly Pre Tax WACC
Program Assumption
Col 3 - Col 4 - Col 5 - Col 6 + Col 7 +
Col 8 - Col 14 + Col 16 + Col 17 -Col 18 + Col 19 + Col 21 + Col 28 +
Col 29
- - - - - - - - - - - - - - - - - - - - - - - - - - - - - - 375,770 375,770
15,546 308 - - 6,389 - - - - - - - - - 1,328,996 1,335,693 219,375 16,811 - - 47,632 - - - - - - - - - 882,463 954,630
1,084,590 52,536 - - 337,276 - - - - - - - - - (746,158) (356,346)
34,778 - - 238,511 - - - - (375,257) (101,968)
ATTACHMENT B
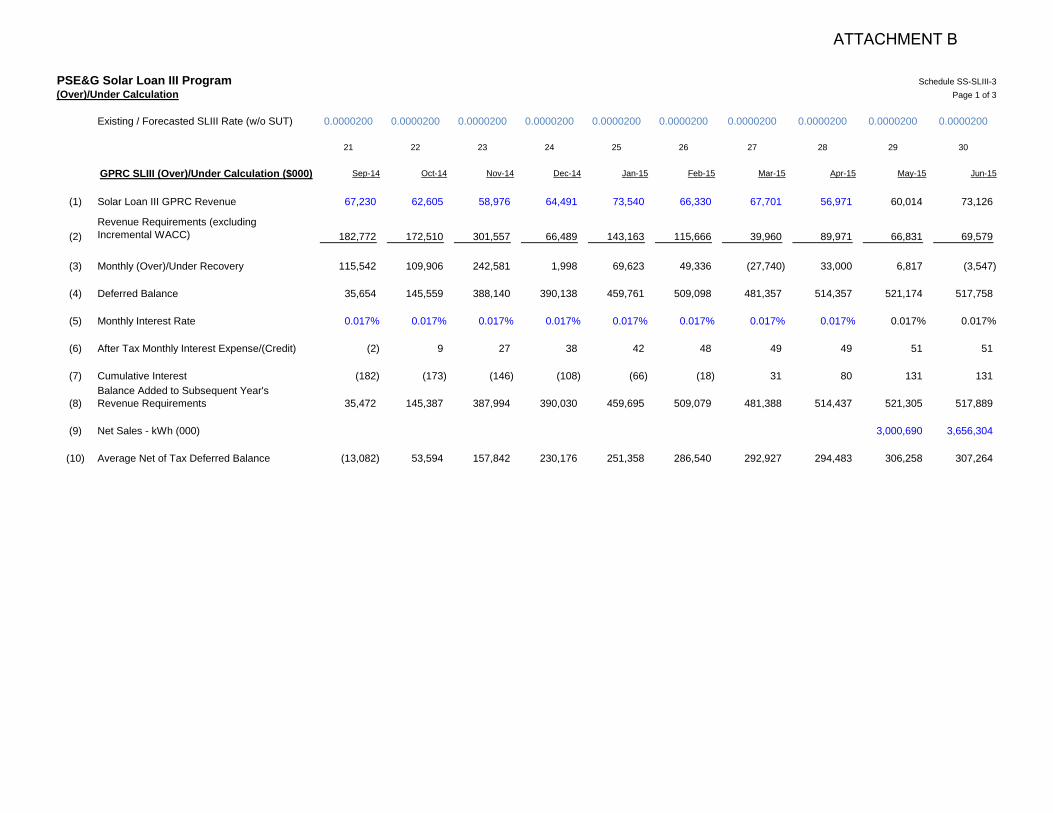
PSE&G Solar Loan III Program Schedule SS-SLIII-3(Over)/Under Calculation Page 1 of 3
Existing / Forecasted SLIII Rate (w/o SUT) 0.0000200 0.0000200 0.0000200 0.0000200 0.0000200 0.0000200 0.0000200 0.0000200 0.0000200 0.0000200
21 22 23 24 25 26 27 28 29 30
GPRC SLIII (Over)/Under Calculation ($000) Sep-14 Oct-14 Nov-14 Dec-14 Jan-15 Feb-15 Mar-15 Apr-15 May-15 Jun-15
(1) Solar Loan III GPRC Revenue 67,230 62,605 58,976 64,491 73,540 66,330 67,701 56,971 60,014 73,126
(2)Revenue Requirements (excluding Incremental WACC) 182,772 172,510 301,557 66,489 143,163 115,666 39,960 89,971 66,831 69,579
(3) Monthly (Over)/Under Recovery 115,542 109,906 242,581 1,998 69,623 49,336 (27,740) 33,000 6,817 (3,547)
(4) Deferred Balance 35,654 145,559 388,140 390,138 459,761 509,098 481,357 514,357 521,174 517,758
(5) Monthly Interest Rate 0.017% 0.017% 0.017% 0.017% 0.017% 0.017% 0.017% 0.017% 0.017% 0.017%
(6) After Tax Monthly Interest Expense/(Credit) (2) 9 27 38 42 48 49 49 51 51
(7) Cumulative Interest (182) (173) (146) (108) (66) (18) 31 80 131 131
(8)Balance Added to Subsequent Year's Revenue Requirements 35,472 145,387 387,994 390,030 459,695 509,079 481,388 514,437 521,305 517,889
(9) Net Sales - kWh (000) 3,000,690 3,656,304
(10) Average Net of Tax Deferred Balance (13,082) 53,594 157,842 230,176 251,358 286,540 292,927 294,483 306,258 307,264
ATTACHMENT B
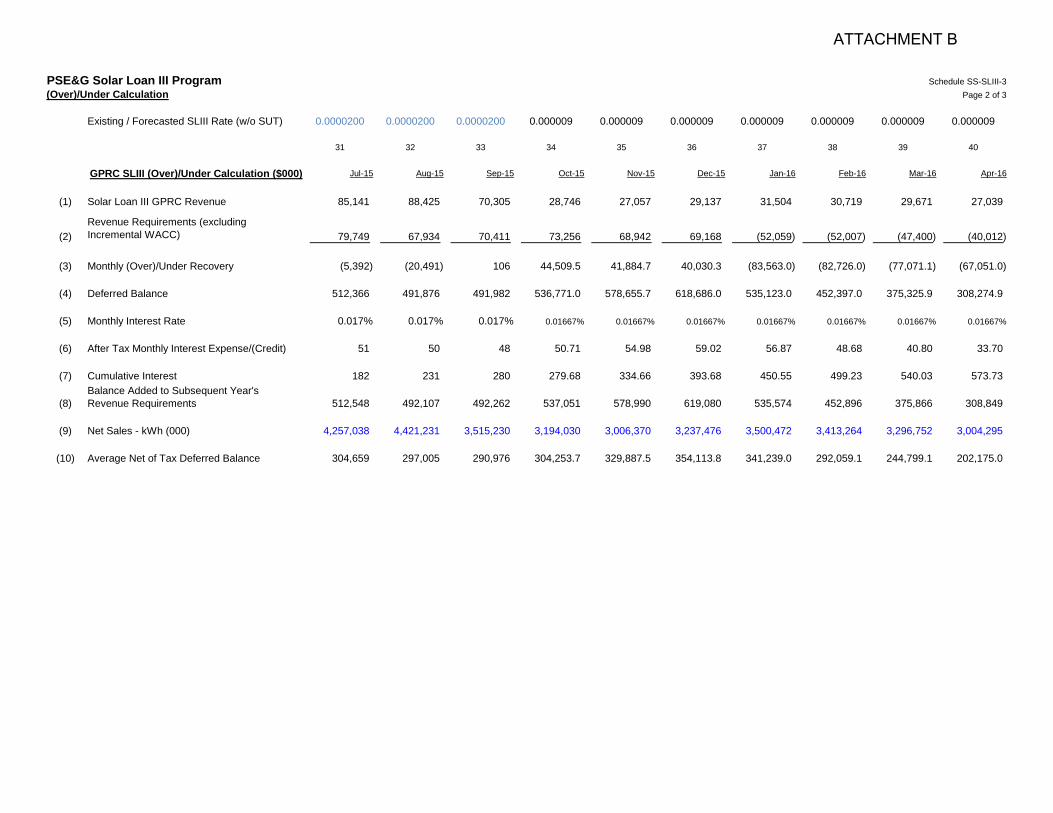
PSE&G Solar Loan III Program(Over)/Under Calculation
Existing / Forecasted SLIII Rate (w/o SUT)
GPRC SLIII (Over)/Under Calculation ($000)
(1) Solar Loan III GPRC Revenue
(2)Revenue Requirements (excluding Incremental WACC)
(3) Monthly (Over)/Under Recovery
(4) Deferred Balance
(5) Monthly Interest Rate
(6) After Tax Monthly Interest Expense/(Credit)
(7) Cumulative Interest
(8)Balance Added to Subsequent Year's Revenue Requirements
(9) Net Sales - kWh (000)
(10) Average Net of Tax Deferred Balance
Schedule SS-SLIII-3Page 2 of 3
0.0000200 0.0000200 0.0000200 0.000009 0.000009 0.000009 0.000009 0.000009 0.000009 0.000009
31 32 33 34 35 36 37 38 39 40
Jul-15 Aug-15 Sep-15 Oct-15 Nov-15 Dec-15 Jan-16 Feb-16 Mar-16 Apr-16
85,141 88,425 70,305 28,746 27,057 29,137 31,504 30,719 29,671 27,039
79,749 67,934 70,411 73,256 68,942 69,168 (52,059) (52,007) (47,400) (40,012)
(5,392) (20,491) 106 44,509.5 41,884.7 40,030.3 (83,563.0) (82,726.0) (77,071.1) (67,051.0)
512,366 491,876 491,982 536,771.0 578,655.7 618,686.0 535,123.0 452,397.0 375,325.9 308,274.9
0.017% 0.017% 0.017% 0.01667% 0.01667% 0.01667% 0.01667% 0.01667% 0.01667% 0.01667%
51 50 48 50.71 54.98 59.02 56.87 48.68 40.80 33.70
182 231 280 279.68 334.66 393.68 450.55 499.23 540.03 573.73
512,548 492,107 492,262 537,051 578,990 619,080 535,574 452,896 375,866 308,849
4,257,038 4,421,231 3,515,230 3,194,030 3,006,370 3,237,476 3,500,472 3,413,264 3,296,752 3,004,295
304,659 297,005 290,976 304,253.7 329,887.5 354,113.8 341,239.0 292,059.1 244,799.1 202,175.0
ATTACHMENT B
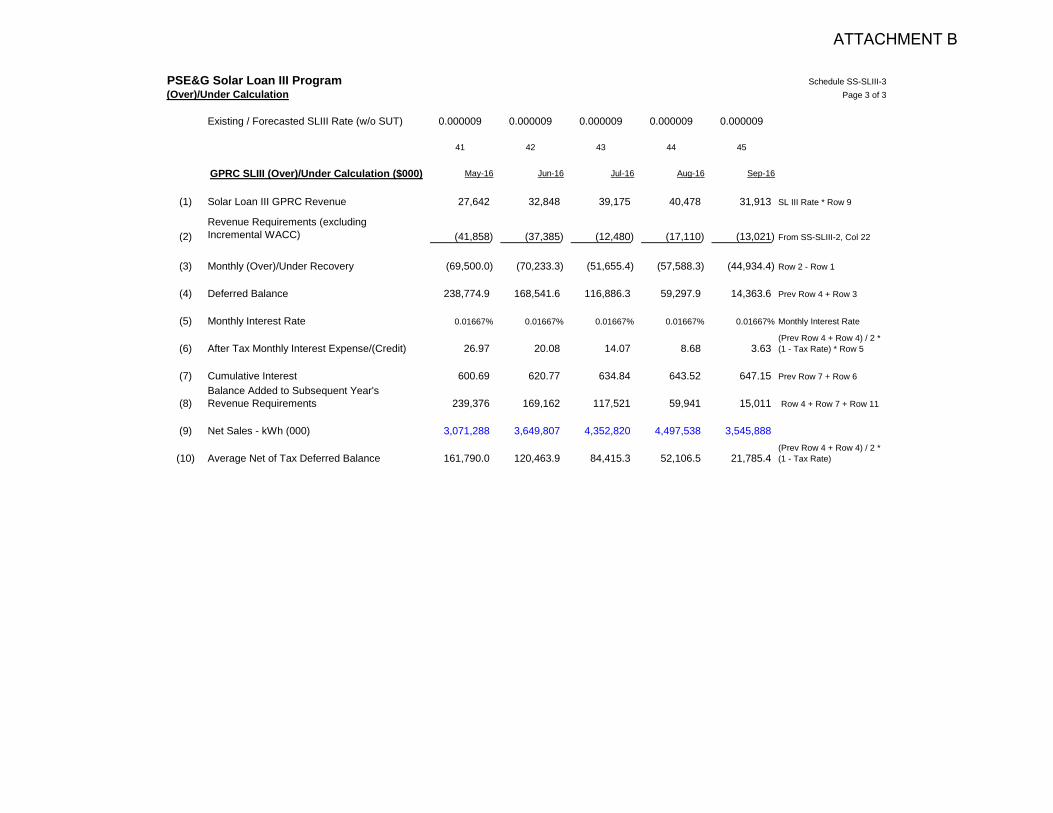
PSE&G Solar Loan III Program(Over)/Under Calculation
Existing / Forecasted SLIII Rate (w/o SUT)
GPRC SLIII (Over)/Under Calculation ($000)
(1) Solar Loan III GPRC Revenue
(2)Revenue Requirements (excluding Incremental WACC)
(3) Monthly (Over)/Under Recovery
(4) Deferred Balance
(5) Monthly Interest Rate
(6) After Tax Monthly Interest Expense/(Credit)
(7) Cumulative Interest
(8)Balance Added to Subsequent Year's Revenue Requirements
(9) Net Sales - kWh (000)
(10) Average Net of Tax Deferred Balance
Schedule SS-SLIII-3Page 3 of 3
0.000009 0.000009 0.000009 0.000009 0.000009
41 42 43 44 45
May-16 Jun-16 Jul-16 Aug-16 Sep-16
27,642 32,848 39,175 40,478 31,913 SL III Rate * Row 9
(41,858) (37,385) (12,480) (17,110) (13,021) From SS-SLIII-2, Col 22
(69,500.0) (70,233.3) (51,655.4) (57,588.3) (44,934.4) Row 2 - Row 1
238,774.9 168,541.6 116,886.3 59,297.9 14,363.6 Prev Row 4 + Row 3
0.01667% 0.01667% 0.01667% 0.01667% 0.01667% Monthly Interest Rate
26.97 20.08 14.07 8.68 3.63 (Prev Row 4 + Row 4) / 2 *(1 - Tax Rate) * Row 5
600.69 620.77 634.84 643.52 647.15 Prev Row 7 + Row 6
239,376 169,162 117,521 59,941 15,011 Row 4 + Row 7 + Row 11
3,071,288 3,649,807 4,352,820 4,497,538 3,545,888
161,790.0 120,463.9 84,415.3 52,106.5 21,785.4 (Prev Row 4 + Row 4) / 2 *(1 - Tax Rate)
ATTACHMENT B
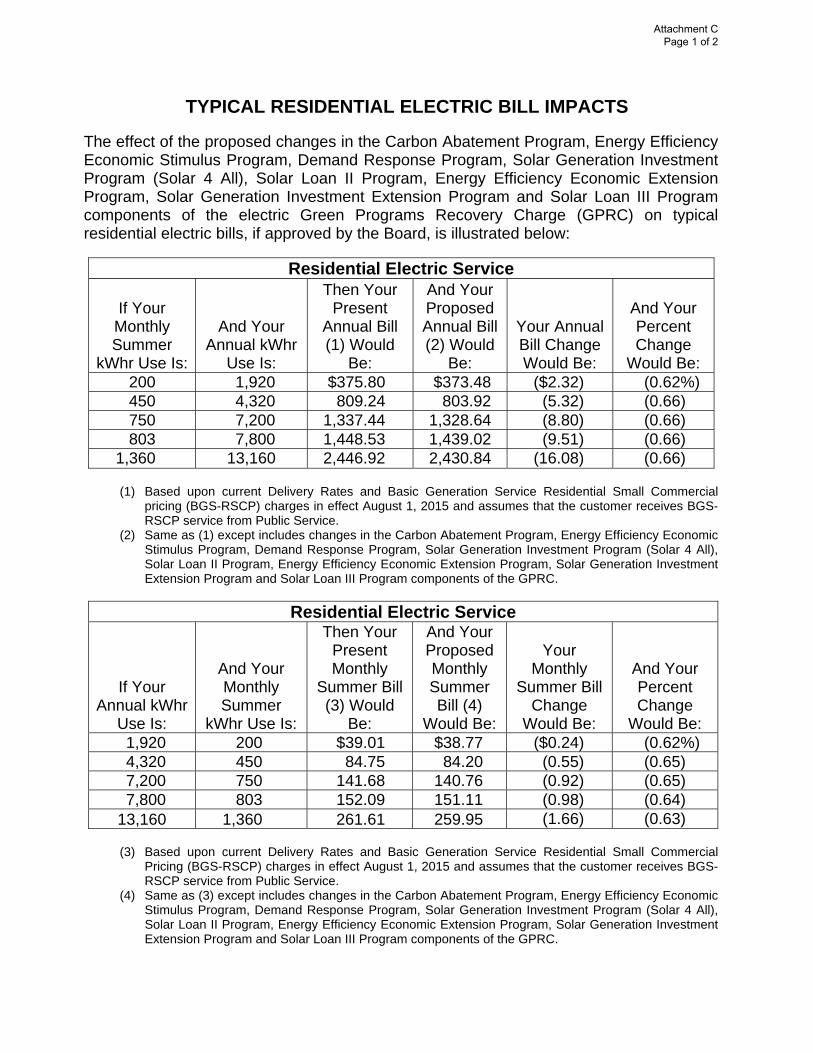
TYPICAL RESIDENTIAL ELECTRIC BILL IMPACTS
The effect of the proposed changes in the Carbon Abatement Program, Energy Efficiency Economic Stimulus Program, Demand Response Program, Solar Generation Investment Program (Solar 4 All), Solar Loan II Program, Energy Efficiency Economic Extension Program, Solar Generation Investment Extension Program and Solar Loan III Program components of the electric Green Programs Recovery Charge (GPRC) on typical residential electric bills, if approved by the Board, is illustrated below:
Residential Electric Service
If Your Monthly Summer
kWhr Use Is:
And Your Annual kWhr
Use Is:
Then Your Present
Annual Bill (1) Would
Be:
And Your Proposed Annual Bill (2) Would
Be:
Your Annual Bill Change Would Be:
And Your Percent Change
Would Be: 200 1,920 $375.80 $373.48 ($2.32) (0.62%) 450 4,320 809.24 803.92 (5.32) (0.66) 750 7,200 1,337.44 1,328.64 (8.80) (0.66) 803 7,800 1,448.53 1,439.02 (9.51) (0.66)
1,360 13,160 2,446.92 2,430.84 (16.08) (0.66) (1) Based upon current Delivery Rates and Basic Generation Service Residential Small Commercial
pricing (BGS-RSCP) charges in effect August 1, 2015 and assumes that the customer receives BGS-RSCP service from Public Service.
(2) Same as (1) except includes changes in the Carbon Abatement Program, Energy Efficiency Economic Stimulus Program, Demand Response Program, Solar Generation Investment Program (Solar 4 All), Solar Loan II Program, Energy Efficiency Economic Extension Program, Solar Generation Investment Extension Program and Solar Loan III Program components of the GPRC.
Residential Electric Service
If Your Annual kWhr
Use Is:
And Your Monthly Summer
kWhr Use Is:
Then Your Present Monthly
Summer Bill (3) Would
Be:
And Your Proposed Monthly Summer Bill (4)
Would Be:
Your Monthly
Summer Bill Change
Would Be:
And Your Percent Change
Would Be: 1,920 200 $39.01 $38.77 ($0.24) (0.62%) 4,320 450 84.75 84.20 (0.55) (0.65) 7,200 750 141.68 140.76 (0.92) (0.65) 7,800 803 152.09 151.11 (0.98) (0.64)
13,160 1,360 261.61 259.95 (1.66) (0.63) (3) Based upon current Delivery Rates and Basic Generation Service Residential Small Commercial
Pricing (BGS-RSCP) charges in effect August 1, 2015 and assumes that the customer receives BGS-RSCP service from Public Service.
(4) Same as (3) except includes changes in the Carbon Abatement Program, Energy Efficiency Economic Stimulus Program, Demand Response Program, Solar Generation Investment Program (Solar 4 All), Solar Loan II Program, Energy Efficiency Economic Extension Program, Solar Generation Investment Extension Program and Solar Loan III Program components of the GPRC.
Attachment C Page 1 of 2
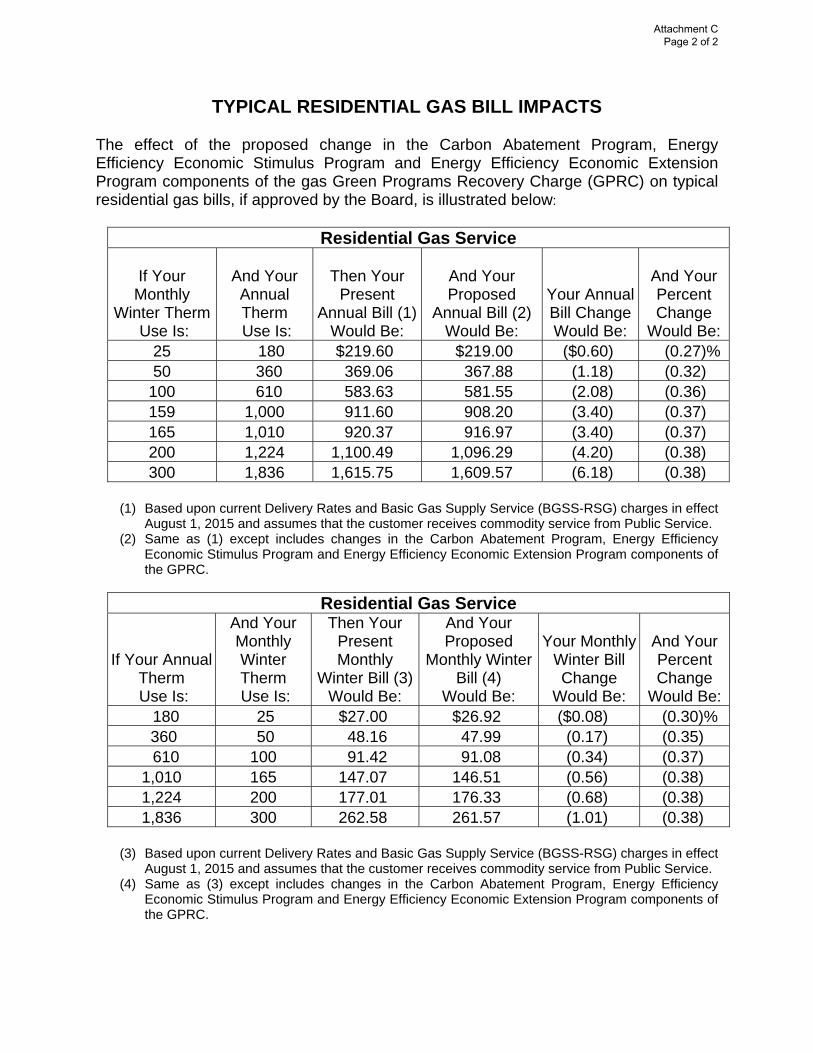
TYPICAL RESIDENTIAL GAS BILL IMPACTS The effect of the proposed change in the Carbon Abatement Program, Energy Efficiency Economic Stimulus Program and Energy Efficiency Economic Extension Program components of the gas Green Programs Recovery Charge (GPRC) on typical residential gas bills, if approved by the Board, is illustrated below:
Residential Gas Service
If Your Monthly
Winter Therm Use Is:
And Your Annual Therm Use Is:
Then Your Present
Annual Bill (1) Would Be:
And Your Proposed
Annual Bill (2) Would Be:
Your Annual Bill Change Would Be:
And Your Percent Change
Would Be:25 180 $219.60 $219.00 ($0.60) (0.27)%50 360 369.06 367.88 (1.18) (0.32)
100 610 583.63 581.55 (2.08) (0.36) 159 1,000 911.60 908.20 (3.40) (0.37) 165 1,010 920.37 916.97 (3.40) (0.37) 200 1,224 1,100.49 1,096.29 (4.20) (0.38) 300 1,836 1,615.75 1,609.57 (6.18) (0.38)
(1) Based upon current Delivery Rates and Basic Gas Supply Service (BGSS-RSG) charges in effect
August 1, 2015 and assumes that the customer receives commodity service from Public Service. (2) Same as (1) except includes changes in the Carbon Abatement Program, Energy Efficiency
Economic Stimulus Program and Energy Efficiency Economic Extension Program components of the GPRC.
Residential Gas Service
If Your Annual Therm Use Is:
And Your Monthly Winter Therm Use Is:
Then Your Present Monthly
Winter Bill (3) Would Be:
And Your Proposed
Monthly Winter Bill (4)
Would Be:
Your Monthly Winter Bill Change
Would Be:
And Your Percent Change
Would Be: 180 25 $27.00 $26.92 ($0.08) (0.30)% 360 50 48.16 47.99 (0.17) (0.35) 610 100 91.42 91.08 (0.34) (0.37) 1,010 165 147.07 146.51 (0.56) (0.38) 1,224 200 177.01 176.33 (0.68) (0.38) 1,836 300 262.58 261.57 (1.01) (0.38)
(3) Based upon current Delivery Rates and Basic Gas Supply Service (BGSS-RSG) charges in effect August 1, 2015 and assumes that the customer receives commodity service from Public Service.
(4) Same as (3) except includes changes in the Carbon Abatement Program, Energy Efficiency Economic Stimulus Program and Energy Efficiency Economic Extension Program components of the GPRC.
Attachment C Page 2 of 2