Embed Size (px)
Citation preview

STATE OF MICHIGAN
Department of State Police and
Department of Technology, Management and Budget
2019 Model Year Police Vehicle Evaluation Program
Published by: Michigan State Police Precision Driving Unit
November 2018
TABLE OF CONTENTS
Preface .............................................................................................................................................................. 1 General Information ........................................................................................................................................... 2 Evaluation Information ....................................................................................................................................... 3 Pursuit Rating ………………………………………………………………………………………………………….. 4 Acknowledgements ........................................................................................................................................... 5 Test Equipment.................................................................................................................................................. 6 Police Package Vehicle Descriptions Police Package Vehicle Photographs & Descriptions .................................................................................. ….7-31 Vehicle Dynamics Testing Vehicle Dynamics Testing Objective & Methodology…… ............................................................................... .33 Test Facility Diagram ....................................................................................................................................... .33 Vehicle Dynamics Testing Schedule ............................................................................................................... .34 Vehicle Dynamics Test Data ...................................................................................................................... …..35-36 Vehicle Dynamics Test Comparison Chart ...................................................................................................... .37 Acceleration and Top Speed Testing Acceleration and Top Speed Testing Objectives & Methodology .................................................................... 39 Test Facility Diagram ........................................................................................................................................ 40 Acceleration and Top Speed Data............................................................................................................... ….41-44 Summary of Acceleration and Top Speed ................................................................................................... ….45-47 Acceleration and Top Speed Test Data Comparison Charts ...................................................................... ….48-51 Brake Testing Brake Testing Objectives & Methodology ........................................................................................................ 53 Brake Testing Data ...................................................................................................................................... ….55-66 Brake Testing Data Comparison Chart... ......................................................................................................... 67 Ergonomics and Communications Evaluation Ergonomics and Communications Evaluation Objectives & Methodology ....................................................... 69 Ergonomics and Communications Evaluation Test Data ........................................................................... … 69-70 Fuel Economy Test Data Comparison Chart ............................................................................................................................ 71 Police Motorcycle Descriptions Motorcycle Introduction .................................................................................................................................... 73 Police Motorcycle Photographs & Descriptions ........................................................................................... ….76-89 Motorcycle Dynamics Testing Motorcycle Dynamics Testing Objective & Methodology ................................................................................. 91 Motorcycle Dynamics Testing Schedule …………………………………………………………………………… 91 Motorcycle Dynamics Test Data ....................................................................................................................... 92 Motorcycle Dynamics Comparison Chart ......................................................................................................... 93 Motorcycle Acceleration and Top Speed Testing Motorcycle Acceleration and Top Speed Testing Objectives & Methodology …………………………………. 95 Motorcycle Acceleration and Top Speed Data ............................................................................................ … 96-98 Summary of Motorcycle Acceleration and Top Speed ..................................................................................... 99 Motorcycle Acceleration and Top Speed Comparison Charts ................................................................ …… 100-103 Motorcycle Brake Testing Motorcycle Brake Testing Objectives & Methodology ..................................................................................... 105 Motorcycle Brake Testing Data ................................................................................................................ ……106-112 Motorcycle Brake Testing Data Comparison Chart ......................................................................................... 113 About the National Institute of Justice ................................................................................................. ……115-116
1
PREFACE
The Michigan State Police Vehicle Test Team is pleased to announce the results of the 2019 Model Year Police Vehicle Evaluation. This year we tested twelve patrol vehicles and seven police motorcycles. We appreciate your continued support and encouragement. The vehicles evaluated this year included the following:
POLICE CATEGORY Chevrolet Tahoe 5.3L RWD Chevrolet Tahoe 5.3L 4WD Dodge Charger 3.6L RWD Dodge Charger 5.7L AWD Dodge Charger 5.7L RWD
Dodge Durango Pursuit 3.6L Dodge Durango Pursuit 5.7L
Ford Police Interceptor Utility Hybrid AWD Ford Police Interceptor Utility 3.0L EcoBoost AWD
Ford Police Interceptor Utility 3.3L AWD Ford F150 Police Responder 3.5L EcoBoost
Ford Police Responder Hybrid Sedan
MOTORCYCLES BMW R 1250 RT-P BMW F 750 GS-P BMW F 850 GS-P
Harley-Davidson FLHTP Harley-Davidson FLHP Stage 1
Harley-Davidson FLHTP Stage 2 Yamaha FJR1300AP
2
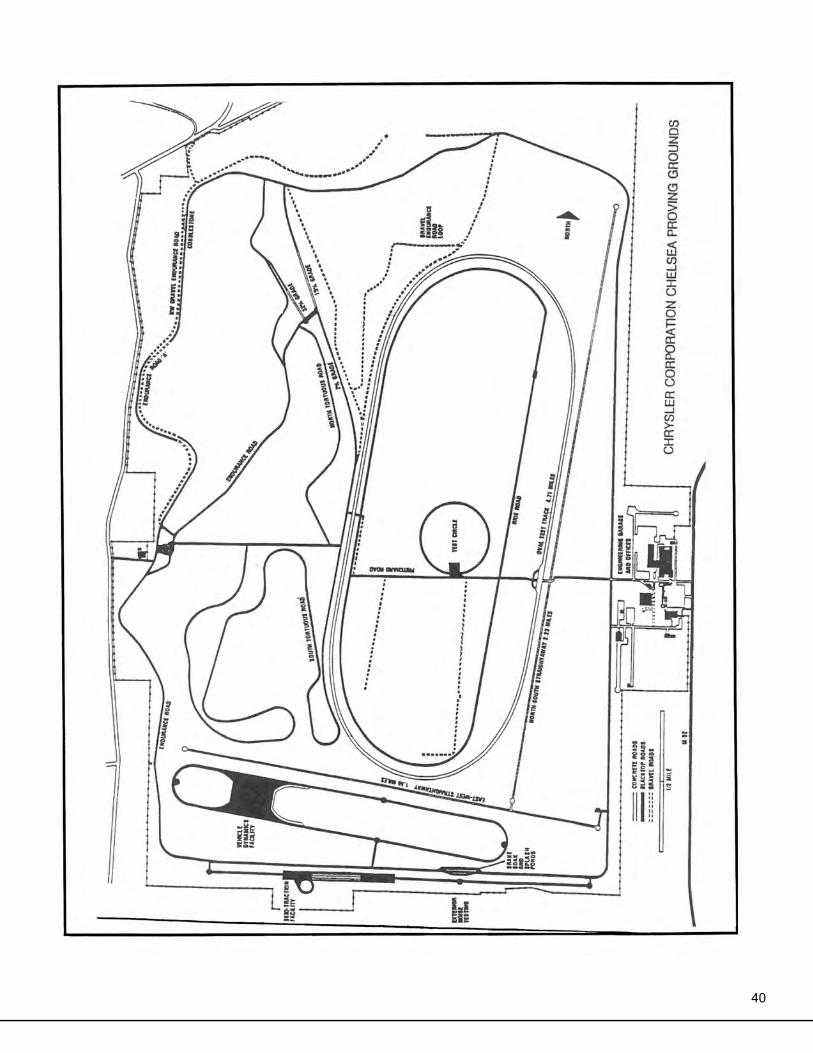
GENERAL INFORMATION All the patrol vehicles were tested with a clean roof (no overhead light or light bar) and without “A” pillar mount spotlights. We believe this is the best way to ensure all the vehicles are tested on an equal basis. Remember that once overhead lights, spotlights, radio antennas, sirens, and other emergency equipment are installed, overall performance may be somewhat lower than we report. Each vehicle was tested with the tires that are available as original equipment on the production model. Specific tire information for each vehicle is available in the Vehicle Description portion of this report. All vehicles listed in this report were equipped with electronic speed limiters unless otherwise noted, or with the exception of certain motorcycles. Motorcycles were tested with equipment installed as provided by their respective manufacturer. Harley-Davidson and Yamaha chose to test their bikes with minimal equipment. BMW chose to test their bikes with the majority of the equipment installed. The manufacturers were allowed to submit a one-half page highlight of their vehicle. These highlights will be included with the vehicle description and photograph. This information is direct from the manufacturer and is not an opinion or endorsement from the Michigan State Police. It is only an attempt to give the consumer the most information about the vehicle. Chelsea Proving Grounds - Acceleration, Top Speed, & Braking Tests Acceleration and Top Speed tests were performed at the Chelsea Proving Grounds. This 4.7-mile 140 mph neutral steer banked oval provides ample space to obtain accurate test results in these areas. The Brake test is also performed at the Chelsea Proving Grounds, utilizing lanes one and two on the straightaway on the eastside of the oval. We would like to thank Mr. Greg Spicher and Mr. Craig Latta for the assistance we received from the staff at the Chelsea Proving Grounds. Grattan Raceway - Motorcycle Dynamics Test Motorcycle Dynamics testing was performed at Grattan Raceway. This two-mile road course provides a taxing environment to test motorcycles in dynamics and continues to produce comprehensive results regarding durability and performance. We appreciate the support we received from BMW, Harley-Davidson, and Yamaha during testing. This was the twelfth year of police motorcycle testing and we continue to get great feedback on this important component to the testing lineup.
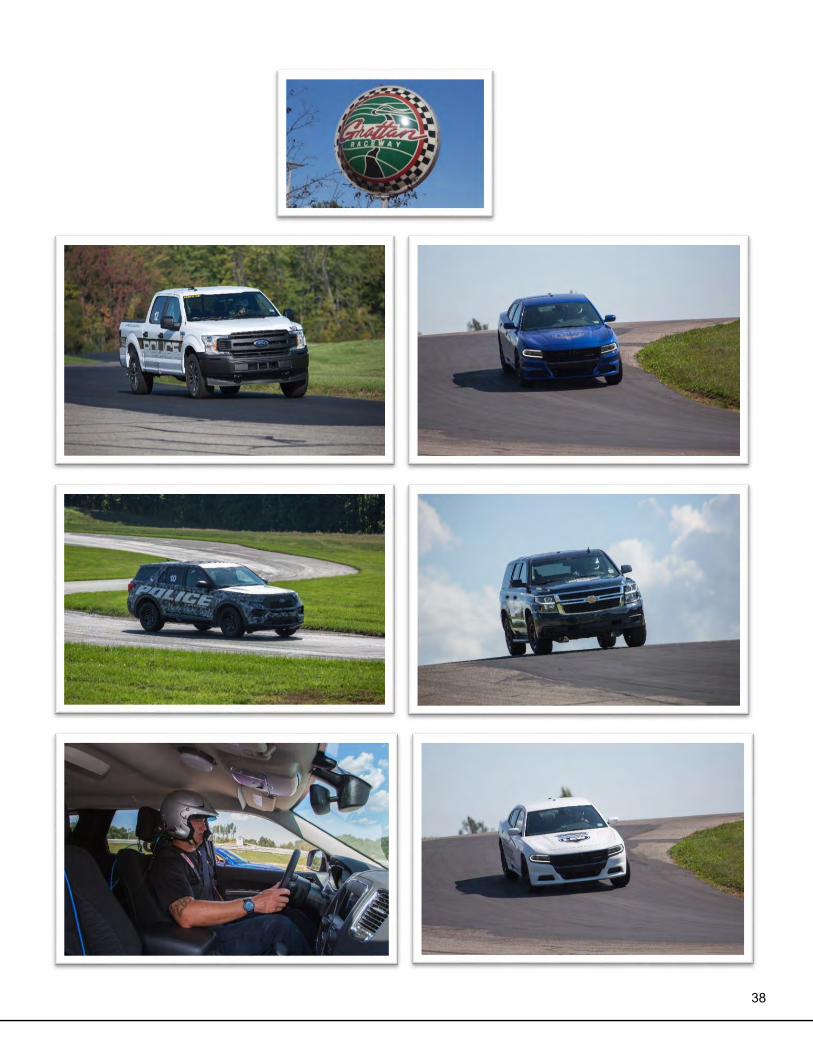
Grattan Raceway - Vehicle Dynamics Test Vehicle Dynamics testing was performed at Grattan Raceway. This two-mile road course provides a realistic environment to test vehicles in dynamics and continues to produce comprehensive results regarding durability and performance. We appreciate the support we received from Fiat Chrysler Automobiles (FCA), Ford Motor Company, and General Motors during testing.
3
EVALUATION INFORMATION Vehicle Dynamics Testing The Chevrolet Tahoe experienced transmission overheating during the vehicle dynamics testing. During the dynamics testing each vehicle is driven a total of 32 timed laps using four separate drivers, each driving an eight-lap series. The temperature on September 17, 2018, ranged from 70° Fahrenheit at 9 a.m. to 88° Fahrenheit at 3:30 p.m. Both the rear wheel drive and four-wheel drive Tahoes experienced partial power/protect mode issues in laps seven or eight on each run for each driver. This partial power mode limited the vehicles speed and caused the final lap times to increase substantially. General Motors (GM) engineers trouble shot the vehicles, and believed the reason was malfunctioning of the thermal bypass valves. These valves determine the flow of transmission fluid through the transmission oil cooler. Both the rear wheel drive and four-wheel drive Tahoes were retested on October 11, 2018, after having the thermal bypass valves replaced. The four-wheel drive Tahoe did not experience partial power during the retest. The rear wheel drive Tahoe experienced partial power on the last lap of the third and fourth runs. The temperature on October 11, 2018, remained 46° Fahrenheit throughout the testing. The Los Angeles County Sheriff’s Department (LASD) performed dynamics testing on both Tahoes on Thursday, October 25, 2018, in 84° Fahrenheit temperatures. The four-wheel drive Tahoe experienced the overheating and partial power mode conditions in the later laps of runs three and four. GM engineers have elected not to retest the vehicles at this time until they have isolated and corrected the root cause of the overheating condition. After the evaluation on October 25, 2018, the Tahoe four-wheel drive went through redevelopment with product improvements. On January 24, 2019, the Tahoe four-wheel drive was retested and successfully completed all 32 laps of the LASD dynamic course as well as the city pursuit course. Winter conditions at the Grattan Raceway preclude the MSP from any confirmatory testing of the success of the engineering changes. The MSP will accept LASD’s testing results as meeting our purchasing requirements. The GM Engineering team has done extensive developments to resolve this issue. GM has no known incidents of the transmission over temperature issue as a result of insufficient transmission cooling capacity. Recognizing the importance of the testing, GM is continuously working to improve performance in its vehicles to better serve law enforcement needs. If your vehicle experiences this condition, please contact your GM Fleet Service Representative.
Motorcycle Brake Testing While performing brake testing on both the BMW F750 GS-P and the BMW F850 GS-P the rear tire lost contact with the roadway on the majority of brake applications. In general, the rear tire lifted 8 to 12 inches causing the rider to modulate braking pressure rather than applying a true panic stop. On several occasions the rider had to release front brake pressure as the rear tire lifted high enough that the motorcycle was no longer stable.
Vehicle Testing History, Pursuit Ratings,
4
and Purchasing Specifications
The Michigan State Police (MSP) began testing patrol cars in the 1950s. At that time, quotations were requested from manufacturers and only the vehicle with the lowest quotation was tested to see if it met our purchasing requirements. Years later, the quotations received from manufacturers were only four dollars apart. At that point, the MSP decided to test all vehicles in order to select the best vehicle. The equipment used to measure speed and distance has evolved from tape measure to global positioning systems providing more accurate measurements, making the MSP vehicle testing an internationally recognized resource for law enforcement agencies. The term pursuit rated vehicle has recently been called into question as no one fully understands what this term represents. The term pursuit capable is more appropriate as there is no sanctioning body, or specific performance criteria, to determine if the vehicle meets a specialized designation. Each vehicle has been modified from a civilian vehicle to perform better under the rigors of police use. These vehicles are engineered to repetitively stop in a shorter distance, accelerate faster, and handle better than the base platform. Modifications to engines, cooling systems, transmissions and shifting parameters, brakes, tires, stability control programming, and other changes may all be included as part of the manufacturers police package. The manufacturers provide upcoming model year vehicles to both the MSP and Los Angeles County Sheriff’s Department to be tested for suitability in their respective operations. Historically, successful results at both test sites have validated the manufacturers’ engineering efforts in building a car capable of handling the stress associated with police pursuits. Neither the MSP, nor the Los Angeles County Sheriff’s Department, has the authority or credentials to award the term pursuit rated to any vehicle. The MSP has performance criteria attached to its purchasing specifications. The criteria has historically been that a vehicle must accelerate from 0 – 60 mph in 9.0 seconds, 0 – 80 mph in 14.9 seconds, and 0 – 100 mph in 24.6 seconds. The vehicle must reach 110 mph in 4,838 feet and 120 mph in 8,985 feet. The vehicle must maintain an average deceleration rate of 25.79 ft./sec2 while performing twenty 60 – 0 mph threshold braking stops. The vehicle must also successfully complete all 32 laps of the Grattan Raceway dynamics testing without major component failure. Meeting these criteria does not certify a vehicle as being pursuit rated, rather it justifies a vehicle is capable of performing the job function the MSP requires in a police vehicle. When reading the testing results in this book, it is up to each agency to determine if the vehicle is suitable for the mission of their agency.
We recommend you review the information contained in this report and then apply it to the needs of your agency. This report is not an endorsement of products, but a means of learning what’s available for your officers so they can do their job effectively and safely. If anything in this report requires further explanation or clarification, please call or write.
Lt. Michael McCarthy, Phone: 517-230-3184, email: mccarthym4@michigangov Sgt. Robert Schwalm, Phone: 517-331-7166, email: [email protected]
Sgt. Nicholas Darlington, Phone: 517-643-5019, email: [email protected] Sgt. Patrick Agema, Phone: 989-818-2214, email: [email protected]
Precision Driving Main Line: 517-636-0301 Michigan State Police, Precision Driving Unit, 7426 North Canal Road, Lansing, Michigan 48913
5
ACKNOWLEDGEMENTS
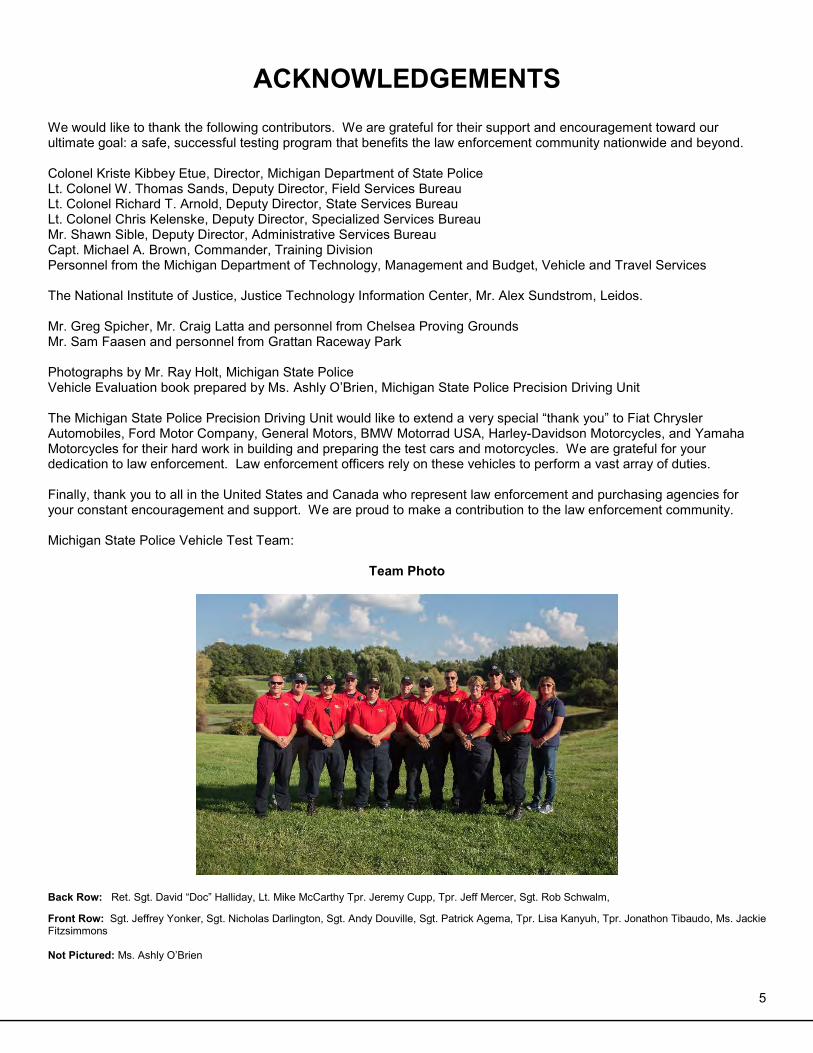
We would like to thank the following contributors. We are grateful for their support and encouragement toward our ultimate goal: a safe, successful testing program that benefits the law enforcement community nationwide and beyond. Colonel Kriste Kibbey Etue, Director, Michigan Department of State Police Lt. Colonel W. Thomas Sands, Deputy Director, Field Services Bureau Lt. Colonel Richard T. Arnold, Deputy Director, State Services Bureau Lt. Colonel Chris Kelenske, Deputy Director, Specialized Services Bureau Mr. Shawn Sible, Deputy Director, Administrative Services Bureau Capt. Michael A. Brown, Commander, Training Division Personnel from the Michigan Department of Technology, Management and Budget, Vehicle and Travel Services The National Institute of Justice, Justice Technology Information Center, Mr. Alex Sundstrom, Leidos. Mr. Greg Spicher, Mr. Craig Latta and personnel from Chelsea Proving Grounds Mr. Sam Faasen and personnel from Grattan Raceway Park Photographs by Mr. Ray Holt, Michigan State Police Vehicle Evaluation book prepared by Ms. Ashly O’Brien, Michigan State Police Precision Driving Unit The Michigan State Police Precision Driving Unit would like to extend a very special “thank you” to Fiat Chrysler Automobiles, Ford Motor Company, General Motors, BMW Motorrad USA, Harley-Davidson Motorcycles, and Yamaha Motorcycles for their hard work in building and preparing the test cars and motorcycles. We are grateful for your dedication to law enforcement. Law enforcement officers rely on these vehicles to perform a vast array of duties. Finally, thank you to all in the United States and Canada who represent law enforcement and purchasing agencies for your constant encouragement and support. We are proud to make a contribution to the law enforcement community. Michigan State Police Vehicle Test Team:
Team Photo
Back Row: Ret. Sgt. David “Doc” Halliday, Lt. Mike McCarthy Tpr. Jeremy Cupp, Tpr. Jeff Mercer, Sgt. Rob Schwalm, Front Row: Sgt. Jeffrey Yonker, Sgt. Nicholas Darlington, Sgt. Andy Douville, Sgt. Patrick Agema, Tpr. Lisa Kanyuh, Tpr. Jonathon Tibaudo, Ms. Jackie Fitzsimmons Not Pictured: Ms. Ashly O’Brien
6
TEST EQUIPMENT
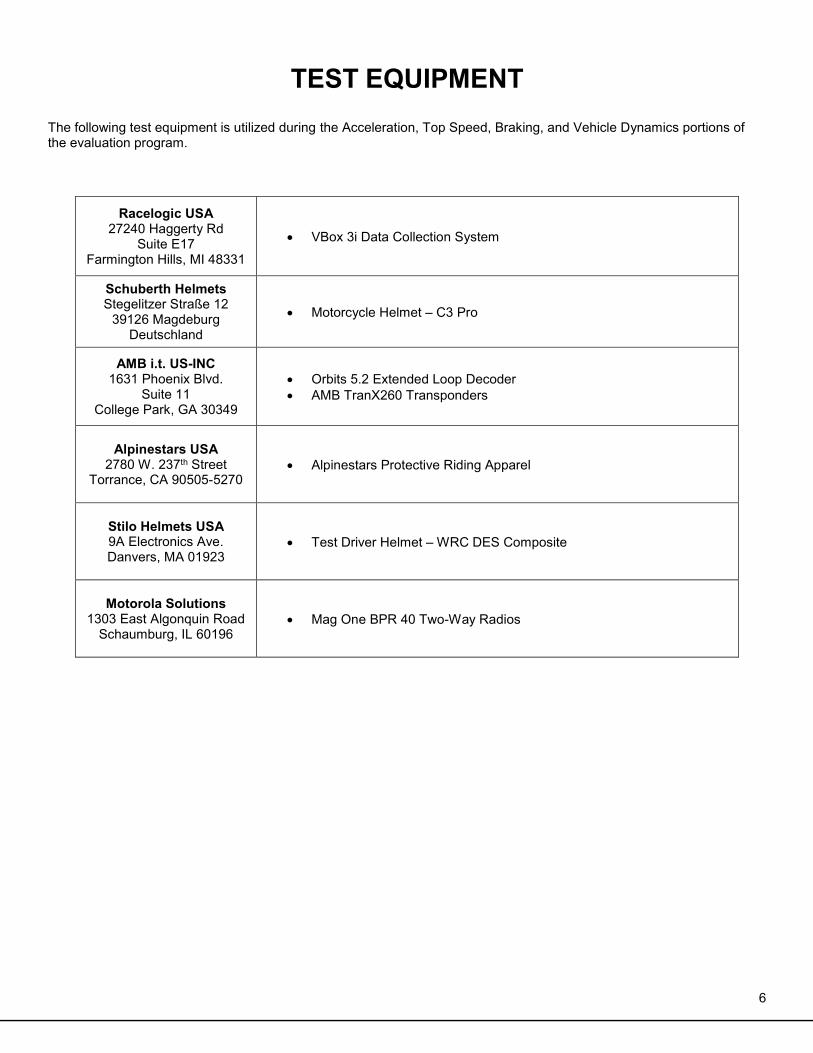
The following test equipment is utilized during the Acceleration, Top Speed, Braking, and Vehicle Dynamics portions of the evaluation program.
Racelogic USA 27240 Haggerty Rd
Suite E17 Farmington Hills, MI 48331
• VBox 3i Data Collection System
Schuberth Helmets Stegelitzer Straße 12
39126 Magdeburg Deutschland
• Motorcycle Helmet – C3 Pro
AMB i.t. US-INC 1631 Phoenix Blvd.
Suite 11 College Park, GA 30349
• Orbits 5.2 Extended Loop Decoder • AMB TranX260 Transponders
Alpinestars USA 2780 W. 237th Street
Torrance, CA 90505-5270 • Alpinestars Protective Riding Apparel
Stilo Helmets USA 9A Electronics Ave. Danvers, MA 01923
• Test Driver Helmet – WRC DES Composite
Motorola Solutions 1303 East Algonquin Road
Schaumburg, IL 60196 • Mag One BPR 40 Two-Way Radios
7
TEST VEHICLE DESCRIPTIONS AND PHOTOGRAPHS
8
9
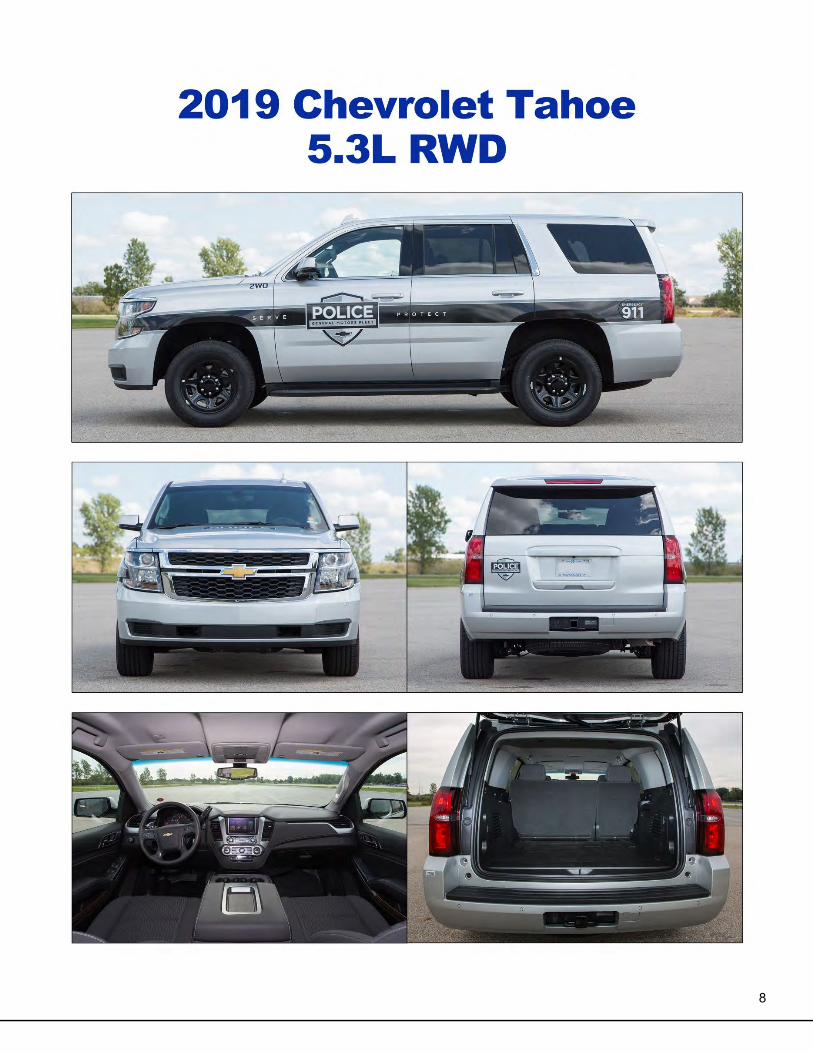
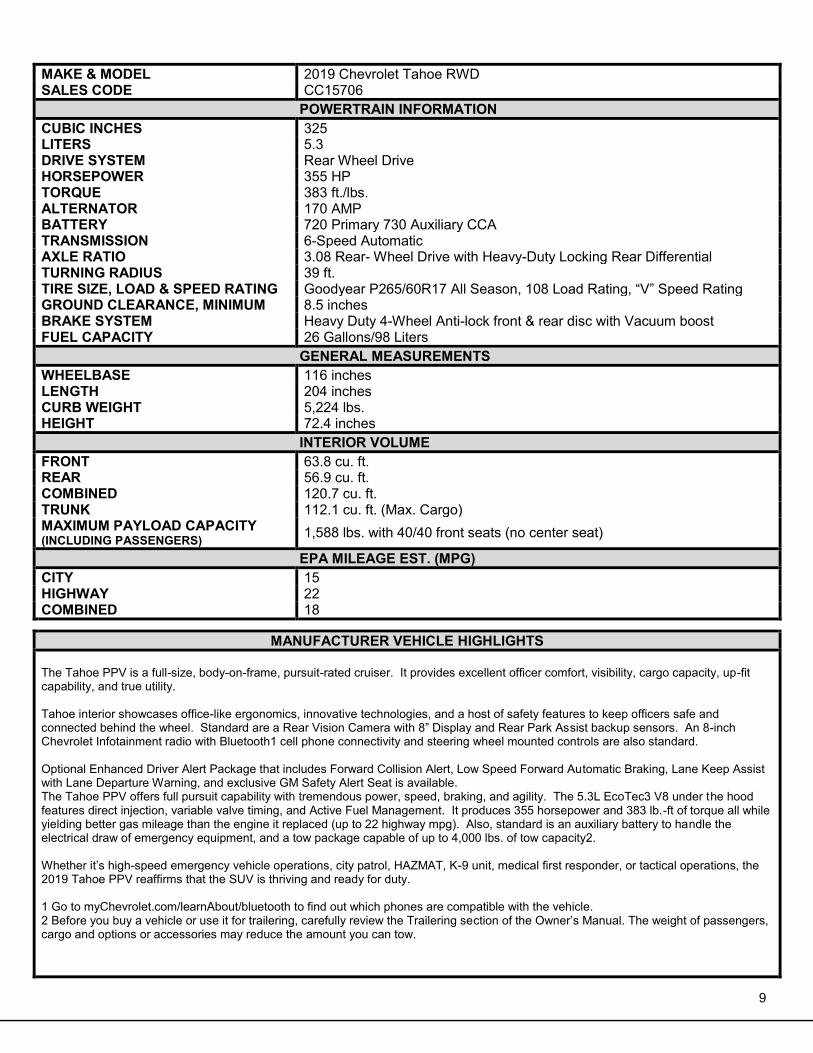
MAKE & MODEL 2019 Chevrolet Tahoe RWD SALES CODE CC15706
POWERTRAIN INFORMATION CUBIC INCHES 325 LITERS 5.3 DRIVE SYSTEM Rear Wheel Drive HORSEPOWER 355 HP TORQUE 383 ft./lbs. ALTERNATOR 170 AMP BATTERY 720 Primary 730 Auxiliary CCA TRANSMISSION 6-Speed Automatic AXLE RATIO 3.08 Rear- Wheel Drive with Heavy-Duty Locking Rear Differential TURNING RADIUS 39 ft. TIRE SIZE, LOAD & SPEED RATING Goodyear P265/60R17 All Season, 108 Load Rating, “V” Speed Rating GROUND CLEARANCE, MINIMUM 8.5 inches BRAKE SYSTEM Heavy Duty 4-Wheel Anti-lock front & rear disc with Vacuum boost FUEL CAPACITY 26 Gallons/98 Liters
GENERAL MEASUREMENTS WHEELBASE 116 inches LENGTH 204 inches CURB WEIGHT 5,224 lbs. HEIGHT 72.4 inches
INTERIOR VOLUME FRONT 63.8 cu. ft. REAR 56.9 cu. ft. COMBINED 120.7 cu. ft. TRUNK 112.1 cu. ft. (Max. Cargo) MAXIMUM PAYLOAD CAPACITY (INCLUDING PASSENGERS) 1,588 lbs. with 40/40 front seats (no center seat)
EPA MILEAGE EST. (MPG) CITY 15 HIGHWAY 22 COMBINED 18
MANUFACTURER VEHICLE HIGHLIGHTS The Tahoe PPV is a full-size, body-on-frame, pursuit-rated cruiser. It provides excellent officer comfort, visibility, cargo capacity, up-fit capability, and true utility. Tahoe interior showcases office-like ergonomics, innovative technologies, and a host of safety features to keep officers safe and connected behind the wheel. Standard are a Rear Vision Camera with 8” Display and Rear Park Assist backup sensors. An 8-inch Chevrolet Infotainment radio with Bluetooth1 cell phone connectivity and steering wheel mounted controls are also standard. Optional Enhanced Driver Alert Package that includes Forward Collision Alert, Low Speed Forward Automatic Braking, Lane Keep Assist with Lane Departure Warning, and exclusive GM Safety Alert Seat is available. The Tahoe PPV offers full pursuit capability with tremendous power, speed, braking, and agility. The 5.3L EcoTec3 V8 under the hood features direct injection, variable valve timing, and Active Fuel Management. It produces 355 horsepower and 383 lb.-ft of torque all while yielding better gas mileage than the engine it replaced (up to 22 highway mpg). Also, standard is an auxiliary battery to handle the electrical draw of emergency equipment, and a tow package capable of up to 4,000 lbs. of tow capacity2. Whether it’s high-speed emergency vehicle operations, city patrol, HAZMAT, K-9 unit, medical first responder, or tactical operations, the 2019 Tahoe PPV reaffirms that the SUV is thriving and ready for duty. 1 Go to myChevrolet.com/learnAbout/bluetooth to find out which phones are compatible with the vehicle. 2 Before you buy a vehicle or use it for trailering, carefully review the Trailering section of the Owner’s Manual. The weight of passengers, cargo and options or accessories may reduce the amount you can tow.
10
11
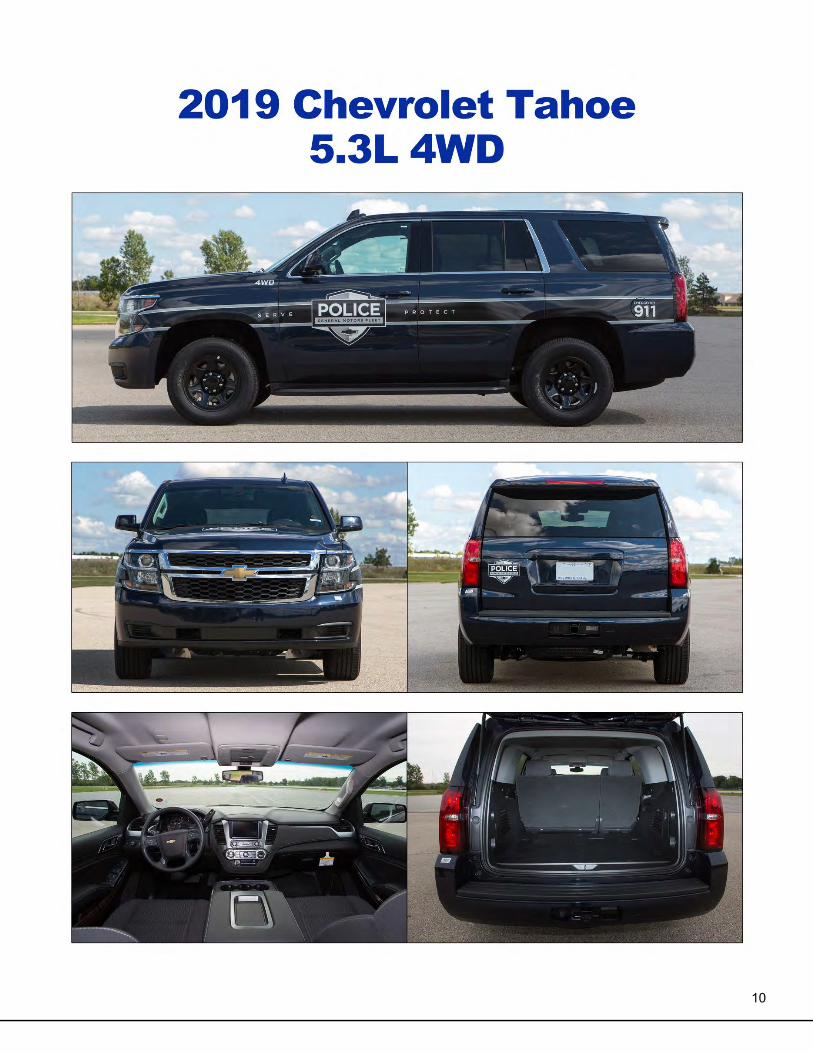
MAKE & MODEL 2019 Chevrolet Tahoe 5.3L 4WD SALES CODE CK15706
POWERTRAIN INFORMATION CUBIC INCHES 325 LITERS 5.3 DRIVE SYSTEM Four Wheel Drive HORSEPOWER 355 HP TORQUE 383 ft./lbs. ALTERNATOR 170 AMP BATTERY 720 Primary 730 Auxiliary CCA TRANSMISSION 6-Speed Automatic AXLE RATIO 3.08 Driver-Selectable 4-Wheel Drive with HD Locking Rear Differential TURNING RADIUS 39 ft. TIRE SIZE, LOAD & SPEED RATING Goodyear P265/60R17 All Season, 108 Load Rating, “V” Speed Rating GROUND CLEARANCE, MINIMUM 8.5 inches BRAKE SYSTEM Heavy Duty 4-Wheel Anti-lock front & rear disc with Vacuum boost FUEL CAPACITY 26 Gallons/98 Liters
GENERAL MEASUREMENTS WHEELBASE 116 inches LENGTH 204 inches CURB WEIGHT 5,442 lbs. HEIGHT 72.4 inches
INTERIOR VOLUME FRONT 68.3 cu. ft. REAR 56.9 cu. ft. COMBINED 120.7 cu. ft. TRUNK 112.1 cu. ft. (Max. Cargo) MAXIMUM PAYLOAD CAPACITY (INCLUDING PASSENGERS) 1,628 lbs. with 40/40 front seats (no center seat)
EPA MILEAGE EST. (MPG) CITY 14 HIGHWAY 21 COMBINED 16
MANUFACTURER VEHICLE HIGHLIGHTS The Tahoe PPV is a full-size, body-on-frame, pursuit-rated cruiser. It provides excellent officer comfort, visibility, cargo capacity, up-fit capability, and true utility. Tahoe interior showcases office-like ergonomics, innovative technologies, and a host of safety features to keep officers safe and connected behind the wheel. Standard are a Rear Vision Camera with 8” Display and Rear Park Assist backup sensors. An 8-inch Chevrolet Infotainment radio with Bluetooth1 cell phone connectivity and steering wheel mounted controls are also standard. Optional Enhanced Driver Alert Package that includes Forward Collision Alert, Low Speed Forward Automatic Braking, Lane Keep Assist with Lane Departure Warning and exclusive GM Safety Alert Seat is available. The Tahoe PPV offers full pursuit capability with tremendous power, speed, braking, and agility. The 5.3L EcoTec3 V8 under the hood features direct injection, variable valve timing, and Active Fuel Management. It produces 355 horsepower and 383 lb-ft of torque all while yielding better gas mileage than the engine it replaced (up to 22 highway mpg). Also, standard is an auxiliary battery to handle the electrical draw of emergency equipment, and a tow package capable of up to 4,000 lbs. of tow capacity2. Whether it’s high-speed emergency vehicle operations, city patrol, HAZMAT, K-9 unit, medical first responder, or tactical operations, the 2019 Tahoe PPV reaffirms that the SUV is thriving and ready for duty. 1 Go to myChevrolet.com/learnAbout/bluetooth to find out which phones are compatible with the vehicle. 2 Before you buy a vehicle or use it for trailering, carefully review the Trailering section of the Owner’s Manual. The weight of passengers, cargo and options or accessories may reduce the amount you can tow
12

13
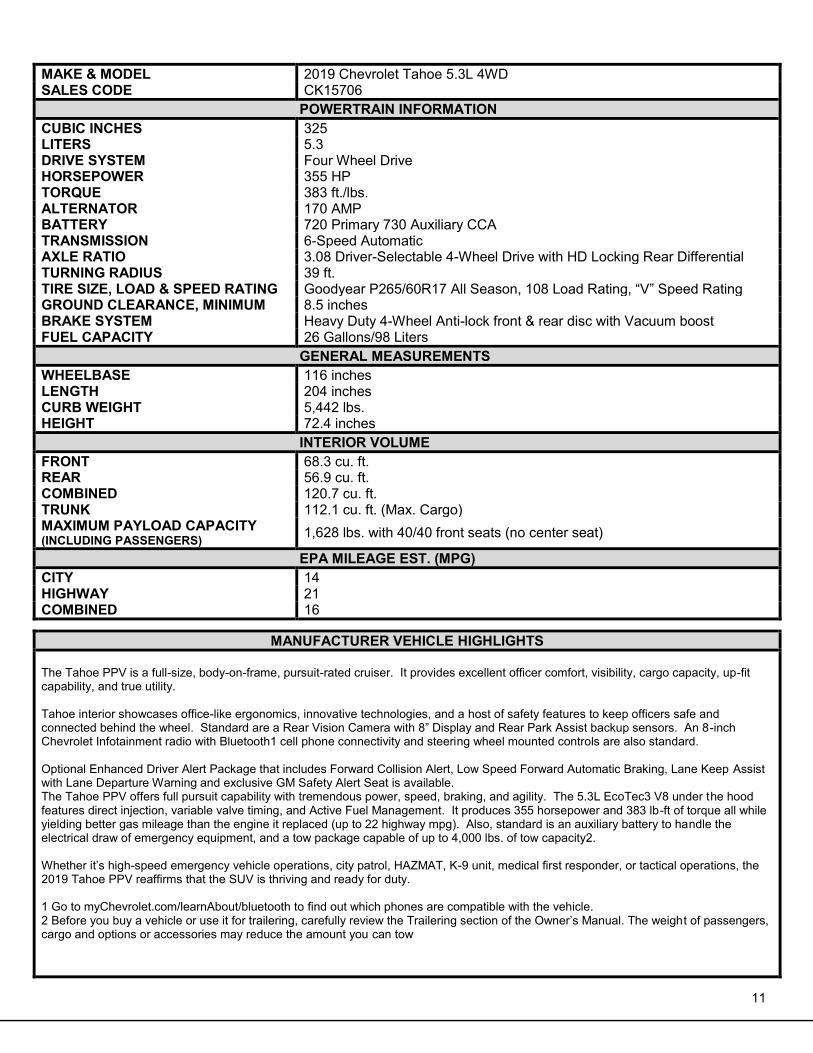
MAKE & MODEL 2019 Dodge Charger 3.6L RWD SALES CODE 27A, Z1B
POWERTRAIN INFORMATION CUBIC INCHES 220 LITERS 3.6 DRIVE SYSTEM Rear Wheel Drive HORSEPOWER 292 HP TORQUE 260 ft./lbs. ALTERNATOR 220 AMP BATTERY 800 CCA TRANSMISSION 5 Speed Electronic Automatic AXLE RATIO 2.62 TURNING RADIUS 37.7 ft. TIRE SIZE, LOAD & SPEED RATING P225/60/R18, 103V, Goodyear Eagle RSA GROUND CLEARANCE, MINIMUM 5.1 inches BRAKE SYSTEM Power, Dual Piston Front/Single Piston Rear, 4 Channel Anti-Lock FUEL CAPACITY 18.5 Gallons/70.03 Liters
GENERAL MEASUREMENTS WHEELBASE 120.2 inches LENGTH 198.4 inches CURB WEIGHT 4,019 lbs. HEIGHT 58.4 inches
INTERIOR VOLUME FRONT 55.6 cu. ft. REAR 49.2 cu. ft. COMBINED 104.7 cu. ft. TRUNK 16.5 cu. ft. MAXIMUM PAYLOAD CAPACITY (INCLUDING PASSENGERS) 1390 lbs.
EPA MILEAGE EST. (MPG) CITY 18 HIGHWAY 26 COMBINED 20
MANUFACTURER VEHICLE HIGHLIGHTS The 2019 Dodge Charger Pursuit comes with FCA’s exclusive, no-cost Officer Protection Package, which includes the Fleet Safety Group. This package is designed to provide officers with rear vision and enhanced officer safety when parked and working inside their vehicle. When activated, the rear-facing camera and sensors detect movement behind the vehicle. When motion is detected, images automatically appear on the vehicle’s Uconnect touchscreen - and any or all of the following can be programmed to occur: alert chimes sound, reverse lights and tail lamps flash, windows roll up and all doors lock. The available Uconnect 12.1-inch display integrates law enforcement systems and innovative technology to improve safety and occupant space. New for 2019:
• Greater range of screen brightness settings to better accommodate individual officer preferences • Usable area on Uconnect 12.1-inch touchscreen has been increased to 97 percent (from 87 percent) • New USB connectivity increases tracking and input speed for keyboard and mouse
The 2019 Dodge Charger Pursuit features a Pentastar® V6 engine with Decel Fuel Shut-Off feature that provides a unique balance of pursuit-rated performance and V6 efficiency, including Flex-Fuel capability. Pursuit package upgrades include performance-tuned suspension, load-leveling shocks and heavy-duty brakes. Additional officer-focused upgrades include specially developed seats to accommodate belt-mounted gear, a steering wheel with auxiliary buttons for controlling police equipment and an I/P-mounted gear shifter that frees up the center console for police-specific controls.
14
15
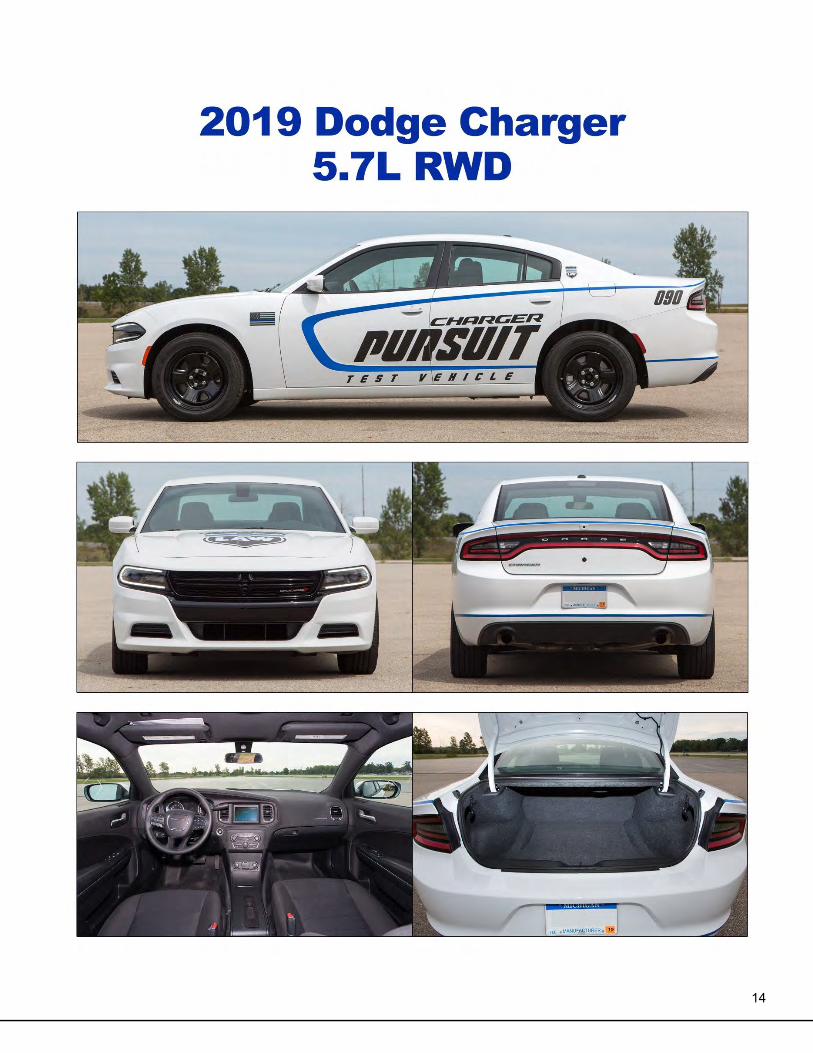
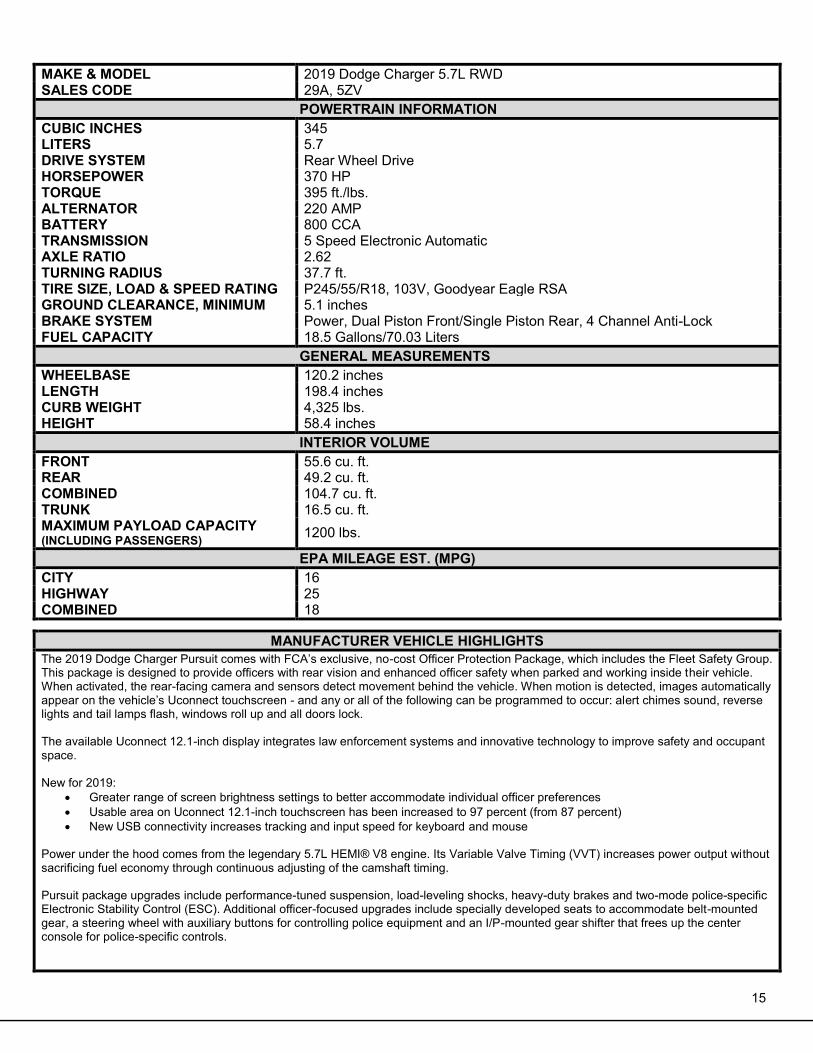
MAKE & MODEL 2019 Dodge Charger 5.7L RWD SALES CODE 29A, 5ZV
POWERTRAIN INFORMATION CUBIC INCHES 345 LITERS 5.7 DRIVE SYSTEM Rear Wheel Drive HORSEPOWER 370 HP TORQUE 395 ft./lbs. ALTERNATOR 220 AMP BATTERY 800 CCA TRANSMISSION 5 Speed Electronic Automatic AXLE RATIO 2.62 TURNING RADIUS 37.7 ft. TIRE SIZE, LOAD & SPEED RATING P245/55/R18, 103V, Goodyear Eagle RSA GROUND CLEARANCE, MINIMUM 5.1 inches BRAKE SYSTEM Power, Dual Piston Front/Single Piston Rear, 4 Channel Anti-Lock FUEL CAPACITY 18.5 Gallons/70.03 Liters
GENERAL MEASUREMENTS WHEELBASE 120.2 inches LENGTH 198.4 inches CURB WEIGHT 4,325 lbs. HEIGHT 58.4 inches
INTERIOR VOLUME FRONT 55.6 cu. ft. REAR 49.2 cu. ft. COMBINED 104.7 cu. ft. TRUNK 16.5 cu. ft. MAXIMUM PAYLOAD CAPACITY (INCLUDING PASSENGERS) 1200 lbs.
EPA MILEAGE EST. (MPG) CITY 16 HIGHWAY 25 COMBINED 18
MANUFACTURER VEHICLE HIGHLIGHTS The 2019 Dodge Charger Pursuit comes with FCA’s exclusive, no-cost Officer Protection Package, which includes the Fleet Safety Group. This package is designed to provide officers with rear vision and enhanced officer safety when parked and working inside their vehicle. When activated, the rear-facing camera and sensors detect movement behind the vehicle. When motion is detected, images automatically appear on the vehicle’s Uconnect touchscreen - and any or all of the following can be programmed to occur: alert chimes sound, reverse lights and tail lamps flash, windows roll up and all doors lock. The available Uconnect 12.1-inch display integrates law enforcement systems and innovative technology to improve safety and occupant space. New for 2019:
• Greater range of screen brightness settings to better accommodate individual officer preferences • Usable area on Uconnect 12.1-inch touchscreen has been increased to 97 percent (from 87 percent) • New USB connectivity increases tracking and input speed for keyboard and mouse
Power under the hood comes from the legendary 5.7L HEMI® V8 engine. Its Variable Valve Timing (VVT) increases power output without sacrificing fuel economy through continuous adjusting of the camshaft timing. Pursuit package upgrades include performance-tuned suspension, load-leveling shocks, heavy-duty brakes and two-mode police-specific Electronic Stability Control (ESC). Additional officer-focused upgrades include specially developed seats to accommodate belt-mounted gear, a steering wheel with auxiliary buttons for controlling police equipment and an I/P-mounted gear shifter that frees up the center console for police-specific controls.
16
17
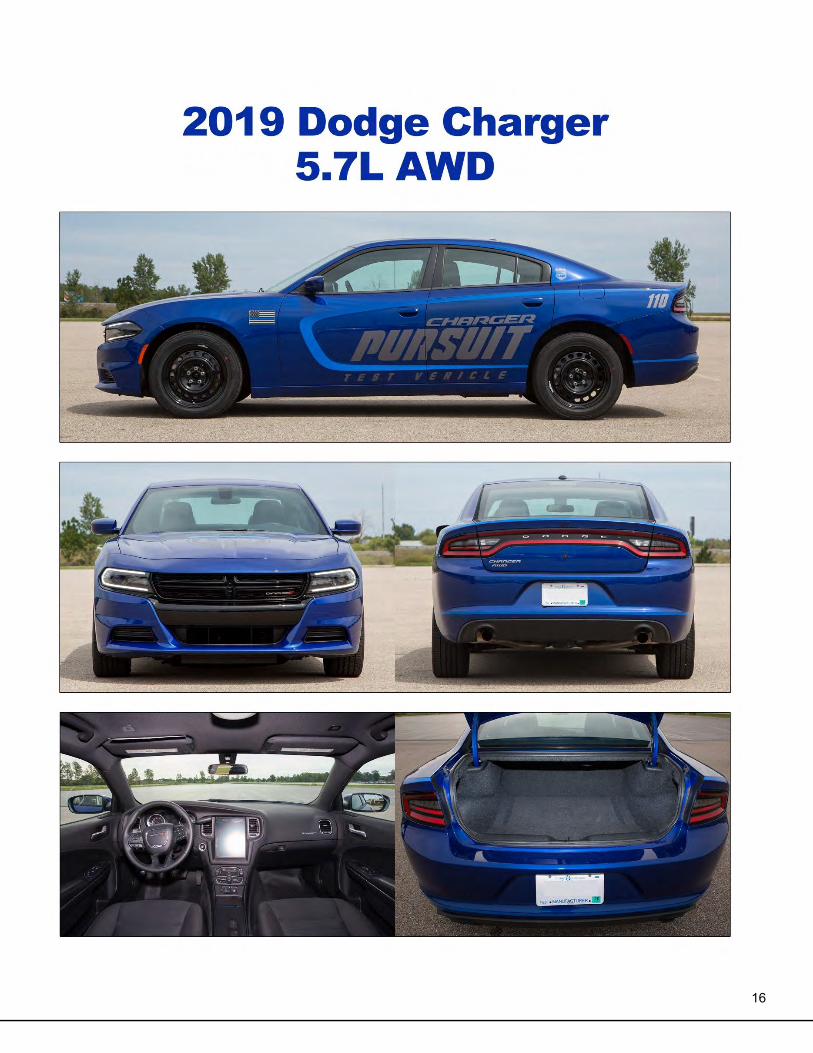
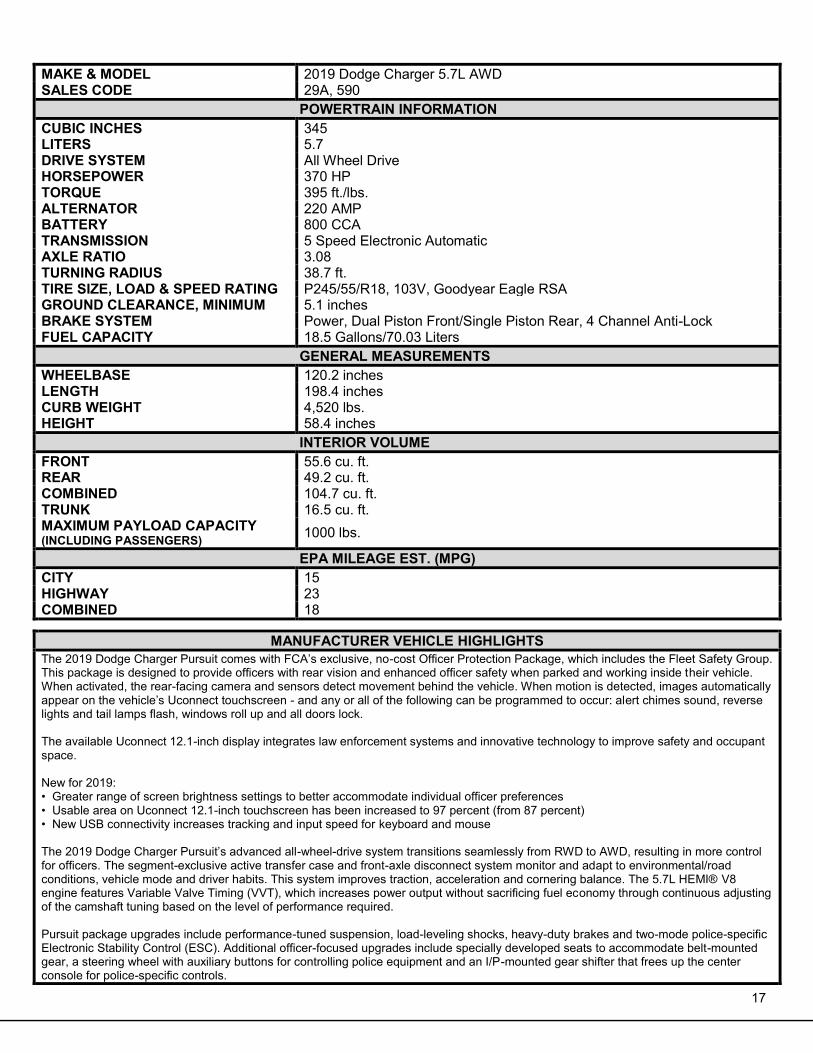
MAKE & MODEL 2019 Dodge Charger 5.7L AWD SALES CODE 29A, 590
POWERTRAIN INFORMATION CUBIC INCHES 345 LITERS 5.7 DRIVE SYSTEM All Wheel Drive HORSEPOWER 370 HP TORQUE 395 ft./lbs. ALTERNATOR 220 AMP BATTERY 800 CCA TRANSMISSION 5 Speed Electronic Automatic AXLE RATIO 3.08 TURNING RADIUS 38.7 ft. TIRE SIZE, LOAD & SPEED RATING P245/55/R18, 103V, Goodyear Eagle RSA GROUND CLEARANCE, MINIMUM 5.1 inches BRAKE SYSTEM Power, Dual Piston Front/Single Piston Rear, 4 Channel Anti-Lock FUEL CAPACITY 18.5 Gallons/70.03 Liters
GENERAL MEASUREMENTS WHEELBASE 120.2 inches LENGTH 198.4 inches CURB WEIGHT 4,520 lbs. HEIGHT 58.4 inches
INTERIOR VOLUME FRONT 55.6 cu. ft. REAR 49.2 cu. ft. COMBINED 104.7 cu. ft. TRUNK 16.5 cu. ft. MAXIMUM PAYLOAD CAPACITY (INCLUDING PASSENGERS) 1000 lbs.
EPA MILEAGE EST. (MPG) CITY 15 HIGHWAY 23 COMBINED 18
MANUFACTURER VEHICLE HIGHLIGHTS The 2019 Dodge Charger Pursuit comes with FCA’s exclusive, no-cost Officer Protection Package, which includes the Fleet Safety Group. This package is designed to provide officers with rear vision and enhanced officer safety when parked and working inside their vehicle. When activated, the rear-facing camera and sensors detect movement behind the vehicle. When motion is detected, images automatically appear on the vehicle’s Uconnect touchscreen - and any or all of the following can be programmed to occur: alert chimes sound, reverse lights and tail lamps flash, windows roll up and all doors lock. The available Uconnect 12.1-inch display integrates law enforcement systems and innovative technology to improve safety and occupant space. New for 2019: • Greater range of screen brightness settings to better accommodate individual officer preferences • Usable area on Uconnect 12.1-inch touchscreen has been increased to 97 percent (from 87 percent) • New USB connectivity increases tracking and input speed for keyboard and mouse The 2019 Dodge Charger Pursuit’s advanced all-wheel-drive system transitions seamlessly from RWD to AWD, resulting in more control for officers. The segment-exclusive active transfer case and front-axle disconnect system monitor and adapt to environmental/road conditions, vehicle mode and driver habits. This system improves traction, acceleration and cornering balance. The 5.7L HEMI® V8 engine features Variable Valve Timing (VVT), which increases power output without sacrificing fuel economy through continuous adjusting of the camshaft tuning based on the level of performance required. Pursuit package upgrades include performance-tuned suspension, load-leveling shocks, heavy-duty brakes and two-mode police-specific Electronic Stability Control (ESC). Additional officer-focused upgrades include specially developed seats to accommodate belt-mounted gear, a steering wheel with auxiliary buttons for controlling police equipment and an I/P-mounted gear shifter that frees up the center console for police-specific controls.
18
19
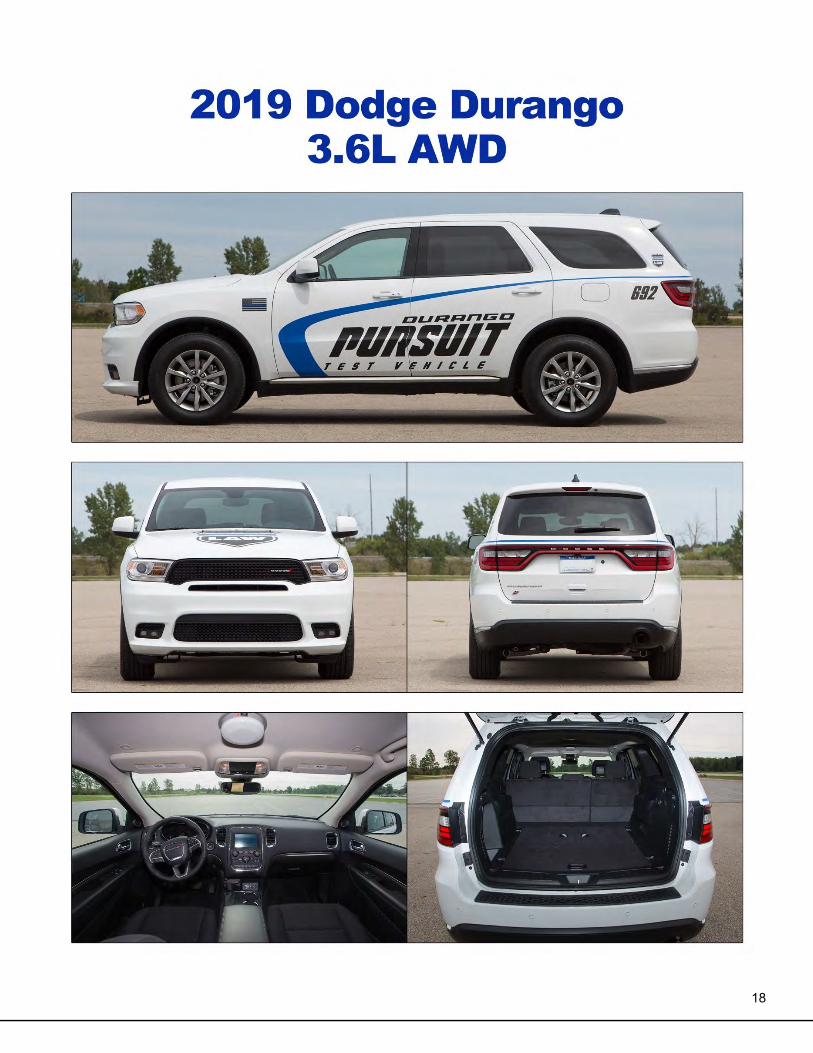
MAKE & MODEL 2019 Dodge Durango Pursuit 3.6L SALES CODE 2BZ, 514
POWERTRAIN INFORMATION CUBIC INCHES 220 LITERS 3.6 DRIVE SYSTEM All Wheel Drive HORSEPOWER 293 HP TORQUE 260 ft./lbs. ALTERNATOR 220 AMP BATTERY 650 CCA + Aux 200 CCA TRANSMISSION 8 Speed Automatic AXLE RATIO 3.45 TURNING RADIUS 41.0 ft. TIRE SIZE, LOAD & SPEED RATING 265/60R18T Michelin Latitude Tour HP GROUND CLEARANCE, MINIMUM 8.1 inches BRAKE SYSTEM Power with dual piston front calipers, single piston rear calipers, anti-lock FUEL CAPACITY 24.6 Gallons/93.12 Liters
GENERAL MEASUREMENTS WHEELBASE 119.8 inches LENGTH 201.2 inches CURB WEIGHT 4,849 lbs. HEIGHT 70.9 inches
INTERIOR VOLUME FRONT 54.4 cu. ft. REAR 44.8 cu. ft. COMBINED 99.2 cu. ft. TRUNK 47.7 cu. ft. MAXIMUM PAYLOAD CAPACITY (INCLUDING PASSENGERS) 1640 lbs.
EPA MILEAGE EST. (MPG) CITY 18 HIGHWAY 25 COMBINED 21
MANUFACTURER VEHICLE HIGHLIGHTS The 2019 Dodge Durango Pursuit – America’s high-performance police SUV – is equipped with world-class safety and security features, segment-first technology and tactical equipment. The Uconnect 7.0-inch display integrates law enforcement systems and innovative technology. The 2019 Durango Pursuit embodies the three qualities that every Dodge law enforcement vehicle is designed to maximize: safety, performance and efficiency. Dodge recognizes that the heroic men and women who protect us must be equipped with the best-performing pursuit-rated vehicle. With input from law enforcement officials, the 2019 Durango Pursuit continues to add improvements to meet the high expectations and performance needs of the heroes who protect us. New for 2019
• The 2019 Dodge Durango Pursuit adds a new front fascia with integrated brake-cooling air ducts for improved brake performance and durability
Durango Pursuit models feature all-wheel-drive (AWD) and offer the standard 3.6-liter Pentastar V-6 engine rated at 293 horsepower and 260 lb.-ft. of torque, class-exclusive, K-9 friendly tri-zone interior temperature control and the segment’s longest wheelbase (120 inches) for added stability and handling.
20
21
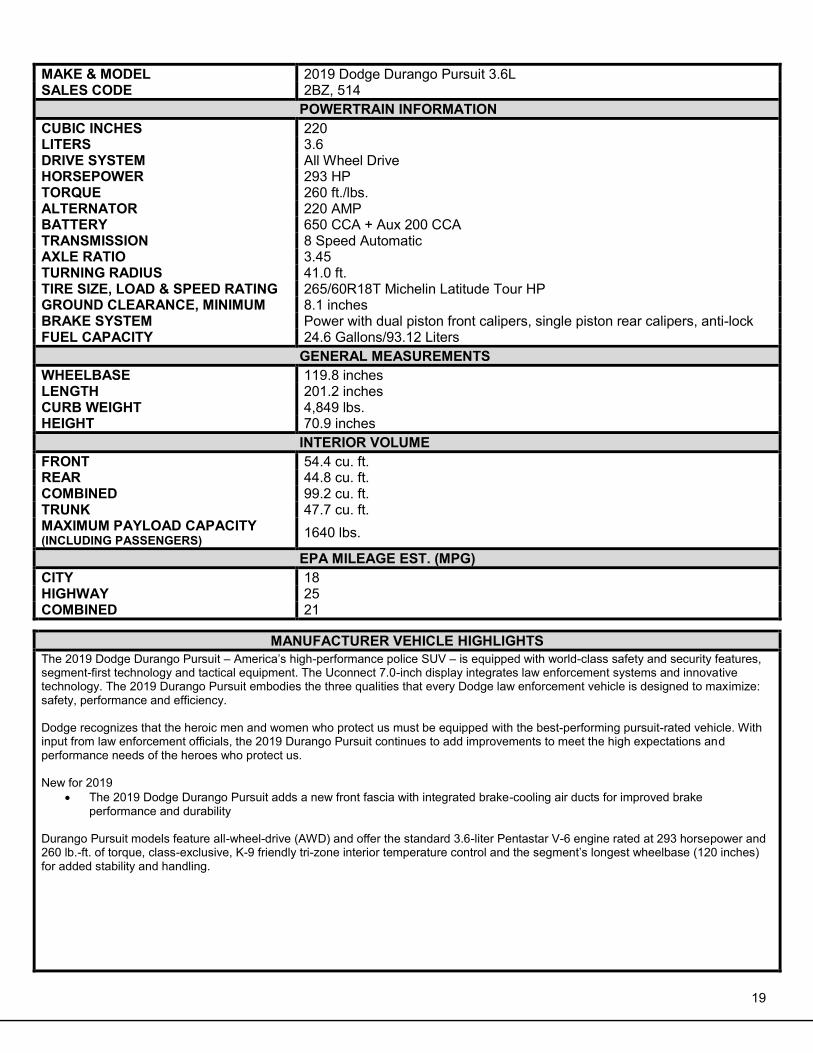
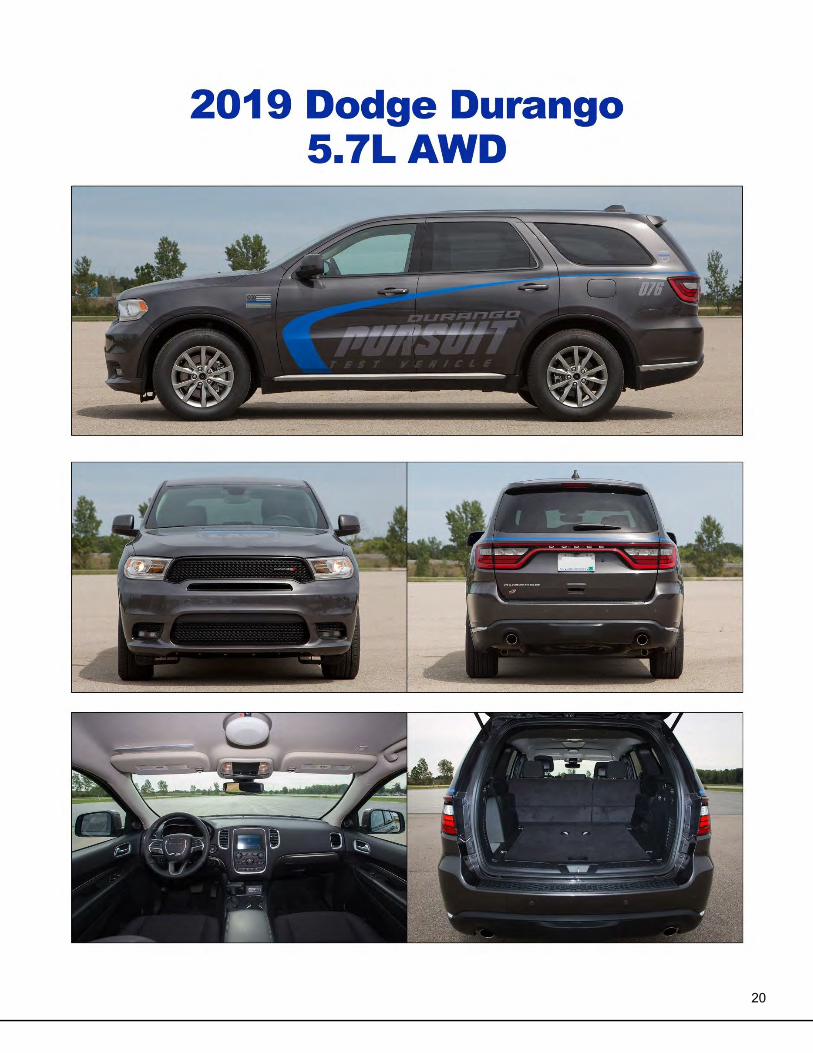
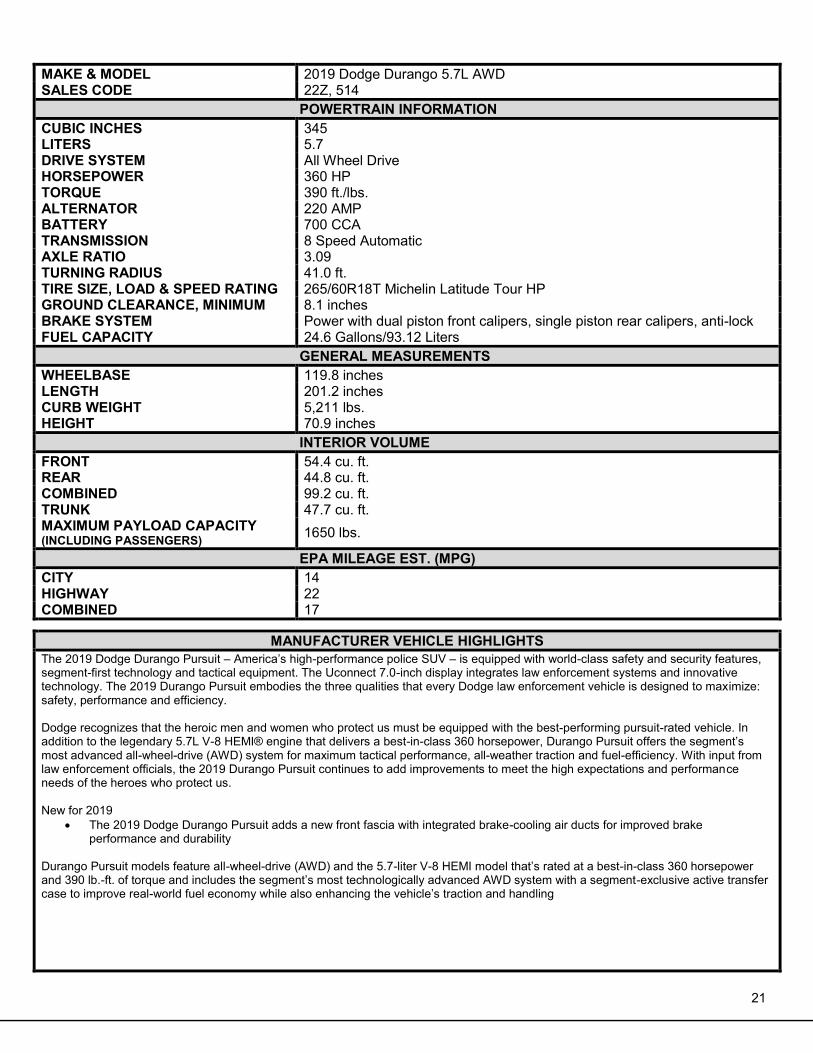
MAKE & MODEL 2019 Dodge Durango 5.7L AWD SALES CODE 22Z, 514
POWERTRAIN INFORMATION CUBIC INCHES 345 LITERS 5.7 DRIVE SYSTEM All Wheel Drive HORSEPOWER 360 HP TORQUE 390 ft./lbs. ALTERNATOR 220 AMP BATTERY 700 CCA TRANSMISSION 8 Speed Automatic AXLE RATIO 3.09 TURNING RADIUS 41.0 ft. TIRE SIZE, LOAD & SPEED RATING 265/60R18T Michelin Latitude Tour HP GROUND CLEARANCE, MINIMUM 8.1 inches BRAKE SYSTEM Power with dual piston front calipers, single piston rear calipers, anti-lock FUEL CAPACITY 24.6 Gallons/93.12 Liters
GENERAL MEASUREMENTS WHEELBASE 119.8 inches LENGTH 201.2 inches CURB WEIGHT 5,211 lbs. HEIGHT 70.9 inches
INTERIOR VOLUME FRONT 54.4 cu. ft. REAR 44.8 cu. ft. COMBINED 99.2 cu. ft. TRUNK 47.7 cu. ft. MAXIMUM PAYLOAD CAPACITY (INCLUDING PASSENGERS) 1650 lbs.
EPA MILEAGE EST. (MPG) CITY 14 HIGHWAY 22 COMBINED 17
MANUFACTURER VEHICLE HIGHLIGHTS The 2019 Dodge Durango Pursuit – America’s high-performance police SUV – is equipped with world-class safety and security features, segment-first technology and tactical equipment. The Uconnect 7.0-inch display integrates law enforcement systems and innovative technology. The 2019 Durango Pursuit embodies the three qualities that every Dodge law enforcement vehicle is designed to maximize: safety, performance and efficiency. Dodge recognizes that the heroic men and women who protect us must be equipped with the best-performing pursuit-rated vehicle. In addition to the legendary 5.7L V-8 HEMI® engine that delivers a best-in-class 360 horsepower, Durango Pursuit offers the segment’s most advanced all-wheel-drive (AWD) system for maximum tactical performance, all-weather traction and fuel-efficiency. With input from law enforcement officials, the 2019 Durango Pursuit continues to add improvements to meet the high expectations and performance needs of the heroes who protect us. New for 2019
• The 2019 Dodge Durango Pursuit adds a new front fascia with integrated brake-cooling air ducts for improved brake performance and durability
Durango Pursuit models feature all-wheel-drive (AWD) and the 5.7-liter V-8 HEMI model that’s rated at a best-in-class 360 horsepower and 390 lb.-ft. of torque and includes the segment’s most technologically advanced AWD system with a segment-exclusive active transfer case to improve real-world fuel economy while also enhancing the vehicle’s traction and handling
22
23
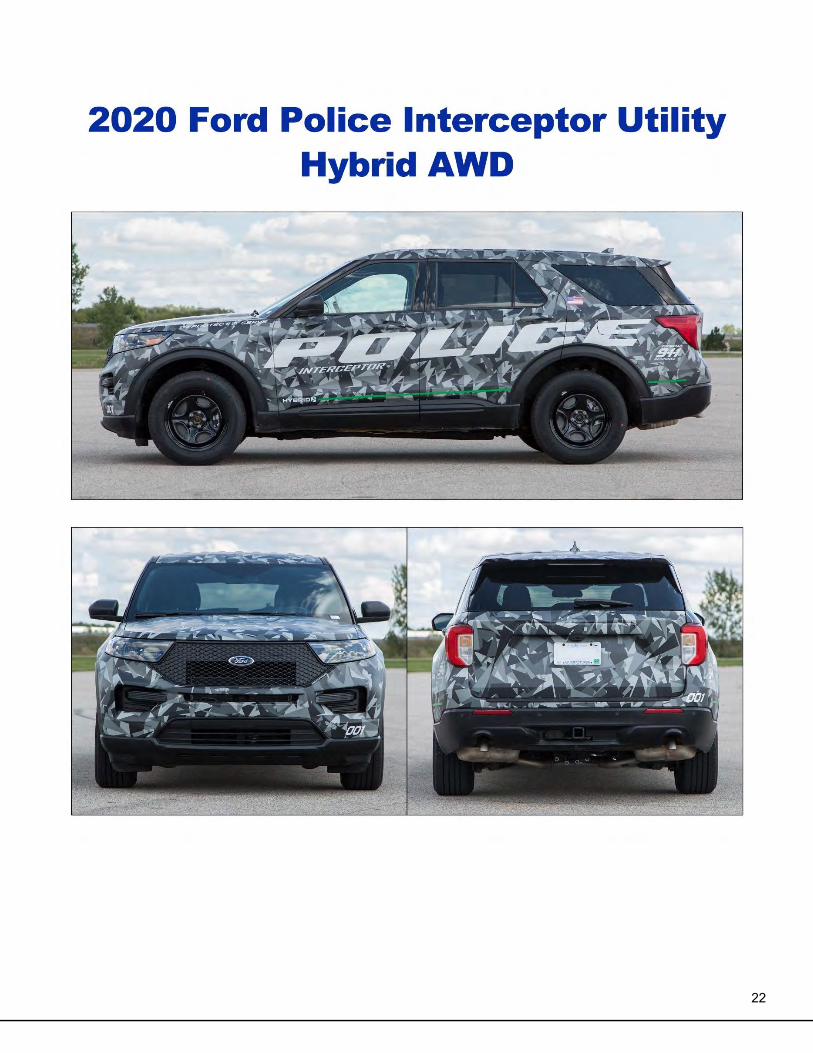
MAKE & MODEL 2020 Ford Police Interceptor Utility Hybrid AWD SALES CODE K8A, 99W
POWERTRAIN INFORMATION CUBIC INCHES 201 LITERS 3.3 DRIVE SYSTEM All Wheel Drive HORSEPOWER TBD TORQUE TBD ALTERNATOR DC/DC Converter: 220 AMP BATTERY 800 CCA TRANSMISSION 10 Speed AXLE RATIO 3.73 TURNING RADIUS 40.4 ft. TIRE SIZE, LOAD & SPEED RATING 255/60R18 108V GROUND CLEARANCE, MINIMUM 7.4 inches BRAKE SYSTEM ABS & Regenerative Braking with power dual piston front calipers, single
piston rear calipers FUEL CAPACITY 19.0 Gallons/72.0 Liters
GENERAL MEASUREMENTS WHEELBASE 119.1 inches LENGTH 198.8 inches CURB WEIGHT 5,303 lbs. HEIGHT 69.5 inches
INTERIOR VOLUME FRONT 59.7 cu. ft. REAR 58.5 cu. ft. COMBINED 118.2 cu. ft. TRUNK 89.9 cu. ft. MAXIMUM PAYLOAD CAPACITY (INCLUDING PASSENGERS) 1637 lbs.
EPA MILEAGE EST. (MPG) CITY TBD HIGHWAY TBD COMBINED TBD
MANUFACTURER VEHICLE HIGHLIGHTS NEW FEATURES & CHANGES:
• All-new for 2020 Model Year, the Ford Police Interceptor Utility comes with standard Hybrid AWD and Ford Telematics • Hybrid and AWD is ideal for law enforcement, due to optimal performance and significant fuel savings achieved by reduced
engine idle time; with hybrid technology, on-board electrical equipment is powered via the lithium-ion hybrid battery, allowing the gas engine to shut off for extended periods, running intermittently to charge the battery
• Fuel savings of over $3,500 per year, per vehicle, at $2.75/gallon; see www.fordpoliceinterceptor.com for details SAFETY:
• Ford Police Interceptors are the only vehicles in the world designed and engineered for the 75-mph rear-impact crash test • New factory-installed Police Perimeter Alert monitors approximately 270° and secures vehicle if threatening motion detected • Optional Level III & IV NIJ Ballistic Panels – includes additional LAPD special threat rounds • Standard Anti-Stab plates in front seat backs
DURABILITY:
• Enhanced police durability-cycle tested, proven real-world durability results PERFORMANCE:
• New standard Hybrid powertrain provides increased horsepower, torque, acceleration and top speed vs. 3.7L AWD • Standard AWD provides optimum handling in all road conditions – dry, ice/snow, wet/rain, gravel, etc.
24
25
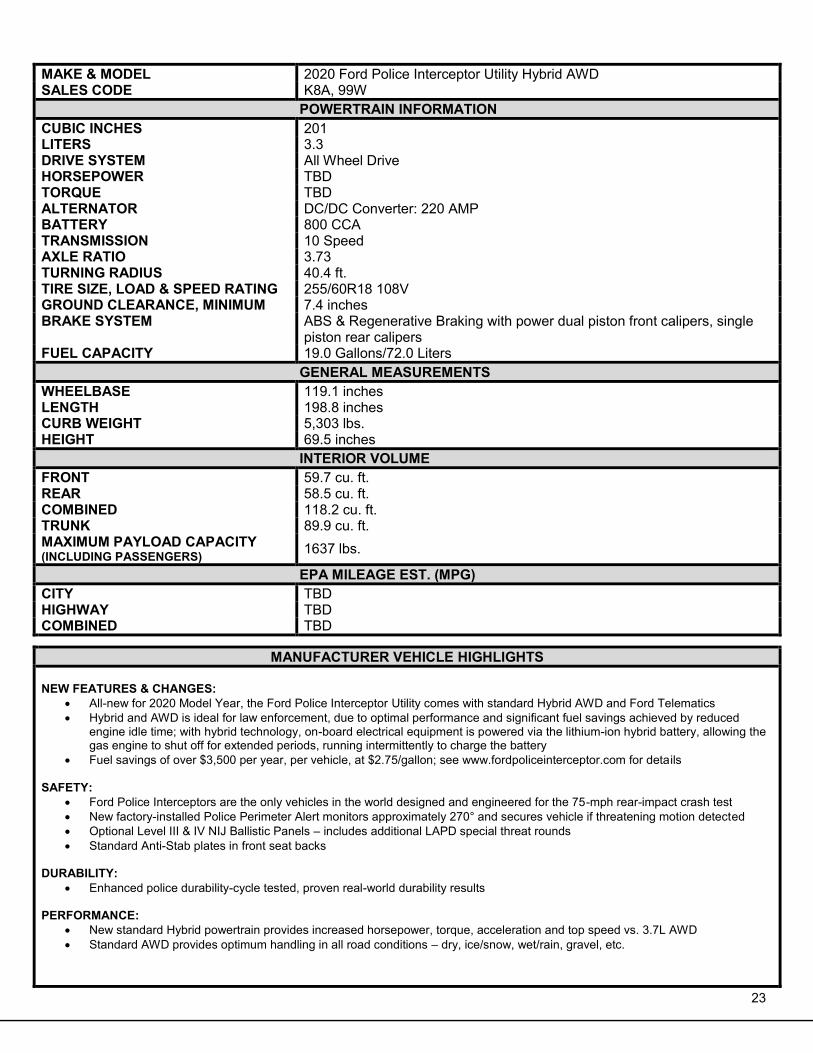
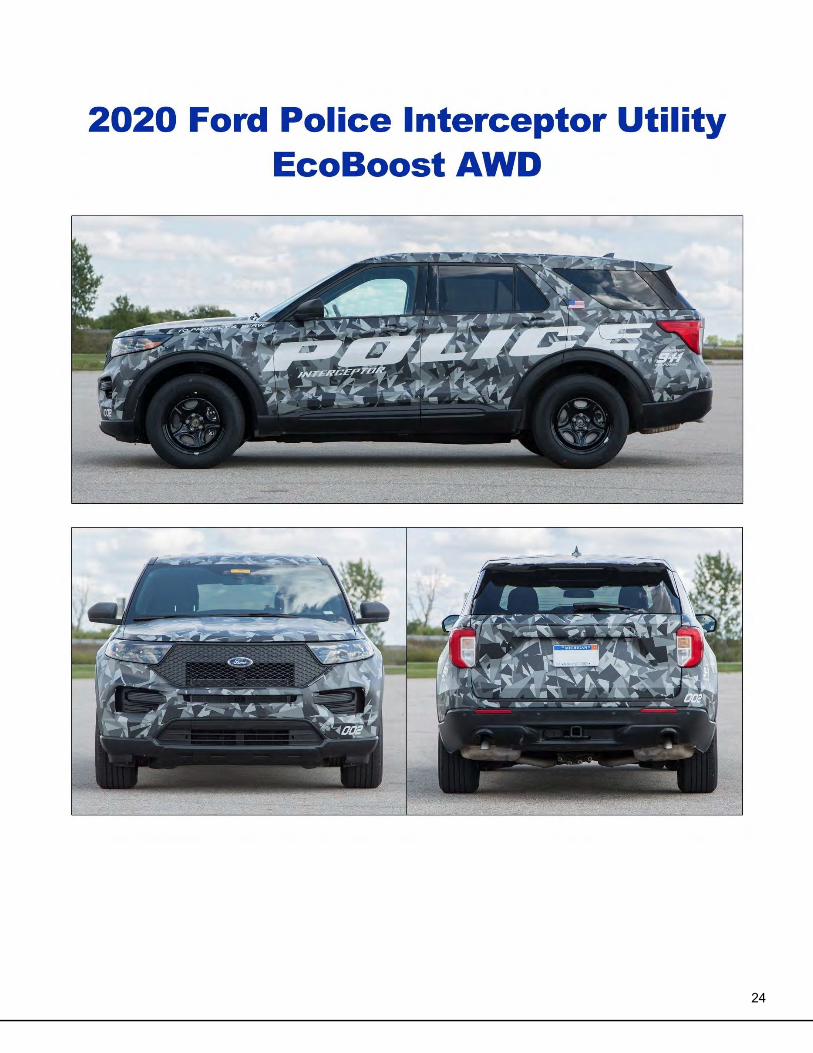
MAKE & MODEL 2020 Ford Police Interceptor Utility 3.0L EcoBoost AWD SALES CODE K8A, 99C
POWERTRAIN INFORMATION CUBIC INCHES 183 LITERS 3.0 DRIVE SYSTEM All Wheel Drive HORSEPOWER TBD TORQUE TBD ALTERNATOR 250 AMP BATTERY 730 CCA TRANSMISSION 10 Speed AXLE RATIO 3.31 TURNING RADIUS 40.4 ft. TIRE SIZE, LOAD & SPEED RATING 255/60R18 108V GROUND CLEARANCE, MINIMUM 7.2 inches BRAKE SYSTEM Power - dual piston calipers front, single piston calipers rear, 4 circuit ABS FUEL CAPACITY 21.4 Gallons/81.0 Liters
GENERAL MEASUREMENTS WHEELBASE 119.1 inches LENGTH 198.8 inches CURB WEIGHT 4,848 lbs. HEIGHT 69.5 inches
INTERIOR VOLUME FRONT 59.7 cu. ft. REAR 58.5 cu. ft. COMBINED 118.2 cu. ft. TRUNK 89.9 cu. ft. MAXIMUM PAYLOAD CAPACITY (INCLUDING PASSENGERS) 1632 lbs.
EPA MILEAGE EST. (MPG) CITY TBD HIGHWAY TBD COMBINED TBD
MANUFACTURER VEHICLE HIGHLIGHTS NEW FEATURES & CHANGES:
• All-new for 2020 Model Year, the Ford Police Interceptor Utility comes with standard Hybrid AWD and Ford Telematics • Hybrid and AWD is ideal for law enforcement, due to optimal performance and significant fuel savings achieved by reduced
engine idle time; with hybrid technology, on-board electrical equipment is powered via the lithium-ion hybrid battery, allowing the gas engine to shut off for extended periods, running intermittently to charge the battery
• Optional 3.3L Direct Injection and 3.0L EcoBoost engines also available SAFETY:
• Ford Police Interceptors are the only vehicles in the world designed and engineered for the 75-mph rear-impact crash test • New factory-installed Police Perimeter Alert monitors approximately 270° and secures vehicle if threatening motion detected • Optional Level III & IV NIJ Ballistic Panels – includes additional LAPD special threat rounds • Standard Anti-Stab plates in front seat backs
DURABILITY:
• Enhanced police durability-cycle tested, proven real-world durability results PERFORMANCE:
• New 3.0L EcoBoost AWD provides increased horsepower, torque, acceleration and top speed vs. 3.5L EcoBoost AWD • Standard AWD provides optimum handling in all road conditions – dry, ice/snow, wet/rain, gravel, etc.
26
27
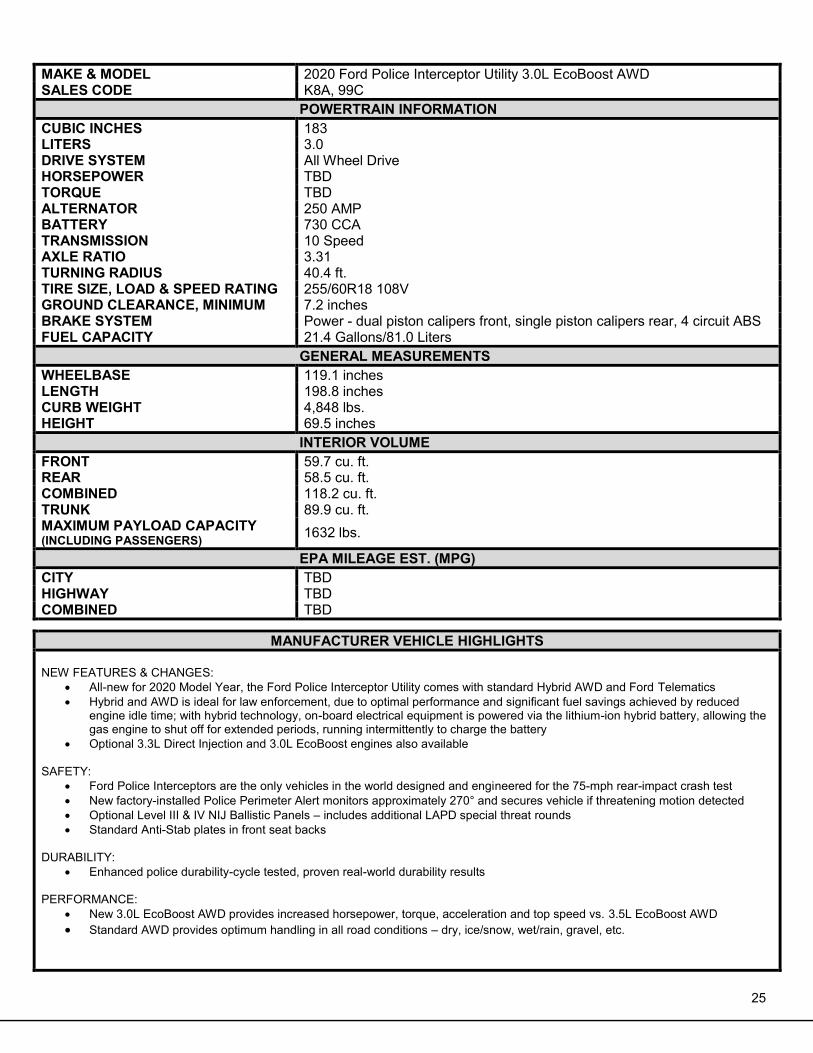
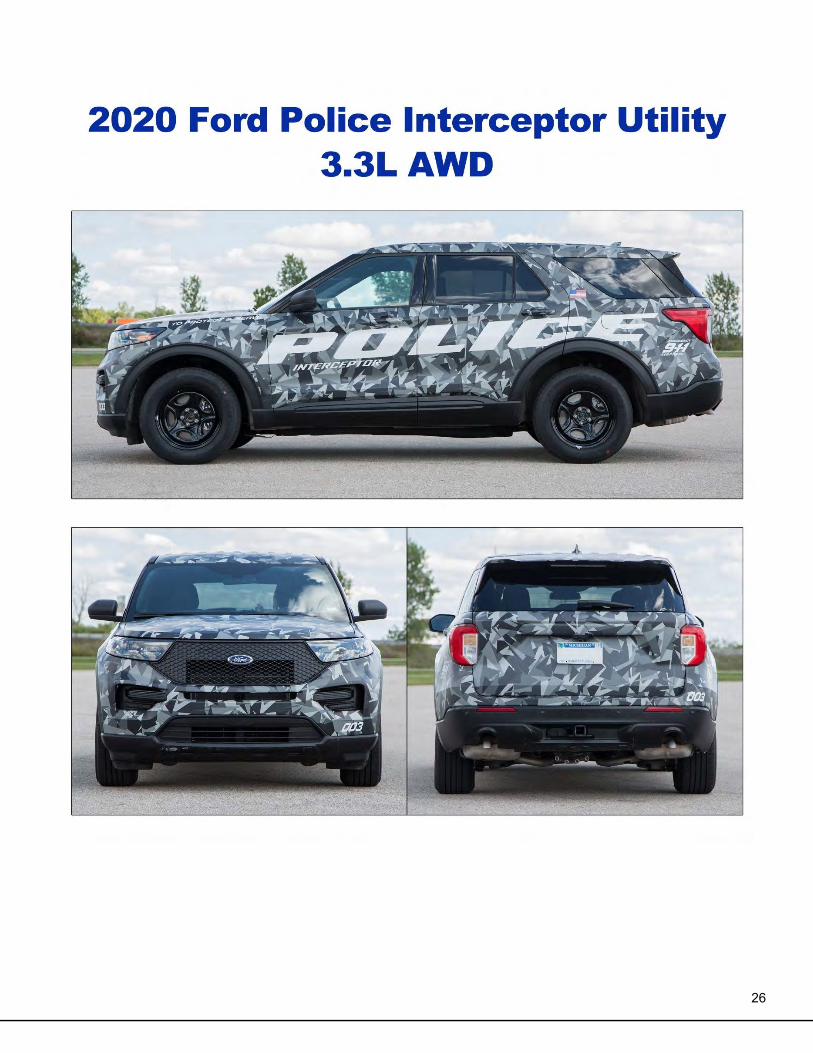
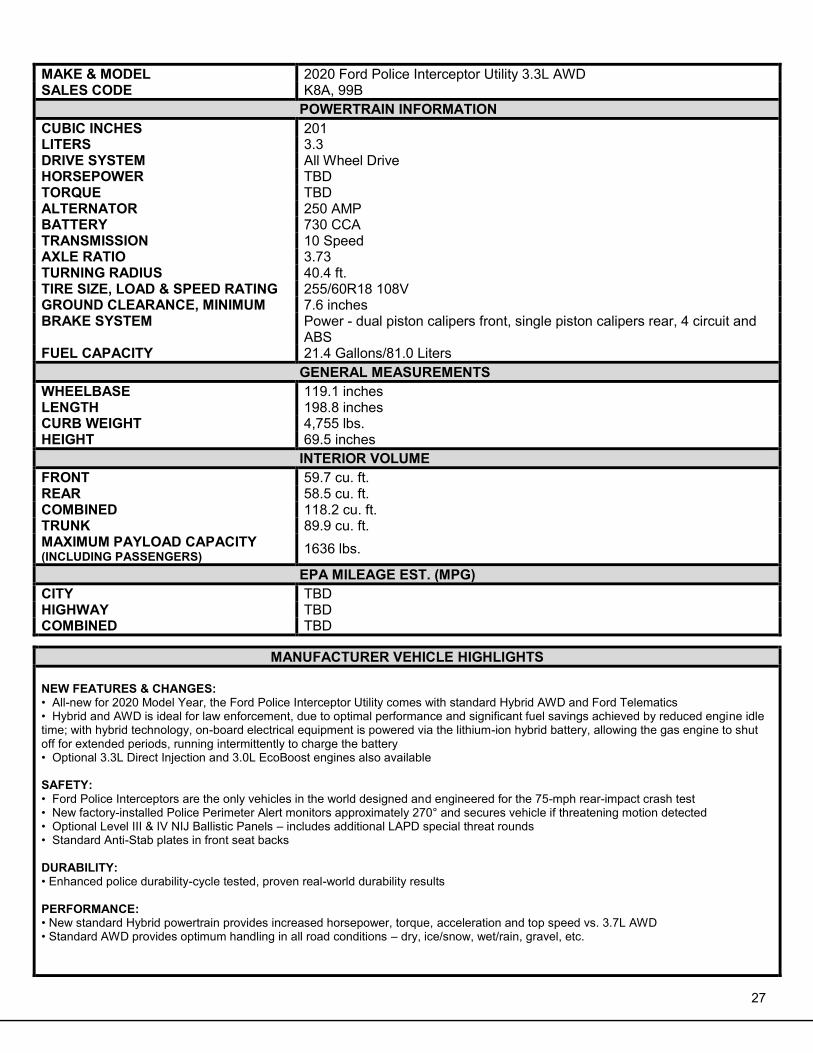
MAKE & MODEL 2020 Ford Police Interceptor Utility 3.3L AWD SALES CODE K8A, 99B
POWERTRAIN INFORMATION CUBIC INCHES 201 LITERS 3.3 DRIVE SYSTEM All Wheel Drive HORSEPOWER TBD TORQUE TBD ALTERNATOR 250 AMP BATTERY 730 CCA TRANSMISSION 10 Speed AXLE RATIO 3.73 TURNING RADIUS 40.4 ft. TIRE SIZE, LOAD & SPEED RATING 255/60R18 108V GROUND CLEARANCE, MINIMUM 7.6 inches BRAKE SYSTEM Power - dual piston calipers front, single piston calipers rear, 4 circuit and
ABS FUEL CAPACITY 21.4 Gallons/81.0 Liters
GENERAL MEASUREMENTS WHEELBASE 119.1 inches LENGTH 198.8 inches CURB WEIGHT 4,755 lbs. HEIGHT 69.5 inches
INTERIOR VOLUME FRONT 59.7 cu. ft. REAR 58.5 cu. ft. COMBINED 118.2 cu. ft. TRUNK 89.9 cu. ft. MAXIMUM PAYLOAD CAPACITY (INCLUDING PASSENGERS) 1636 lbs.
EPA MILEAGE EST. (MPG) CITY TBD HIGHWAY TBD COMBINED TBD
MANUFACTURER VEHICLE HIGHLIGHTS NEW FEATURES & CHANGES: • All-new for 2020 Model Year, the Ford Police Interceptor Utility comes with standard Hybrid AWD and Ford Telematics • Hybrid and AWD is ideal for law enforcement, due to optimal performance and significant fuel savings achieved by reduced engine idle time; with hybrid technology, on-board electrical equipment is powered via the lithium-ion hybrid battery, allowing the gas engine to shut off for extended periods, running intermittently to charge the battery • Optional 3.3L Direct Injection and 3.0L EcoBoost engines also available SAFETY: • Ford Police Interceptors are the only vehicles in the world designed and engineered for the 75-mph rear-impact crash test • New factory-installed Police Perimeter Alert monitors approximately 270° and secures vehicle if threatening motion detected • Optional Level III & IV NIJ Ballistic Panels – includes additional LAPD special threat rounds • Standard Anti-Stab plates in front seat backs DURABILITY: • Enhanced police durability-cycle tested, proven real-world durability results PERFORMANCE: • New standard Hybrid powertrain provides increased horsepower, torque, acceleration and top speed vs. 3.7L AWD • Standard AWD provides optimum handling in all road conditions – dry, ice/snow, wet/rain, gravel, etc.
28
29
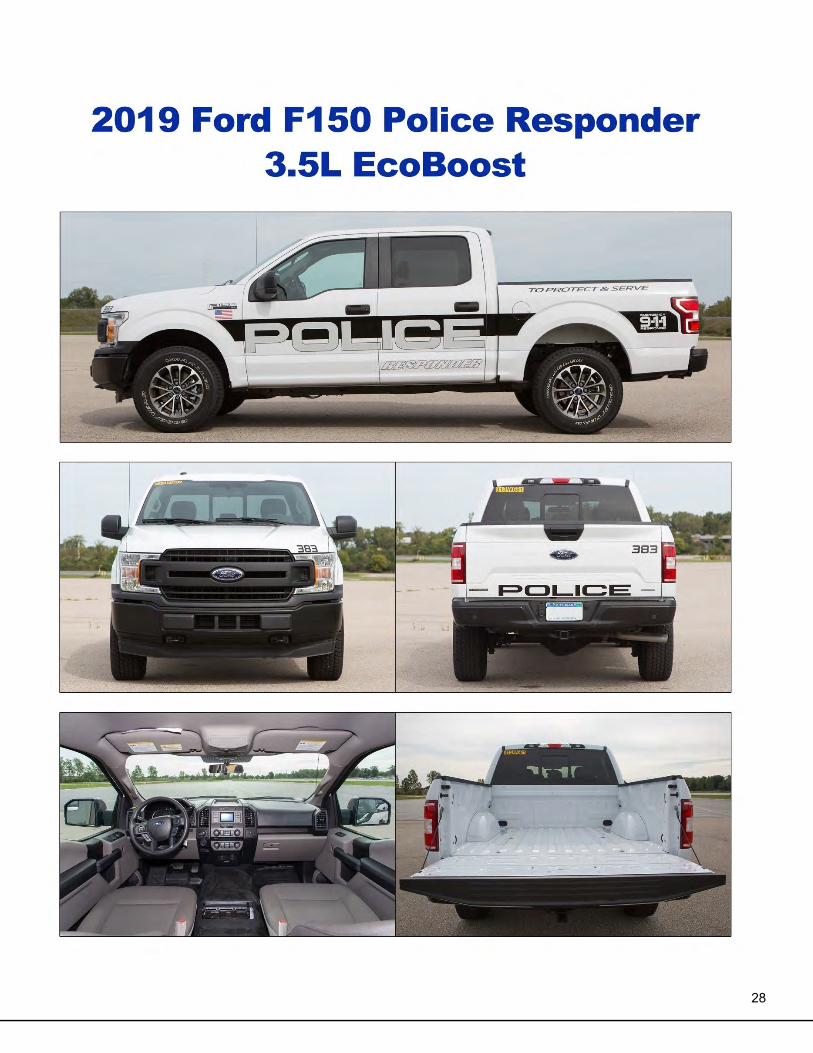
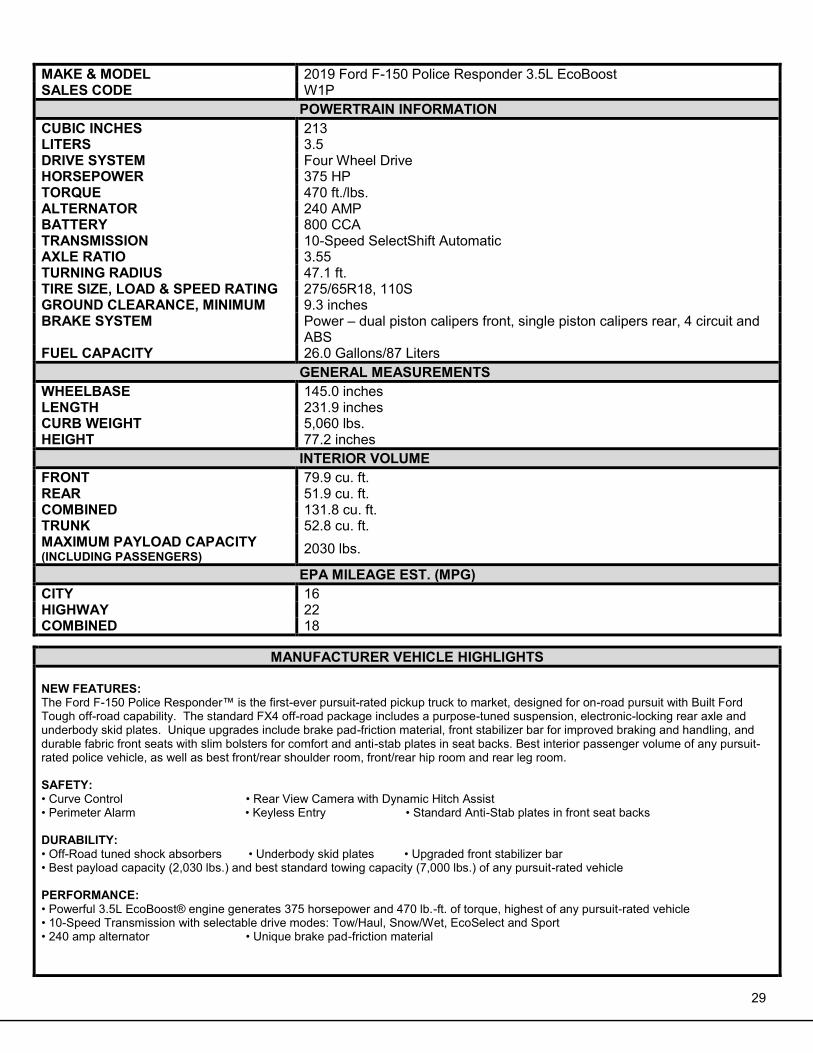
MAKE & MODEL 2019 Ford F-150 Police Responder 3.5L EcoBoost SALES CODE W1P
POWERTRAIN INFORMATION CUBIC INCHES 213 LITERS 3.5 DRIVE SYSTEM Four Wheel Drive HORSEPOWER 375 HP TORQUE 470 ft./lbs. ALTERNATOR 240 AMP BATTERY 800 CCA TRANSMISSION 10-Speed SelectShift Automatic AXLE RATIO 3.55 TURNING RADIUS 47.1 ft. TIRE SIZE, LOAD & SPEED RATING 275/65R18, 110S GROUND CLEARANCE, MINIMUM 9.3 inches BRAKE SYSTEM Power – dual piston calipers front, single piston calipers rear, 4 circuit and
ABS FUEL CAPACITY 26.0 Gallons/87 Liters
GENERAL MEASUREMENTS WHEELBASE 145.0 inches LENGTH 231.9 inches CURB WEIGHT 5,060 lbs. HEIGHT 77.2 inches
INTERIOR VOLUME FRONT 79.9 cu. ft. REAR 51.9 cu. ft. COMBINED 131.8 cu. ft. TRUNK 52.8 cu. ft. MAXIMUM PAYLOAD CAPACITY (INCLUDING PASSENGERS) 2030 lbs.
EPA MILEAGE EST. (MPG) CITY 16 HIGHWAY 22 COMBINED 18
MANUFACTURER VEHICLE HIGHLIGHTS NEW FEATURES: The Ford F-150 Police Responder™ is the first-ever pursuit-rated pickup truck to market, designed for on-road pursuit with Built Ford Tough off-road capability. The standard FX4 off-road package includes a purpose-tuned suspension, electronic-locking rear axle and underbody skid plates. Unique upgrades include brake pad-friction material, front stabilizer bar for improved braking and handling, and durable fabric front seats with slim bolsters for comfort and anti-stab plates in seat backs. Best interior passenger volume of any pursuit-rated police vehicle, as well as best front/rear shoulder room, front/rear hip room and rear leg room. SAFETY: • Curve Control • Rear View Camera with Dynamic Hitch Assist • Perimeter Alarm • Keyless Entry • Standard Anti-Stab plates in front seat backs DURABILITY: • Off-Road tuned shock absorbers • Underbody skid plates • Upgraded front stabilizer bar • Best payload capacity (2,030 lbs.) and best standard towing capacity (7,000 lbs.) of any pursuit-rated vehicle PERFORMANCE: • Powerful 3.5L EcoBoost® engine generates 375 horsepower and 470 lb.-ft. of torque, highest of any pursuit-rated vehicle • 10-Speed Transmission with selectable drive modes: Tow/Haul, Snow/Wet, EcoSelect and Sport • 240 amp alternator • Unique brake pad-friction material
30
31
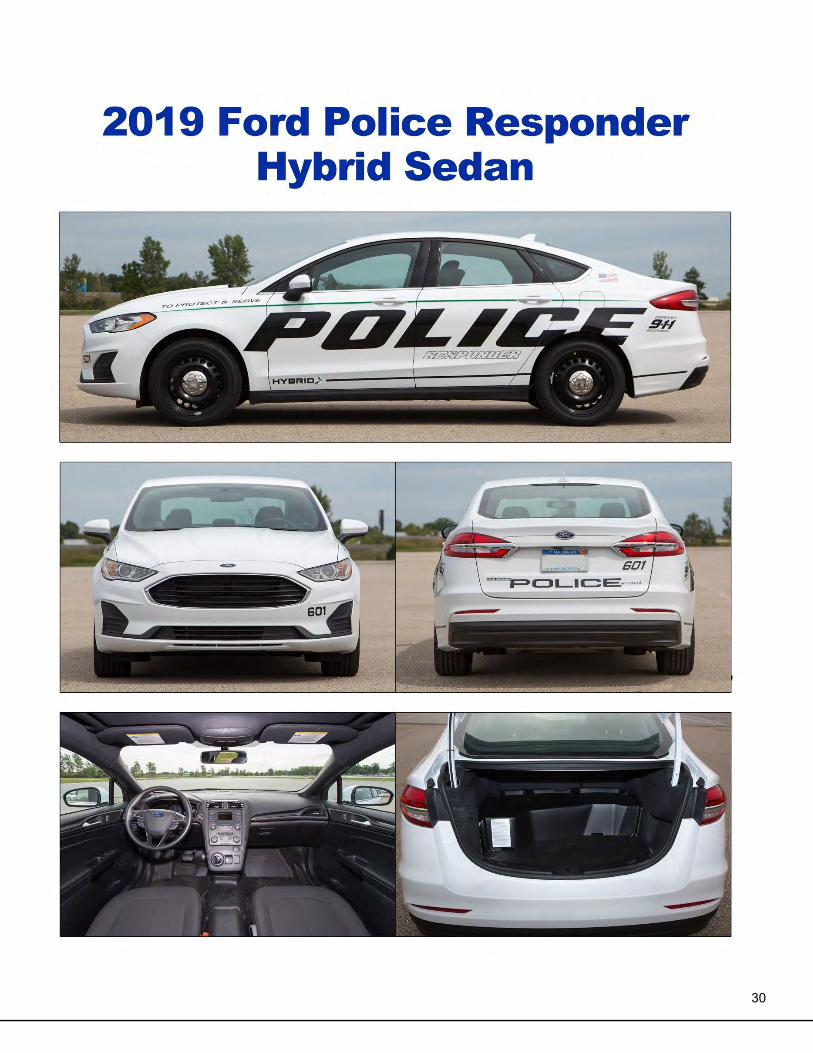
MAKE & MODEL 2019 Ford Police Responder Hybrid Sedan SALES CODE P0A
POWERTRAIN INFORMATION CUBIC INCHES 122 LITERS 2.0 DRIVE SYSTEM Front Wheel Drive HORSEPOWER 188 HP TORQUE 129 ft./lbs. ALTERNATOR 165 AMP BATTERY 590 CCA TRANSMISSION eCVT (Automatic) AXLE RATIO 2.57 TURNING RADIUS 37.6 ft. TIRE SIZE, LOAD & SPEED RATING 235/50R17 96W GROUND CLEARANCE, MINIMUM 6.3 inches BRAKE SYSTEM Regenerative Braking System and 4-wheel Disc with Anti-Lock Brake
System (ABS) FUEL CAPACITY 14.0 Gallons/53.0 Liters
GENERAL MEASUREMENTS WHEELBASE 112.2 inches LENGTH 191.8 inches CURB WEIGHT 3,748 lbs. HEIGHT 58.0 inches
INTERIOR VOLUME FRONT 55.2 cu. ft. REAR 47.6 cu. ft. COMBINED 102.8 cu. ft. TRUNK 12.0 cu. ft. MAXIMUM PAYLOAD CAPACITY (INCLUDING PASSENGERS) 1200 lbs.
EPA MILEAGE EST. (MPG) CITY 40 HIGHWAY 36 COMBINED 38
MANUFACTURER VEHICLE HIGHLIGHTS NEW FEATURES: A Greener Shade of BlueTM The first-ever pursuit-rated Hybrid police vehicle to market, the Ford Police ResponderTM Hybrid Sedan provides a capable option that delivers multiple benefits, including potential fuel savings, reduced CO2 emissions and fewer fill-ups – meaning less vehicle downtime to keep your vehicles and officers on the road. Our scenario shows potential savings of nearly $4,300 per year, per vehicle, at $2.75 per gallon. See www.fordpoliceresponder.com for details and to run your own scenarios. In Fall 2017 testing at MSP, 0-100 acceleration was similar to the last testing of V8-powered Crown Victoria Police Interceptor in Fall 2011. SAFETY: • Standard Anti-Stab plates in front seat backs • Standard Rear View Camera • Standard Individual Tire Pressure Monitoring System • Optional NIJ Level IIIa Ballistic Panels • Standard Police Engine Idle feature DURABILITY: • Enhanced Police durability-cycle tested • Standard Front Underbody Deflector Plate PERFORMANCE: • Pursuit calibrated powertrain • Police-tuned Regenerative Braking System • Heavy duty suspension components, upgraded braking and cooling

32
33
VEHICLE DYNAMICS TESTING
TESTING OBJECTIVE
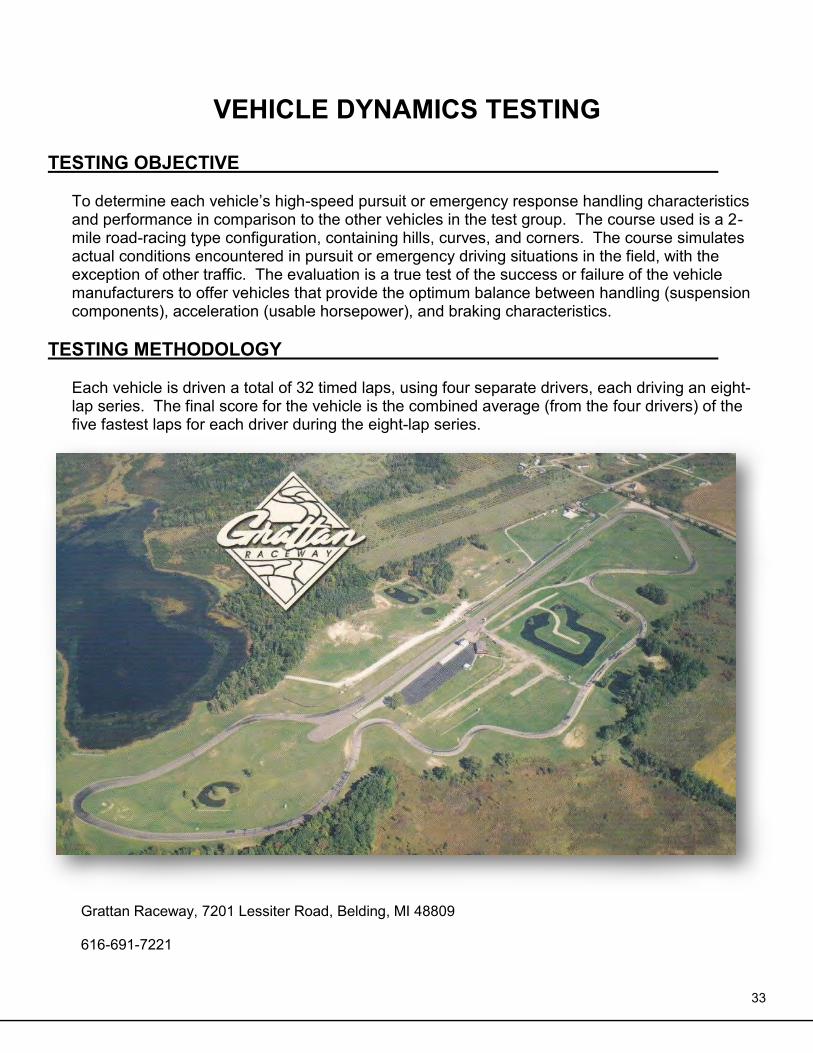
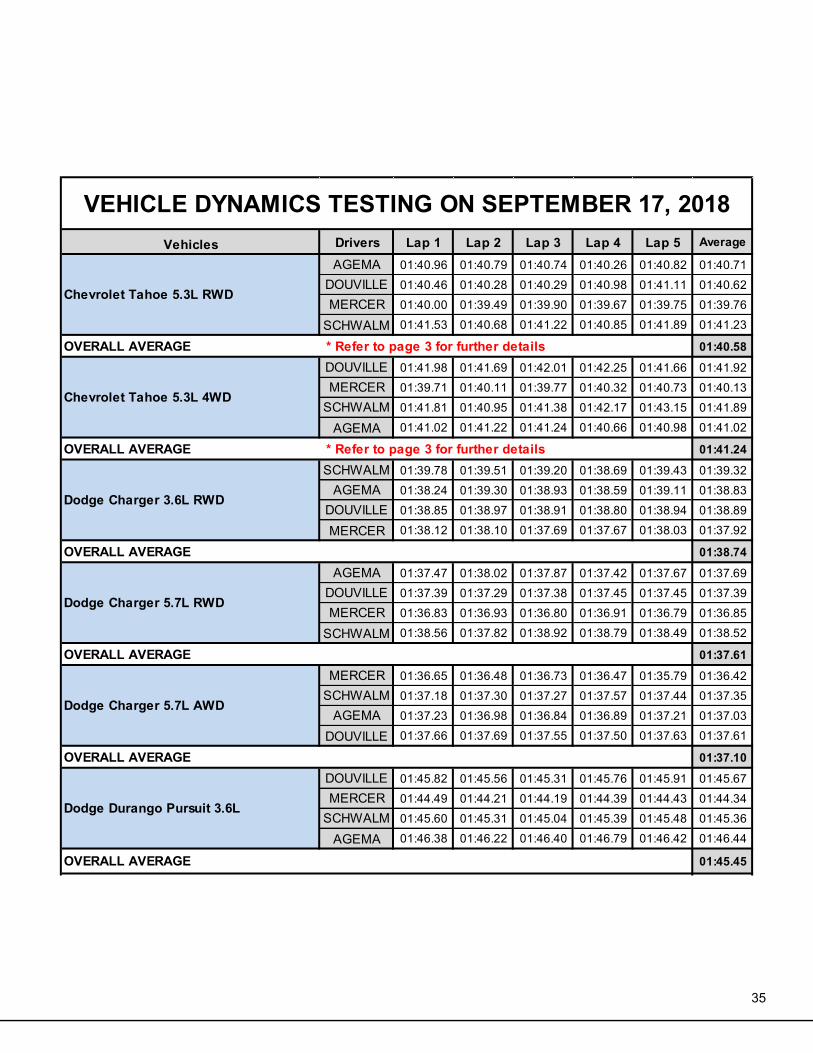
To determine each vehicle’s high-speed pursuit or emergency response handling characteristics and performance in comparison to the other vehicles in the test group. The course used is a 2-mile road-racing type configuration, containing hills, curves, and corners. The course simulates actual conditions encountered in pursuit or emergency driving situations in the field, with the exception of other traffic. The evaluation is a true test of the success or failure of the vehicle manufacturers to offer vehicles that provide the optimum balance between handling (suspension components), acceleration (usable horsepower), and braking characteristics.
TESTING METHODOLOGY
Each vehicle is driven a total of 32 timed laps, using four separate drivers, each driving an eight-lap series. The final score for the vehicle is the combined average (from the four drivers) of the five fastest laps for each driver during the eight-lap series.
Grattan Raceway, 7201 Lessiter Road, Belding, MI 48809 616-691-7221
34
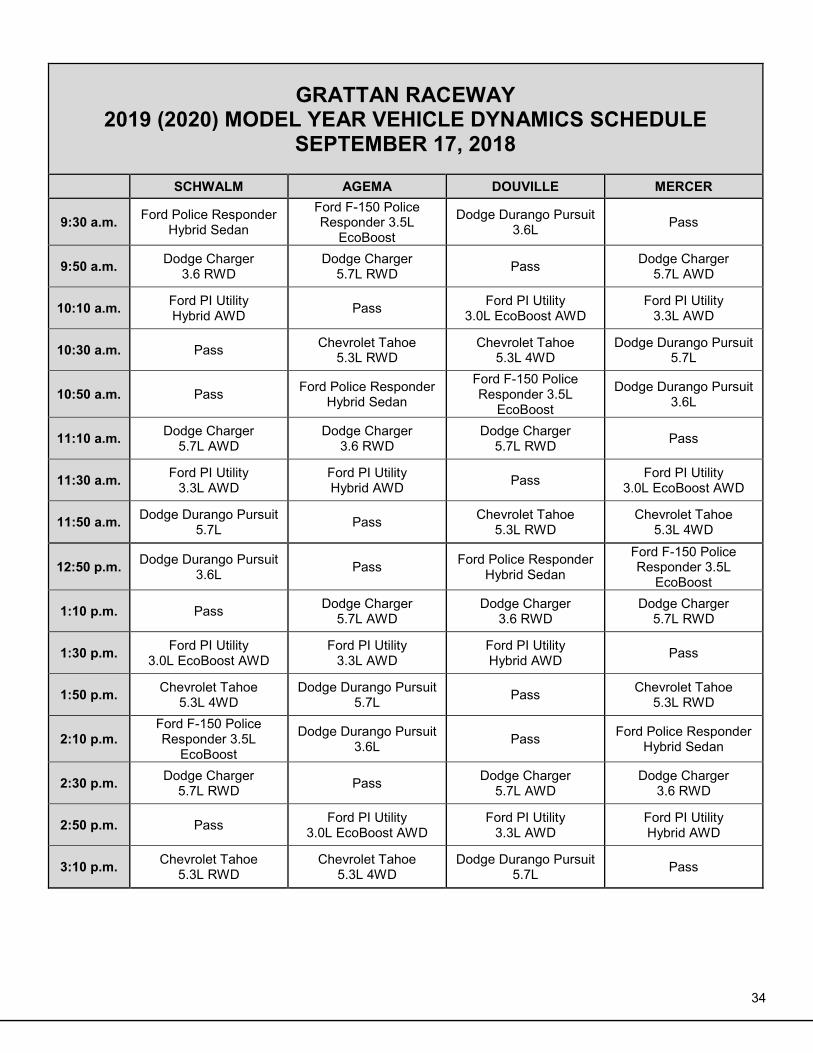
GRATTAN RACEWAY 2019 (2020) MODEL YEAR VEHICLE DYNAMICS SCHEDULE
SEPTEMBER 17, 2018 SCHWALM AGEMA DOUVILLE MERCER
9:30 a.m. Ford Police Responder Hybrid Sedan
Ford F-150 Police Responder 3.5L
EcoBoost
Dodge Durango Pursuit 3.6L Pass
9:50 a.m. Dodge Charger 3.6 RWD
Dodge Charger 5.7L RWD Pass Dodge Charger
5.7L AWD
10:10 a.m. Ford PI Utility Hybrid AWD Pass Ford PI Utility
3.0L EcoBoost AWD Ford PI Utility
3.3L AWD
10:30 a.m. Pass Chevrolet Tahoe 5.3L RWD
Chevrolet Tahoe 5.3L 4WD
Dodge Durango Pursuit 5.7L
10:50 a.m. Pass Ford Police Responder Hybrid Sedan
Ford F-150 Police Responder 3.5L
EcoBoost
Dodge Durango Pursuit 3.6L
11:10 a.m. Dodge Charger 5.7L AWD
Dodge Charger 3.6 RWD
Dodge Charger 5.7L RWD Pass
11:30 a.m. Ford PI Utility 3.3L AWD
Ford PI Utility Hybrid AWD Pass Ford PI Utility
3.0L EcoBoost AWD
11:50 a.m. Dodge Durango Pursuit 5.7L Pass Chevrolet Tahoe
5.3L RWD Chevrolet Tahoe
5.3L 4WD
12:50 p.m. Dodge Durango Pursuit 3.6L Pass Ford Police Responder
Hybrid Sedan
Ford F-150 Police Responder 3.5L
EcoBoost
1:10 p.m. Pass Dodge Charger 5.7L AWD
Dodge Charger 3.6 RWD
Dodge Charger 5.7L RWD
1:30 p.m. Ford PI Utility 3.0L EcoBoost AWD
Ford PI Utility 3.3L AWD
Ford PI Utility Hybrid AWD Pass
1:50 p.m. Chevrolet Tahoe 5.3L 4WD
Dodge Durango Pursuit 5.7L Pass Chevrolet Tahoe
5.3L RWD
2:10 p.m. Ford F-150 Police Responder 3.5L
EcoBoost
Dodge Durango Pursuit 3.6L Pass Ford Police Responder
Hybrid Sedan
2:30 p.m. Dodge Charger 5.7L RWD Pass Dodge Charger
5.7L AWD Dodge Charger
3.6 RWD
2:50 p.m. Pass Ford PI Utility 3.0L EcoBoost AWD
Ford PI Utility 3.3L AWD
Ford PI Utility Hybrid AWD
3:10 p.m. Chevrolet Tahoe 5.3L RWD
Chevrolet Tahoe 5.3L 4WD
Dodge Durango Pursuit 5.7L Pass
35
Vehicles Drivers Lap 1 Lap 2 Lap 3 Lap 4 Lap 5 Average
AGEMA 01:40.96 01:40.79 01:40.74 01:40.26 01:40.82 01:40.71DOUVILLE 01:40.46 01:40.28 01:40.29 01:40.98 01:41.11 01:40.62MERCER 01:40.00 01:39.49 01:39.90 01:39.67 01:39.75 01:39.76
SCHWALM 01:41.53 01:40.68 01:41.22 01:40.85 01:41.89 01:41.23
01:40.58DOUVILLE 01:41.98 01:41.69 01:42.01 01:42.25 01:41.66 01:41.92MERCER 01:39.71 01:40.11 01:39.77 01:40.32 01:40.73 01:40.13
SCHWALM 01:41.81 01:40.95 01:41.38 01:42.17 01:43.15 01:41.89
AGEMA 01:41.02 01:41.22 01:41.24 01:40.66 01:40.98 01:41.02
01:41.24SCHWALM 01:39.78 01:39.51 01:39.20 01:38.69 01:39.43 01:39.32
AGEMA 01:38.24 01:39.30 01:38.93 01:38.59 01:39.11 01:38.83DOUVILLE 01:38.85 01:38.97 01:38.91 01:38.80 01:38.94 01:38.89
MERCER 01:38.12 01:38.10 01:37.69 01:37.67 01:38.03 01:37.92
01:38.74AGEMA 01:37.47 01:38.02 01:37.87 01:37.42 01:37.67 01:37.69
DOUVILLE 01:37.39 01:37.29 01:37.38 01:37.45 01:37.45 01:37.39MERCER 01:36.83 01:36.93 01:36.80 01:36.91 01:36.79 01:36.85
SCHWALM 01:38.56 01:37.82 01:38.92 01:38.79 01:38.49 01:38.52
01:37.61MERCER 01:36.65 01:36.48 01:36.73 01:36.47 01:35.79 01:36.42
SCHWALM 01:37.18 01:37.30 01:37.27 01:37.57 01:37.44 01:37.35AGEMA 01:37.23 01:36.98 01:36.84 01:36.89 01:37.21 01:37.03
DOUVILLE 01:37.66 01:37.69 01:37.55 01:37.50 01:37.63 01:37.61
01:37.10DOUVILLE 01:45.82 01:45.56 01:45.31 01:45.76 01:45.91 01:45.67MERCER 01:44.49 01:44.21 01:44.19 01:44.39 01:44.43 01:44.34
SCHWALM 01:45.60 01:45.31 01:45.04 01:45.39 01:45.48 01:45.36
AGEMA 01:46.38 01:46.22 01:46.40 01:46.79 01:46.42 01:46.44
01:45.45
VEHICLE DYNAMICS TESTING ON SEPTEMBER 17, 2018
OVERALL AVERAGE * Refer to page 3 for further details
Chevrolet Tahoe 5.3L RWD
OVERALL AVERAGE * Refer to page 3 for further details
Dodge Charger 3.6L RWD
Chevrolet Tahoe 5.3L 4WD
OVERALL AVERAGE
Dodge Charger 5.7L RWD
Dodge Charger 5.7L AWD
OVERALL AVERAGE
OVERALL AVERAGE
OVERALL AVERAGE
Dodge Durango Pursuit 3.6L
36
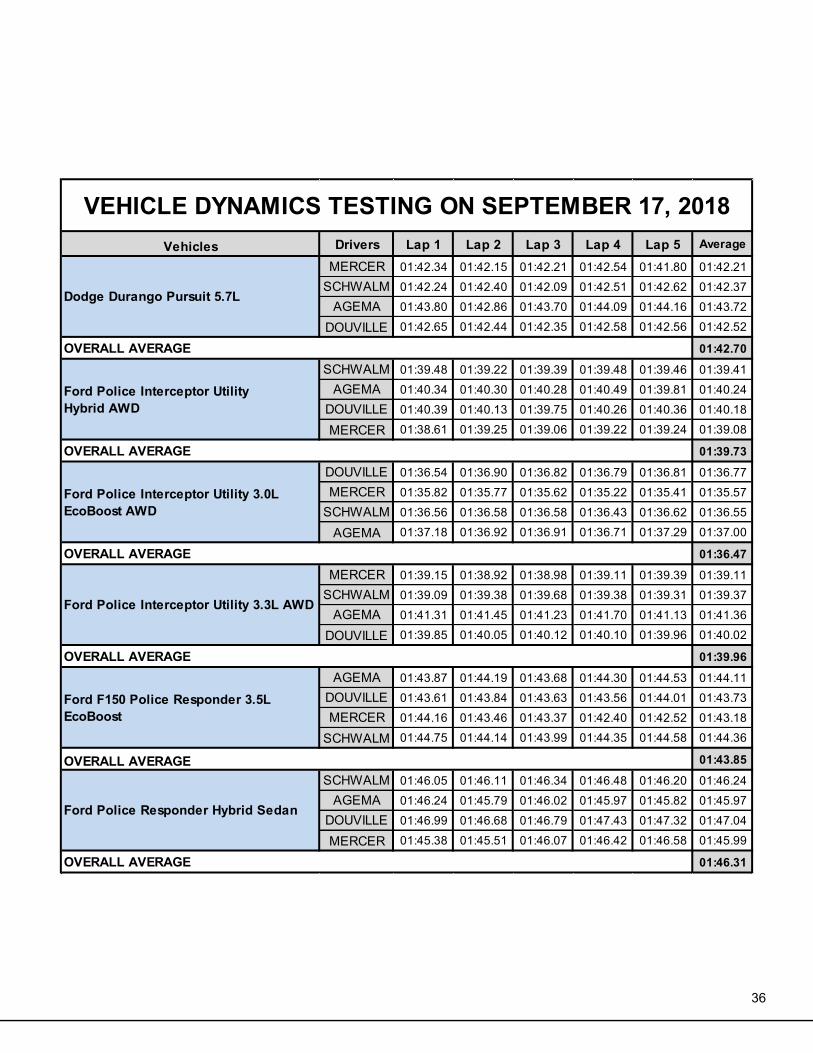
Vehicles Drivers Lap 1 Lap 2 Lap 3 Lap 4 Lap 5 Average
MERCER 01:42.34 01:42.15 01:42.21 01:42.54 01:41.80 01:42.21SCHWALM 01:42.24 01:42.40 01:42.09 01:42.51 01:42.62 01:42.37
AGEMA 01:43.80 01:42.86 01:43.70 01:44.09 01:44.16 01:43.72
DOUVILLE 01:42.65 01:42.44 01:42.35 01:42.58 01:42.56 01:42.52
01:42.70SCHWALM 01:39.48 01:39.22 01:39.39 01:39.48 01:39.46 01:39.41
AGEMA 01:40.34 01:40.30 01:40.28 01:40.49 01:39.81 01:40.24DOUVILLE 01:40.39 01:40.13 01:39.75 01:40.26 01:40.36 01:40.18
MERCER 01:38.61 01:39.25 01:39.06 01:39.22 01:39.24 01:39.08
01:39.73DOUVILLE 01:36.54 01:36.90 01:36.82 01:36.79 01:36.81 01:36.77MERCER 01:35.82 01:35.77 01:35.62 01:35.22 01:35.41 01:35.57
SCHWALM 01:36.56 01:36.58 01:36.58 01:36.43 01:36.62 01:36.55
AGEMA 01:37.18 01:36.92 01:36.91 01:36.71 01:37.29 01:37.00
01:36.47MERCER 01:39.15 01:38.92 01:38.98 01:39.11 01:39.39 01:39.11
SCHWALM 01:39.09 01:39.38 01:39.68 01:39.38 01:39.31 01:39.37AGEMA 01:41.31 01:41.45 01:41.23 01:41.70 01:41.13 01:41.36
DOUVILLE 01:39.85 01:40.05 01:40.12 01:40.10 01:39.96 01:40.02
01:39.96AGEMA 01:43.87 01:44.19 01:43.68 01:44.30 01:44.53 01:44.11
DOUVILLE 01:43.61 01:43.84 01:43.63 01:43.56 01:44.01 01:43.73MERCER 01:44.16 01:43.46 01:43.37 01:42.40 01:42.52 01:43.18
SCHWALM 01:44.75 01:44.14 01:43.99 01:44.35 01:44.58 01:44.36
01:43.85SCHWALM 01:46.05 01:46.11 01:46.34 01:46.48 01:46.20 01:46.24
AGEMA 01:46.24 01:45.79 01:46.02 01:45.97 01:45.82 01:45.97DOUVILLE 01:46.99 01:46.68 01:46.79 01:47.43 01:47.32 01:47.04
MERCER 01:45.38 01:45.51 01:46.07 01:46.42 01:46.58 01:45.99
01:46.31
OVERALL AVERAGE
OVERALL AVERAGE
Ford F150 Police Responder 3.5L EcoBoost
VEHICLE DYNAMICS TESTING ON SEPTEMBER 17, 2018
Ford Police Interceptor Utility 3.3L AWD
Dodge Durango Pursuit 5.7L
OVERALL AVERAGE
OVERALL AVERAGE
Ford Police Interceptor Utility 3.0L EcoBoost AWD
OVERALL AVERAGE
Ford Police Interceptor Utility Hybrid AWD
Ford Police Responder Hybrid Sedan
OVERALL AVERAGE
37
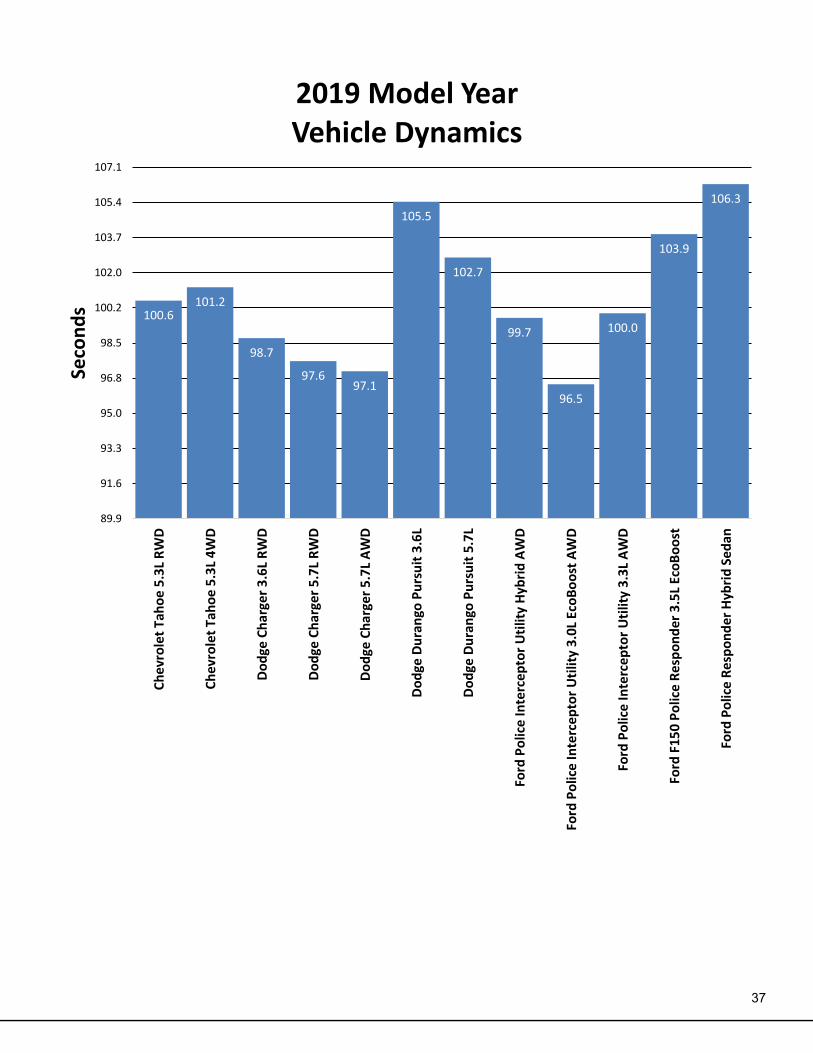
100.6101.2
98.7
97.697.1
105.5
102.7
99.7
96.5
100.0
103.9
106.3
89.9
91.6
93.3
95.0
96.8
98.5
100.2
102.0
103.7
105.4
107.1C
hev
role
t Ta
ho
e 5
.3L
RW
D
Ch
evro
let
Tah
oe
5.3
L 4
WD
Do
dge
Ch
arge
r 3
.6L
RW
D
Do
dge
Ch
arge
r 5
.7L
RW
D
Do
dge
Ch
arge
r 5
.7L
AW
D
Do
dge
Du
ran
go P
urs
uit
3.6
L
Do
dge
Du
ran
go P
urs
uit
5.7
L
Ford
Po
lice
Inte
rcep
tor
Uti
lity
Hyb
rid
AW
D
Ford
Po
lice
Inte
rcep
tor
Uti
lity
3.0
L Ec
oB
oo
st A
WD
Ford
Po
lice
Inte
rcep
tor
Uti
lity
3.3
L A
WD
Ford
F15
0 P
olic
e R
esp
on
de
r 3
.5L
Eco
Bo
ost
Ford
Po
lice
Re
spo
nd
er
Hyb
rid
Se
dan
Seco
nd
s 2019 Model YearVehicle Dynamics
38
39
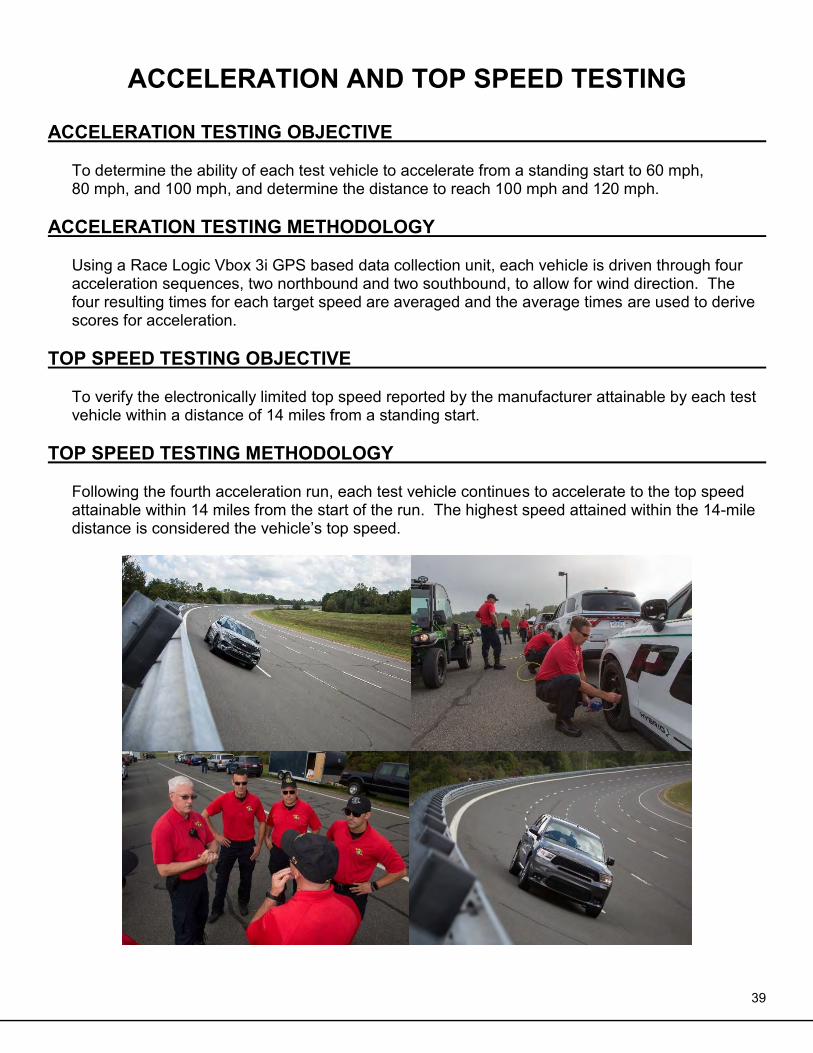
ACCELERATION AND TOP SPEED TESTING
ACCELERATION TESTING OBJECTIVE
To determine the ability of each test vehicle to accelerate from a standing start to 60 mph, 80 mph, and 100 mph, and determine the distance to reach 100 mph and 120 mph.
ACCELERATION TESTING METHODOLOGY
Using a Race Logic Vbox 3i GPS based data collection unit, each vehicle is driven through four acceleration sequences, two northbound and two southbound, to allow for wind direction. The four resulting times for each target speed are averaged and the average times are used to derive scores for acceleration.
TOP SPEED TESTING OBJECTIVE
To verify the electronically limited top speed reported by the manufacturer attainable by each test vehicle within a distance of 14 miles from a standing start.
TOP SPEED TESTING METHODOLOGY
Following the fourth acceleration run, each test vehicle continues to accelerate to the top speed attainable within 14 miles from the start of the run. The highest speed attained within the 14-mile distance is considered the vehicle’s top speed.
40
41
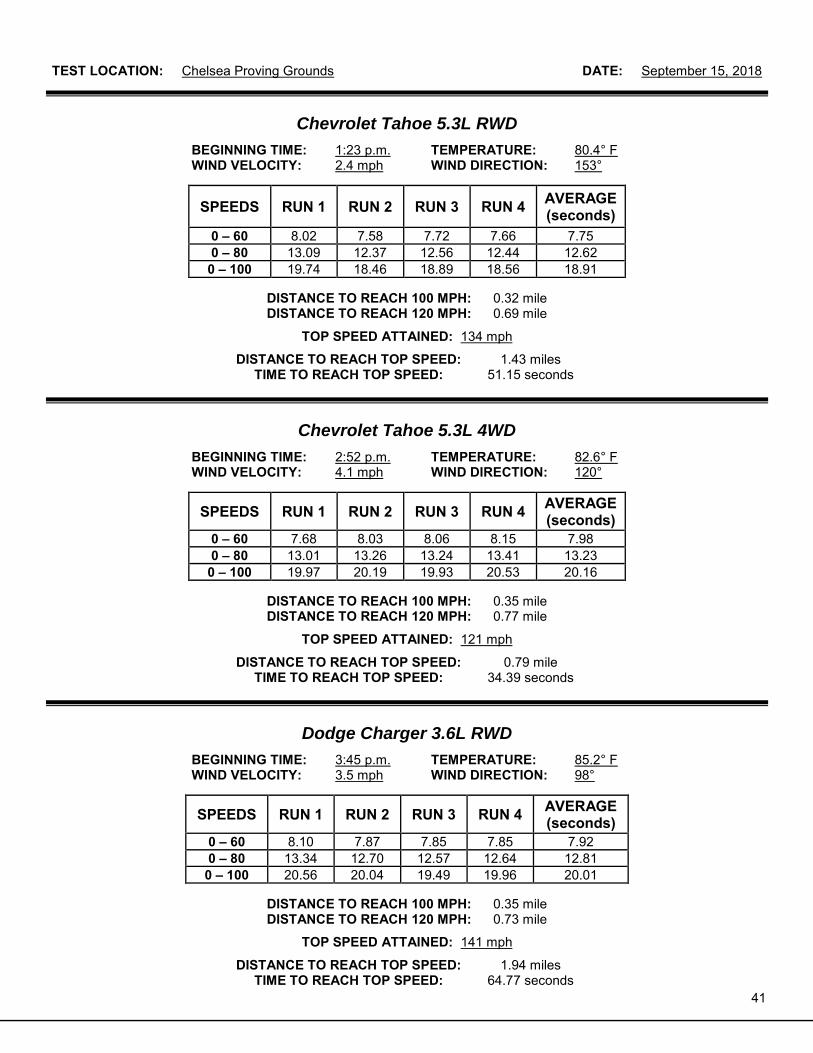
TEST LOCATION: Chelsea Proving Grounds DATE: September 15, 2018
Chevrolet Tahoe 5.3L RWD
BEGINNING TIME: 1:23 p.m. TEMPERATURE: 80.4° F WIND VELOCITY: 2.4 mph WIND DIRECTION: 153°
SPEEDS RUN 1 RUN 2 RUN 3 RUN 4 AVERAGE (seconds)
0 – 60 8.02 7.58 7.72 7.66 7.75 0 – 80 13.09 12.37 12.56 12.44 12.62 0 – 100 19.74 18.46 18.89 18.56 18.91
DISTANCE TO REACH 100 MPH: 0.32 mile DISTANCE TO REACH 120 MPH: 0.69 mile
TOP SPEED ATTAINED: 134 mph
DISTANCE TO REACH TOP SPEED: 1.43 miles TIME TO REACH TOP SPEED: 51.15 seconds
Chevrolet Tahoe 5.3L 4WD
BEGINNING TIME: 2:52 p.m. TEMPERATURE: 82.6° F WIND VELOCITY: 4.1 mph WIND DIRECTION: 120°
SPEEDS RUN 1 RUN 2 RUN 3 RUN 4 AVERAGE (seconds)
0 – 60 7.68 8.03 8.06 8.15 7.98 0 – 80 13.01 13.26 13.24 13.41 13.23 0 – 100 19.97 20.19 19.93 20.53 20.16
DISTANCE TO REACH 100 MPH: 0.35 mile DISTANCE TO REACH 120 MPH: 0.77 mile
TOP SPEED ATTAINED: 121 mph
DISTANCE TO REACH TOP SPEED: 0.79 mile TIME TO REACH TOP SPEED: 34.39 seconds
Dodge Charger 3.6L RWD
BEGINNING TIME: 3:45 p.m. TEMPERATURE: 85.2° F WIND VELOCITY: 3.5 mph WIND DIRECTION: 98°
SPEEDS RUN 1 RUN 2 RUN 3 RUN 4 AVERAGE (seconds)
0 – 60 8.10 7.87 7.85 7.85 7.92 0 – 80 13.34 12.70 12.57 12.64 12.81 0 – 100 20.56 20.04 19.49 19.96 20.01
DISTANCE TO REACH 100 MPH: 0.35 mile DISTANCE TO REACH 120 MPH: 0.73 mile
TOP SPEED ATTAINED: 141 mph
DISTANCE TO REACH TOP SPEED: 1.94 miles TIME TO REACH TOP SPEED: 64.77 seconds
42
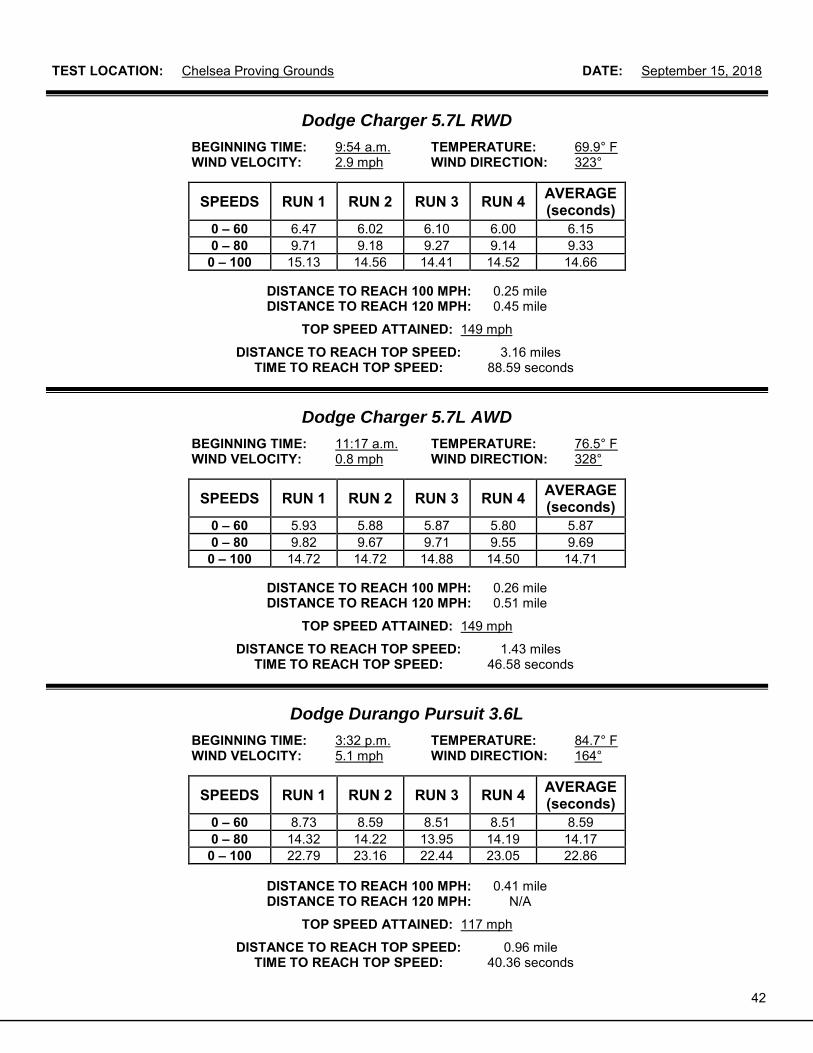
TEST LOCATION: Chelsea Proving Grounds DATE: September 15, 2018
Dodge Charger 5.7L RWD
BEGINNING TIME: 9:54 a.m. TEMPERATURE: 69.9° F WIND VELOCITY: 2.9 mph WIND DIRECTION: 323°
SPEEDS RUN 1 RUN 2 RUN 3 RUN 4 AVERAGE (seconds)
0 – 60 6.47 6.02 6.10 6.00 6.15 0 – 80 9.71 9.18 9.27 9.14 9.33 0 – 100 15.13 14.56 14.41 14.52 14.66
DISTANCE TO REACH 100 MPH: 0.25 mile DISTANCE TO REACH 120 MPH: 0.45 mile
TOP SPEED ATTAINED: 149 mph
DISTANCE TO REACH TOP SPEED: 3.16 miles TIME TO REACH TOP SPEED: 88.59 seconds
Dodge Charger 5.7L AWD
BEGINNING TIME: 11:17 a.m. TEMPERATURE: 76.5° F WIND VELOCITY: 0.8 mph WIND DIRECTION: 328°
SPEEDS RUN 1 RUN 2 RUN 3 RUN 4 AVERAGE (seconds)
0 – 60 5.93 5.88 5.87 5.80 5.87 0 – 80 9.82 9.67 9.71 9.55 9.69 0 – 100 14.72 14.72 14.88 14.50 14.71
DISTANCE TO REACH 100 MPH: 0.26 mile DISTANCE TO REACH 120 MPH: 0.51 mile
TOP SPEED ATTAINED: 149 mph
DISTANCE TO REACH TOP SPEED: 1.43 miles TIME TO REACH TOP SPEED: 46.58 seconds
Dodge Durango Pursuit 3.6L
BEGINNING TIME: 3:32 p.m. TEMPERATURE: 84.7° F WIND VELOCITY: 5.1 mph WIND DIRECTION: 164°
SPEEDS RUN 1 RUN 2 RUN 3 RUN 4 AVERAGE (seconds)
0 – 60 8.73 8.59 8.51 8.51 8.59 0 – 80 14.32 14.22 13.95 14.19 14.17 0 – 100 22.79 23.16 22.44 23.05 22.86
DISTANCE TO REACH 100 MPH: 0.41 mile DISTANCE TO REACH 120 MPH: N/A
TOP SPEED ATTAINED: 117 mph
DISTANCE TO REACH TOP SPEED: 0.96 mile TIME TO REACH TOP SPEED: 40.36 seconds
43
TEST LOCATION: Chelsea Proving Grounds DATE: September 15, 2018
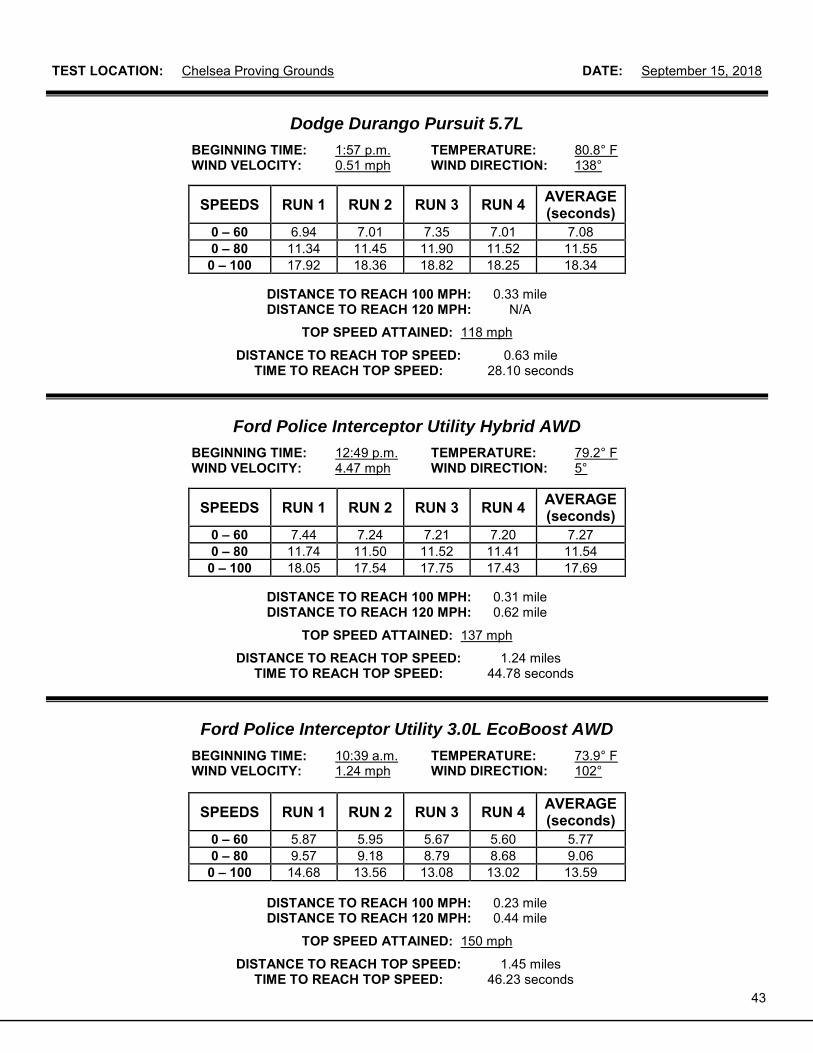
Dodge Durango Pursuit 5.7L
BEGINNING TIME: 1:57 p.m. TEMPERATURE: 80.8° F WIND VELOCITY: 0.51 mph WIND DIRECTION: 138°
SPEEDS RUN 1 RUN 2 RUN 3 RUN 4 AVERAGE (seconds)
0 – 60 6.94 7.01 7.35 7.01 7.08 0 – 80 11.34 11.45 11.90 11.52 11.55 0 – 100 17.92 18.36 18.82 18.25 18.34
DISTANCE TO REACH 100 MPH: 0.33 mile DISTANCE TO REACH 120 MPH: N/A
TOP SPEED ATTAINED: 118 mph
DISTANCE TO REACH TOP SPEED: 0.63 mile TIME TO REACH TOP SPEED: 28.10 seconds
Ford Police Interceptor Utility Hybrid AWD
BEGINNING TIME: 12:49 p.m. TEMPERATURE: 79.2° F WIND VELOCITY: 4.47 mph WIND DIRECTION: 5°
SPEEDS RUN 1 RUN 2 RUN 3 RUN 4 AVERAGE (seconds)
0 – 60 7.44 7.24 7.21 7.20 7.27 0 – 80 11.74 11.50 11.52 11.41 11.54 0 – 100 18.05 17.54 17.75 17.43 17.69
DISTANCE TO REACH 100 MPH: 0.31 mile DISTANCE TO REACH 120 MPH: 0.62 mile
TOP SPEED ATTAINED: 137 mph
DISTANCE TO REACH TOP SPEED: 1.24 miles TIME TO REACH TOP SPEED: 44.78 seconds
Ford Police Interceptor Utility 3.0L EcoBoost AWD
BEGINNING TIME: 10:39 a.m. TEMPERATURE: 73.9° F WIND VELOCITY: 1.24 mph WIND DIRECTION: 102°
SPEEDS RUN 1 RUN 2 RUN 3 RUN 4 AVERAGE (seconds)
0 – 60 5.87 5.95 5.67 5.60 5.77 0 – 80 9.57 9.18 8.79 8.68 9.06 0 – 100 14.68 13.56 13.08 13.02 13.59
DISTANCE TO REACH 100 MPH: 0.23 mile DISTANCE TO REACH 120 MPH: 0.44 mile
TOP SPEED ATTAINED: 150 mph
DISTANCE TO REACH TOP SPEED: 1.45 miles TIME TO REACH TOP SPEED: 46.23 seconds
44
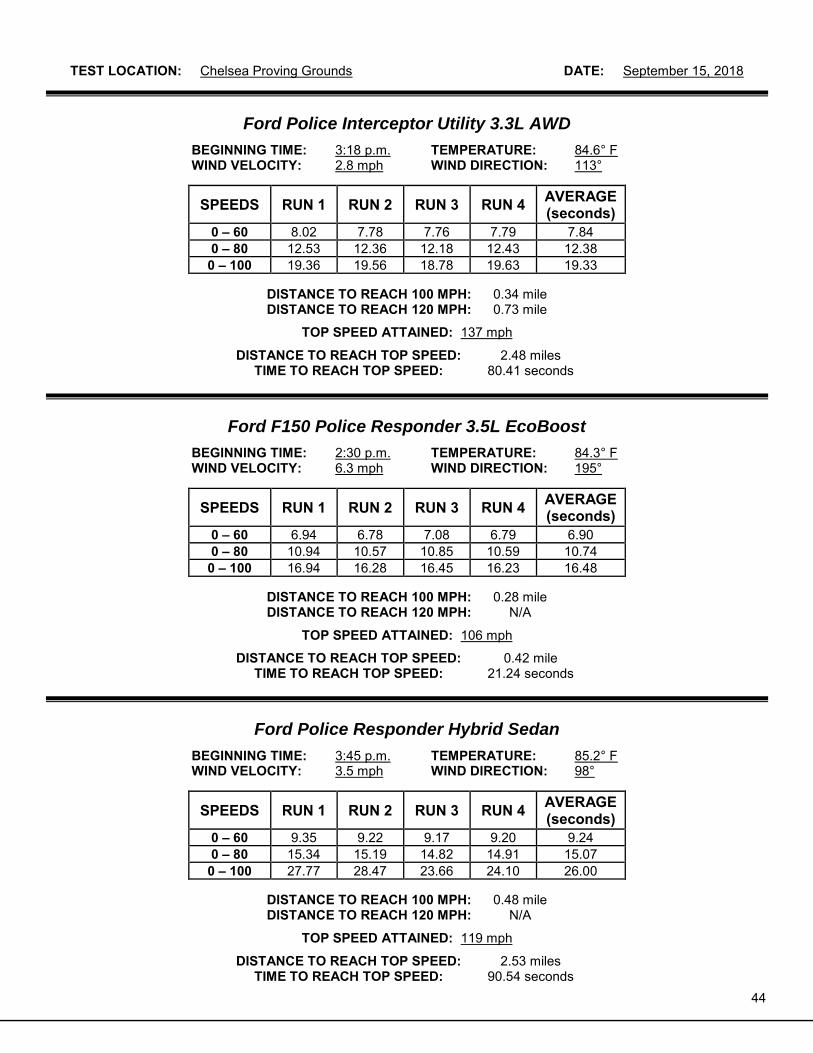
TEST LOCATION: Chelsea Proving Grounds DATE: September 15, 2018
Ford Police Interceptor Utility 3.3L AWD
BEGINNING TIME: 3:18 p.m. TEMPERATURE: 84.6° F WIND VELOCITY: 2.8 mph WIND DIRECTION: 113°
SPEEDS RUN 1 RUN 2 RUN 3 RUN 4 AVERAGE (seconds)
0 – 60 8.02 7.78 7.76 7.79 7.84 0 – 80 12.53 12.36 12.18 12.43 12.38 0 – 100 19.36 19.56 18.78 19.63 19.33
DISTANCE TO REACH 100 MPH: 0.34 mile DISTANCE TO REACH 120 MPH: 0.73 mile
TOP SPEED ATTAINED: 137 mph
DISTANCE TO REACH TOP SPEED: 2.48 miles TIME TO REACH TOP SPEED: 80.41 seconds
Ford F150 Police Responder 3.5L EcoBoost
BEGINNING TIME: 2:30 p.m. TEMPERATURE: 84.3° F WIND VELOCITY: 6.3 mph WIND DIRECTION: 195°
SPEEDS RUN 1 RUN 2 RUN 3 RUN 4 AVERAGE (seconds)
0 – 60 6.94 6.78 7.08 6.79 6.90 0 – 80 10.94 10.57 10.85 10.59 10.74 0 – 100 16.94 16.28 16.45 16.23 16.48
DISTANCE TO REACH 100 MPH: 0.28 mile DISTANCE TO REACH 120 MPH: N/A
TOP SPEED ATTAINED: 106 mph
DISTANCE TO REACH TOP SPEED: 0.42 mile TIME TO REACH TOP SPEED: 21.24 seconds
Ford Police Responder Hybrid Sedan
BEGINNING TIME: 3:45 p.m. TEMPERATURE: 85.2° F WIND VELOCITY: 3.5 mph WIND DIRECTION: 98°
SPEEDS RUN 1 RUN 2 RUN 3 RUN 4 AVERAGE (seconds)
0 – 60 9.35 9.22 9.17 9.20 9.24 0 – 80 15.34 15.19 14.82 14.91 15.07 0 – 100 27.77 28.47 23.66 24.10 26.00
DISTANCE TO REACH 100 MPH: 0.48 mile DISTANCE TO REACH 120 MPH: N/A
TOP SPEED ATTAINED: 119 mph
DISTANCE TO REACH TOP SPEED: 2.53 miles TIME TO REACH TOP SPEED: 90.54 seconds
45
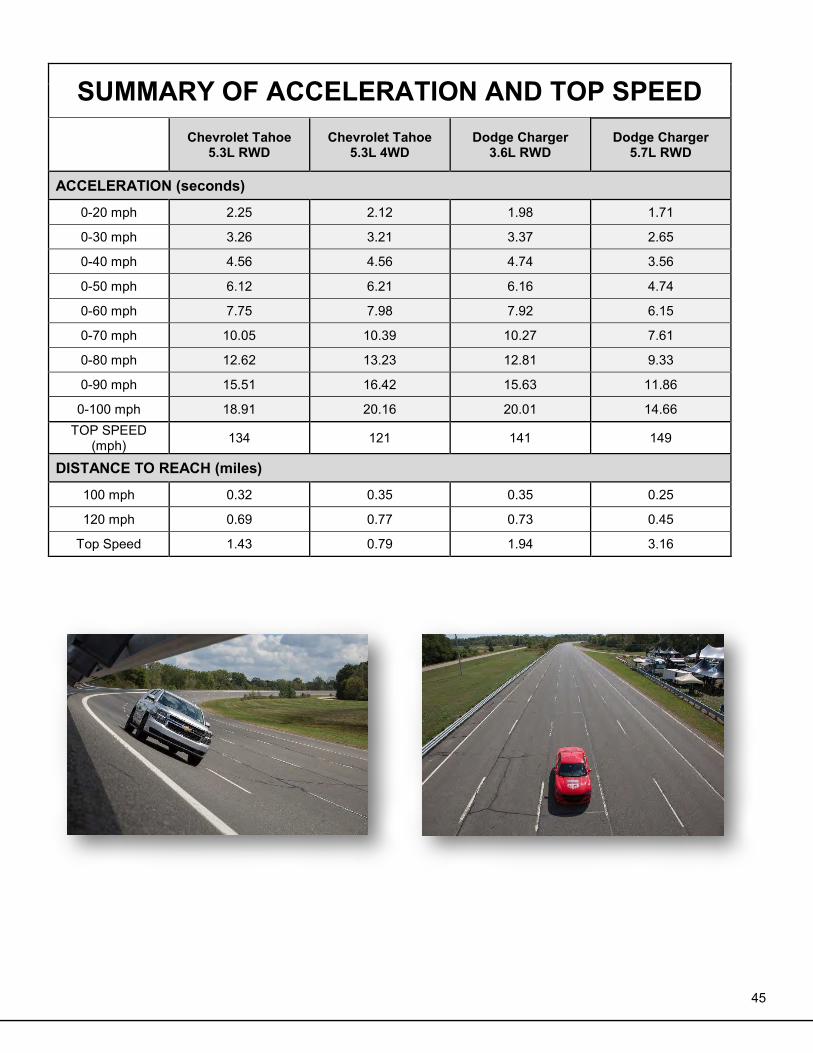
SUMMARY OF ACCELERATION AND TOP SPEED
Chevrolet Tahoe 5.3L RWD
Chevrolet Tahoe 5.3L 4WD
Dodge Charger 3.6L RWD
Dodge Charger 5.7L RWD
ACCELERATION (seconds) 0-20 mph 2.25 2.12 1.98 1.71
0-30 mph 3.26 3.21 3.37 2.65
0-40 mph 4.56 4.56 4.74 3.56
0-50 mph 6.12 6.21 6.16 4.74
0-60 mph 7.75 7.98 7.92 6.15
0-70 mph 10.05 10.39 10.27 7.61
0-80 mph 12.62 13.23 12.81 9.33
0-90 mph 15.51 16.42 15.63 11.86
0-100 mph 18.91 20.16 20.01 14.66 TOP SPEED
(mph) 134 121 141 149
DISTANCE TO REACH (miles) 100 mph 0.32 0.35 0.35 0.25
120 mph 0.69 0.77 0.73 0.45
Top Speed 1.43 0.79 1.94 3.16
46
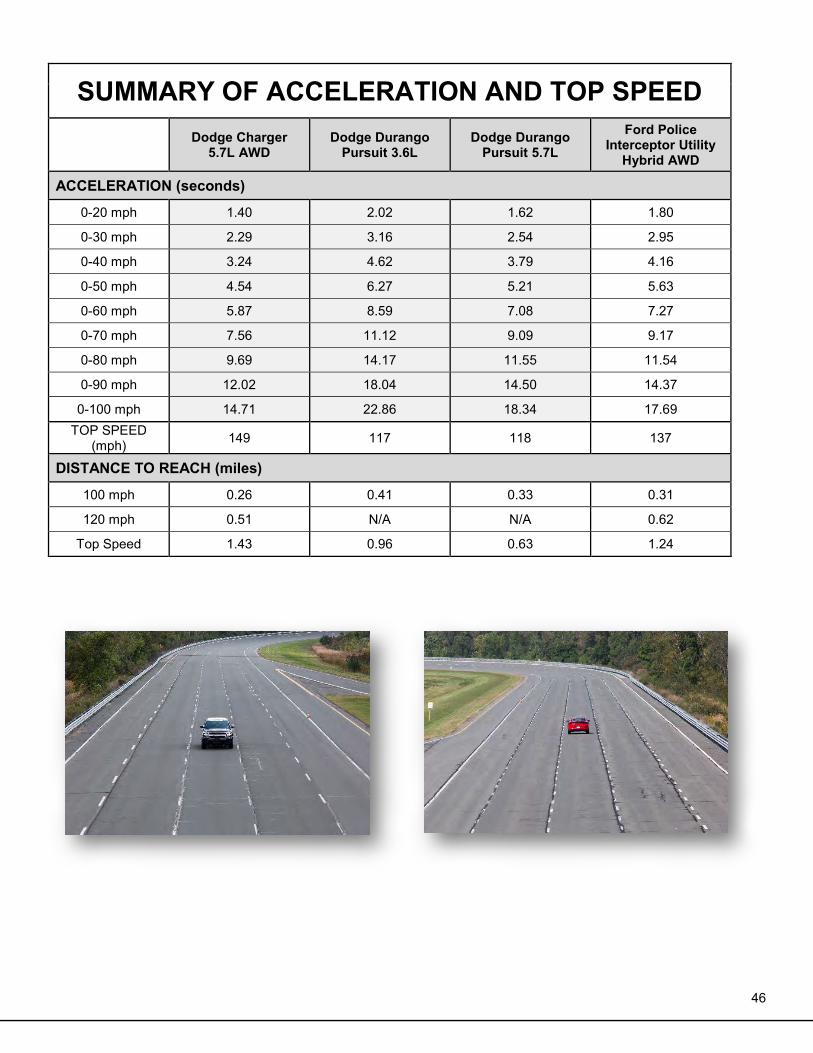
SUMMARY OF ACCELERATION AND TOP SPEED
Dodge Charger 5.7L AWD
Dodge Durango Pursuit 3.6L
Dodge Durango Pursuit 5.7L
Ford Police Interceptor Utility
Hybrid AWD
ACCELERATION (seconds) 0-20 mph 1.40 2.02 1.62 1.80
0-30 mph 2.29 3.16 2.54 2.95
0-40 mph 3.24 4.62 3.79 4.16
0-50 mph 4.54 6.27 5.21 5.63
0-60 mph 5.87 8.59 7.08 7.27
0-70 mph 7.56 11.12 9.09 9.17
0-80 mph 9.69 14.17 11.55 11.54
0-90 mph 12.02 18.04 14.50 14.37
0-100 mph 14.71 22.86 18.34 17.69 TOP SPEED
(mph) 149 117 118 137
DISTANCE TO REACH (miles) 100 mph 0.26 0.41 0.33 0.31
120 mph 0.51 N/A N/A 0.62
Top Speed 1.43 0.96 0.63 1.24
47
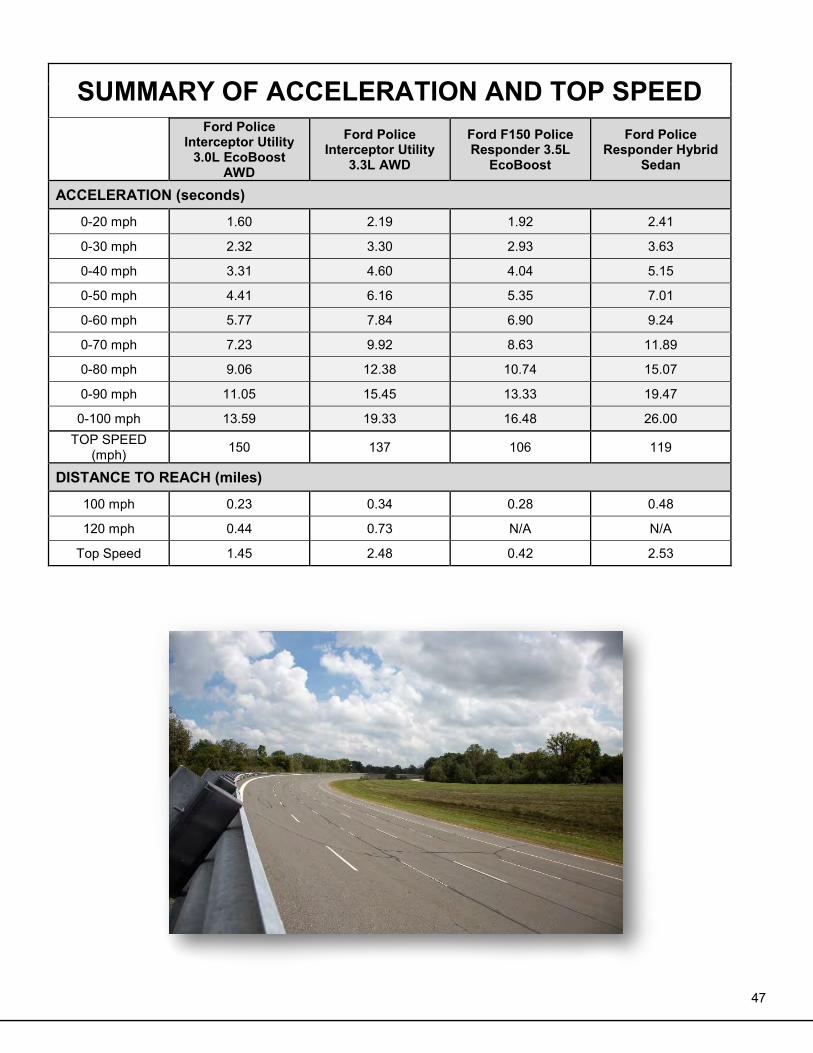
SUMMARY OF ACCELERATION AND TOP SPEED
Ford Police Interceptor Utility
3.0L EcoBoost AWD
Ford Police Interceptor Utility
3.3L AWD
Ford F150 Police Responder 3.5L
EcoBoost
Ford Police Responder Hybrid
Sedan
ACCELERATION (seconds) 0-20 mph 1.60 2.19 1.92 2.41
0-30 mph 2.32 3.30 2.93 3.63
0-40 mph 3.31 4.60 4.04 5.15
0-50 mph 4.41 6.16 5.35 7.01
0-60 mph 5.77 7.84 6.90 9.24
0-70 mph 7.23 9.92 8.63 11.89
0-80 mph 9.06 12.38 10.74 15.07
0-90 mph 11.05 15.45 13.33 19.47
0-100 mph 13.59 19.33 16.48 26.00 TOP SPEED
(mph) 150 137 106 119
DISTANCE TO REACH (miles) 100 mph 0.23 0.34 0.28 0.48
120 mph 0.44 0.73 N/A N/A
Top Speed 1.45 2.48 0.42 2.53
48
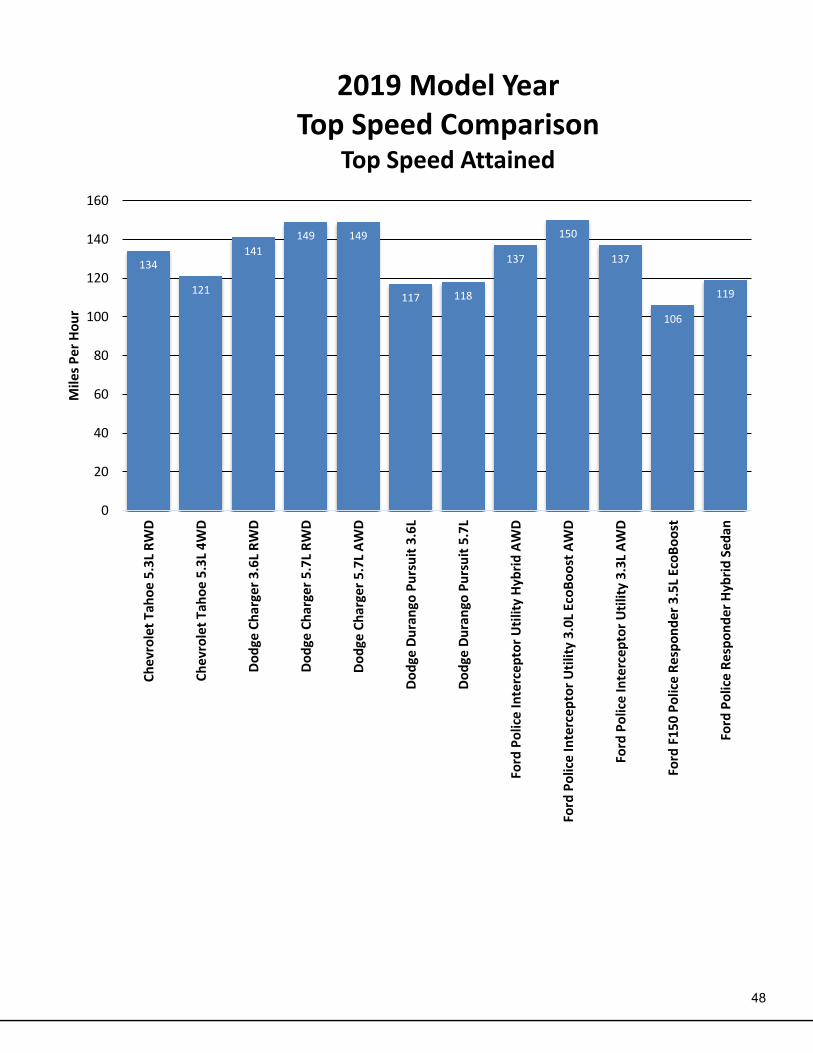
134
121
141
149 149
117 118
137
150
137
106
119
0
20
40
60
80
100
120
140
160
Ch
evro
let
Tah
oe
5.3
L R
WD
Ch
evro
let
Tah
oe
5.3
L 4
WD
Do
dge
Ch
arge
r 3
.6L
RW
D
Do
dge
Ch
arge
r 5
.7L
RW
D
Do
dge
Ch
arge
r 5
.7L
AW
D
Do
dge
Du
ran
go P
urs
uit
3.6
L
Do
dge
Du
ran
go P
urs
uit
5.7
L
Ford
Po
lice
Inte
rcep
tor
Uti
lity
Hyb
rid
AW
D
Ford
Po
lice
Inte
rcep
tor
Uti
lity
3.0
L Ec
oB
oo
st A
WD
Ford
Po
lice
Inte
rcep
tor
Uti
lity
3.3
L A
WD
Ford
F15
0 P
olic
e R
esp
on
der
3.5
L Ec
oB
oo
st
Ford
Po
lice
Re
spo
nd
er
Hyb
rid
Se
dan
Mile
s P
er
Ho
ur
2019 Model Year Top Speed Comparison
Top Speed Attained
49
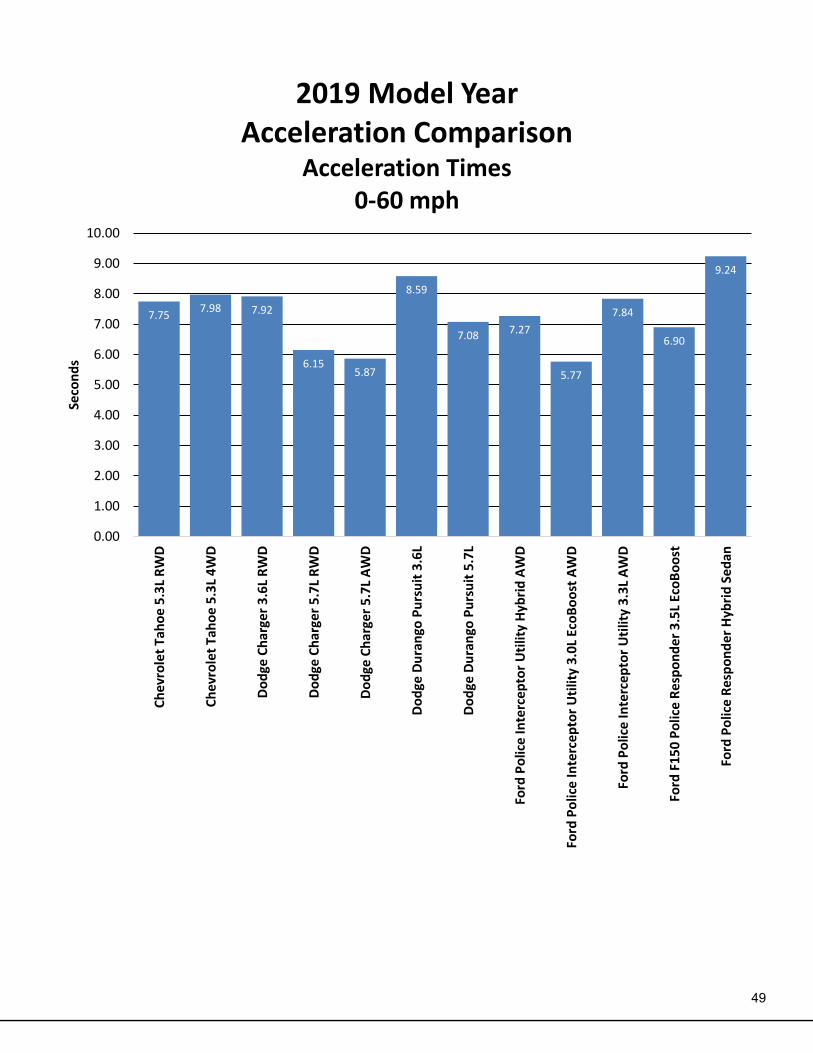
7.757.98 7.92
6.155.87
8.59
7.08 7.27
5.77
7.84
6.90
9.24
0.00
1.00
2.00
3.00
4.00
5.00
6.00
7.00
8.00
9.00
10.00
Ch
evro
let
Tah
oe
5.3
L R
WD
Ch
evro
let
Tah
oe
5.3
L 4
WD
Do
dge
Ch
arge
r 3
.6L
RW
D
Do
dge
Ch
arge
r 5
.7L
RW
D
Do
dge
Ch
arge
r 5
.7L
AW
D
Do
dge
Du
ran
go P
urs
uit
3.6
L
Do
dge
Du
ran
go P
urs
uit
5.7
L
Ford
Po
lice
Inte
rcep
tor
Uti
lity
Hyb
rid
AW
D
Ford
Po
lice
Inte
rcep
tor
Uti
lity
3.0
L Ec
oB
oo
st A
WD
Ford
Po
lice
Inte
rcep
tor
Uti
lity
3.3
L A
WD
Ford
F1
50
Po
lice
Re
spo
nd
er
3.5
L Ec
oB
oo
st
Ford
Po
lice
Re
spo
nd
er
Hyb
rid
Se
dan
Seco
nd
s
2019 Model YearAcceleration Comparison
Acceleration Times0-60 mph
50
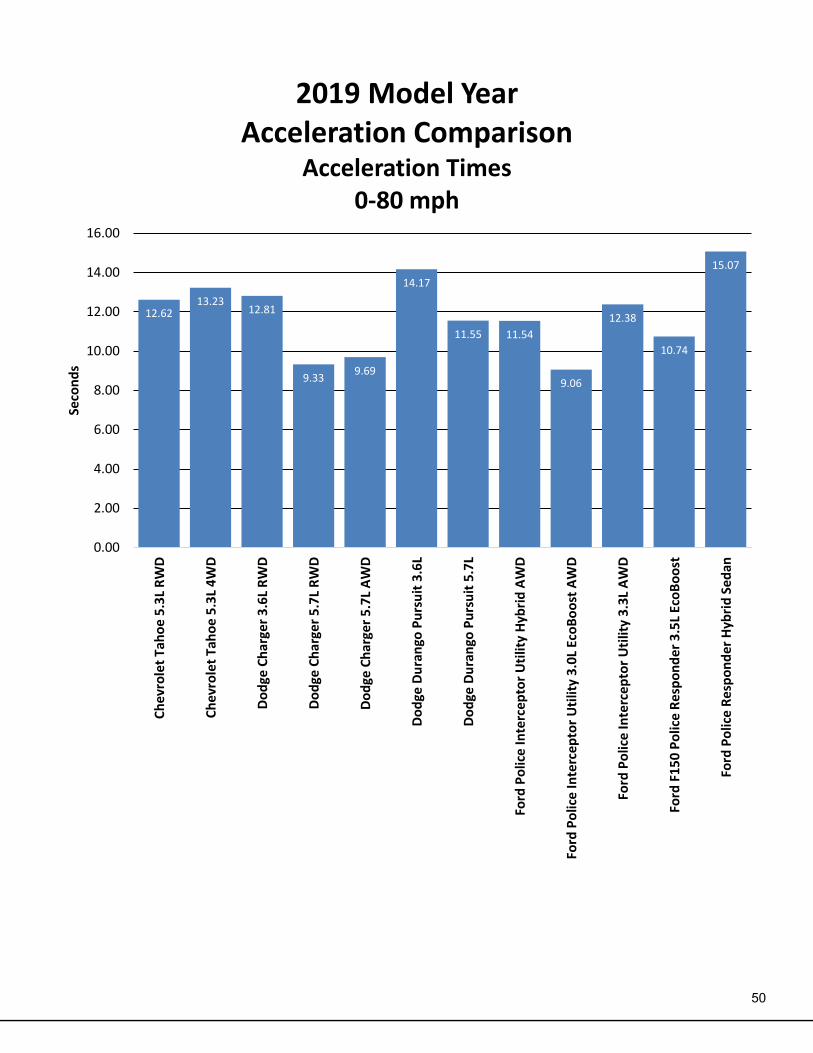
12.6213.23
12.81
9.339.69
14.17
11.55 11.54
9.06
12.38
10.74
15.07
0.00
2.00
4.00
6.00
8.00
10.00
12.00
14.00
16.00
Ch
evro
let
Tah
oe
5.3
L R
WD
Ch
evro
let
Tah
oe
5.3
L 4
WD
Do
dge
Ch
arge
r 3
.6L
RW
D
Do
dge
Ch
arge
r 5
.7L
RW
D
Do
dge
Ch
arge
r 5
.7L
AW
D
Do
dge
Du
ran
go P
urs
uit
3.6
L
Do
dge
Du
ran
go P
urs
uit
5.7
L
Ford
Po
lice
Inte
rcep
tor
Uti
lity
Hyb
rid
AW
D
Ford
Po
lice
Inte
rcep
tor
Uti
lity
3.0
L Ec
oB
oo
st A
WD
Ford
Po
lice
Inte
rcep
tor
Uti
lity
3.3
L A
WD
Ford
F1
50
Po
lice
Re
spo
nd
er
3.5
L Ec
oB
oo
st
Ford
Po
lice
Re
spo
nd
er
Hyb
rid
Se
dan
Seco
nd
s
2019 Model YearAcceleration Comparison
Acceleration Times0-80 mph
51
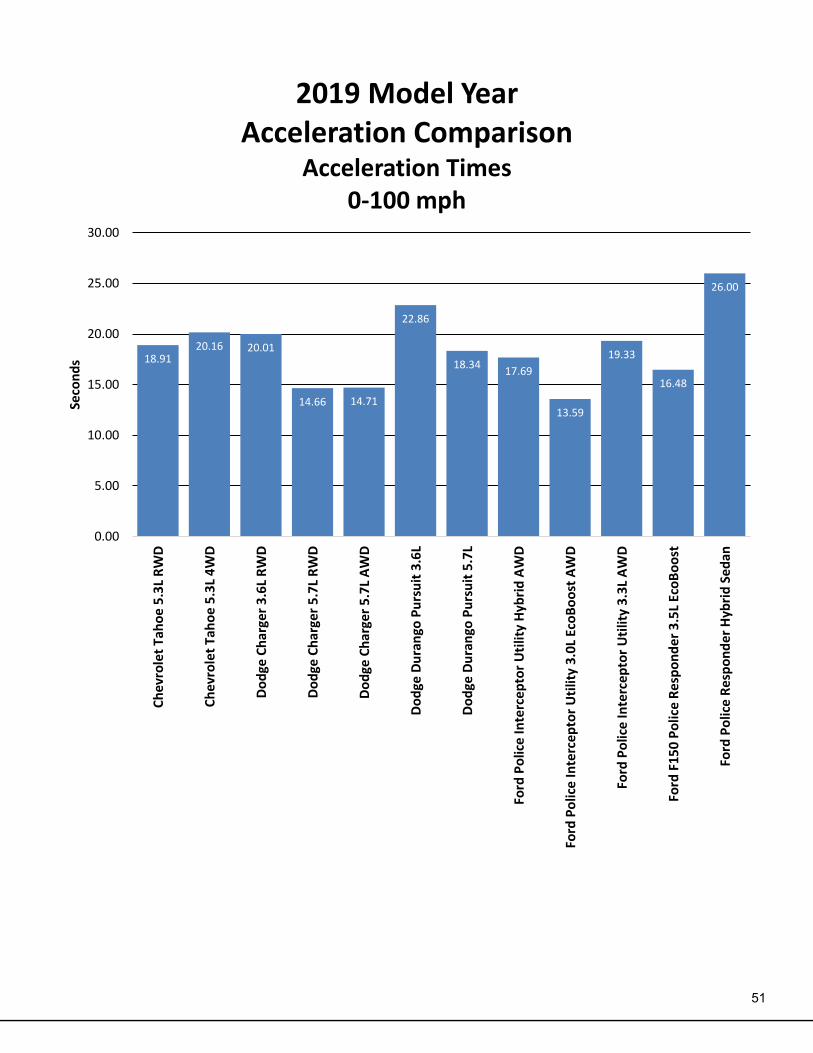
18.9120.16 20.01
14.66 14.71
22.86
18.3417.69
13.59
19.33
16.48
26.00
0.00
5.00
10.00
15.00
20.00
25.00
30.00
Ch
evro
let
Tah
oe
5.3
L R
WD
Ch
evro
let
Tah
oe
5.3
L 4
WD
Do
dge
Ch
arge
r 3
.6L
RW
D
Do
dge
Ch
arge
r 5
.7L
RW
D
Do
dge
Ch
arge
r 5
.7L
AW
D
Do
dge
Du
ran
go P
urs
uit
3.6
L
Do
dge
Du
ran
go P
urs
uit
5.7
L
Ford
Po
lice
Inte
rcep
tor
Uti
lity
Hyb
rid
AW
D
Ford
Po
lice
Inte
rcep
tor
Uti
lity
3.0
L Ec
oB
oo
st A
WD
Ford
Po
lice
Inte
rcep
tor
Uti
lity
3.3
L A
WD
Ford
F1
50
Po
lice
Re
spo
nd
er
3.5
L Ec
oB
oo
st
Ford
Po
lice
Re
spo
nd
er
Hyb
rid
Se
dan
Seco
nd
s
2019 Model YearAcceleration Comparison
Acceleration Times0-100 mph

52
53
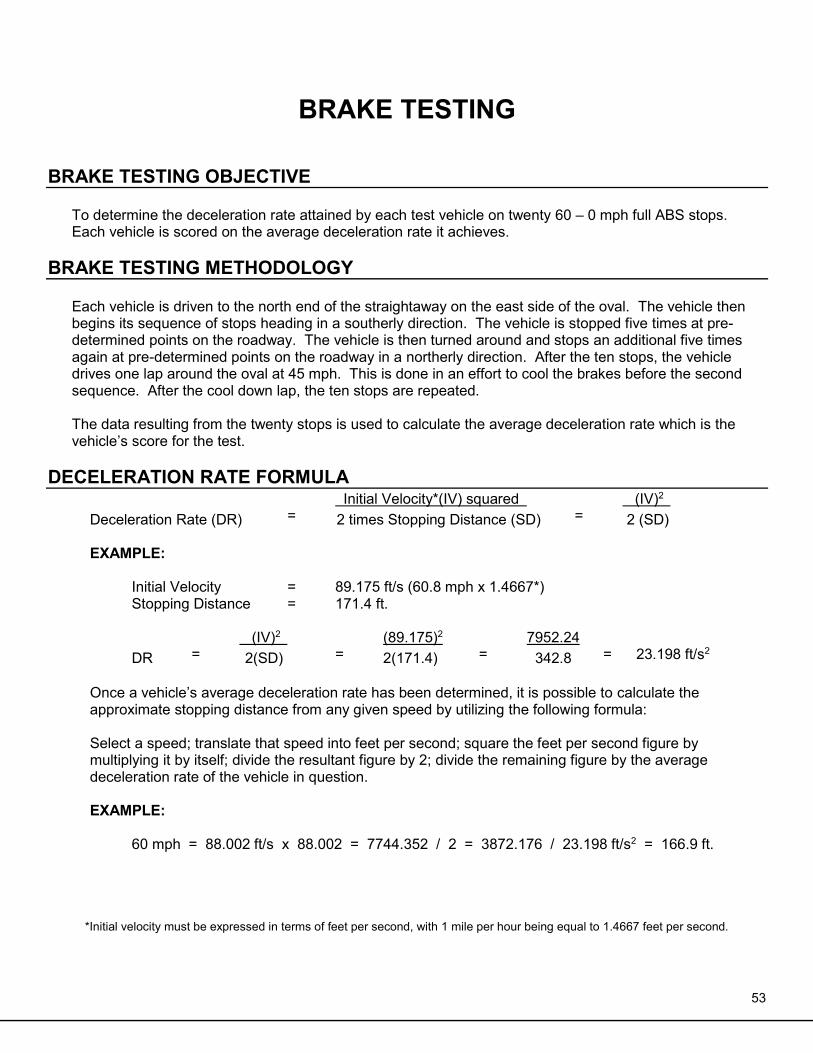
BRAKE TESTING
BRAKE TESTING OBJECTIVE
To determine the deceleration rate attained by each test vehicle on twenty 60 – 0 mph full ABS stops. Each vehicle is scored on the average deceleration rate it achieves.
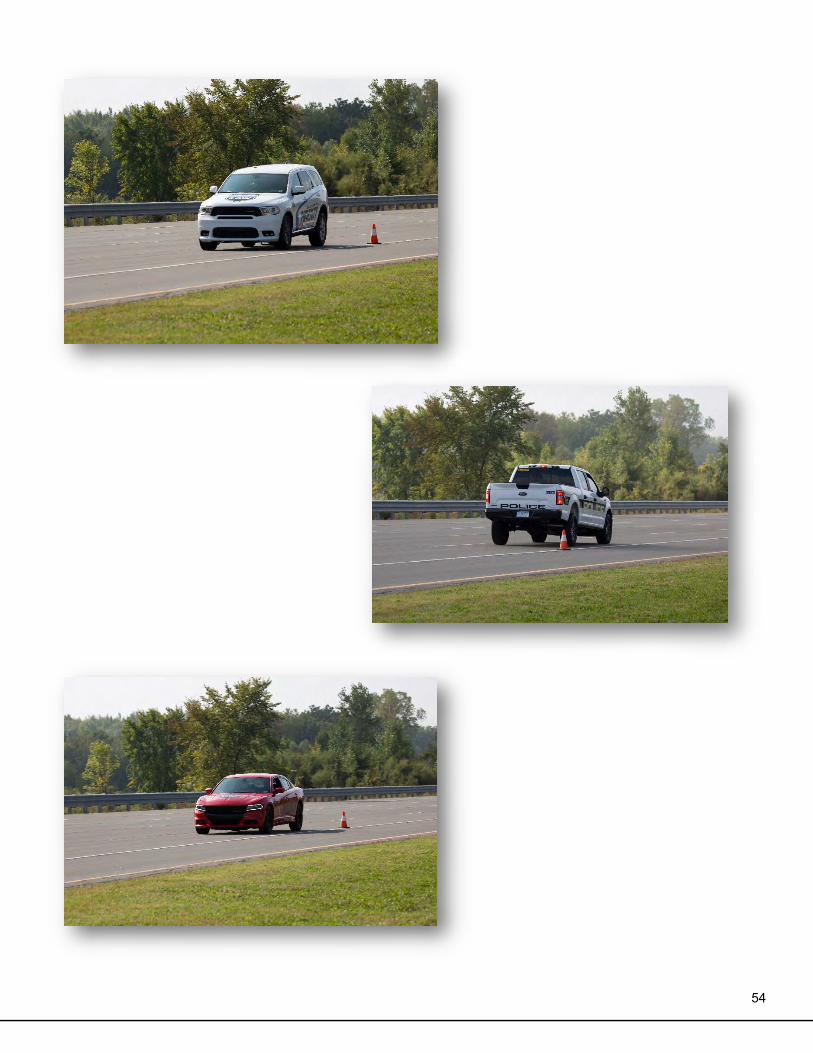
BRAKE TESTING METHODOLOGY
Each vehicle is driven to the north end of the straightaway on the east side of the oval. The vehicle then begins its sequence of stops heading in a southerly direction. The vehicle is stopped five times at pre-determined points on the roadway. The vehicle is then turned around and stops an additional five times again at pre-determined points on the roadway in a northerly direction. After the ten stops, the vehicle drives one lap around the oval at 45 mph. This is done in an effort to cool the brakes before the second sequence. After the cool down lap, the ten stops are repeated. The data resulting from the twenty stops is used to calculate the average deceleration rate which is the vehicle’s score for the test.
DECELERATION RATE FORMULA Initial Velocity*(IV) squared (IV)2
Deceleration Rate (DR) = 2 times Stopping Distance (SD) = 2 (SD) EXAMPLE:
Initial Velocity = 89.175 ft/s (60.8 mph x 1.4667*) Stopping Distance = 171.4 ft. (IV)2 (89.175)2 7952.24 DR = 2(SD) = 2(171.4) = 342.8 = 23.198 ft/s2
Once a vehicle’s average deceleration rate has been determined, it is possible to calculate the approximate stopping distance from any given speed by utilizing the following formula:
Select a speed; translate that speed into feet per second; square the feet per second figure by multiplying it by itself; divide the resultant figure by 2; divide the remaining figure by the average deceleration rate of the vehicle in question. EXAMPLE:
60 mph = 88.002 ft/s x 88.002 = 7744.352 / 2 = 3872.176 / 23.198 ft/s2 = 166.9 ft.
*Initial velocity must be expressed in terms of feet per second, with 1 mile per hour being equal to 1.4667 feet per second.
54
55
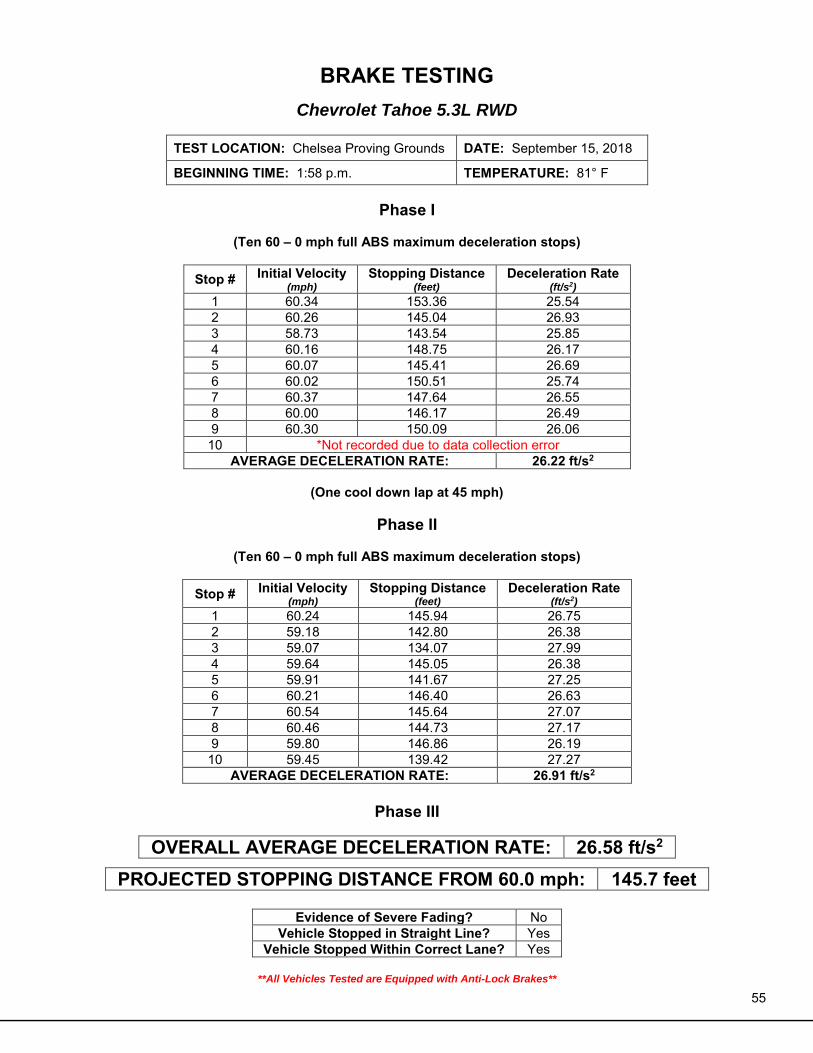
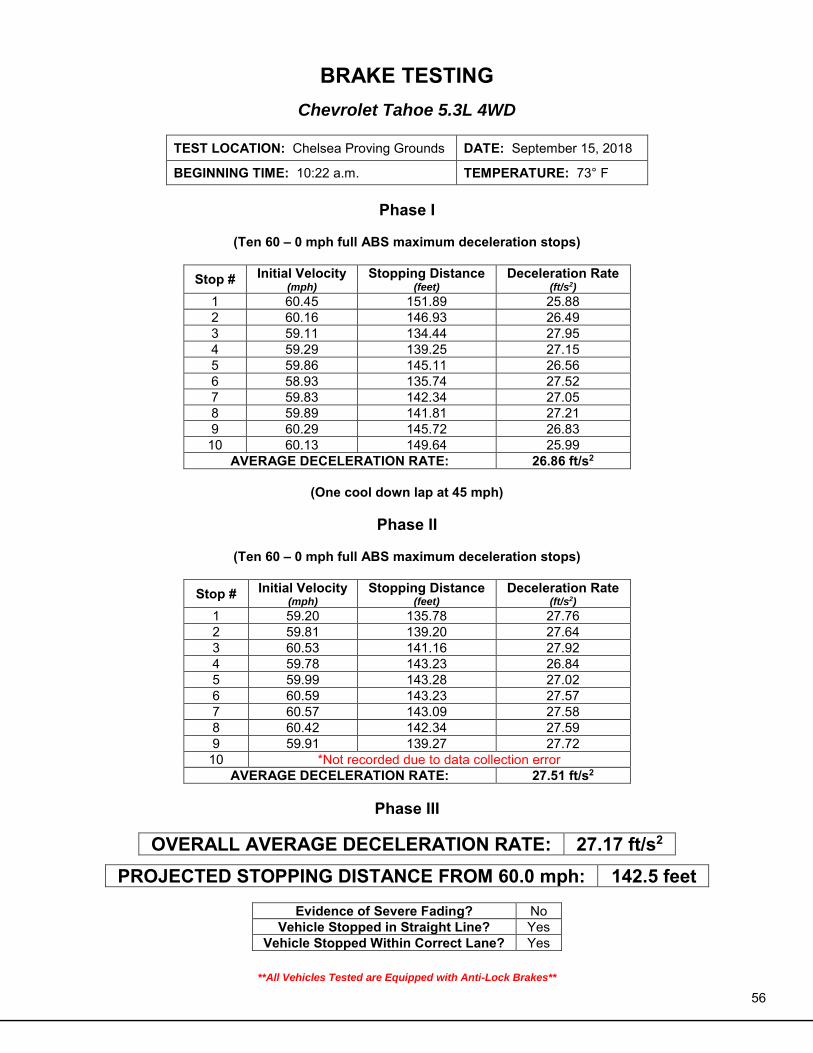
BRAKE TESTING
Chevrolet Tahoe 5.3L RWD
TEST LOCATION: Chelsea Proving Grounds DATE: September 15, 2018
BEGINNING TIME: 1:58 p.m. TEMPERATURE: 81° F
Phase I
(Ten 60 – 0 mph full ABS maximum deceleration stops)
Stop # Initial Velocity (mph)
Stopping Distance (feet)
Deceleration Rate (ft/s2)
1 60.34 153.36 25.54 2 60.26 145.04 26.93 3 58.73 143.54 25.85 4 60.16 148.75 26.17 5 60.07 145.41 26.69 6 60.02 150.51 25.74 7 60.37 147.64 26.55 8 60.00 146.17 26.49 9 60.30 150.09 26.06 10 *Not recorded due to data collection error
AVERAGE DECELERATION RATE: 26.22 ft/s2
(One cool down lap at 45 mph)
Phase II
(Ten 60 – 0 mph full ABS maximum deceleration stops)
Stop # Initial Velocity (mph)
Stopping Distance (feet)
Deceleration Rate (ft/s2)
1 60.24 145.94 26.75 2 59.18 142.80 26.38 3 59.07 134.07 27.99 4 59.64 145.05 26.38 5 59.91 141.67 27.25 6 60.21 146.40 26.63 7 60.54 145.64 27.07 8 60.46 144.73 27.17 9 59.80 146.86 26.19 10 59.45 139.42 27.27
AVERAGE DECELERATION RATE: 26.91 ft/s2
Phase III
OVERALL AVERAGE DECELERATION RATE: 26.58 ft/s2
PROJECTED STOPPING DISTANCE FROM 60.0 mph: 145.7 feet
Evidence of Severe Fading? No Vehicle Stopped in Straight Line? Yes
Vehicle Stopped Within Correct Lane? Yes
**All Vehicles Tested are Equipped with Anti-Lock Brakes**
56
BRAKE TESTING
Chevrolet Tahoe 5.3L 4WD
TEST LOCATION: Chelsea Proving Grounds DATE: September 15, 2018
BEGINNING TIME: 10:22 a.m. TEMPERATURE: 73° F
Phase I
(Ten 60 – 0 mph full ABS maximum deceleration stops)
Stop # Initial Velocity (mph)
Stopping Distance (feet)
Deceleration Rate (ft/s2)
1 60.45 151.89 25.88 2 60.16 146.93 26.49 3 59.11 134.44 27.95 4 59.29 139.25 27.15 5 59.86 145.11 26.56 6 58.93 135.74 27.52 7 59.83 142.34 27.05 8 59.89 141.81 27.21 9 60.29 145.72 26.83 10 60.13 149.64 25.99
AVERAGE DECELERATION RATE: 26.86 ft/s2
(One cool down lap at 45 mph)
Phase II
(Ten 60 – 0 mph full ABS maximum deceleration stops)
Stop # Initial Velocity (mph)
Stopping Distance (feet)
Deceleration Rate (ft/s2)
1 59.20 135.78 27.76 2 59.81 139.20 27.64 3 60.53 141.16 27.92 4 59.78 143.23 26.84 5 59.99 143.28 27.02 6 60.59 143.23 27.57 7 60.57 143.09 27.58 8 60.42 142.34 27.59 9 59.91 139.27 27.72 10 *Not recorded due to data collection error
AVERAGE DECELERATION RATE: 27.51 ft/s2
Phase III
OVERALL AVERAGE DECELERATION RATE: 27.17 ft/s2
PROJECTED STOPPING DISTANCE FROM 60.0 mph: 142.5 feet
Evidence of Severe Fading? No Vehicle Stopped in Straight Line? Yes
Vehicle Stopped Within Correct Lane? Yes
**All Vehicles Tested are Equipped with Anti-Lock Brakes**
57
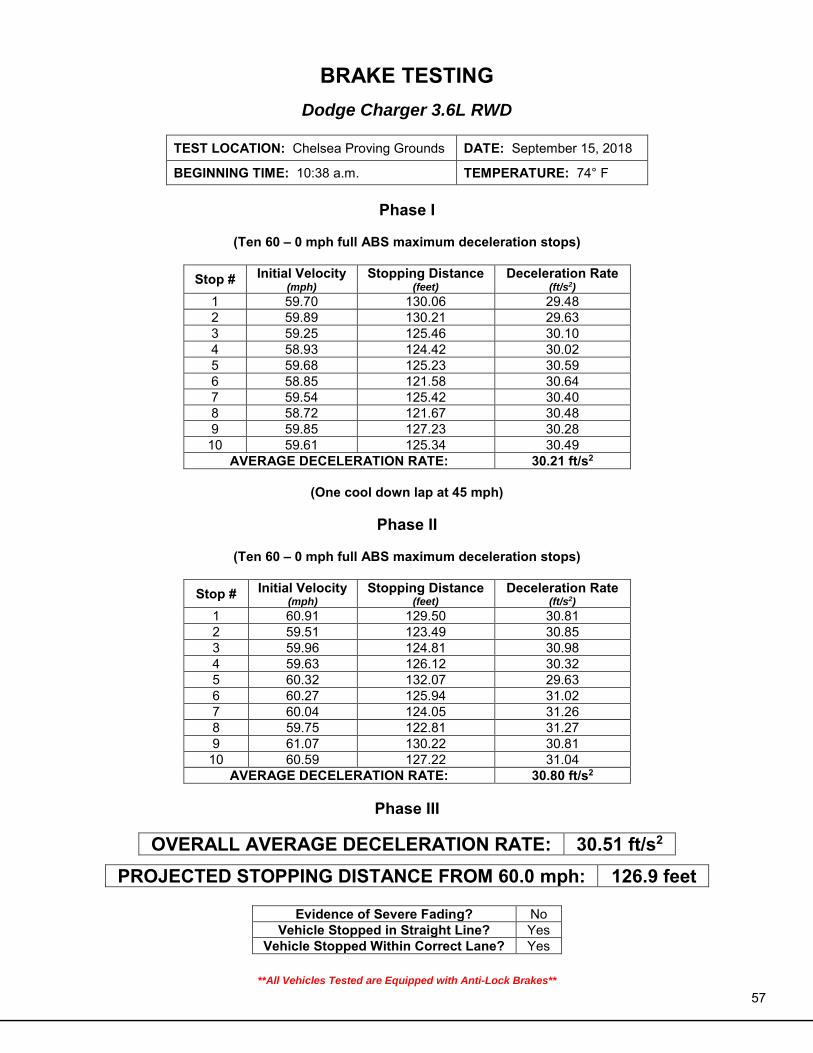
BRAKE TESTING
Dodge Charger 3.6L RWD
TEST LOCATION: Chelsea Proving Grounds DATE: September 15, 2018
BEGINNING TIME: 10:38 a.m. TEMPERATURE: 74° F
Phase I
(Ten 60 – 0 mph full ABS maximum deceleration stops)
Stop # Initial Velocity (mph)
Stopping Distance (feet)
Deceleration Rate (ft/s2)
1 59.70 130.06 29.48 2 59.89 130.21 29.63 3 59.25 125.46 30.10 4 58.93 124.42 30.02 5 59.68 125.23 30.59 6 58.85 121.58 30.64 7 59.54 125.42 30.40 8 58.72 121.67 30.48 9 59.85 127.23 30.28 10 59.61 125.34 30.49
AVERAGE DECELERATION RATE: 30.21 ft/s2
(One cool down lap at 45 mph)
Phase II
(Ten 60 – 0 mph full ABS maximum deceleration stops)
Stop # Initial Velocity (mph)
Stopping Distance (feet)
Deceleration Rate (ft/s2)
1 60.91 129.50 30.81 2 59.51 123.49 30.85 3 59.96 124.81 30.98 4 59.63 126.12 30.32 5 60.32 132.07 29.63 6 60.27 125.94 31.02 7 60.04 124.05 31.26 8 59.75 122.81 31.27 9 61.07 130.22 30.81 10 60.59 127.22 31.04
AVERAGE DECELERATION RATE: 30.80 ft/s2
Phase III
OVERALL AVERAGE DECELERATION RATE: 30.51 ft/s2
PROJECTED STOPPING DISTANCE FROM 60.0 mph: 126.9 feet
Evidence of Severe Fading? No Vehicle Stopped in Straight Line? Yes
Vehicle Stopped Within Correct Lane? Yes
**All Vehicles Tested are Equipped with Anti-Lock Brakes**

58
BRAKE TESTING
Dodge Charger 5.7L RWD
TEST LOCATION: Chelsea Proving Grounds DATE: September 15, 2018
BEGINNING TIME: 12:50 p.m. TEMPERATURE: 79° F
Phase I
(Ten 60 – 0 mph full ABS maximum deceleration stops)
Stop # Initial Velocity (mph)
Stopping Distance (feet)
Deceleration Rate (ft/s2)
1 61.16 133.85 30.06 2 59.12 122.93 30.58 3 60.25 128.05 30.49 4 60.15 126.51 30.76 5 58.93 120.83 30.91 6 60.15 126.32 30.81 7 58.65 122.06 30.31 8 58.46 121.51 30.25 9 59.81 125.21 30.73 10 59.88 130.85 29.47
AVERAGE DECELERATION RATE: 30.44 ft/s2
(One cool down lap at 45 mph)
Phase II
(Ten 60 – 0 mph full ABS maximum deceleration stops)
Stop # Initial Velocity (mph)
Stopping Distance (feet)
Deceleration Rate (ft/s2)
1 60.48 129.10 30.48 2 61.09 137.37 29.22 3 58.85 126.48 29.45 4 60.34 129.97 30.13 5 59.65 129.97 29.45 6 59.87 126.87 30.39 7 61.05 131.15 30.57 8 60.73 131.45 30.18 9 60.33 129.32 30.27 10 60.25 128.05 30.49
AVERAGE DECELERATION RATE: 30.06 ft/s2
Phase III
OVERALL AVERAGE DECELERATION RATE: 30.25 ft/s2
PROJECTED STOPPING DISTANCE FROM 60.0 mph: 128.0 feet
Evidence of Severe Fading? No Vehicle Stopped in Straight Line? Yes
Vehicle Stopped Within Correct Lane? Yes
**All Vehicles Tested are Equipped with Anti-Lock Brakes**

59
BRAKE TESTING
Dodge Charger 5.7L AWD
TEST LOCATION: Chelsea Proving Grounds DATE: September 15, 2018
BEGINNING TIME: 1:24 p.m. TEMPERATURE: 81° F
Phase I
(Ten 60 – 0 mph full ABS maximum deceleration stops)
Stop # Initial Velocity (mph)
Stopping Distance (feet)
Deceleration Rate (ft/s2)
1 60.48 143.32 27.45 2 59.37 133.45 28.41 3 60.68 139.38 28.41 4 60.61 135.32 29.20 5 60.00 133.93 28.91 6 60.64 134.57 29.39 7 59.93 132.70 29.11 8 59.62 130.40 29.32 9 60.44 134.92 29.12 10 60.71 141.19 28.08
AVERAGE DECELERATION RATE: 28.74 ft/s2
(One cool down lap at 45 mph)
Phase II
(Ten 60 – 0 mph full ABS maximum deceleration stops)
Stop # Initial Velocity (mph)
Stopping Distance (feet)
Deceleration Rate (ft/s2)
1 59.95 132.19 29.24 2 60.03 133.32 29.07 3 59.84 133.57 28.84 4 60.12 136.53 28.47 5 60.59 140.71 28.06 6 60.47 133.24 29.52 7 60.33 135.28 28.94 8 60.65 133.11 29.72 9 58.89 125.13 29.81 10 60.26 131.89 29.61
AVERAGE DECELERATION RATE: 29.13 ft/s2
Phase III
OVERALL AVERAGE DECELERATION RATE: 28.94 ft/s2
PROJECTED STOPPING DISTANCE FROM 60.0 mph: 133.8 feet
Evidence of Severe Fading? No Vehicle Stopped in Straight Line? Yes
Vehicle Stopped Within Correct Lane? Yes
**All Vehicles Tested are Equipped with Anti-Lock Brakes**
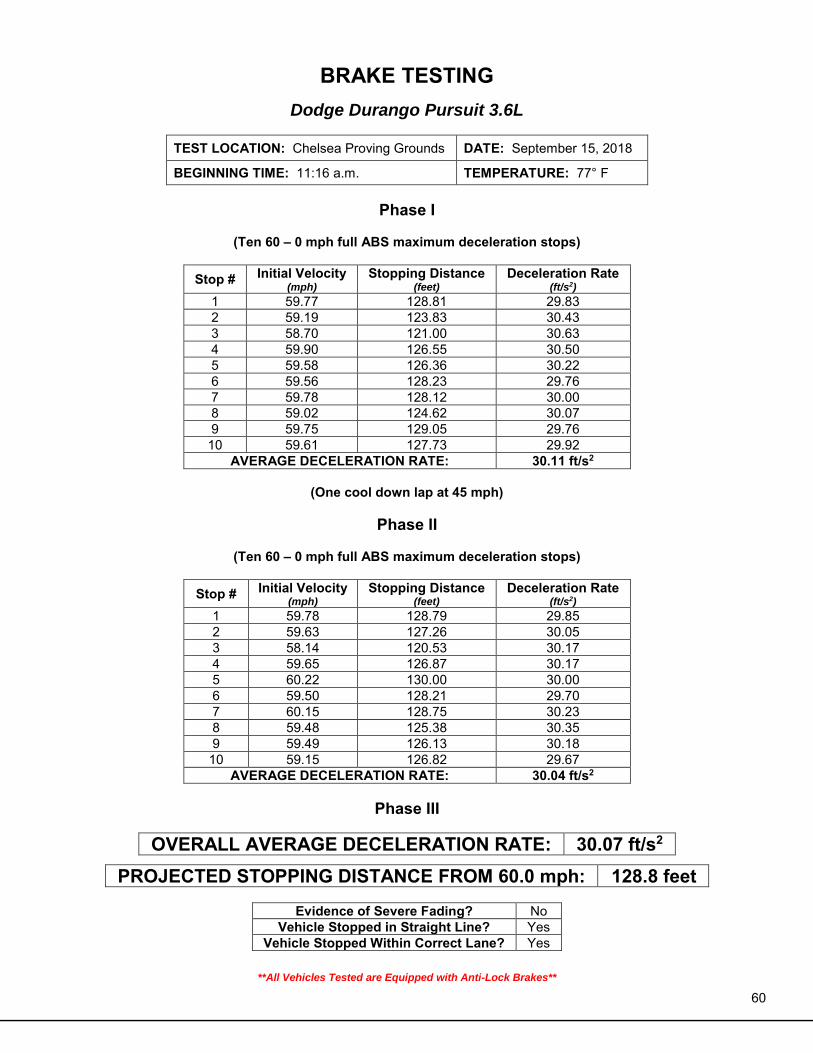
60
BRAKE TESTING
Dodge Durango Pursuit 3.6L
TEST LOCATION: Chelsea Proving Grounds DATE: September 15, 2018
BEGINNING TIME: 11:16 a.m. TEMPERATURE: 77° F
Phase I
(Ten 60 – 0 mph full ABS maximum deceleration stops)
Stop # Initial Velocity (mph)
Stopping Distance (feet)
Deceleration Rate (ft/s2)
1 59.77 128.81 29.83 2 59.19 123.83 30.43 3 58.70 121.00 30.63 4 59.90 126.55 30.50 5 59.58 126.36 30.22 6 59.56 128.23 29.76 7 59.78 128.12 30.00 8 59.02 124.62 30.07 9 59.75 129.05 29.76 10 59.61 127.73 29.92
AVERAGE DECELERATION RATE: 30.11 ft/s2
(One cool down lap at 45 mph)
Phase II
(Ten 60 – 0 mph full ABS maximum deceleration stops)
Stop # Initial Velocity (mph)
Stopping Distance (feet)
Deceleration Rate (ft/s2)
1 59.78 128.79 29.85 2 59.63 127.26 30.05 3 58.14 120.53 30.17 4 59.65 126.87 30.17 5 60.22 130.00 30.00 6 59.50 128.21 29.70 7 60.15 128.75 30.23 8 59.48 125.38 30.35 9 59.49 126.13 30.18 10 59.15 126.82 29.67
AVERAGE DECELERATION RATE: 30.04 ft/s2
Phase III
OVERALL AVERAGE DECELERATION RATE: 30.07 ft/s2
PROJECTED STOPPING DISTANCE FROM 60.0 mph: 128.8 feet
Evidence of Severe Fading? No Vehicle Stopped in Straight Line? Yes
Vehicle Stopped Within Correct Lane? Yes
**All Vehicles Tested are Equipped with Anti-Lock Brakes**

61
BRAKE TESTING
Dodge Durango Pursuit 5.7L
TEST LOCATION: Chelsea Proving Grounds DATE: September 15, 2018
BEGINNING TIME: 2:16 p.m. TEMPERATURE: 83° F
Phase I
(Ten 60 – 0 mph full ABS maximum deceleration stops)
Stop # Initial Velocity (mph)
Stopping Distance (feet)
Deceleration Rate (ft/s2)
1 59.63 132.96 28.76 2 60.55 134.80 29.25 3 60.66 132.03 29.98 4 60.11 133.81 29.04 5 59.30 127.27 29.72 6 59.87 129.81 29.70 7 59.82 131.83 29.20 8 59.55 132.28 28.84 9 58.74 127.63 29.08 10 59.62 134.47 28.43
AVERAGE DECELERATION RATE: 29.20 ft/s2
(One cool down lap at 45 mph)
Phase II
(Ten 60 – 0 mph full ABS maximum deceleration stops)
Stop # Initial Velocity (mph)
Stopping Distance (feet)
Deceleration Rate (ft/s2)
1 60.31 134.36 29.12 2 59.85 130.91 29.43 3 58.86 129.02 28.88 4 60.28 133.60 29.25 5 59.67 131.78 29.06 6 60.03 131.25 29.53 7 60.17 130.84 29.76 8 59.79 133.24 28.86 9 60.48 137.56 28.60 10 59.43 131.01 29.00
AVERAGE DECELERATION RATE: 29.15 ft/s2
Phase III
OVERALL AVERAGE DECELERATION RATE: 29.18 ft/s2
PROJECTED STOPPING DISTANCE FROM 60.0 mph: 132.7 feet
Evidence of Severe Fading? No Vehicle Stopped in Straight Line? Yes
Vehicle Stopped Within Correct Lane? Yes
**All Vehicles Tested are Equipped with Anti-Lock Brakes**
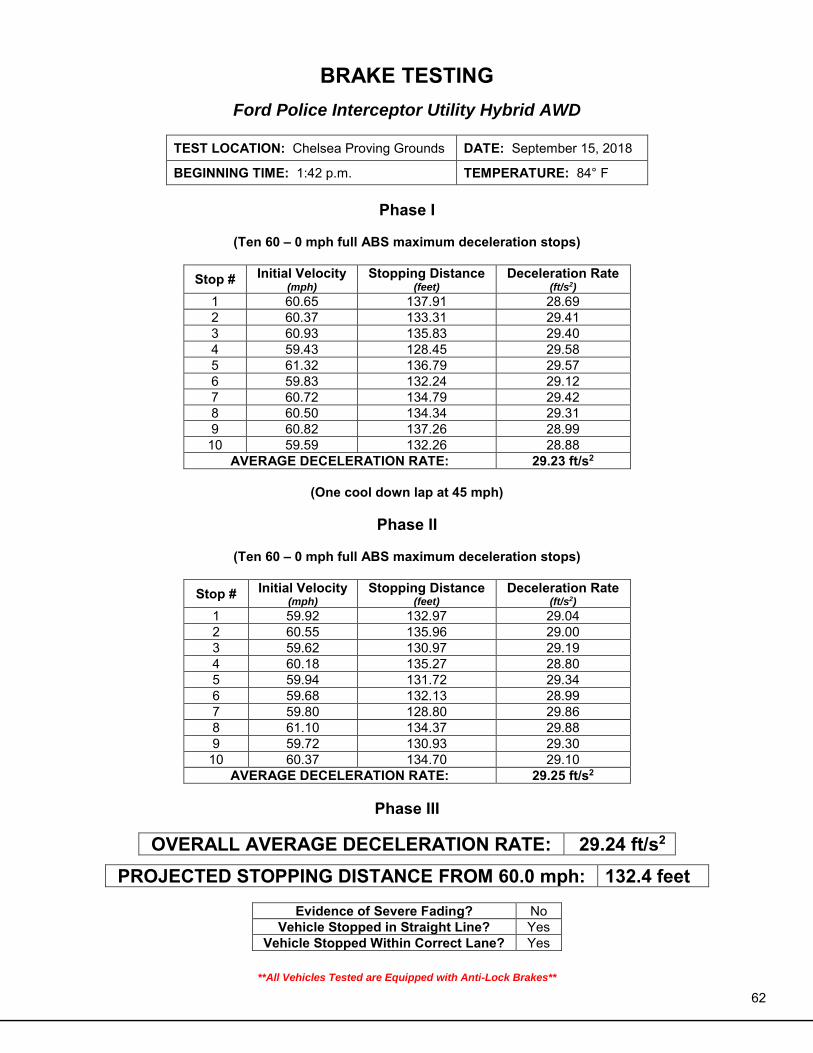
62
BRAKE TESTING
Ford Police Interceptor Utility Hybrid AWD
TEST LOCATION: Chelsea Proving Grounds DATE: September 15, 2018
BEGINNING TIME: 1:42 p.m. TEMPERATURE: 84° F
Phase I
(Ten 60 – 0 mph full ABS maximum deceleration stops)
Stop # Initial Velocity (mph)
Stopping Distance (feet)
Deceleration Rate (ft/s2)
1 60.65 137.91 28.69 2 60.37 133.31 29.41 3 60.93 135.83 29.40 4 59.43 128.45 29.58 5 61.32 136.79 29.57 6 59.83 132.24 29.12 7 60.72 134.79 29.42 8 60.50 134.34 29.31 9 60.82 137.26 28.99 10 59.59 132.26 28.88
AVERAGE DECELERATION RATE: 29.23 ft/s2
(One cool down lap at 45 mph)
Phase II
(Ten 60 – 0 mph full ABS maximum deceleration stops)
Stop # Initial Velocity (mph)
Stopping Distance (feet)
Deceleration Rate (ft/s2)
1 59.92 132.97 29.04 2 60.55 135.96 29.00 3 59.62 130.97 29.19 4 60.18 135.27 28.80 5 59.94 131.72 29.34 6 59.68 132.13 28.99 7 59.80 128.80 29.86 8 61.10 134.37 29.88 9 59.72 130.93 29.30 10 60.37 134.70 29.10
AVERAGE DECELERATION RATE: 29.25 ft/s2
Phase III
OVERALL AVERAGE DECELERATION RATE: 29.24 ft/s2
PROJECTED STOPPING DISTANCE FROM 60.0 mph: 132.4 feet
Evidence of Severe Fading? No Vehicle Stopped in Straight Line? Yes
Vehicle Stopped Within Correct Lane? Yes
**All Vehicles Tested are Equipped with Anti-Lock Brakes**
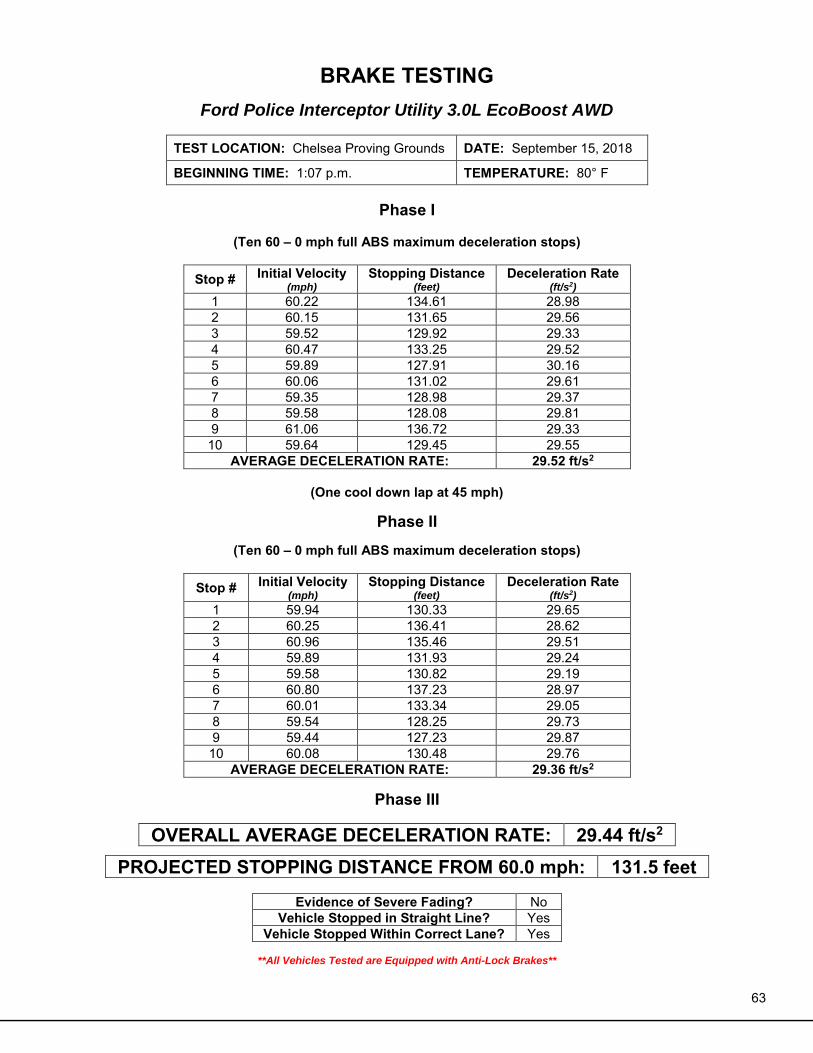
63
BRAKE TESTING
Ford Police Interceptor Utility 3.0L EcoBoost AWD
TEST LOCATION: Chelsea Proving Grounds DATE: September 15, 2018
BEGINNING TIME: 1:07 p.m. TEMPERATURE: 80° F
Phase I
(Ten 60 – 0 mph full ABS maximum deceleration stops)
Stop # Initial Velocity (mph)
Stopping Distance (feet)
Deceleration Rate (ft/s2)
1 60.22 134.61 28.98 2 60.15 131.65 29.56 3 59.52 129.92 29.33 4 60.47 133.25 29.52 5 59.89 127.91 30.16 6 60.06 131.02 29.61 7 59.35 128.98 29.37 8 59.58 128.08 29.81 9 61.06 136.72 29.33 10 59.64 129.45 29.55
AVERAGE DECELERATION RATE: 29.52 ft/s2
(One cool down lap at 45 mph)
Phase II
(Ten 60 – 0 mph full ABS maximum deceleration stops)
Stop # Initial Velocity (mph)
Stopping Distance (feet)
Deceleration Rate (ft/s2)
1 59.94 130.33 29.65 2 60.25 136.41 28.62 3 60.96 135.46 29.51 4 59.89 131.93 29.24 5 59.58 130.82 29.19 6 60.80 137.23 28.97 7 60.01 133.34 29.05 8 59.54 128.25 29.73 9 59.44 127.23 29.87 10 60.08 130.48 29.76
AVERAGE DECELERATION RATE: 29.36 ft/s2
Phase III
OVERALL AVERAGE DECELERATION RATE: 29.44 ft/s2
PROJECTED STOPPING DISTANCE FROM 60.0 mph: 131.5 feet
Evidence of Severe Fading? No Vehicle Stopped in Straight Line? Yes
Vehicle Stopped Within Correct Lane? Yes
**All Vehicles Tested are Equipped with Anti-Lock Brakes**
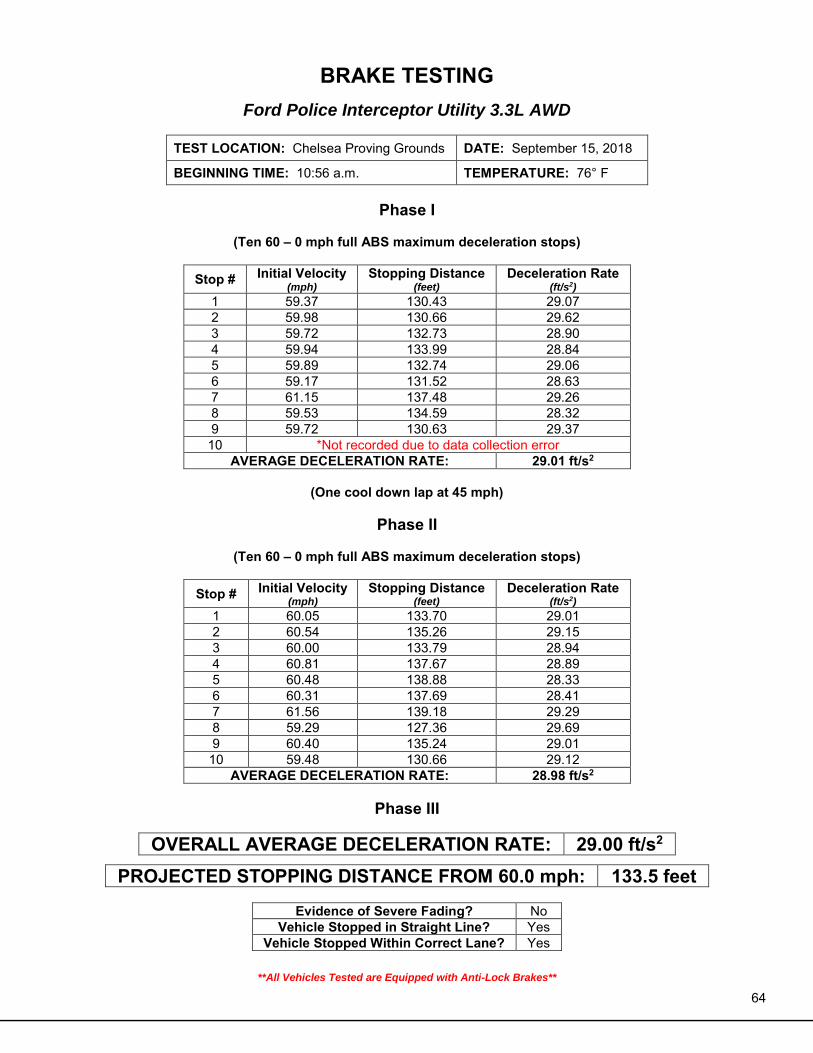
64
BRAKE TESTING
Ford Police Interceptor Utility 3.3L AWD
TEST LOCATION: Chelsea Proving Grounds DATE: September 15, 2018
BEGINNING TIME: 10:56 a.m. TEMPERATURE: 76° F
Phase I
(Ten 60 – 0 mph full ABS maximum deceleration stops)
Stop # Initial Velocity (mph)
Stopping Distance (feet)
Deceleration Rate (ft/s2)
1 59.37 130.43 29.07 2 59.98 130.66 29.62 3 59.72 132.73 28.90 4 59.94 133.99 28.84 5 59.89 132.74 29.06 6 59.17 131.52 28.63 7 61.15 137.48 29.26 8 59.53 134.59 28.32 9 59.72 130.63 29.37 10 *Not recorded due to data collection error
AVERAGE DECELERATION RATE: 29.01 ft/s2
(One cool down lap at 45 mph)
Phase II
(Ten 60 – 0 mph full ABS maximum deceleration stops)
Stop # Initial Velocity (mph)
Stopping Distance (feet)
Deceleration Rate (ft/s2)
1 60.05 133.70 29.01 2 60.54 135.26 29.15 3 60.00 133.79 28.94 4 60.81 137.67 28.89 5 60.48 138.88 28.33 6 60.31 137.69 28.41 7 61.56 139.18 29.29 8 59.29 127.36 29.69 9 60.40 135.24 29.01 10 59.48 130.66 29.12
AVERAGE DECELERATION RATE: 28.98 ft/s2
Phase III
OVERALL AVERAGE DECELERATION RATE: 29.00 ft/s2
PROJECTED STOPPING DISTANCE FROM 60.0 mph: 133.5 feet
Evidence of Severe Fading? No Vehicle Stopped in Straight Line? Yes
Vehicle Stopped Within Correct Lane? Yes
**All Vehicles Tested are Equipped with Anti-Lock Brakes**
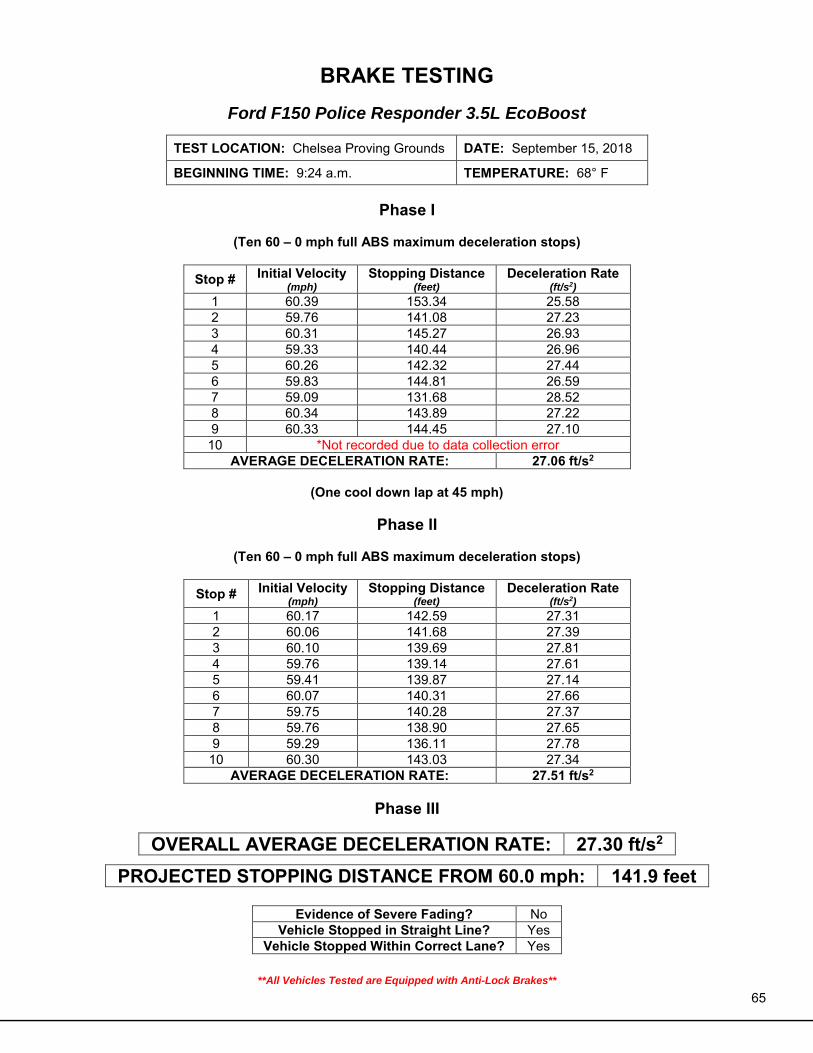
65
BRAKE TESTING
Ford F150 Police Responder 3.5L EcoBoost
TEST LOCATION: Chelsea Proving Grounds DATE: September 15, 2018
BEGINNING TIME: 9:24 a.m. TEMPERATURE: 68° F
Phase I
(Ten 60 – 0 mph full ABS maximum deceleration stops)
Stop # Initial Velocity (mph)
Stopping Distance (feet)
Deceleration Rate (ft/s2)
1 60.39 153.34 25.58 2 59.76 141.08 27.23 3 60.31 145.27 26.93 4 59.33 140.44 26.96 5 60.26 142.32 27.44 6 59.83 144.81 26.59 7 59.09 131.68 28.52 8 60.34 143.89 27.22 9 60.33 144.45 27.10 10 *Not recorded due to data collection error
AVERAGE DECELERATION RATE: 27.06 ft/s2
(One cool down lap at 45 mph)
Phase II
(Ten 60 – 0 mph full ABS maximum deceleration stops)
Stop # Initial Velocity (mph)
Stopping Distance (feet)
Deceleration Rate (ft/s2)
1 60.17 142.59 27.31 2 60.06 141.68 27.39 3 60.10 139.69 27.81 4 59.76 139.14 27.61 5 59.41 139.87 27.14 6 60.07 140.31 27.66 7 59.75 140.28 27.37 8 59.76 138.90 27.65 9 59.29 136.11 27.78 10 60.30 143.03 27.34
AVERAGE DECELERATION RATE: 27.51 ft/s2
Phase III
OVERALL AVERAGE DECELERATION RATE: 27.30 ft/s2
PROJECTED STOPPING DISTANCE FROM 60.0 mph: 141.9 feet
Evidence of Severe Fading? No Vehicle Stopped in Straight Line? Yes
Vehicle Stopped Within Correct Lane? Yes
**All Vehicles Tested are Equipped with Anti-Lock Brakes**

66
BRAKE TESTING
Ford Police Responder Hybrid Sedan
TEST LOCATION: Chelsea Proving Grounds DATE: September 15, 2018
BEGINNING TIME: 12:33 p.m. TEMPERATURE: 79° F
Phase I
(Ten 60 – 0 mph full ABS maximum deceleration stops)
Stop # Initial Velocity (mph)
Stopping Distance (feet)
Deceleration Rate (ft/s2)
1 60.36 134.47 29.14 2 59.43 128.41 29.58 3 60.76 132.86 29.89 4 60.30 129.26 30.26 5 60.61 132.22 29.88 6 60.98 131.22 30.48 7 61.22 133.12 30.28 8 60.34 129.91 30.15 9 60.32 132.25 29.59 10 60.14 131.48 29.59
AVERAGE DECELERATION RATE: 29.62 ft/s2
(One cool down lap at 45 mph)
Phase II
(Ten 60 – 0 mph full ABS maximum deceleration stops)
Stop # Initial Velocity (mph)
Stopping Distance (feet)
Deceleration Rate (ft/s2)
1 59.61 130.70 29.24 2 61.05 132.53 30.25 3 59.53 124.79 30.55 4 59.59 133.39 28.63 5 59.39 125.77 30.16 6 60.26 128.44 30.41 7 61.21 134.37 29.99 8 60.78 131.82 30.14 9 60.33 127.80 30.63 10 60.31 131.61 29.73
AVERAGE DECELERATION RATE: 29.97 ft/s2
Phase III
OVERALL AVERAGE DECELERATION RATE: 29.93 ft/s2
PROJECTED STOPPING DISTANCE FROM 60.0 mph: 129.4 feet
Evidence of Severe Fading? No Vehicle Stopped in Straight Line? Yes
Vehicle Stopped Within Correct Lane? Yes
**All Vehicles Tested are Equipped with Anti-Lock Brakes**
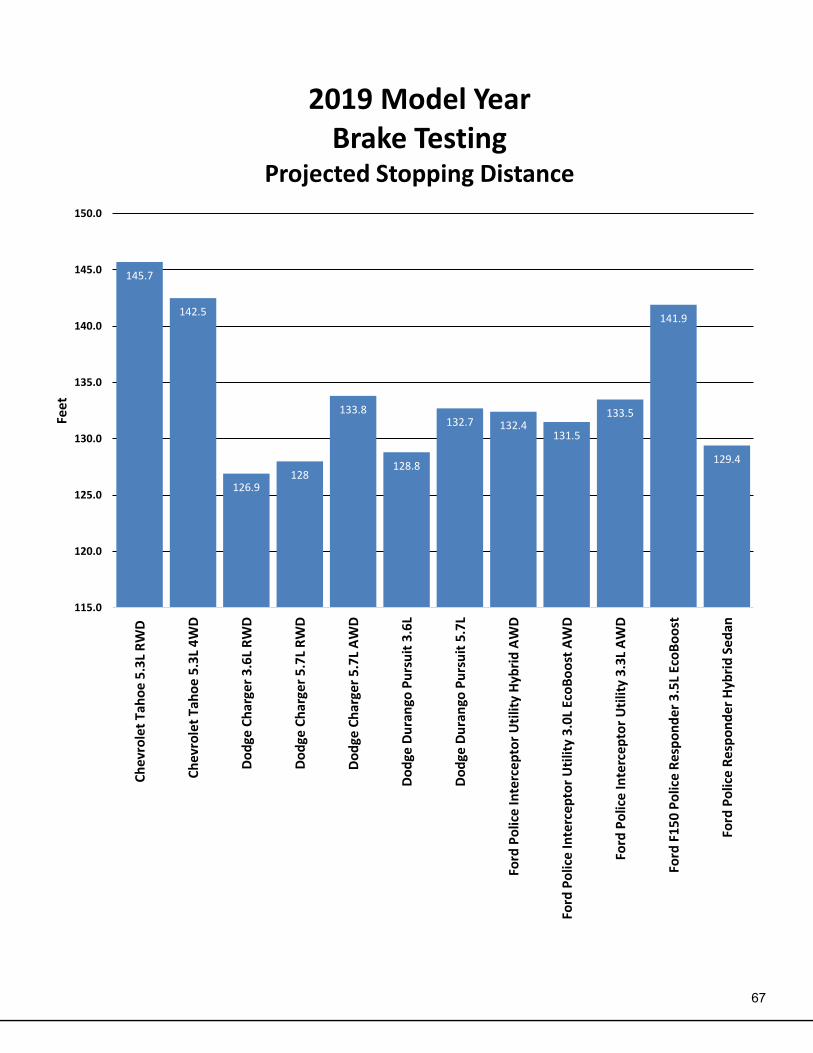
67
145.7
142.5
126.9128
133.8
128.8
132.7 132.4131.5
133.5
141.9
129.4
115.0
120.0
125.0
130.0
135.0
140.0
145.0
150.0
Ch
evro
let
Tah
oe
5.3
L R
WD
Ch
evro
let
Tah
oe
5.3
L 4
WD
Do
dge
Ch
arge
r 3
.6L
RW
D
Do
dge
Ch
arge
r 5
.7L
RW
D
Do
dge
Ch
arge
r 5
.7L
AW
D
Do
dge
Du
ran
go P
urs
uit
3.6
L
Do
dge
Du
ran
go P
urs
uit
5.7
L
Ford
Po
lice
Inte
rcep
tor
Uti
lity
Hyb
rid
AW
D
Ford
Po
lice
Inte
rcep
tor
Uti
lity
3.0
L Ec
oB
oo
st A
WD
Ford
Po
lice
Inte
rcep
tor
Uti
lity
3.3
L A
WD
Ford
F15
0 P
olic
e R
esp
on
der
3.5
L Ec
oB
oo
st
Ford
Po
lice
Re
spo
nd
er H
ybri
d S
ed
an
Fee
t
2019 Model YearBrake Testing
Projected Stopping Distance
68
69
ERGONOMICS AND COMMUNICATIONS
TESTING OBJECTIVE
Rate each test vehicle’s ability to:
1. Provide a suitable environment for the patrol officer in the performance of his/her assigned tasks.
2. Accommodate the required communications and emergency warning equipment and assess the relative difficulty of such installations.
TESTING METHODOLOGY
Utilizing the Ergonomics and Communications Form (as seen on page 70 of this book) each category is graded on a scale of 1-10, with 1 representing “totally unacceptable,” 5 representing “average,” and 10 representing “superior.” The scores given are averaged to minimize personal prejudice for or against any given vehicle. For the ergonomics portion of the form, a minimum of four officers (in this case six) individually and independently compare and score each test vehicle in several areas. These include comfort, convenience, instrumentation, and visibility. The installation and communications portion of the evaluation is conducted by personnel from the Michigan Public Safety Communications System. The scores are given based on the relative difficulty of the necessary installations.
COMMUNICATIONS
Chevrolet
Tahoe Dodge
Charger Dodge
Durango
2020 Ford Police
Interceptor Utility
Ford F150 Police
Responder
Ford Police
Responder Hybrid
COMMUNICATIONS Dashboard Accessibility 9.33 9.39 10.00 10.00 9.56 7.61 Trunk Accessibility 8.86 9.07 9.33 8.33 7.57 6.93 Engine Compartment 8.33 7.67 10.00 10.00 9.00 5.67
TOTAL SCORES 8.84 8.71 9.78 9.44 8.71 6.74
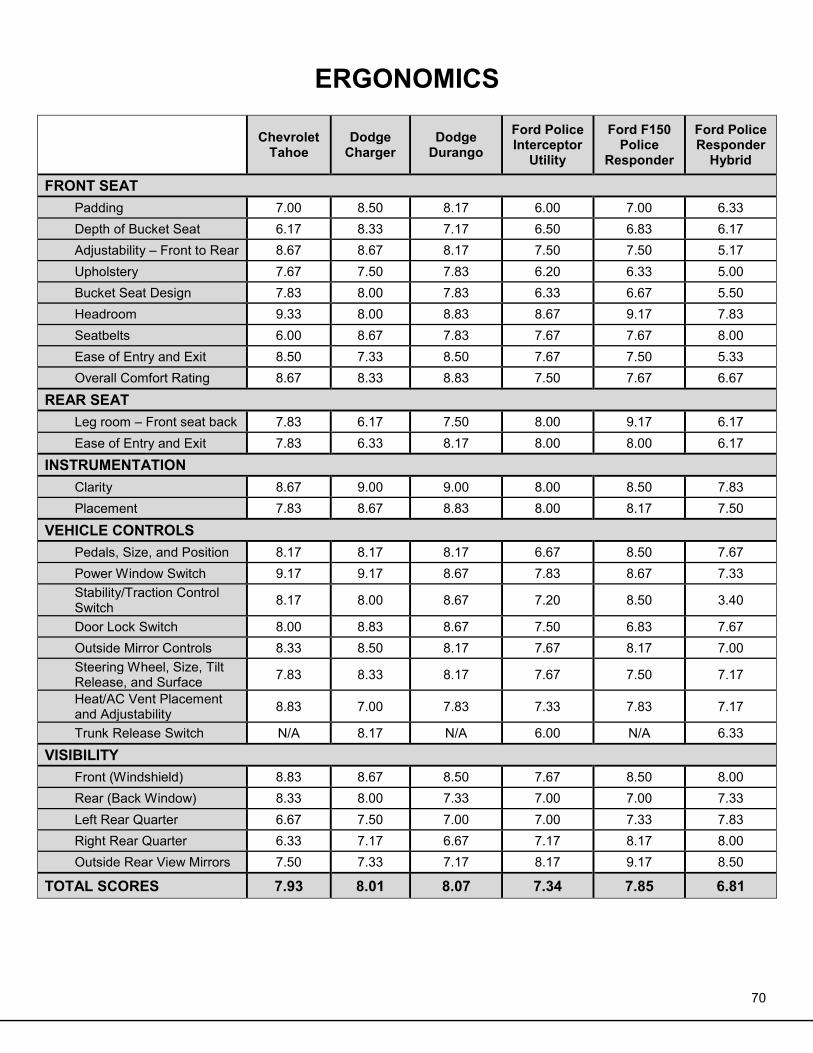
70
ERGONOMICS
Chevrolet Tahoe
Dodge Charger
Dodge Durango
Ford Police Interceptor
Utility
Ford F150 Police
Responder
Ford Police Responder
Hybrid
FRONT SEAT Padding 7.00 8.50 8.17 6.00 7.00 6.33 Depth of Bucket Seat 6.17 8.33 7.17 6.50 6.83 6.17 Adjustability – Front to Rear 8.67 8.67 8.17 7.50 7.50 5.17 Upholstery 7.67 7.50 7.83 6.20 6.33 5.00 Bucket Seat Design 7.83 8.00 7.83 6.33 6.67 5.50 Headroom 9.33 8.00 8.83 8.67 9.17 7.83 Seatbelts 6.00 8.67 7.83 7.67 7.67 8.00 Ease of Entry and Exit 8.50 7.33 8.50 7.67 7.50 5.33 Overall Comfort Rating 8.67 8.33 8.83 7.50 7.67 6.67
REAR SEAT Leg room – Front seat back 7.83 6.17 7.50 8.00 9.17 6.17 Ease of Entry and Exit 7.83 6.33 8.17 8.00 8.00 6.17
INSTRUMENTATION Clarity 8.67 9.00 9.00 8.00 8.50 7.83 Placement 7.83 8.67 8.83 8.00 8.17 7.50
VEHICLE CONTROLS Pedals, Size, and Position 8.17 8.17 8.17 6.67 8.50 7.67 Power Window Switch 9.17 9.17 8.67 7.83 8.67 7.33 Stability/Traction Control Switch 8.17 8.00 8.67 7.20 8.50 3.40
Door Lock Switch 8.00 8.83 8.67 7.50 6.83 7.67 Outside Mirror Controls 8.33 8.50 8.17 7.67 8.17 7.00 Steering Wheel, Size, Tilt Release, and Surface 7.83 8.33 8.17 7.67 7.50 7.17
Heat/AC Vent Placement and Adjustability 8.83 7.00 7.83 7.33 7.83 7.17
Trunk Release Switch N/A 8.17 N/A 6.00 N/A 6.33 VISIBILITY
Front (Windshield) 8.83 8.67 8.50 7.67 8.50 8.00 Rear (Back Window) 8.33 8.00 7.33 7.00 7.00 7.33 Left Rear Quarter 6.67 7.50 7.00 7.00 7.33 7.83 Right Rear Quarter 6.33 7.17 6.67 7.17 8.17 8.00 Outside Rear View Mirrors 7.50 7.33 7.17 8.17 9.17 8.50
TOTAL SCORES 7.93 8.01 8.07 7.34 7.85 6.81
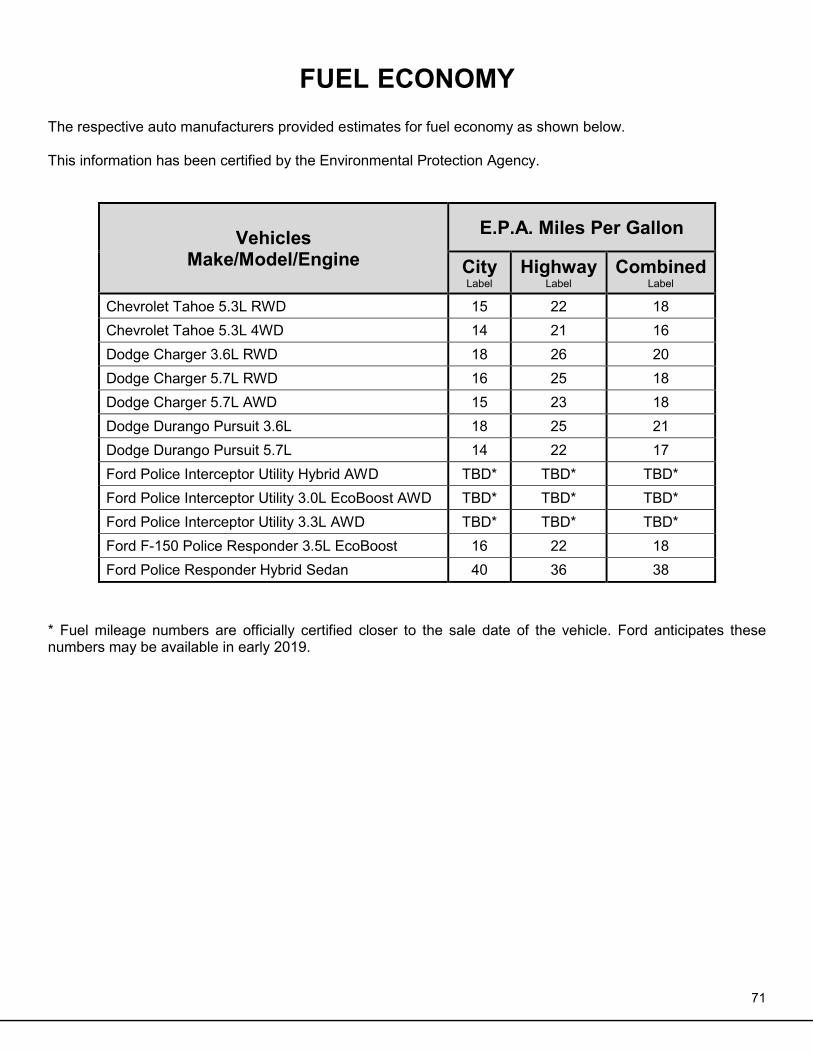
71
FUEL ECONOMY
The respective auto manufacturers provided estimates for fuel economy as shown below. This information has been certified by the Environmental Protection Agency.
Vehicles Make/Model/Engine
E.P.A. Miles Per Gallon
City Label
Highway Label
Combined Label
Chevrolet Tahoe 5.3L RWD 15 22 18 Chevrolet Tahoe 5.3L 4WD 14 21 16 Dodge Charger 3.6L RWD 18 26 20 Dodge Charger 5.7L RWD 16 25 18 Dodge Charger 5.7L AWD 15 23 18 Dodge Durango Pursuit 3.6L 18 25 21 Dodge Durango Pursuit 5.7L 14 22 17 Ford Police Interceptor Utility Hybrid AWD TBD* TBD* TBD* Ford Police Interceptor Utility 3.0L EcoBoost AWD TBD* TBD* TBD* Ford Police Interceptor Utility 3.3L AWD TBD* TBD* TBD* Ford F-150 Police Responder 3.5L EcoBoost 16 22 18 Ford Police Responder Hybrid Sedan 40 36 38
* Fuel mileage numbers are officially certified closer to the sale date of the vehicle. Ford anticipates these numbers may be available in early 2019.

72
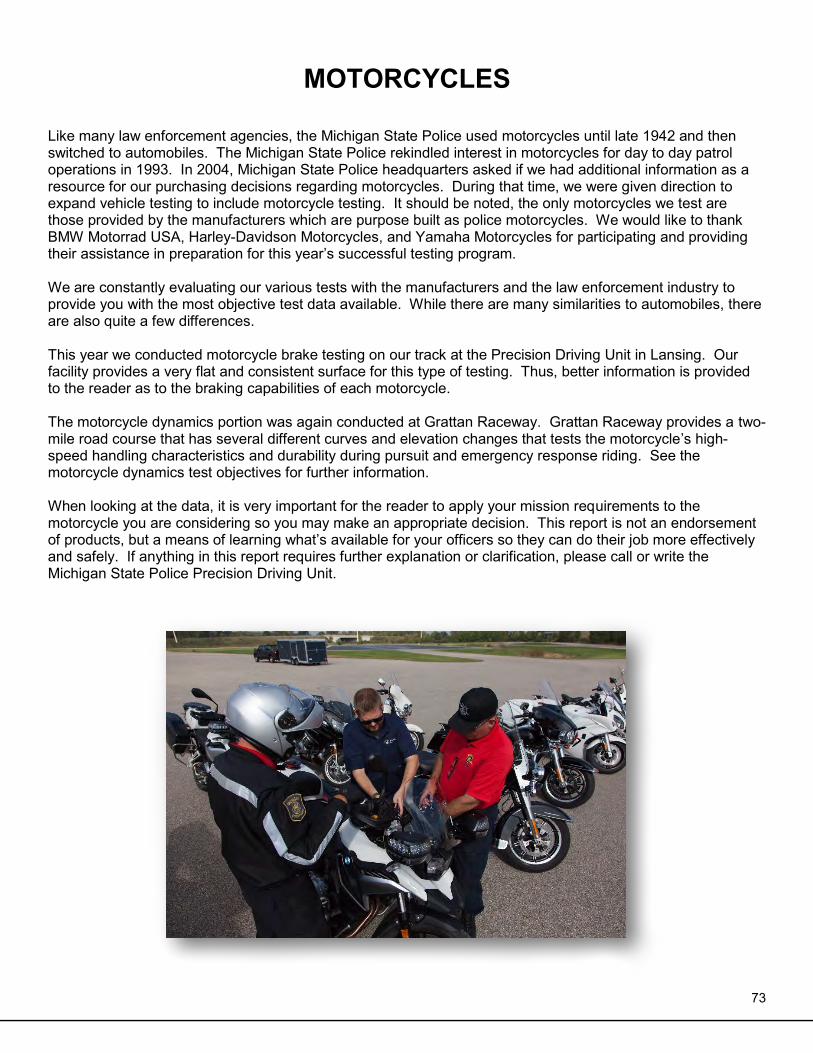
73
MOTORCYCLES
Like many law enforcement agencies, the Michigan State Police used motorcycles until late 1942 and then switched to automobiles. The Michigan State Police rekindled interest in motorcycles for day to day patrol operations in 1993. In 2004, Michigan State Police headquarters asked if we had additional information as a resource for our purchasing decisions regarding motorcycles. During that time, we were given direction to expand vehicle testing to include motorcycle testing. It should be noted, the only motorcycles we test are those provided by the manufacturers which are purpose built as police motorcycles. We would like to thank BMW Motorrad USA, Harley-Davidson Motorcycles, and Yamaha Motorcycles for participating and providing their assistance in preparation for this year’s successful testing program. We are constantly evaluating our various tests with the manufacturers and the law enforcement industry to provide you with the most objective test data available. While there are many similarities to automobiles, there are also quite a few differences. This year we conducted motorcycle brake testing on our track at the Precision Driving Unit in Lansing. Our facility provides a very flat and consistent surface for this type of testing. Thus, better information is provided to the reader as to the braking capabilities of each motorcycle. The motorcycle dynamics portion was again conducted at Grattan Raceway. Grattan Raceway provides a two-mile road course that has several different curves and elevation changes that tests the motorcycle’s high-speed handling characteristics and durability during pursuit and emergency response riding. See the motorcycle dynamics test objectives for further information. When looking at the data, it is very important for the reader to apply your mission requirements to the motorcycle you are considering so you may make an appropriate decision. This report is not an endorsement of products, but a means of learning what’s available for your officers so they can do their job more effectively and safely. If anything in this report requires further explanation or clarification, please call or write the Michigan State Police Precision Driving Unit.

74
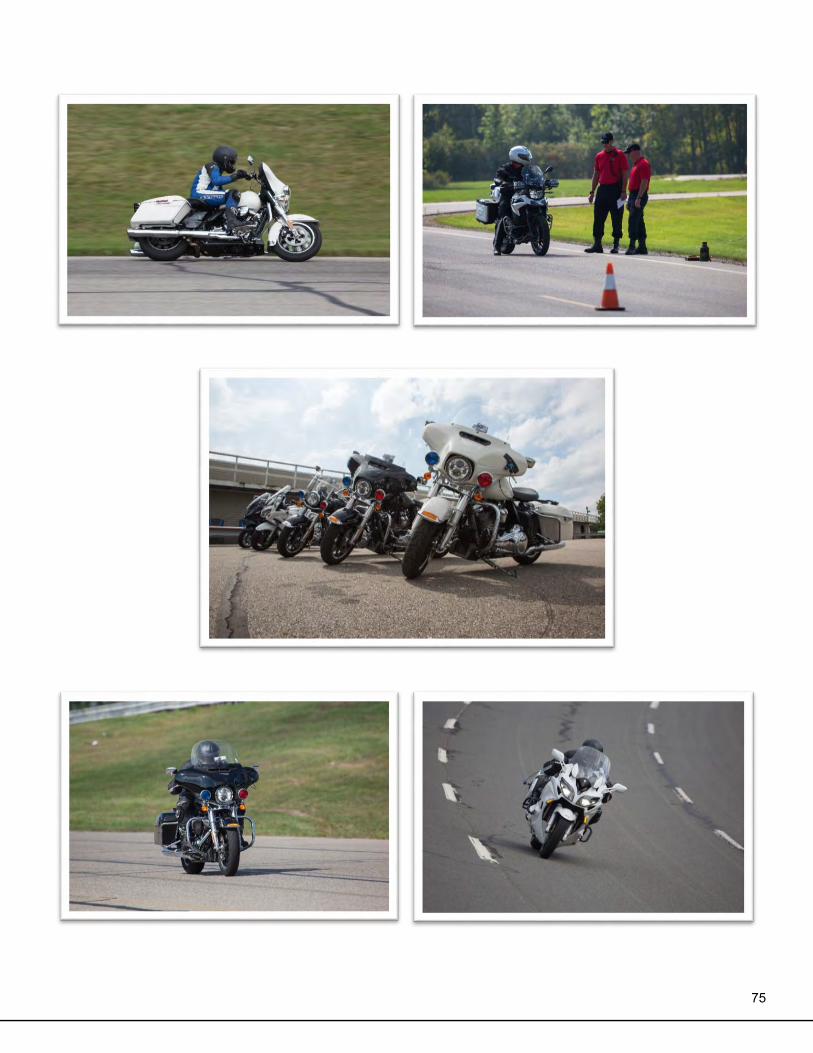
75
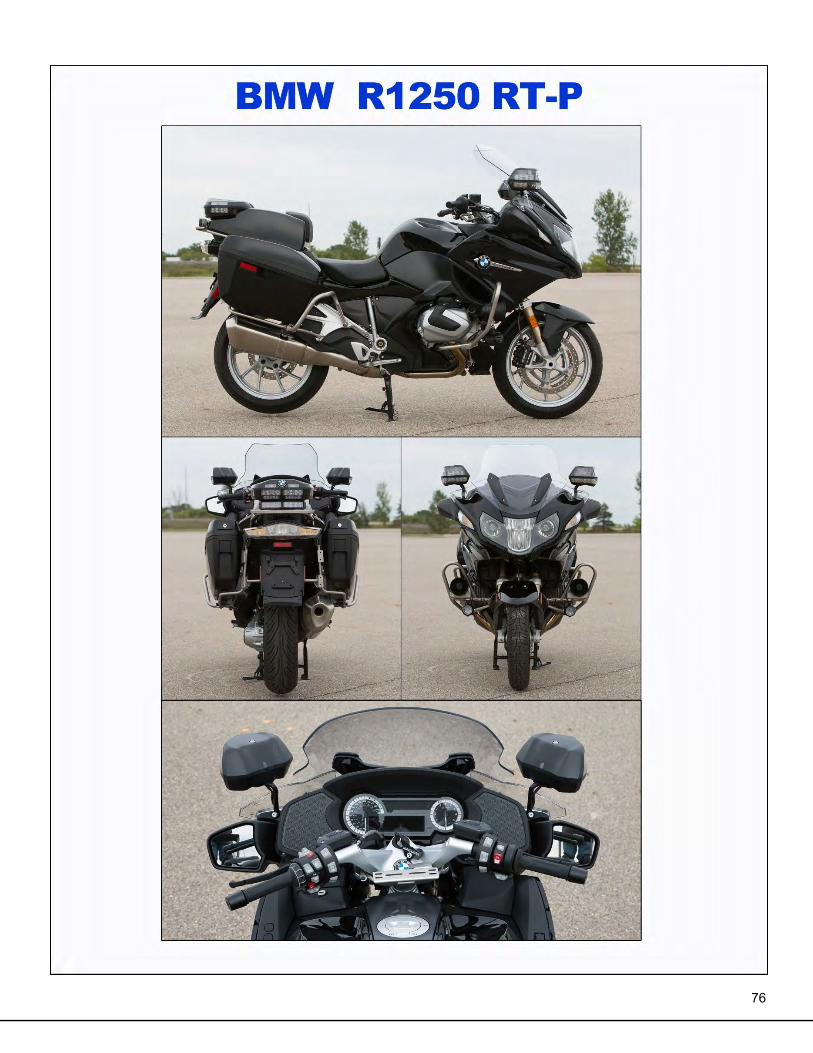
76
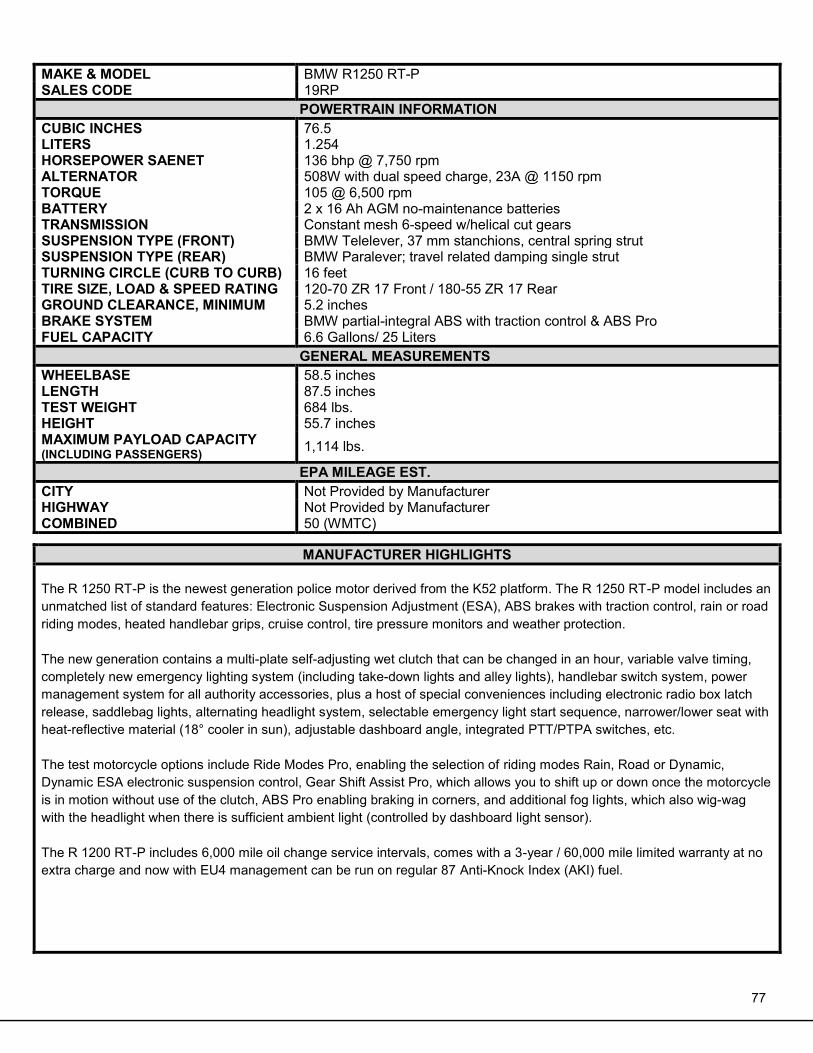
77
MAKE & MODEL BMW R1250 RT-P SALES CODE 19RP
POWERTRAIN INFORMATION CUBIC INCHES 76.5 LITERS 1.254 HORSEPOWER SAENET 136 bhp @ 7,750 rpm ALTERNATOR 508W with dual speed charge, 23A @ 1150 rpm TORQUE 105 @ 6,500 rpm BATTERY 2 x 16 Ah AGM no-maintenance batteries TRANSMISSION Constant mesh 6-speed w/helical cut gears SUSPENSION TYPE (FRONT) BMW Telelever, 37 mm stanchions, central spring strut SUSPENSION TYPE (REAR) BMW Paralever; travel related damping single strut TURNING CIRCLE (CURB TO CURB) 16 feet TIRE SIZE, LOAD & SPEED RATING 120-70 ZR 17 Front / 180-55 ZR 17 Rear GROUND CLEARANCE, MINIMUM 5.2 inches BRAKE SYSTEM BMW partial-integral ABS with traction control & ABS Pro FUEL CAPACITY 6.6 Gallons/ 25 Liters
GENERAL MEASUREMENTS WHEELBASE 58.5 inches LENGTH 87.5 inches TEST WEIGHT 684 lbs. HEIGHT 55.7 inches MAXIMUM PAYLOAD CAPACITY (INCLUDING PASSENGERS) 1,114 lbs.
EPA MILEAGE EST. CITY Not Provided by Manufacturer HIGHWAY Not Provided by Manufacturer COMBINED 50 (WMTC)
MANUFACTURER HIGHLIGHTS The R 1250 RT-P is the newest generation police motor derived from the K52 platform. The R 1250 RT-P model includes an unmatched list of standard features: Electronic Suspension Adjustment (ESA), ABS brakes with traction control, rain or road riding modes, heated handlebar grips, cruise control, tire pressure monitors and weather protection. The new generation contains a multi-plate self-adjusting wet clutch that can be changed in an hour, variable valve timing, completely new emergency lighting system (including take-down lights and alley lights), handlebar switch system, power management system for all authority accessories, plus a host of special conveniences including electronic radio box latch release, saddlebag lights, alternating headlight system, selectable emergency light start sequence, narrower/lower seat with heat-reflective material (18° cooler in sun), adjustable dashboard angle, integrated PTT/PTPA switches, etc. The test motorcycle options include Ride Modes Pro, enabling the selection of riding modes Rain, Road or Dynamic, Dynamic ESA electronic suspension control, Gear Shift Assist Pro, which allows you to shift up or down once the motorcycle is in motion without use of the clutch, ABS Pro enabling braking in corners, and additional fog lights, which also wig-wag with the headlight when there is sufficient ambient light (controlled by dashboard light sensor). The R 1200 RT-P includes 6,000 mile oil change service intervals, comes with a 3-year / 60,000 mile limited warranty at no extra charge and now with EU4 management can be run on regular 87 Anti-Knock Index (AKI) fuel.
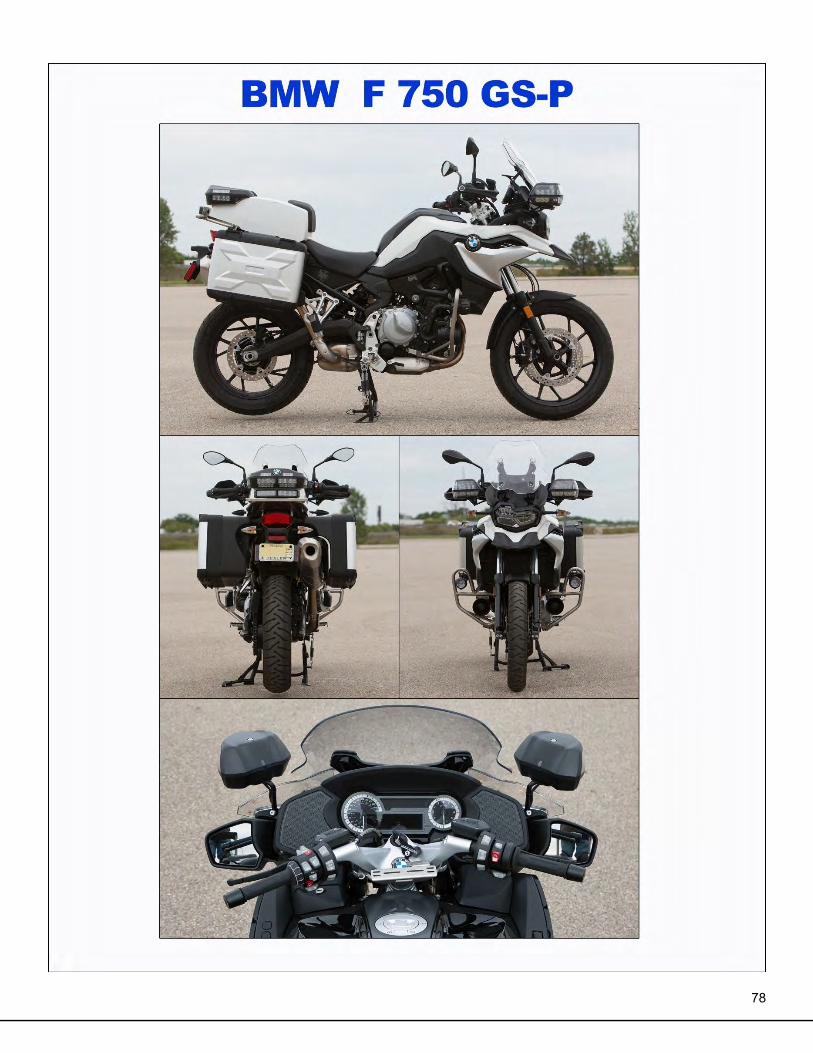
78
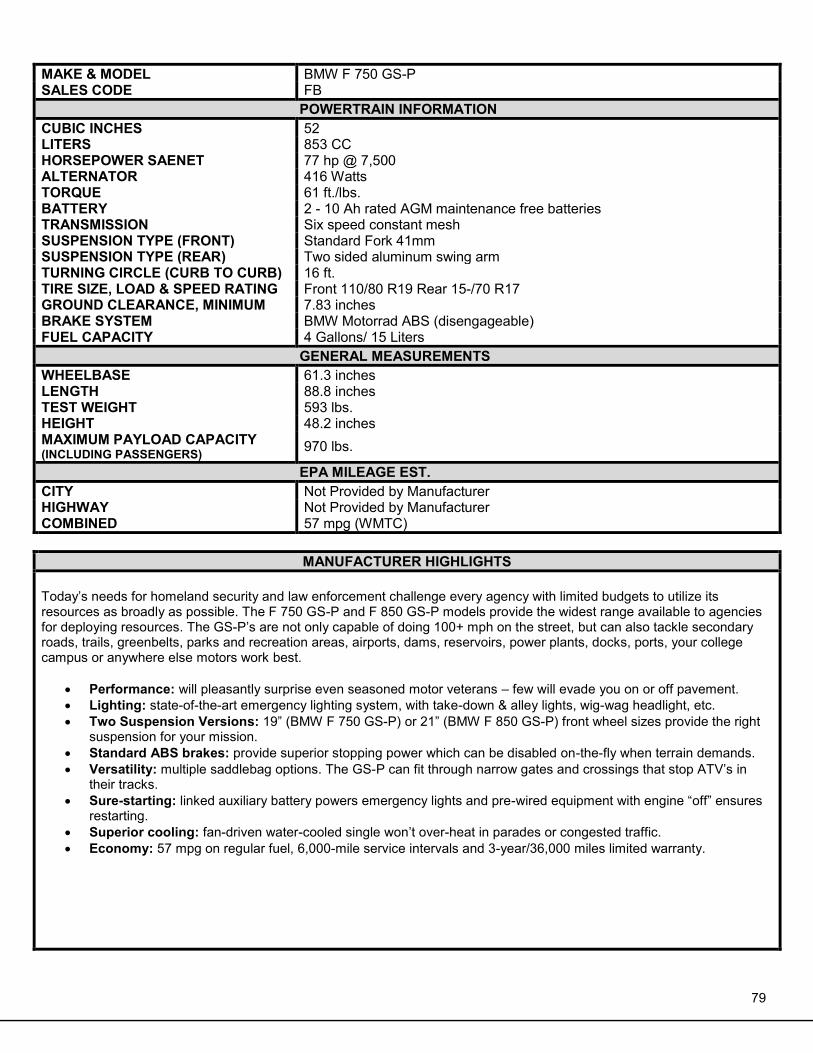
79
MAKE & MODEL BMW F 750 GS-P SALES CODE FB
POWERTRAIN INFORMATION CUBIC INCHES 52 LITERS 853 CC HORSEPOWER SAENET 77 hp @ 7,500 ALTERNATOR 416 Watts TORQUE 61 ft./lbs. BATTERY 2 - 10 Ah rated AGM maintenance free batteries TRANSMISSION Six speed constant mesh SUSPENSION TYPE (FRONT) Standard Fork 41mm SUSPENSION TYPE (REAR) Two sided aluminum swing arm TURNING CIRCLE (CURB TO CURB) 16 ft. TIRE SIZE, LOAD & SPEED RATING Front 110/80 R19 Rear 15-/70 R17 GROUND CLEARANCE, MINIMUM 7.83 inches BRAKE SYSTEM BMW Motorrad ABS (disengageable) FUEL CAPACITY 4 Gallons/ 15 Liters
GENERAL MEASUREMENTS WHEELBASE 61.3 inches LENGTH 88.8 inches TEST WEIGHT 593 lbs. HEIGHT 48.2 inches MAXIMUM PAYLOAD CAPACITY (INCLUDING PASSENGERS) 970 lbs.
EPA MILEAGE EST. CITY Not Provided by Manufacturer HIGHWAY Not Provided by Manufacturer COMBINED 57 mpg (WMTC)
MANUFACTURER HIGHLIGHTS
Today’s needs for homeland security and law enforcement challenge every agency with limited budgets to utilize its resources as broadly as possible. The F 750 GS-P and F 850 GS-P models provide the widest range available to agencies for deploying resources. The GS-P’s are not only capable of doing 100+ mph on the street, but can also tackle secondary roads, trails, greenbelts, parks and recreation areas, airports, dams, reservoirs, power plants, docks, ports, your college campus or anywhere else motors work best.
• Performance: will pleasantly surprise even seasoned motor veterans – few will evade you on or off pavement. • Lighting: state-of-the-art emergency lighting system, with take-down & alley lights, wig-wag headlight, etc. • Two Suspension Versions: 19” (BMW F 750 GS-P) or 21” (BMW F 850 GS-P) front wheel sizes provide the right
suspension for your mission. • Standard ABS brakes: provide superior stopping power which can be disabled on-the-fly when terrain demands. • Versatility: multiple saddlebag options. The GS-P can fit through narrow gates and crossings that stop ATV’s in
their tracks. • Sure-starting: linked auxiliary battery powers emergency lights and pre-wired equipment with engine “off” ensures
restarting. • Superior cooling: fan-driven water-cooled single won’t over-heat in parades or congested traffic. • Economy: 57 mpg on regular fuel, 6,000-mile service intervals and 3-year/36,000 miles limited warranty.
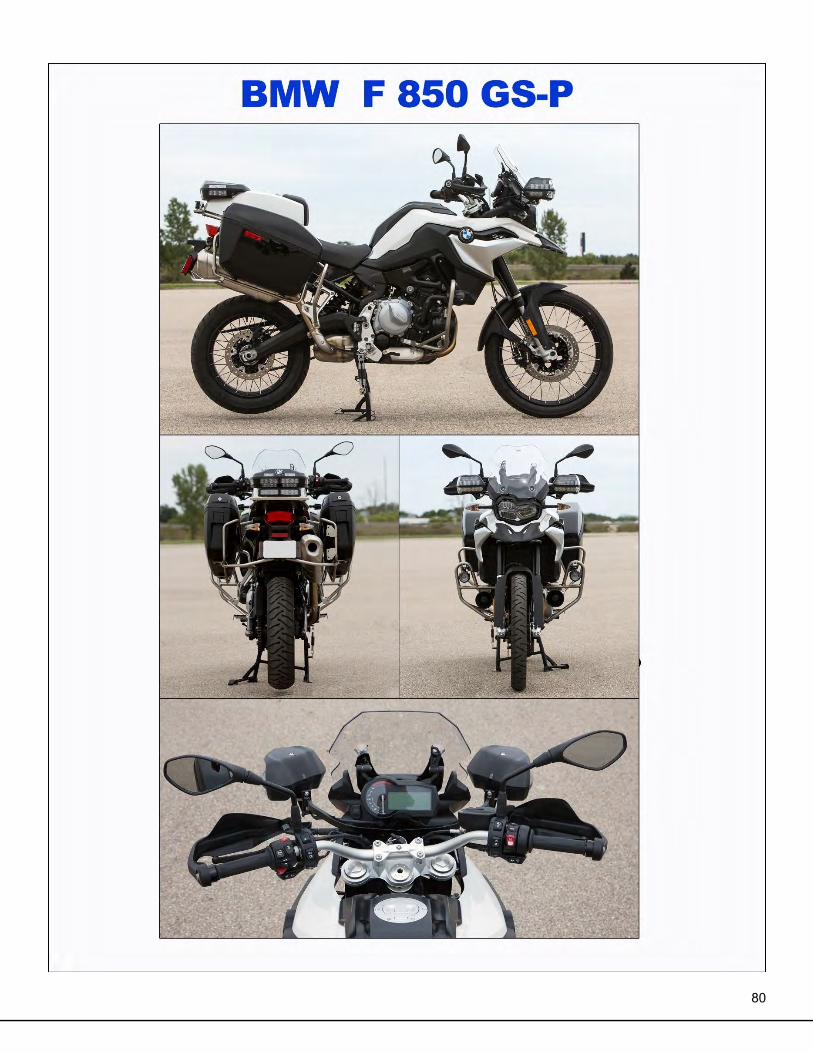
80
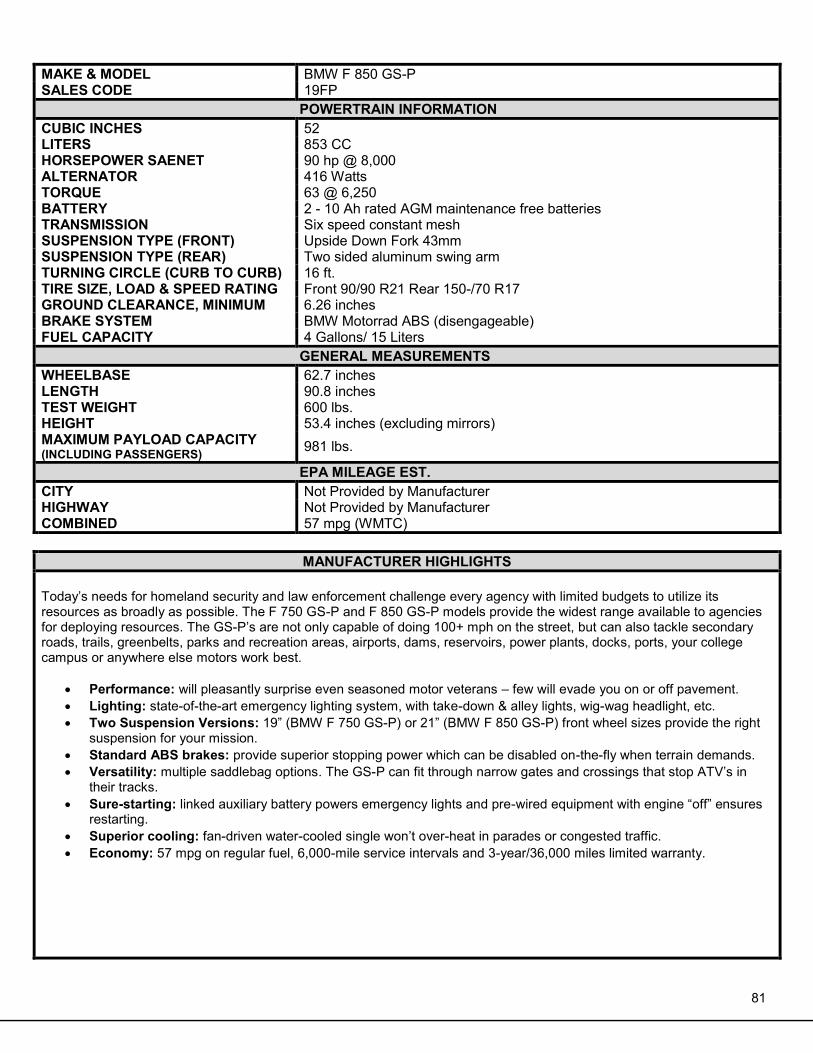
81
MAKE & MODEL BMW F 850 GS-P SALES CODE 19FP
POWERTRAIN INFORMATION CUBIC INCHES 52 LITERS 853 CC HORSEPOWER SAENET 90 hp @ 8,000 ALTERNATOR 416 Watts TORQUE 63 @ 6,250 BATTERY 2 - 10 Ah rated AGM maintenance free batteries TRANSMISSION Six speed constant mesh SUSPENSION TYPE (FRONT) Upside Down Fork 43mm SUSPENSION TYPE (REAR) Two sided aluminum swing arm TURNING CIRCLE (CURB TO CURB) 16 ft. TIRE SIZE, LOAD & SPEED RATING Front 90/90 R21 Rear 150-/70 R17 GROUND CLEARANCE, MINIMUM 6.26 inches BRAKE SYSTEM BMW Motorrad ABS (disengageable) FUEL CAPACITY 4 Gallons/ 15 Liters
GENERAL MEASUREMENTS WHEELBASE 62.7 inches LENGTH 90.8 inches TEST WEIGHT 600 lbs. HEIGHT 53.4 inches (excluding mirrors) MAXIMUM PAYLOAD CAPACITY (INCLUDING PASSENGERS) 981 lbs.
EPA MILEAGE EST. CITY Not Provided by Manufacturer HIGHWAY Not Provided by Manufacturer COMBINED 57 mpg (WMTC)
MANUFACTURER HIGHLIGHTS
Today’s needs for homeland security and law enforcement challenge every agency with limited budgets to utilize its resources as broadly as possible. The F 750 GS-P and F 850 GS-P models provide the widest range available to agencies for deploying resources. The GS-P’s are not only capable of doing 100+ mph on the street, but can also tackle secondary roads, trails, greenbelts, parks and recreation areas, airports, dams, reservoirs, power plants, docks, ports, your college campus or anywhere else motors work best.
• Performance: will pleasantly surprise even seasoned motor veterans – few will evade you on or off pavement. • Lighting: state-of-the-art emergency lighting system, with take-down & alley lights, wig-wag headlight, etc. • Two Suspension Versions: 19” (BMW F 750 GS-P) or 21” (BMW F 850 GS-P) front wheel sizes provide the right
suspension for your mission. • Standard ABS brakes: provide superior stopping power which can be disabled on-the-fly when terrain demands. • Versatility: multiple saddlebag options. The GS-P can fit through narrow gates and crossings that stop ATV’s in
their tracks. • Sure-starting: linked auxiliary battery powers emergency lights and pre-wired equipment with engine “off” ensures
restarting. • Superior cooling: fan-driven water-cooled single won’t over-heat in parades or congested traffic. • Economy: 57 mpg on regular fuel, 6,000-mile service intervals and 3-year/36,000 miles limited warranty.
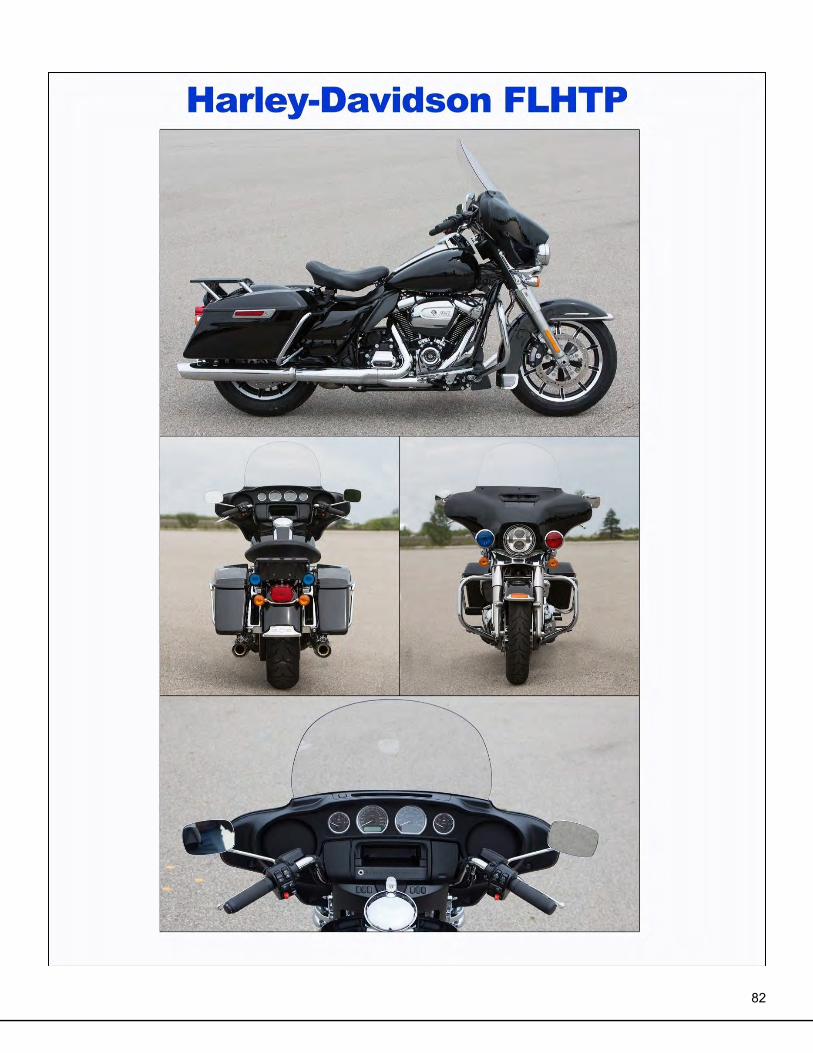
82
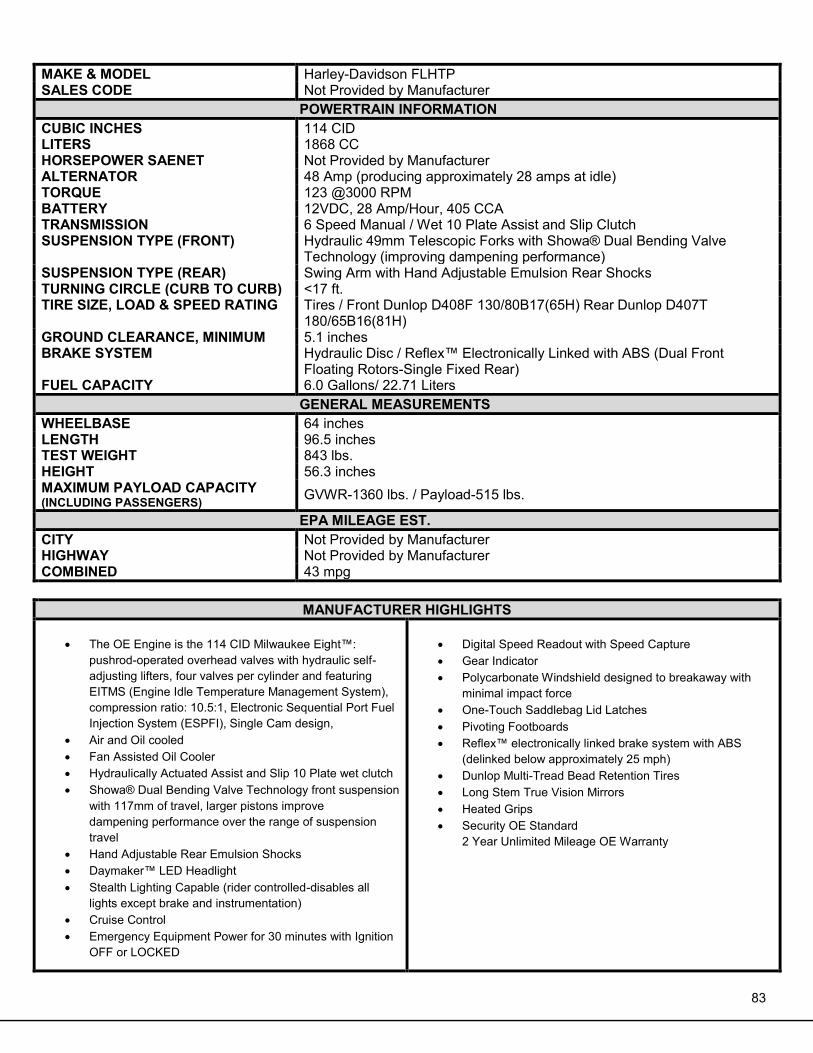
83
MAKE & MODEL Harley-Davidson FLHTP SALES CODE Not Provided by Manufacturer
POWERTRAIN INFORMATION CUBIC INCHES 114 CID LITERS 1868 CC HORSEPOWER SAENET Not Provided by Manufacturer ALTERNATOR 48 Amp (producing approximately 28 amps at idle) TORQUE 123 @3000 RPM BATTERY 12VDC, 28 Amp/Hour, 405 CCA TRANSMISSION 6 Speed Manual / Wet 10 Plate Assist and Slip Clutch SUSPENSION TYPE (FRONT) Hydraulic 49mm Telescopic Forks with Showa® Dual Bending Valve
Technology (improving dampening performance) SUSPENSION TYPE (REAR) Swing Arm with Hand Adjustable Emulsion Rear Shocks TURNING CIRCLE (CURB TO CURB) <17 ft. TIRE SIZE, LOAD & SPEED RATING Tires / Front Dunlop D408F 130/80B17(65H) Rear Dunlop D407T
180/65B16(81H) GROUND CLEARANCE, MINIMUM 5.1 inches BRAKE SYSTEM Hydraulic Disc / Reflex™ Electronically Linked with ABS (Dual Front
Floating Rotors-Single Fixed Rear) FUEL CAPACITY 6.0 Gallons/ 22.71 Liters
GENERAL MEASUREMENTS WHEELBASE 64 inches LENGTH 96.5 inches TEST WEIGHT 843 lbs. HEIGHT 56.3 inches MAXIMUM PAYLOAD CAPACITY (INCLUDING PASSENGERS) GVWR-1360 lbs. / Payload-515 lbs.
EPA MILEAGE EST. CITY Not Provided by Manufacturer HIGHWAY Not Provided by Manufacturer COMBINED 43 mpg
MANUFACTURER HIGHLIGHTS
• The OE Engine is the 114 CID Milwaukee Eight™:
pushrod-operated overhead valves with hydraulic self- adjusting lifters, four valves per cylinder and featuring EITMS (Engine Idle Temperature Management System), compression ratio: 10.5:1, Electronic Sequential Port Fuel Injection System (ESPFI), Single Cam design,
• Air and Oil cooled • Fan Assisted Oil Cooler • Hydraulically Actuated Assist and Slip 10 Plate wet clutch • Showa® Dual Bending Valve Technology front suspension
with 117mm of travel, larger pistons improve dampening performance over the range of suspension travel
• Hand Adjustable Rear Emulsion Shocks • Daymaker™ LED Headlight • Stealth Lighting Capable (rider controlled-disables all
lights except brake and instrumentation) • Cruise Control • Emergency Equipment Power for 30 minutes with Ignition
OFF or LOCKED
• Digital Speed Readout with Speed Capture • Gear Indicator • Polycarbonate Windshield designed to breakaway with
minimal impact force • One-Touch Saddlebag Lid Latches • Pivoting Footboards • Reflex™ electronically linked brake system with ABS
(delinked below approximately 25 mph) • Dunlop Multi-Tread Bead Retention Tires • Long Stem True Vision Mirrors • Heated Grips • Security OE Standard
2 Year Unlimited Mileage OE Warranty
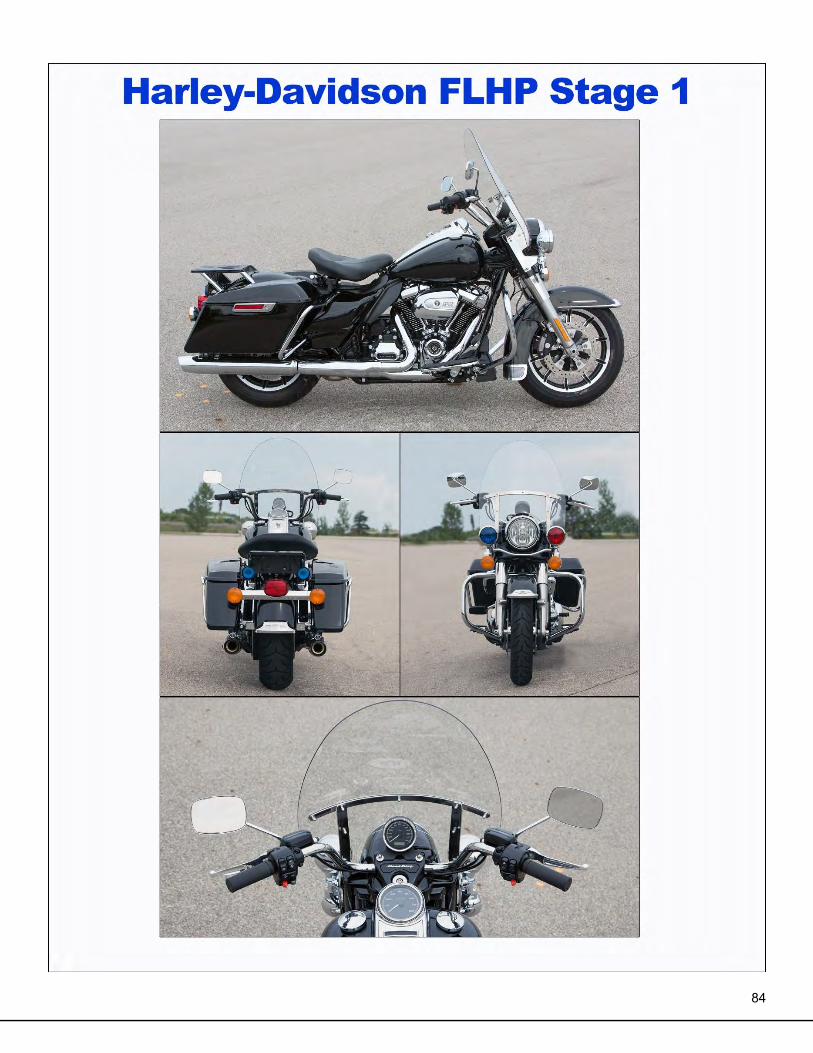
84
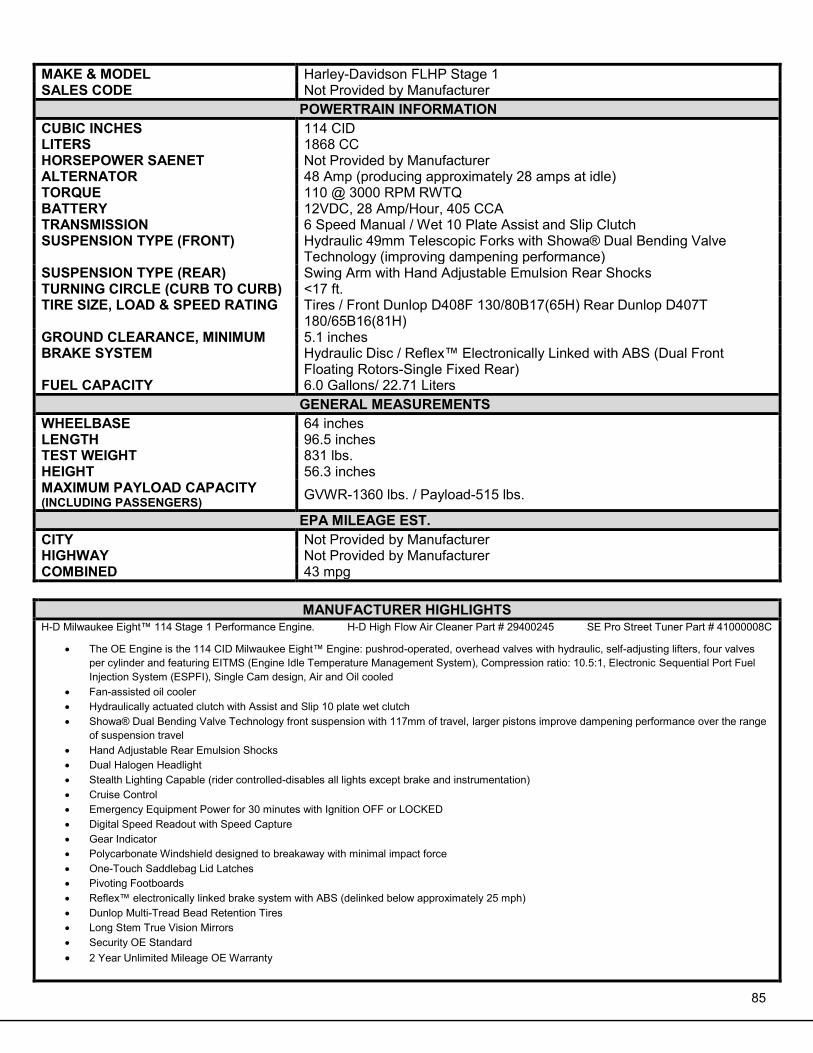
85
MAKE & MODEL Harley-Davidson FLHP Stage 1 SALES CODE Not Provided by Manufacturer
POWERTRAIN INFORMATION CUBIC INCHES 114 CID LITERS 1868 CC HORSEPOWER SAENET Not Provided by Manufacturer ALTERNATOR 48 Amp (producing approximately 28 amps at idle) TORQUE 110 @ 3000 RPM RWTQ BATTERY 12VDC, 28 Amp/Hour, 405 CCA TRANSMISSION 6 Speed Manual / Wet 10 Plate Assist and Slip Clutch SUSPENSION TYPE (FRONT) Hydraulic 49mm Telescopic Forks with Showa® Dual Bending Valve
Technology (improving dampening performance) SUSPENSION TYPE (REAR) Swing Arm with Hand Adjustable Emulsion Rear Shocks TURNING CIRCLE (CURB TO CURB) <17 ft. TIRE SIZE, LOAD & SPEED RATING Tires / Front Dunlop D408F 130/80B17(65H) Rear Dunlop D407T
180/65B16(81H) GROUND CLEARANCE, MINIMUM 5.1 inches BRAKE SYSTEM Hydraulic Disc / Reflex™ Electronically Linked with ABS (Dual Front
Floating Rotors-Single Fixed Rear) FUEL CAPACITY 6.0 Gallons/ 22.71 Liters
GENERAL MEASUREMENTS WHEELBASE 64 inches LENGTH 96.5 inches TEST WEIGHT 831 lbs. HEIGHT 56.3 inches MAXIMUM PAYLOAD CAPACITY (INCLUDING PASSENGERS) GVWR-1360 lbs. / Payload-515 lbs.
EPA MILEAGE EST. CITY Not Provided by Manufacturer HIGHWAY Not Provided by Manufacturer COMBINED 43 mpg
MANUFACTURER HIGHLIGHTS
H-D Milwaukee Eight™ 114 Stage 1 Performance Engine. H-D High Flow Air Cleaner Part # 29400245 SE Pro Street Tuner Part # 41000008C
• The OE Engine is the 114 CID Milwaukee Eight™ Engine: pushrod-operated, overhead valves with hydraulic, self-adjusting lifters, four valves per cylinder and featuring EITMS (Engine Idle Temperature Management System), Compression ratio: 10.5:1, Electronic Sequential Port Fuel Injection System (ESPFI), Single Cam design, Air and Oil cooled
• Fan-assisted oil cooler • Hydraulically actuated clutch with Assist and Slip 10 plate wet clutch • Showa® Dual Bending Valve Technology front suspension with 117mm of travel, larger pistons improve dampening performance over the range
of suspension travel • Hand Adjustable Rear Emulsion Shocks • Dual Halogen Headlight • Stealth Lighting Capable (rider controlled-disables all lights except brake and instrumentation) • Cruise Control • Emergency Equipment Power for 30 minutes with Ignition OFF or LOCKED • Digital Speed Readout with Speed Capture • Gear Indicator • Polycarbonate Windshield designed to breakaway with minimal impact force • One-Touch Saddlebag Lid Latches • Pivoting Footboards • Reflex™ electronically linked brake system with ABS (delinked below approximately 25 mph) • Dunlop Multi-Tread Bead Retention Tires • Long Stem True Vision Mirrors • Security OE Standard • 2 Year Unlimited Mileage OE Warranty
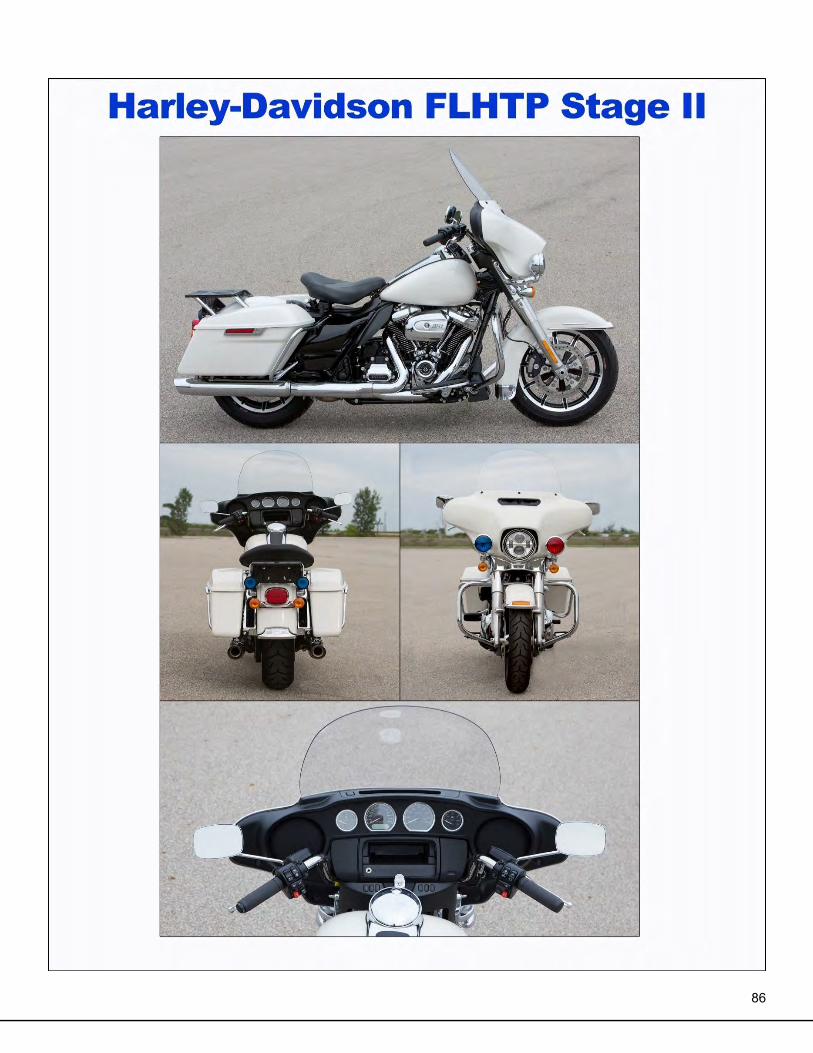
86
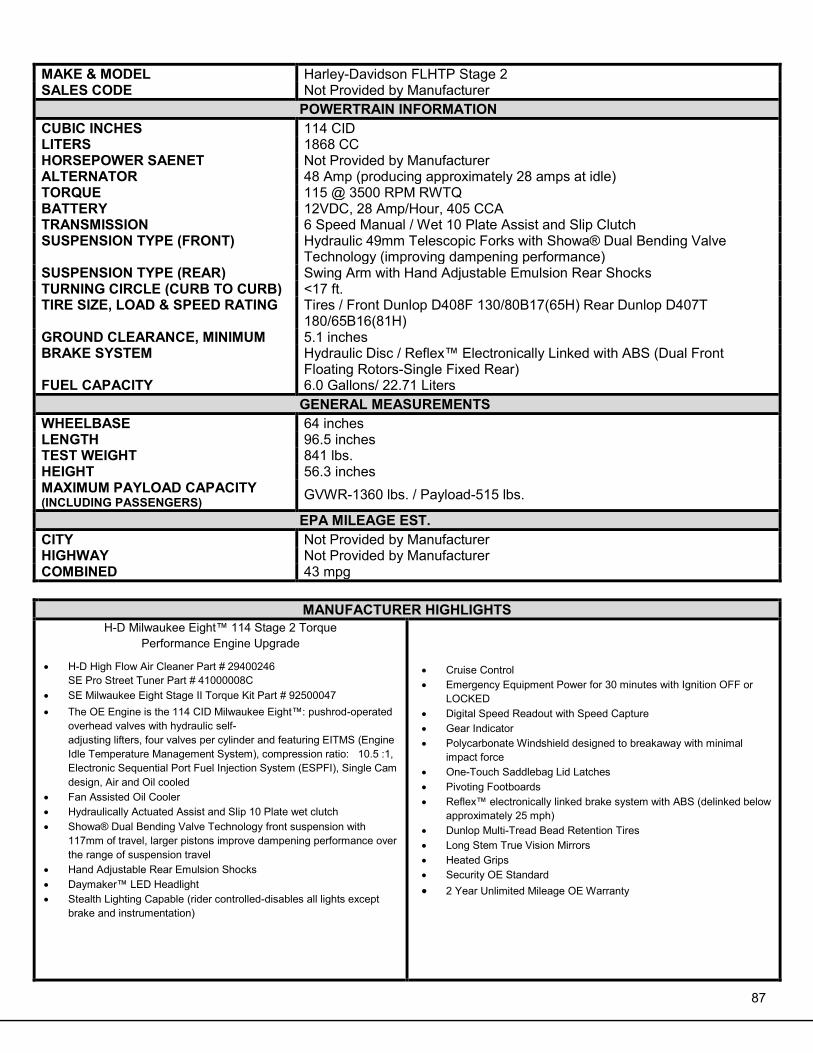
87
MAKE & MODEL Harley-Davidson FLHTP Stage 2 SALES CODE Not Provided by Manufacturer
POWERTRAIN INFORMATION CUBIC INCHES 114 CID LITERS 1868 CC HORSEPOWER SAENET Not Provided by Manufacturer ALTERNATOR 48 Amp (producing approximately 28 amps at idle) TORQUE 115 @ 3500 RPM RWTQ BATTERY 12VDC, 28 Amp/Hour, 405 CCA TRANSMISSION 6 Speed Manual / Wet 10 Plate Assist and Slip Clutch SUSPENSION TYPE (FRONT) Hydraulic 49mm Telescopic Forks with Showa® Dual Bending Valve
Technology (improving dampening performance) SUSPENSION TYPE (REAR) Swing Arm with Hand Adjustable Emulsion Rear Shocks TURNING CIRCLE (CURB TO CURB) <17 ft. TIRE SIZE, LOAD & SPEED RATING Tires / Front Dunlop D408F 130/80B17(65H) Rear Dunlop D407T
180/65B16(81H) GROUND CLEARANCE, MINIMUM 5.1 inches BRAKE SYSTEM Hydraulic Disc / Reflex™ Electronically Linked with ABS (Dual Front
Floating Rotors-Single Fixed Rear) FUEL CAPACITY 6.0 Gallons/ 22.71 Liters
GENERAL MEASUREMENTS WHEELBASE 64 inches LENGTH 96.5 inches TEST WEIGHT 841 lbs. HEIGHT 56.3 inches MAXIMUM PAYLOAD CAPACITY (INCLUDING PASSENGERS) GVWR-1360 lbs. / Payload-515 lbs.
EPA MILEAGE EST. CITY Not Provided by Manufacturer HIGHWAY Not Provided by Manufacturer COMBINED 43 mpg
MANUFACTURER HIGHLIGHTS
H-D Milwaukee Eight™ 114 Stage 2 Torque Performance Engine Upgrade
• H-D High Flow Air Cleaner Part # 29400246 SE Pro Street Tuner Part # 41000008C
• SE Milwaukee Eight Stage II Torque Kit Part # 92500047
• The OE Engine is the 114 CID Milwaukee Eight™: pushrod-operated overhead valves with hydraulic self- adjusting lifters, four valves per cylinder and featuring EITMS (Engine Idle Temperature Management System), compression ratio: 10.5 :1, Electronic Sequential Port Fuel Injection System (ESPFI), Single Cam design, Air and Oil cooled
• Fan Assisted Oil Cooler • Hydraulically Actuated Assist and Slip 10 Plate wet clutch • Showa® Dual Bending Valve Technology front suspension with
117mm of travel, larger pistons improve dampening performance over the range of suspension travel
• Hand Adjustable Rear Emulsion Shocks • Daymaker™ LED Headlight • Stealth Lighting Capable (rider controlled-disables all lights except
brake and instrumentation)
• Cruise Control • Emergency Equipment Power for 30 minutes with Ignition OFF or
LOCKED • Digital Speed Readout with Speed Capture • Gear Indicator • Polycarbonate Windshield designed to breakaway with minimal
impact force • One-Touch Saddlebag Lid Latches • Pivoting Footboards • Reflex™ electronically linked brake system with ABS (delinked below
approximately 25 mph) • Dunlop Multi-Tread Bead Retention Tires • Long Stem True Vision Mirrors • Heated Grips • Security OE Standard • 2 Year Unlimited Mileage OE Warranty
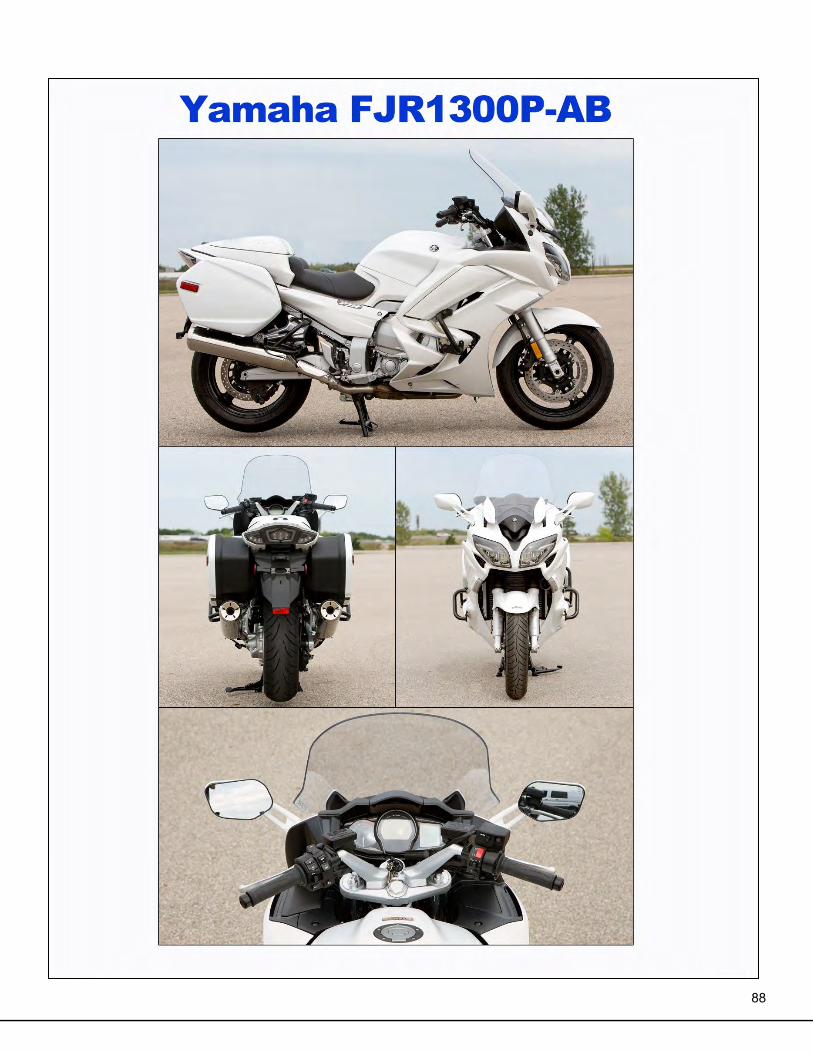
88
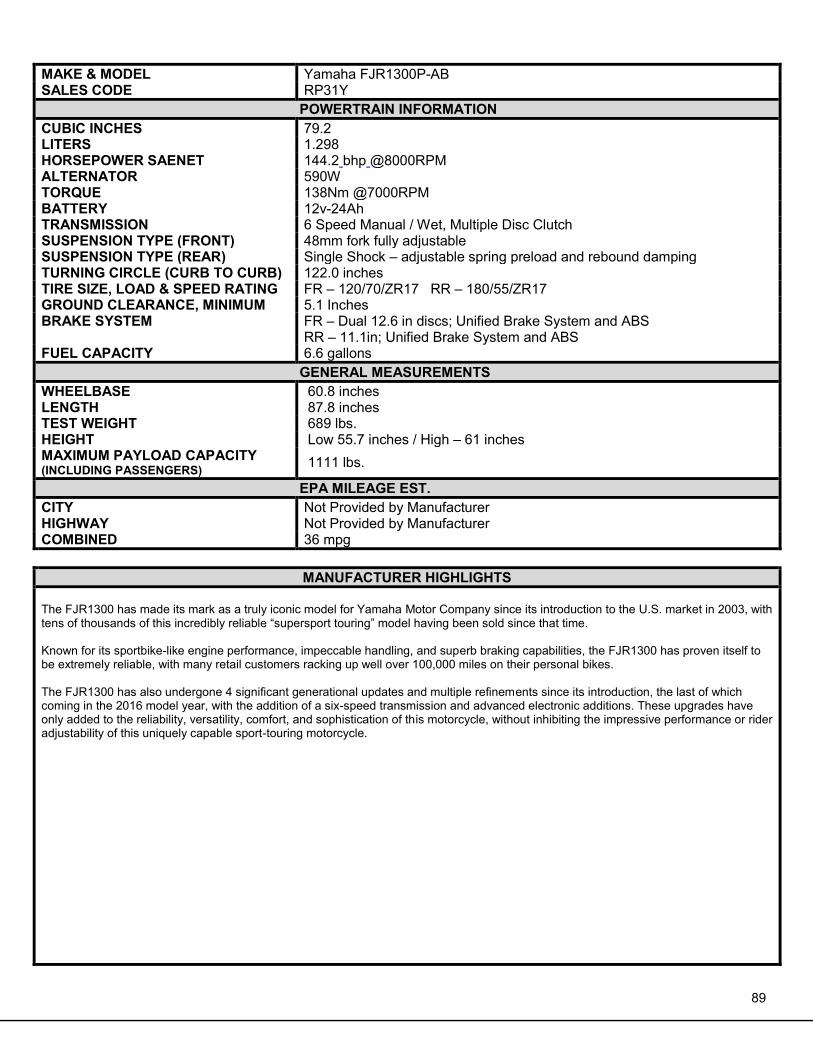
89
MAKE & MODEL Yamaha FJR1300P-AB SALES CODE RP31Y
POWERTRAIN INFORMATION CUBIC INCHES 79.2 LITERS 1.298 HORSEPOWER SAENET 144.2 bhp @8000RPM ALTERNATOR 590W TORQUE 138Nm @7000RPM BATTERY 12v-24Ah TRANSMISSION 6 Speed Manual / Wet, Multiple Disc Clutch SUSPENSION TYPE (FRONT) 48mm fork fully adjustable SUSPENSION TYPE (REAR) Single Shock – adjustable spring preload and rebound damping TURNING CIRCLE (CURB TO CURB) 122.0 inches TIRE SIZE, LOAD & SPEED RATING FR – 120/70/ZR17 RR – 180/55/ZR17 GROUND CLEARANCE, MINIMUM 5.1 Inches BRAKE SYSTEM FR – Dual 12.6 in discs; Unified Brake System and ABS
RR – 11.1in; Unified Brake System and ABS FUEL CAPACITY 6.6 gallons
GENERAL MEASUREMENTS WHEELBASE 60.8 inches LENGTH 87.8 inches TEST WEIGHT 689 lbs. HEIGHT Low 55.7 inches / High – 61 inches MAXIMUM PAYLOAD CAPACITY (INCLUDING PASSENGERS) 1111 lbs.
EPA MILEAGE EST. CITY Not Provided by Manufacturer HIGHWAY Not Provided by Manufacturer COMBINED 36 mpg
MANUFACTURER HIGHLIGHTS
The FJR1300 has made its mark as a truly iconic model for Yamaha Motor Company since its introduction to the U.S. market in 2003, with tens of thousands of this incredibly reliable “supersport touring” model having been sold since that time. Known for its sportbike-like engine performance, impeccable handling, and superb braking capabilities, the FJR1300 has proven itself to be extremely reliable, with many retail customers racking up well over 100,000 miles on their personal bikes. The FJR1300 has also undergone 4 significant generational updates and multiple refinements since its introduction, the last of which coming in the 2016 model year, with the addition of a six-speed transmission and advanced electronic additions. These upgrades have only added to the reliability, versatility, comfort, and sophistication of this motorcycle, without inhibiting the impressive performance or rider adjustability of this uniquely capable sport-touring motorcycle.

90
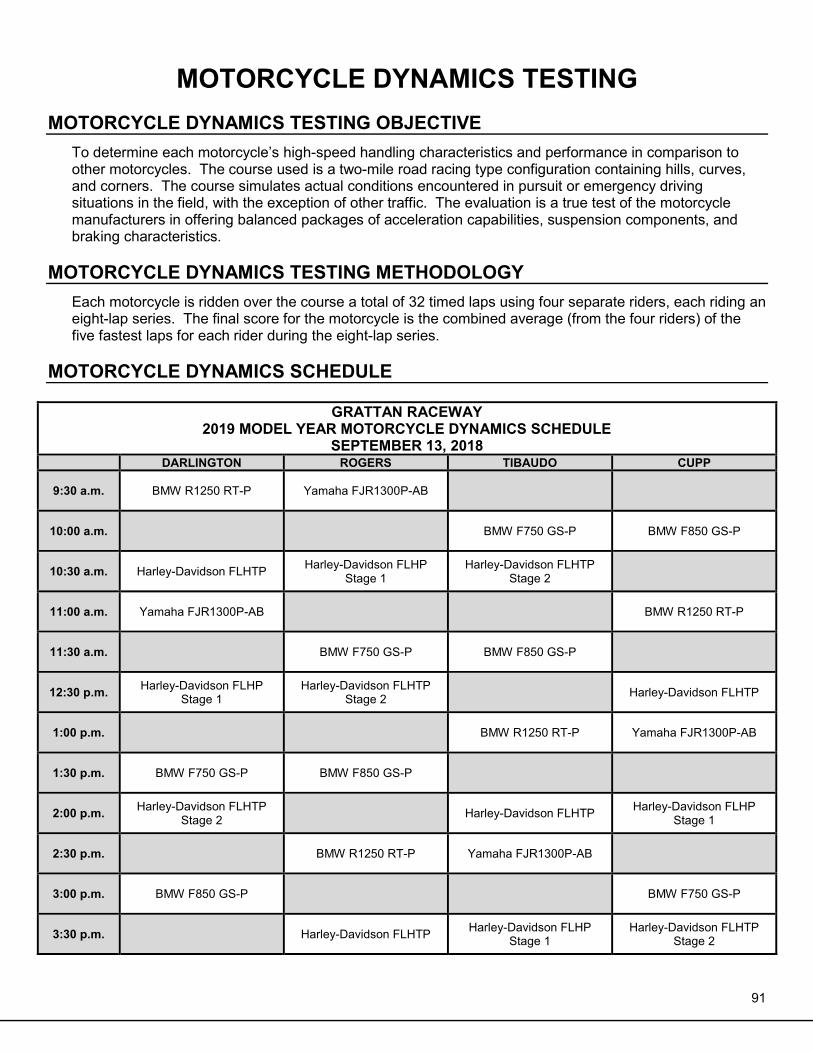
91
MOTORCYCLE DYNAMICS TESTING MOTORCYCLE DYNAMICS TESTING OBJECTIVE
To determine each motorcycle’s high-speed handling characteristics and performance in comparison to other motorcycles. The course used is a two-mile road racing type configuration containing hills, curves, and corners. The course simulates actual conditions encountered in pursuit or emergency driving situations in the field, with the exception of other traffic. The evaluation is a true test of the motorcycle manufacturers in offering balanced packages of acceleration capabilities, suspension components, and braking characteristics.
MOTORCYCLE DYNAMICS TESTING METHODOLOGY
Each motorcycle is ridden over the course a total of 32 timed laps using four separate riders, each riding an eight-lap series. The final score for the motorcycle is the combined average (from the four riders) of the five fastest laps for each rider during the eight-lap series.
MOTORCYCLE DYNAMICS SCHEDULE
GRATTAN RACEWAY 2019 MODEL YEAR MOTORCYCLE DYNAMICS SCHEDULE
SEPTEMBER 13, 2018 DARLINGTON ROGERS TIBAUDO CUPP
9:30 a.m. BMW R1250 RT-P Yamaha FJR1300P-AB
10:00 a.m. BMW F750 GS-P BMW F850 GS-P
10:30 a.m. Harley-Davidson FLHTP Harley-Davidson FLHP Stage 1
Harley-Davidson FLHTP Stage 2
11:00 a.m. Yamaha FJR1300P-AB BMW R1250 RT-P
11:30 a.m. BMW F750 GS-P BMW F850 GS-P
12:30 p.m. Harley-Davidson FLHP Stage 1
Harley-Davidson FLHTP Stage 2 Harley-Davidson FLHTP
1:00 p.m. BMW R1250 RT-P Yamaha FJR1300P-AB
1:30 p.m. BMW F750 GS-P BMW F850 GS-P
2:00 p.m. Harley-Davidson FLHTP Stage 2 Harley-Davidson FLHTP Harley-Davidson FLHP
Stage 1
2:30 p.m. BMW R1250 RT-P Yamaha FJR1300P-AB
3:00 p.m. BMW F850 GS-P BMW F750 GS-P
3:30 p.m. Harley-Davidson FLHTP Harley-Davidson FLHP Stage 1
Harley-Davidson FLHTP Stage 2
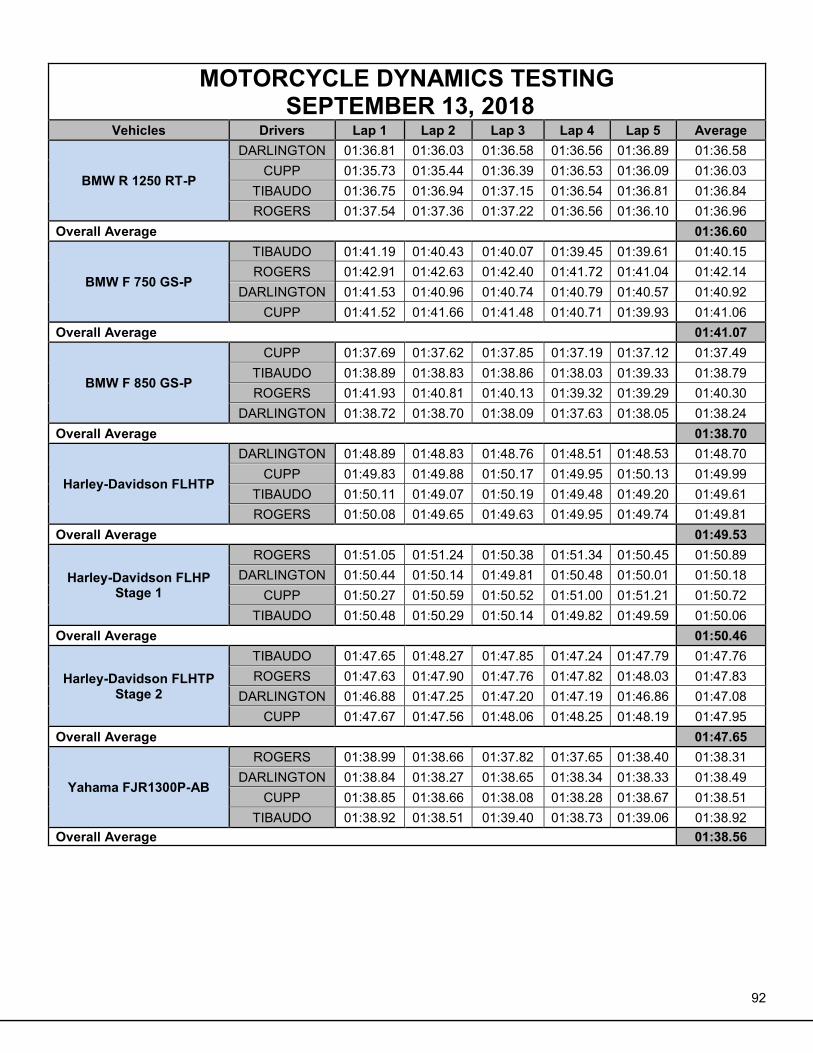
92
MOTORCYCLE DYNAMICS TESTING SEPTEMBER 13, 2018
Vehicles Drivers Lap 1 Lap 2 Lap 3 Lap 4 Lap 5 Average
BMW R 1250 RT-P
DARLINGTON 01:36.81 01:36.03 01:36.58 01:36.56 01:36.89 01:36.58 CUPP 01:35.73 01:35.44 01:36.39 01:36.53 01:36.09 01:36.03
TIBAUDO 01:36.75 01:36.94 01:37.15 01:36.54 01:36.81 01:36.84 ROGERS 01:37.54 01:37.36 01:37.22 01:36.56 01:36.10 01:36.96
Overall Average 01:36.60
BMW F 750 GS-P
TIBAUDO 01:41.19 01:40.43 01:40.07 01:39.45 01:39.61 01:40.15 ROGERS 01:42.91 01:42.63 01:42.40 01:41.72 01:41.04 01:42.14
DARLINGTON 01:41.53 01:40.96 01:40.74 01:40.79 01:40.57 01:40.92 CUPP 01:41.52 01:41.66 01:41.48 01:40.71 01:39.93 01:41.06
Overall Average 01:41.07
BMW F 850 GS-P
CUPP 01:37.69 01:37.62 01:37.85 01:37.19 01:37.12 01:37.49 TIBAUDO 01:38.89 01:38.83 01:38.86 01:38.03 01:39.33 01:38.79 ROGERS 01:41.93 01:40.81 01:40.13 01:39.32 01:39.29 01:40.30
DARLINGTON 01:38.72 01:38.70 01:38.09 01:37.63 01:38.05 01:38.24 Overall Average 01:38.70
Harley-Davidson FLHTP
DARLINGTON 01:48.89 01:48.83 01:48.76 01:48.51 01:48.53 01:48.70 CUPP 01:49.83 01:49.88 01:50.17 01:49.95 01:50.13 01:49.99
TIBAUDO 01:50.11 01:49.07 01:50.19 01:49.48 01:49.20 01:49.61 ROGERS 01:50.08 01:49.65 01:49.63 01:49.95 01:49.74 01:49.81
Overall Average 01:49.53
Harley-Davidson FLHP Stage 1
ROGERS 01:51.05 01:51.24 01:50.38 01:51.34 01:50.45 01:50.89 DARLINGTON 01:50.44 01:50.14 01:49.81 01:50.48 01:50.01 01:50.18
CUPP 01:50.27 01:50.59 01:50.52 01:51.00 01:51.21 01:50.72 TIBAUDO 01:50.48 01:50.29 01:50.14 01:49.82 01:49.59 01:50.06
Overall Average 01:50.46
Harley-Davidson FLHTP Stage 2
TIBAUDO 01:47.65 01:48.27 01:47.85 01:47.24 01:47.79 01:47.76 ROGERS 01:47.63 01:47.90 01:47.76 01:47.82 01:48.03 01:47.83
DARLINGTON 01:46.88 01:47.25 01:47.20 01:47.19 01:46.86 01:47.08 CUPP 01:47.67 01:47.56 01:48.06 01:48.25 01:48.19 01:47.95
Overall Average 01:47.65
Yahama FJR1300P-AB
ROGERS 01:38.99 01:38.66 01:37.82 01:37.65 01:38.40 01:38.31 DARLINGTON 01:38.84 01:38.27 01:38.65 01:38.34 01:38.33 01:38.49
CUPP 01:38.85 01:38.66 01:38.08 01:38.28 01:38.67 01:38.51 TIBAUDO 01:38.92 01:38.51 01:39.40 01:38.73 01:39.06 01:38.92
Overall Average 01:38.56
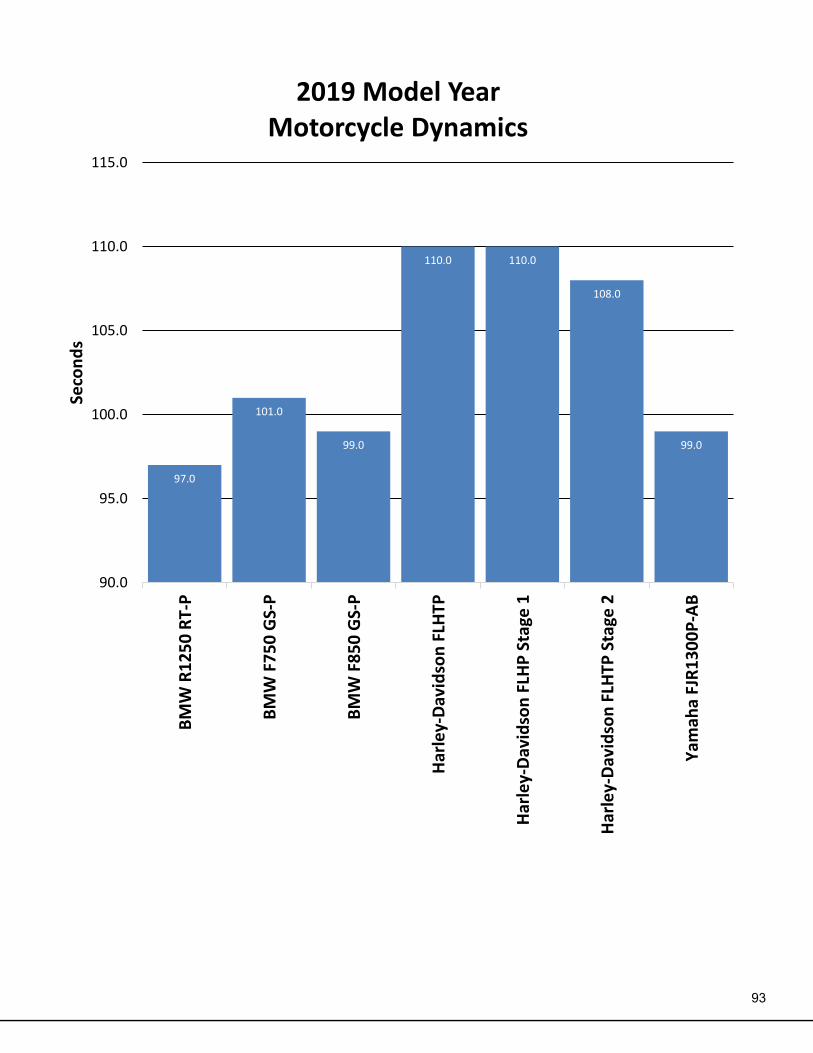
93
97.0
101.0
99.0
110.0 110.0
108.0
99.0
90.0
95.0
100.0
105.0
110.0
115.0
BM
W R
12
50
RT-
P
BM
W F
75
0 G
S-P
BM
W F
85
0 G
S-P
Har
ley-
Dav
idso
n F
LHTP
Har
ley-
Dav
idso
n F
LHP
Sta
ge 1
Har
ley-
Dav
idso
n F
LHTP
Sta
ge 2
Yam
aha
FJR
13
00
P-A
B
Seco
nd
s2019 Model Year
Motorcycle Dynamics

94
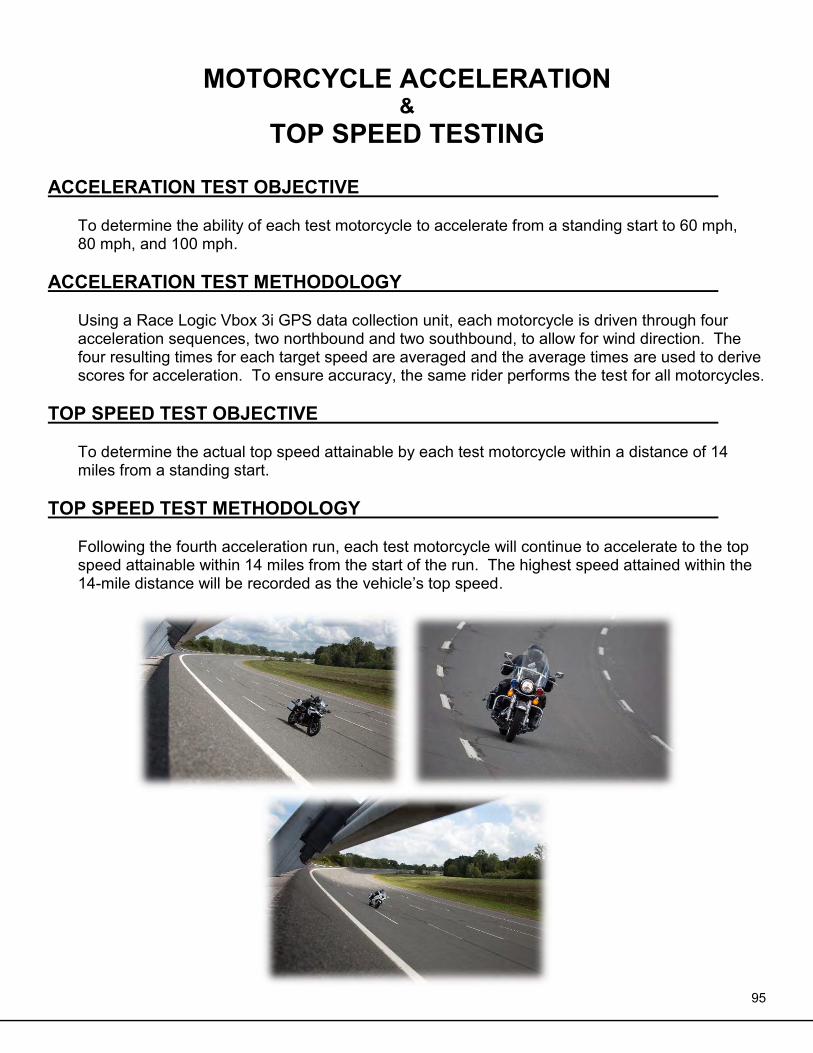
95
MOTORCYCLE ACCELERATION &
TOP SPEED TESTING
ACCELERATION TEST OBJECTIVE
To determine the ability of each test motorcycle to accelerate from a standing start to 60 mph, 80 mph, and 100 mph.
ACCELERATION TEST METHODOLOGY
Using a Race Logic Vbox 3i GPS data collection unit, each motorcycle is driven through four acceleration sequences, two northbound and two southbound, to allow for wind direction. The four resulting times for each target speed are averaged and the average times are used to derive scores for acceleration. To ensure accuracy, the same rider performs the test for all motorcycles.
TOP SPEED TEST OBJECTIVE
To determine the actual top speed attainable by each test motorcycle within a distance of 14 miles from a standing start.
TOP SPEED TEST METHODOLOGY
Following the fourth acceleration run, each test motorcycle will continue to accelerate to the top speed attainable within 14 miles from the start of the run. The highest speed attained within the 14-mile distance will be recorded as the vehicle’s top speed.
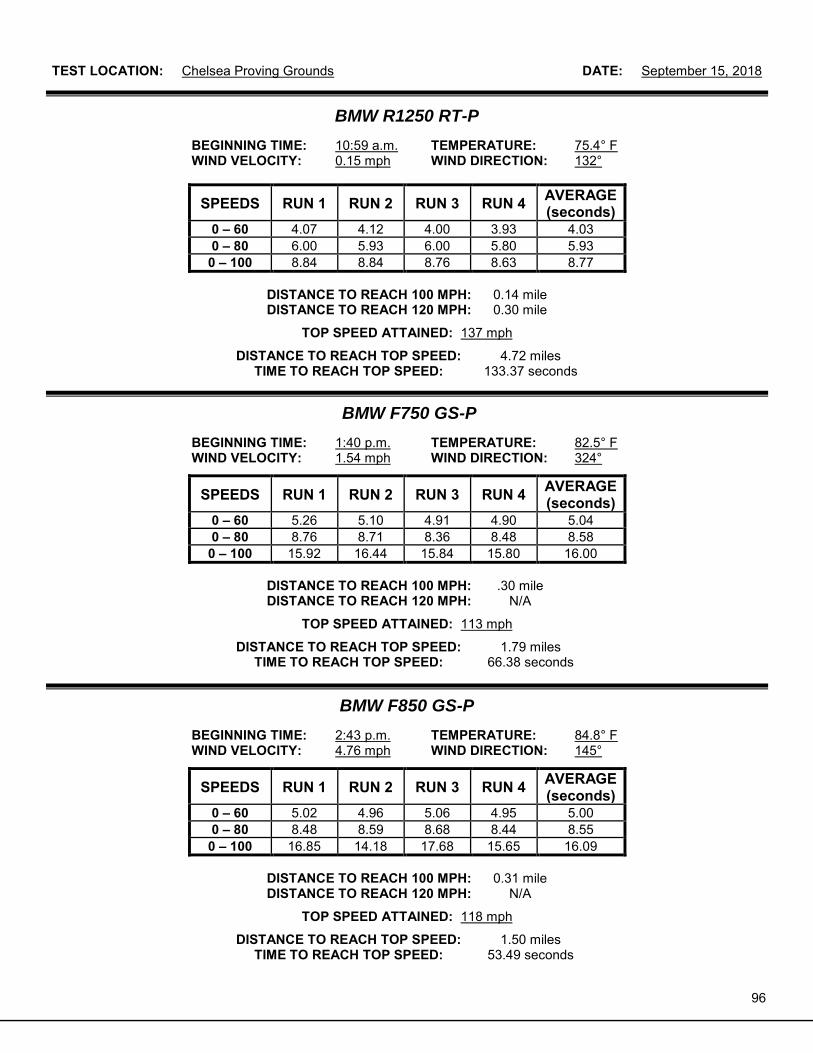
96
TEST LOCATION: Chelsea Proving Grounds DATE: September 15, 2018
BMW R1250 RT-P
BEGINNING TIME: 10:59 a.m. TEMPERATURE: 75.4° F WIND VELOCITY: 0.15 mph WIND DIRECTION: 132°
SPEEDS RUN 1 RUN 2 RUN 3 RUN 4 AVERAGE (seconds)
0 – 60 4.07 4.12 4.00 3.93 4.03 0 – 80 6.00 5.93 6.00 5.80 5.93 0 – 100 8.84 8.84 8.76 8.63 8.77
DISTANCE TO REACH 100 MPH: 0.14 mile DISTANCE TO REACH 120 MPH: 0.30 mile
TOP SPEED ATTAINED: 137 mph
DISTANCE TO REACH TOP SPEED: 4.72 miles TIME TO REACH TOP SPEED: 133.37 seconds
BMW F750 GS-P
BEGINNING TIME: 1:40 p.m. TEMPERATURE: 82.5° F WIND VELOCITY: 1.54 mph WIND DIRECTION: 324°
SPEEDS RUN 1 RUN 2 RUN 3 RUN 4 AVERAGE (seconds)
0 – 60 5.26 5.10 4.91 4.90 5.04 0 – 80 8.76 8.71 8.36 8.48 8.58 0 – 100 15.92 16.44 15.84 15.80 16.00
DISTANCE TO REACH 100 MPH: .30 mile DISTANCE TO REACH 120 MPH: N/A
TOP SPEED ATTAINED: 113 mph
DISTANCE TO REACH TOP SPEED: 1.79 miles TIME TO REACH TOP SPEED: 66.38 seconds
BMW F850 GS-P
BEGINNING TIME: 2:43 p.m. TEMPERATURE: 84.8° F WIND VELOCITY: 4.76 mph WIND DIRECTION: 145°
SPEEDS RUN 1 RUN 2 RUN 3 RUN 4 AVERAGE (seconds)
0 – 60 5.02 4.96 5.06 4.95 5.00 0 – 80 8.48 8.59 8.68 8.44 8.55 0 – 100 16.85 14.18 17.68 15.65 16.09
DISTANCE TO REACH 100 MPH: 0.31 mile DISTANCE TO REACH 120 MPH: N/A
TOP SPEED ATTAINED: 118 mph
DISTANCE TO REACH TOP SPEED: 1.50 miles TIME TO REACH TOP SPEED: 53.49 seconds
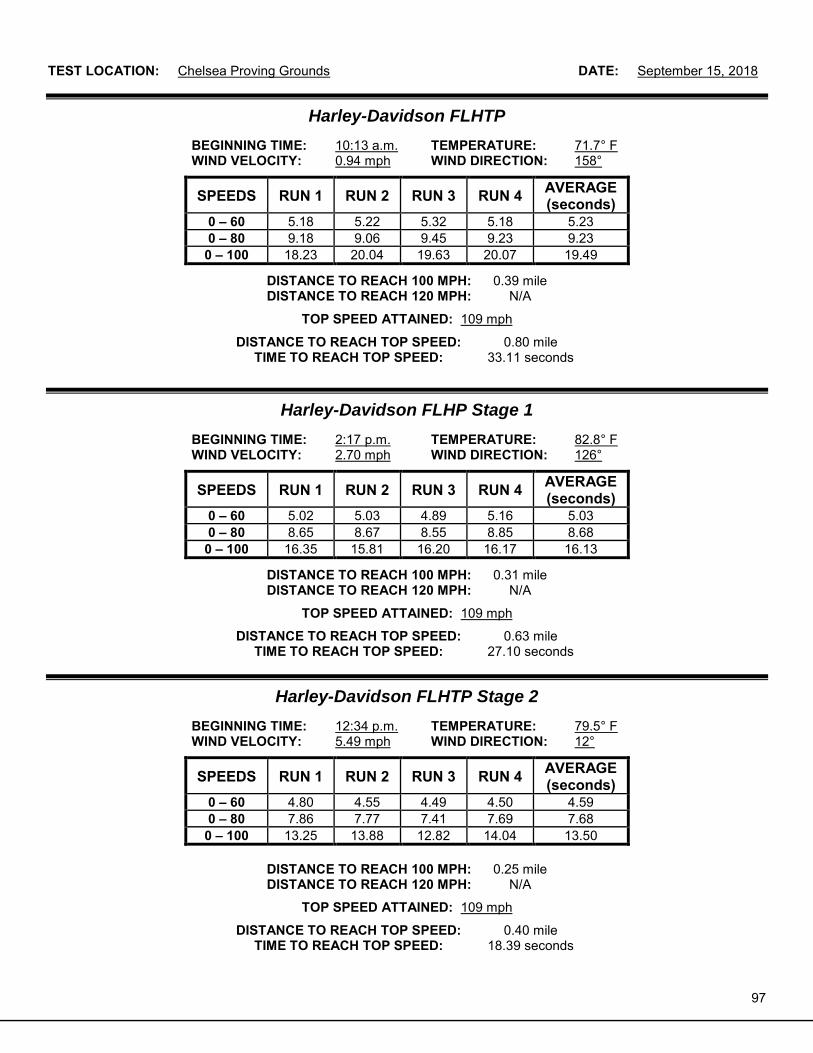
97
TEST LOCATION: Chelsea Proving Grounds DATE: September 15, 2018
Harley-Davidson FLHTP
BEGINNING TIME: 10:13 a.m. TEMPERATURE: 71.7° F WIND VELOCITY: 0.94 mph WIND DIRECTION: 158°
SPEEDS RUN 1 RUN 2 RUN 3 RUN 4 AVERAGE (seconds)
0 – 60 5.18 5.22 5.32 5.18 5.23 0 – 80 9.18 9.06 9.45 9.23 9.23 0 – 100 18.23 20.04 19.63 20.07 19.49
DISTANCE TO REACH 100 MPH: 0.39 mile DISTANCE TO REACH 120 MPH: N/A
TOP SPEED ATTAINED: 109 mph
DISTANCE TO REACH TOP SPEED: 0.80 mile TIME TO REACH TOP SPEED: 33.11 seconds
Harley-Davidson FLHP Stage 1
BEGINNING TIME: 2:17 p.m. TEMPERATURE: 82.8° F WIND VELOCITY: 2.70 mph WIND DIRECTION: 126°
SPEEDS RUN 1 RUN 2 RUN 3 RUN 4 AVERAGE (seconds)
0 – 60 5.02 5.03 4.89 5.16 5.03 0 – 80 8.65 8.67 8.55 8.85 8.68 0 – 100 16.35 15.81 16.20 16.17 16.13
DISTANCE TO REACH 100 MPH: 0.31 mile DISTANCE TO REACH 120 MPH: N/A
TOP SPEED ATTAINED: 109 mph
DISTANCE TO REACH TOP SPEED: 0.63 mile TIME TO REACH TOP SPEED: 27.10 seconds
Harley-Davidson FLHTP Stage 2
BEGINNING TIME: 12:34 p.m. TEMPERATURE: 79.5° F WIND VELOCITY: 5.49 mph WIND DIRECTION: 12°
SPEEDS RUN 1 RUN 2 RUN 3 RUN 4 AVERAGE (seconds)
0 – 60 4.80 4.55 4.49 4.50 4.59 0 – 80 7.86 7.77 7.41 7.69 7.68 0 – 100 13.25 13.88 12.82 14.04 13.50
DISTANCE TO REACH 100 MPH: 0.25 mile DISTANCE TO REACH 120 MPH: N/A
TOP SPEED ATTAINED: 109 mph
DISTANCE TO REACH TOP SPEED: 0.40 mile TIME TO REACH TOP SPEED: 18.39 seconds
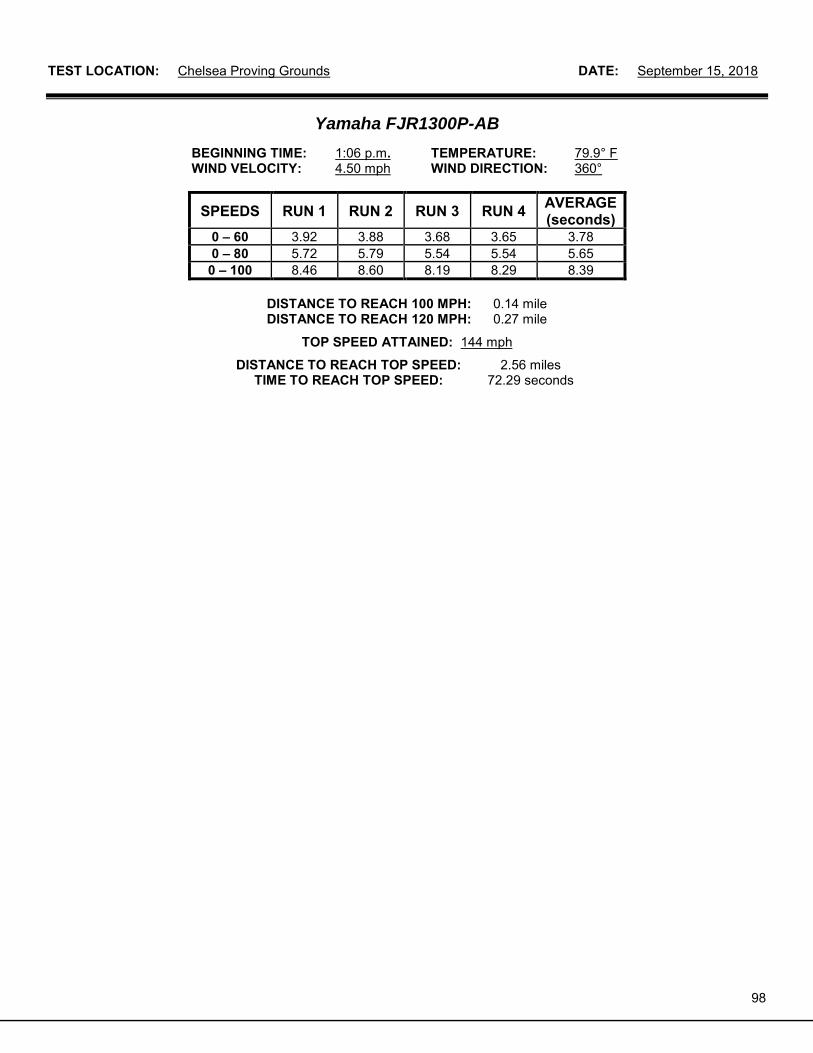
98
TEST LOCATION: Chelsea Proving Grounds DATE: September 15, 2018
Yamaha FJR1300P-AB
BEGINNING TIME: 1:06 p.m. TEMPERATURE: 79.9° F WIND VELOCITY: 4.50 mph WIND DIRECTION: 360°
SPEEDS RUN 1 RUN 2 RUN 3 RUN 4 AVERAGE (seconds)
0 – 60 3.92 3.88 3.68 3.65 3.78 0 – 80 5.72 5.79 5.54 5.54 5.65 0 – 100 8.46 8.60 8.19 8.29 8.39
DISTANCE TO REACH 100 MPH: 0.14 mile DISTANCE TO REACH 120 MPH: 0.27 mile
TOP SPEED ATTAINED: 144 mph
DISTANCE TO REACH TOP SPEED: 2.56 miles TIME TO REACH TOP SPEED: 72.29 seconds
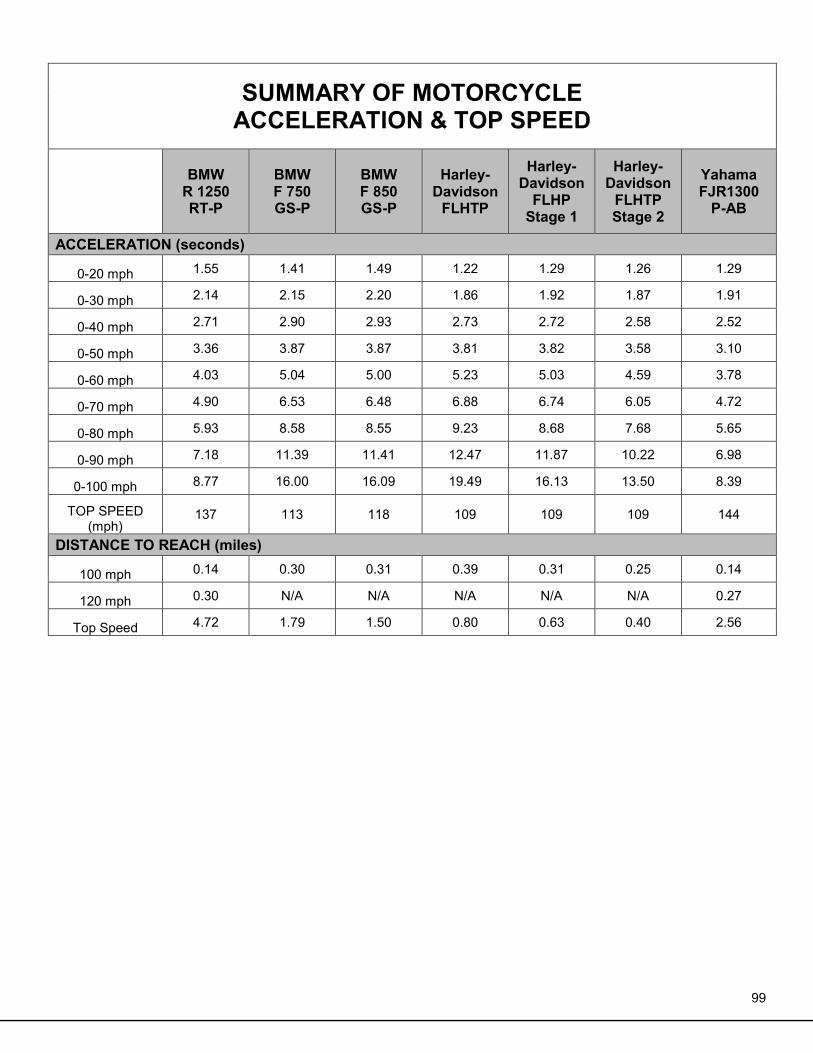
99
SUMMARY OF MOTORCYCLE ACCELERATION & TOP SPEED
BMW R 1250 RT-P
BMW F 750 GS-P
BMW F 850 GS-P
Harley-Davidson
FLHTP
Harley-Davidson
FLHP Stage 1
Harley-Davidson
FLHTP Stage 2
Yahama FJR1300
P-AB
ACCELERATION (seconds)
0-20 mph 1.55 1.41 1.49 1.22 1.29 1.26 1.29
0-30 mph 2.14 2.15 2.20 1.86 1.92 1.87 1.91
0-40 mph 2.71 2.90 2.93 2.73 2.72 2.58 2.52
0-50 mph 3.36 3.87 3.87 3.81 3.82 3.58 3.10
0-60 mph 4.03 5.04 5.00 5.23 5.03 4.59 3.78
0-70 mph 4.90 6.53 6.48 6.88 6.74 6.05 4.72
0-80 mph 5.93 8.58 8.55 9.23 8.68 7.68 5.65
0-90 mph 7.18 11.39 11.41 12.47 11.87 10.22 6.98
0-100 mph 8.77 16.00 16.09 19.49 16.13 13.50 8.39
TOP SPEED (mph)
137 113 118 109 109 109 144
DISTANCE TO REACH (miles)
100 mph 0.14 0.30 0.31 0.39 0.31 0.25 0.14
120 mph 0.30 N/A N/A N/A N/A N/A 0.27
Top Speed 4.72 1.79 1.50 0.80 0.63 0.40 2.56
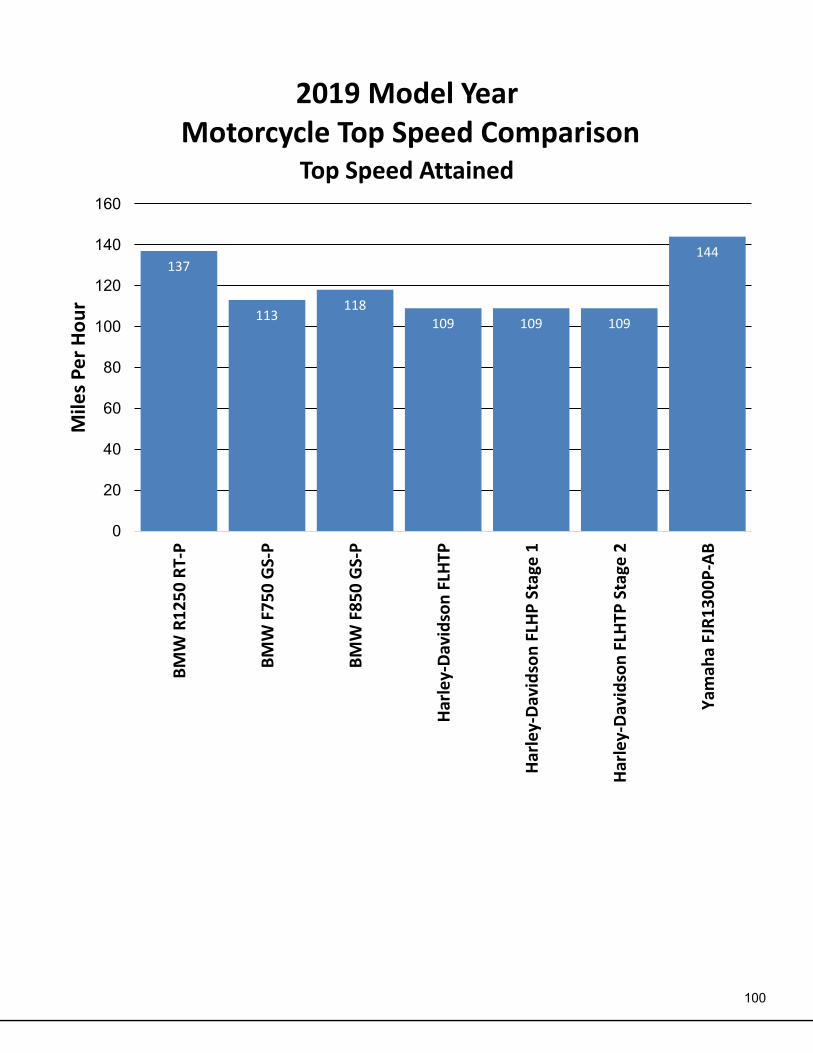
100
137
113118
109 109 109
144
0
20
40
60
80
100
120
140
160B
MW
R1
25
0 R
T-P
BM
W F
75
0 G
S-P
BM
W F
85
0 G
S-P
Har
ley-
Dav
idso
n F
LHTP
Har
ley-
Dav
idso
n F
LHP
Sta
ge 1
Har
ley-
Dav
idso
n F
LHTP
Sta
ge 2
Yam
aha
FJR
13
00
P-A
B
Mile
s P
er
Ho
ur
2019 Model YearMotorcycle Top Speed Comparison
Top Speed Attained
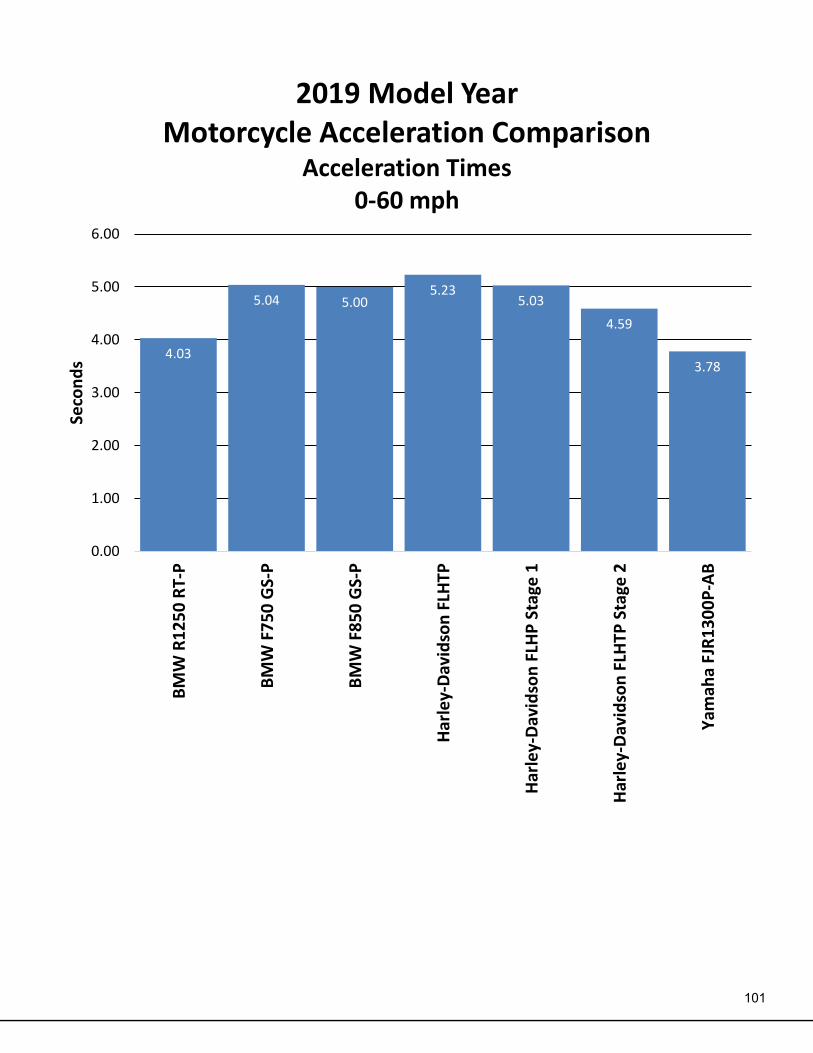
101
4.03
5.04 5.005.23
5.03
4.59
3.78
0.00
1.00
2.00
3.00
4.00
5.00
6.00
BM
W R
12
50
RT-
P
BM
W F
75
0 G
S-P
BM
W F
85
0 G
S-P
Har
ley-
Dav
idso
n F
LHTP
Har
ley-
Dav
idso
n F
LHP
Sta
ge 1
Har
ley-
Dav
idso
n F
LHTP
Sta
ge 2
Yam
aha
FJR
13
00
P-A
B
Seco
nd
s2019 Model Year
Motorcycle Acceleration ComparisonAcceleration Times
0-60 mph
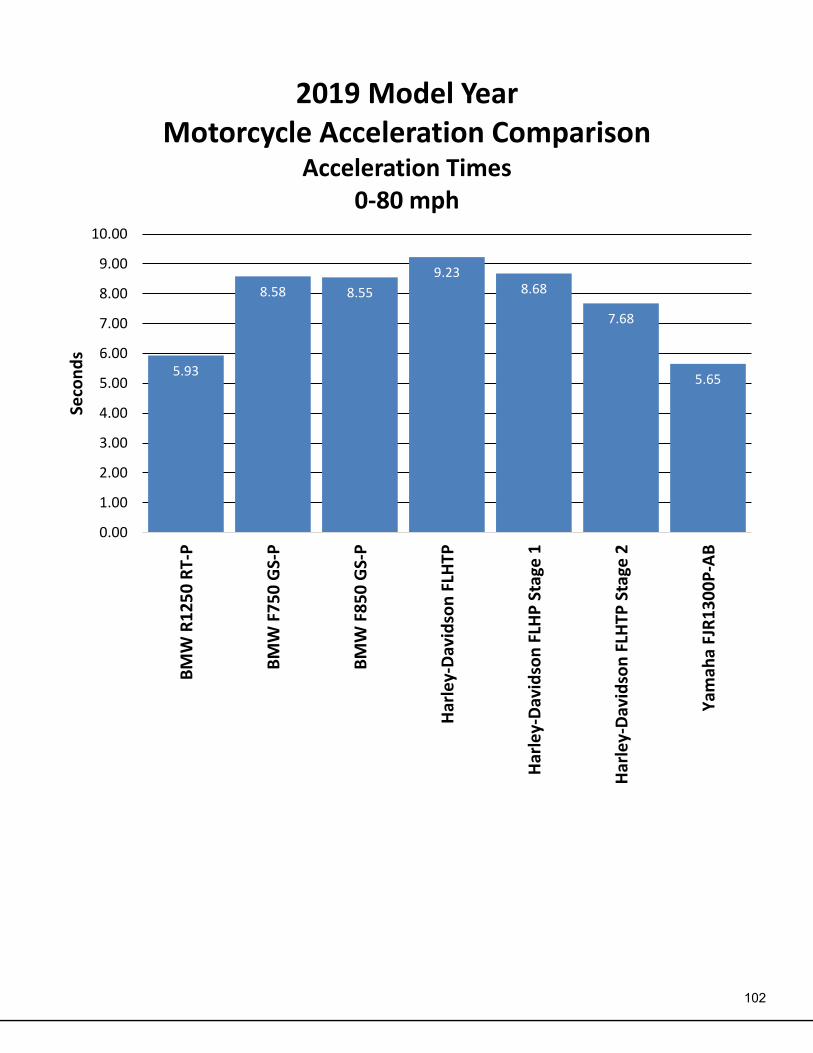
102
5.93
8.58 8.55
9.238.68
7.68
5.65
0.00
1.00
2.00
3.00
4.00
5.00
6.00
7.00
8.00
9.00
10.00
BM
W R
12
50
RT-
P
BM
W F
75
0 G
S-P
BM
W F
85
0 G
S-P
Har
ley-
Dav
idso
n F
LHTP
Har
ley-
Dav
idso
n F
LHP
Sta
ge 1
Har
ley-
Dav
idso
n F
LHTP
Sta
ge 2
Yam
aha
FJR
13
00
P-A
B
Seco
nd
s2019 Model Year
Motorcycle Acceleration ComparisonAcceleration Times
0-80 mph
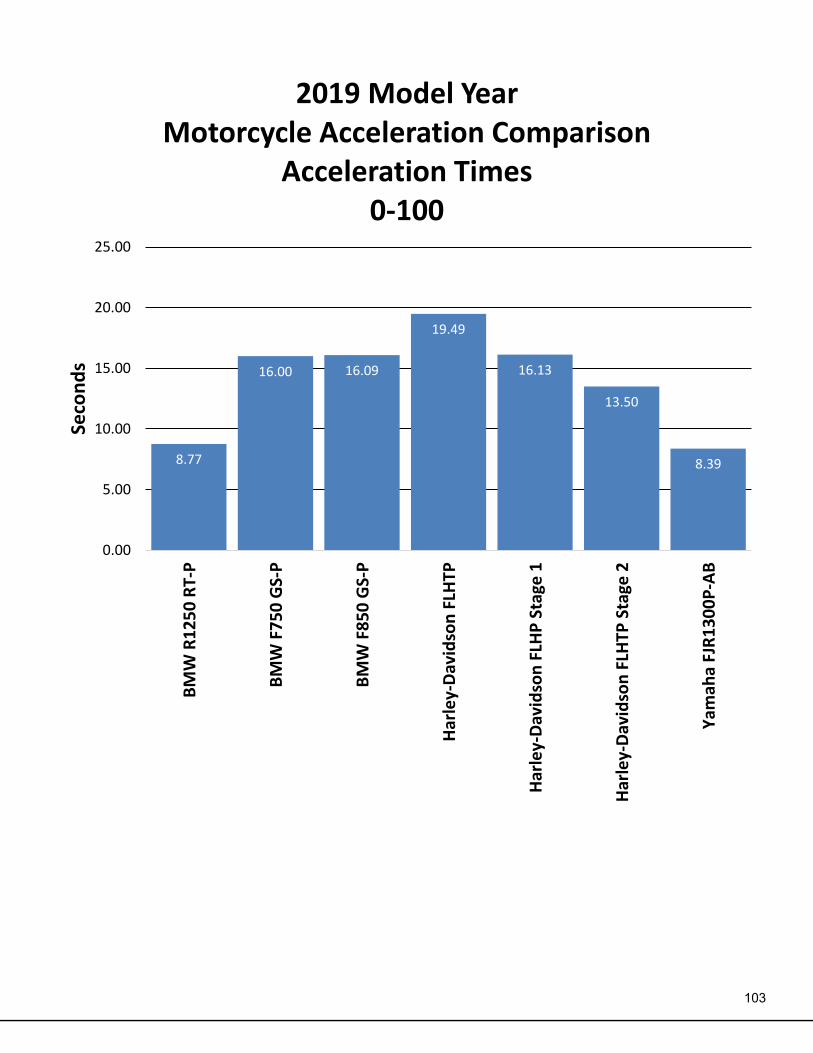
103
8.77
16.00 16.09
19.49
16.13
13.50
8.39
0.00
5.00
10.00
15.00
20.00
25.00
BM
W R
12
50
RT-
P
BM
W F
75
0 G
S-P
BM
W F
85
0 G
S-P
Har
ley-
Dav
idso
n F
LHTP
Har
ley-
Dav
idso
n F
LHP
Sta
ge 1
Har
ley-
Dav
idso
n F
LHTP
Sta
ge 2
Yam
aha
FJR
13
00
P-A
B
Seco
nd
s2019 Model Year
Motorcycle Acceleration ComparisonAcceleration Times
0-100

104
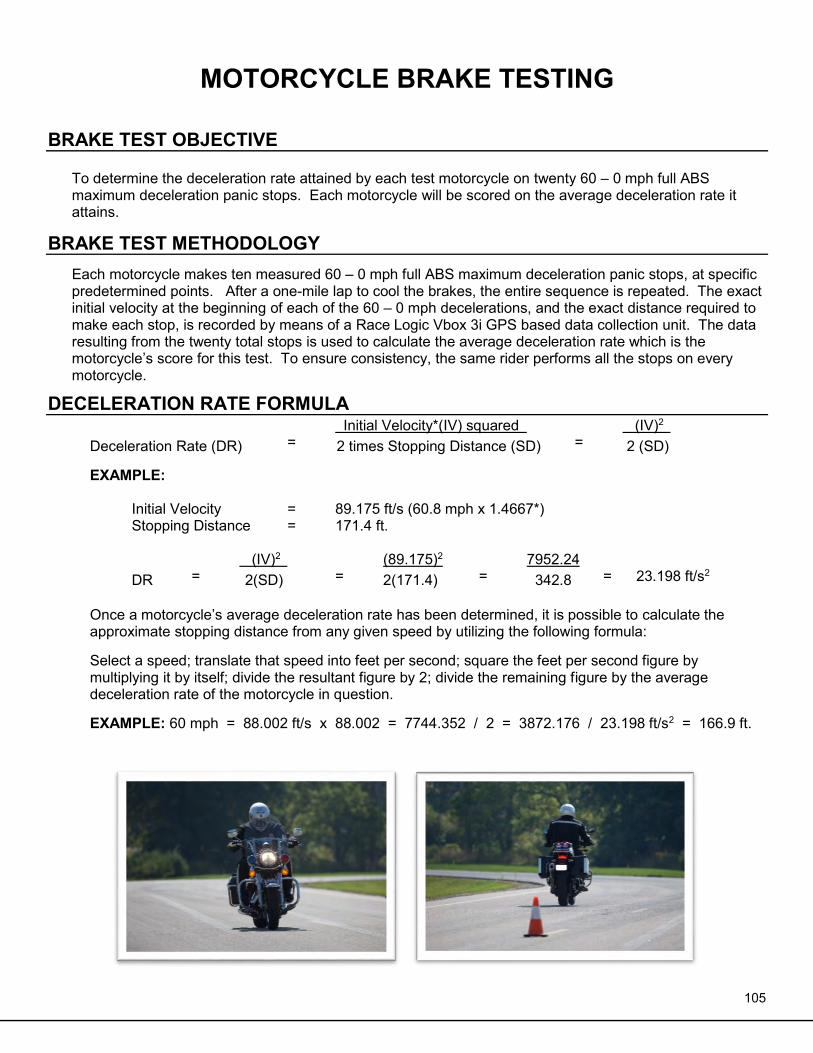
105
MOTORCYCLE BRAKE TESTING
BRAKE TEST OBJECTIVE
To determine the deceleration rate attained by each test motorcycle on twenty 60 – 0 mph full ABS maximum deceleration panic stops. Each motorcycle will be scored on the average deceleration rate it attains.
BRAKE TEST METHODOLOGY
Each motorcycle makes ten measured 60 – 0 mph full ABS maximum deceleration panic stops, at specific predetermined points. After a one-mile lap to cool the brakes, the entire sequence is repeated. The exact initial velocity at the beginning of each of the 60 – 0 mph decelerations, and the exact distance required to make each stop, is recorded by means of a Race Logic Vbox 3i GPS based data collection unit. The data resulting from the twenty total stops is used to calculate the average deceleration rate which is the motorcycle’s score for this test. To ensure consistency, the same rider performs all the stops on every motorcycle.
DECELERATION RATE FORMULA Initial Velocity*(IV) squared (IV)2
Deceleration Rate (DR) = 2 times Stopping Distance (SD) = 2 (SD) EXAMPLE:
Initial Velocity = 89.175 ft/s (60.8 mph x 1.4667*) Stopping Distance = 171.4 ft. (IV)2 (89.175)2 7952.24 DR = 2(SD) = 2(171.4) = 342.8 = 23.198 ft/s2
Once a motorcycle’s average deceleration rate has been determined, it is possible to calculate the approximate stopping distance from any given speed by utilizing the following formula:
Select a speed; translate that speed into feet per second; square the feet per second figure by multiplying it by itself; divide the resultant figure by 2; divide the remaining figure by the average deceleration rate of the motorcycle in question. EXAMPLE: 60 mph = 88.002 ft/s x 88.002 = 7744.352 / 2 = 3872.176 / 23.198 ft/s2 = 166.9 ft.
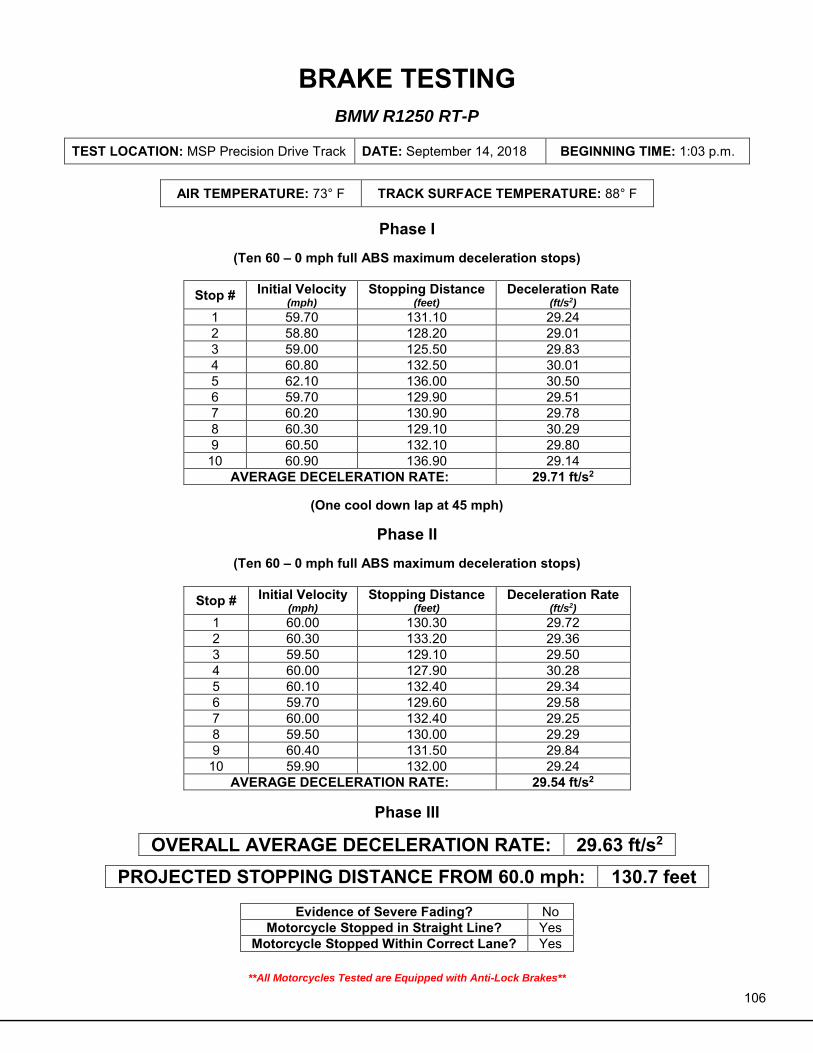
106
BRAKE TESTING
BMW R1250 RT-P
TEST LOCATION: MSP Precision Drive Track DATE: September 14, 2018 BEGINNING TIME: 1:03 p.m.
AIR TEMPERATURE: 73° F TRACK SURFACE TEMPERATURE: 88° F
Phase I
(Ten 60 – 0 mph full ABS maximum deceleration stops)
Stop # Initial Velocity (mph)
Stopping Distance (feet)
Deceleration Rate (ft/s2)
1 59.70 131.10 29.24 2 58.80 128.20 29.01 3 59.00 125.50 29.83 4 60.80 132.50 30.01 5 62.10 136.00 30.50 6 59.70 129.90 29.51 7 60.20 130.90 29.78 8 60.30 129.10 30.29 9 60.50 132.10 29.80 10 60.90 136.90 29.14
AVERAGE DECELERATION RATE: 29.71 ft/s2
(One cool down lap at 45 mph)
Phase II
(Ten 60 – 0 mph full ABS maximum deceleration stops)
Stop # Initial Velocity (mph)
Stopping Distance (feet)
Deceleration Rate (ft/s2)
1 60.00 130.30 29.72 2 60.30 133.20 29.36 3 59.50 129.10 29.50 4 60.00 127.90 30.28 5 60.10 132.40 29.34 6 59.70 129.60 29.58 7 60.00 132.40 29.25 8 59.50 130.00 29.29 9 60.40 131.50 29.84 10 59.90 132.00 29.24
AVERAGE DECELERATION RATE: 29.54 ft/s2
Phase III
OVERALL AVERAGE DECELERATION RATE: 29.63 ft/s2
PROJECTED STOPPING DISTANCE FROM 60.0 mph: 130.7 feet
Evidence of Severe Fading? No Motorcycle Stopped in Straight Line? Yes
Motorcycle Stopped Within Correct Lane? Yes
**All Motorcycles Tested are Equipped with Anti-Lock Brakes**
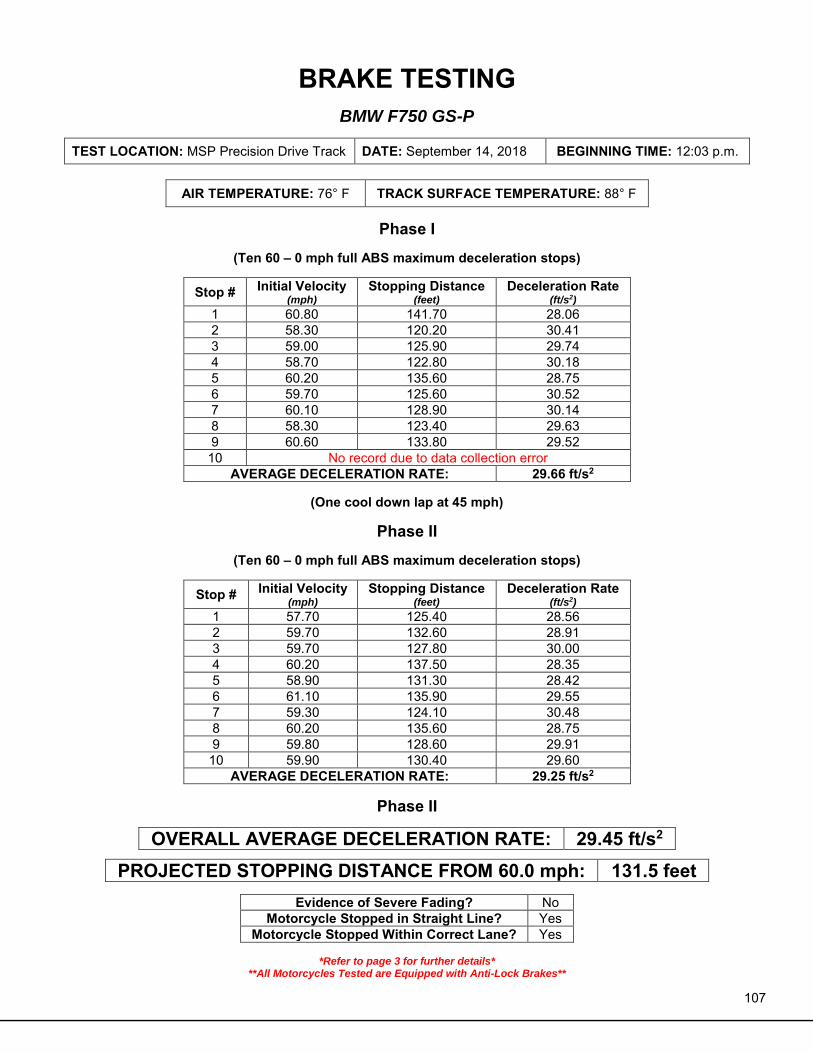
107
BRAKE TESTING
BMW F750 GS-P
TEST LOCATION: MSP Precision Drive Track DATE: September 14, 2018 BEGINNING TIME: 12:03 p.m.
AIR TEMPERATURE: 76° F TRACK SURFACE TEMPERATURE: 88° F
Phase I
(Ten 60 – 0 mph full ABS maximum deceleration stops)
Stop # Initial Velocity (mph)
Stopping Distance (feet)
Deceleration Rate (ft/s2)
1 60.80 141.70 28.06 2 58.30 120.20 30.41 3 59.00 125.90 29.74 4 58.70 122.80 30.18 5 60.20 135.60 28.75 6 59.70 125.60 30.52 7 60.10 128.90 30.14 8 58.30 123.40 29.63 9 60.60 133.80 29.52 10 No record due to data collection error
AVERAGE DECELERATION RATE: 29.66 ft/s2
(One cool down lap at 45 mph)
Phase II
(Ten 60 – 0 mph full ABS maximum deceleration stops)
Stop # Initial Velocity (mph)
Stopping Distance (feet)
Deceleration Rate (ft/s2)
1 57.70 125.40 28.56 2 59.70 132.60 28.91 3 59.70 127.80 30.00 4 60.20 137.50 28.35 5 58.90 131.30 28.42 6 61.10 135.90 29.55 7 59.30 124.10 30.48 8 60.20 135.60 28.75 9 59.80 128.60 29.91 10 59.90 130.40 29.60
AVERAGE DECELERATION RATE: 29.25 ft/s2
Phase II
OVERALL AVERAGE DECELERATION RATE: 29.45 ft/s2
PROJECTED STOPPING DISTANCE FROM 60.0 mph: 131.5 feet
Evidence of Severe Fading? No Motorcycle Stopped in Straight Line? Yes
Motorcycle Stopped Within Correct Lane? Yes
*Refer to page 3 for further details* **All Motorcycles Tested are Equipped with Anti-Lock Brakes**
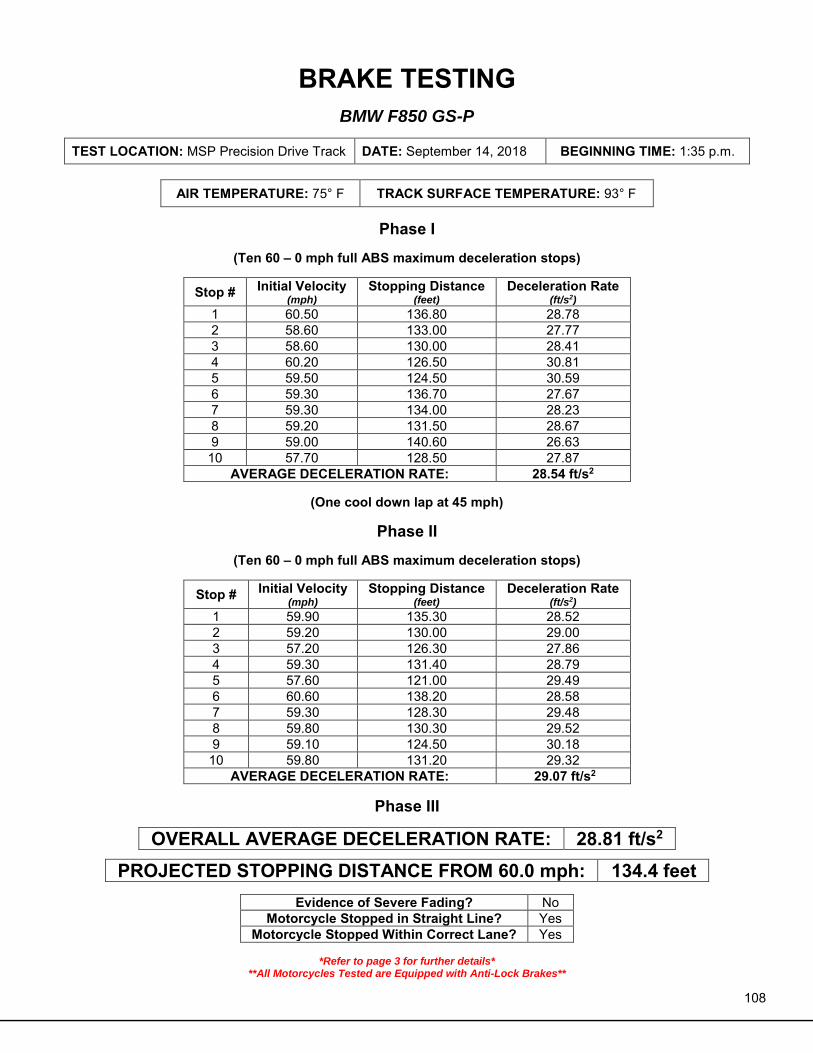
108
BRAKE TESTING
BMW F850 GS-P
TEST LOCATION: MSP Precision Drive Track DATE: September 14, 2018 BEGINNING TIME: 1:35 p.m.
AIR TEMPERATURE: 75° F TRACK SURFACE TEMPERATURE: 93° F
Phase I
(Ten 60 – 0 mph full ABS maximum deceleration stops)
Stop # Initial Velocity (mph)
Stopping Distance (feet)
Deceleration Rate (ft/s2)
1 60.50 136.80 28.78 2 58.60 133.00 27.77 3 58.60 130.00 28.41 4 60.20 126.50 30.81 5 59.50 124.50 30.59 6 59.30 136.70 27.67 7 59.30 134.00 28.23 8 59.20 131.50 28.67 9 59.00 140.60 26.63 10 57.70 128.50 27.87
AVERAGE DECELERATION RATE: 28.54 ft/s2
(One cool down lap at 45 mph)
Phase II
(Ten 60 – 0 mph full ABS maximum deceleration stops)
Stop # Initial Velocity (mph)
Stopping Distance (feet)
Deceleration Rate (ft/s2)
1 59.90 135.30 28.52 2 59.20 130.00 29.00 3 57.20 126.30 27.86 4 59.30 131.40 28.79 5 57.60 121.00 29.49 6 60.60 138.20 28.58 7 59.30 128.30 29.48 8 59.80 130.30 29.52 9 59.10 124.50 30.18 10 59.80 131.20 29.32
AVERAGE DECELERATION RATE: 29.07 ft/s2
Phase III
OVERALL AVERAGE DECELERATION RATE: 28.81 ft/s2
PROJECTED STOPPING DISTANCE FROM 60.0 mph: 134.4 feet
Evidence of Severe Fading? No Motorcycle Stopped in Straight Line? Yes
Motorcycle Stopped Within Correct Lane? Yes
*Refer to page 3 for further details* **All Motorcycles Tested are Equipped with Anti-Lock Brakes**
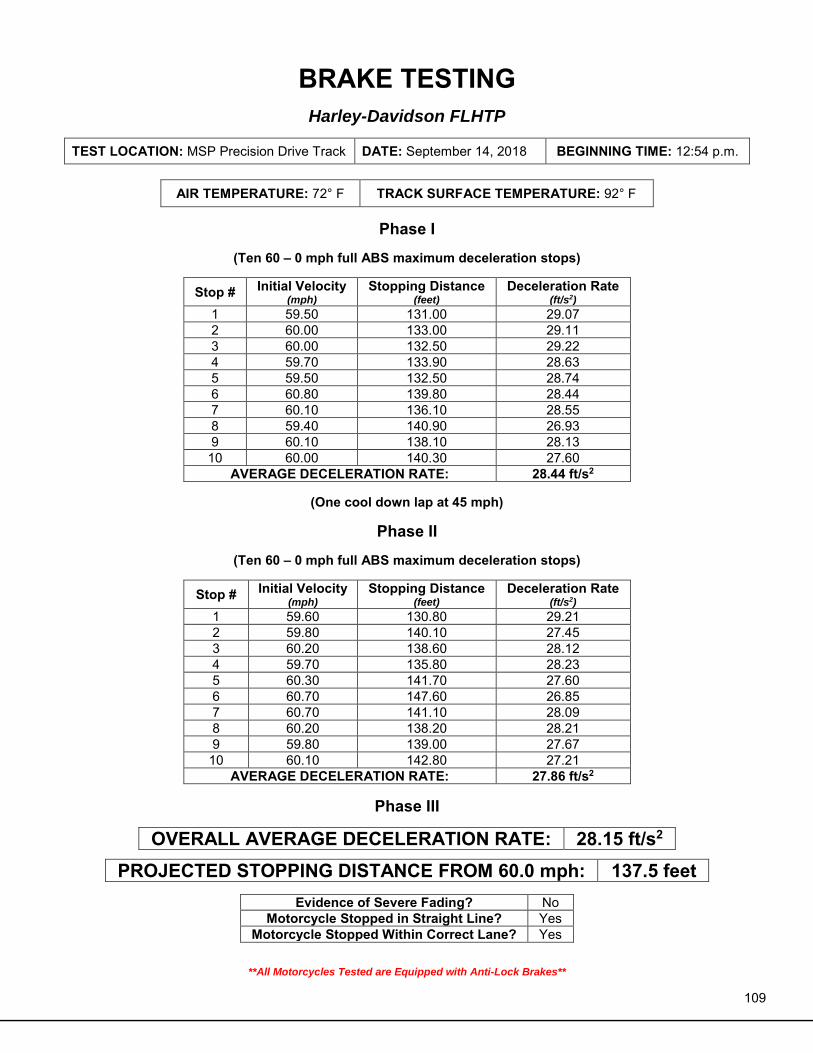
109
BRAKE TESTING
Harley-Davidson FLHTP
TEST LOCATION: MSP Precision Drive Track DATE: September 14, 2018 BEGINNING TIME: 12:54 p.m.
AIR TEMPERATURE: 72° F TRACK SURFACE TEMPERATURE: 92° F
Phase I
(Ten 60 – 0 mph full ABS maximum deceleration stops)
Stop # Initial Velocity (mph)
Stopping Distance (feet)
Deceleration Rate (ft/s2)
1 59.50 131.00 29.07 2 60.00 133.00 29.11 3 60.00 132.50 29.22 4 59.70 133.90 28.63 5 59.50 132.50 28.74 6 60.80 139.80 28.44 7 60.10 136.10 28.55 8 59.40 140.90 26.93 9 60.10 138.10 28.13 10 60.00 140.30 27.60
AVERAGE DECELERATION RATE: 28.44 ft/s2
(One cool down lap at 45 mph)
Phase II
(Ten 60 – 0 mph full ABS maximum deceleration stops)
Stop # Initial Velocity (mph)
Stopping Distance (feet)
Deceleration Rate (ft/s2)
1 59.60 130.80 29.21 2 59.80 140.10 27.45 3 60.20 138.60 28.12 4 59.70 135.80 28.23 5 60.30 141.70 27.60 6 60.70 147.60 26.85 7 60.70 141.10 28.09 8 60.20 138.20 28.21 9 59.80 139.00 27.67 10 60.10 142.80 27.21
AVERAGE DECELERATION RATE: 27.86 ft/s2
Phase III
OVERALL AVERAGE DECELERATION RATE: 28.15 ft/s2
PROJECTED STOPPING DISTANCE FROM 60.0 mph: 137.5 feet
Evidence of Severe Fading? No Motorcycle Stopped in Straight Line? Yes
Motorcycle Stopped Within Correct Lane? Yes
**All Motorcycles Tested are Equipped with Anti-Lock Brakes**
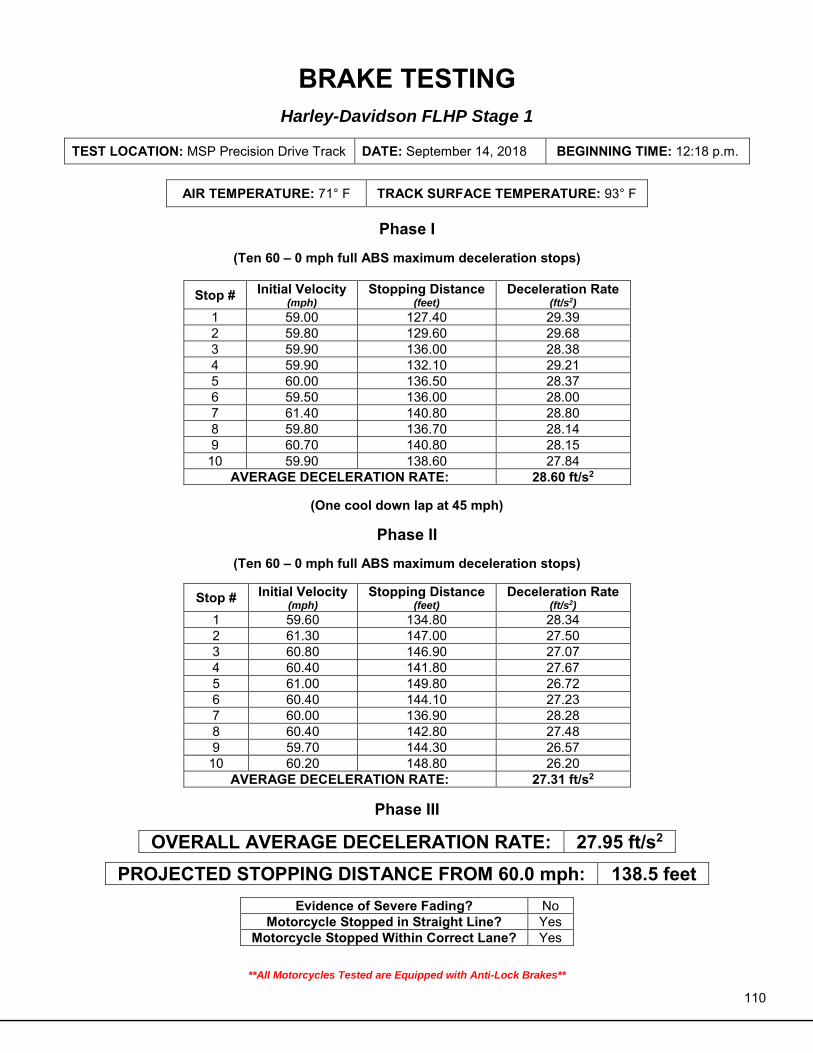
110
BRAKE TESTING
Harley-Davidson FLHP Stage 1
TEST LOCATION: MSP Precision Drive Track DATE: September 14, 2018 BEGINNING TIME: 12:18 p.m.
AIR TEMPERATURE: 71° F TRACK SURFACE TEMPERATURE: 93° F
Phase I
(Ten 60 – 0 mph full ABS maximum deceleration stops)
Stop # Initial Velocity (mph)
Stopping Distance (feet)
Deceleration Rate (ft/s2)
1 59.00 127.40 29.39 2 59.80 129.60 29.68 3 59.90 136.00 28.38 4 59.90 132.10 29.21 5 60.00 136.50 28.37 6 59.50 136.00 28.00 7 61.40 140.80 28.80 8 59.80 136.70 28.14 9 60.70 140.80 28.15 10 59.90 138.60 27.84
AVERAGE DECELERATION RATE: 28.60 ft/s2
(One cool down lap at 45 mph)
Phase II
(Ten 60 – 0 mph full ABS maximum deceleration stops)
Stop # Initial Velocity (mph)
Stopping Distance (feet)
Deceleration Rate (ft/s2)
1 59.60 134.80 28.34 2 61.30 147.00 27.50 3 60.80 146.90 27.07 4 60.40 141.80 27.67 5 61.00 149.80 26.72 6 60.40 144.10 27.23 7 60.00 136.90 28.28 8 60.40 142.80 27.48 9 59.70 144.30 26.57 10 60.20 148.80 26.20
AVERAGE DECELERATION RATE: 27.31 ft/s2
Phase III
OVERALL AVERAGE DECELERATION RATE: 27.95 ft/s2
PROJECTED STOPPING DISTANCE FROM 60.0 mph: 138.5 feet
Evidence of Severe Fading? No Motorcycle Stopped in Straight Line? Yes
Motorcycle Stopped Within Correct Lane? Yes
**All Motorcycles Tested are Equipped with Anti-Lock Brakes**
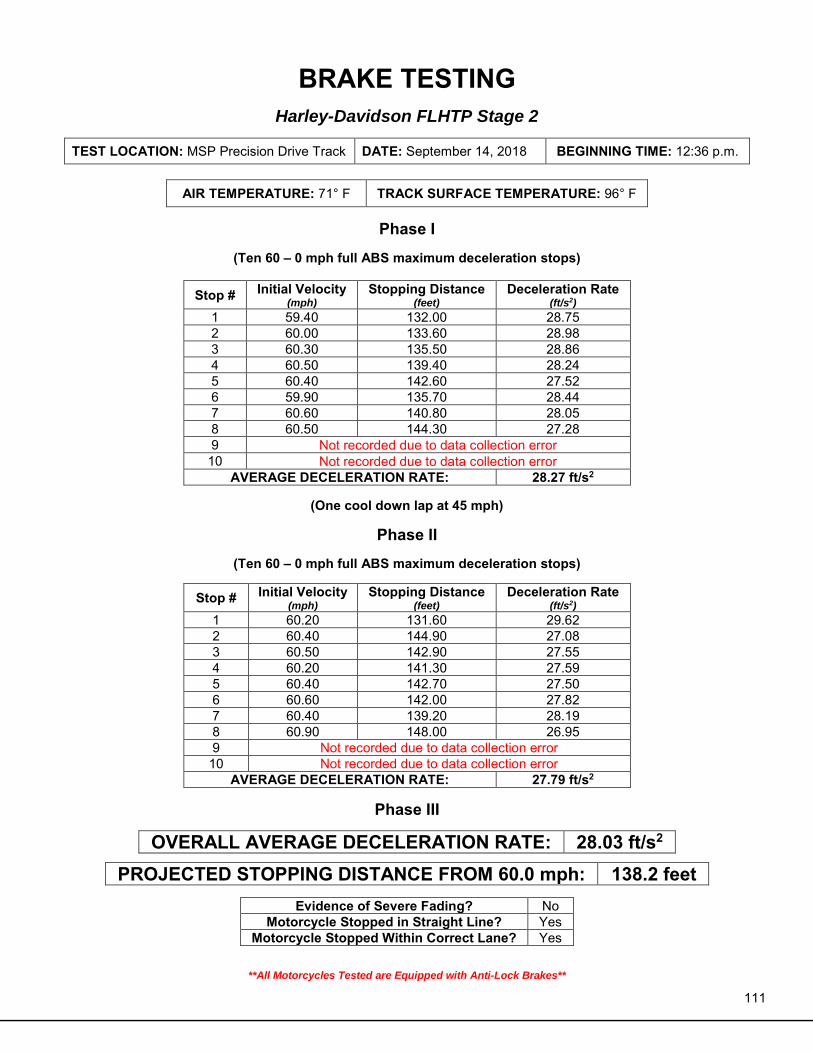
111
BRAKE TESTING
Harley-Davidson FLHTP Stage 2
TEST LOCATION: MSP Precision Drive Track DATE: September 14, 2018 BEGINNING TIME: 12:36 p.m.
AIR TEMPERATURE: 71° F TRACK SURFACE TEMPERATURE: 96° F
Phase I
(Ten 60 – 0 mph full ABS maximum deceleration stops)
Stop # Initial Velocity (mph)
Stopping Distance (feet)
Deceleration Rate (ft/s2)
1 59.40 132.00 28.75 2 60.00 133.60 28.98 3 60.30 135.50 28.86 4 60.50 139.40 28.24 5 60.40 142.60 27.52 6 59.90 135.70 28.44 7 60.60 140.80 28.05 8 60.50 144.30 27.28 9 Not recorded due to data collection error 10 Not recorded due to data collection error
AVERAGE DECELERATION RATE: 28.27 ft/s2
(One cool down lap at 45 mph)
Phase II
(Ten 60 – 0 mph full ABS maximum deceleration stops)
Stop # Initial Velocity (mph)
Stopping Distance (feet)
Deceleration Rate (ft/s2)
1 60.20 131.60 29.62 2 60.40 144.90 27.08 3 60.50 142.90 27.55 4 60.20 141.30 27.59 5 60.40 142.70 27.50 6 60.60 142.00 27.82 7 60.40 139.20 28.19 8 60.90 148.00 26.95 9 Not recorded due to data collection error 10 Not recorded due to data collection error
AVERAGE DECELERATION RATE: 27.79 ft/s2
Phase III
OVERALL AVERAGE DECELERATION RATE: 28.03 ft/s2
PROJECTED STOPPING DISTANCE FROM 60.0 mph: 138.2 feet
Evidence of Severe Fading? No Motorcycle Stopped in Straight Line? Yes
Motorcycle Stopped Within Correct Lane? Yes
**All Motorcycles Tested are Equipped with Anti-Lock Brakes**
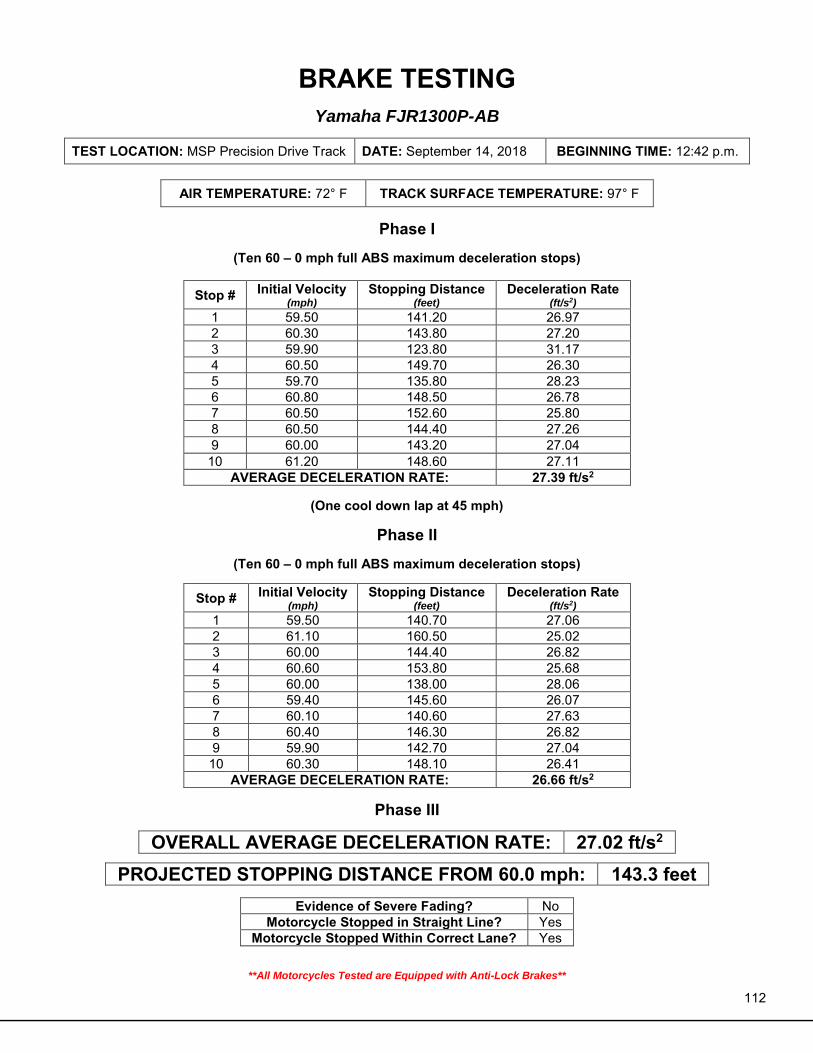
112
BRAKE TESTING
Yamaha FJR1300P-AB
TEST LOCATION: MSP Precision Drive Track DATE: September 14, 2018 BEGINNING TIME: 12:42 p.m.
AIR TEMPERATURE: 72° F TRACK SURFACE TEMPERATURE: 97° F
Phase I
(Ten 60 – 0 mph full ABS maximum deceleration stops)
Stop # Initial Velocity (mph)
Stopping Distance (feet)
Deceleration Rate (ft/s2)
1 59.50 141.20 26.97 2 60.30 143.80 27.20 3 59.90 123.80 31.17 4 60.50 149.70 26.30 5 59.70 135.80 28.23 6 60.80 148.50 26.78 7 60.50 152.60 25.80 8 60.50 144.40 27.26 9 60.00 143.20 27.04 10 61.20 148.60 27.11
AVERAGE DECELERATION RATE: 27.39 ft/s2
(One cool down lap at 45 mph)
Phase II
(Ten 60 – 0 mph full ABS maximum deceleration stops)
Stop # Initial Velocity (mph)
Stopping Distance (feet)
Deceleration Rate (ft/s2)
1 59.50 140.70 27.06 2 61.10 160.50 25.02 3 60.00 144.40 26.82 4 60.60 153.80 25.68 5 60.00 138.00 28.06 6 59.40 145.60 26.07 7 60.10 140.60 27.63 8 60.40 146.30 26.82 9 59.90 142.70 27.04 10 60.30 148.10 26.41
AVERAGE DECELERATION RATE: 26.66 ft/s2
Phase III
OVERALL AVERAGE DECELERATION RATE: 27.02 ft/s2
PROJECTED STOPPING DISTANCE FROM 60.0 mph: 143.3 feet
Evidence of Severe Fading? No Motorcycle Stopped in Straight Line? Yes
Motorcycle Stopped Within Correct Lane? Yes
**All Motorcycles Tested are Equipped with Anti-Lock Brakes**
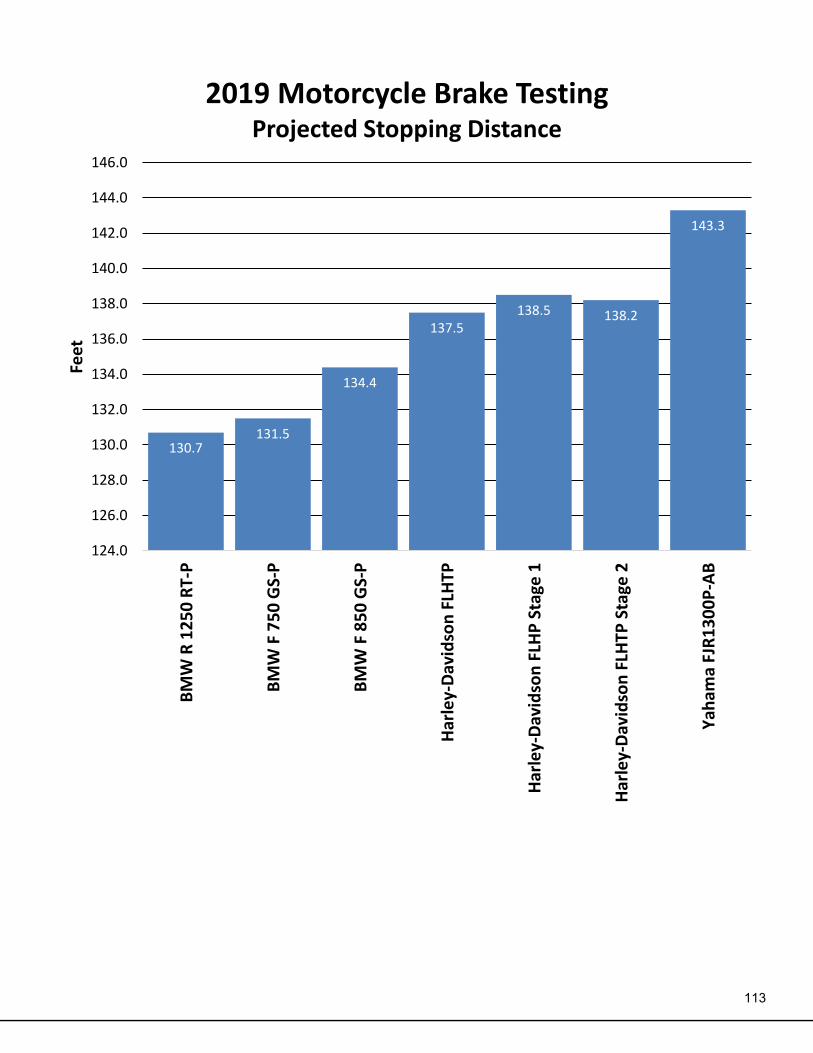
113
130.7131.5
134.4
137.5138.5 138.2
143.3
124.0
126.0
128.0
130.0
132.0
134.0
136.0
138.0
140.0
142.0
144.0
146.0
BM
W R
12
50
RT-
P
BM
W F
75
0 G
S-P
BM
W F
85
0 G
S-P
Har
ley-
Dav
idso
n F
LHTP
Har
ley-
Dav
idso
n F
LHP
Sta
ge 1
Har
ley-
Dav
idso
n F
LHTP
Sta
ge 2
Yah
ama
FJR
13
00
P-A
B
Feet
2019 Motorcycle Brake TestingProjected Stopping Distance

114
115
For Your Information About the National Institute of Justice NIJ — the research, development, and evaluation agency of the U.S. Department of Justice - is dedicated to improving knowledge and understanding of crime and justice issues through science. NIJ provides objective and independent knowledge and tools to inform the decision-making of the criminal justice community to reduce crime and advance justice, particularly at the state and local levels.
NIJ's pursuit of this mission is guided by the following principles:
• Research can make a difference in individual lives, in the safety of communities and in creating a more effective and fair justice system.
• Government-funded research must adhere to processes of fair and open competition guided by rigorous peer review.
• NIJ's research agenda must respond to the real world needs of victims, communities, and criminal justice professionals.
• NIJ must encourage and support innovative and rigorous research methods that can provide answers to basic research questions as well as practical, applied solutions to crime.
• Partnerships with other agencies and organizations, public and private, are essential to NIJ's success.
The National Institute of Justice is committed to being a transformative force in the criminal justice field by meeting five strategic challenges:
1. Fostering science-based criminal justice practice - supporting rigorous scientific research to ensure the safety of families, neighborhoods, and communities.
2. Translating knowledge to practice - disseminating rigorous scientific research to criminal justice professionals to advance what works best in preventing and reducing crime.
3. Advancing technology - building a more effective, fair and efficient criminal justice system through technology. 4. Working across disciplines - connecting the physical, forensic and social sciences to reduce crime and promote
justice. 5. Bolstering the research infrastructure - supporting young scholars, encouraging researchers from a broad
array of disciplines to apply their work to criminal justice, and increasing the availability of research findings and data.
6. Adopting a global perspective - understanding crime in its social context within the U.S. and globally.
116
About the Standards and Testing Program The NIJ Standards and Testing Program develops and publishes equipment standards that specifically address the needs of law enforcement, corrections, and other criminal justice agencies. The goal is to ensure to the degree possible that equipment is safe, reliable, and performs according to established minimum requirements. NIJ standards are voluntary standards. Manufacturers are neither required nor mandated to follow them. They are also performance standards. They do not specify a particular solution, but rather define what a potential solution must accomplish. Even though NIJ standards are not regulatory in nature, they are nevertheless influential because they articulate best practice. They obtain their influence from an agency's consideration of the legal or monetary penalties that may ensue as a consequence of a bad outcome resulting from not adopting a standard. Having a standard provides the end user with performance information on key equipment characteristics, provides a level of confidence in a product's fitness for use and allows comparison of products based on standardized testing methods and minimum performance requirements. NIJ standards are an articulation of the criminal justice practitioner's operational needs and associated performance levels with regard to particular tools and technology. They reflect the practical experiences of the community in the field articulated in such a way as to enable testing in a valid and consistently replicable manner. NIJ also supports testing programs based on the standards. For more information, please visit the NIJ website at http://www.nij.gov/topics/technology/standards-testing/Pages/welcome.aspx, or JUSTNET, the website of the Justice Technology Information Center, at https://www.justnet.org/compliant/Learn-about-testing.html. JTIC manages the Compliance Testing Program for NIJ>