Embed Size (px)
Citation preview

STATE OF FLORIDA
2001 FLEXIBLE PAVEMENT CONDITION SURVEY
FACTS & FIGURES
FL/DOT/SMO/01-447 April 2001
STATE MATERIALS OFFICE

Executive Summary ........................................................................................................ 1
Section I. Introduction ............................................................................................. 2
Observations ........................................................................................... 4
General Notes .......................................................................................... 4
Section II. Crack Rating by System and District ...................................................... 7
Section III. Rut Rating by System and District .......................................................... 18
Section IV. Ride Rating by System and District ........................................................ 30
Section V. Crack, Rut and Ride Distributions by District ........................................ 41
Section VI. Historical Information by District (1992 - 2001) .................................... 50
Section VII. Historical Information by System (1992 – 2001) .................................... 59
Section VIII. Raveling Information .............................................................................. 65
Section IX. Rating Comparison between 2001 and 2000 ........................................... 70
Table of Contents
i

Since 1985, the Pavement Condition Unit of Pavement Systems Evaluation Section has been annually collecting, processing and analyzing the information on the condition and performance of the State Roadway System. The information provided by such a Pavement Condition Survey (PCS) program has been critical to the Department’s effort to support informed highway planning, policy and decision making at State, and local levels. This includes the apportionment and allocation of funding needs as well as the determination of appropriate cost-effective strategies to rehabilitate and preserve existing highway transportation infrastructure.
The condition survey is traditionally performed on the pavement lane that has deteriorated the most in each direction, and pavement sections are determined by construction limits or uniformity of conditions. All the sections rated are rated in terms of varying levels and amounts of specific distresses, namely, (1) ride quality, (2) rutting, and (3) cracking.
The Survey data is collected, reviewed, processed, and analyzed by the Pavement Systems Evaluation Section of the State Materials Office. Each county is forwarded to the District responsible for review and any concerns are addressed prior to the data collection being finalized. Once the data collection process is complete, the Central Pavement Management Office is responsible for processing, analysis and making the data available for use by the Department, consultants and others. Thereafter, the Central Program Development Office becomes responsible for reporting the condition of the State Highway System for Pavement Management purposes.
The present report provides essential information on the current condition of the Florida roadway system collected as part of the PCS program. It also includes a summary of the historical condition rating data.
Executive Summary
1

The Pavement Systems Evaluation Section of the State Materials Office is responsible for the Department’s Annual Pavement Condition Survey. The Survey is conducted on the totality of the State-maintained Highway System.
The Survey is completed each year by a highly trained and experienced engineering staff, and requires each of the four teams about 25 weeks of travel each year to complete. Since the inception of the PCS program, there has been over 20 percent increase of lane miles surveyed (refer to Chart on page 5) while the number of the Pavement Condition Survey staff has decreased. Presently, over 17 million data points are collected, processed, and analyzed every year by the PCS team. These data provide the Department with a means to:
� Determine the present condition of the State Roadway System;
� Compare the present with past conditions;
� Predict deterioration rates;
� Predict rehabilitation funding needs;
� Provide justification for annual rehabilitation budget;
� Provide justification for project rehabilitation; and
� Provide justification for distribution of rehabilitation funds to Districts.
The condition survey is conducted in terms of varying levels and amounts of specific distresses, namely, (1) ride quality, (2) rutting, and (3) cracking. For each distress type, the pavement sections are rated on a zero to ten scale, where a rating of ten indicates a section in excellent condition. Currently, any section with a rating of six or less would become eligible for rehabilitation.
Cracking is a subjective survey conducted visually either from the roadway or from the shoulder. Rut and Ride are measured using an automated vehicle-mounted instrument called a Profiler that measures the longitudinal profile of the roadway. The ride quality is quantified in terms of Ride Number (RN). Ride Number is a mathematical processing of longitudinal profile measurements to produce an estimate of ride quality or user perception in accordance with ASTM Standard E1489.
SECTION I
Introduction
2

In order to ensure a maximum accuracy and repeatability of the data collected, the testing equipment has to be well maintained and routinely calibrated. In addition, over 150 edit checks are currently implemented to test both the data accuracy and compliance with other parameters of the Pavement Management System. Comparisons of annual survey data to that of earlier years to review trends and identify potential errors are also performed. Furthermore, team members (raters) annually complete a comparative distress rating evaluation on selected pavement sections to enhance uniformity of the subjective crack rating. When necessary, and as appropriate, efforts have been made to upgrade the survey equipment and to improve the data analysis software resulting in increased speed of data collection and substantially improved accuracy of the survey results. These types of improvements now allow in-depth analysis on any segment of the highway system and completing the PCS on time and on target while maintaining a high level of accuracy in the survey results. For more detailed information about the Pavement Condition Surveys, please refer to the latest edition of the Rigid and Flexible Pavement Condition Survey Handbooks. Since the mileage of flexible pavements represents approximately 97% of the entire System, the facts and figures contained in this report are for flexible pavements only unless otherwise noted.
3

Observations • Crack ratings have remained stable for the past ten years with a mean rating of
approximately 8 (8.02 to 8.21 to be exact).
• Rut rating values for the State-maintained Highway System have improved from an average rating of 8 (or 8.35) in 1992 to 9 (or 8.93) in 2001.
• Ride rating values for the State-maintained Highway System have remained constant with a mean rating of approximately 8.
• 92.7% of this year’s Crack ratings were within one point as compared to the previous year’s. (*)
• 99.6% of this year’s Rut ratings were within one point as compared to the previous year’s. (*)
• 99.7% of this year’s Ride ratings were within one point as compared to the previous year’s. (*)
• Beginning with the 1999 survey, Laser sensors were implemented along with the use of Ride Number as a method of calculating Ride Ratings. This may explain the increase in serviceability observed thereafter.
��Note: Sections that had known changes (under construction, rehabilitated, etc.) were excluded.
General Notes • For multi-lane roadways: The worst lane in each direction is tested (normally the
outermost traffic lane).
• For two lane roadways: The worst lane is tested (normally the same lane tested the previous year).
• Rated sections are determined by construction limits or significant changes in visual appearance (condition) of the pavement.
• Ride rating and Rut rating data are collected with four road profilers.
• Crack rating is subjective and collected visually (performed from windshield or roadway shoulder).
• Cracking is rated by severity levels and quantities for both the wheel path area and the area outside of the wheel path.
4

Production History Lane Miles
Flexible and Rigid Pavements Combined
5
35,0
90
35,3
99 35,9
28
36,7
45
36,9
25 37,4
23
37,7
25
38,0
25
38,1
30 38,7
13
38,9
11
40,1
60
33,2
15
40,0
12
39,4
92
39,1
65
32,000
33,000
34,000
35,000
36,000
37,000
38,000
39,000
40,000
41,000
42,000
1986 1987 1988 1989 1990 1991 1992 1993 1994 1995 1996 1997 1998 1999 2000 2001
Year
Lane
Mile
s
Production History Rated Sections
Flexible and Rigid Pavements Combined
6
6,59
4
6,74
8
6,87
5
6,97
8
6,85
3 7,11
8 7,32
3
7,41
3
7,42
5
7,54
6 7,75
8 8,08
1
5,81
2
8,07
7
7,97
4
7,85
4
5,000
5,500
6,000
6,500
7,000
7,500
8,000
8,500
9,000
1986 1987 1988 1989 1990 1991 1992 1993 1994 1995 1996 1997 1998 1999 2000 2001
Year
Rat
ed S
ectio
ns
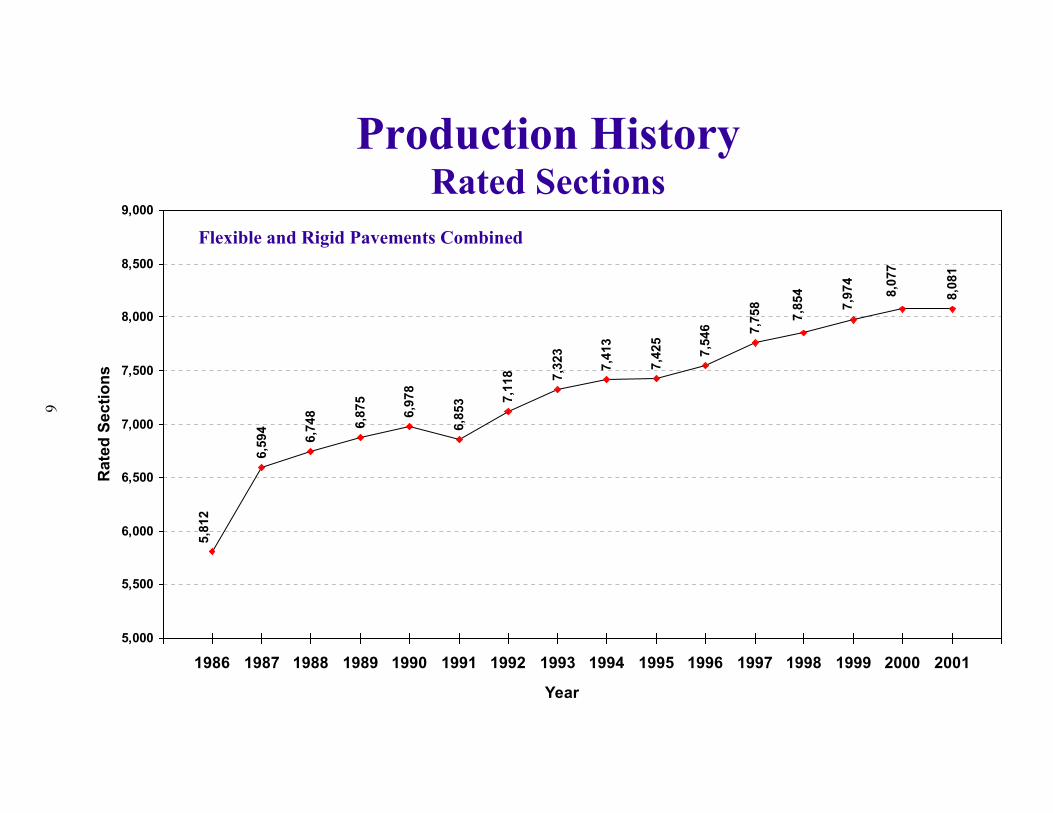
SECTION II
CRACK RATING
BY
SYSTEM AND DISTRICT
7

• Cracking is estimated as percentages of areas within the wheel paths (CW) and outside of the wheel paths (CO). These percentages are estimated separately for each of the two areas.
• Three types of cracking are rated depending upon severity levels (1B, II and III).
• Only the predominate type of cracking is used to determine the numerical deduct value that is subtracted from ten to establish the crack rating. However, the percentages of all types of cracking are used to calculate the percentage of pavement cracked.
• Cracking deficiency is rated on a zero to ten scale, where the rating of ten is best. Currently, a rating of six or less makes pavement segments eligible for rehabilitation.
• The Crack Rating is subtracted from a perfect score of ten.
SECTION II
Crack Rating by System and District
Crack Rating Criteria
Crack Rating = 10 – (CW + CO)
Where: CW and CO are numerical factors for Cracking within thewheel paths (CW) and outside of the wheel paths (CO).These factors are based on the severity and extent of thetype of cracking.
8

No
Tol
l Sys
tem
No
Tur
npik
e Sy
stem
N
o T
oll S
yste
m
No
Tur
npik
e Sy
stem
No
Tol
l Sys
tem
Crack Ratings by System and District 2001 Flexible Pavement Condition Survey
9
7.92 8.03
9.24
7.97
7.62
9.06
7.92 8.
258.
84
8.01 8.29
7.82 8.
06 8.25
7.92
7.78
8.70
8.40
8.14
8.02
8.62
9.79
9.05
8.80
8.69
8.57
8.19
9.82
7.69
8.52
8.00
8.55
8.54
8.15
8.11
0.001.002.003.004.00
5.006.007.008.00
9.0010.00
Ave
rage
Cra
ck R
atin
g
District 1 District 2 District 3 District 4 District 5 District 6 District 7 AllDistricts
Roadway System / Based on Lane MilesPrimary Interstate Turnpike Toll All Systems

0.71 1.44
0.81
0.86 6.
08
4.78 5.92 11
.05
10.2
4
12.7
6
45.3
5
0102030405060708090
100
0 1 2 3 4 5 6 7 8 9 10Crack Rating
Perc
ent (
%) o
f Lan
e M
iles
PRIMARY (28,983 lane miles)
2001 Crack Distribution by System Statewide
10
0.17
0.00
0.63
0.15 1.56 3.65
3.23 12
.61
13.1
8
12.9
6
51.8
6
0102030405060708090
100
0 1 2 3 4 5 6 7 8 9 10Crack Rating
Perc
ent (
%) o
f Lan
e M
iles
INTERSTATE (5,685 lane miles)
0.00
0.00
0.00
0.00 0.95
1.09 5.
31 13.1
9 21.7
3
12.2
8
45.4
5
0102030405060708090
100
0 1 2 3 4 5 6 7 8 9 10Crack Rating
Perc
ent (
%) o
f Lan
e M
iles
TURNPIKE (1,602 lane miles)
0.00
0.00
0.00
0.00 2.96 7.
85
6.72 8.37
25.5
6
6.74
41.8
0
0102030405060708090
100
0 1 2 3 4 5 6 7 8 9 10Crack Rating
Perc
ent (
%) o
f Lan
e M
iles
TOLL (581 lane miles)

0.11 1.54
0.81
0.96 6.
05 7.78
4.54 13
.37
9.18
9.56
46.1
0
0102030405060708090
100
0 1 2 3 4 5 6 7 8 9 10Crack Rating
Perc
ent (
%) o
f Lan
e M
iles
PRIMARY (4,436 lane miles)
2001 Crack Distribution by System District 1
11
0.00
0.00
0.00 0.94
0.00 5.
24 10.6
1 18.7
7
12.8
6
15.4
5
36.1
3
0102030405060708090
100
0 1 2 3 4 5 6 7 8 9 10Crack Rating
Perc
ent (
%) o
f Lan
e M
iles
INTERSTATE (915 lane miles)
0.00
0.00
0.00
0.00
0.00
0.00 8.
62
8.62
7.62
0.00
75.1
3
0102030405060708090
100
0 1 2 3 4 5 6 7 8 9 10Crack Rating
Perc
ent (
%) o
f Lan
e M
iles
TURNPIKE (115 lane miles)
0102030405060708090
100
0 1 2 3 4 5 6 7 8 9 10Crack Rating
Perc
ent (
%) o
f Lan
e M
iles
TOLL (0 lane miles)
No Toll System in District 1
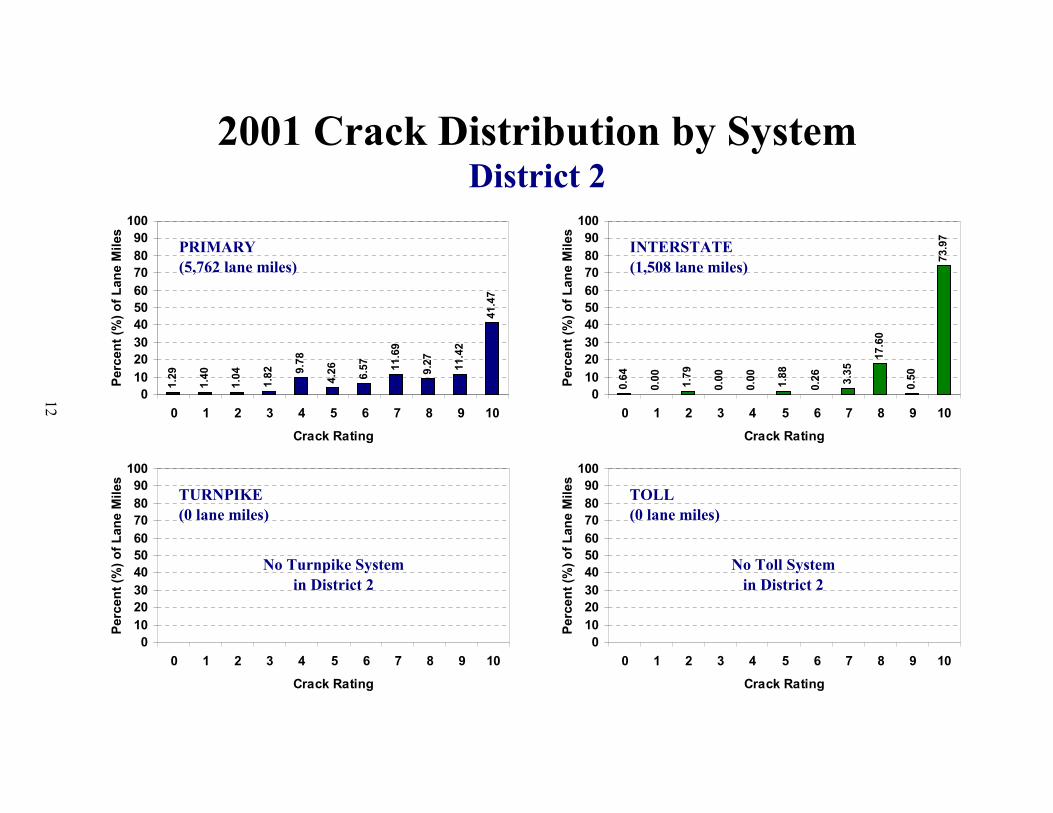
1.29
1.40
1.04
1.82 9.
78
4.26 6.57 11
.69
9.27 11
.42
41.4
7
0102030405060708090
100
0 1 2 3 4 5 6 7 8 9 10Crack Rating
Perc
ent (
%) o
f Lan
e M
iles
PRIMARY (5,762 lane miles)
2001 Crack Distribution by System District 2
12
0.64
0.00 1.79
0.00
0.00 1.88
0.26 3.35
17.6
0
0.50
73.9
7
0102030405060708090
100
0 1 2 3 4 5 6 7 8 9 10Crack Rating
Perc
ent (
%) o
f Lan
e M
iles
INTERSTATE (1,508 lane miles)
0102030405060708090
100
0 1 2 3 4 5 6 7 8 9 10Crack Rating
Perc
ent (
%) o
f Lan
e M
iles
TOLL (0 lane miles)
No Toll System in District 2
0102030405060708090
100
0 1 2 3 4 5 6 7 8 9 10Crack Rating
Perc
ent (
%) o
f Lan
e M
iles
TURNPIKE (0 lane miles)
No Turnpike System in District 2

0.52
0.73
0.84
0.73 3.74 5.19 10
.13
7.08 7.93 10
.81
52.3
0
0102030405060708090
100
0 1 2 3 4 5 6 7 8 9 10Crack Rating
Perc
ent (
%) o
f Lan
e M
iles
PRIMARY (5,184 lane miles)
2001 Crack Distribution by System District 3
13
0.00
0.00
0.00
0.00
0.00
0.00
0.11
12.4
4
11.7
7 26.9
4
48.7
4
0102030405060708090
100
0 1 2 3 4 5 6 7 8 9 10Crack Rating
Perc
ent (
%) o
f Lan
e M
iles
INTERSTATE (378 lane miles)
0.00
0.00
0.00
0.00
0.00
0.00
0.00
66.2
7
0.00
0.00
33.7
3
0102030405060708090
100
0 1 2 3 4 5 6 7 8 9 10Crack Rating
Perc
ent (
%) o
f Lan
e M
iles
TOLL (6 lane miles)
0102030405060708090
100
0 1 2 3 4 5 6 7 8 9 10Crack Rating
Perc
ent (
%) o
f Lan
e M
iles
TURNPIKE (0 lane miles)
No Turnpike System in District 3

0.71 1.89
1.06
0.52 4.
54
4.97 6.92 12
.29
14.0
3
19.6
7 33.4
1
0102030405060708090
100
0 1 2 3 4 5 6 7 8 9 10Crack Rating
Perc
ent (
%) o
f Lan
e M
iles
PRIMARY (3,800 lane miles)
2001 Crack Distribution by System District 4
14
0.00
0.00
0.00
0.00 4.
15 7.25
0.09
16.4
8
16.7
7
20.6
6 34.6
0
0102030405060708090
100
0 1 2 3 4 5 6 7 8 9 10Crack Rating
Perc
ent (
%) o
f Lan
e M
iles
INTERSTATE (1,150 lane miles)
0102030405060708090
100
0 1 2 3 4 5 6 7 8 9 10Crack Rating
Perc
ent (
%) o
f Lan
e M
iles
TOLL (0 lane miles)
No Toll System in District 4
0.00
0.00
0.00
0.00
0.00 2.33 5.89 12
.99 28
.23
17.3
3 33.2
3
0102030405060708090
100
0 1 2 3 4 5 6 7 8 9 10Crack Rating
Perc
ent (
%) o
f Lan
e M
iles
TURNPIKE (662 lane miles)
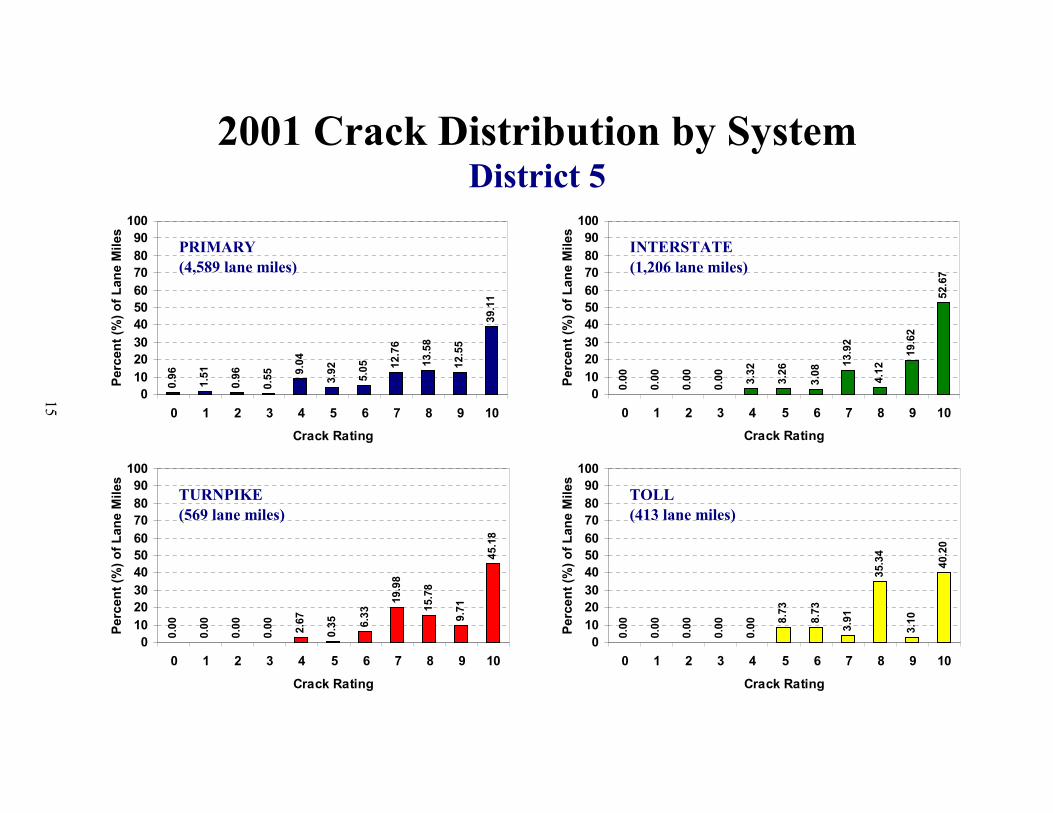
0.96
1.51
0.96
0.55 9.
04
3.92 5.05 12
.76
13.5
8
12.5
5
39.1
1
0102030405060708090
100
0 1 2 3 4 5 6 7 8 9 10Crack Rating
Perc
ent (
%) o
f Lan
e M
iles
PRIMARY (4,589 lane miles)
2001 Crack Distribution by System District 5
15
0.00
0.00
0.00
0.00 3.32
3.26
3.08
13.9
2
4.12
19.6
2
52.6
7
0102030405060708090
100
0 1 2 3 4 5 6 7 8 9 10Crack Rating
Perc
ent (
%) o
f Lan
e M
iles
INTERSTATE (1,206 lane miles)
0.00
0.00
0.00
0.00
0.00 8.
73
8.73
3.91
35.3
4
3.10
40.2
0
0102030405060708090
100
0 1 2 3 4 5 6 7 8 9 10Crack Rating
Perc
ent (
%) o
f Lan
e M
iles
TOLL (413 lane miles)
0.00
0.00
0.00
0.00 2.67
0.35 6.
33
19.9
8
15.7
8
9.71
45.1
8
0102030405060708090
100
0 1 2 3 4 5 6 7 8 9 10Crack Rating
Perc
ent (
%) o
f Lan
e M
iles
TURNPIKE (569 lane miles)

0.00 1.39
0.15
0.05 1.73 3.28
3.67 9.
25 10.3
1 19.8
3
50.3
5
0102030405060708090
100
0 1 2 3 4 5 6 7 8 9 10Crack Rating
Perc
ent (
%) o
f Lan
e M
iles
PRIMARY (2,247 lane miles)
2001 Crack Distribution by System District 6
16
0.00
0.00
0.00
0.00
0.00
0.00
0.00
0.00 1.12 7.
56 9
1.32
0102030405060708090
100
0 1 2 3 4 5 6 7 8 9 10Crack Rating
Perc
ent (
%) o
f Lan
e M
iles
INTERSTATE (93 lane miles)
0.00
0.00
0.00
0.00 4.
63
4.63
4.21
4.21
3.91
26.4
6
51.9
4
0102030405060708090
100
0 1 2 3 4 5 6 7 8 9 10Crack Rating
Perc
ent (
%) o
f Lan
e M
iles
TOLL (72 lane miles)
0.00
0.00
0.00
0.00
0.00
0.00
0.00
0.80
33.8
5
7.66
57.6
9
0102030405060708090
100
0 1 2 3 4 5 6 7 8 9 10Crack Rating
Perc
ent (
%) o
f Lan
e M
iles
TURNPIKE (185 lane miles)

0.91
1.94
0.31
0.64 3.71
2.80
1.12 10
.36
7.73 9.71
60.7
7
0102030405060708090
100
0 1 2 3 4 5 6 7 8 9 10Crack Rating
Perc
ent (
%) o
f Lan
e M
iles
PRIMARY (2,965 lane miles)
2001 Crack Distribution by System District 7
17
0.00
0.00 2.01
0.00
0.17 2.01 10
.17 20
.76
17.8
9
1.10
45.8
9
0102030405060708090
100
0 1 2 3 4 5 6 7 8 9 10Crack Rating
Perc
ent (
%) o
f Lan
e M
iles
INTERSTATE (435 lane miles)
0.00
0.00
0.00
0.00
15.2
8
6.92
0.00
28.3
0
0.00 7.
98
41.5
2
0102030405060708090
100
0 1 2 3 4 5 6 7 8 9 10Crack Rating
Perc
ent (
%) o
f Lan
e M
iles
TOLL (90 lane miles)
0.00
0.00
0.00
0.00
0.00
0.00
0.00
0.00
0.00
17.9
1
82.0
9
0102030405060708090
100
0 1 2 3 4 5 6 7 8 9 10Crack Rating
Perc
ent (
%) o
f Lan
e M
iles
TURNPIKE (70 lane miles)

SECTION III
RUT RATING
BY
SYSTEM AND DISTRICT
18

• A Rut is a continuous longitudinal depression deviating from a surface plane defined by transverse cross slope and longitudinal profile. This depression normally occurs in the wheel path.
• A Rut Depth is defined herein as the difference in elevations between the center of the wheel path and the center of the travel lane.
• Rut Depth is measured simultaneously with the Ride values using a profiler. See illustration on next page.
• The profiler measures Rut Depth approximately 30 times per inch when traveling at 60 mph. The measurements are then stored on one-foot intervals for the survey.
• The average Rut Depth for both wheel paths is recorded and then converted to a one point deduct for every eighth (1/8) of an inch of average Rut Depth.
• Rut Depth is rated on a zero to ten scale, where ten is best. A ten would indicate no rutting while a six would indicate half (1/2) of an inch of rutting. Currently pavement sections with ratings of six or less are eligible for rehabilitation.
• Rut Depth for each measurement is calculated using the following equation:
SECTION III
Rut Rating by System and District
Rut Rating Criteria
(h1 - h2) + (h3 - h2) 2 Rut Depth =
Where: h1, h2, and h3, are the respective distances betweenthe sensor locations and the roadway surface directlybelow each sensor. See diagram on next page.
19

The Profiler has three sensors (to measure ride and rut), combined with two accelerometers and a data acquisition system (computer) that monitors the pavement’s longitudinal and transverse profiles while in motion.
(h1 - h2) + (h3 - h2) 2 Rut Depth =
20

No
Tol
l Sys
tem
No
Tur
npik
e Sy
stem
N
o T
oll S
yste
m
No
Tur
npik
e Sy
stem
No
Tol
l Sys
tem
Rut Ratings by System and District 2001 Flexible Pavement Condition Survey
21
8.81 9.
109.
67
8.87
8.91 9.02
8.94
8.71
8.39
7.34
8.69 9.
038.
979.
30
9.05
8.96 9.12
9.09
9.33
9.02
9.00 9.
038.
989.
069.
00
8.94 9.02
10.0
09.
078.
97
8.89 9.00 9.
259.
238.
93
0.001.002.003.004.00
5.006.007.008.00
9.0010.00
Ave
rage
Rut
Rat
ing
District 1 District 2 District 3 District 4 District 5 District 6 District 7 AllDistricts
Roadway System / Based on Lane MilesPrimary Interstate Turnpike Toll All Systems

0.00
0.00
0.00
0.01
0.03
0.39
1.41 6.
29
18.3
8
47.2
4
26.2
6
0102030405060708090
100
0 1 2 3 4 5 6 7 8 9 10Rut Rating
Perc
ent (
%) o
f Lan
e M
iles
PRIMARY (28,983 lane miles)
2001 Rut Distribution by System Statewide
22
0.00
0.00
0.00
0.00
0.00
0.00
0.69 2.22
13.9
6
62.3
7
20.7
6
0102030405060708090
100
0 1 2 3 4 5 6 7 8 9 10Rut Rating
Perc
ent (
%) o
f Lan
e M
iles
INTERSTATE (5,685 lane miles)
0.00
0.00
0.00
0.00
0.00
0.00
0.00 0.90 8.
49
55.6
0
35.0
1
0102030405060708090
100
0 1 2 3 4 5 6 7 8 9 10Rut Rating
Perc
ent (
%) o
f Lan
e M
iles
TURNPIKE (1,602 lane miles)
0.00
0.00
0.00
0.00
0.00
0.00
0.00 2.34 5.66
58.2
9
33.7
1
0102030405060708090
100
0 1 2 3 4 5 6 7 8 9 10Rut Rating
Perc
ent (
%) o
f Lan
e M
iles
TOLL (581 lane miles)

0.00
0.00
0.00
0.00
0.00
0.55 2.76 5.93
23.2
6
41.1
3
26.3
7
0102030405060708090
100
0 1 2 3 4 5 6 7 8 9 10Rut Rating
Perc
ent (
%) o
f Lan
e M
iles
PRIMARY (4,436 lane miles)
2001 Rut Distribution by System District 1
23
0.00
0.00
0.00
0.00
0.00
0.00
0.00
0.00 3.08
13.1
2
83.8
0
0102030405060708090
100
0 1 2 3 4 5 6 7 8 9 10Rut Rating
Perc
ent (
%) o
f Lan
e M
iles
INTERSTATE (915 lane miles)
0.00
0.00
0.00
0.00
0.00
0.00
0.00
0.00 8.
62 16.2
5
75.1
3
0102030405060708090
100
0 1 2 3 4 5 6 7 8 9 10Rut Rating
Perc
ent (
%) o
f Lan
e M
iles
TURNPIKE (115 lane miles)
0102030405060708090
100
0 1 2 3 4 5 6 7 8 9 10Rut Rating
Perc
ent (
%) o
f Lan
e M
iles
TOLL (0 lane miles)
No Toll System in District 1

0.00
0.00
0.00
0.00
0.00
0.34
0.80 6.
14
18.2
5
48.7
7
25.7
0
0102030405060708090
100
0 1 2 3 4 5 6 7 8 9 10Rut Rating
Perc
ent (
%) o
f Lan
e M
iles
PRIMARY (5,762 lane miles)
2001 Rut Distribution by System District 2
24
0.00
0.00
0.00
0.00
0.00
0.00
0.00 4.
96
15.5
7
51.4
9
27.9
8
0102030405060708090
100
0 1 2 3 4 5 6 7 8 9 10Rut Rating
Perc
ent (
%) o
f Lan
e M
iles
INTERSTATE (1,508 lane miles)
0102030405060708090
100
0 1 2 3 4 5 6 7 8 9 10Rut Rating
Perc
ent (
%) o
f Lan
e M
iles
TOLL (0 lane miles)
No Toll System in District 2
0102030405060708090
100
0 1 2 3 4 5 6 7 8 9 10Rut Rating
Perc
ent (
%) o
f Lan
e M
iles
TURNPIKE (0 lane miles)
No Turnpike System in District 2

0.00
0.00
0.00
0.04
0.14
0.80 2.88 11
.12 18.8
2
41.1
9
25.0
2
0102030405060708090
100
0 1 2 3 4 5 6 7 8 9 10Rut Rating
Perc
ent (
%) o
f Lan
e M
iles
PRIMARY (5,184 lane miles)
2001 Rut Distribution by System District 3
25
0.00
0.00
0.00
0.00
0.00
0.00 9.
23 12.0
1 22.4
3
42.8
7
13.4
6
0102030405060708090
100
0 1 2 3 4 5 6 7 8 9 10Rut Rating
Perc
ent (
%) o
f Lan
e M
iles
INTERSTATE (378 lane miles)
0.00
0.00
0.00
0.00
0.00
0.00
0.00
66.2
7
33.7
3
0.00
0.00
0102030405060708090
100
0 1 2 3 4 5 6 7 8 9 10Rut Rating
Perc
ent (
%) o
f Lan
e M
iles
TOLL (6 lane miles)
0102030405060708090
100
0 1 2 3 4 5 6 7 8 9 10Rut Rating
Perc
ent (
%) o
f Lan
e M
iles
TURNPIKE (0 lane miles)
No Turnpike System in District 3

0.00
0.00
0.00
0.00
0.04
0.24
0.29 2.54
13.5
6
59.5
6
23.7
7
0102030405060708090
100
0 1 2 3 4 5 6 7 8 9 10Rut Rating
Perc
ent (
%) o
f Lan
e M
iles
PRIMARY (3,800 lane miles)
2001 Rut Distribution by System District 4
26
0.00
0.00
0.00
0.00
0.00
0.00
0.37
0.00
21.5
5
58.8
6
19.2
2
0102030405060708090
100
0 1 2 3 4 5 6 7 8 9 10Rut Rating
Perc
ent (
%) o
f Lan
e M
iles
INTERSTATE (1,150 lane miles)
0.00
0.00
0.00
0.00
0.00
0.00
0.00
0.00 6.
45
56.7
9
36.7
6
0102030405060708090
100
0 1 2 3 4 5 6 7 8 9 10Rut Rating
Perc
ent (
%) o
f Lan
e M
iles
TURNPIKE (662 lane miles)
0102030405060708090
100
0 1 2 3 4 5 6 7 8 9 10Rut Rating
Perc
ent (
%) o
f Lan
e M
iles
TOLL (0 lane miles)
No Toll System in District 4

0.00
0.00
0.00
0.00
0.00
0.00
0.67 4.
82
21.6
6
43.4
3
29.4
2
0102030405060708090
100
0 1 2 3 4 5 6 7 8 9 10Rut Rating
Perc
ent (
%) o
f Lan
e M
iles
PRIMARY (4,589 lane miles)
2001 Rut Distribution by System District 5
27
0.00
0.00
0.00
0.00
0.00
0.00
0.00
0.51
11.2
9
63.8
0
24.4
0
0102030405060708090
100
0 1 2 3 4 5 6 7 8 9 10Rut Rating
Perc
ent (
%) o
f Lan
e M
iles
INTERSTATE (1,206 lane miles)
0.00
0.00
0.00
0.00
0.00
0.00
0.00 2.53
11.8
4
59.7
4
25.8
9
0102030405060708090
100
0 1 2 3 4 5 6 7 8 9 10Rut Rating
Perc
ent (
%) o
f Lan
e M
iles
TURNPIKE (569 lane miles)
0.00
0.00
0.00
0.00
0.00
0.00
0.00
0.00 2.08
63.0
2
34.9
0
0102030405060708090
100
0 1 2 3 4 5 6 7 8 9 10Rut Rating
Perc
ent (
%) o
f Lan
e M
iles
TOLL (413 lane miles)

0.00
0.00
0.00
0.00
0.00
0.00 1.15 6.
26 15.3
0
46.4
5
30.8
4
0102030405060708090
100
0 1 2 3 4 5 6 7 8 9 10Rut Rating
Perc
ent (
%) o
f Lan
e M
iles
PRIMARY (2,247 lane miles)
2001 Rut Distribution by System District 6
28
0.00
0.00
0.00
0.00
0.00
0.00
0.00
0.00
0.00 3.42
96.5
8
0102030405060708090
100
0 1 2 3 4 5 6 7 8 9 10Rut Rating
Perc
ent (
%) o
f Lan
e M
iles
INTERSTATE (93 lane miles)
0.00
0.00
0.00
0.00
0.00
0.00
0.00
0.00 8.
67
7.10
84.2
3
0102030405060708090
100
0 1 2 3 4 5 6 7 8 9 10Rut Rating
Perc
ent (
%) o
f Lan
e M
iles
TURNPIKE (185 lane miles)
0.00
0.00
0.00
0.00
0.00
0.00
0.00
0.00
12.7
5
68.6
6
18.5
9
0102030405060708090
100
0 1 2 3 4 5 6 7 8 9 10Rut Rating
Perc
ent (
%) o
f Lan
e M
iles
TOLL (72 lane miles)

0.00
0.00
0.00
0.00
0.00
0.61
0.78 5.
77 14.0
4
54.6
5
24.1
6
0102030405060708090
100
0 1 2 3 4 5 6 7 8 9 10Rut Rating
Perc
ent (
%) o
f Lan
e M
iles
PRIMARY (2,965 lane miles)
2001 Rut Distribution by System District 7
29
0.00
0.00
0.00
0.00
0.00
0.00
0.00
0.00
14.2
4
15.8
4
69.9
2
0102030405060708090
100
0 1 2 3 4 5 6 7 8 9 10Rut Rating
Perc
ent (
%) o
f Lan
e M
iles
INTERSTATE (435 lane miles)
0.00
0.00
0.00
0.00
0.00
0.00
0.00
0.00
0.00
0.00
100.
00
0102030405060708090
100
0 1 2 3 4 5 6 7 8 9 10Rut Rating
Perc
ent (
%) o
f Lan
e M
iles
TURNPIKE (70 lane miles)
0.00
0.00
0.00
0.00
0.00
0.00
0.00
10.7
7
14.5
0
32.2
0 42.5
4
0102030405060708090
100
0 1 2 3 4 5 6 7 8 9 10Rut Rating
Perc
ent (
%) o
f Lan
e M
iles
TOLL (90 lane miles)
SECTION IV
RIDE RATING
BY
SYSTEM AND DISTRICT
30

• Ride Ratings measure the ride quality of a pavement section. It is an indication of the degree of smoothness or roughness of the wearing surface.
• Ride Ratings are calculated from Ride Number (ASTM E-1489).
Ride Number x 2 = Ride Rating
Ride Number is a mathematical processing of longitudinal profile measurements to produce an estimate of subjective ride quality or user perception. The Ride Number is based on an algorithm published in National Cooperative Highway Research Project (NCHRP) 1-23. Ride Number is an ASTM Standard (E-1489).
• Rideability is greatly affected by factors that include the following:
�� Original pavement profile
�� Profiles from intersecting roads
�� Utility patches and manhole covers
�� Surface and structural deterioration
• Ride deficiency is rated on a zero to ten scale, where ten is best. A ten would indicate a very smooth surface. Currently pavement sections with ratings of six or less are eligible for rehabilitation.
SECTION IV
Ride Rating by System and District
Ride Rating Criteria
31

No
Tol
l Sys
tem
No
Tur
npik
e Sy
stem
N
o T
oll S
yste
m
No
Tur
npik
e Sy
stem
No
Tol
l Sys
tem
Ride Ratings by System and District 2001 Flexible Pavement Condition Survey
32
8.17
8.86
8.80
8.30
8.13
8.80
8.27
8.26 8.
61
7.97 8.28
7.73
8.58
8.60
8.00 8.08
8.79
8.80
8.63
8.30
7.60
8.60 8.76
8.29
7.74 8.
138.
738.
507.
82 8.20
8.06
8.74
8.70
8.45
8.20
0.001.002.003.004.00
5.006.007.008.00
9.0010.00
Ave
rage
Rid
e R
atin
g
District 1 District 2 District 3 District 4 District 5 District 6 District 7 AllDistricts
Roadway System / Based on Lane MilesPrimary Interstate Turnpike Toll All Systems

0.00
0.00
0.00
0.04
0.23 1.08 4.09 13
.01
43.0
8
38.4
7
0.00
0102030405060708090
100
0 1 2 3 4 5 6 7 8 9 10Ride Rating
Perc
ent (
%) o
f Lan
e M
iles
PRIMARY (28,923 lane miles)
2001 Ride Distribution by System Statewide
33
0.00
0.00
0.00
0.00
0.00
0.00
0.01
0.27
12.4
1
0.00
87.3
2
0102030405060708090
100
0 1 2 3 4 5 6 7 8 9 10Ride Rating
Perc
ent (
%) o
f Lan
e M
iles
INTERSTATE (5,679 lane miles)
0.00
0.00
0.00
0.00
0.00
0.00
0.00
0.09
18.3
5
81.5
6
0.00
0102030405060708090
100
0 1 2 3 4 5 6 7 8 9 10Ride Rating
Perc
ent (
%) o
f Lan
e M
iles
TURNPIKE (1,601 lane miles)
0.00
0.00
0.00
0.00
0.00
0.00
0.47 5.
50
26.9
2
67.1
1
0.00
0102030405060708090
100
0 1 2 3 4 5 6 7 8 9 10Ride Rating
Perc
ent (
%) o
f Lan
e M
iles
TOLL (581 lane miles)
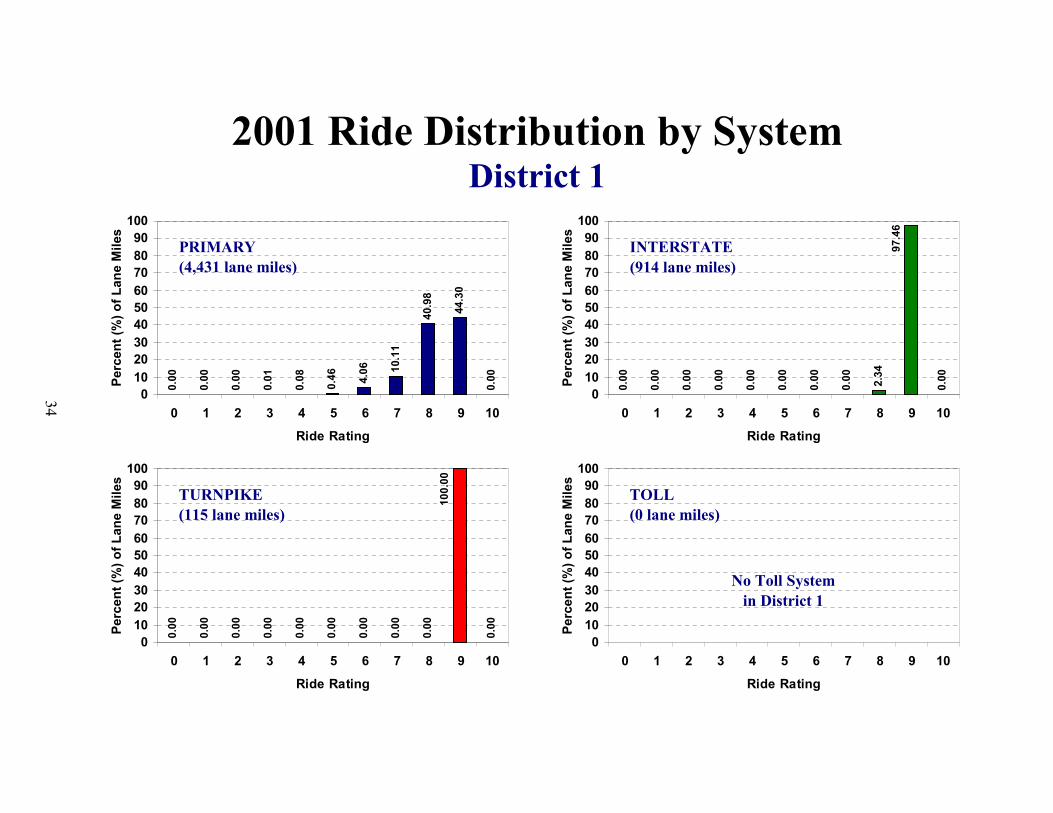
0.00
0.00
0.00
0.01
0.08
0.46 4.06 10
.11
40.9
8
44.3
0
0.00
0102030405060708090
100
0 1 2 3 4 5 6 7 8 9 10Ride Rating
Perc
ent (
%) o
f Lan
e M
iles
PRIMARY (4,431 lane miles)
2001 Ride Distribution by System District 1
34
0.00
0.00
0.00
0.00
0.00
0.00
0.00
0.00 2.34
0.00
97.4
6
0102030405060708090
100
0 1 2 3 4 5 6 7 8 9 10Ride Rating
Perc
ent (
%) o
f Lan
e M
iles
INTERSTATE (914 lane miles)
0.00
0.00
0.00
0.00
0.00
0.00
0.00
0.00
0.00
0.00
100.
00
0102030405060708090
100
0 1 2 3 4 5 6 7 8 9 10Ride Rating
Perc
ent (
%) o
f Lan
e M
iles
TURNPIKE (115 lane miles)
0102030405060708090
100
0 1 2 3 4 5 6 7 8 9 10Ride Rating
Perc
ent (
%) o
f Lan
e M
iles
TOLL (0 lane miles)
No Toll System in District 1

0.00
0.00
0.00
0.08
0.30
0.66 2.56 10
.03
48.0
2
38.3
5
0.00
0102030405060708090
100
0 1 2 3 4 5 6 7 8 9 10Ride Rating
Perc
ent (
%) o
f Lan
e M
iles
PRIMARY (5,733 lane miles)
2001 Ride Distribution by System District 2
35
0.00
0.00
0.00
0.00
0.00
0.00
0.00 0.94 5.
63
0.00
93.4
3
0102030405060708090
100
0 1 2 3 4 5 6 7 8 9 10Ride Rating
Perc
ent (
%) o
f Lan
e M
iles
INTERSTATE (1,505 lane miles)
0102030405060708090
100
0 1 2 3 4 5 6 7 8 9 10Ride Rating
Perc
ent (
%) o
f Lan
e M
iles
TOLL (0 lane miles)
No Toll System in District 2
0102030405060708090
100
0 1 2 3 4 5 6 7 8 9 10Ride Rating
Perc
ent (
%) o
f Lan
e M
iles
TURNPIKE (0 lane miles)
No Turnpike System in District 2

0.00
0.00
0.00
0.00
0.09
0.66 1.97 7.
81
40.3
1 49.1
7
0.00
0102030405060708090
100
0 1 2 3 4 5 6 7 8 9 10Ride Rating
Perc
ent (
%) o
f Lan
e M
iles
PRIMARY (5,178 lane miles)
2001 Ride Distribution by System District 3
36
0.00
0.00
0.00
0.00
0.00
0.00
0.11
0.00
22.7
1
0.00
77.1
8
0102030405060708090
100
0 1 2 3 4 5 6 7 8 9 10Ride Rating
Perc
ent (
%) o
f Lan
e M
iles
INTERSTATE (377 lane miles)
0.00
0.00
0.00
0.00
0.00
0.00
0.00
0.00
0.00
0.00
100.
00
0102030405060708090
100
0 1 2 3 4 5 6 7 8 9 10Ride Rating
Perc
ent (
%) o
f Lan
e M
iles
TOLL (6 lane miles)
0102030405060708090
100
0 1 2 3 4 5 6 7 8 9 10Ride Rating
Perc
ent (
%) o
f Lan
e M
iles
TURNPIKE (0 lane miles)
No Turnpike System in District 3
0.00
0.00
0.00
0.01
0.49 1.71 8.
21
23.2
3
40.7
2
25.5
4
0.00
0102030405060708090
100
0 1 2 3 4 5 6 7 8 9 10Ride Rating
Perc
ent (
%) o
f Lan
e M
iles
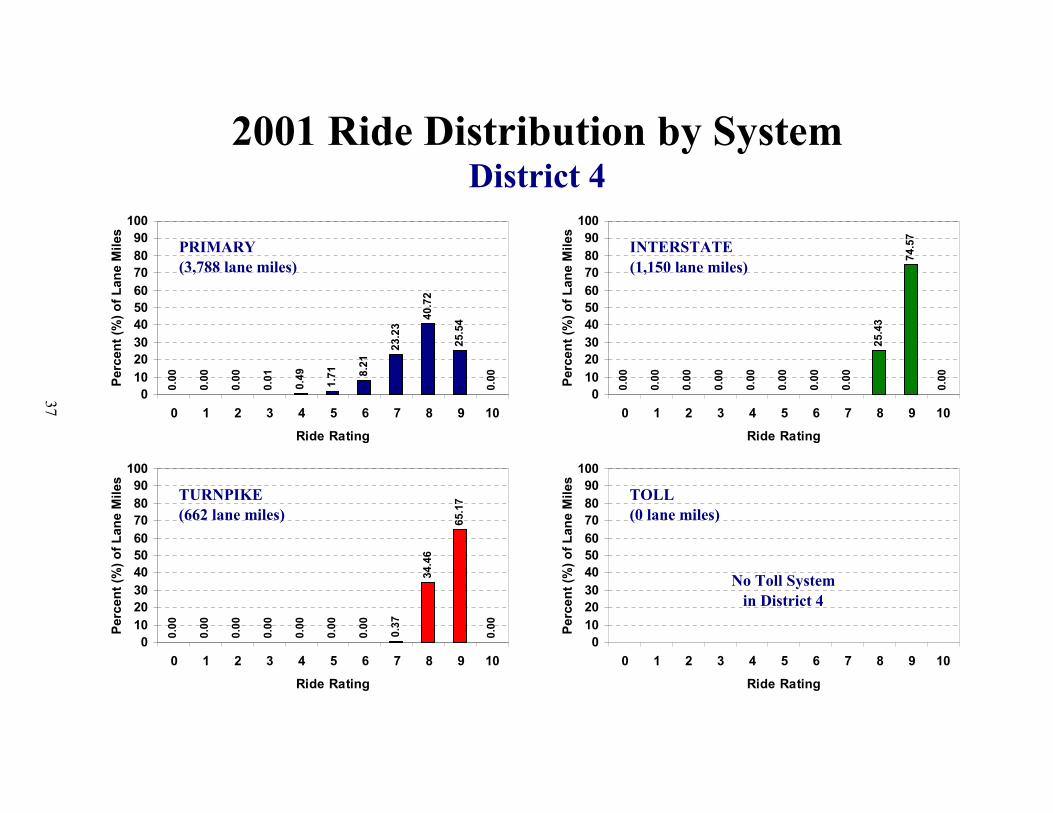
PRIMARY (3,788 lane miles)
2001 Ride Distribution by System District 4
37
0.00
0.00
0.00
0.00
0.00
0.00
0.00
0.00
25.4
3
0.00
74.5
7
0102030405060708090
100
0 1 2 3 4 5 6 7 8 9 10Ride Rating
Perc
ent (
%) o
f Lan
e M
iles
INTERSTATE (1,150 lane miles)
0.00
0.00
0.00
0.00
0.00
0.00
0.00
0.37
34.4
6
0.00
65.1
7
0102030405060708090
100
0 1 2 3 4 5 6 7 8 9 10Ride Rating
Perc
ent (
%) o
f Lan
e M
iles
TURNPIKE (662 lane miles)
0102030405060708090
100
0 1 2 3 4 5 6 7 8 9 10Ride Rating
Perc
ent (
%) o
f Lan
e M
iles
TOLL (0 lane miles)
No Toll System in District 4

PRIMARY (4,584 lane miles)
2001 Ride Distribution by System District 5
38
INTERSTATE (1,206 lane miles)
TURNPIKE (569 lane miles)
TOLL (413 lane miles)
0.00
0.00
0.00
0.00
0.11 0.92 3.16
14.1
9
42.5
8
39.0
3
0.00
0102030405060708090
100
0 1 2 3 4 5 6 7 8 9 10Ride Rating
Perc
ent (
%) o
f Lan
e M
iles
0.00
0.00
0.00
0.00
0.00
0.00
0.00
0.00
11.5
6
0.00
88.4
4
0102030405060708090
100
0 1 2 3 4 5 6 7 8 9 10Ride Rating
Perc
ent (
%) o
f Lan
e M
iles
0.00
0.00
0.00
0.00
0.00
0.00
0.00
0.00
10.8
1
0.00
89.1
9
0102030405060708090
100
0 1 2 3 4 5 6 7 8 9 10Ride Rating
Perc
ent (
%) o
f Lan
e M
iles
0.00
0.00
0.00
0.00
0.00
0.00
0.00
0.00
80.1
5
19.8
5
0102030405060708090
100
0 1 2 3 4 5 6 7 8 9 10Ride Rating
Perc
ent (
%) o
f Lan
e M
iles

0.00
0.00
0.00
0.07
0.19 2.73 9.
53
22.5
9
47.5
1
17.3
7
0.00
0102030405060708090
100
0 1 2 3 4 5 6 7 8 9 10Ride Rating
Perc
ent (
%) o
f Lan
e M
iles
PRIMARY (2,247 lane miles)
2001 Ride Distribution by System District 6
39
0.00
0.00
0.00
0.00
0.00
0.00
0.00
0.24
17.6
3
0.00
82.1
3
0102030405060708090
100
0 1 2 3 4 5 6 7 8 9 10Ride Rating
Perc
ent (
%) o
f Lan
e M
iles
INTERSTATE (93 lane miles)
0.00
0.00
0.00
0.00
0.00
0.00
0.00
0.10 9.
05
0.00
90.8
5
0102030405060708090
100
0 1 2 3 4 5 6 7 8 9 10Ride Rating
Perc
ent (
%) o
f Lan
e M
iles
TURNPIKE (185 lane miles)
0.00
0.00
0.00
0.00
0.00
0.00
0.00 7.
47
44.8
1
0.00
47.7
2
0102030405060708090
100
0 1 2 3 4 5 6 7 8 9 10Ride Rating
Perc
ent (
%) o
f Lan
e M
iles
TOLL (72 lane miles)

0.00
0.00
0.00
0.00
0.44 1.77 2.88 10
.02
41.9
2
42.9
8
0.00
0102030405060708090
100
0 1 2 3 4 5 6 7 8 9 10Ride Rating
Perc
ent (
%) o
f Lan
e M
iles
PRIMARY (2,961 lane miles)
2001 Ride Distribution by System District 7
40
0.00
0.00
0.00
0.00
0.00
0.00
0.00
0.17
14.4
7
0.00
85.3
6
0102030405060708090
100
0 1 2 3 4 5 6 7 8 9 10Ride Rating
Perc
ent (
%) o
f Lan
e M
iles
INTERSTATE (435 lane miles)
0.00
0.00
0.00
0.00
0.00
0.00
0.00
0.00
42.3
5
0.00
57.6
5
0102030405060708090
100
0 1 2 3 4 5 6 7 8 9 10Ride Rating
Perc
ent (
%) o
f Lan
e M
iles
TURNPIKE (70 lane miles)
0.00
0.00
0.00
0.00
0.00
0.00 3.04
29.3
4 40.1
6
0.00
27.4
7
0102030405060708090
100
0 1 2 3 4 5 6 7 8 9 10Ride Rating
Perc
ent (
%) o
f Lan
e M
iles
TOLL (90 lane miles)

SECTION V
CRACK, RUT AND RIDE
DISTRIBUTIONS
BY
DISTRICT
(ALL SYSTEMS COMBINED)
41

CRACK (36,850 lane miles)
2001 Crack, Rut and Ride Distribution Statewide (All Systems)
42
RUT (36,850 lane miles)
RIDE (36,785 lane miles)
0.58
1.13
0.74
0.70 5.
11
4.49 5.49 11
.34
11.4
4
12.6
8
46.3
0
0102030405060708090
100
0 1 2 3 4 5 6 7 8 9 10Rating
Perc
ent (
%) o
f Lan
e M
iles
0.00
0.00
0.00
0.01
0.02
0.31
1.21 5.
36
17.0
7 25.9
1
50.1
1
0102030405060708090
100
0 1 2 3 4 5 6 7 8 9 10Rating
Perc
ent (
%) o
f Lan
e M
iles
0.00
0.00
0.00
0.03
0.18
0.85 3.23 10
.36
37.0
1
0.00
48.3
4
0102030405060708090
100
0 1 2 3 4 5 6 7 8 9 10Rating
Perc
ent (
%) o
f Lan
e M
iles

0.09 1.25
0.66
0.94 4.
91 7.19
5.64 14
.18
9.76
10.3
5
45.0
4
0102030405060708090
100
0 1 2 3 4 5 6 7 8 9 10Rating
Perc
ent (
%) o
f Lan
e M
iles
CRACK (5,466 lane miles)
2001 Crack, Rut and Ride Distribution District 1 (All Systems)
43
0.00
0.00
0.00
0.00
0.00
0.45 2.24 4.81
19.5
7
25.1
9
47.7
5
0102030405060708090
100
0 1 2 3 4 5 6 7 8 9 10Rating
Perc
ent (
%) o
f Lan
e M
iles
RUT (5,466 lane miles)
0.00
0.00
0.00
0.01
0.06
0.37 3.30 8.
20
33.6
8
0.00
54.3
7
0102030405060708090
100
0 1 2 3 4 5 6 7 8 9 10Rating
Perc
ent (
%) o
f Lan
e M
iles
RIDE (5,461 lane miles)

1.15
1.11
1.19
1.45 7.
75
3.77 5.26 9.
96 10.9
9
9.15
48.2
1
0102030405060708090
100
0 1 2 3 4 5 6 7 8 9 10Rating
Perc
ent (
%) o
f Lan
e M
iles
CRACK (7,270 lane miles)
2001 Crack, Rut and Ride Distribution District 2 (All Systems)
44
0.00
0.00
0.00
0.00
0.00
0.27
0.63 5.
90
17.7
0 26.1
7
49.3
4
0102030405060708090
100
0 1 2 3 4 5 6 7 8 9 10Rating
Perc
ent (
%) o
f Lan
e M
iles
RUT (7,270 lane miles)
0.00
0.00
0.00
0.07
0.24
0.52 2.02 8.
14
39.2
1
0.00
49.8
0
0102030405060708090
100
0 1 2 3 4 5 6 7 8 9 10Rating
Perc
ent (
%) o
f Lan
e M
iles
RIDE (7,238 lane miles)

0.49
0.68
0.78
0.68 3.48 4.83 9.
44
7.51
8.18 11
.89
52.0
4
0102030405060708090
100
0 1 2 3 4 5 6 7 8 9 10Rating
Perc
ent (
%) o
f Lan
e M
iles
CRACK (5,567 lane miles)
2001 Crack, Rut and Ride Distribution District 3 (All Systems)
45
0.00
0.00
0.00
0.04
0.13
0.74 3.31 11
.24
19.0
8
24.2
1
41.2
6
0102030405060708090
100
0 1 2 3 4 5 6 7 8 9 10Rating
Perc
ent (
%) o
f Lan
e M
iles
RUT (5,567 lane miles)
0.00
0.00
0.00
0.00
0.08
0.62 1.84 7.
27
39.1
8
0.00
51.0
2
0102030405060708090
100
0 1 2 3 4 5 6 7 8 9 10Rating
Perc
ent (
%) o
f Lan
e M
iles
RIDE (5,560 lane miles)
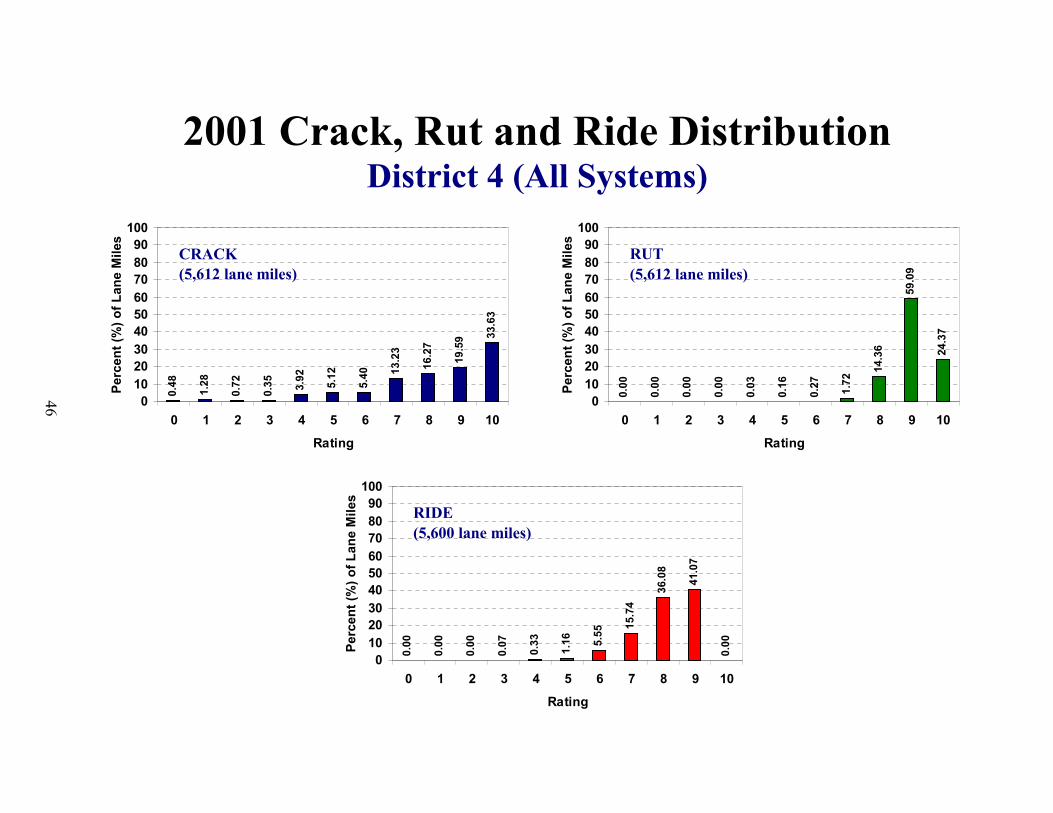
0.48
1.28
0.72
0.35 3.92 5.12
5.40 13
.23
16.2
7
19.5
9 33.6
3
0102030405060708090
100
0 1 2 3 4 5 6 7 8 9 10Rating
Perc
ent (
%) o
f Lan
e M
iles
CRACK (5,612 lane miles)
2001 Crack, Rut and Ride Distribution District 4 (All Systems)
46
0.00
0.00
0.00
0.00
0.03
0.16
0.27 1.72
14.3
6 24.3
7
59.0
9
0102030405060708090
100
0 1 2 3 4 5 6 7 8 9 10Rating
Perc
ent (
%) o
f Lan
e M
iles
RUT (5,612 lane miles)
0.00
0.00
0.00
0.07
0.33
1.16 5.
55
15.7
4
36.0
8
0.00
41.0
7
0102030405060708090
100
0 1 2 3 4 5 6 7 8 9 10Rating
Perc
ent (
%) o
f Lan
e M
iles
RIDE (5,600 lane miles)

0.65
1.02
0.65
0.37 6.
93
3.80 5.03 13
.04
13.4
1
13.0
0
42.1
0
0102030405060708090
100
0 1 2 3 4 5 6 7 8 9 10Rating
Perc
ent (
%) o
f Lan
e M
iles
CRACK (6,776 lane miles)
2001 Crack, Rut and Ride Distribution District 5 (All Systems)
47
0.00
0.00
0.00
0.00
0.00
0.00
0.45 3.57
17.7
9 28.5
7
49.6
2
0102030405060708090
100
0 1 2 3 4 5 6 7 8 9 10Rating
Perc
ent (
%) o
f Lan
e M
iles
RUT (6,776 lane miles)
0.00
0.00
0.00
0.00
0.08
0.62 2.14 9.
61
33.0
0
0.00
54.5
5
0102030405060708090
100
0 1 2 3 4 5 6 7 8 9 10Rating
Perc
ent (
%) o
f Lan
e M
iles
RIDE (6,771 lane miles)
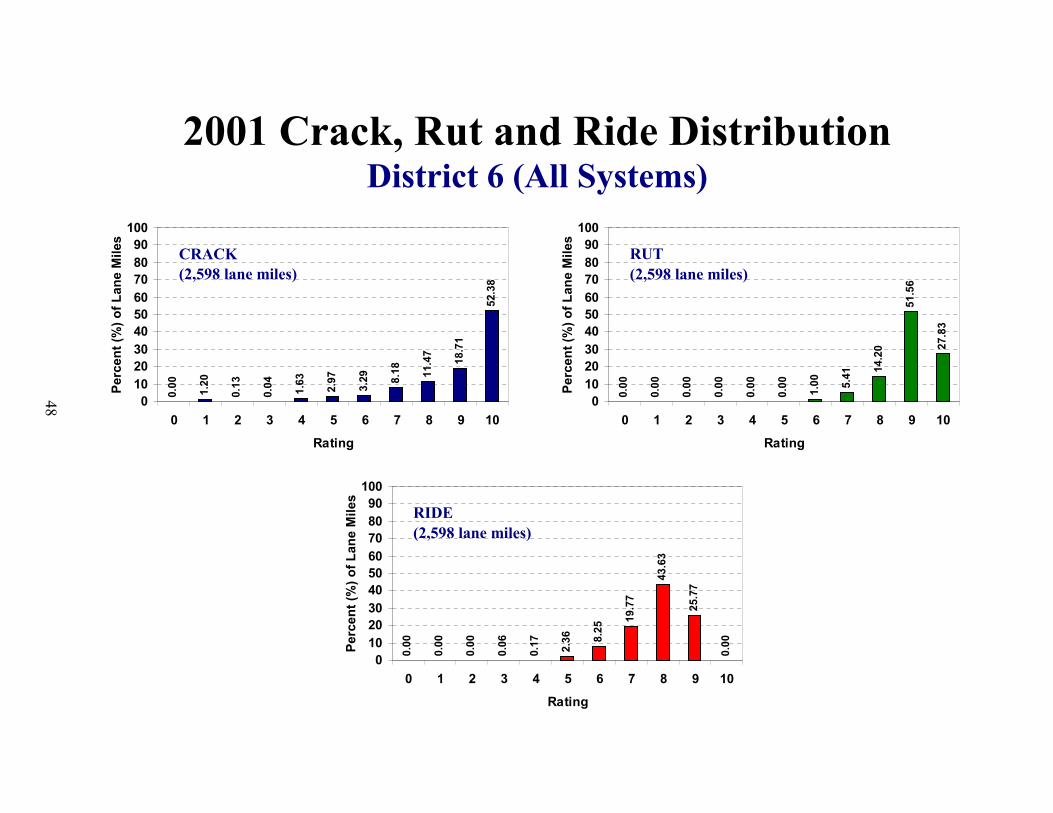
0.00 1.20
0.13
0.04 1.63 2.97
3.29 8.
18 11.4
7
18.7
1
52.3
8
0102030405060708090
100
0 1 2 3 4 5 6 7 8 9 10Rating
Perc
ent (
%) o
f Lan
e M
iles
CRACK (2,598 lane miles)
2001 Crack, Rut and Ride Distribution District 6 (All Systems)
48
0.00
0.00
0.00
0.00
0.00
0.00 1.00 5.
41 14.2
0 27.8
3
51.5
6
0102030405060708090
100
0 1 2 3 4 5 6 7 8 9 10Rating
Perc
ent (
%) o
f Lan
e M
iles
RUT (2,598 lane miles)
0.00
0.00
0.00
0.06
0.17 2.36 8.
25
19.7
7
43.6
3
0.00
25.7
7
0102030405060708090
100
0 1 2 3 4 5 6 7 8 9 10Rating
Perc
ent (
%) o
f Lan
e M
iles
RIDE (2,598 lane miles)

0.76 1.62
0.50
0.54 3.50
2.76
2.17
11.8
8
8.62
8.77
58.8
8
0102030405060708090
100
0 1 2 3 4 5 6 7 8 9 10Rating
Perc
ent (
%) o
f Lan
e M
iles
CRACK (3,561 lane miles)
2001 Crack, Rut and Ride Distribution District 7 (All Systems)
49
0.00
0.00
0.00
0.00
0.00
0.51
0.65 5.
08 13.8
0 25.1
0
54.8
7
0102030405060708090
100
0 1 2 3 4 5 6 7 8 9 10Rating
Perc
ent (
%) o
f Lan
e M
iles
RUT (3,561 lane miles)
0.00
0.00
0.00
0.00
0.37 1.47
2.48 9.
11
38.5
3
0.00
48.0
5
0102030405060708090
100
0 1 2 3 4 5 6 7 8 9 10Rating
Perc
ent (
%) o
f Lan
e M
iles
RIDE (3,557 lane miles)

SECTION VI
HISTORICAL
INFORMATION
BY
DISTRICT
50

Historical Information Statewide
51
(Best)
6.50
7.50
8.50
9.50
Ave
rage
Rat
ing
Crack Rating 8.15 8.15 8.03 8.07 8.17 8.21 8.12 8.02 8.14 8.11Rut Rating 8.35 8.56 8.72 8.70 8.81 8.81 8.78 8.91 8.96 8.93Ride Rating 8.02 8.05 8.03 8.08 8.09 8.16 8.24 8.20 8.20 8.20
1992 1993 1994 1995 1996 1997 1998 1999 2000 2001

Historical Information District 1
52
6.50
7.50
8.50
9.50
Ave
rage
Rat
ing
Crack Rating 8.65 8.68 8.48 8.23 8.08 8.01 7.97 7.81 7.96 7.97Rut Rating 8.34 8.51 8.69 8.61 8.70 8.59 8.63 8.70 8.81 8.87Ride Rating 8.07 8.11 8.02 8.03 8.07 8.03 8.12 8.23 8.26 8.30
1992 1993 1994 1995 1996 1997 1998 1999 2000 2001
(Best)

Historical Information District 2
53
6.50
7.50
8.50
9.50
Ave
rage
Rat
ing
Crack Rating 8.03 8.07 7.96 7.92 7.99 7.94 7.79 7.67 7.96 7.92Rut Rating 8.34 8.73 8.80 8.80 8.99 8.97 8.94 9.04 9.00 8.94Ride Rating 8.15 8.14 8.12 8.20 8.16 8.29 8.31 8.28 8.27 8.27
1992 1993 1994 1995 1996 1997 1998 1999 2000 2001
(Best)

Historical Information District 3
54
6.50
7.50
8.50
9.50
Ave
rage
Rat
ing
Crack Rating 7.00 7.01 6.86 7.12 7.49 7.78 7.73 7.81 8.10 8.29Rut Rating 8.05 8.24 8.39 8.31 8.41 8.38 8.38 8.67 8.75 8.69Ride Rating 8.02 8.07 8.06 8.07 8.17 8.32 8.39 8.21 8.27 8.28
1992 1993 1994 1995 1996 1997 1998 1999 2000 2001
(Best)

Historical Information District 4
55
6.50
7.50
8.50
9.50
Ave
rage
Rat
ing
Crack Rating 8.78 8.65 8.62 8.62 8.55 8.61 8.33 8.16 8.03 7.92Rut Rating 8.58 8.77 8.95 8.92 8.97 9.05 9.01 8.92 8.98 9.05Ride Rating 7.84 7.88 7.90 7.94 7.93 7.90 8.12 8.11 8.02 8.00
1992 1993 1994 1995 1996 1997 1998 1999 2000 2001
(Best)
Historical Information District 5
56
6.50
7.50
8.50
9.50
Ave
rage
Rat
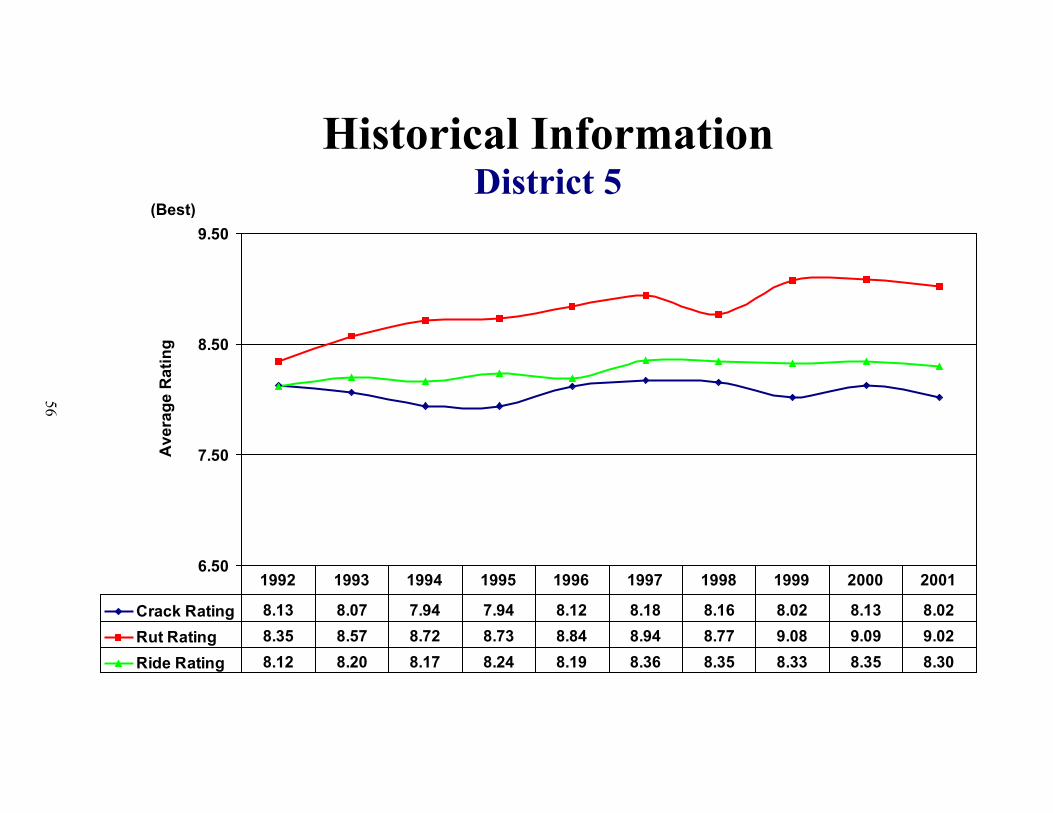
ing
Crack Rating 8.13 8.07 7.94 7.94 8.12 8.18 8.16 8.02 8.13 8.02Rut Rating 8.35 8.57 8.72 8.73 8.84 8.94 8.77 9.08 9.09 9.02Ride Rating 8.12 8.20 8.17 8.24 8.19 8.36 8.35 8.33 8.35 8.30
1992 1993 1994 1995 1996 1997 1998 1999 2000 2001
(Best)

Historical Information District 6
57
6.50
7.50
8.50
9.50
Ave
rage
Rat
ing
Crack Rating 8.65 8.83 8.63 8.71 8.78 8.83 8.81 8.70 8.74 8.69Rut Rating 9.02 8.57 8.89 8.79 8.89 8.99 8.95 8.94 9.06 9.00Ride Rating 7.80 7.71 7.81 7.88 7.94 7.96 8.09 7.80 7.75 7.74
1992 1993 1994 1995 1996 1997 1998 1999 2000 2001
(Best)

Historical Information District 7
58
6.50
7.50
8.50
9.50
Ave
rage
Rat
ing
Crack Rating 8.07 8.23 8.20 8.50 8.77 8.74 8.79 8.61 8.65 8.52Rut Rating 7.97 8.35 8.58 8.71 8.84 8.76 8.85 8.93 9.11 8.97Ride Rating 7.83 7.93 7.90 7.98 8.00 8.06 8.16 8.16 8.14 8.20
1992 1993 1994 1995 1996 1997 1998 1999 2000 2001
(Best)

SECTION VII
HISTORICAL
INFORMATION
BY
SYSTEM
59

Historical Information All Systems
60
(Best)
6.50
7.50
8.50
9.50
Ave
rage
Rat
ing
Crack Rating 8.15 8.15 8.03 8.07 8.17 8.21 8.12 8.02 8.14 8.11Rut Rating 8.35 8.56 8.72 8.70 8.81 8.81 8.78 8.91 8.96 8.93Ride Rating 8.02 8.05 8.03 8.08 8.09 8.16 8.24 8.20 8.20 8.20
1992 1993 1994 1995 1996 1997 1998 1999 2000 2001

Historical Information Primary System
61
6.50
7.50
8.50
9.50
Ave
rage
Rat
ing
Crack Rating 8.05 8.06 7.93 7.96 8.03 8.04 7.96 7.84 7.99 8.00Rut Rating 8.33 8.52 8.69 8.68 8.77 8.76 8.76 8.87 8.92 8.89Ride Rating 7.95 7.97 7.97 8.02 8.04 8.10 8.19 8.06 8.06 8.06
1992 1993 1994 1995 1996 1997 1998 1999 2000 2001
(Best)

Historical Information Interstate System
62
6.50
7.50
8.50
9.50
Ave
rage
Rat
ing
Crack Rating 8.38 8.34 8.24 8.38 8.60 8.76 8.66 8.73 8.76 8.55Rut Rating 8.41 8.61 8.69 8.69 8.92 8.97 8.84 8.99 9.07 9.00Ride Rating 8.34 8.38 8.34 8.32 8.34 8.47 8.46 8.81 8.78 8.74
1992 1993 1994 1995 1996 1997 1998 1999 2000 2001
(Best)

Historical Information Turnpike System
63
6.50
7.50
8.50
9.50
Ave
rage
Rat
ing
Crack Rating 9.48 9.39 9.20 9.05 9.20 9.23 9.04 8.72 8.52 8.54Rut Rating 8.77 8.96 9.26 9.00 9.10 9.08 9.02 9.19 9.14 9.25Ride Rating 8.26 8.52 8.29 8.39 8.16 8.28 8.38 8.74 8.69 8.70
1992 1993 1994 1995 1996 1997 1998 1999 2000 2001
(Best)

Historical Information Toll System
64
6.50
7.50
8.50
9.50
Ave
rage
Rat
ing
Crack Rating 8.44 8.67 8.37 8.68 8.65 8.82 8.60 8.35 8.37 8.15Rut Rating 8.30 9.02 9.04 8.86 8.82 8.79 8.81 9.35 9.48 9.23Ride Rating 7.95 8.08 7.68 8.12 8.14 8.45 8.13 8.39 8.36 8.45
1992 1993 1994 1995 1996 1997 1998 1999 2000 2001
(Best)
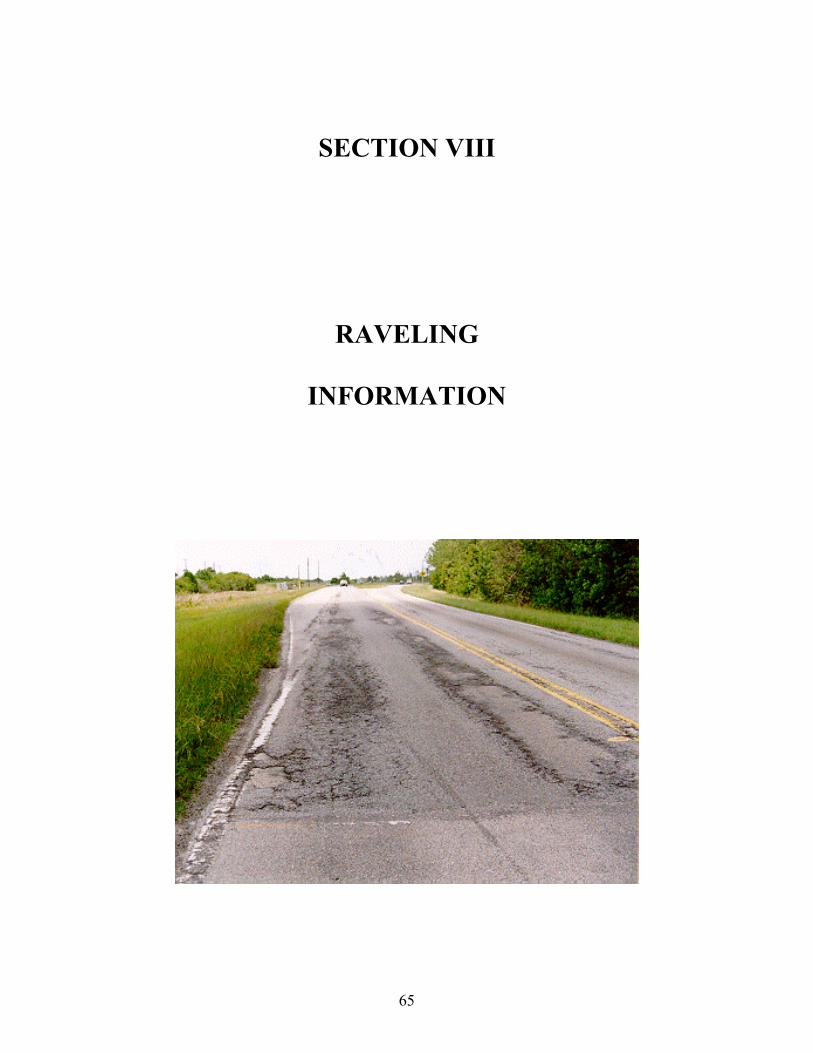
SECTION VIII
RAVELING
INFORMATION
65

• Raveling is the wearing away of the pavement surface caused by the dislodging of
aggregate particles and the loss of asphalt binder due to weathering.
• Raveling for the rated section is accumulated in the crack ratings.
• Raveling and weathering may be caused by:
�� Hardening of the asphalt binder
�� Low adhesion of the asphalt binder
�� Low wear resistant aggregate in the mix or poor asphalt mix (dirty aggregate in the mix)
�� Water sensitive asphalt-aggregate mixture
�� Any combination of the above items
• Raveling became a noticeable defect by raters and was required to be listed in their comments as of 1992.
• Beginning in 1995, Raveling was rated by severity level (light, moderate, and severe) and percent of affected area, where only the predominate severity level was recorded.
�� Light Raveling occurs when the aggregate and/or binder has begun to wear away but has not progressed significantly. Some loss of fine aggregate is present.
�� Moderate Raveling occurs when the aggregate and/or binder has worn away and the surface texture is becoming rough and pitted; loose particles generally exist; loss of fine aggregate and some loss of coarse aggregate exists.
�� Severe Raveling occurs when the aggregate and/or binder has worn away and the surface texture is very rough and pitted; loss of coarse aggregate is very noticeable.
66
SECTION VIII
Raveling
Raveling Rating Criteria

2001 Raveling Survey by District
67
9.23
7.27
8.77
4.53 5.
13
2.75
4.59
4.46
2.16
24.0
4
8.43
2.00
8.01
5.97 6.12
11.6
9
9.42
3.48
8.93
2.32
0.32
9.78
6.08
3.88
0
5
10
15
20
25
30
Perc
ent o
f Lan
e M
iles
Rav
eled
District 1 District 2 District 3 District 4 District 5 District 6 District 7 AllDistricts
Raveling Severity Level `Light Moderate Severe
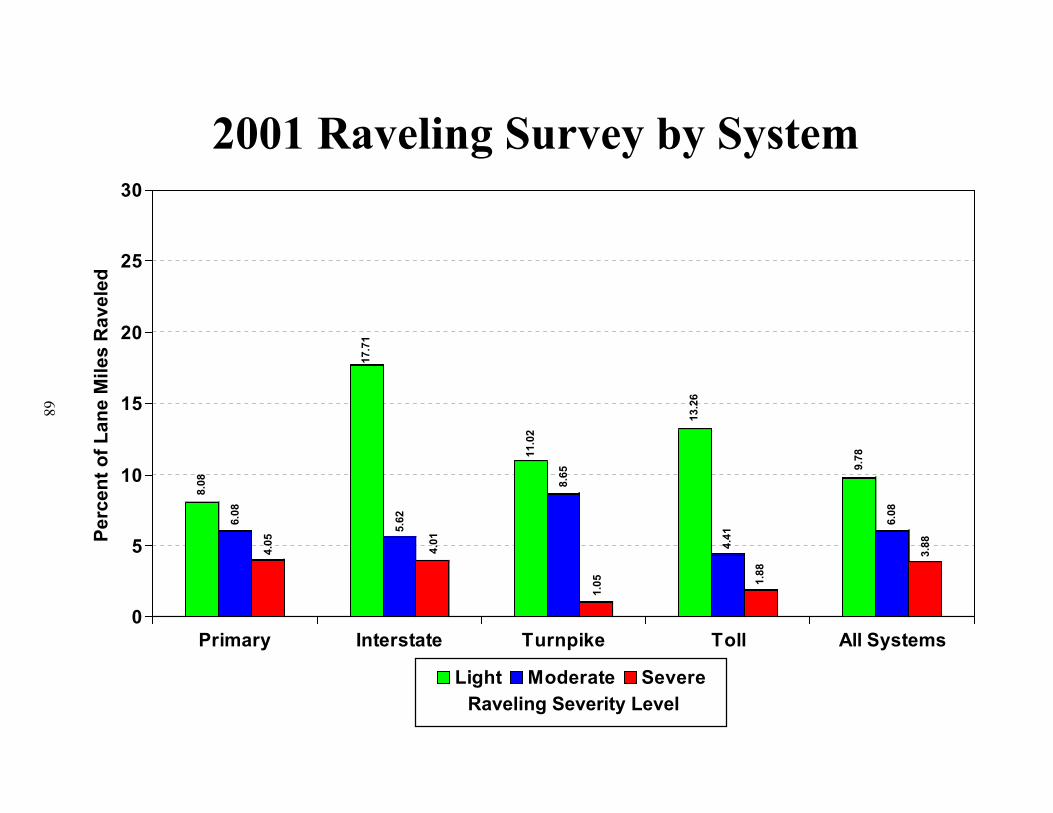
8.08
6.08
4.05
17.7
1
5.62
4.01
11.0
2
8.65
1.05
13.2
6
4.41
1.88
9.78
6.08
3.88
0
5
10
15
20
25
30
Perc
ent o
f Lan
e M
iles
Rav
eled
Primary Interstate Turnpike Toll All Systems
Raveling Severity Level `Light Moderate Severe
2001 Raveling Survey by System
68
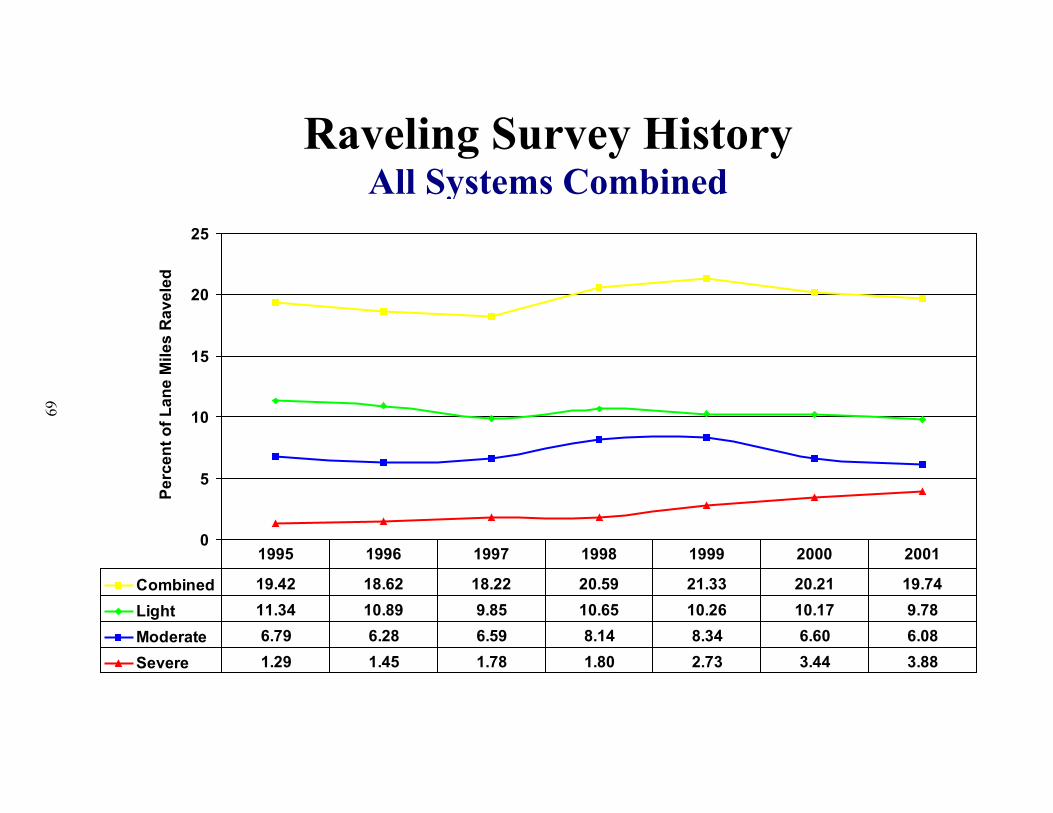
Raveling Survey History All Systems Combined
69
0
5
10
15
20
25
Perc
ent o
f Lan
e M
iles
Rav
eled
Combined 19.42 18.62 18.22 20.59 21.33 20.21 19.74Light 11.34 10.89 9.85 10.65 10.26 10.17 9.78Moderate 6.79 6.28 6.59 8.14 8.34 6.60 6.08Severe 1.29 1.45 1.78 1.80 2.73 3.44 3.88
1995 1996 1997 1998 1999 2000 2001

SECTION IX
CRACK, RUT AND RIDE
RATINGS COMPARISON
BETWEEN
2001 AND 2000
70
The following pavement types have been omitted because they exhibit known changes to the pavement surface as indicated below:
Type 0 - Pavement sections not State-maintained, duplicated under another county section number, or added under the rigid pavement condition survey.
Type 2 - Surface Treatment or pavement improvement without new construction, such as intersection improvements, wheel path leveling, bridge approach or area resurfacing.
Type 4 - Rigid Pavements
Type 5 - New Construction
Type 6 - No Ride taken for this section (normally because of length constraint)
Type 7 - New Pavement (Overlays)
Type 8 - Under Construction
Type 9 - Structures or exceptions that are State-maintained
71
SECTION IX
Crack, Rut, and Ride Ratings Comparison
Rating Comparison Criteria

Crack, Rut and Ride Changes 2001 as Compared to 2000
72
Approximately 92.7% of the 2001 Crack Ratings are within +/-1 Point as Compared to 2000
CRACK
Approximately 99.6% of the 2001 Rut Ratings are within +/-1 Point as Compared to 2000
RUT
RIDE
Approximately 99.7% of the 2001 Ride Ratings are within +/-1 Point as Compared to 2000
NEGATIVE VALUES COULD INDICATE DETERIORATION IN THE PAVEMENT AND/OR VARIABILITY IN THE DATA COLLECTION PROCESS
POSITIVE VALUES COULD INDICATE VARIABILITY IN THE DATA COLLECTION PROCESS
0.00
0.36 1.95 5.02
15.7
7
76.7
5
0.13
0.00
0.00
0.00
0.00
0102030405060708090
100
-5 -4 -3 -2 -1 0 1 2 3 4 5Rating Change
Perc
ent (
%) o
f Lan
e M
iles
0.00
0.00
0.00
0.25
19.4
1
73.4
6
6.77
0.10
0.00
0.00
0.00
0102030405060708090
100
-5 -4 -3 -2 -1 0 1 2 3 4 5Rating Change
Perc
ent (
%) o
f Lan
e M
iles
0.00
0.01
0.05
0.15
10.5
5
4.24
0.11
0.01
0.00
84.8
8
0.00
0102030405060708090
100
-5 -4 -3 -2 -1 0 1 2 3 4 5Rating Change
Perc
ent (
%) o
f Lan
e M
iles