Embed Size (px)
Citation preview

Update on CNA PFM Development
and Existing Conditions
AssessmentOroville Dam Safety – Ad Hoc Committee Meeting No. 5August 9, 2019
STATE OF CALIFORNIADEPARTMENT OF WATER RESOURCESOROVILLE DAM SAFETY COMPREHENSIVE NEEDS ASSESSMENT

Presentation Outline Background
• Review: Purpose of the CNA• Risk-Informed Decision Making Approach• Ongoing Independent Level 2 Risk Analysis• Need for CNA Existing Conditions Assessment
Overview of CNA Existing Conditions Assessment• PFM Development and Evaluation• Examples of PFM Development• Comparisons of Estimated PFM Likelihoods with L2RA Estimates• Preliminary Results to Date
Update on CNA PFM Development and CNA Existing Conditions Assessment

Review: Purpose of theComprehensive Needs Assessment
Identify and prioritize dam safety enhancements Document existing conditions Identify current dam safety risks
Identify risk reduction measures to bolster safety and reliability Develop prioritized list of safety and reliability needs Provide set of Alternative Plans to DWR management
to consider in future investment

Initial Commitment forComprehensive Needs Assessment
June 27 and 28, 2017 DWR Letters to FERC and DSOD

Initial Outline of Comprehensive Needs Assessment
January 12, 2018 DWR Letter to FERC

Final Product of Comprehensive Needs Assessment
A report documenting an Existing Conditions Assessment that identifies current Dam Safety risks at the Oroville
Dam complex, opportunities to reduce risk, and a set of Alternative Plans that DWR could consider for future
implementation for risk reduction.

Presentation Outline Background
• Review: Purpose of the CNA• Risk-Informed Decision Making Approach• Ongoing Independent Level 2 Risk Analysis• Need for CNA Existing Conditions Assessment
Overview of CNA Existing Conditions Assessment• PFM Development and Evaluation• Examples of PFM Development• Comparisons of Estimated PFM Likelihoods with L2RA Estimates• Preliminary Results to Date
Update on CNA PFM Development and CNA Existing Conditions Assessment

Comprehensive Needs Assessment will employ Risk-Informed Decision Making (RIDM) Processes
The RIDM approach is the process of making safety decisions by evaluating if existing risks are tolerable and present risk measures are adequate, and if not, whether alternative risk reduction measures are justified.
(FEMA, 2015)
Risk = product of the likelihood of an adverse event and the consequences of that event
(U.S. Bureau of Reclamation, 2003)

Tolerable Levels of Risk for Different
Industries/ Facilities
from T. William Lambe and W. Allen Marr
10,0001,0001001
1/10,000
1/1,000
1/100,000
1/1,000,000
1/100
1/10

RIDM Process – Step 1Assess and Compare Risks:
Potential Failure Mode Analyses
Identify possible scenarios (Potential Failure Modes) that would lead to adverse impacts
Estimate the likelihood of each scenario occurring Estimate the consequences of each scenario Estimate Risk = Likelihood x Consequence Compare risk across scenarios to help prioritize
future risk reduction measures

Use of Potential Failure Modes (PFMs) in Dam Safety Risk Evaluations
January 12, 2018 DWR Letter to FERC
Potential Failure Mode Analyses (PFMA):
Required by FERC since December 2002
To be conducted jointly by Owner, Independent Consultant, and FERC staff
from Chapter 14, Dam Safety Monitoring Program, Revision 3,
May 2017, FERC

Potential Failure Mode Analyses (PFMA): Consideration and Development of PFMs – Example: Progression of Internal Erosion PFM
Reservoir at or above threshold levelInitiation – Erosion starts
Continuation – Unfiltered or inadequately filtered exit existsProgression – Continuous stable roof and/or sidewalls
Progression – Constriction or upstream zone fails to limit flowsProgression – No self-healing by upstream zone
Unsuccessful detection and interventionDam breaches (uncontrolled release of reservoir)
from “Best Practices in Dam and Levee Safety Risk Analysis,” United States Bureau of Reclamation and Army Corps of Engineers
Use of Potential Failure Modes (PFMs) in Dam Safety Risk Evaluations

Event Tree/Nodal Approach for Likelihood Estimates

Qualitative Approach to
Estimate Failure Likelihood using
Descriptors
Failure Likelihood Descriptors Failure
Likelihood Descriptors
Annual Failure Likelihood Evidence
Certain More frequent (greater) than 1/10
There is direct evidence or substantial indirect evidence to suggest it certain to nearly certain that failure is eminent or extremely likely in the next few years.
Extreme 1/10 to 1/100 There is direct evidence or substantial indirect evidence to suggest that failure has initiated or is very likely to occur during the life of the structure.
Very High 1/100 to 1/1,000 There is direct evidence or substantial indirect evidence to suggest that failure has initiated or is likely to occur.
High 1/1,000 to 1/10,000
The fundamental condition or defect is known to exist; indirect evidence suggests it is plausible; and key evidence is weighted more heavily toward “more likely” than “less likely.”
Moderate 1/10,000 to 1/100,000
The fundamental condition or defect is known to exist; indirect evidence suggests it is plausible; and key evidence is weighted more heavily toward “less likely” than “more likely.”
Low 1/100,000 to 1/1,000,000
The possibility cannot be ruled out, the fundamental condition or defect is postulated. Evidence indicates it is very unlikely.
Very Low 1/1,000,000 to 10,000,000
The possibility cannot be ruled out, but there is no compelling evidence to suggest it has occurred or that a condition or flaw exists that could lead to initiation.
Remote More remote (less) than 1/10,000,000
Several events must occur concurrently or in series to cause failure, and most, if not all, have negligible likelihood such that the failure likelihood is negligible.
from FERC, 2018

Example of Periodic (Level 2) Risk Analysis
Matrix for Societal Incremental Life Safety
from FERC Risk-Informed Decision Making for Dam Safety, Periodic (Level 2) Risk Analysis Procedures,
DRAFT, Version 1.1, June 2018

Example Use of Periodic (Level 2) Risk
Analysis Matrix for Evaluating Risk
Reduction Measures
Adapted from FERC Risk-Informed Decision Making for Dam Safety, Periodic (Level 2) Risk Analysis
Procedures, DRAFT, Version 1.1, June 2018
Measure 1
Measure 2
Measure 3
Existing Hydrologic Risk

Presentation Outline Background
• Review: Purpose of the CNA• Risk-Informed Decision Making Approach• Ongoing Independent Level 2 Risk Analysis• Need for CNA Existing Conditions Assessment
Overview of CNA Existing Conditions Assessment• PFM Development and Evaluation• Examples of PFM Development• Comparisons of Estimated PFM Likelihoods with L2RA Estimates• Preliminary Results to Date
Update on CNA PFM Development and CNA Existing Conditions Assessment

Congressional Mandate for Level 2 Risk Analysis as part of Part12D Safety Review of Oroville Dam
HR 5895 CONFERENCE REPORT – September 20, 2018

Update on Level 2 Risk Analysis and CNA Existing Conditions Assessment
from Section I-4 Semi-Quantitative Risk Analysis, USBR/USACE Best Practices (04-13-15)

Level 2 Risk Analysis
Organization, Leadership, and Participants: Independent Team Participants include experts from 9 different consulting firms and
agencies include: Robin Fell (Geotechnical) University of New South Wales, Australia David Paul (Geotechnical) HDR (formerly USACE Risk Management Center) Mark Stanley (Geotechnical) HDR Dan Osmun (Geotechnical) HDR (formerly USBR) Elena Sossenkina (Geotechnical) HDR Keith Kelson (Geology/Seismology) USACE Risk Management Center Chris Hitchcock (Geology/Seismology) Lettis Consultants International Dina Hunt (Geology/Seismology) Gannett Fleming Bill Cole (Geology) Sage Engineers Alex Bjelica (Structural) Black & Veatch Keith Moen (Structural) HDR Phoebe Percell (Structural) HDR (formerly USBR) Todd Schellhase (Structural) Black & Veatch Tom Hepler (Structural) Schnabel Engineering (formerly USBR) Nathan Pringle (Hydrology/Hydraulics) HDR Paul Rischer (Hydrology/Consequences) HDR (formerly USACE Risk Management Center) Jason Needham (Consequences) USACE Risk Management Center Joe Goldstein (Consequences) Geosyntec (formerly USACE)

Level 2 Risk Analysis
Organization, Leadership, and Participants: DWR Subject Matter Experts/Contributors provide design, construction, and
performance information – participate in discussions and initial rankings of risk, but not in final Independent Evaluation – include:
Leslie Harder (Geotechnical) HDR (formerly DWR) Mitch Tyler (Geotechnical) DWR – DOE Ryan Abernathy (Civil/Geotechnical) DWR - DOE Daniel Cimini (Civil/Geotechnical) DWR - DOE Holly Nichols (Geology) DWR – Project Geology Nick Hightower (Geology) DWR – Project Geology Sean Dunbar (Geology) DWR – Project Geology Art Carleton (Structural) DWR – DOE Cody Kimball (Structural) DWR – DOE Kenny Dosanjh (Structural) HDR (on behalf of DWR) Dustin Jones (Hydrology/Hydraulics) DWR – Project Operations CNA Task 2 Lead David Panec (Performance/Surveillance) DWR – Dam Safety Branch CNA Task 6 Lead Paul Dunlap (Performance/Surveillance) DWR – Dam Safety Branch Gina House (Operations) DWR – Oroville Field Division Operations Clint Womack (Operations) DWR – Oroville Field Division Operations Jeff House (Operations) DWR – Oroville Field Division Plant Maintenance

Level 2 Risk Analysis
Organization, Leadership, and Participants: Oversight provided by FERC, USACE, and DSOD staff, as well as by Eric Halpin,
former Chief of Levee and Dam Safety for United States Army Corps of Engineers -participate in discussions, but do not vote on risk determinations - include:
Eric Halpin Halpin Consulting (formerly Chief of Levee and Dam Safety, USACE) Steven Townsley USACE Risk Management Center Frank Blackett FERC – Regional Engineer Doug Boyer FERC – National Risk Analysis Lead Vinh Tran FERC Dustin Smith FERC Eric Kennedy FERC Daniel Meyersohn DSOD Bill Pennington DSOD Wallace Lam DSOD Robert Jaeger DSOD Harpreet Hansra DSOD
Level 2 Risk Analysis
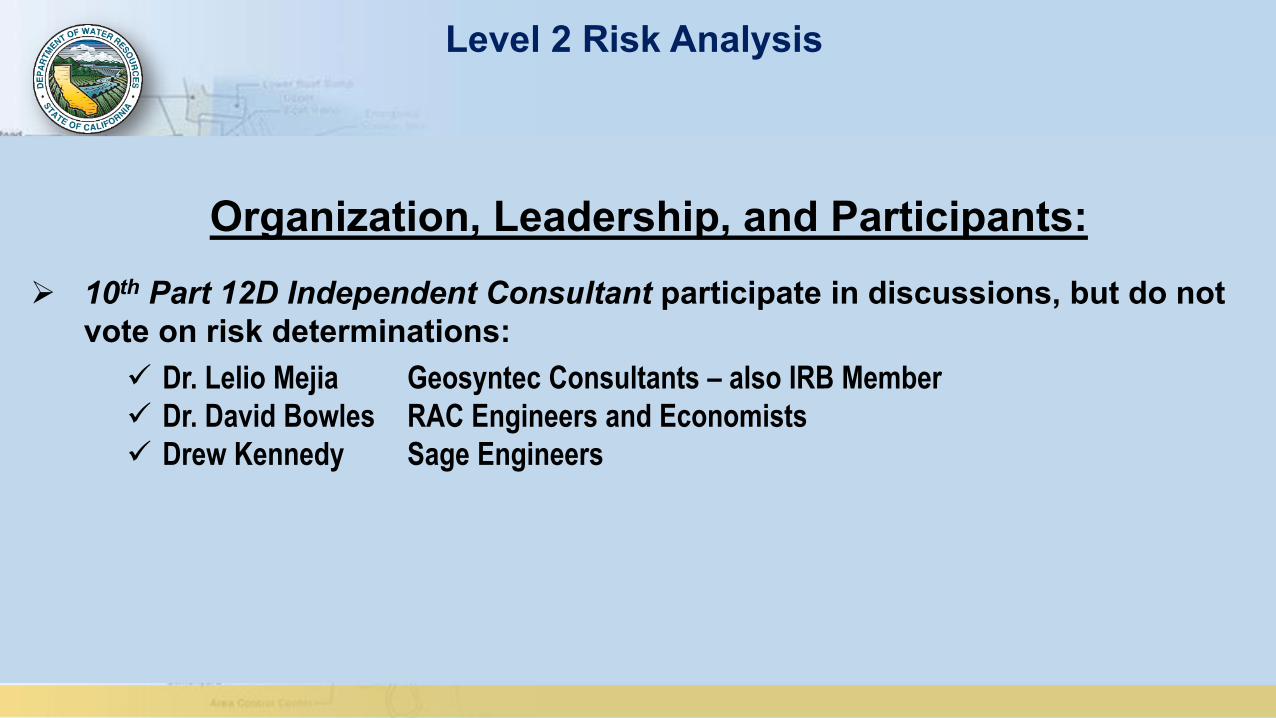
Organization, Leadership, and Participants: 10th Part 12D Independent Consultant participate in discussions, but do not
vote on risk determinations: Dr. Lelio Mejia Geosyntec Consultants – also IRB Member Dr. David Bowles RAC Engineers and Economists Drew Kennedy Sage Engineers

Level 2 Risk Analysis
Organization, Leadership, and Participants: Observers include CNA Task Team Leads and IRB members – generally do
not participate in discussions or vote on risk determinations - include: Sergio Escobar DWR - CNA Project Manager David Ford HDR - CNA Project Integration Team Craig Hall GEI - CNA Task 1 Lead Bob Filgas HDR - CNA Task 3 Lead Chris Krivanec HDR - CNA Task 4 Lead Bailey Johnson HDR - CNA Task 4 Asst. Lead Tim Wehling DWR - CNA Task 5 Lead Don Walker DWR - O&M Asset Management
Daniel Wade IRB Member

Update on Level 2 Risk Analysis and CNA Existing Conditions Assessment
Presentation Outline Background
• FERC Part 12D 5-year Review by Independent Consultant• Potential Failure Mode Analysis• Congressional Mandate for Independent Level 2 Risk Analysis
Overview of Ongoing Level 2 Risk Analysis• Organization, Leadership, Participants• General Approach and Methods• Status/Accomplishments to Date – Revised Schedule
CNA Existing Conditions Assessment

PFM No. No. Dam PFM Description Loading Component Mechanism
CNA Task Team
PFM Group (A, B, C, D)
Previous Category Submitter
1 Oroville DamCBND: Earthquake breaks bond between core block and foundation, resulting in seepage and piping of core material.
Earthquake EmbankmentStructural Failure/Internal Erosion
5
2 Oroville DamCBND: Earthquake induced ground motion cracks through grout curtain allowing concentrated seepage along foundation and rock interface.
Earthquake EmbankmentInternal Erosion 5
3 Oroville Dam CBND: Earthquake cracks seepage barrier dam. Earthquake EmbankmentInternal Erosion 5
4 Oroville DamCBND: Landslide occurs on the reservoir rim during earthquake creating wave in reservoir.
Earthquake Embankment Landslide 55 Oroville Dam
CBND: Displacement / rupture along one of the existing shears in the dam foundation during seismic event.
Earthquake EmbankmentFoundation Stability 5
6 Oroville Dam CBND: Seismic damage to site access roads and bridges. Earthquake EmbankmentDam Access Issues 5
7 Oroville DamCBND: Seiche Occurs During Seismic Event Resulting in Overtopping of Dam.
Earthquake Embankment Overtopping 5
8 Oroville DamDuring PMF event, wind and wave run-up overtop the dam causing erosion of the crest down to static water line initiating overtopping breach.
Hydrologic Embankment Erosion 5 A P. Risher
9 Oroville DamRupture in domestic water line crossing the Dam Crest during high reservoir levels causes saturation of fill materials and leads to erosion.
Hydrologic EmbankmentComponent failure 5 C. Womack
10 H-3 Oroville DamBreach near dam crest under high reservoir conditions due to erosion of fill at the right abutment contact with FCO structure.
Hydrologic Embankment Erosion 5 2
11 Oroville DamCBND: Canyon Dam (Lake Almanor) upstream of Oroville Dam fails during PMF event in Feather River Basin. Leads to overtopping of Oroville Dam.
Hydrologic Embankment Overtopping 5
12 Oroville DamInternal erosion of fines from seepage barrier exiting into transition zone 2a due to imperfect filter compatibility.
Normal EmbankmentInternal Erosion 5 D. Panec
13 Oroville DamCanyon Dam (Lake Almanor) upstream of Oroville Dam in Feather River Basin fails during normal loads, which leads to overtopping of Oroville Dam (variation of #4).
Normal Embankment Overtopping 5 A T. Hepler
14 Oroville DamToe Weir drain pipe becomes clogged, dam seepage cannot exit causing seepage to exit through dam fill materials
Normal EmbankmentSlope Instability 5 C. Womack
171 Pre-Workshop PFMs Considered in Previous PFMA Workshops and Brainstorming Ideas Submitted by
Level 2 Workshop Participants
35 PFMs (1 - 35) for Embankments19 PFMs (36 – 52, 116, 117) Emergency Spillway64 PFMs (53 – 115, 118) for FCO53 PFMs (119 – 171) for Hyatt, Palermo, and RVOS outlets171 PFMs Total
Some PFMs – Previously Considered But Not Developed (CBND)
Additional PFMs added during Level 2 Risk Analysis Workshop Sessions

Assigning Likelihood/Annual Probability of Failure for PFMs in Oroville Level 2 Risk Analysis
DO NOT MAKE ENTRIES IN RISK MATRIXMake entries in the APF and Incremental Life- Loss Vectors if you judge this PFM to be physically possible
APFFailure
Likelihood Category
APF Vector
APF
10-3 - 10-2 Very High
10-4 - 10-3 High
10-5 - 10-4 Moderate
10-6 - 10-5 Low 0.09 0.01 0.10
10-7 - 10-6 Very Low 0.72 0.08 0.80
< 10-7 Remote 0.09 0.01 0.10
Level 1 Level 2 Level 3 Level 4 Level 5
0 - 1 1 - 10 10 - 100 100 - 1,000 1,000 - 10,000 > 10,000 a) 1.00
0.90 0.10 b) 1.00Incremental Life- Loss Vector
0.00 c) 1.00
Level 2 Risk Analysis Matrix - Breach
Consequence Level
Incremental Life Loss Consequence Category
Incremental Life Loss
If you judge this PFM to be not physically possible enter 1 (and do not make entries in APF and Incremental
Life- Loss Vectors):
a) - c) must each sum to 1.00 (Except if PFM judged not physically possible in which case b) must be zero)

Presentation Outline Background
• Review: Purpose of the CNA• Risk-Informed Decision Making Approach• Ongoing Independent Level 2 Risk Analysis• Need for CNA Existing Conditions Assessment
Overview of CNA Existing Conditions Assessment• PFM Development and Evaluation• Examples of PFM Development• Comparisons of Estimated PFM Likelihoods with L2RA Estimates• Preliminary Results to Date
Update on CNA PFM Development and CNA Existing Conditions Assessment

Deferred Level 2 RA Schedule no longer meets CNA Schedule needs –CNA Task Teams need to understand higher risks sooner in order toidentify risk reduction opportunities and potential risk reductionmeasures
Need for CNA Existing Conditions Assessment

Update on Level 2 Risk Analysis
Dates Workshop Subject Matter
January 22 – 25 Parish Camp, Bidwell Bar Canyon, Main Embankment
January 28 –February 1 Main Embankment
February 27 –March 7
Hyatt Intake, FCO Headworks, Hyatt PP,
Palermo Tunnel, and RVOS
March 18 – 22Post-Construction FCOChute and Emergency
Spillway
Dates Workshop Subject MatterJanuary 22 – 25 Parish Camp, Bidwell Bar Canyon, Main Embankment
January 28 – February 1 Main Embankment
February 27 – March 7 Hyatt Intake, FCO Headworks, Hyatt PP, Palermo Tunnel, and RVOS
March 18 – 22 Embankments – Week 3
May 8 – 10 Structural – Week 3
June 24 - 28 Systems and Human Factors
July 8 - 12 Non-Life LossJuly 29 – August 2 Spillways
Original Schedule Revised Schedule

Comprehensive Needs Assessment WorkplanDRAFT September 2018

Deferred Level 2 RA Schedule no longer meets CNA Schedule needs –CNA Task Teams need to understand higher risks sooner in order toidentify risk reduction opportunities and potential risk reductionmeasures
Level 2 RA is largely focused on Ultimate Failure conditions for eachPFM with an uncontrolled release of the reservoir – e.g. dam breach orloss of FCO Headworks structure – CNA ECA looks at multiple conditionstates for each PFM
Need for CNA Existing Conditions Assessment
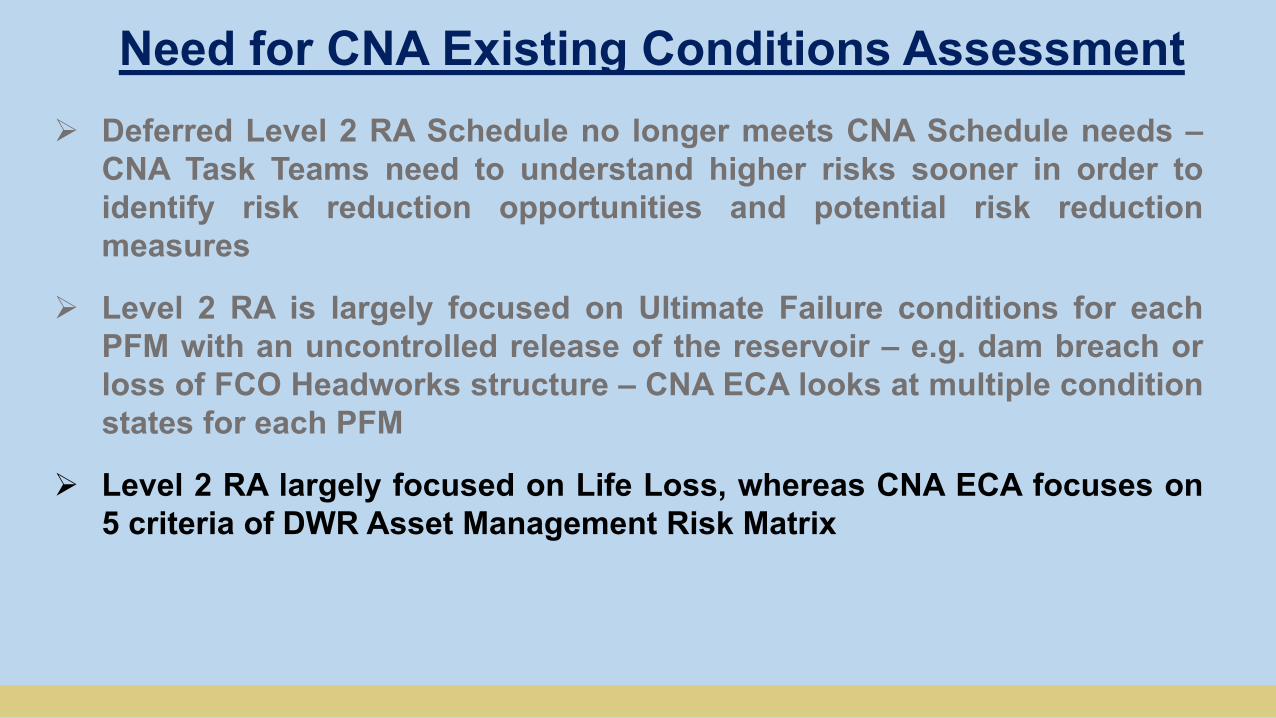
Deferred Level 2 RA Schedule no longer meets CNA Schedule needs –CNA Task Teams need to understand higher risks sooner in order toidentify risk reduction opportunities and potential risk reductionmeasures
Level 2 RA is largely focused on Ultimate Failure conditions for eachPFM with an uncontrolled release of the reservoir – e.g. dam breach orloss of FCO Headworks structure – CNA ECA looks at multiple conditionstates for each PFM
Level 2 RA largely focused on Life Loss, whereas CNA ECA focuses on5 criteria of DWR Asset Management Risk Matrix
Level 2 RA will not consider risk reduction opportunities or riskreduction measures – CNA will – so having the same risk estimators willhelp ensure consistency
Need for CNA Existing Conditions Assessment

How CNA Existing Conditions Assessment Benefits from Level 2 Risk Assessment
CNA ECA is intended as a Preliminary Assessment of Existing Conditions to avoid further delays in CNA Project Schedule
Will make use of available Level 2 RA results and products
Will utilize additional Level 2 RA results as they become available and circle back to Level 2 RA results when completed
At the end of both processes, results are expected to be consistent with each other, particularly on PFMs and Life Loss Consequences

Presentation Outline Background
• Review: Purpose of the CNA• Risk-Informed Decision Making Approach• Ongoing Independent Level 2 Risk Analysis• Need for CNA Existing Conditions Assessment
Overview of CNA Existing Conditions Assessment• PFM Development and Evaluation• Examples of PFM Development• Comparisons of Estimated PFM Likelihoods with L2RA Estimates• Preliminary Results to Date
Update on CNA PFM Development and CNA Existing Conditions Assessment
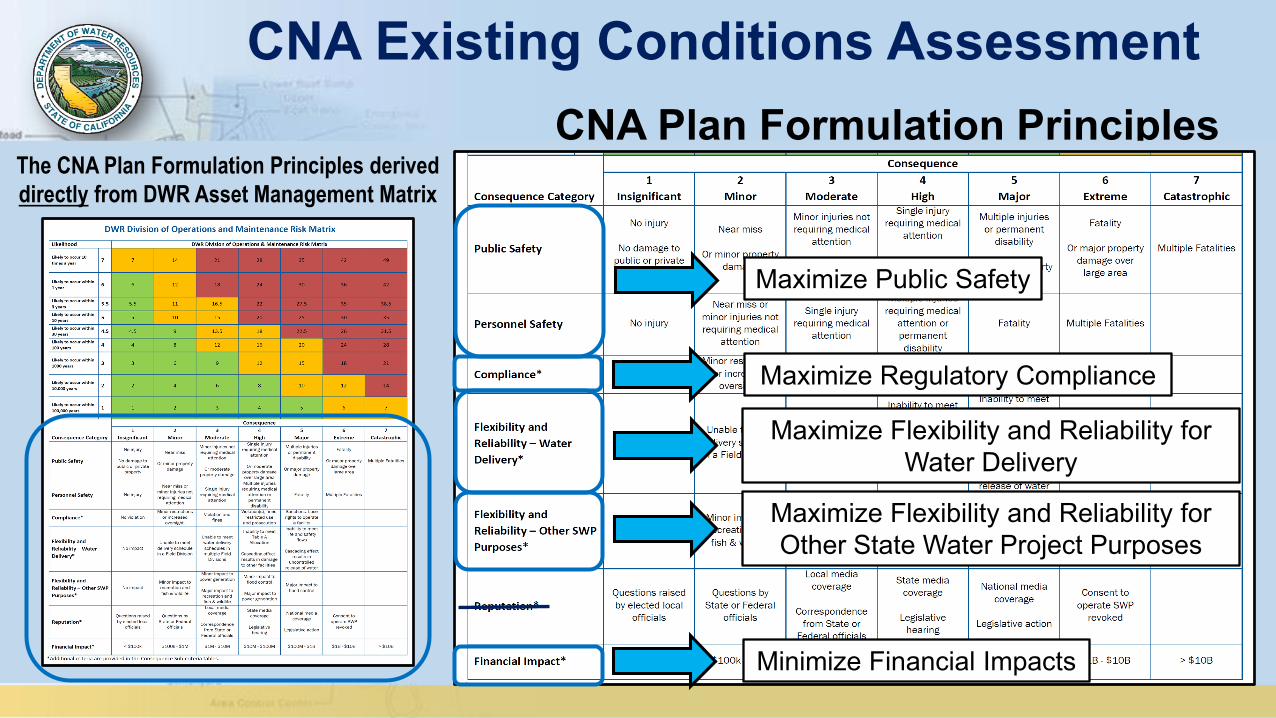
CNA Existing Conditions AssessmentCNA Plan Formulation Principles
The CNA Plan Formulation Principles derived directly from DWR Asset Management Matrix
Maximize Public Safety
Maximize Regulatory Compliance
Maximize Flexibility and Reliability for Water Delivery
Maximize Flexibility and Reliability for Other State Water Project Purposes
Minimize Financial Impacts
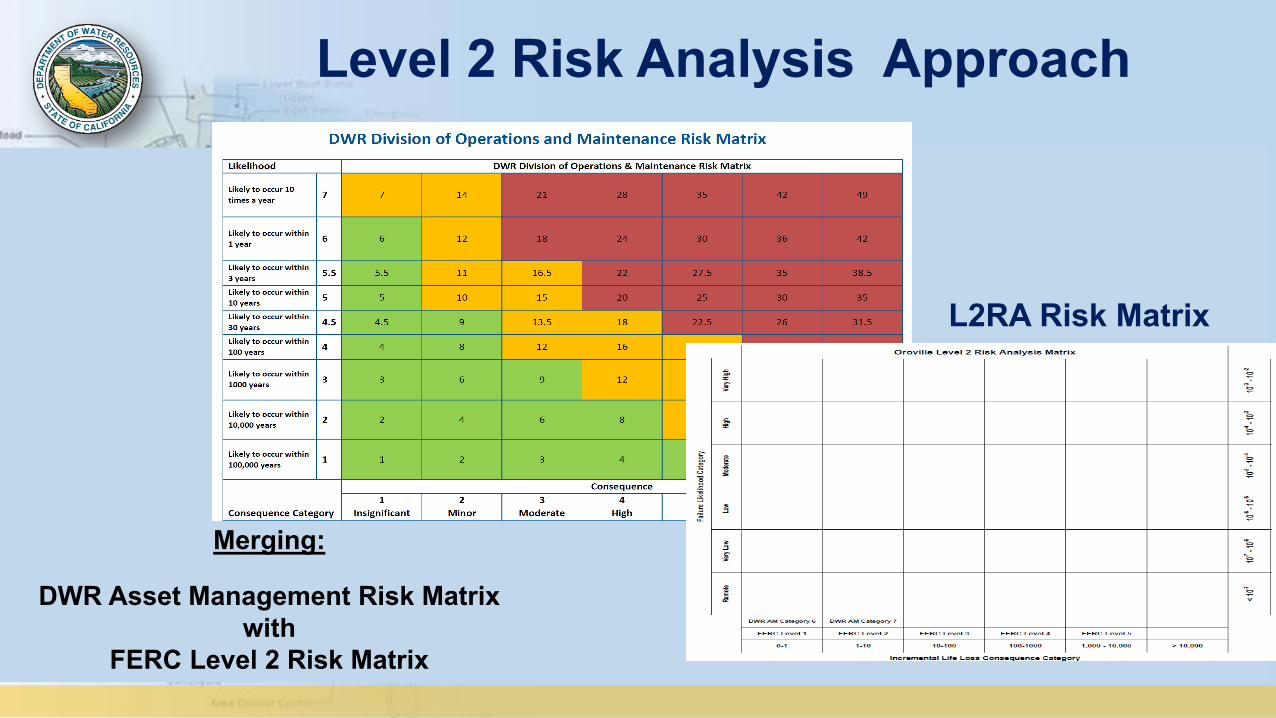
Merging:
DWR Asset Management Risk Matrixwith
FERC Level 2 Risk Matrix
Level 2 Risk Analysis Approach
L2RA Risk Matrix

Comprehensive Needs Assessment –Extension of DWR Asset Management Risk Matrix

Comprehensive Needs Assessment –Extension of DWR Asset Management Risk Matrix
Original DWR AM Risk Matrix

Comprehensive Needs Assessment –Extension of DWR Asset Management Risk Matrix
L2RA Risk Matrix

Comprehensive Needs Assessment –Extension of DWR Asset Management Risk Matrix
Tolerable Risk Guidelines for Dam Safety from FERC and other Federal Agencies

PFM No. No. Dam PFM Description Loading Component Mechanism
CNA Task Team
PFM Group (A, B, C, D)
Previous Category Submitter
1 Oroville DamCBND: Earthquake breaks bond between core block and foundation, resulting in seepage and piping of core material.
Earthquake EmbankmentStructural Failure/Internal Erosion
5
2 Oroville DamCBND: Earthquake induced ground motion cracks through grout curtain allowing concentrated seepage along foundation and rock interface.
Earthquake EmbankmentInternal Erosion 5
3 Oroville Dam CBND: Earthquake cracks seepage barrier dam. Earthquake EmbankmentInternal Erosion 5
4 Oroville DamCBND: Landslide occurs on the reservoir rim during earthquake creating wave in reservoir.
Earthquake Embankment Landslide 55 Oroville Dam
CBND: Displacement / rupture along one of the existing shears in the dam foundation during seismic event.
Earthquake EmbankmentFoundation Stability 5
6 Oroville Dam CBND: Seismic damage to site access roads and bridges. Earthquake EmbankmentDam Access Issues 5
7 Oroville DamCBND: Seiche Occurs During Seismic Event Resulting in Overtopping of Dam.
Earthquake Embankment Overtopping 5
8 Oroville DamDuring PMF event, wind and wave run-up overtop the dam causing erosion of the crest down to static water line initiating overtopping breach.
Hydrologic Embankment Erosion 5 A P. Risher
9 Oroville DamRupture in domestic water line crossing the Dam Crest during high reservoir levels causes saturation of fill materials and leads to erosion.
Hydrologic EmbankmentComponent failure 5 C. Womack
10 H-3 Oroville DamBreach near dam crest under high reservoir conditions due to erosion of fill at the right abutment contact with FCO structure.
Hydrologic Embankment Erosion 5 2
11 Oroville DamCBND: Canyon Dam (Lake Almanor) upstream of Oroville Dam fails during PMF event in Feather River Basin. Leads to overtopping of Oroville Dam.
Hydrologic Embankment Overtopping 5
12 Oroville DamInternal erosion of fines from seepage barrier exiting into transition zone 2a due to imperfect filter compatibility.
Normal EmbankmentInternal Erosion 5 D. Panec
13 Oroville DamCanyon Dam (Lake Almanor) upstream of Oroville Dam in Feather River Basin fails during normal loads, which leads to overtopping of Oroville Dam (variation of #4).
Normal Embankment Overtopping 5 A T. Hepler
14 Oroville DamToe Weir drain pipe becomes clogged, dam seepage cannot exit causing seepage to exit through dam fill materials
Normal EmbankmentSlope Instability 5 C. Womack
171 Pre-Workshop PFMs Considered in Previous PFMA Workshops and Brainstorming Ideas Submitted by
Level 2 Workshop Participants
35 PFMs (1 - 35) for Embankments19 PFMs (36 – 52, 116, 117) Emergency Spillway64 PFMs (53 – 115, 118) for FCO53 PFMs (119 – 171) for Hyatt, Palermo, and RVOS outlets171 PFMs Total
Some PFMs – Previously Considered But Not Developed (CBND)
Additional PFMs added during Level 2 Risk Analysis Workshop Sessions

CNA Existing Conditions AssessmentPFM Development
Potential Failure Mode Analyses (PFMA): Consideration and Development of PFMs – Example: Progression of Internal Erosion PFM
Reservoir at or above threshold levelInitiation – Erosion starts
Continuation – Unfiltered or inadequately filtered exit existsProgression – Continuous stable roof and/or sidewalls
Progression – Constriction or upstream zone fails to limit flowsProgression – No self-healing by upstream zone
Unsuccessful detection and interventionDam breaches (uncontrolled release of reservoir)
from “Best Practices in Dam and Levee Safety Risk Analysis,” United States Bureau of Reclamation and Army Corps of Engineers

Past Focus on only
“Uncontrolled Release of
Water”
from FERC Part 12D Training Workshop,
January 2015

Independent Forensic Team - Lessons Learned
from Independent Forensic Team Final Report, Pages 78-79, January 2018
In practice today, PFMAs appear to be limited mainly to consideration ofpotential failures modes that lead to uncontrolled release of the reservoir.This can lead to potential failure modes with significant consequences shortof reservoir release being ruled out of further consideration. In the case ofOroville Dam, the 2014 PFMA team essentially identified the two failuresmodes which initiated in February 2017, but ruled them out in large partbecause they were judged to be unlikely to lead to release of stored reservoirwater….
…By ruling out these failure modes, they may have been removed from anyfurther consideration in subsequent studies including future PFMAs.
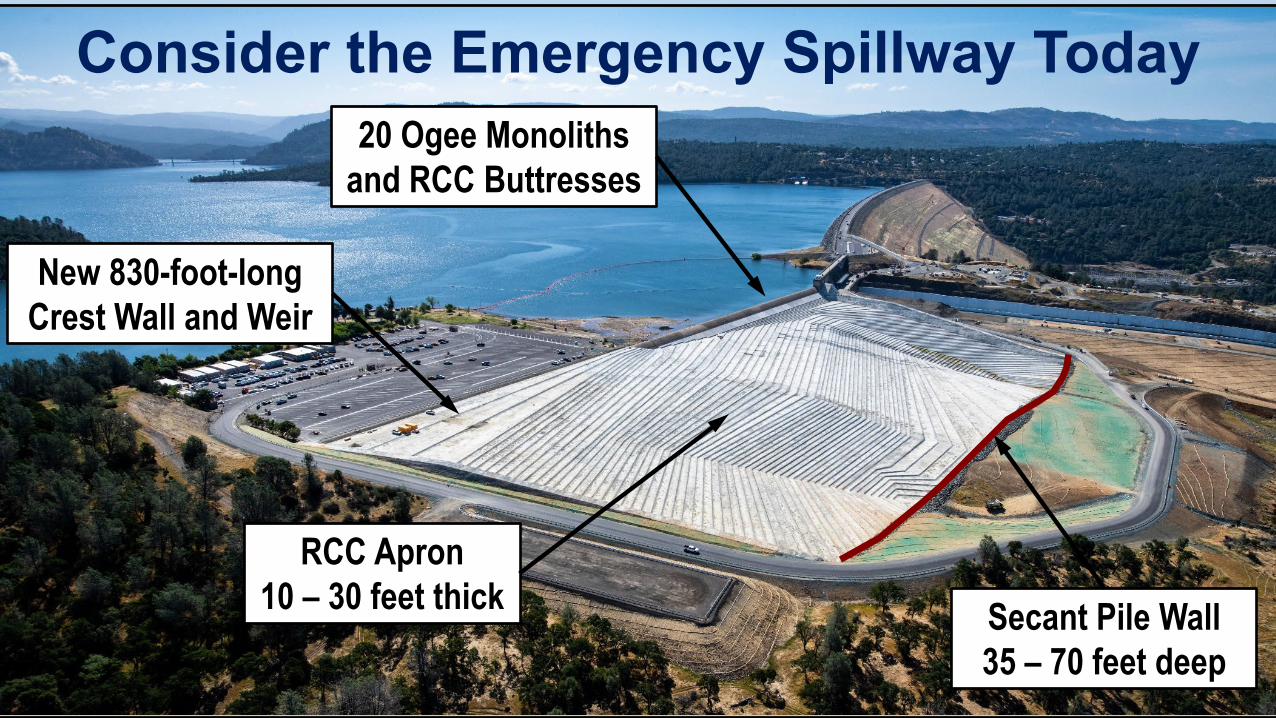
Consider the Emergency Spillway Today20 Ogee Monoliths
and RCC Buttresses
RCC Apron10 – 30 feet thick Secant Pile Wall
35 – 70 feet deep
New 830-foot-long Crest Wall and Weir

Consider the Emergency Spillway TodayPFM T1-6.1a:
Ultimate Failure State:Failure of Secant Pile Wall, RCC Apron, and the
6 Large Monoliths – Leading to Uncontrolled Release, Significant Incremental Downstream Damages

Consider the Emergency Spillway TodayPFM T1-6.1a:
Ultimate Failure State:Failure of Secant Pile Wall, RCC Apron, and 6 Monoliths
– Leading to Uncontrolled Release, Significant Incremental Downstream Damages
PFM T1-6.1b: Heavy Damage State:
Failure of Secant Pile Wall and RCC Apron, but Monoliths remain intact – No Uncontrolled Release, No Significant Incremental Downstream Damages
PFM T1-6.1c: Light Damage State:
Very Localized Failure of Secant Pile Wall and Damage to RCC Apron, but Monoliths remain intact
– No Uncontrolled Release, No Significant Incremental Downstream Damages

T1-6 Risk Summary – Public Safety and Life LossPFM No.T1-6
Total likelihood of failure1
Insignificant2
Minor3
Moderate4 High
5 Major
6 Extreme, Life
loss 0-1
7 Catastrophic, Life loss 1-10
8 Life loss 10-100
9 Life loss 100-
1,000
10 Life loss 1,000-
10,000
11 Life loss >
10,000Likely to occur 10 times a year 10 20 30 40 50 60 70 80 90 100 110
Likely to occur within 1 year 9 18 27 36 45 54 63 72 81 90 99
Likely to occur within 3 years 8.5 17 25.5 34 42.5 51 59.5 68 76.5 85 93.5
Likely to occur within 10 years 8 16 24 32 40 48 56 64 72 80 88
Likely to occur within 30 years 7.5 15 22.5 30 37.5 45 52.5 60 67.5 75 82.5
Likely to occur within 100 years 7 14 21 28 35 42 49 56 63 70 77
Likely to occur within 1,000 years 6 12 18 24 30 36 42 48 54 60 66
Likely to occur within 10,000 years 5 10 15 20 25 30 35 40 45 50 55
Likely to occur within 100,000 years 4 8 12 16 20 24 28 32 36 40 44
Likely to occur within 1,000,000 years 3 6 9 12 15 18 21 24 27 30 33
Likely to occur within 10,000,000 years 2 4 6 8 10 12 14 16 18 20 22
Likely to occur less often than 10,000,000 years 1 2 3 4 5 6 7 8 9 10 11
PFM DescriptionPMF and 100k cfs loading, erosion rock d/s of secant pile wall, headward cutting/erosion through secant pile wall and RCC apron. Erosion destabilizes ES monoliths 15-20.
Risk Matrix: Public Safety & Life Loss
Preliminary
T1-6.1c&2c
T1-6.3

T1-6 Risk Summary – Regulatory CompliancePFM No.T1-6
Total likelihood of failure1
Insignificant2
Minor3
Moderate4 High
5 Major
6 Extreme, Life
loss 0-1
7 Catastrophic, Life loss 1-10
8 Life loss 10-100
9 Life loss 100-
1,000
10 Life loss 1,000-
10,000
11 Life loss >
10,000Likely to occur 10 times a year 10 20 30 40 50 60 70 80 90 100 110
Likely to occur within 1 year 9 18 27 36 45 54 63 72 81 90 99
Likely to occur within 3 years 8.5 17 25.5 34 42.5 51 59.5 68 76.5 85 93.5
Likely to occur within 10 years 8 16 24 32 40 48 56 64 72 80 88
Likely to occur within 30 years 7.5 15 22.5 30 37.5 45 52.5 60 67.5 75 82.5
Likely to occur within 100 years 7 14 21 28 35 42 49 56 63 70 77
Likely to occur within 1,000 years 6 12 18 24 30 36 42 48 54 60 66
Likely to occur within 10,000 years 5 10 15 20 25 30 35 40 45 50 55
Likely to occur within 100,000 years 4 8 12 16 20 24 28 32 36 40 44
Likely to occur within 1,000,000 years 3 6 9 12 15 18 21 24 27 30 33
Likely to occur within 10,000,000 years 2 4 6 8 10 12 14 16 18 20 22
Likely to occur less often than 10,000,000 years 1 2 3 4 5 6 7 8 9 10 11
PFM DescriptionPMF and 100k cfs loading, erosion rock d/s of secant pile wall, headward cutting/erosion through secant pile wall and RCC apron. Erosion destabilizes ES monoliths 15-20.
Risk Matrix: Public Safety & Life Loss
Preliminary
T1-6.1c&2c
T1-6.3

T1-6 Risk Summary – SWP Water DeliveryPFM No.T1-6
Total likelihood of failure1
Insignificant2
Minor3
Moderate4 High
5 Major
6 Extreme, Life
loss 0-1
7 Catastrophic, Life loss 1-10
8 Life loss 10-100
9 Life loss 100-
1,000
10 Life loss 1,000-
10,000
11 Life loss >
10,000Likely to occur 10 times a year 10 20 30 40 50 60 70 80 90 100 110
Likely to occur within 1 year 9 18 27 36 45 54 63 72 81 90 99
Likely to occur within 3 years 8.5 17 25.5 34 42.5 51 59.5 68 76.5 85 93.5
Likely to occur within 10 years 8 16 24 32 40 48 56 64 72 80 88
Likely to occur within 30 years 7.5 15 22.5 30 37.5 45 52.5 60 67.5 75 82.5
Likely to occur within 100 years 7 14 21 28 35 42 49 56 63 70 77
Likely to occur within 1,000 years 6 12 18 24 30 36 42 48 54 60 66
Likely to occur within 10,000 years 5 10 15 20 25 30 35 40 45 50 55
Likely to occur within 100,000 years 4 8 12 16 20 24 28 32 36 40 44
Likely to occur within 1,000,000 years 3 6 9 12 15 18 21 24 27 30 33
Likely to occur within 10,000,000 years 2 4 6 8 10 12 14 16 18 20 22
Likely to occur less often than 10,000,000 years 1 2 3 4 5 6 7 8 9 10 11
PFM DescriptionPMF and 100k cfs loading, erosion rock d/s of secant pile wall, headward cutting/erosion through secant pile wall and RCC apron. Erosion destabilizes ES monoliths 15-20.
Risk Matrix: Public Safety & Life Loss
Preliminary
T1-6.1b&2b
T1-6.1c&2c
T1-6.3

T1-6 Risk Summary – Other SWP PurposesPFM No.T1-6
Total likelihood of failure1
Insignificant2
Minor3
Moderate4 High
5 Major
6 Extreme, Life
loss 0-1
7 Catastrophic, Life loss 1-10
8 Life loss 10-100
9 Life loss 100-
1,000
10 Life loss 1,000-
10,000
11 Life loss >
10,000Likely to occur 10 times a year 10 20 30 40 50 60 70 80 90 100 110
Likely to occur within 1 year 9 18 27 36 45 54 63 72 81 90 99
Likely to occur within 3 years 8.5 17 25.5 34 42.5 51 59.5 68 76.5 85 93.5
Likely to occur within 10 years 8 16 24 32 40 48 56 64 72 80 88
Likely to occur within 30 years 7.5 15 22.5 30 37.5 45 52.5 60 67.5 75 82.5
Likely to occur within 100 years 7 14 21 28 35 42 49 56 63 70 77
Likely to occur within 1,000 years 6 12 18 24 30 36 42 48 54 60 66
Likely to occur within 10,000 years 5 10 15 20 25 30 35 40 45 50 55
Likely to occur within 100,000 years 4 8 12 16 20 24 28 32 36 40 44
Likely to occur within 1,000,000 years 3 6 9 12 15 18 21 24 27 30 33
Likely to occur within 10,000,000 years 2 4 6 8 10 12 14 16 18 20 22
Likely to occur less often than 10,000,000 years 1 2 3 4 5 6 7 8 9 10 11
PFM DescriptionPMF and 100k cfs loading, erosion rock d/s of secant pile wall, headward cutting/erosion through secant pile wall and RCC apron. Erosion destabilizes ES monoliths 15-20.
Risk Matrix: Public Safety & Life Loss
Preliminary
T1-6.1a&2aT1-6.1b&2b
T1-6.1c&2c
T1-6.3
T1-6.3

T1-6 Risk Summary – Financial ImpactPFM No.T1-6
Total likelihood of failure1
Insignificant2
Minor3
Moderate4 High
5 Major
6 Extreme, Life
loss 0-1
7 Catastrophic, Life loss 1-10
8 Life loss 10-100
9 Life loss 100-
1,000
10 Life loss 1,000-
10,000
11 Life loss >
10,000Likely to occur 10 times a year 10 20 30 40 50 60 70 80 90 100 110
Likely to occur within 1 year 9 18 27 36 45 54 63 72 81 90 99
Likely to occur within 3 years 8.5 17 25.5 34 42.5 51 59.5 68 76.5 85 93.5
Likely to occur within 10 years 8 16 24 32 40 48 56 64 72 80 88
Likely to occur within 30 years 7.5 15 22.5 30 37.5 45 52.5 60 67.5 75 82.5
Likely to occur within 100 years 7 14 21 28 35 42 49 56 63 70 77
Likely to occur within 1,000 years 6 12 18 24 30 36 42 48 54 60 66
Likely to occur within 10,000 years 5 10 15 20 25 30 35 40 45 50 55
Likely to occur within 100,000 years 4 8 12 16 20 24 28 32 36 40 44
Likely to occur within 1,000,000 years 3 6 9 12 15 18 21 24 27 30 33
Likely to occur within 10,000,000 years 2 4 6 8 10 12 14 16 18 20 22
Likely to occur less often than 10,000,000 years 1 2 3 4 5 6 7 8 9 10 11
PFM DescriptionPMF and 100k cfs loading, erosion rock d/s of secant pile wall, headward cutting/erosion through secant pile wall and RCC apron. Erosion destabilizes ES monoliths 15-20.
Risk Matrix: Public Safety & Life Loss
Preliminary
T1-6.1a&2aT1-6.1b&2b
T1-6.1c&2c
T1-6.3
Total likelihood of failure1
Insignificant2
Minor3
Moderate4 High
5 Major
6 Extreme
7 Catastrophic
8 $100B - $250B
9 $250B - $500B
10 $500B - $1T
11 > $1T
Likely to occur 10 times a year 10 20 30 40 50 60 70 80 90 100 110
Likely to occur within 1 year 9 18 27 36 45 54 63 72 81 90 99
Likely to occur within 3 years 8.5 17 25.5 34 42.5 51 59.5 68 76.5 85 93.5
Likely to occur within 10 years 8 16 24 32 40 48 56 64 72 80 88
Likely to occur within 30 years 7.5 15 22.5 30 37.5 45 52.5 60 67.5 75 82.5
Likely to occur within 100 years 7 14 21 28 35 42 49 56 63 70 77
Likely to occur within 1,000 years 6 12 18 24 30 36 42 48 54 60 66
Likely to occur within 10,000 years 5 10 15 20 25 30 35 40 45 50 55
Likely to occur within 100,000 years 4 8 12 16 20 24 28 32 36 40 44
Likely to occur within 1,000,000 years 3 6 9 12 15 18 21 24 27 30 33
Likely to occur within 10,000,000 years 2 4 6 8 10 12 14 16 18 20 22
Likely to occur less often than 10,000,000 years 1 2 3 4 5 6 7 8 9 10 11
Risk Matrix: Financial ImpactPreliminary
T1-6.3
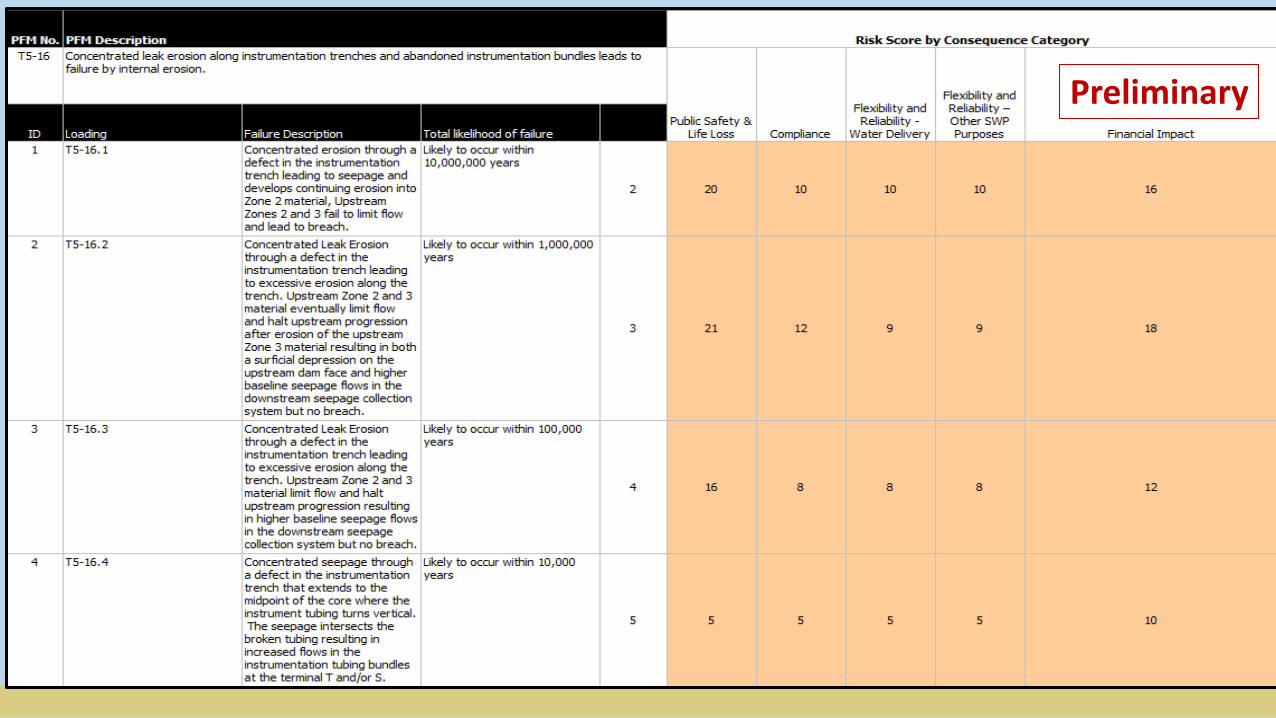
T5-16 – Risk Summary Preliminary

T5-16 – Risk Summary
Focus of L2RA Evaluations
Preliminary

CNA Existing Conditions AssessmentStatus
Over 372 PFMs Considered
~127 PFMs fully developed (~245 CBND)
Generally 3 to 4 Scenarios developed per PFM ~407 PFM Scenarios fully developed
(~3+ Scenarios/PFM x 127 PFMs = ~407 Scenarios)
5 Consequence Conditions Assessed per PFM Scenario ~2056 PFM Consequences fully evaluated
(~5 Consequences/Scenario x 407 Scenarios = ~2056)

Presentation Outline Background
• Review: Purpose of the CNA• Risk-Informed Decision Making Approach• Ongoing Independent Level 2 Risk Analysis• Need for CNA Existing Conditions Assessment
Overview of CNA Existing Conditions Assessment• PFM Development and Evaluation• Example of PFM Development• Comparisons of Estimated PFM Likelihoods with L2RA Estimates• Preliminary Results to Date
Update on CNA PFM Development and CNA Existing Conditions Assessment

HPS-3-A.1 – SummaryMajor landslide triggered in cut slope below Palermo Canal due to leaks in canal lining, debris buries switchyard and shuts down Hyatt PP

HPS-3-A– PFM Event Tree• HPS-3-A.1
Reservoir is above El. 640, all units in Hyatt are generating power Initiation – Water leaks from Palermo canal. Slope materials retain water, creating high pore pressure and loss of shear strength.
Continuation – Large landslide is triggered in cut slopes below Palermo Canal (Figures HPS 3A-A, B).
Progression – Large amount of landslide debris flows about 200 feet and completely buries switchyard. Switchyard is inoperable for 6-12 months and causes shutdown of Hyatt Powerplant.
• HPS-3-A.2 Moderate landslide triggered in cut slope below Palermo Canal due to leaks in canal lining-debris partially buries and shutdown
switchyard for about 4 weeks.
• HPS-3-A.3 Small slump in in cut slope below Palermo Canal due to minor leaks in canal lining- no impact on switchyard operations.
• HPS-3-A.4 Visible seepage and wet spots in cut slope below Palermo Canal due to minor leaks in canal lining- no impact to switchyard
operations.

HPS-3-A PFM Scenario Visualization

HPS-3-A– Risk Matrix
HPS-3A.1HPS-3A.2HPS-3A.3
HPS-3A.4

Presentation Outline Background
• Review: Purpose of the CNA• Risk-Informed Decision Making Approach• Ongoing Independent Level 2 Risk Analysis• Need for CNA Existing Conditions Assessment
Overview of CNA Existing Conditions Assessment• PFM Development and Evaluation• Example of PFM Development• Comparisons of Estimated PFM Likelihoods with L2RA Estimates• Preliminary Results to Date
Update on CNA PFM Development and CNA Existing Conditions Assessment

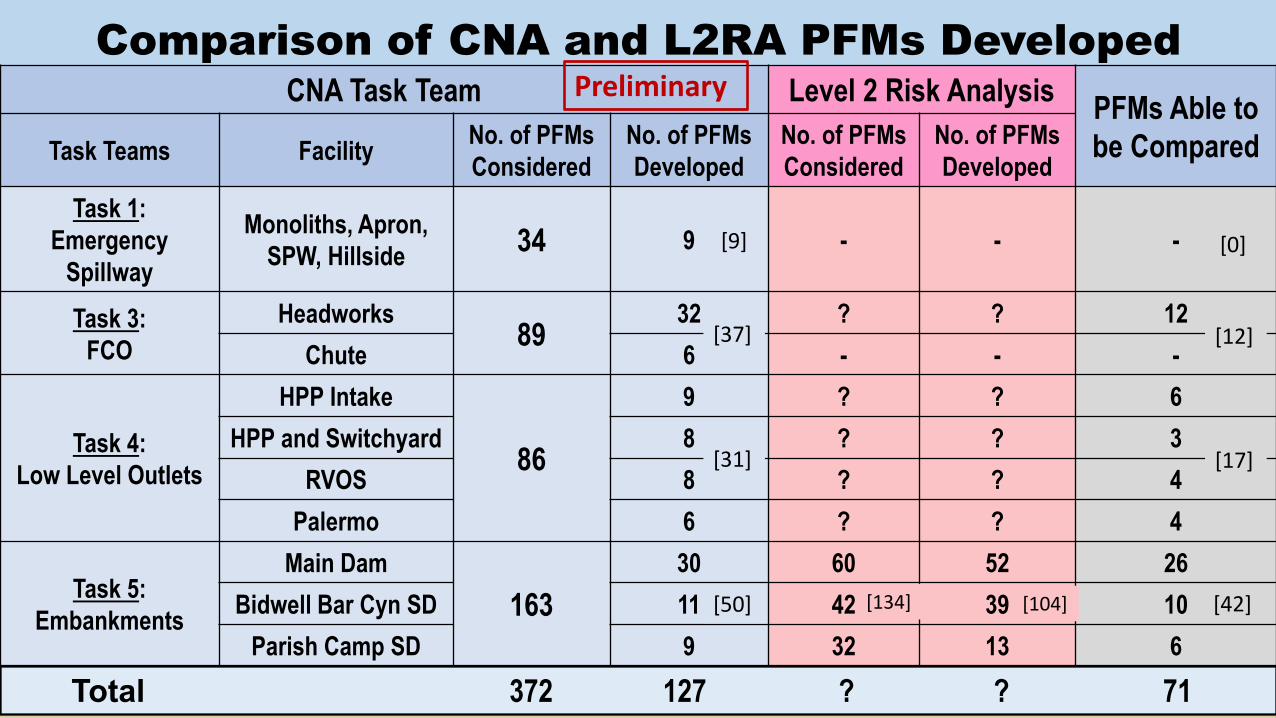
Comparison of CNA and L2RA PFMs DevelopedCNA Task Team Level 2 Risk Analysis PFMs Able to
be ComparedTask Teams Facility No. of PFMs Considered
No. of PFMs Developed
No. of PFMs Considered
No. of PFMs Developed
Task 1: Emergency
Spillway
Monoliths, Apron, SPW, Hillside 34 9
Task 3: FCO
Headworks89
31Chute 6
Task 4: Low Level Outlets
HPP Intake
86
9HPP and Switchyard 8
RVOS 8Palermo 6
Task 5:Embankments
Main Dam163
30Bidwell Bar Cyn SD 11
Parish Camp SD 9
[37]
[31]
[50]
[9]
Total 372 127
Preliminary

OROVILLE DAM COMPLE TATE DAM No. 1-48 ERC PROJECT No. 2100-CA
VEL 2 RISK ANALYSIS ORKSHOP MEETING NOTES
WELL BAR CANYON SADDLE (BCSD) 2019
Prepared By: HDR 2365 Iron Point Road, Suite 300 Folsom, CA 95630-8709
Prepared For: State of California The Natural Resources Agency EPARTMENT OF WATER RESOURCES vision of Operations and Maintenance
CEII – CRITICAL ENERGY INFRASTRUCTURE INFORMATION
DO NOT RELEASE
DRAFT
CNA Benefited from L2RA Workshop Meeting Notes
OROVILLE DAM COMPLEX TATE DAM NO. 1-48 ERC PROJECT No. 2100-CA EVEL 2 RISK ANALYSIS ORKSHOP MEETING NOTES
OD CONTROL OUTLET DWORKS 019
Prepared By: HDR 2365 Iron Point Road, Suite 300 Folsom, CA 95630-8709
Prepared For: State of California The Natural Resources Agency
DEPARTMENT OF WATER RESOURCES vision of Operations and Maintenance
CEII – CRITICAL ENERGY INFRASTRUCTURE INFORMATIO DO NOT RELEASE
DRAFT
DRAFT
OROVILLE DAM COMPLEX TATE DAM NO. 1-48 ERC PROJECT No. 2100-CA
VEL 2 RISK ANALYSIS ORKSHOP MEETING NOTES
t Powerplant and RVOS 2019
Prepared By: HDR 2365 Iron Point Road, Suite 300 Folsom, CA 95630-8709
Prepared For: State of California The Natural Resources Agency EPARTMENT OF WATER RESOURCES vision of Operations and Maintenance
CEII – CRITICAL ENERGY INFRASTRUCTURE INFORMATION DO NOT RELEASE
OROVILLE DAM COMPLE TATE DAM NO. 1-48 ERC PROJECT No. 2100-CA
VEL 2 RISK ANALYSIS ORKSHOP MEETING NOTES BANKMENTS (follow up sessi March xxx)
VILLE DAM (ORO) 019
Prepared By: HDR 2365 Iron Point Road, Suite 300 Folsom, CA 95630-8709
Prepared For: State of California The Natural Resources Agency EPARTMENT OF WATER RESOURCES vision of Operations and Maintenance
CEII – CRITICAL ENERGY INFRASTRUCTURE INFORMATION
DO NOT RELEASE
DRAFT

Challenges in Comparing CNA PFMswith L2RA PFMS
L2RA Notes represent preliminary Draft Notes, not final results No PFMs have currently been performed for Emergency Spillway or FCO
Chute by L2RA – scheduled towards the end of July Many L2RA PFMs rated simply as NEGLIGIBLE (<10-8) – considered not
really feasible or reasonable – many not considered fully developed in matrix as a result
Many CNA PFMs rated simply as REMOTE (<10-7) without estimating actual likelihood – could be much lower
Many PFMs developed by CNA and L2RA are similar, but not exactly the same – some not carried to the same point of failure
Many L2RA PFMs had likelihood estimates that ranged over 2 - 4 orders of magnitude; CNA Task Teams instructed to use just 1 order of magnitude

Comparison of CNA and L2RA PFMs DevelopedCNA Task Team Level 2 Risk Analysis PFMs Able to
be ComparedTask Teams Facility No. of PFMs Considered
No. of PFMs Developed
No. of PFMs Considered
No. of PFMs Developed
Task 1: Emergency
Spillway
Monoliths, Apron, SPW, Hillside 34 9 - -
Task 3: FCO
Headworks89
31 ? ?Chute 6 - -
Task 4: Low Level Outlets
HPP Intake
86
9 ? ?HPP and Switchyard 8 ? ?
RVOS 8 ? ?Palermo 6 ? ?
Task 5:Embankments
Main Dam163
30 60 52Bidwell Bar Cyn SD 11 42 39
Parish Camp SD 9 32 13
[37]
[31]
[50]
[9]
Total 372 127
[104][134]
? Denotes that PFMs appear to not be
finalized as Fault Tree approach
is being used without final results shown in
the notes
Preliminary
Comparison of CNA and L2RA PFMs DevelopedCNA Task Team Level 2 Risk Analysis PFMs Able to
be ComparedTask Teams Facility No. of PFMs Considered
No. of PFMs Developed
No. of PFMs Considered
No. of PFMs Developed
Task 1: Emergency
Spillway
Monoliths, Apron, SPW, Hillside 34 9 - - -
Task 3: FCO
Headworks89
32 ? ? 12Chute 6 - - -
Task 4: Low Level Outlets
HPP Intake
86
9 ? ? 6HPP and Switchyard 8 ? ? 3
RVOS 8 ? ? 4Palermo 6 ? ? 4
Task 5:Embankments
Main Dam163
30 60 52 26Bidwell Bar Cyn SD 11 42 39 10
Parish Camp SD 9 32 13 6
[37]
[31]
[50]
[9]
Total 372 127 ? ? 71
[12]
[0]
[17]
[104][134] [42]
Preliminary

Comparison of PFM Likelihood Estimates for FCO Spillwayfrom CNA Task Teams and L2RA Team
56% of PFMs with Same (Order of Magnitude) Likelihood Estimates (40/71)93% of PFMs within 1 Order of Magnitude Difference in Likelihood Estimates (66/71)
Task Team
No. of PFMs with SameLikelihood Estimates
No. of PFMs with 1 Order of
Magnitude Difference
No. of PFMs with 2 Orders of Magnitude
Difference
No. of PFMs with 3 Orders of Magnitude
Difference
Total No. of PFMs
Compared
1 - - - - -
3 8 2 1 1 12
4 12 4 1 0 17
5 20 20 2 0 42
Total 40 26 4 1 71
Preliminary

Presentation Outline Background
• Review: Purpose of the CNA• Risk-Informed Decision Making Approach• Ongoing Independent Level 2 Risk Analysis• Need for CNA Existing Conditions Assessment
Overview of CNA Existing Conditions Assessment• PFM Development and Evaluation• Examples of PFM Development• Comparisons of Estimated PFM Likelihoods with L2RA Estimates• Preliminary Results to Date
Update on CNA PFM Development and CNA Existing Conditions Assessment

Next Steps Include: Internal Review of PFM Risk Estimates for
consistency within and across Task Teams
Reconcile Remaining Significant Differences between CNA and L2RA Risk Estimates
Continue Developing Risk Reduction Measures

Questions?