Embed Size (px)
Citation preview

State of California Department of Education
Last Minute Memorandum To: STATE BOARD MEMBERS Date: March 11, 2003 From: Camille Maben Re: ITEM # 5 Subject NO CHILD LEFT BEHIND CDE staff will provide an overview of the eight components of the consolidated state plan due to USDE May 1, 2003. This “information only” item will be presented by:
- Geno Flores - Wendy Harris - Camille Maben - Jan Mayer - Bill Padia - Phil Spears
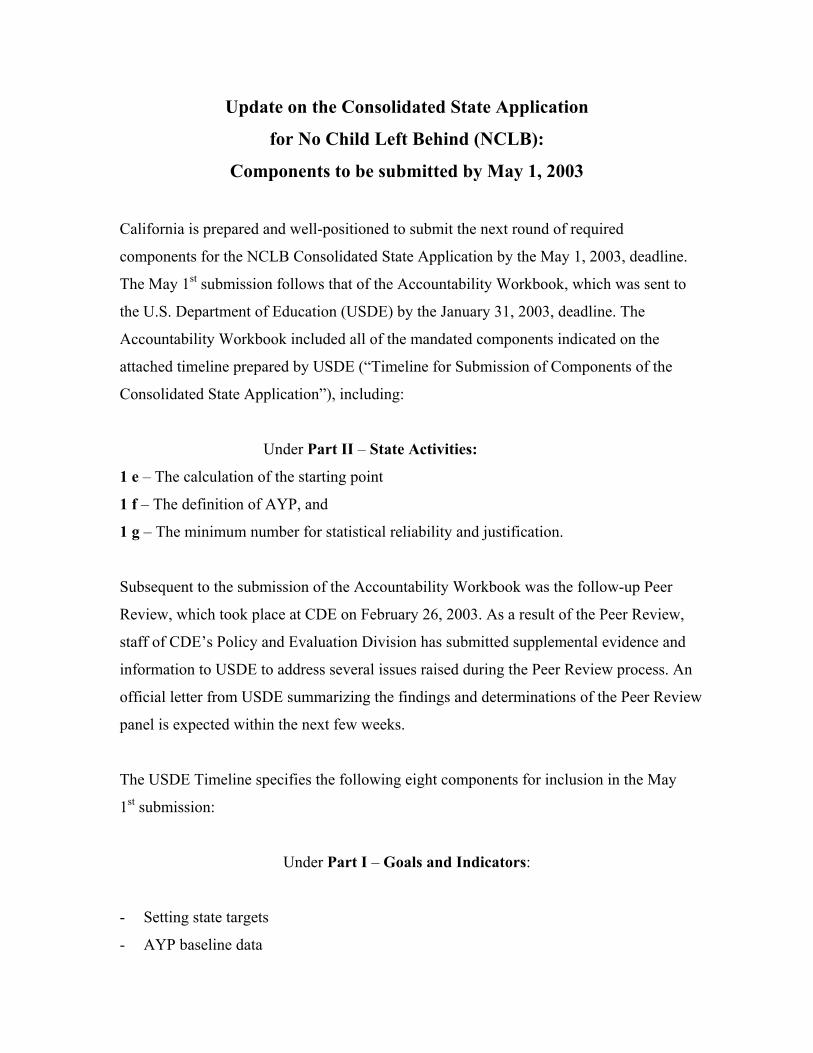
Update on the Consolidated State Application
for No Child Left Behind (NCLB):
Components to be submitted by May 1, 2003
California is prepared and well-positioned to submit the next round of required
components for the NCLB Consolidated State Application by the May 1, 2003, deadline.
The May 1st submission follows that of the Accountability Workbook, which was sent to
the U.S. Department of Education (USDE) by the January 31, 2003, deadline. The
Accountability Workbook included all of the mandated components indicated on the
attached timeline prepared by USDE (“Timeline for Submission of Components of the
Consolidated State Application”), including:
Under Part II – State Activities:
1 e – The calculation of the starting point
1 f – The definition of AYP, and
1 g – The minimum number for statistical reliability and justification.
Subsequent to the submission of the Accountability Workbook was the follow-up Peer
Review, which took place at CDE on February 26, 2003. As a result of the Peer Review,
staff of CDE’s Policy and Evaluation Division has submitted supplemental evidence and
information to USDE to address several issues raised during the Peer Review process. An
official letter from USDE summarizing the findings and determinations of the Peer Review
panel is expected within the next few weeks.
The USDE Timeline specifies the following eight components for inclusion in the May
1st submission:
Under Part I – Goals and Indicators:
- Setting state targets
- AYP baseline data

Under Part II – State Activities:
1 a – Evidence of adopting academic content standards/grade-level expectations in
math and reading
1 b – A detailed timeline for adopting academic content standards/grade-level
expectations in science
1 c – A detailed timeline for developing and implementing required assessments in
science
1 d – A detailed timeline for setting academic achievement standards in science
1 h – Evidence of a single accountability system
1 k – Standards and objectives for English proficiency (Annual Measurable
Achievement Objectives)
These eight components will be fully addressed as part of California’s May 1st
submission to USDE. On the pages that follow are drafts for each component.

Setting State Targets
[The charts on the following page were approved by SBE and submitted to USDE on
January 31, 2003, as part of California’s Accountability Workbook.]

7 intermediate objectives, designated by asterisks Annual Measurable Objectives – Percent at or above ProficientELA Year Mathematics 0.136 2001-2002 0.160 0.136 2002-2003 0.160 0.136 2003-2004 0.160 0.244 2004-2005 0.265*0.244 2005-2006 0.265 0.244 2006-2007 0.265 0.352 2007-2008 0.370*0.460 2008-2009 0.475*0.568 2009-2010 0.580*0.676 2010-2011 0.685*0.784 2011-2012 0.790*0.892 2012-2013 0.895*1.000 2013-2014 1.000
AYP Baseline Data
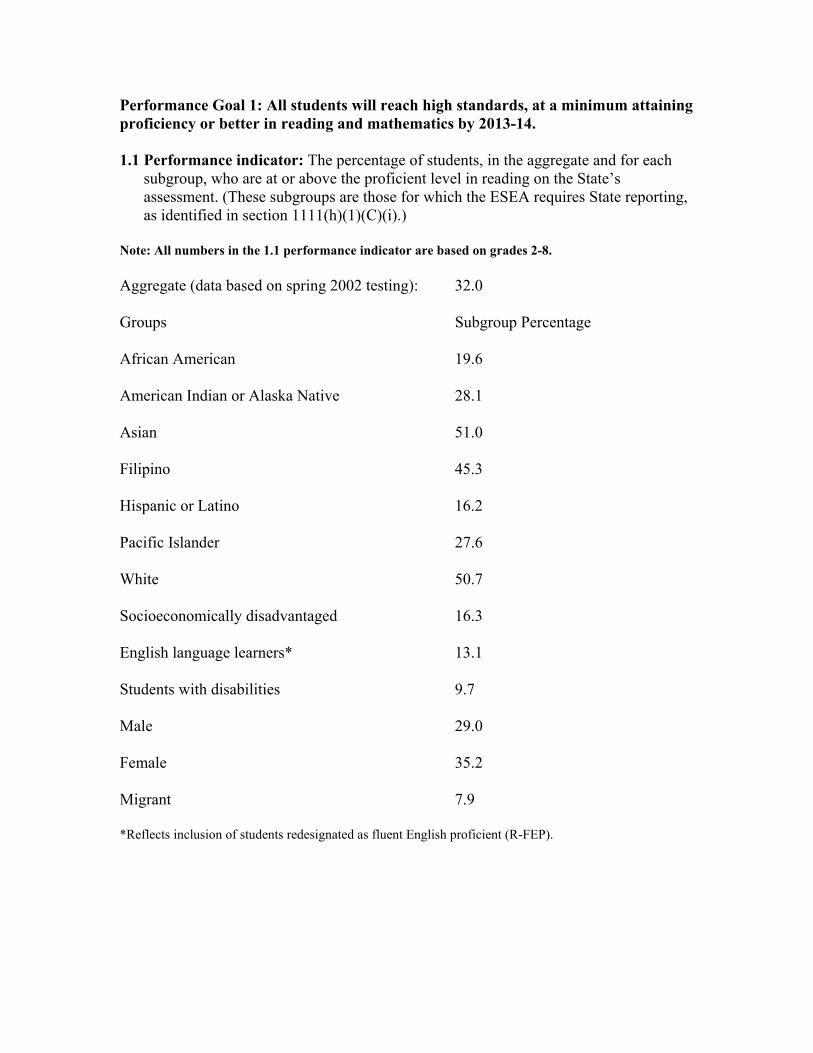
Performance Goal 1: All students will reach high standards, at a minimum attaining proficiency or better in reading and mathematics by 2013-14. 1.1 Performance indicator: The percentage of students, in the aggregate and for each
subgroup, who are at or above the proficient level in reading on the State’s assessment. (These subgroups are those for which the ESEA requires State reporting, as identified in section 1111(h)(1)(C)(i).)
Note: All numbers in the 1.1 performance indicator are based on grades 2-8. Aggregate (data based on spring 2002 testing): 32.0 Groups Subgroup Percentage African American 19.6 American Indian or Alaska Native 28.1 Asian 51.0 Filipino 45.3 Hispanic or Latino 16.2 Pacific Islander 27.6 White 50.7 Socioeconomically disadvantaged 16.3 English language learners* 13.1 Students with disabilities 9.7 Male 29.0 Female 35.2 Migrant 7.9 *Reflects inclusion of students redesignated as fluent English proficient (R-FEP).

1.2 Performance Indicator: The percentage of students, in the aggregate and in each
subgroup, who are at or above the proficient level in mathematics on the State’s assessment. (These subgroups are those for which the ESEA requires State reporting, as identified in section 1111(h)(1)(C)(i).)
Note: All numbers in the 1.2 performance indicator are based on grades 2-8. Aggregate (data based on spring 2002 testing): 33.8 Groups Subgroup Percentage African American 18.1 American Indian or Alaska Native 27.8 Asian 60.5 Filipino 46.6 Hispanic or Latino 20.2 Pacific Islander 29.7 White 48.9 Socioeconomically disadvantaged 20.7 English language learners* 21.0 Students with disabilities 12.1 Male 34.1 Female 33.1 Migrant 14.4 *Reflects inclusion of students redesignated as fluent English proficient (R-FEP).

1.3 Performance indicator: The percentage of Title I schools that make adequate yearly
progress. A total of 48% (2,438 of 5,077) of Title I schools met AYP based on spring 2002 assessment results. Note: In 2002, AYP was synonymous with the Academic Performance Index (API), but defined differently by type of Title I funding. Schools designated as Schoolwide Programs (SWP) made AYP if they made their schoolwide API growth target and the growth targets for all numerically significant subgroups. Schools in the upper half of the API distribution that were Targeted Assistance Schools (TAS) made AYP if they made the API growth target for their socio-economically disadvantaged subgroup.
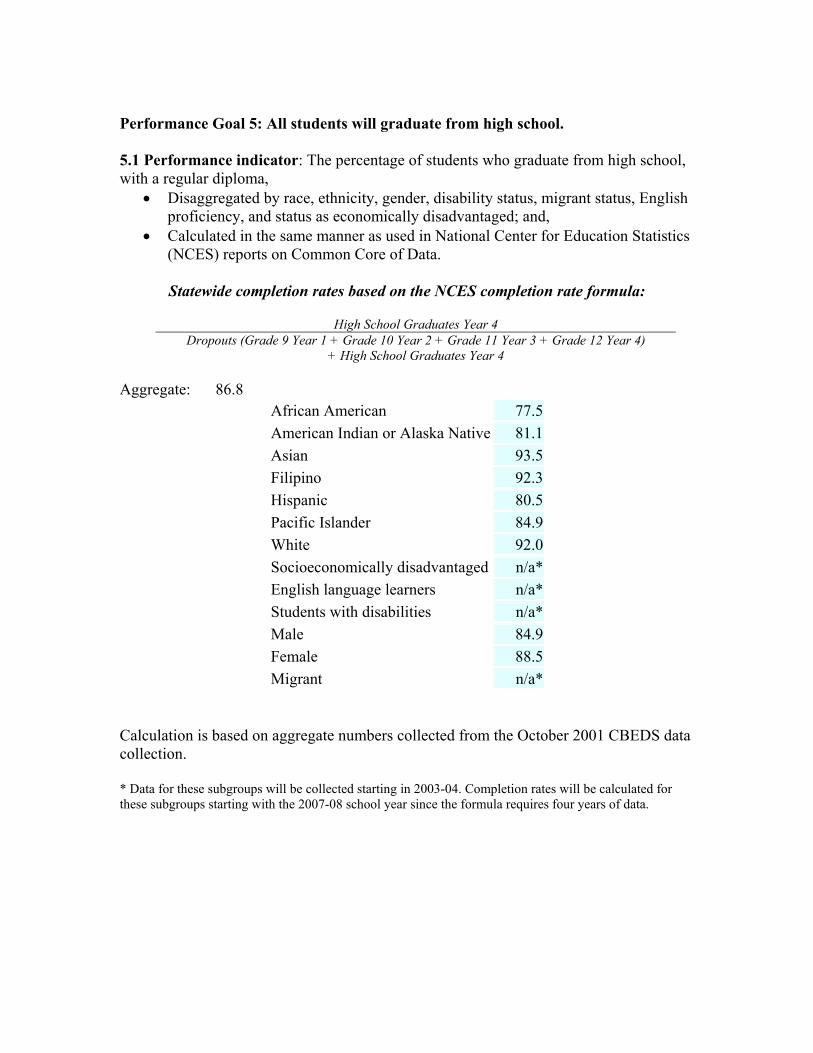
Performance Goal 5: All students will graduate from high school. 5.1 Performance indicator: The percentage of students who graduate from high school, with a regular diploma,
• Disaggregated by race, ethnicity, gender, disability status, migrant status, English proficiency, and status as economically disadvantaged; and,
• Calculated in the same manner as used in National Center for Education Statistics (NCES) reports on Common Core of Data.
Statewide completion rates based on the NCES completion rate formula:
High School Graduates Year 4
Dropouts (Grade 9 Year 1 + Grade 10 Year 2 + Grade 11 Year 3 + Grade 12 Year 4) + High School Graduates Year 4
Aggregate: 86.8
African American 77.5American Indian or Alaska Native 81.1Asian 93.5Filipino 92.3Hispanic 80.5Pacific Islander 84.9White 92.0Socioeconomically disadvantaged n/a*English language learners n/a*Students with disabilities n/a*Male 84.9Female 88.5Migrant n/a*
Calculation is based on aggregate numbers collected from the October 2001 CBEDS data collection. * Data for these subgroups will be collected starting in 2003-04. Completion rates will be calculated for these subgroups starting with the 2007-08 school year since the formula requires four years of data.
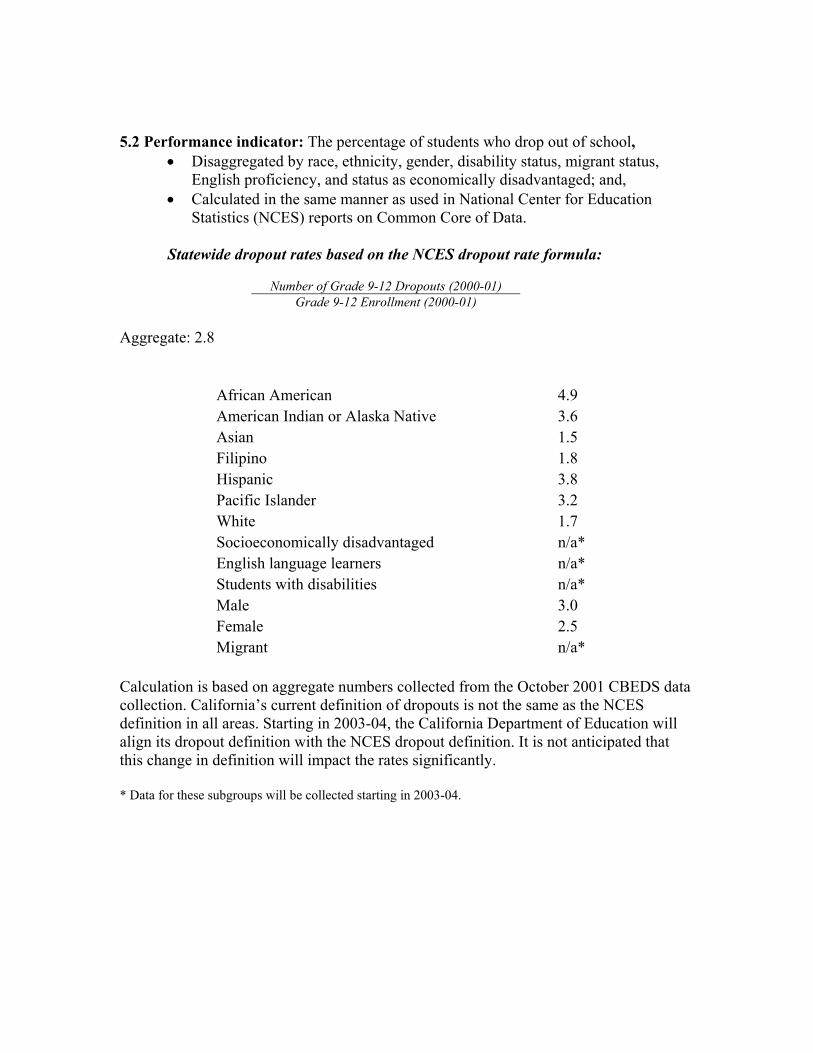
5.2 Performance indicator: The percentage of students who drop out of school,
• Disaggregated by race, ethnicity, gender, disability status, migrant status, English proficiency, and status as economically disadvantaged; and,
• Calculated in the same manner as used in National Center for Education Statistics (NCES) reports on Common Core of Data.
Statewide dropout rates based on the NCES dropout rate formula:
Number of Grade 9-12 Dropouts (2000-01)
Grade 9-12 Enrollment (2000-01) Aggregate: 2.8
African American 4.9 American Indian or Alaska Native 3.6 Asian 1.5 Filipino 1.8 Hispanic 3.8 Pacific Islander 3.2 White 1.7 Socioeconomically disadvantaged n/a* English language learners n/a* Students with disabilities n/a* Male 3.0 Female 2.5 Migrant n/a*
Calculation is based on aggregate numbers collected from the October 2001 CBEDS data collection. California’s current definition of dropouts is not the same as the NCES definition in all areas. Starting in 2003-04, the California Department of Education will align its dropout definition with the NCES dropout definition. It is not anticipated that this change in definition will impact the rates significantly. * Data for these subgroups will be collected starting in 2003-04.

1 a –
Evidence of Adopting Academic
Content Standards/Grade-Level
Expectations in Math and Reading
[Standards for both Mathematics and English-language Arts (which includes reading,
writing, speaking, and listening standards) were adopted by the State Board of Education
in 1997. All of California’s grade-level academic content standards can be viewed via the
Internet at:
http://www.cde.ca.gov/standards/ ]

1 b –
A Detailed Timeline for Adopting
Academic Content Standards/
Grade-Level Expectations in
Science
[Standards for Science were adopted by the State Board of Education in 1998. All of
California’s grade-level academic content standards can be viewed via the Internet at:
http://www.cde.ca.gov/standards/ ]

1 c –
A Detailed Timeline for Developing
and Implementing Required
Assessments in Science
1 d –
A Detailed Timeline for Setting
Academic Achievement Standards in
Science
[The timeline on the pages that follow includes the combined target dates and related
information on California’s development of science assessments and academic
achievement standards as required for Components 1c and 1d above]

Proposed Timeline of Tasks and Events for the Development of the Middle (grades 6-9) and High School (grades 10-12)
Core Knowledge Science Tests The NCLB Consolidated State application must include a timeline for the development of the required tests, which are currently not a component of the state assessment program.
Date Responsibility Task
April 2003 ETS Prepares scope of work and cost proposal for development and
implementation of tests May 2003 SBE Approves scope of work and cost proposal June 2003 CDE Secures funding and Department of Finance approval for test
development and program implementation July/August
2003 CDE/SBE Identifies and selects members for the NCLB Core Knowledge
Science Committee November
2003 Committee Develops recommendation for test content and grade levels for
test administration January
2004 SBE Approves test content and grade levels for test administration
February 2004
ETS Develops preliminary blueprints for committee review
March 2004 Committee Considers and recommends blueprints to SBE April 2004 SBE Adopts blueprints May/June
2004 ETS Develops test items
July 2004 CRP Reviews items for accuracy and alignment to standards August 2004 SPAR Panel Reviews items for issues of privacy August 2004 ETS Builds field test forms and prepares Directions for
Administration October
2004 CDE Reviews field test lasers
November 2004
ETS Prints field test forms
Spring 2005 ETS Administers field tests at designated grade levels May/June
2005 ETS Continue development of test items
July 2005 CRP Reviews items for accuracy and alignment to standards August 2005 SPAR Panel Reviews items for issues of privacy August 2005 ETS Builds operational forms including field test items Spring 2006 STAR
Contractor Administers operational forms including field test items
May/June 2006
STAR Contractor
Continue development of test items

Date Responsibility Task
July 2006 CRP Reviews items for accuracy and alignment to standards August 2006 SPAR Panel Reviews items for issues of privacy August 2006 CDE Reports tests results of Spring 2006 Administration August 2006 STAR
Contractor Completes technical manual
September 2006
STAR Contractor
Organizes and supervises standard setting following operational administration and recommends performance levels to SBE/CDE
October 2006
SBE Approves performance levels
November 2006
SBE Holds public hearings on approved performance levels
December 2006
SBE Adopts performance levels
January 2007
CDE Performance levels applied retroactively and results sent to districts
Spring 2007 STAR Contractor
Second operational test administered
August 2007 CDE Results reported using adopted performance levels August 2007 CDE Results used to calculate new base science API and AYP

1 h –
Evidence of a
Single Accountability System
(Alignment of State and
Federal Systems)

California’s School Classification Matrix The School Classification Matrix (see table on the following page) was developed as a method of communicating a school’s status to the field by combining their performance on the statewide Academic Performance Index (API) and their performance on the newly adopted criteria for federal Adequate Yearly Progress (AYP). In addition, the School Classification Matrix may be used to prioritize interventions for Title I and non-Title I schools. Key Features:
• Combine school performance across API score, API growth, and AYP • Identify the “right” schools for awards and for interventions/sanctions • Be internally consistent within API score bands • Pay attention to subgroups whether through the API or AYP • Allow a lower scoring school to gain a star if they met all API growth targets and
AYP • Limit the top category to schools that meet or exceed the statewide interim API
target and meet AYP Critical Elements:
Annual Decisions • Schools would be classified according to the School Classification Matrix each
year after the results of the prior spring testing cycle are released.
API/AYP Combinations • Within the lower two API score bands (i.e. 600 to 799 and 200 to 599) three
combinations of API growth and AYP are possible: 1. Met all targets and met AYP 2. Met all targets or met AYP 3. Did not meet all targets and missed AYP
API Score and Number of Stars
• A school with an API score above 800 can receive four or five stars. • A school with an API score of 600 to 799 can receive from two to four stars. • A school with an API score of 200 to 599 can receive from one to three stars.
Eligibility for Awards and Interventions
• Three stars represent the minimum eligibility criteria for awards. • Interventions will focus on “one star” schools first, followed by “two star”
schools, etc. Within each star category, interventions may be prioritized by API score or API decile rank if resources are limited.

California’s School Classification Matrix: A System for Combining Performance on the Academic Performance Index (API) with the
Federal Adequate Yearly Progress (AYP) Criteria Prescribed Under the No Child Left Behind Act
API Score API Growth AYP Requirements*
21% 800 to 1000 N/A and Met AYP
800 to 1000 N/A and Missed AYP
13% 600 to 799 and Met all targets**
and Met AYP
600 to 799 and Met all targets or Met AYP 28%
200 to 599 and Met all targets and Met AYP
600 to 799 and Did not meet all targets
and Missed AYP
27%
200 to 599 and Met all targets or Met AYP
11% 200 to 599 and Did not meet all targets
and Missed AYP
*School met or exceeded the statewide annual measurable objective in English language arts and mathematics. **Met all targets includes the school-wide target and the targets for all numerically significant subgroups. Note: The percentage of schools in each category is based on 2002 data for grades 2-8 only.

ISSUES:
• NCLB calls for single integrated accountability system that applies to all schools. Aligning California’s state and federal systems will provide a clearer focus for schools with a uniform set of expectations and will set priorities for use of resources.
• A key requirement of an aligned system is to eliminate or minimize differences
among the various state and federal accountability programs. These differences manifest themselves in several areas:
Eligibility, entry, and exit criteria Planning and program requirements Timeframe for support, intervention, and sanction Funding
• Now that AYP is defined, it is possible to move ahead in thinking through alignment issues in the aforementioned areas. The adoption of the classification matrix, which takes elements from both the API and AYP, is critical in driving thoughts around priorities for assistance and intervention. Priority for assistance and intervention is defined by status of schools in meeting state standards. Those schools in the “lowest groups” for meeting standards (one or two stars) would receive priority.
• In late January 2003, CDE formed a work group, which includes SBE staff, that is
wrestling with the complex issues of alignment. The goal of the group is to finish the design of an aligned system through the remainder of March and the early part of April, then to bring the proposed design along with some open issues to the AB 312 committee and then to SBE in April. In the meantime, CDE looks forward to working both with Board liaisons and SBE staff toward a better and more comprehensive understanding of these issues by April.
• As an introduction to these issues, we are inclined to support some of the thinking
of the Legislative Analyst’s Office (LAO) as presented in its analysis of the 2003-04 Budget. This thinking includes the notions of: 1) focusing state intervention at the district level instead of the school level (in alignment with NCLB), and 2) reserving state intervention for only the lowest performing schools, such as those in the bottom tier of any “star” system. Some implications of moving in this direction may include, among others: 1) changes in state law related to the Immediate Intervention/Underperforming Schools Program (II/USP) and the High Priority (HP) Schools Grant Program, and 2) determining how to transition all the existing II/USP and HP funded schools into a single new system in a way that makes accountability seamless as soon as possible but that also follows through on existing sanction commitments to maintain credibility in an accountability system.

• Examples of open issues for discussion among SBE, the Legislature, and other stakeholders include:
1. For how many years should the state fund school accountability support?
Three years? Four years? 2. Should the notion of extending such funding for one year if a school makes
“significant growth” be revisited? 3. If support and technical assistance for low performing schools is concentrated
at the district level, and state intervention are reserved for the lowest performing and neediest schools in a program such as HP, would such a program remain voluntary?

1k –
Standards and Objectives for
English Proficiency:
Annual Measurable
Achievement Objectives
(NCLB Performance Goal 2)
Title III Accountability Issues in No Child Left Behind (NCLB)
This section provides an overview of the Title III accountability requirements under NCLB and outlines the policy decisions that SBE will make in April 2003. The process CDE will use to analyze data on the 2001 and 2002 administrations of California English Language Development Test (CELDT) to recommend policy alternatives also will be addressed. Overview of Accountability Requirements in Title III NCLB, Title III requires states to develop annual measurable achievement objectives for limited-English-proficient (LEP) students that relate to their development and attainment of English proficiency. The objectives must be based upon results from the state’s annual English language proficiency assessment, the CELDT. States are required to consult with the following representative groups as part of the process in developing the annual measurable achievement objectives: local education agencies, education-related community groups and non-profit organizations, parents, teachers, school administrators, and researchers. On February 24, 2003, CDE staff convened a Title III accountability workgroup to meet the requirement for consultation. Following are several of the key issues identified by the workgroup regarding the development of the annual measurable achievement objectives for English language proficiency:
Maintain a distinction between ELD proficiency and academic proficiency Consider differences between elementary and secondary models Need to guard against setting benchmarks too low or too high Analyze different levels and growth rates within the five CELDT proficiency
levels to determine whether individual student progress is faster at the beginning levels of proficiency when compared to intermediate and early advanced CELDT levels
Consider using scaled scores to measure growth within the five CELDT proficiency levels
Policy Decisions to be made by SBE in April The State Plan for NCLB will include two major annual measurable achievement objectives in English language development (ELD) for English Learners:
1) Gains in the percentage of children meeting annual CELDT growth objectives 2) Annual increases in the percentage of students attaining English language
proficiency as demonstrated by the CELDT
1. Gains in the percentage of children meeting annual CELDT growth objectives SBE will need to consider the following in determining the annual CELDT growth objectives.
• Growth metric SBE will need to determine what scoring metric will be used for growth: changes in scaled scores, rate of attaining proficiency, or some combination of both metrics.
• Differential growth rates for students in different grade spans The CELDT test is given to four grade span groups: K-2, 3-5, 6-8, and 9-12. There may be different rates of growth for students in the earlier grade levels than for students in the upper grades and SBE may want to set differential growth rates by grade span.
• Differential growth rates depending on student proficiency level SBE may want to consider whether or not to set growth targets that vary depending upon the student proficiency level.
• Percentage of students expected to meet the target beginning in 2002-03 The percentage of students expected to meet the target may vary depending on the rigor of the target. For example, if the data indicate that the target is achievable for most students we would expect a high percentage of students to meet the target beginning in 2002-03.
• Rate of increase in the percentage of students expected to meet the target from 2002-03 to 2013-14
NCLB requires that states set annual increases in the percentage of students meeting the target from 2002-03 to 2013-14. The rate of increase could be an equal rate from 2002-03 to 2013-2014, or we could require smaller increments of growth at the beginning, and larger increases in later years as school staffs increase their skills in helping students reach English language proficiency.
2. Annual increases in the percentage of students attaining English language proficiency
SBE will need to make the following policy decisions in determining the rate of attainment of English language proficiency.
• Definition of English Language proficiency
SBE has recommended that students be considered for reclassification if they have an overall proficiency score on the CELDT of early advanced and also intermediate or higher proficiency levels on each of the three skill areas. SBE may want to use this definition for the attainment of English language proficiency or they may want to choose some other definition.
• Number of years in a U.S. school that students need to meet proficiency SBE will need to determine the number of years in a U.S. school that students need in order to reach their definition of English language proficiency. Empirical data from CELDT will be presented in order to help the SBE make that decision.
• Differential expectations for the time needed to reach proficiency by the current grade level of the student and the initial proficiency level of the student
SBE may want to consider whether the length of time needed to attain English language proficiency varies depending upon the grade level and the initial proficiency level of the student and if they want that reflected in the annual measurable achievement objectives.
• Percent of students in 2002-03 through 20013-14 that will be expected to attain English level proficiency after being enrolled in U.S. schools a given number of years.
SBE will need to set the percentage of students that will be expected to attain English level proficiency after being enrolled in US schools a given number of years. NCLB requires that this percentage be increased annually and targets set from 2002-03 to 2013-14. SBE will need to determine the initial rate and the annual rate of increase.
Process for Data Analysis and Recommending of Policy Alternatives The 2002 CELDT data have just become available; this will allow staff to analyze and report empirical evidence based on two years of CELDT data. The patterns of CELDT progress overall, by grade span, and for different proficiency levels will be analyzed and reported to SBE. Data on the number of years it takes to reach proficiency will be analyzed based on different definitions of English proficiency. CDE also will prepare displays showing the number of schools that would meet the targets for the different policy options presented.