Embed Size (px)
Citation preview

39Program Trends
State Is Primary Source of Revenue For K-12 Schools2006-07
In 2006‑07, the state provided almost two‑thirds of all K‑12 school revenue. Less than 2 percent came from the state lottery.
Local government (through property taxes and other local incomes) provided about one‑quarter of all K‑12 school revenue.
The federal government provided slightly more than 10 percent of all K‑12 revenue.
State Funds
Local Property Taxes
Federal Funds
Other Local Funds
40Program Trends
About One-Third of K-12 Funding Has Strings Attached2006-07
Of all state budgeted K‑12 school funds, about two‑thirds is provided as general purpose, or “revenue limit,” funding. These monies support basic school operations.
Most of the remaining funds are for specific “categorical” programs, such as the state’s K‑3 Class Size Reduc‑tion program. These monies must be used to fulfill the various requirements associated with each categorical program.
In addition, the state annually spends roughly $2 billion for debt service (on school facilities) and $1 billion for the State Teachers’ Retirement System.
General PurposeRestricted
Other Categorical
Class Size ReductionCompensatory Education
Child DevelopmentSTRS Debt Service
Special Education

41Program Trends
Teacher Retirement Rates On the RiseCalSTRS Annual Retirement Rate
The retirement rate of CalSTRS members (close to 80 percent of whom are K‑12 teachers) is expected to jump notably in the next few years. This is because the number of active members close to retirement age is increasing significantly. For example, the number of active members age 59 increased by 25 percent from 2004‑05 to 2005‑06.
Whereas the average annual retirement rate from 1995‑96 through 2004‑05 was 2.1 percent, the average annual retirement rate from 2004‑05 through 2013‑14 is projected to be 3.2 percent.
Projection
1.0
2.0
3.0
4.0%
95-96 97-98 99-00 01-02 03-04 05-06 07-08 09-10 11-12 13-14

42Program Trends
K-12 Enrollment Expected to Be Virtually Flat in Near Term
Over the next several years, virtually no growth is expected in total K‑12 enrollment.
Elementary enrollment began declining in 2004 and is expected to continue declining modestly for a few more years before experiencing a small, upward growth trend.
High school enrollment is expected to grow modestly for the next few years and then decline over the sub‑sequent period.
1.0
2.0
3.0%
95-96 97-98 99-00 01-02 03-04 05-06 07-08 09-10 11-12 13-14
Projection

43Program Trends
K-12 Enrollment Trends Vary Greatly by CountyProjected Change, 2004 to 2014
From 2004 to 2014, county enrollment trends are expected to vary greatly—with declines of almost 20 percent projected for Modoc County and increases of almost 40 percent projected for Riverside County.
Declines of 5 percent or more are expected in several large urban counties, including Los Angeles (10 per‑cent), San Francisco (8 percent), and Orange Counties (5 percent).
Increases of 5 percent or more are expected in sev‑eral medium‑sized counties, including San Joaquin (26 percent), Kern (18 percent), and Sacramento (16 percent).
More than -5%
0 to -5%
0 to 5%
5 to 15%
Over 15%
Percent Change

44Program Trends
Percentage of Low-Performing Students on the DeclinePercent of Fourth-Grade Students Scoring "Below Basic" in Reading
Since 2002, the percentage of low‑performing students (those scoring below basic) has been declining. This trend holds whether examining state or federal standard‑ized test results, though the trend is more noticeable for state test results.
Despite similar trends, state and federal tests in fourth‑grade reading show very different results in absolute terms. Whereas the 2005 results on the state test show only about one‑quarter of students scoring below basic, the federal test shows one‑half of students are scoring below basic.
The discrepancy between the state and federal test results is smaller in math, with the 2005 results on the state test showing 24 percent of students scoring below basic and the federal test showing 29 percent of students scoring below basic.
10
20
30
40
50
60%
2002 2003 2004 2005
State Test
Federal Test

45Program Trends
Large Achievement Gap Exists Across Grade LevelsPercent Scoring at Proficient or Advanced on 2006 State Standardized English Language Arts Exam
A large achievement gap exists between students from low‑income families and other students. For example, in 2006 26 percent of low‑income sixth‑graders scored proficient or advanced on the state's English‑Language Arts exam whereas 60 percent of non‑low‑income students scored proficient or advanced.
State test results suggest the achievement gap in both English language arts and mathematics has increased slightly in recent years.
10
20
30
40
50
60
70%
Third Grade Sixth Grade Tenth Grade
Low Incomea
Non-Low Income
aLow income is based on eligibility for federally subsidized meal programs.

46Program Trends
High-Poverty Schools Have Fewer "Highly Qualified" TeachersPercent of Highly Qualified Teachers
Federal law requires all teachers of core academic subjects to demonstrate they are competent (or “highly qualified”) in each of the subjects they teach. Teachers generally demonstrate subject matter competency by passing an exam or completing certain coursework.
High‑poverty elementary schools have slightly fewer core academic classes taught by highly qualified teach‑ers than low‑poverty elementary schools.
The difference at the high school level is more notable. High‑poverty high schools have about 80 percent of core classes taught by highly qualified teachers, whereas, about 90 percent of core classes are taught by highly qualified teachers at low‑poverty high schools.
75
80
85
90%
Elementary High School
High-Poverty Schools
Low-Poverty Schools

47Program Trends
Funding Per College Student Has Outpaced Inflation 2006 Dollarsa
After adjusting for inflation, the average funding Cali‑fornia public colleges and universities have received for each student has increased about 12 percent over the past four decades.
Per‑student funding varies by segment. The University of California receives almost four times as much as the California Community Colleges (CCC), and the California State University receives about twice as much as CCC.
The segments have used the additional per‑student funding in various ways, such as expanding student support services, outreach programs, and research programs.
5,000
6,000
7,000
8,000
9,000
10,000
$11,000
66-67 76-77 86-87 96-97 06-07
aAverage total support (General Fund, property taxes, and student fee revenue) per FTE student in public colleges and universities.

48Program Trends
Growth in College-Age Population To Slow Sharply After 2009Projected Annual Change in 18- to 24-Year-Olds
Growth in the state’s population of 18‑ to 24‑year‑olds (a key determinant of enrollment demand) will slow starting in 2009. This population group will actually decline beginning in 2014.
The state’s population of 25‑ to 44‑year olds is expected to remain relatively flat during this period, with average annual growth of less than 0.4 percent.
These trends will reduce annual enrollment growth cost pressures. At the same time, other factors—such as changing participation rates by different age, gender, and ethnic groups—will affect future higher education spending.
-2.0
-1.0
0.0
1.0
2.0
3.0%
2007 2009 2011 2013 2015

49Program Trends
UC and CSU Faculty Salaries Among Highest in Nation2004-05 Average Faculty Salary for State Four-Year Public Universities
$20,000 40,000 60,000 80,000
North DakotaIdaho
South DakotaMontana
ArkansasWest Virginia
MississippiLouisiana
OklahomaVermontOregon
MaineAlaska
UtahMissouri
KentuckyTennessee
New MexicoAlabamaGeorgia
South CarolinaKansas
WisconsinColoradoNebraska
FloridaIndiana
WyomingWashington
TexasIllinois
Rhode IslandNorth CarolinaUnited States
MarylandOhio
HawaiiVirginiaNevada
New YorkMinnesota
District of ColumbiaPennsylvania
New HampshireMichigan
IowaMassachusetts
ArizonaConnecticut
CaliforniaNew Jersey
Delaware
Source: National Center for Education Statistics.Note: This figure replaces an earlier version in Cal Facts (2006).

50Program Trends
Student Fees Cover Small Share Of Higher Education CostsAverage Cost Per FTE Undergraduate Student 2006-07
The resident undergraduate fee at the University of California (UC), the California State University (CSU), and the California Community Colleges (CCC) represents about one‑third, one‑fourth, and one‑eighth, respectively, of each system’s average edu‑cation costs per full‑time equivalent undergraduate student.
Currently, the UC resident undergraduate fee is the second lowest and the CSU fee is the lowest of their respective public comparison institutions. The CCC per‑unit fee is by far the lowest of all public community college systems in the nation.
2,500
5,000
7,500
10,000
12,500
15,000
17,500
$20,000
UC CSU CCCa
Student Share (Fee)
State Share
aReflects fee reduction that goes into effect January 2007.

51Program Trends
Most Higher Education Subsidies Not Targeted to Needy StudentsTotal General Fund Support for Undergraduate Students in 2005-06
The state subsidizes public higher education in two ways. As illustrated on the facing page, the state funds higher education institutions for most of the cost of serv‑ing each student—financially needy or not. The state also provides additional subsidies to needy students, mostly in the form of grants and fee waivers.
As illustrated above, only a fraction of the funding the state uses to subsidize undergraduate public education is targeted at needy students. Targeted funds make up about 12 percent of state support for undergraduate programs at the University of California, and 6 percent at both the California State University and the California Community Colleges.
1
2
3
4
5
$6
UC CSU CCCa
Targeted at needy students
Untargeted
aIncludes local property taxes under Proposition 98.
In Billions

52Program Trends
Most CSU Freshmen Require RemediationRegularly Admitted Freshmen in Fall 2005
Over 55 percent of regularly admitted California State University (CSU) freshmen required remediation in either college‑level math or writing (or both) in the fall of 2005. Only about 45 percent of freshmen were proficient in both subject areas.
In 1996, CSU set a goal to reduce the percentage of unprepared freshmen to no more than 10 percent in both math and writing by 2007.
The state pays about $7,500 per full‑time equivalent student to provide remedial courses.
Math & Writing
Writing
Fully PreparedRequire Remediation
Math

53Program Trends
SSI/SSP Caseload Continues to GrowCases in Thousands
CalWORKs Caseload Flattens; Share of Child-Only Cases IncreasesCases in Thousands
200
400
600
800
1,000
1,200
1,400
94-95 96-97 98-99 00-01 02-03 04-05 06-07
DisabledBlindAged
200
400
600
800
1,000
94-95 96-97 98-99 00-01 02-03 04-05 06-07
Child-Only Cases
Cases With Adults

54Program Trends
SSI/SSP Grant Is Just Above Poverty Level . . .
. . . While CalWORKs Grant Is Significantly Below Poverty Level
SSI/SSP grant-individualsa
Poverty level for an individual
200
400
600
800
1,000
1,200
$1,400
94-95 96-97 98-99 00-01 02-03 04-05 06-07
aMaximum monthly grant.
200
400
600
800
1,000
1,200
$1,400
94-95 96-97 98-99 00-01 02-03 04-05 06-07
CalWORKs grant and food stampsfor family of threea
Poverty level for a family of three

55Program Trends
Welfare Spending Shifts From Cash Assistance to ServicesExpenditures in Millions
In response to federal welfare reform, CalWORKs shifted the focus of welfare assistance from providing cash aid to furnishing child care and other services to help parents find work. Specifically, the share of spend‑ing dedicated to services and child care increased from 7 percent to 34 percent.
Total spending decreased from $9.1 billion in 1995‑96 to $5.4 billion in 2005‑06, a 40 percent reduction, mostly attributable to caseload decline.
Child Care/Services
Administration Cash Assistance
Child Care/Services
Administration
Cash Assistance
1995-96a
2005-06
aAdjusted for inflation.
Total$9,103
Total$5,427

56Program Trends
IHSS Cost Per Person Leveling Off
From 1995‑96 through 2005‑06, In‑Home Supportive Services (IHSS) costs rose very rapidly from less than $4,000 per person to over $10,000 per person, an average increase of 9.8 percent per year. Most of this change is attributable to higher wages paid to providers.
General Fund spending per person has leveled off over the last four years due to increased federal funding. This increased federal support came from (1) one‑time federal fiscal relief funds in 2003‑04 and (2) approval of a waiver authorizing federal financial participation in the formerly state‑only "residual" IHSS program beginning in 2004‑05.
2
4
6
8
10
$12
94-95 96-97 98-99 00-01 02-03 04-05 06-07
In Thousands
Federal and County Funds
General Fund
Per Person Costs

57Program Trends
Child Support Collections Rising but Cost-Effectiveness Lags Nation
California's child support collections have increased steadily each year, from $1.1 billion in 1995‑96 to $2.4 billion in 2005‑06. However, assistance (Cal‑WORKs) collections have declined from a peak in 2000‑01 primarily due to CalWORKs caseload reduc‑tions.
In terms of cost‑effectiveness, defined as collections per dollar spent on program administration, California ranked 49th among the 50 states in 2005. Specifically, California collected $2.15 for every dollar spent, while the national average was $4.58.
Collections(In Millions)
Cost-Effectiveness
aThe federal government defines cost-effectiveness as collections per administrative dollar spent. Data are from federal fiscal years 1995 through 2005.
500
1,000
1,500
2,000
$2,500
95-96 97-98 99-00 01-02 03-04 05-06
0.50
1.00
1.50
2.00
2.50
3.00
$3.50Nonassistance
Collections for:
Assistance
Cost-Effectivenessa

58Program Trends
One Year After Entering Foster Care, Most Children Are Still in Care
Of Those Who Leave in a Given Year, One-Half Return to Their Family
Adoption and "aging out" (emancipated) are the next most common types of exits. Over 20 percent are adopted while 12 percent exit foster care when they reach age 18.
Reunified
Adopted/Other
In Care
Data for children entering care during 2004-05.
Reunified
Adopted
Emancipated
OtherKinGap/Guardianship
Data for children leaving during 2005.

59Program Trends
Spending on Child Care Has Increased SignificantlyDollars in Millions
Spending on state subsidized child care increased from about $1.1 billion in 1997‑98 to about $3 billion in 2002‑03. After three years of essentially level fund‑ing, expenditures increased in 2006‑07, mostly due to a major expansion of after school and preschool programs.
The percentage of total child care spending for cur‑rent and former CalWORKs families grew from about one‑quarter of all spending in 1997‑98 to a peak of about 56 percent in 2001‑02. Since then, the share for CalWORKs has declined because of (1) modest caseload reduction and (2) new expenditures for non‑CalWORKs after school and preschool programs.
1,000
2,000
3,000
$4,000
97-98 99-00 01-02 03-04 05-06
All Other SDEStage ThreeStage One & Two

60Program Trends
Medi-Cal Caseload Growth Slowing While Cost Per Person Increases
The Medi‑Cal caseload declined between 1996‑97 and 1997‑98 as the economy recovered, then remained flat for a couple years. Various eligibility expansions and simplified eligibility processes caused a rapid growth in caseload in 2001‑02 and 2002‑03. Since then,the caseload has continued to grow, but at a slower rate.
The annual cost increase per Medi‑Cal beneficiary trended steadily upward until 2001‑02. The decline that year appears to be partly the result of an increase in the number of healthy beneficiaries, rather than a decrease in costs. More recently, costs have gener‑ally shown steady growth, interrupted for one year in 2004‑05 when the state adopted certain one‑time savings actions.
Persons Enrolled(In Millions)
Annual CostPer Persona
aIncludes federal funds. Excludes disproportionate share hospital payments and most pass-through funding for related programs.
3
4
5
6
7
96-97 98-99 00-01 02-03 04-05 06-071,500
2,000
2,500
3,000
3,500
$4,000
Persons Enrolled
Annual Cost Per Persona

61Program Trends
Most Medi-Cal Families/Children Are Not on Welfare
By 2000‑01, for the first time in the history of the Medi‑Cal Program, welfare (CalWORKs) recipients accounted for less than one‑half of the families and children enrolled in the program. This trend has con‑tinued and Medi‑Cal enrollment of nonwelfare families and children now exceeds those on welfare by more than 2 million persons.
The reduction in the welfare component of the Medi‑Cal caseload is generally attributable to welfare reform. The growth in the nonwelfare component is due to legisla‑tive changes primarily in 2000‑01 that expanded and simplified Medi‑Cal eligibility for low‑income working families.
0.5
1.0
1.5
2.0
2.5
3.0
3.5
4.0
99-00 00-01 01-02 02-03 03-04 04-05 05-06 06-07
Welfare Families
Nonwelfare Families/Children
Enrollees(In Millions)

62Program Trends
Medi-Cal Caseload Is Primarily Families/Children . . .2006-07
. . . While Most Medi-Cal Spending Is for Elderly/Disabled
Percent of Caseload
Elderly/Disabled
Families/Children
Percent of Spending
Elderly/DisabledFamilies/Children

63Program Trends
Smoking Has Declined Among California AdultsPrevalence of Smoking Among Adults 18 and Older a
The prevalence of smoking among adults dropped significantly over time from about 26 percent in 1986 to about 14 percent in 2005. The prevalence of smok‑ing among high school students declined dramatically since 2000 from about 22 percent to about 13 percent in 2004, but increased to about 15 percent in 2006.
Proposition 99 of 1988 imposed a 25 cent per pack tax on cigarettes and earmarked the proceeds for various tobacco prevention, health, and resources programs. Proposition 10 of 1998 imposed a further 50 cent per pack tax on cigarettes that is devoted to childhood development programs.
5
10
15
20
25
30%
1986 1989 1992 1995 1998 2001 2004
aThe state definition of who is considered a smoker changed in 1996 to include more occasional smokers.

64Program Trends
Regional Center Spending Up SignificantlyPercent Change Since 1999-00
The state provides community‑based services to about 212,000 developmentally disabled individuals through 21 nonprofit corporations known as regional centers (RCs). Between 1999‑00 and 2006‑07 real growth has occurred in this program as average per person spending, after adjusting for inflation, has gone up 13 percent. During the same period, unadjusted spending per person has gone up by 41 percent.
The increases in costs are attributable to several fac‑tors. New medical technology, treatments, and equip‑ment are broadening the scope of services available to the developmentally disabled. Other factors include increased life expectancies of RC clients, increases in the number of diagnosed cases of autism, and the comparatively higher costs of treating autistic clients.
10
20
30
40
50%
99-00 01-02 03-04 05-06
Per Person Spendinga
CPI Adjusted Per Person Spendinga
aData adjusted to reflect programmatic changes. CPI: Consumer Price Index
65Program Trends
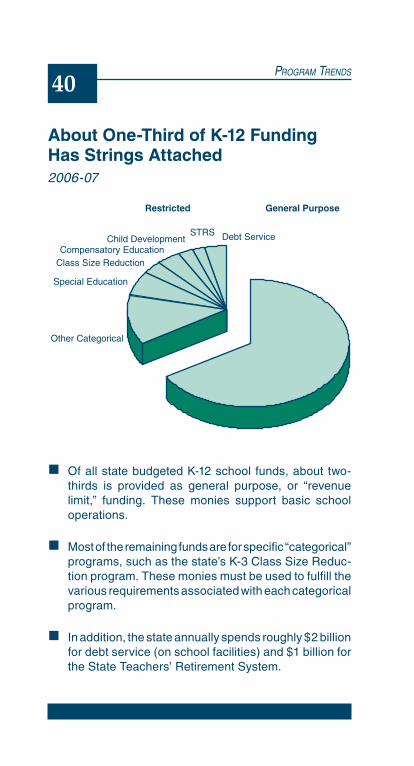
Crime Rate Up After Decade DeclineRate Per 100,000 Population
After nearly ten consecutive years of decline, California's crime rate increased somewhat since 2000. Nonethe‑less, crime in California remains at a level not seen since the mid 1960s.
As the above figure shows, this upward shift is driven by an increase in the level of property crimes such as burglary and theft. Violent crime, such as murder, rape, and assault, has continued to slowly decline.
There are probably many reasons for this slight increase in the overall crime rate, including the changing demo‑graphics (growth in crime prone age groups), higher reporting of crimes, and improvements in policing and other law enforcement techniques.
1,000
3,000
5,000
7,000
9,000
60 64 68 72 76 80 84 88 92 96 00 04
Total
ViolentProperty
Source: FBI Crime Index
66Program Trends
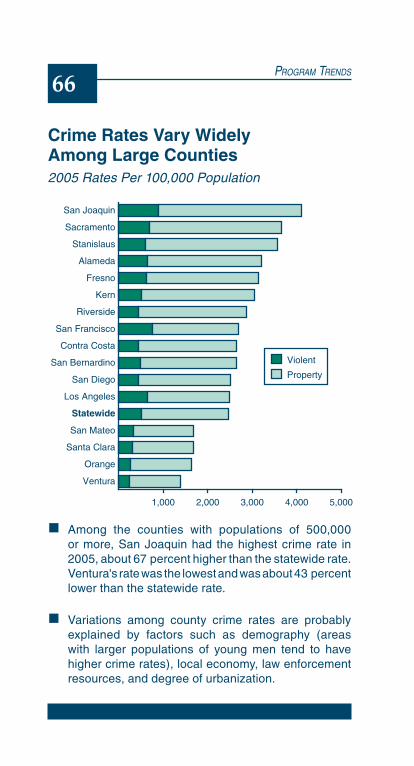
Crime Rates Vary Widely Among Large Counties2005 Rates Per 100,000 Population
Among the counties with populations of 500,000 or more, San Joaquin had the highest crime rate in 2005, about 67 percent higher than the statewide rate. Ventura's rate was the lowest and was about 43 percent lower than the statewide rate.
Variations among county crime rates are probably explained by factors such as demography (areas with larger populations of young men tend to have higher crime rates), local economy, law enforcement resources, and degree of urbanization.
1,000 2,000 3,000 4,000 5,000
Ventura
Orange
Santa Clara
San Mateo
Statewide
Los Angeles
San Diego
San Bernardino
Contra Costa
San Francisco
Riverside
Kern
Fresno
Alameda
Stanislaus
Sacramento
San Joaquin
Violent
Property
67Program Trends
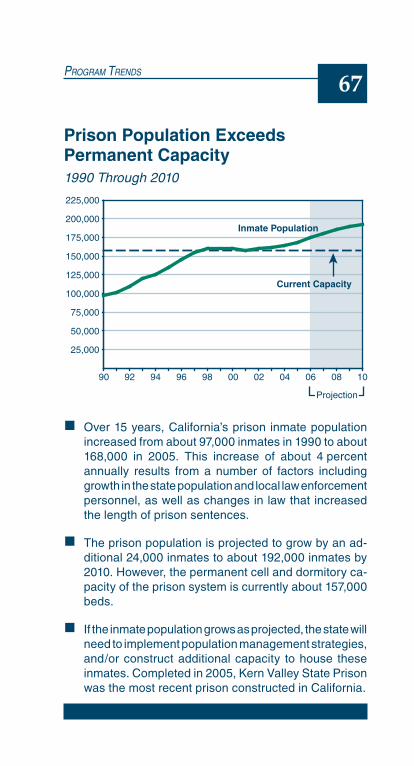
Prison Population Exceeds Permanent Capacity1990 Through 2010
Over 15 years, California’s prison inmate population increased from about 97,000 inmates in 1990 to about 168,000 in 2005. This increase of about 4 percent annually results from a number of factors including growth in the state population and local law enforcement personnel, as well as changes in law that increased the length of prison sentences.
The prison population is projected to grow by an ad‑ditional 24,000 inmates to about 192,000 inmates by 2010. However, the permanent cell and dormitory ca‑pacity of the prison system is currently about 157,000 beds.
If the inmate population grows as projected, the state will need to implement population management strategies, and/or construct additional capacity to house these inmates. Completed in 2005, Kern Valley State Prison was the most recent prison constructed in California.
25,000
50,000
75,000
100,000
125,000
150,000
175,000
200,000
225,000
90 92 94 96 98 00 02 04 06 08 10
Current Capacity
Inmate Population
Projection

68Program Trends
Offenders Sent to Prison for Various Offense Types2005
There were more than 68,000 admissions to prison from the courts in 2005.
Almost two‑thirds of admissions are for property and drug crimes, including burglary, auto theft, and drug possession and sale.
Among inmates convicted of crimes against persons, the most common offenses are assault and robbery.
Property Crimes
Drug Crimes
Crimes Against Persons
Other Crimes
69Program Trends
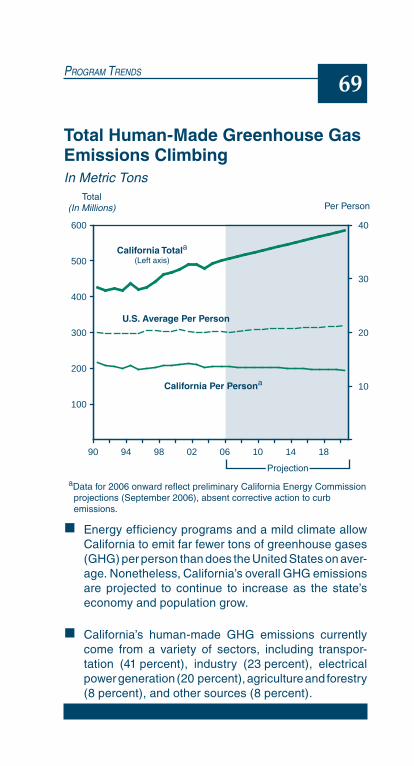
Total Human-Made Greenhouse Gas Emissions Climbing In Metric Tons
Energy efficiency programs and a mild climate allow California to emit far fewer tons of greenhouse gases (GHG) per person than does the United States on aver‑age. Nonetheless, California’s overall GHG emissions are projected to continue to increase as the state’s economy and population grow.
California’s human‑made GHG emissions currently come from a variety of sectors, including transpor‑tation (41 percent), industry (23 percent), electrical power generation (20 percent), agriculture and forestry (8 percent), and other sources (8 percent).
100
200
300
400
500
600
90 94 98 02 06 10 14 18
10
20
30
40
Total(In Millions) Per Person
California Per Persona
U.S. Average Per Person
California Totala(Left axis)
aData for 2006 onward reflect preliminary California Energy Commission projections (September 2006), absent corrective action to curb emissions.
Projection
70Program Trends
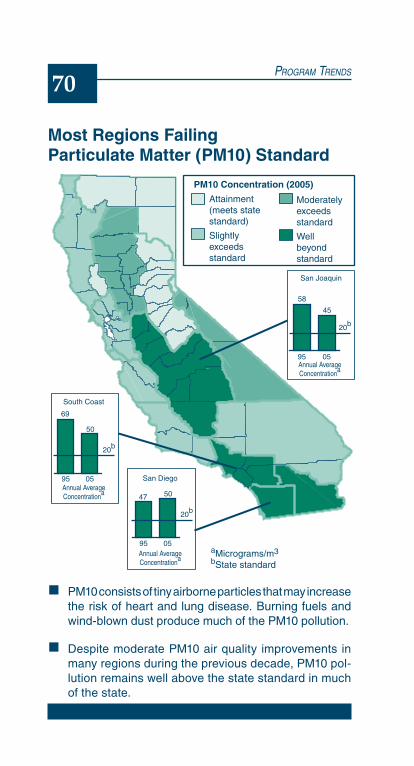
Most Regions Failing Particulate Matter (PM10) Standard
PM10 consists of tiny airborne particles that may increase the risk of heart and lung disease. Burning fuels and wind‑blown dust produce much of the PM10 pollution.
Despite moderate PM10 air quality improvements in many regions during the previous decade, PM10 pol‑lution remains well above the state standard in much of the state.
Attainment(meets state standard)
Slightlyexceedsstandard
PM10 Concentration (2005)
Moderatelyexceedsstandard
Wellbeyondstandard
aMicrograms/m3bState standard
95 05Annual AverageConcentrationa
San Joaquin
45
20b
58
95 05Annual AverageConcentrationa
South Coast
20b
50
69
95 05Annual AverageConcentrationa
San Diego
20b
5047

71Program Trends
Electricity Supply and Transmission Flat While Demand Grows
Over the next five years, electricity demand is projected to increase at an average annual rate of 1.4 percent, while the secure supply (existing generation, high prob‑ability new and out‑of‑state generation) is projected to grow more slowly at an average annual rate of less than 0.1 percent.
Meeting projected demand in part requires increased transmission capacity. However, the number of transmis‑sion line miles is projected to grow slowly, limiting the state’s ability to provide bulk electricity to many regions, particularly Southern California, during peak hot summer demand. Projects planned to come on line beginning in 2009 may lessen these constraints.
aElectricity supplied and demanded at the time of peak demand for the year (typically the afternoon peak of a very hot summer day).
62,000
64,000
66,000
68,000
70,000
72,000
2006 2007 2008 2009 2010 2011
Secure Supply
Very Hot SummerTemperature Demand
TotalMilesb
Bulk Transmission Line MilesGrowing Slowly
10,500
15,500
20,500
25,500
2006 2011
bBulk transmission lines carry over 200 kilovolts of electricity.
Megawattsa

72Program Trends
Delta Is at the Heart of California's Water System
Water flowing through the Sacramento‑San Joaquin River Delta (the Delta) is the main source of supply for two major California water delivery projects, the State Water Project and the federal Central Valley Project. From these projects, a majority of Californians rely on water flowing through the Delta for all or part of their drinking water. In addition, approximately one‑third of the state’s cropland uses water flowing through the Delta.
The state has spent over $2 billion over the past five years in the CALFED Bay‑Delta program to help protect and restore the Delta.
10% EastsideTributaries/In-Delta Precipitation
12% Central ValleyProject (CVP),Mostly Agriculture
16%San Joaquin River
65% Outflow toSuisun andSan Francisco Bays
8% In-Delta Use,Mostly Agricultural
Source of Waterinto the Delta
Water deliveriesand flow out of Delta
74% SacramentoRiver Valley
15% State Water Project (SWP),Mostly Southern CaliforniaUrban and Industrial Use

73Program Trends
Increasing Development Where State Fights Wildland Fires
The Department of Forestry and Fire Protection is responsible for wildland firefighting in State Responsi‑bility Areas (SRA)—generally privately owned forests, grasslands, and watersheds, with minimal urban development. When such lands are incorporated into cities or exceed a certain density, local governments become solely responsible for firefighting.
As shown, while the acreage in SRA has remained fairly constant, the number of housing units has increased significantly. This has increased state firefighting costs by requiring more resources to protect human life and structures, limiting fire prevention and suppression tactics, and increasing wildland fire risk from human activities.
20
22
24
26
28
30
32
34
1990 1995 2000a 2005700,000
750,000
800,000
850,000
900,000
950,000Acres
State Responsibility Areas
Housing Units
aIn the late 1990s in Southern California, local governments annexedlarge parcels of land thereby shifting a significant amount of land andhousing units from state to local firefighting responsibility. However, thelong-term trend shows increasing housing units in SRA.
Acres(In Millions)
HousingUnits

74Program Trends
Protected Species Concentrated in Heavily Developed Areas
Both federal and state law allow for the listing of plant or animal species as threatened or endangered. Fish and wildlife agencies may issue permits that allow for a listed species to be incidentally harmed by a project, provided mitigation requirements are met.
There are 405 protected species found throughout the state, largely concentrated in highly developed areas, such as the Bay Area, coastal Southern California, and increasingly in the Central Valley. As development continues to reduce available habitat, protected popu‑lations may decline further and/or additional species may be listed.
0-2
ProtectedSpecies
3-5
6-21

75Program Trends
Growth in Travel on State Highways Outpaces Capacity Increases
Between 1990 and 2003, travel on the state highway system increased by 26 percent. Meanwhile, highway lane‑miles increased by only 3 percent.
Today, California has about 50,500 miles of highways maintained and operated by Caltrans. An additional 327,000 miles of local roads are maintained and oper‑ated by cities and counties.
Because of the imbalance between road supply and travel demand, delay on California’s urban highways has nearly doubled from 262,000 hours per day in 1992 to 512,000 hours per day in 2002.
5
10
15
20
25
30%
90 92 94 96 98 00 02
Growth in vehicle-miles traveled
Growth in highway lane-miles
76Program Trends
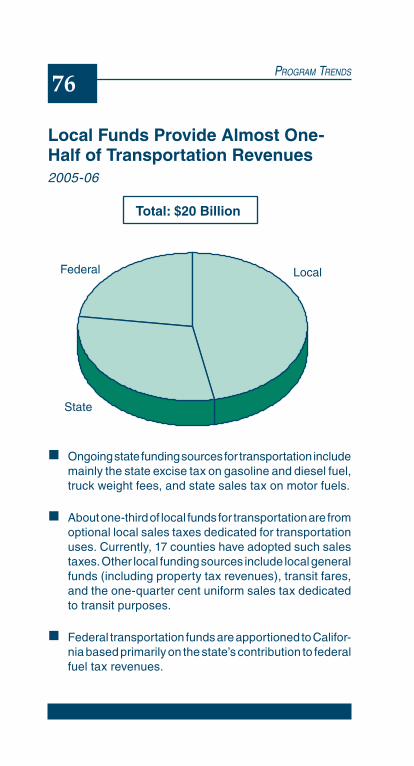
Local Funds Provide Almost One-Half of Transportation Revenues2005-06
Ongoing state funding sources for transportation include mainly the state excise tax on gasoline and diesel fuel, truck weight fees, and state sales tax on motor fuels.
About one‑third of local funds for transportation are from optional local sales taxes dedicated for transportation uses. Currently, 17 counties have adopted such sales taxes. Other local funding sources include local general funds (including property tax revenues), transit fares, and the one‑quarter cent uniform sales tax dedicated to transit purposes.
Federal transportation funds are apportioned to Califor‑nia based primarily on the state’s contribution to federal fuel tax revenues.
State
Federal Local
Total: $20 Billion
77Program Trends
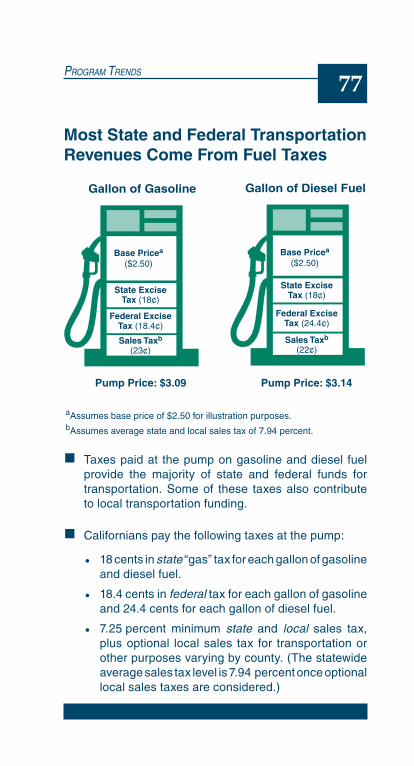
Most State and Federal Transportation Revenues Come From Fuel Taxes
Taxes paid at the pump on gasoline and diesel fuel provide the majority of state and federal funds for transportation. Some of these taxes also contribute to local transportation funding.
Californians pay the following taxes at the pump:
•18 cents in state “gas” tax for each gallon of gasoline and diesel fuel.
•18.4 cents in federal tax for each gallon of gasoline and 24.4 cents for each gallon of diesel fuel.
•7.25 percent minimum state and local sales tax, plus optional local sales tax for transportation or other purposes varying by county. (The statewide average sales tax level is 7.94 percent once optional local sales taxes are considered.)
Pump Price: $3.09 Pump Price: $3.14
Gallon of Diesel Fuel
Base Pricea
($2.50)
Federal ExciseTax (18.4¢)
State ExciseTax (18¢)
Sales Taxb
(23¢)
Base Pricea
($2.50)
Federal ExciseTax (24.4¢)
State ExciseTax (18¢)
Sales Taxb
(22¢)
aAssumes base price of $2.50 for illustration purposes.bAssumes average state and local sales tax of 7.94 percent.
Gallon of Gasoline

78Program Trends
State Transportation Funding Comes Primarily From Fuel Taxes . . .2005-06
. . . And Goes Primarily for Highways2005-06
Revenues: $6.1 Billion
Fuel Excise Tax
Fuel Sales Tax
Other
Weight Fee
Expenditures: $6.6 Billiona
Highways
Local Streetsand Roads
Planning, Administration,and Other
Mass Transportation
aAmount includes expenditure out of prior-year fund balance.

79Program Trends
Are Californians Really in Love With Their Cars?
While the conventional wisdom is that Californians are infatuated with their automobiles, some data suggest that this is not the case.
For instance, when compared to the average American, Californians tend to drive fewer miles.
Californians do have slightly more vehicles than the average American.
Lowest State Highest State
U.S. AverageCalifornia
Miles Driven (x 10,000) per Capita
Motor Vehicles per Capita
1.0 1.5 2.00.0 0.5
80Program Trends
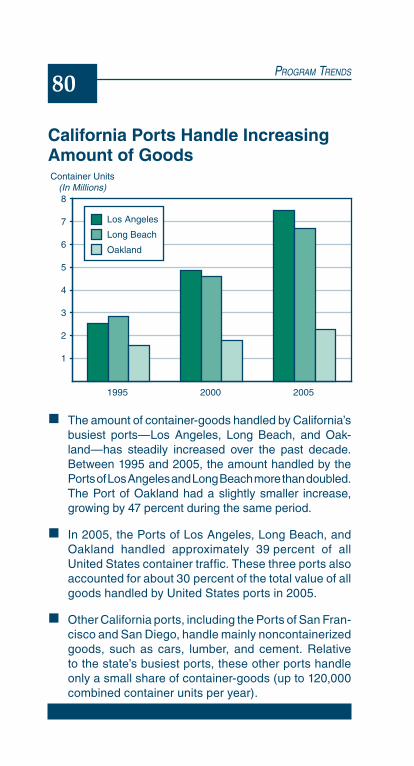
California Ports Handle Increasing Amount of Goods
The amount of container‑goods handled by California’s busiest ports—Los Angeles, Long Beach, and Oak‑land—has steadily increased over the past decade. Between 1995 and 2005, the amount handled by the Ports of Los Angeles and Long Beach more than doubled. The Port of Oakland had a slightly smaller increase, growing by 47 percent during the same period.
In 2005, the Ports of Los Angeles, Long Beach, and Oakland handled approximately 39 percent of all United States container traffic. These three ports also accounted for about 30 percent of the total value of all goods handled by United States ports in 2005.
Other California ports, including the Ports of San Fran‑cisco and San Diego, handle mainly noncontainerized goods, such as cars, lumber, and cement. Relative to the state’s busiest ports, these other ports handle only a small share of container‑goods (up to 120,000 combined container units per year).
1
2
3
4
5
6
7
8
1995 2000 2005
Los Angeles
Long Beach
Oakland
Container Units(In Millions)

81Program Trends
Bond Funds Will Provide Substantial One-Time Infusion to Transportation
Proposition 1B, the Highway Safety, Traffic Reduction, Air Quality, and Port Security Bond Act of 2006, ap‑proved by voters in November 2006, allows the state to sell $20 billion in general obligation bonds to fund projects that will relieve congestion, improve air quality, and enhance the safety and security of the transporta‑tion system.
These bond funds constitute a major one‑time infusion of state funds that will be spent over multiple years.
Proposition 1B creates several new transportation fund‑ing programs (for example, Corridor Mobility Improve‑ment and Trade Corridors Improvement), and provides additional funds for existing construction programs.
Total: $19.925 Billion
Highway and LocalRoad Improvements
Bus and Rail
Safety andSecurity
Goods MovementAnd Air Quality

82Program Trends
Infrastructure Spending Focused on Transportation and Educationa
In Billions
Over the past five years, the state has spent about $38 billion on infrastructure.
Over that time period, transportation projects and education facilities (both K‑12 and higher education) have accounted for a total of 83 percent of all state infrastructure spending. The remaining spending was for other state facilities, such as office buildings, prison facilities, state parks, open space, and wildlife habitat.
About three‑fourths of the spending on education fa‑cilities was allocated to local school districts, with the remainder spent on state higher education facilities.
2
4
6
8
10
$12
01-02 02-03 03-04 04-05 05-06
OtherEducationTransportation
aExcludes spending on self-financed projects and State Water Project.
83Program Trends
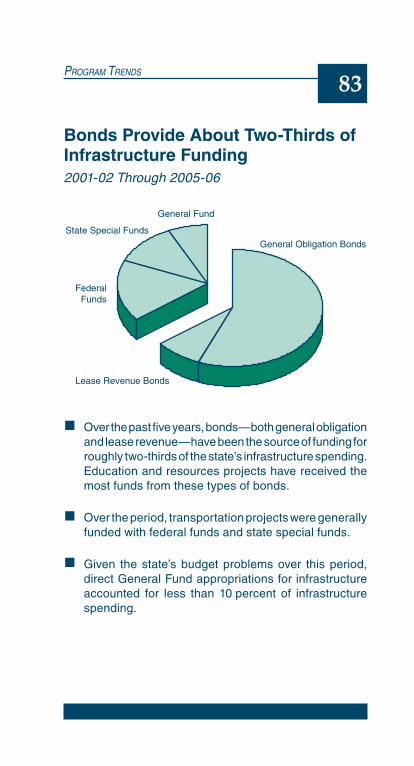
Bonds Provide About Two-Thirds of Infrastructure Funding2001-02 Through 2005-06
Over the past five years, bonds—both general obligation and lease revenue—have been the source of funding for roughly two‑thirds of the state’s infrastructure spending. Education and resources projects have received the most funds from these types of bonds.
Over the period, transportation projects were generally funded with federal funds and state special funds.
Given the state’s budget problems over this period, direct General Fund appropriations for infrastructure accounted for less than 10 percent of infrastructure spending.
General Obligation Bonds
Lease Revenue Bonds
State Special Funds
General Fund
FederalFunds

84Program Trends