Embed Size (px)
Citation preview
STATE HORTICULTURE MISSION
Government of Andhra Pradesh
ANNUAL ACTION PLAN : 2008-09

SHM Districts
Srikakulum West Godavari
Adilabad Mahaboobnagar
Ananthapur Medak
Chittoor Nalgonda
Guntur Nellore
Kadapa Nizamabad
Karimnagar Prakasam
Khammam Rangareddy
Kurnool Warangal
Total Districts in SHM 18 Agency areas added in 2007-08 02
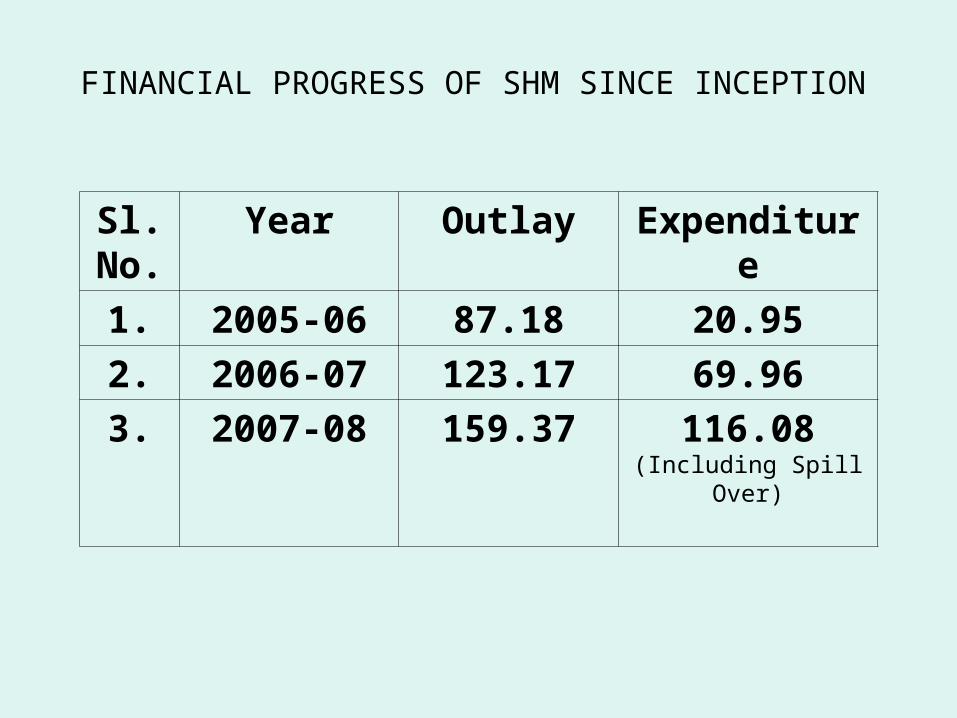
FINANCIAL PROGRESS OF SHM SINCE INCEPTION
Sl. No.
Year Outlay Expenditure
1. 2005-06 87.18 20.95
2. 2006-07 123.17 69.96
3. 2007-08 159.37 116.08(Including Spill Over)
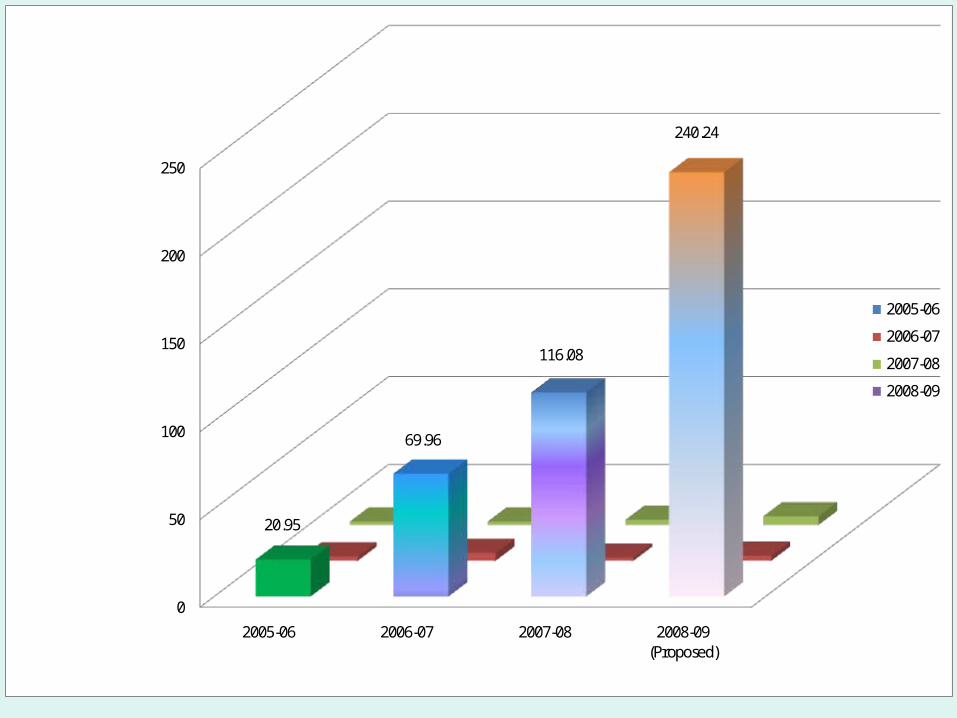
PATTERN OF UTILISATION OF FUNDS
0
50
100
150
200
250
2005-06 2006-07 2007-08 2008-09 (Proposed)
20.95
69.96
116.08
240.24
2005-06
2006-07
2007-08
2008-09
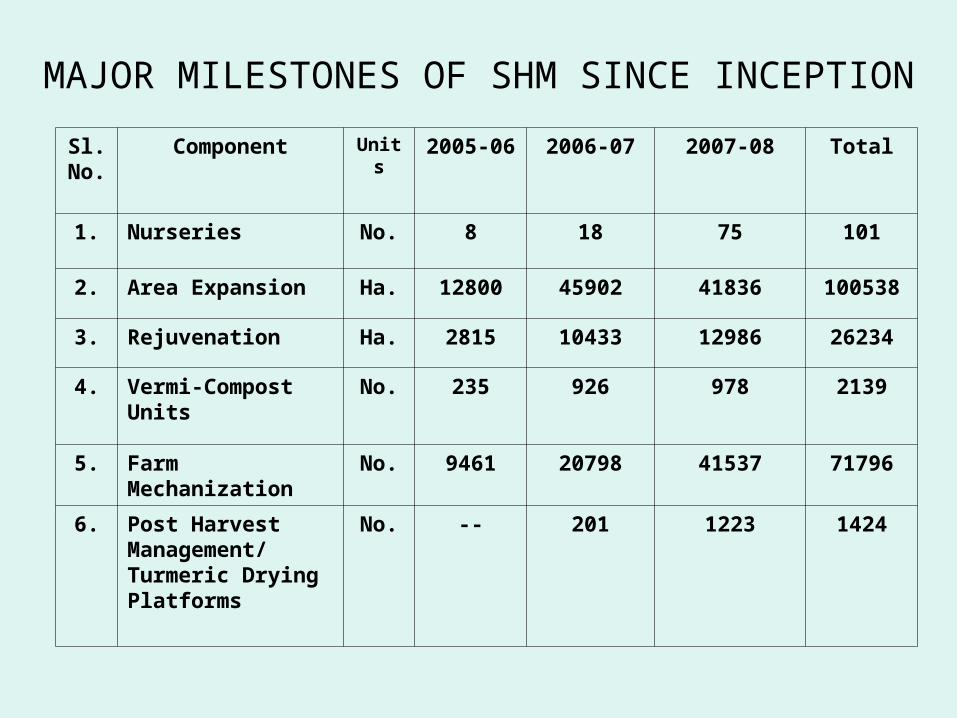
MAJOR MILESTONES OF SHM SINCE INCEPTION
Sl.No.
Component Units 2005-06 2006-07 2007-08 Total
1. Nurseries No. 8 18 75 101
2. Area Expansion Ha. 12800 45902 41836 100538
3. Rejuvenation Ha. 2815 10433 12986 26234
4. Vermi-Compost Units
No. 235 926 978 2139
5. Farm Mechanization No. 9461 20798 41537 71796
6. Post Harvest Management/ Turmeric Drying Platforms
No. -- 201 1223 1424
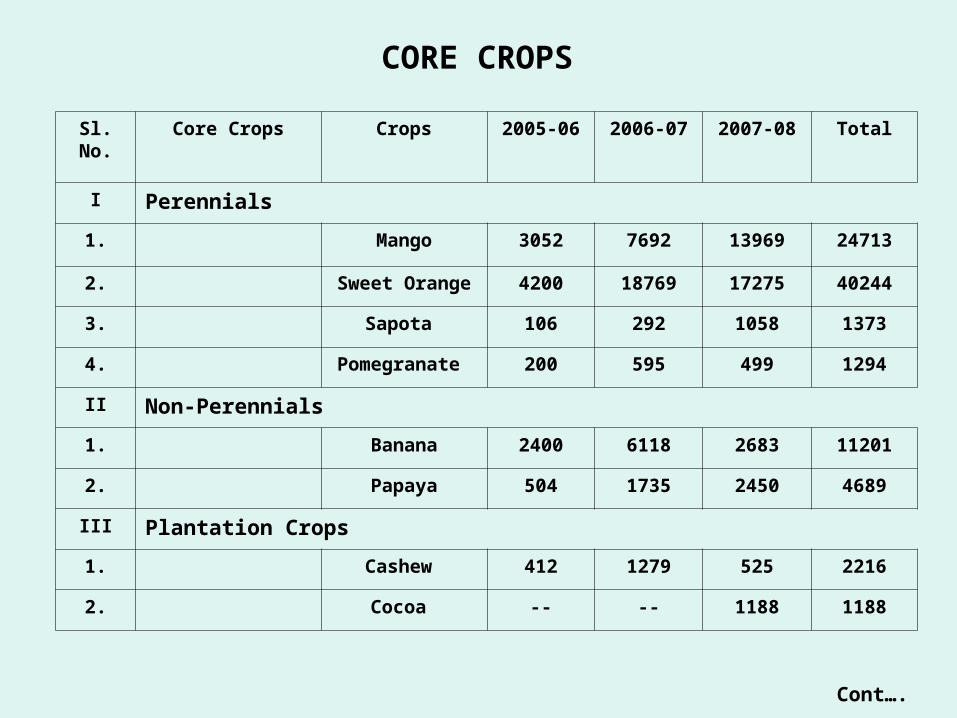
Sl. No. Core Crops Crops 2005-06 2006-07 2007-08 Total
I Perennials
1. Mango 3052 7692 13969 24713
2. Sweet Orange 4200 18769 17275 40244
3. Sapota 106 292 1058 1373
4. Pomegranate 200 595 499 1294
II Non-Perennials
1. Banana 2400 6118 2683 11201
2. Papaya 504 1735 2450 4689
III Plantation Crops
1. Cashew 412 1279 525 2216
2. Cocoa -- -- 1188 1188
CORE CROPS
Cont….
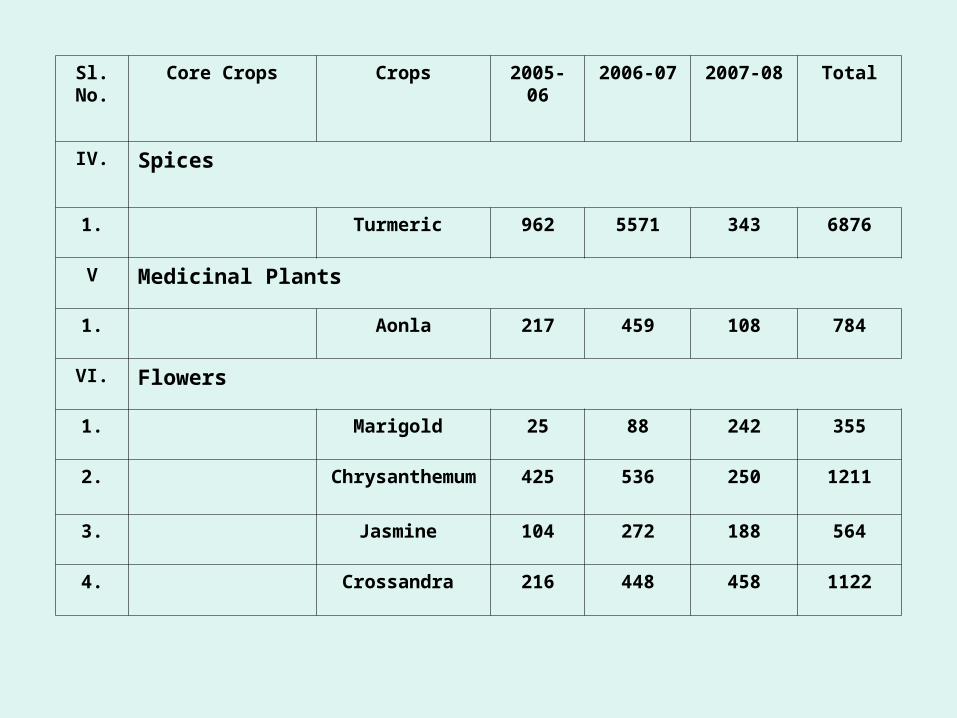
Sl. No.
Core Crops Crops 2005-06 2006-07 2007-08 Total
IV. Spices
1. Turmeric 962 5571 343 6876
V Medicinal Plants
1. Aonla 217 459 108 784
VI. Flowers
1. Marigold 25 88 242 355
2. Chrysanthemum 425 536 250 1211
3. Jasmine 104 272 188 564
4. Crossandra 216 448 458 1122
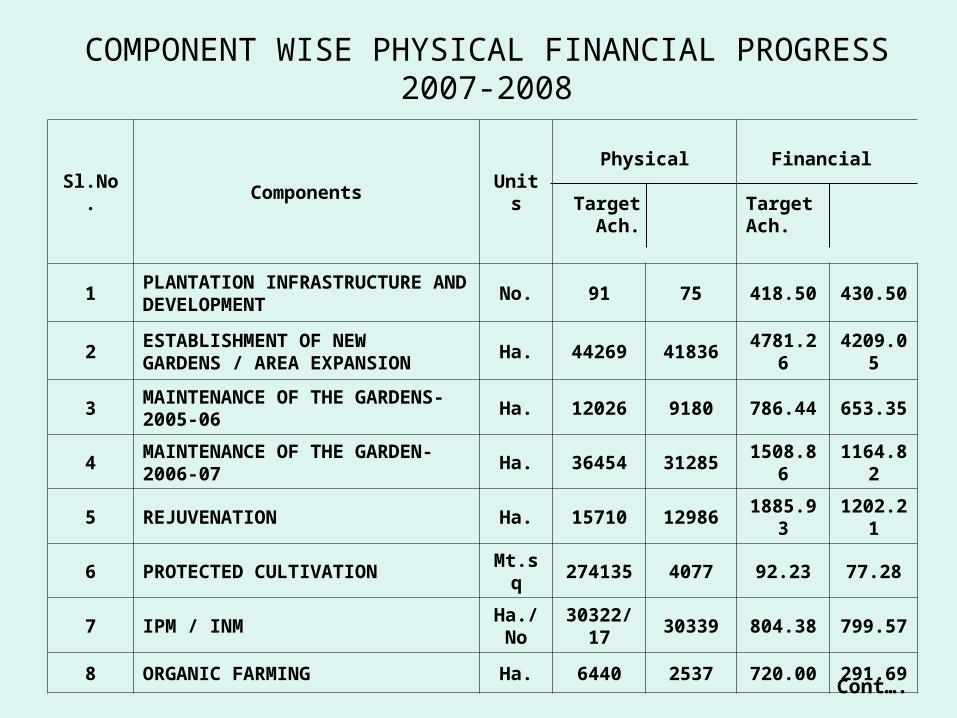
COMPONENT WISE PHYSICAL FINANCIAL PROGRESS 2007-2008
Sl.No. Components UnitsPhysical
Target Ach.
Financial
Target Ach.
1PLANTATION INFRASTRUCTURE AND DEVELOPMENT
No. 91 75 418.50 430.50
2ESTABLISHMENT OF NEW GARDENS / AREA EXPANSION
Ha. 44269 41836 4781.26 4209.05
3MAINTENANCE OF THE GARDENS- 2005-06
Ha. 12026 9180 786.44 653.35
4MAINTENANCE OF THE GARDEN- 2006-07
Ha. 36454 31285 1508.86 1164.82
5 REJUVENATION Ha. 15710 12986 1885.93 1202.21
6 PROTECTED CULTIVATION Mt.sq 274135 4077 92.23 77.28
7 IPM / INMHa./ No
30322/17
30339 804.38 799.57
8 ORGANIC FARMING Ha. 6440 2537 720.00 291.69
Cont….
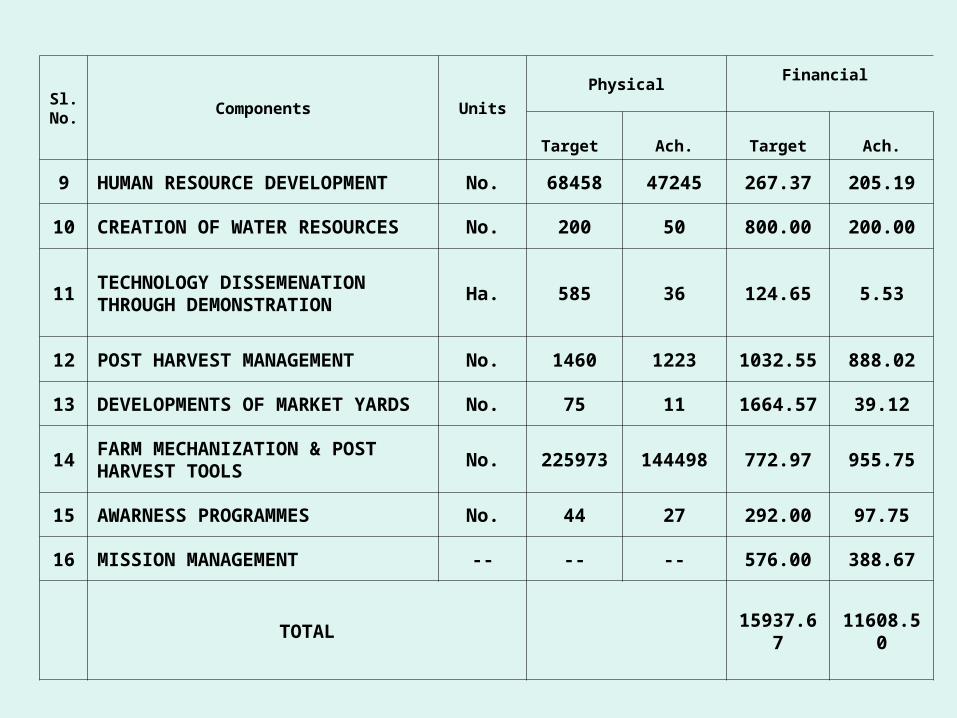
Sl.No.
Components Units
PhysicalFinancial
Target Ach. Target Ach.
9HUMAN RESOURCE DEVELOPMENT
No. 68458 47245 267.37 205.19
10CREATION OF WATER RESOURCES
No. 200 50 800.00 200.00
11TECHNOLOGY DISSEMENATION THROUGH DEMONSTRATION
Ha. 585 36 124.65 5.53
12 POST HARVEST MANAGEMENT No. 1460 1223 1032.55 888.02
13DEVELOPMENTS OF MARKET YARDS
No. 75 11 1664.57 39.12
14FARM MECHANIZATION & POST HARVEST TOOLS
No. 225973 144498 772.97 955.75
15 AWARNESS PROGRAMMES No. 44 27 292.00 97.75
16 MISSION MANAGEMENT -- -- -- 576.00 388.67
TOTAL 15937.67 11608.50
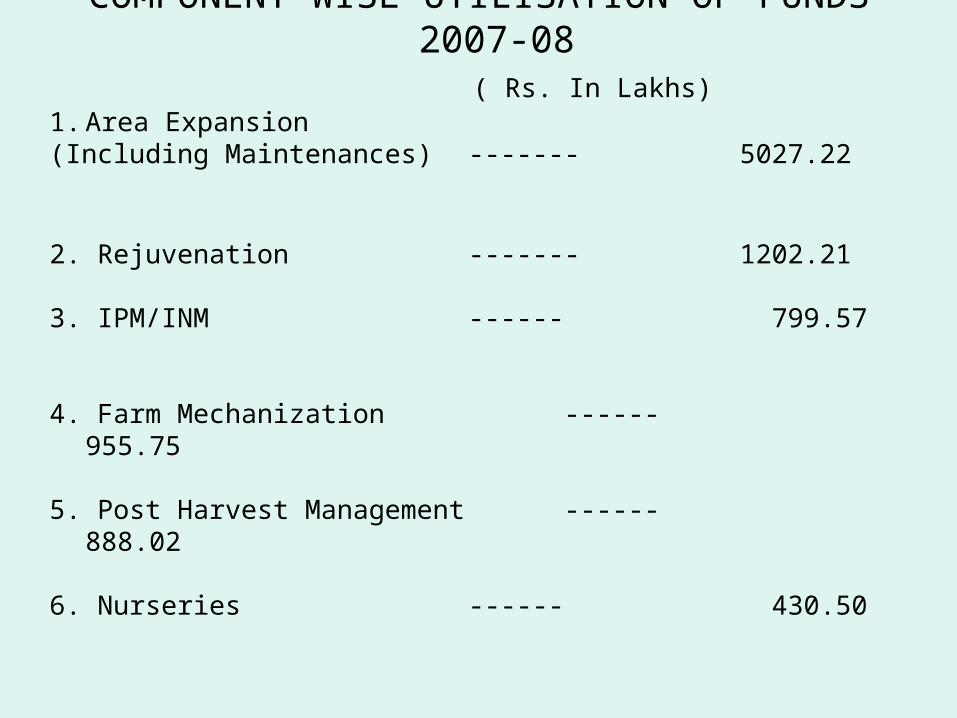
COMPONENT WISE UTILISATION OF FUNDS 2007-08
( Rs. In Lakhs)1. Area Expansion (Including Maintenances) ------- 5027.22
2. Rejuvenation ------- 1202.21 3. IPM/INM ------ 799.57
4. Farm Mechanization ------ 955.75
5. Post Harvest Management ------ 888.02
6. Nurseries ------ 430.50

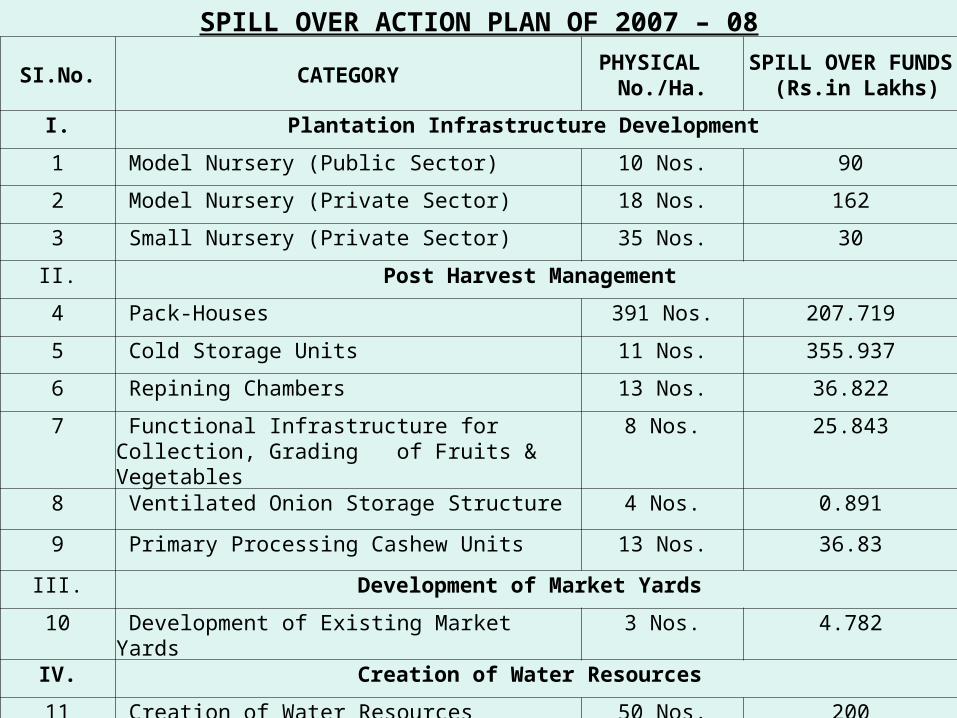
SPILL OVER ACTION PLAN OF 2007 – 08
SI.No. CATEGORYPHYSICAL
No./Ha.SPILL OVER FUNDS
(Rs.in Lakhs)
I. Plantation Infrastructure Development
1 Model Nursery (Public Sector) 10 Nos. 90
2 Model Nursery (Private Sector) 18 Nos. 162
3 Small Nursery (Private Sector) 35 Nos. 30
II. Post Harvest Management
4 Pack-Houses 391 Nos. 207.719
5 Cold Storage Units 11 Nos. 355.937
6 Repining Chambers 13 Nos. 36.822
7 Functional Infrastructure for Collection, Grading of Fruits & Vegetables
8 Nos. 25.843
8 Ventilated Onion Storage Structure 4 Nos. 0.891
9 Primary Processing Cashew Units 13 Nos. 36.83
III. Development of Market Yards
10 Development of Existing Market Yards 3 Nos. 4.782
IV. Creation of Water Resources
11 Creation of Water Resources 50 Nos. 200
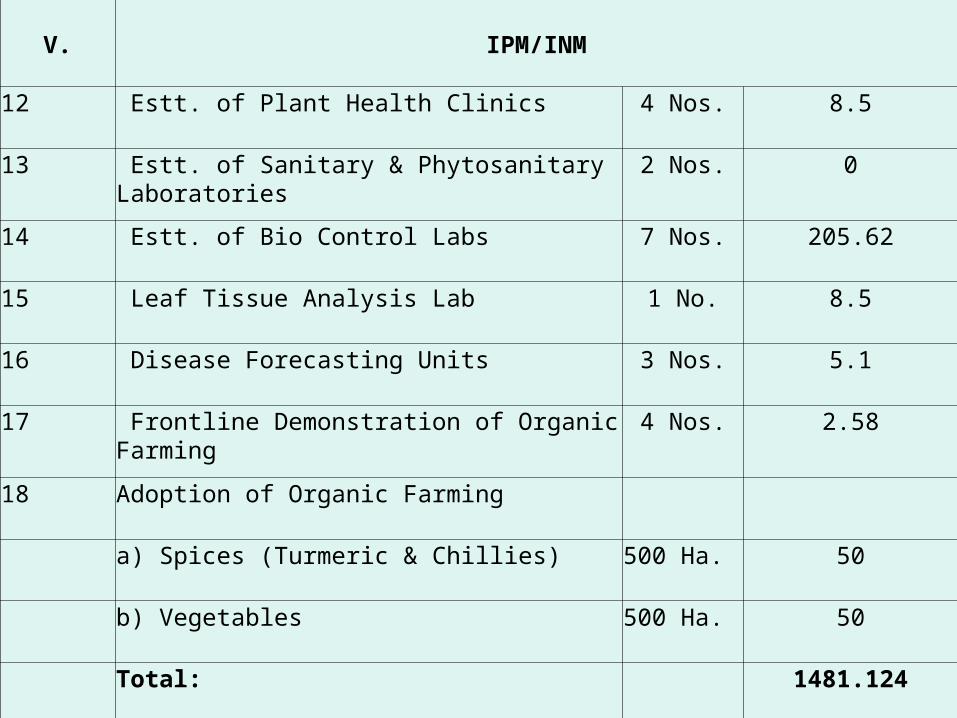
V. IPM/INM
12 Estt. of Plant Health Clinics 4 Nos. 8.5
13 Estt. of Sanitary & Phytosanitary Laboratories 2 Nos. 0
14 Estt. of Bio Control Labs 7 Nos. 205.62
15 Leaf Tissue Analysis Lab 1 No. 8.5
16 Disease Forecasting Units 3 Nos. 5.1
17 Frontline Demonstration of Organic Farming 4 Nos. 2.58
18 Adoption of Organic Farming
a) Spices (Turmeric & Chillies) 500 Ha. 50
b) Vegetables 500 Ha. 50
Total: 1481.124
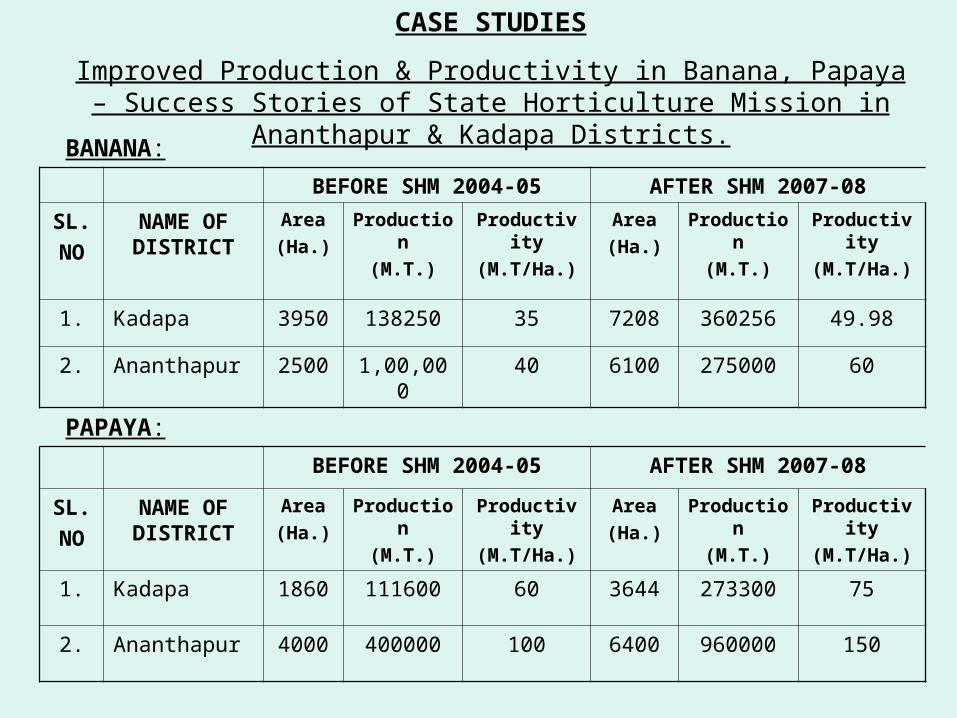
CASE STUDIES
Improved Production & Productivity in Banana, Papaya – Success Stories of State Horticulture Mission in Ananthapur & Kadapa Districts.
BEFORE SHM 2004-05 AFTER SHM 2007-08
SL.
NO
NAME OF DISTRICT
Area
(Ha.)
Production
(M.T.)
Productivity
(M.T/Ha.)
Area
(Ha.)
Production
(M.T.)
Productivity
(M.T/Ha.)
1. Kadapa 3950 138250 35 7208 360256 49.98
2. Ananthapur 2500 1,00,000 40 6100 275000 60
BEFORE SHM 2004-05 AFTER SHM 2007-08
SL.
NO
NAME OF DISTRICT
Area
(Ha.)
Production
(M.T.)
Productivity
(M.T/Ha.)
Area
(Ha.)
Production
(M.T.)
Productivity
(M.T/Ha.)
1. Kadapa 1860 111600 60 3644 273300 75
2. Ananthapur 4000 400000 100 6400 960000 150
BANANA:
PAPAYA:
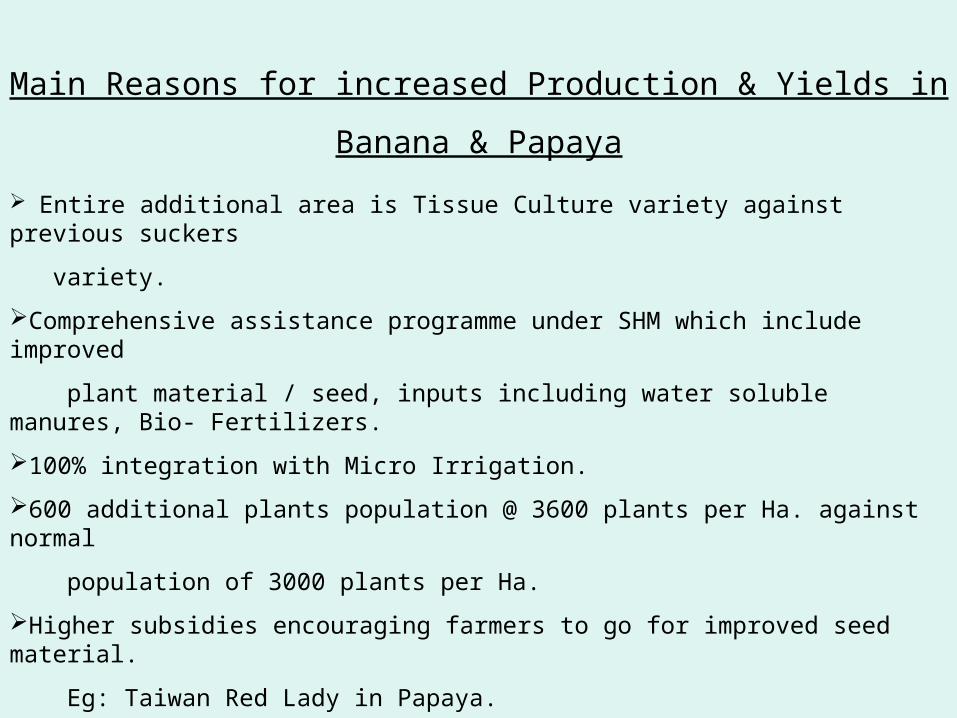
Main Reasons for increased Production & Yields in
Banana & Papaya
Entire additional area is Tissue Culture variety against previous suckers
variety.
Comprehensive assistance programme under SHM which include improved
plant material / seed, inputs including water soluble manures, Bio- Fertilizers.
100% integration with Micro Irrigation.
600 additional plants population @ 3600 plants per Ha. against normal
population of 3000 plants per Ha.
Higher subsidies encouraging farmers to go for improved seed material.
Eg: Taiwan Red Lady in Papaya.
Intensive crop specific training programmes on GAP & Viral Diseases
Management.

Impact Study on Cashew Rejuvenation Program taken- up in 2006-07 in Srikakulam District of Andhra Pradesh
(Case Study)
Total Area Under Cashew in the District: 19268 Ha.
Average Productivity Per Ha.: 0.599 M.T.
Reasons for Low Productivity.
a) Majority of the Gardens Seedling Variety.
b) Rain Fed Cultivation.
c) Lack of Good Agricultural Practices
d) Negligence & Poor Maintenance.
e) Affected with Root & Stem Borer & Tea Mosquito.

Area Taken-up for Rejuvenation in 1500 Ha. in 2006-07 SHM.
Mode of Implementation:
• Selection of orchards by Technical Team.
• Training & Awareness Building of all the farmers.
• Baseline Survey of the orchards to capture the condition of the orchard & productivity.
• Mostly implemented in tribal areas
• Package including assistance for good agricultural practices, inputs like fertilizers & chemicals.
Impact Observed:
• Impact Study done by a multi disciplinary team.
• Visible improvement in the condition of the garden.
• Incidence of Tea Mosquito & stem and root borer decreased from 30 to 10%.
• Yield of each cashew increased from 240 kg per Acre to 360 Kgs.
• Additional Income 4000 - 5000 Per Acre.
• Additional income by way of increased yields & reduced input cost.
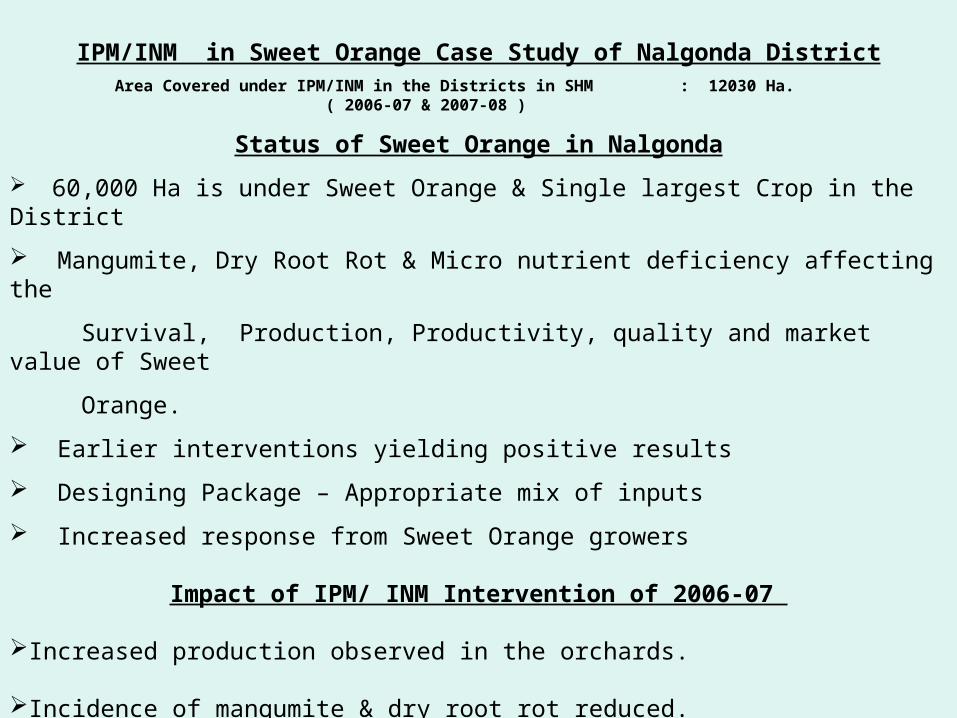
IPM/INM in Sweet Orange Case Study of Nalgonda District Area Covered under IPM/INM in the Districts in SHM : 12030 Ha. ( 2006-07 & 2007-08 )
Status of Sweet Orange in Nalgonda
60,000 Ha is under Sweet Orange & Single largest Crop in the District
Mangumite, Dry Root Rot & Micro nutrient deficiency affecting the
Survival, Production, Productivity, quality and market value of Sweet
Orange.
Earlier interventions yielding positive results
Designing Package – Appropriate mix of inputs
Increased response from Sweet Orange growers
Impact of IPM/ INM Intervention of 2006-07
Increased production observed in the orchards.
Incidence of mangumite & dry root rot reduced.
Correction in micro nutrient deficiencies observed.
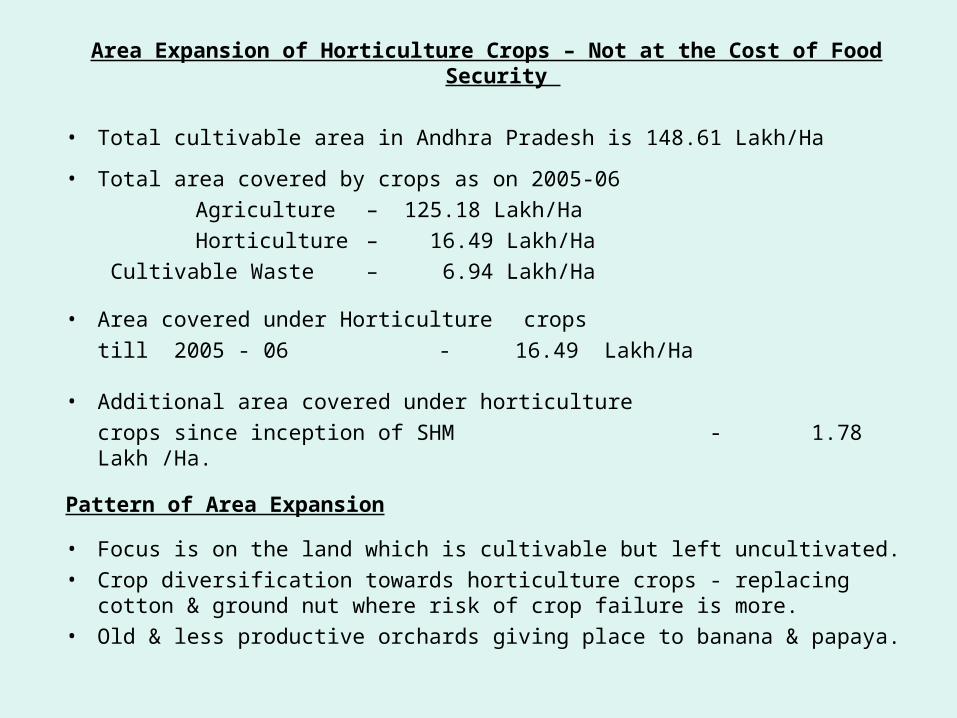
Area Expansion of Horticulture Crops – Not at the Cost of Food Security
• Total cultivable area in Andhra Pradesh is 148.61 Lakh/Ha
• Total area covered by crops as on 2005-06
Agriculture – 125.18 Lakh/Ha
Horticulture – 16.49 Lakh/Ha
Cultivable Waste – 6.94 Lakh/Ha
• Area covered under Horticulture crops
till 2005 - 06 - 16.49 Lakh/Ha
• Additional area covered under horticulture
crops since inception of SHM - 1.78 Lakh /Ha.
Pattern of Area Expansion
• Focus is on the land which is cultivable but left uncultivated.
• Crop diversification towards horticulture crops - replacing cotton & ground nut where risk of crop failure is more.
• Old & less productive orchards giving place to banana & papaya.
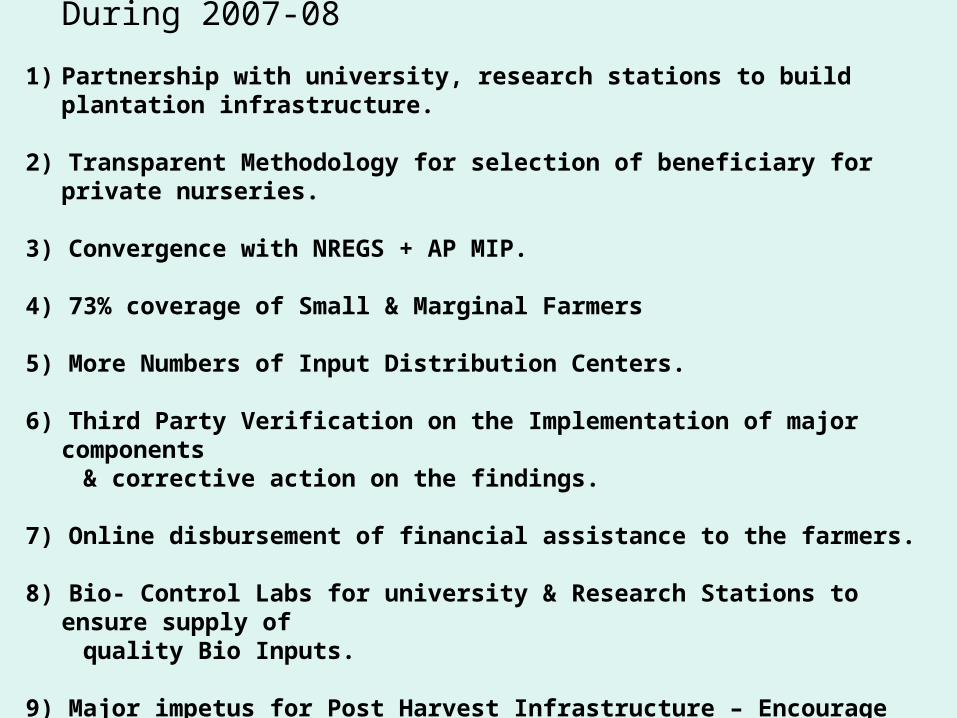
Major Initiatives in Implementation of SHM During 2007-08
1) Partnership with university, research stations to build plantation infrastructure.
2) Transparent Methodology for selection of beneficiary for private nurseries.
3) Convergence with NREGS + AP MIP.
4) 73% coverage of Small & Marginal Farmers
5) More Numbers of Input Distribution Centers.
6) Third Party Verification on the Implementation of major components & corrective action on the findings.
7) Online disbursement of financial assistance to the farmers.
8) Bio- Control Labs for university & Research Stations to ensure supply of quality Bio Inputs.
9) Major impetus for Post Harvest Infrastructure – Encourage growers cooperatives for setting up of Ripening Chambers.

ANNUAL ACTION PLAN 2008-’09 Approach Followed
District level workshops with stakeholders for preparation of Action Plan.
Convergence with NREGS for area expansion.
Cluster based approach for Rejuvenation under the technical guidance of Research Stations & University.
Campaign mode of implementation in IPM/INM in selected areas.
Partnership with department of Tribal Welfare for adoption of Organic Farming.
35% of total plan outlay allotted for Post Harvest, Marketing Infrastructure and Farm Machination.
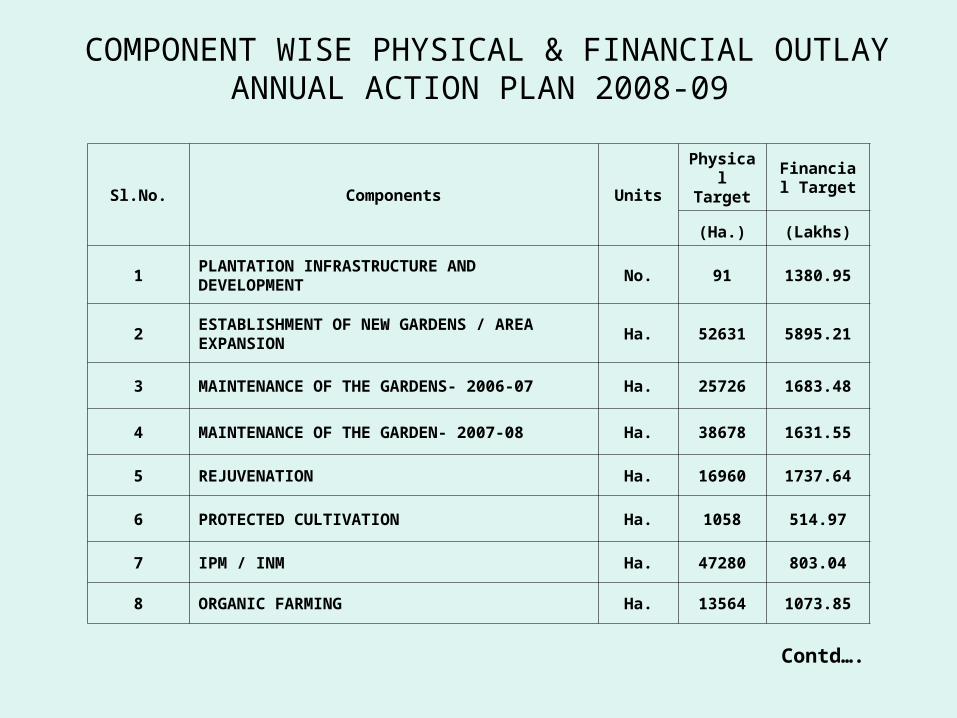
COMPONENT WISE PHYSICAL & FINANCIAL OUTLAY ANNUAL ACTION PLAN 2008-09
Sl.No. Components Units
Physical Target
Financial Target
(Ha.) (Lakhs)
1PLANTATION INFRASTRUCTURE AND DEVELOPMENT
No. 91 1380.95
2ESTABLISHMENT OF NEW GARDENS / AREA EXPANSION
Ha. 52631 5895.21
3 MAINTENANCE OF THE GARDENS- 2006-07 Ha. 25726 1683.48
4 MAINTENANCE OF THE GARDEN- 2007-08 Ha. 38678 1631.55
5 REJUVENATION Ha. 16960 1737.64
6 PROTECTED CULTIVATION Ha. 1058 514.97
7 IPM / INM Ha. 47280 803.04
8 ORGANIC FARMING Ha. 13564 1073.85
Contd….

Sl.No. Components Units
Physical Target
Financial Target
(Ha.) (Lakhs)
9 HUMAN RESOURCE DEVELOPMENT No. 79769 452.38
10 CREATION OF WATER RESOURCES No. 600 1200.00
11TECHNOLOGY DISSEMENATION THROUGH DEMONSTRATION
Ha. 1023 135.63
12 POST HARVEST MANAGEMENT No. 2289 1881.03
13 DEVELOPMENTS OF MARKET YARDS No. 244 2106.25
14FARM MECHANIZATION & POST HARVEST TOOLS
No. 571599 1966.11
15 AWARNESS PROGRAMMES No. 44 315.50
16 MISSION MANAGEMENT -- -- 1247.00
TOTAL 24024.57
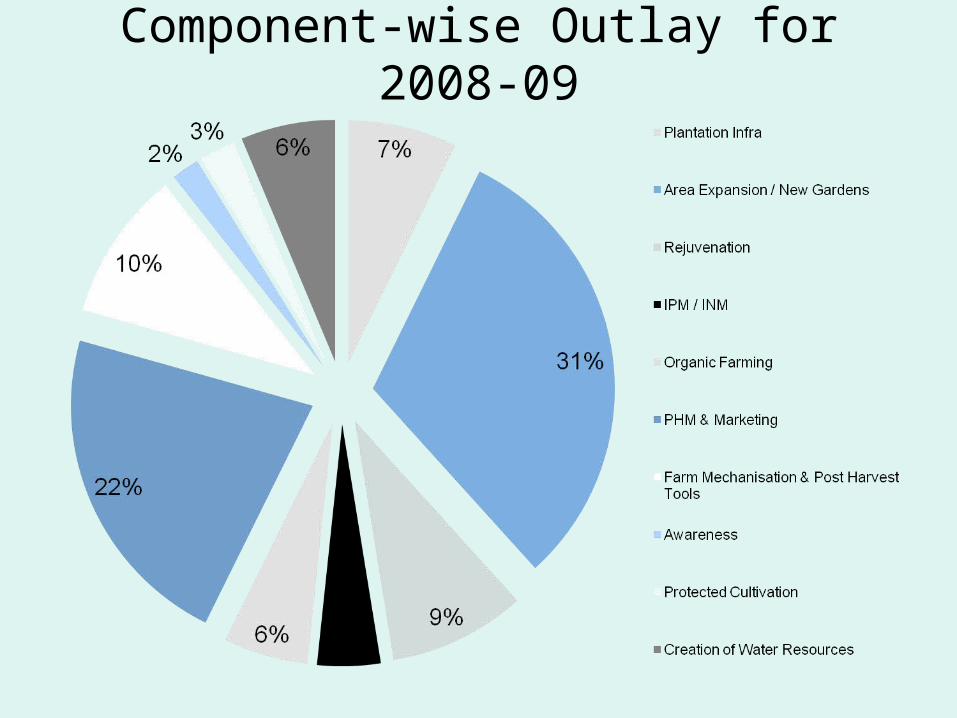
Component-wise Outlay for 2008-09
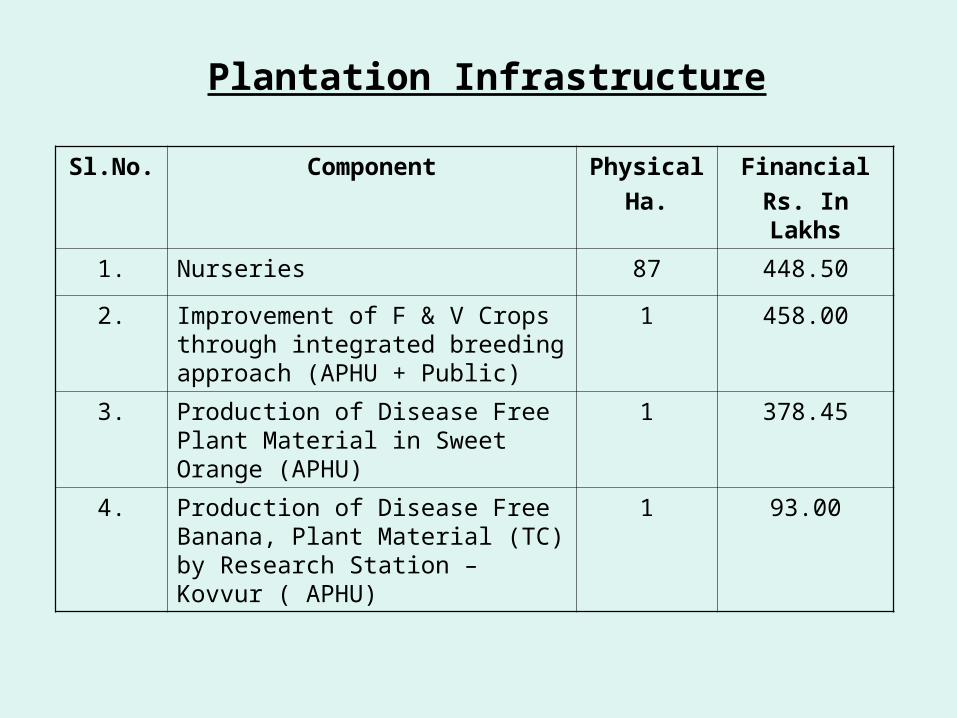
Plantation Infrastructure
Sl.No. Component Physical
Ha.
Financial
Rs. In Lakhs
1. Nurseries 87 448.50
2. Improvement of F & V Crops through integrated breeding approach (APHU + Public)
1 458.00
3. Production of Disease Free Plant Material in Sweet Orange (APHU)
1 378.45
4. Production of Disease Free Banana, Plant Material (TC) by Research Station – Kovvur ( APHU)
1 93.00

Area Expansion
Sl.No. Sub Component Physical
Ha.
Financial
Rs. In Lakhs
1. Perennials 34813 3766.33
2. Non Perennials 9257 1110.84
3. Spices 2260 254.26
4. Plantation Crops 3230 177.69
5. Medicinal & Aromatic Plants 506 65.03
6. Flowers 2565 376.04
7. Non Traditional Crops 600 145.00
Total 52631 5895.21

JUSTIFICATION FOR HIGHER OUTLAY FOR
AREA EXPANSION
25.57% increase over the previous year achievement
NREGS Convergence helping Small & Marginal farmers
Crop diversification in drought prone districts especially Ananthapur,
Kadapa, Mahabubnagar, Nalgonda, & Prakasam etc.– Shift from
risk crops to horticulture crops.
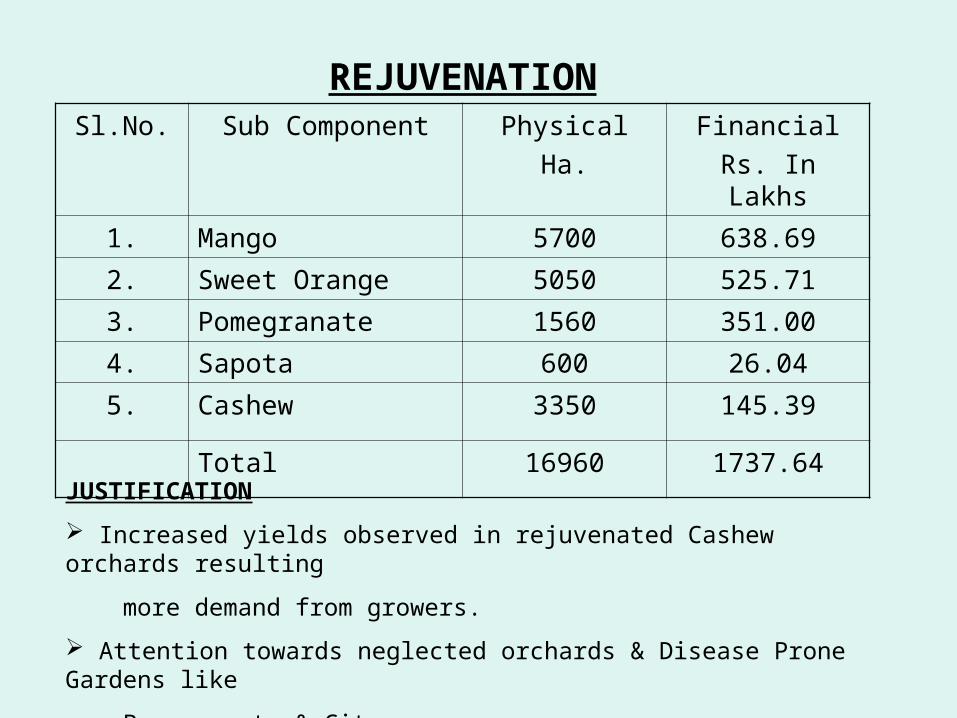
REJUVENATIONSl.No. Sub Component Physical
Ha.
Financial
Rs. In Lakhs
1. Mango 5700 638.69
2. Sweet Orange 5050 525.71
3. Pomegranate 1560 351.00
4. Sapota 600 26.04
5. Cashew 3350 145.39
Total 16960 1737.64
JUSTIFICATION
Increased yields observed in rejuvenated Cashew orchards resulting
more demand from growers.
Attention towards neglected orchards & Disease Prone Gardens like
Pomegranate & Citrus.

S.No Components UnitsPhy.
Target Fin.
Targert
1 Green Houses Ha. 3 83.13
2 Mulching Ha. 262 18.34
3 Shade Nets Ha. 41 28.70
4Establishment of Pendals for Vegetables
Ha. 190 85.50
5Poly tunnels for Hybrid Vegetable Seedling Nursery
Ha. 42 56.70
6Shadenet House for Vegetable Nursery
Ha. 70 73.85
7Establishment of Trellies System for Vegetables
Ha. 450 168.75
Total: 1,058 514.97
PROTECTED CULTIVATION
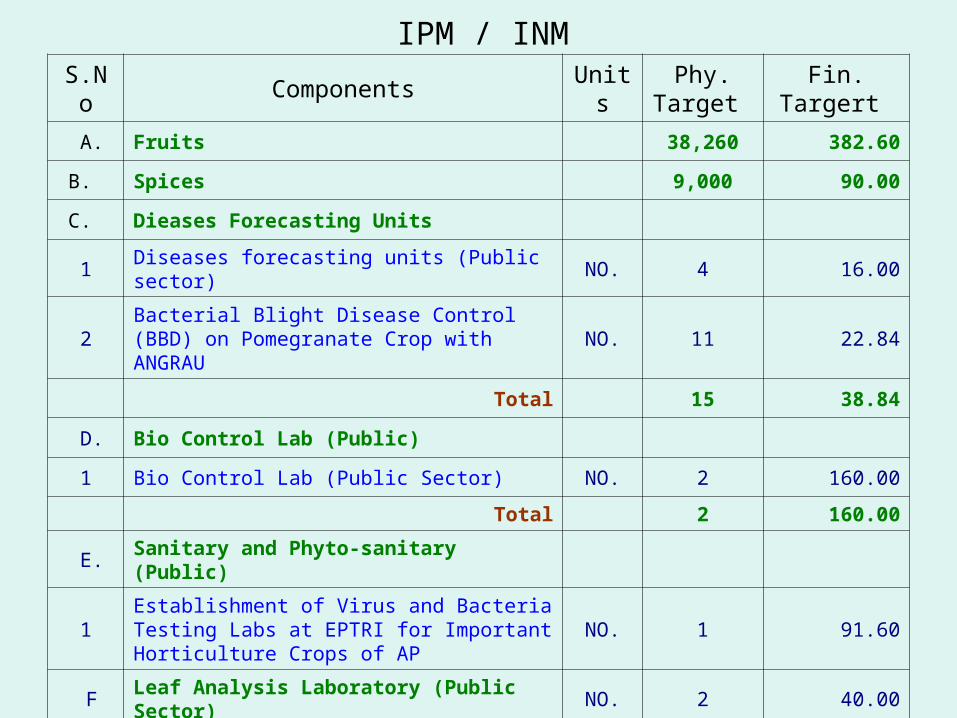
S.No Components UnitsPhy.
Target Fin. Targert
A. Fruits 38,260 382.60
B. Spices 9,000 90.00
C. Dieases Forecasting Units
1 Diseases forecasting units (Public sector) NO. 4 16.00
2Bacterial Blight Disease Control (BBD) on Pomegranate Crop with ANGRAU
NO. 11 22.84
Total 15 38.84
D. Bio Control Lab (Public)
1 Bio Control Lab (Public Sector) NO. 2 160.00
Total 2 160.00
E. Sanitary and Phyto-sanitary (Public)
1Establishment of Virus and Bacteria Testing Labs at EPTRI for Important Horticulture Crops of AP
NO. 1 91.60
FLeaf Analysis Laboratory (Public Sector)
NO. 2 40.00
Total 47,280 803.04
IPM / INM

A. Adoption of Organic Farming 7,325 732.50
B. Vermicompost Units 2,139 320.85
C. Organic Certification 4,100 20.50
Total 13,564 1,073.85
ORGANIC FARMING
JUSTIFICATION
Partnership with Department of Tribal Welfare & Rural Development.
Implementation through Public, Private Partnership.
Buy back agreement to the organic produce.
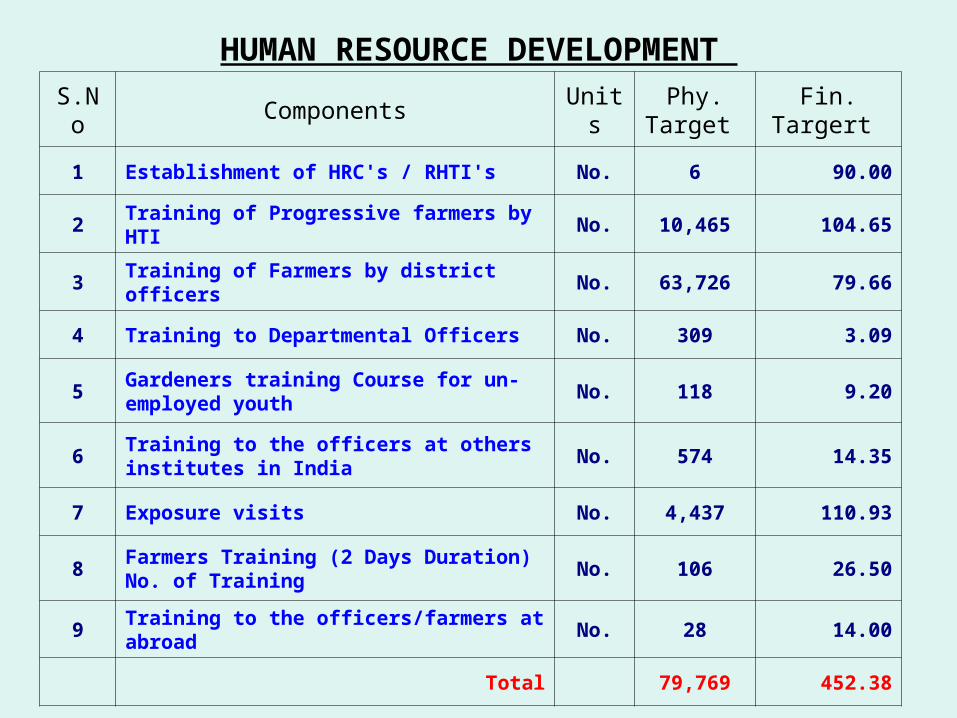
S.No Components UnitsPhy.
Target Fin. Targert
1 Establishment of HRC's / RHTI's No. 6 90.00
2Training of Progressive farmers by HTI
No. 10,465 104.65
3Training of Farmers by district officers
No. 63,726 79.66
4 Training to Departmental Officers No. 309 3.09
5Gardeners training Course for un-employed youth
No. 118 9.20
6Training to the officers at others institutes in India
No. 574 14.35
7 Exposure visits No. 4,437 110.93
8Farmers Training (2 Days Duration) No. of Training
No. 106 26.50
9Training to the officers/farmers at abroad
No. 28 14.00
Total 79,769 452.38
HUMAN RESOURCE DEVELOPMENT

S.No Components UnitsPhy.
Target Fin. Targert
CREATION OF WATER RESOURCES
1CREATION OF WATER RESOURCES (As per Project Report)
No. 600 1,200.00
TECHNOLOGY DISSEMINATION THROUGH DEMONSTRATION
A. Demonstrations at Farmers Fields
1 IPM on Vegetables/Chillies Ha. 420 9.45
2 IPM on Fruits Ha. 343 77.18
3 Organic farming vegetables/Spices Ha. 160 24.00
Sub-total 923 110.63
B. Frontline Demonstration on Public Sector
1Frontline Demonstration on Public Sector Farms
No. 100 25.00
Sub-total 100 25.00
Total 1,023 135.63
CREATION OF WATER RESOURCES & TECHNOLOGY DISSEMINATION THROUGH DEMONSTRATION

Sl.No
Components UnitsPhy.
Target Fin.
Targert
1 Pack Houses No. 551 344.38
2 Cold Storage No. 15 750.00
3 Refer vans/ Containers No. 13 78.00
4 Ripening chambers No. 22 110.00
5 Papaya Value Adition No. 1 5.00
6Aonla Seed Seperator Boiler cum dryer
No. 2 5.00
7 Cocoa Drying Platform No. 30 3.75
8IQF Units (Individual Quick Freezing Units)
No. 1 25.00
Cont…..
POST HARVEST MANAGEMENT

Sl.No
Components UnitsPhy.
Target Fin.
Targert
9Conversion of Existing Cashew Processing Units Into Steam Boiling Units
No. 19 38.00
10
Development of Post Harvest Facility for Handling of Horticulture Produce & Training Centre, A.P.H.U. (Public)
No. 1 239.65
11Cashew Steam Boiling Units ( 100 Kg. Capacity)
No. 30 9.00
12Cashew Steam Boiling Units ( 1000 Kg.)
No. 20 60.00
13 Turmeric drying platforms No. 1,542 192.75
14 Chillies Drying Platforms No. 40 12.50
15 Aloevera Extraction Units No. 2 8.00
Total 2,289 1,881.03

POST HARVEST MANAGEMENT & MARKETING INFRASTRUCTURE
Together account for almost 25% of the outlay
Enthusiastic response from farmers entrepreneurs & Cooperatives
during 2007-08.
7 focus districts having the potential, identified for setting up of PHM &
Marketing Infrastructure.

DEVELOPMENTS OF MARKET YARDS
Component Units Physical Target
Financial Target
Rural Markets / Rytu Bazars / Apni Mandies
No. 161 603.75
Functional infrastructure for collection grading etc
No. 62 232.50
Setting up of whole sale markets No. 6 600.00
Preparation of feasibility report of setting of whole sale market
No. 4 40.00
Creation / Strengthening of additional infrastructure to the new / existing market yards (Project based.)
-- 11 630.00
Total 244 2106.25

FARM MECHANISATION - PRE & POST HARVEST TOOLS
Component Physical Target
Financial Target
(Rs. In Lakhs)
Plant Protection Equipment 22,422 857.93
Pre – Harvest Tools 7,925 240.31
Post Harvesting Tools 541252 867.87
Total 571599 1966.11
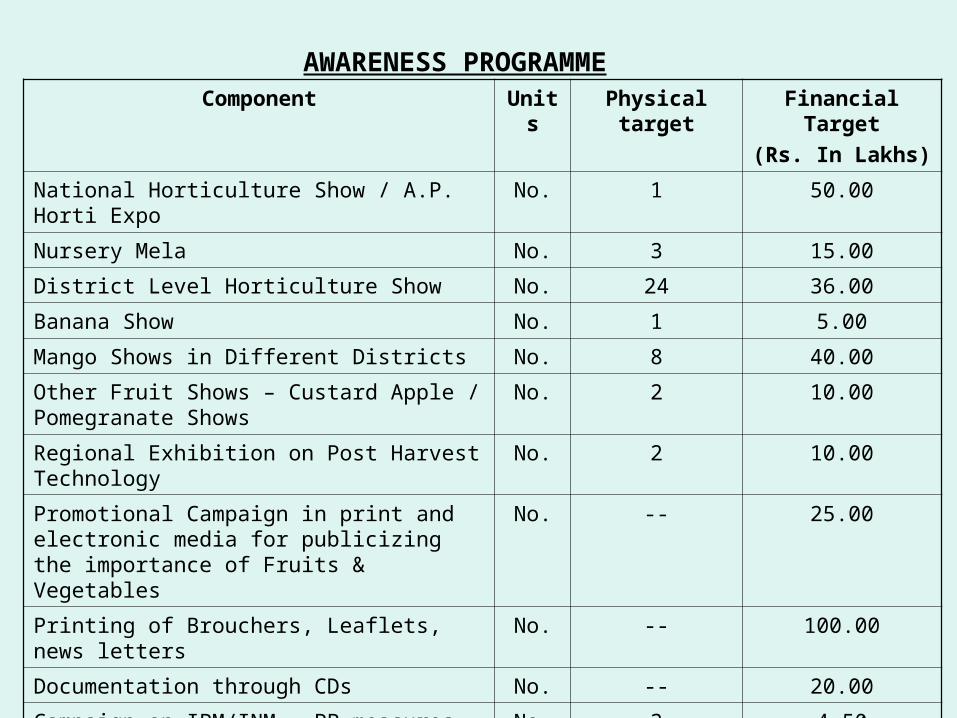
AWARENESS PROGRAMMEComponent Units Physical target Financial Target
(Rs. In Lakhs)
National Horticulture Show / A.P. Horti Expo No. 1 50.00
Nursery Mela No. 3 15.00
District Level Horticulture Show No. 24 36.00
Banana Show No. 1 5.00
Mango Shows in Different Districts No. 8 40.00
Other Fruit Shows – Custard Apple / Pomegranate Shows
No. 2 10.00
Regional Exhibition on Post Harvest Technology
No. 2 10.00
Promotional Campaign in print and electronic media for publicizing the importance of Fruits & Vegetables
No. -- 25.00
Printing of Brouchers, Leaflets, news letters No. -- 100.00
Documentation through CDs No. -- 20.00
Campaign on IPM/INM – PP measures No. 3 4.50
Total 44 315.50
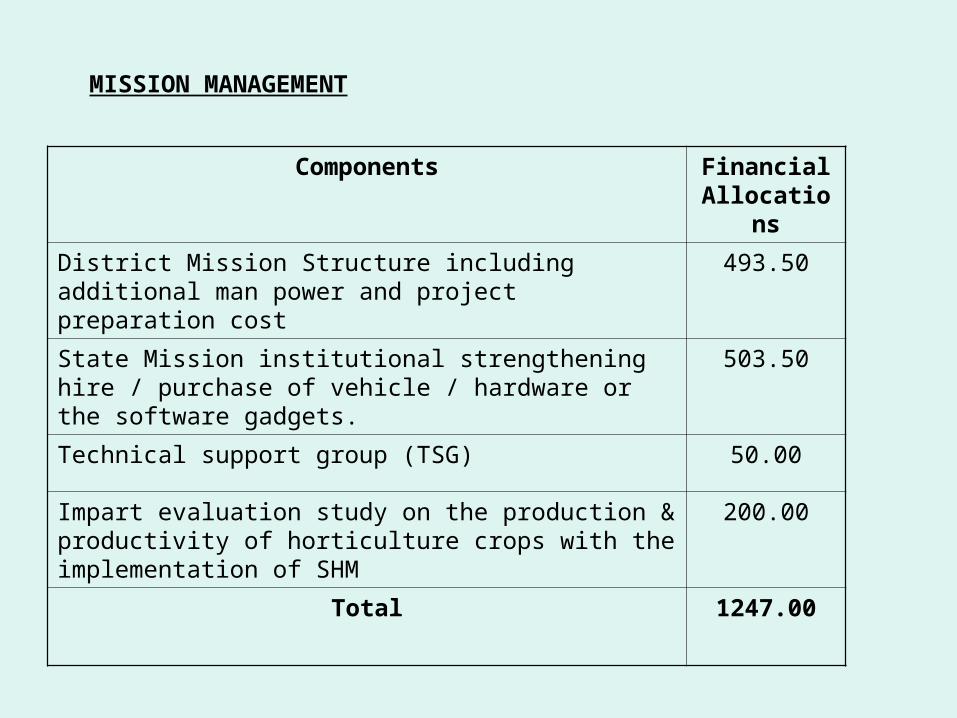
MISSION MANAGEMENT
Components Financial Allocations
District Mission Structure including additional man power and project preparation cost
493.50
State Mission institutional strengthening hire / purchase of vehicle / hardware or the software gadgets.
503.50
Technical support group (TSG) 50.00
Impart evaluation study on the production & productivity of horticulture crops with the implementation of SHM
200.00
Total 1247.00