Embed Size (px)
DESCRIPTION
State Higher Education Finance Fiscal Year 2012. Summary of Analysis and Findings. Agenda. History of the SHEF Project SHEF Metrics and Adjustments HECA vs. CPI Summary of FY 2012 Findings National State-level Additional Data / Analysis Opportunities. SHEF History. - PowerPoint PPT Presentation
Citation preview

State Higher Education FinanceFiscal Year 2012
Summary of Analysis and Findings

Agenda
History of the SHEF Project SHEF Metrics and Adjustments
HECA vs. CPI Summary of FY 2012 Findings
National State-level
Additional Data / Analysis Opportunities

SHEF History The tenth report, SHEF FY 2012, was released
on March 6, 2013
SHEF builds upon Dr. Kent Halstead’s “Halstead Finance Survey” and the corresponding data going back to 1972
Halstead ceased publishing his study in 1998. SHEEO membership encouraged SHEEO to embark on a similar study moving forward

SHEF History Halstead transferred his dataset to SHEEO
which became the historical basis for SHEF
First SHEF report released in 2004 for FY 2003
SHEEO moved to an online data collection tool (SSDB) in 2010 and aligned the SHEF Survey with the Grapevine Survey maintained by Illinois State University
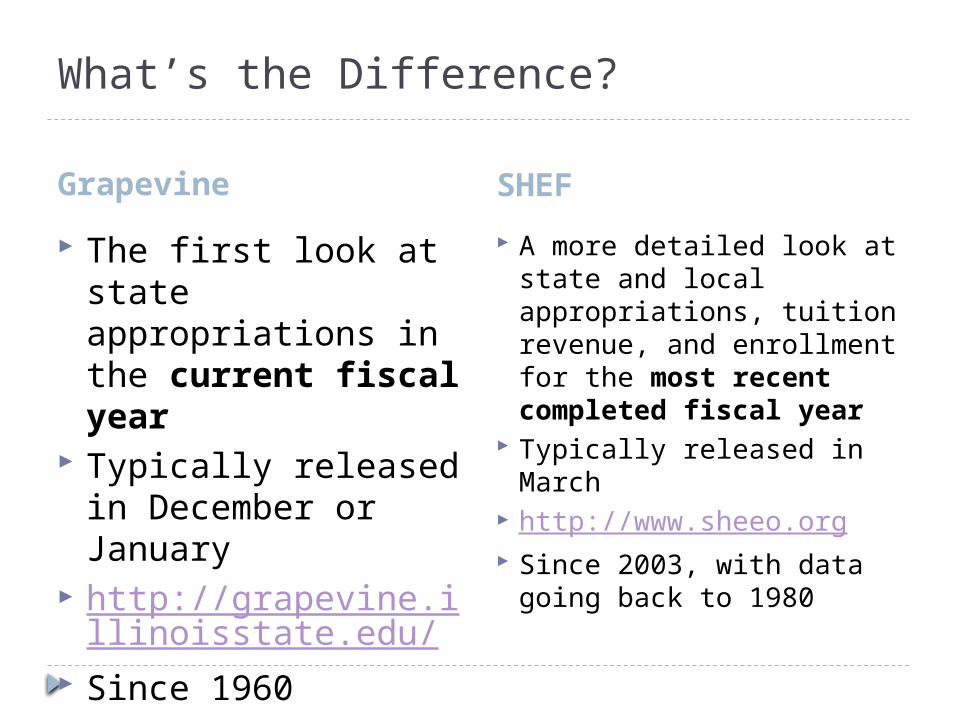
What’s the Difference?
Grapevine SHEF The first look at state
appropriations in the current fiscal year
Typically released in December or January
http://grapevine.illinoisstate.edu/
Since 1960
A more detailed look at state and local appropriations, tuition revenue, and enrollment for the most recent completed fiscal year
Typically released in March
http://www.sheeo.org Since 2003, with data
going back to 1980
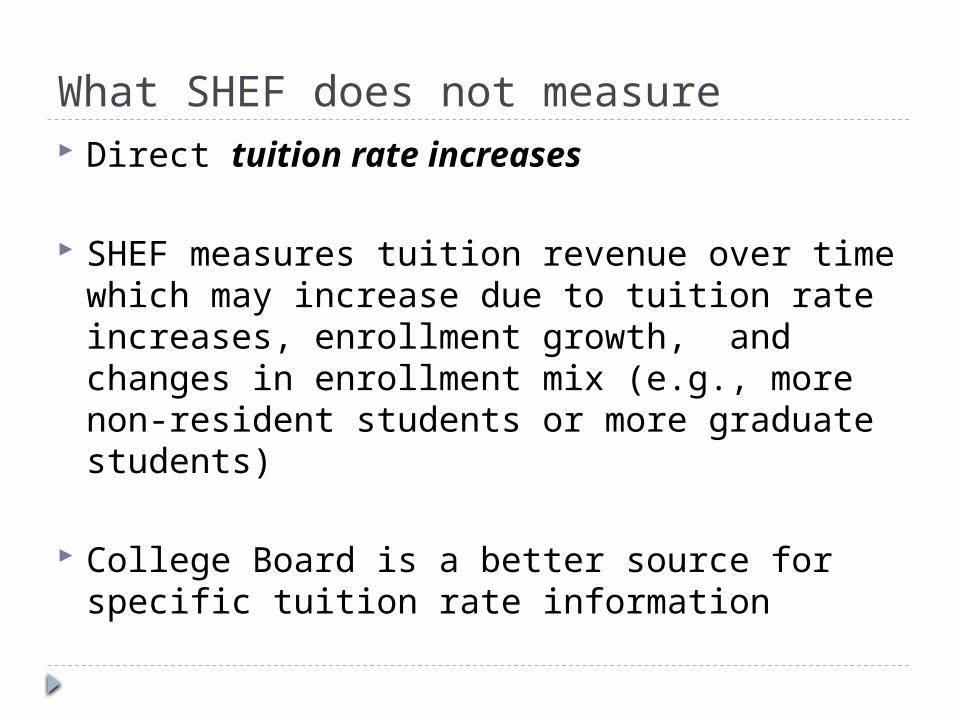
What SHEF does not measure Direct tuition rate increases
SHEF measures tuition revenue over time which may increase due to tuition rate increases, enrollment growth, and changes in enrollment mix (e.g., more non-resident students or more graduate students)
College Board is a better source for specific tuition rate information

SHEF Metrics State and Local Support
Educational Appropriations
Net Tuition Revenue
Full-Time Equivalent Enrollment (FTE)
Total Educational Revenue
Make up the Wave Chart

SHEF Adjustments - HECA Higher Education Cost Adjustment (HECA)
To measure inflation over time, $s adjusted to current year
SHEEO developed as an alternative to CPI and HEPI as a means to account for the “market basket of goods” higher education must purchase, that is, primarily personnel costs
Constructed from two existing federal indices - the Employee Cost Index (75%) and GDP-Implicit Price Deflator (25%)
FY 2011 appropriation: $1000Divide by corresponding HECA: $1000/0.9824FY 2011 appropriation in FY 2012 $s: $1018

HECA vs. CPI - HECA Criticisms HECA’s critics argue that HECA has historically
grown more quickly than CPI and therefore overstates the amount of support institutions need in order to keep up with inflation
A further critique is that HECA is a meaningless figure for families struggling to pay tuition costs
HECACPI

HECA vs. CPI - SHEEO’s Response Institutions of higher education primary costs are
driven by personnel expenditures which make up the bulk of the higher education “market basket of goods.” SHEF’s intent is to measure trends in revenue for educational delivery. HECA is a reasonable means to compare available revenue to necessary expenditures
Little difference between CPI and HECA since 2007, due to flat salaries. Since 2010, CPI is growing faster than HECA
CPI is a better measure for tuition rate increases, which SHEF does not measure. SHEF tracks changes in net tuition revenues

SHEF Adjustments – EMI and COLA Enrollment Mix Index (EMI)
To adjust for differences in the mix of enrollment and costs among types of institutions among the states
Aggregated IPEDS data Cost of Living Adjustment (COLA)
To account for cost of living differences among the states
Derived from the 2003 Berry Index that provides a single index for each state
State X with $1000 educational appropriationAdjust by EMI: $1000/0.95 = $1053Adjust by EMI and COLA: $1053/1.01 = $1043

National-level Findings Enrollment grew 15.6% since 2007 to
over 11.5 million FTE in 2012 (down slightly from 2011)
For the third year in a row, educational appropriations per student hit a 25-year low and were $5,906 in 2012 (down 23.0% since 2007)
Net tuition revenue per student continued to increase, reaching $5,189 in 2012 (up 19.1% since 2007). It now makes up 47.0% of total educational revenue
Tuition increases did not offset reductions in state and local support. Total educational revenue is down 7.9% since 2007


State-level Findings All fifty states grew enrollment since
2007, ranging from 4.2% growth in California to 36.2% in Oregon
Two states, Illinois and North Dakota increased per student educational appropriations since 2007. Illinois’ increase is due to addressing the historic underfunding of its pension program
48 states decreased educational appropriations per FTE
Percent of total revenue from net tuition ranges from 13.8% in Wyoming to 85.1% in Vermont in 2012
In 36 states, total educational revenue decreased since 2007, despite increases in net tuition revenue

Calif
orni
aNe
vada
Main
eIll
inoi
sW
iscon
sinLo
uisia
naPe
nnsy
lvan
iaRh
ode
Islan
dMi
chig
anW
est V
irgin
iaNo
rth D
akot
aDe
lawa
reOk
laho
ma
Minn
esot
aVe
rmon
tKa
nsas
Alab
ama
Kent
ucky
Nebr
aska
Conn
ectic
utSo
uth
Dako
taNe
w Yo
rk USMo
ntan
aW
yom
ing
Hawa
iiAl
aska
Iowa
Indi
ana
New
Mexi
coW
ashi
ngto
nTe
nnes
see
Mass
achu
setts
Ohio
Virg
inia
North
Car
olin
aAr
izona
Miss
ouri
Sout
h Ca
rolin
aNe
w Je
rsey
New
Ham
pshi
reAr
kans
asCo
lora
doTe
xas
Miss
issip
piMa
ryla
ndFlo
rida
Utah
Geor
gia
Idah
oOr
egon
0%
5%
10%
15%
20%
25%
30%
35%
40%
4.2%
15.6%
36.2%
Source: State Higher Education Executive Officers
Figure 5Full-Time Equivalent (FTE) Enrollment in Public Higher Education
Percent Change by State, Fiscal 2007-2012

New
Ham
pshi
reFlo
rida
Idah
oSo
uth
Caro
lina
Arizo
naW
ashi
ngto
nVi
rgin
iaNe
vada
Oreg
onPe
nnsy
lvan
iaTe
nnes
see
Mich
igan
Mass
achu
setts
Colo
rado
Geor
gia
Alab
ama
Loui
siana
Iowa
Minn
esot
aMi
ssou
riOh
ioUt
ahCa
lifor
nia
Dela
ware
Hawa
ii USNe
w Me
xico
New
Jers
eyMi
ssiss
ippi
Kans
asOk
laho
ma
Mary
land
Rhod
e Isl
and
Kent
ucky
Sout
h Da
kota
Conn
ectic
utIn
dian
aAr
kans
asVe
rmon
tW
iscon
sinNe
w Yo
rkNo
rth C
arol
ina
Wyo
min
gMa
ine
Nebr
aska
Texa
sMo
ntan
aW
est V
irgin
iaAl
aska
Illin
ois
North
Dak
ota
-60%
-50%
-40%
-30%
-20%
-10%
0%
10%
20%
30%
40%
-50.7%
-23.0%
30.7%
Note: Dollars adjusted by 2012 HECA, Cost of Living Adjustment, and Enrollment Mix Index.
Source: State Higher Education Executive Officers
Figure 6Educational Appropriations per FTE
Percent Change by State, Fiscal 2007-2012

Wyo
min
gNe
w Me
xico
Calif
orni
aAl
aska
North
Car
olin
aHa
waii
Illin
ois
Neva
daNe
w Y
ork
Geor
gia
Idah
oTe
xas
Arka
nsas
Florid
aNe
bras
kaLo
uisia
naOk
laho
ma
Was
hing
ton
Wisc
onsi
nKe
ntuc
ky USTe
nnes
see
Utah
Miss
issip
piCo
nnec
ticut
North
Dak
ota
Miss
ouri
Kans
asMa
ssac
huse
ttsM
aryl
and
Ariz
ona
New
Jers
eyMo
ntan
aW
est V
irgin
iaMa
ine
Indi
ana
Oreg
onIo
waAl
abam
aM
inne
sota
Ohio
Virg
inia
Rhod
e Isl
and
Sout
h Ca
rolin
aSo
uth
Dako
taMi
chig
anPe
nnsy
lvan
iaCo
lora
doDe
lawa
reNe
w H
amps
hire
Verm
ont0%
10%
20%
30%
40%
50%
60%
70%
80%
90%
13.8%
47.0%
85.1%
Note: Dollars adjusted by 2012 HECA, Cost of Living Adjustment, and Enrollment Mix. Source: State Higher Education Executive Officers
Figure 7Net Tuition as a Percent of Public Higher Education Total Educational Revenue
by State, Fiscal 2012

Florid
aId
aho
Calif
orni
aAr
kans
asNe
vada
Loui
siana
Was
hing
ton
Tenn
esse
eMa
ssac
huse
ttsSo
uth
Caro
lina
Wyo
min
gNe
w Me
xico
Miss
ouri
Arizo
naOh
ioGe
orgi
aOr
egon
Mary
land
Hawa
iiUt
ahOk
laho
ma US
Conn
ectic
utNo
rth C
arol
ina
Miss
issip
piKa
nsas
New
Ham
pshi
reNe
w Yo
rkNe
w Je
rsey
Indi
ana
Kent
ucky
Iowa
Alab
ama
Wisc
onsin
Texa
sMo
ntan
aMi
chig
anPe
nnsy
lvan
iaVi
rgin
iaAl
aska
Verm
ont
Nebr
aska
Sout
h Da
kota
Rhod
e Isl
and
Minn
esot
aCo
lora
doMa
ine
Dela
ware
Wes
t Virg
inia
North
Dak
ota
Illin
ois
-30%
-20%
-10%
0%
10%
20%
-25.9%
-7.9%
15.6%
Note: Dollars adjusted by 2012 HECA, Cost of Living Adjustment, and Enrollment Mix; total educational revenue excludes net tuition revenue used for capi-tal debt service. Source: State Higher Education Executive Officers
Figure 8Total Educational Revenue per FTE
Percent Change by State, Fiscal 2007-2012

Additional Data/Analysis Opportunities
All the tables and charts
The raw, unadjusted data
State wave charts and data
http://www.sheeo.org/shef12

SHEF in the News
CBPP Analysis Combined SHEF, Grapevine, and College
Board data to correlate tuition rate increases with cuts in state support
Recent Deep State Higher Education Cuts may Harm Students and the Economy for Years to Come
http://www.cbpp.org/cms/index.cfm?fa=view&id=3927
![THE PHILIPPINE FISCAL INSTITUTIONSSan Juan] Philippines_Fiscal...THE PHILIPPINE FISCAL INSTITUTIONS RONALD RAY K. SAN JUAN International Finance Group Department of Finance, Philippines](https://img.pdfslide.us/doc/110x75/5ec96973e133ce005f09db24/the-philippine-fiscal-institutions-san-juan-philippinesfiscal-the-philippine.jpg)