Embed Size (px)
Citation preview

THE CENTER FOR STATE AND LOCAL FINANCE
Georgia’s Ranking Among the States:Budget, Taxes, and Other Indicators
JUNE 2015
IN COLLABORATION WITH

ABOUT THE CENTER FOR STATE AND LOCAL FINANCEThe Center for State and Local Finance (CSLF) mission is to develop the people and ideas for next generation public finance. Key initiatives include: 1) Developing executive education programs in public finance to provide professional development for the next generation of practitioners in state and local finance; 2) Building technical assistance capacity in next generation technologies for the public sector that include the use of “big data” and improved analytics to better inform policymakers and to better target solutions to public sector problems; 3) Supporting scholarship on critical challenges in state and local fiscal and economic policy; and 4) Building a strong capacity to translate and communicate academic research for the practitioner audience.
CSLF Reports, Policy Briefs, and other publications maintain a position of neutrality on public policy issues in order to safeguard the academic freedom of the authors. Thus, interpretations or conclusion in CSLF publications should be understood to be solely those of the author(s).
For more information on the Center for State and Local Finance, visit our website at: cslf.gsu.edu.
ABOUT THE FISCAL RESEARCH CENTEREstablished in 1995, the Fiscal Research Center (FRC) provides nonpartisan research, technical assistance and education in the evaluation and design of state tax and economic policy. FRC’s responsibilities include developing estimates for tax-related fiscal notes, writing the Georgia State Tax Expenditure Budget, supporting the state’s economist, and conducting policy and academic research on a variety of topics associated with state tax policy issues.
FRC Reports, Policy Briefs, and other publications maintain a position of neutrality on public policy issues in order to safeguard the academic freedom of the authors. Thus, interpretations or conclusions in FRC publications should be understood to be solely those of the author(s).
For more information on the Fiscal Research Center, visit our website at: frc.gsu.edu.
ACKNOWLEDGEMENTSThis guide mirrors the format and content of the annual report, “Virginia Compared to the Other States,” produced by the Virginia’s Joint Legislative Audit and Review Commission. I would especially like to thank Joe McMahon, Senior Legislative Analyst, and Kathy DuVall, Publications Analyst, for their assistance during this project. Additionally, appreciation goes to Dr. Robert Buschman and Mels de Zeeuw for their careful review of the data.
IntroductionEnclosed is a collection of quantitative metrics and state rankings that compare Georgia to states across the nation. While several of the comparisons focus on total state or local government revenue and expenditures, the report also includes a number of measures that provide comparisons of either expenditures or state characteristics within specific functional areas, such as education, health, and transportation. The state rankings for each topic are generally (with a few excep-tions) determined by the reported total dollar value or percentage, with the highest state value or percentage ranked number one. This 2015 guide is the first issue of an intended annual publication from the Center for State and Local Finance. We hope it will serve as a convenient reference guide for policymakers, the media, and the public.
SourcesThe 38 metrics contained within the report are based upon data from a variety of sources. Each metric within the report contain a listing of the sources used to produce the reported information. Although each source is updated periodically in accordance with its own unique schedule, we have made an attempt to use the latest information available for each measure. A partial list of the data sources includes:
f U.S. Census Bureau, Annual Population Estimates
f U.S. Census Bureau, Annual Surveys of State and Local Government Finances
f U.S. Census Bureau, Poverty: American Community Survey Briefs
f Bureau of Economic Analysis
f College Board, Trends in College Pricing
f National Association of State Budget Officers, State Expenditure Report
f State Higher Education Executive Officers
f Bureau of Labor Statistics
f Centers for Disease Control and Prevention
cslf.gsu.edu Center for State and Local Finance

21 State Credit Ratings 1 AAA
22 Per Capita Medicaid Expenditures 46 904
23 Percentage of Total State Expenditures for Public Assistance 25 22.8%
24 Percentage of Population Under Age 65 With Health Insurance 43 81.6%
25 Infant Mortality Rate 11 6.9%
26 State & Local Per-Pupil Funding, Pre-K to 12 34 9,402
27 State Per-Pupil Funding, Pre-K to 12 40 4,466
28 Average Salary of Public School Teachers 23 52,924
29 Percentage of Population 25 Years & Older With at Least a High School Education 40 85.5%
30 Average Annual In-State Tuition & Fees at Public Four-Year Institutions 30 8,094
31 Percentage Change in In-State Tuition & Fees at Public Four-Year Institutions (2009-10 to 2014-15) 2 46.1%
32 Per Capita State Support for Public & Private Higher Education 15 276
33 FTE Student Enrollment in Public Higher Education 9 347,733
34 Higher Education Appropriations per FTE Student 14 7,297
35 State Motor Fuel Taxes (Gas) 25 26.53
36 Per Capita State & Local Road Expenditures 50 312
37 State Corrections Expenditures Per Offender 50 2,628
38 State Government FTEs per 100 Persons 39 1.3
1 Population 8 10,097,343
2 Percentage Change in Population (2004-14) 14 13.3%
3 Per Capita Personal Income 40 39,097
4 Annual Average Unemployment Rate 45 7.2%
5 Percentage of Population in Poverty 13 16.3%
6 Per Capita State & Local Revenue 49 7,320
7 State & Local Revenue as Percentage of Personal Income 41 19.7%
8 Per Capita State Revenue 50 4,098
9 Per Capita Local Revenue 28 4,278
10 Percentage of Total State & Local Tax Revenue from Individual Income Tax 16 25.2%
11 Per Capita State & Local Taxes 45 3,257
12 State & Local Taxes as Percentage of Personal Income 39 8.8%
13 Per Capita Local Taxes 27 1,572
14 Per Capita State Taxes 49 1,685
15 Per Capita Federal Grants 44 1,187
16 Per Capita Federal Expenditures 45 5,317
17 Per Capita State Expenditures 44 4,247
18 Percentage Change in Real Per Capita State Expenditures (FY 2004-13) 26 6.8%
19 Per Capita General Fund Expenditures 34 1,803
20 Per Capita State & Local Debt Outstanding 44 5,624
Georgia Trends, 2015 Edition
RANK MEASURE RANK MEASURE
cslf.gsu.edu Center for State and Local Finance

1 California 38,802,500
2 Texas 26,956,958
3 Florida 19,893,297
4 New York 19,746,227
5 Illinois 12,880,580
6 Pennsylvania 12,787,209
7 Ohio 11,594,163
8 Georgia 10,097,343
9 North Carolina 9,943,964
10 Michigan 9,909,877
11 New Jersey 8,938,175
12 Virginia 8,326,289
13 Washington 7,061,530
14 Massachusetts 6,745,408
15 Arizona 6,731,484
16 Indiana 6,596,855
17 Tennessee 6,549,352
f 50-State Average 6,363,963
18 Missouri 6,063,589
19 Maryland 5,976,407
20 Wisconsin 5,757,564
21 Minnesota 5,457,173
22 Colorado 5,355,866
23 Alabama 4,849,377
24 South Carolina 4,832,482
25 Louisiana 4,649,676
26 Kentucky 4,413,457
27 Oregon 3,970,239
28 Oklahoma 3,878,051
29 Connecticut 3,596,677
30 Iowa 3,107,126
31 Mississippi 2,994,079
32 Arkansas 2,966,369
33 Utah 2,942,902
34 Kansas 2,904,021
35 Nevada 2,839,099
36 New Mexico 2,085,572
37 Nebraska 1,881,503
38 West Virginia 1,850,326
39 Idaho 1,634,464
40 Hawaii 1,419,561
41 Maine 1,330,089
42 New Hampshire 1,326,813
43 Rhode Island 1,055,173
44 Montana 1,023,579
45 Delaware 935,614
46 South Dakota 853,175
47 North Dakota 739,482
48 Alaska 736,732
49 Vermont 626,562
50 Wyoming 584,153
1. Population, 2014
RANK STATE IN $ RANK STATE IN $
Quick Stats
f Georgia’s population increased by 1.0 percent from 2013 to 2014, compared to 0.7 percent nationally.
f The United States population was estimated to be 318,857,056 in 2014.
Note: Population estimates are for July 1, 2014, and are based on the 2010 Census.
Source: U.S. Census Bureau Annual Population Estimates
LEGEND
Ranked above 50-state average
Ranked below 50-state average
cslf.gsu.edu Center for State and Local Finance

1 Nevada 21.9
2 Utah 20.7
3 Texas 20.2
4 Idaho 17.4
5 Arizona 16.9
6 North Carolina 16.6
7 Colorado 16.4
8 North Dakota 16.2
9 Wyoming 16.1
10 South Carolina 15.0
11 Florida 14.5
12 Washington 14.2
13 Hawaii 13.3
14 Georgia 13.3
15 Delaware 13.2
16 Virginia 11.5
17 Alaska 11.4
18 Oregon 11.1
19 Tennessee 10.7
20 Montana 10.6
21 Oklahoma 10.3
22 New Mexico 10.2
23 South Dakota 10.2
24 California 9.1
f 50-State Average 8.9
25 Arkansas 8.0
26 Nebraska 8.0
27 Maryland 7.8
28 Alabama 7.5
29 Minnesota 7.4
30 Kentucky 6.4
31 Kansas 6.3
32 Indiana 6.2
33 Iowa 5.6
34 Missouri 5.3
35 Massachusetts 4.6
36 Wisconsin 4.5
37 New Jersey 3.8
38 Mississippi 3.7
39 Louisiana 3.6
40 Connecticut 3.5
41 Pennsylvania 3.2
42 New Hampshire 2.6
43 West Virginia 2.6
44 New York 2.3
45 Illinois 1.9
46 Maine 1.7
47 Vermont 1.4
48 Ohio 1.1
49 Rhode Island -1.5
50 Michigan -1.8
2. Percentage Change in Population (2004-14)
RANK STATE IN % RANK STATE IN %
LEGEND
Ranked above 50-state average
Ranked below 50-state average
Quick Stats
f Georgia’s population increased by 13.3 percent from 2004 to 2014, compared to an 8.8% overall increase for the United States.
Source: U.S. Census Bureau Annual Population Estimates
cslf.gsu.edu Center for State and Local Finance
1 Connecticut 62,467
2 Massachusetts 59,182
3 New Jersey 56,807
4 New York 56,231
5 Maryland 55,143
6 North Dakota 54,951
7 Wyoming 54,810
8 New Hampshire 53,149
9 Alaska 52,901
10 California 50,109
11 Virginia 49,710
12 Washington 49,583
13 Rhode Island 48,838
14 Colorado 48,730
15 Minnesota 48,711
16 Illinois 48,120
17 Pennsylvania 47,727
18 Vermont 47,330
19 Nebraska 47,073
20 Hawaii 46,396
21 South Dakota 46,345
22 Delaware 45,942
23 Kansas 45,546
24 Texas 45,426
f 50-State Average 45,172
25 Iowa 45,115
26 Wisconsin 44,585
27 Oklahoma 43,138
28 Florida 42,645
29 Ohio 42,571
30 Louisiana 42,287
31 Maine 42,071
32 Oregon 41,681
33 Missouri 41,613
34 Tennessee 40,654
35 Montana 40,601
36 Michigan 40,556
37 Nevada 40,077
38 North Carolina 39,646
39 Indiana 39,433
40 Georgia 39,097
41 Arizona 37,895
42 Utah 37,766
43 Arkansas 37,751
44 Kentucky 37,654
45 New Mexico 37,605
46 Idaho 37,533
47 Alabama 37,493
48 South Carolina 36,934
49 West Virginia 36,644
50 Mississippi 34,333
3. Per Capita Personal Income, 2013
RANK STATE IN $ RANK STATE IN $
LEGEND
Ranked above 50-state average
Ranked below 50-state average
Quick Stats
f Georgia’s per capita personal income increased by 3.3 percent from 2013 to 2014, 18th highest growth rate among all states.
f Per capita personal income increased in all 50 states by an average rate of 3 percent from 2013 to 2014 (50-state average).
Note: Personal income is the income from net earnings (wages, salaries, and other labor income); property (personal dividend, interest, and rental income); and transfer payments such as Social Security and unemployment benefits. Personal income is measured before the deduction of personal income taxes and other personal taxes.
Sources: U.S. Bureau of Economic Analysis and U.S. Census Bureau Annual Population Estimates
cslf.gsu.edu Center for State and Local Finance

1 North Dakota 2.8
2 Nebraska 3.3
3 South Dakota 3.4
4 Utah 3.8
5 Minnesota 4.1
5 Vermont 4.1
7 New Hampshire 4.3
7 Wyoming 4.3
9 Hawaii 4.4
9 Iowa 4.4
11 Kansas 4.5
11 Oklahoma 4.5
13 Montana 4.7
14 Idaho 4.8
15 Colorado 5.0
16 Texas 5.1
17 Virginia 5.2
18 Wisconsin 5.5
19 Delaware 5.7
19 Maine 5.7
19 Ohio 5.7
f 50-State Average 5.8
22 Maryland 5.8
22 Massachusetts 5.8
22 Pennsylvania 5.8
25 Indiana 6.0
26 Arkansas 6.1
26 Missouri 6.1
26 North Carolina 6.1
29 Washington 6.2
30 Florida 6.3
30 New York 6.3
32 Louisiana 6.4
32 South Carolina 6.4
34 Kentucky 6.5
34 New Mexico 6.5
34 West Virginia 6.5
37 Connecticut 6.6
37 New Jersey 6.6
39 Tennessee 6.7
40 Alabama 6.8
40 Alaska 6.8
42 Arizona 6.9
42 Oregon 6.9
44 Illinois 7.1
45 Georgia 7.2
46 Michigan 7.3
47 California 7.5
48 Rhode Island 7.7
49 District of Columbia 7.8
49 Mississippi 7.8
49 Nevada 7.8
4. Annual Average Unemployment Rate, 2014
RANK STATE IN % RANK STATE IN %
LEGEND
Ranked above 50-state average
Ranked below 50-state average
Quick Stats
f Georgia’s annual average unemployment rate decreased by 1 percentage point from 2013 to 2014.
f The U.S. annual average unemployment rate was 6.2 percent in 2014, a 1.2 percentage point decrease from 2013.
f Georgia’s monthly unemployment rate in December 2014 was 6.6 percent, compared to 5.6 percent nationally.
Source: U.S. Bureau of Labor Statistics
cslf.gsu.edu Center for State and Local Finance
1 Mississippi 22.5
2 New Mexico 21.7
3 Arizona 20.2
4 Kentucky 20.0
5 Louisiana 19.2
6 North Carolina 18.6
7 Tennessee 18.1
8 Nevada 17.4
9 West Virginia 17.3
10 Arkansas 17.1
11 Texas 16.8
12 Alabama 16.7
13 Georgia 16.3
14 South Carolina 15.9
15 Oregon 15.1
16 California 14.9
16 Florida 14.9
18 Michigan 14.5
18 Montana 14.5
18 New York 14.5
21 Delaware 14.0
21 Oklahoma 14.0
f 50-State Average 13.9
23 Missouri 13.7
23 Ohio 13.7
25 Rhode Island 13.5
26 Illinois 13.3
27 Kansas 13.2
28 Idaho 12.9
29 Pennsylvania 12.4
30 Maine 12.3
31 Minnesota 12.0
31 Washington 12.0
33 Massachusetts 11.9
34 Wyoming 11.8
35 Indiana 11.6
36 Connecticut 11.3
37 Hawaii 11.1
37 New Jersey 11.1
39 Nebraska 11.0
39 Wisconsin 11.0
41 Alaska 10.9
42 Iowa 10.8
43 Colorado 10.6
44 Virginia 10.4
45 Maryland 10.3
45 South Dakota 10.3
47 North Dakota 9.9
48 New Hampshire 9.0
49 Vermont 8.7
50 Utah 8.3
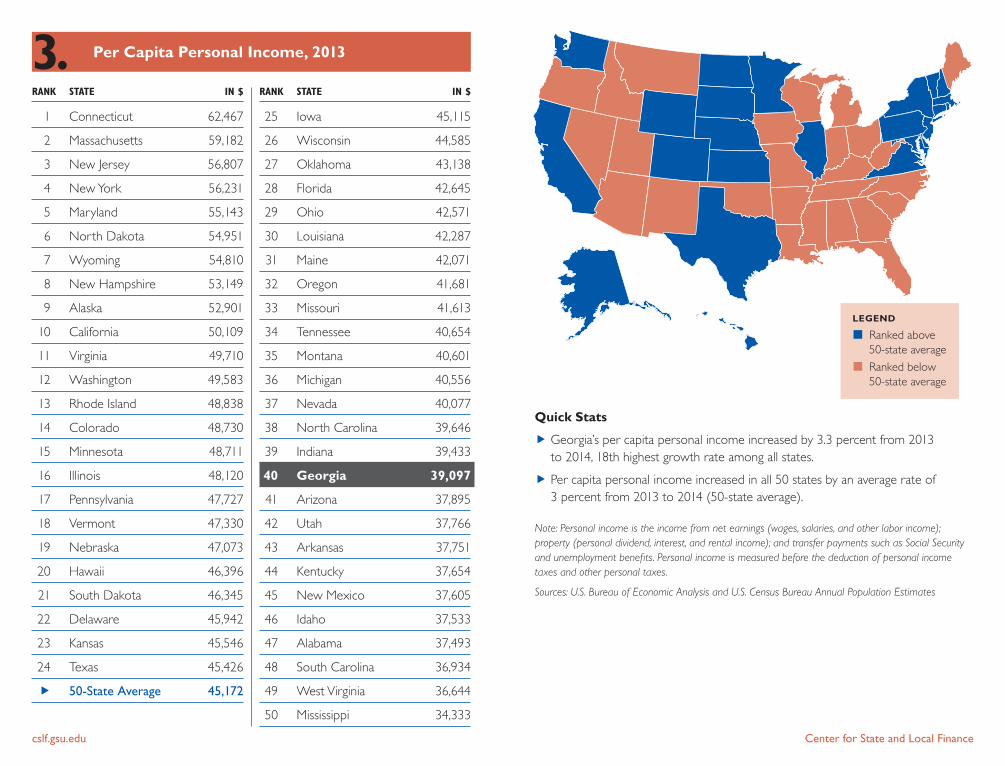
5. Percentage of Population Living in Poverty in Past 12 Months, 2013
RANK STATE IN % RANK STATE IN %
LEGEND
Ranked above 50-state average
Ranked below 50-state average
Quick Stats
f There were nearly 1.6 million Georgians living in poverty in 2013, a decrease of 9.1 percent from 2012.
f There were 45.3 million Americans living in poverty in 2013, a decrease of 2.5 percent from 2012.
Note: The poverty threshold, as designated by the Census Bureau, was $23,624 for a family of four, including two children in 2013. This threshold is updated annually for changes in the cost of living.
Source: U.S. Census Bureau, Current Population Survey, Annual Social and Economic Supplements
cslf.gsu.edu Center for State and Local Finance

1 Alaska 24,963
2 Wyoming 16,834
3 North Dakota 16,094
4 New York 15,072
5 Vermont 11,885
6 Connecticut 11,115
7 Massachusetts 10,973
8 Nebraska 10,904
9 California 10,818
10 Delaware 10,712
11 Rhode Island 10,657
12 Minnesota 10,448
13 Iowa 10,364
14 New Jersey 10,355
15 Washington 10,039
16 Montana 9,970
f 50-State Average 9,926
17 Hawaii 9,872
18 Oregon 9,602
19 New Mexico 9,467
20 Maryland 9,447
21 Pennsylvania 9,407
22 Ohio 9,389
23 Wisconsin 9,285
24 Illinois 9,225
25 Colorado 9,134
26 Louisiana 9,127
27 Michigan 9,115
28 Kansas 9,064
29 Alabama 9,058
30 North Carolina 8,977
31 Mississippi 8,968
32 West Virginia 8,933
33 Maine 8,860
34 Tennessee 8,551
35 South Carolina 8,509
36 Oklahoma 8,490
37 Texas 8,485
38 Utah 8,425
39 New Hampshire 8,217
40 Indiana 8,206
41 South Dakota 8,202
42 Virginia 8,200
43 Kentucky 8,161
44 Missouri 8,156
45 Nevada 8,096
46 Florida 8,028
47 Arkansas 7,969
48 Arizona 7,901
49 Georgia 7,320
50 Idaho 7,264
6. Per Capita State & Local Revenue, FY 2012
RANK STATE IN $ RANK STATE IN $
LEGEND
Ranked above 50-state average
Ranked below 50-state average
Quick Stats
f Georgia’s per capita state and local revenue decreased by $1,301 (15.1 percent) from FY 2011 to FY 2012. Per capita tax revenue increased by 1.8 percent but was offset by decreases in federal transfers (7.2 percent) and insurance trust revenue (72.9 percent).
f The U.S. 50-state average per capita state and local government revenues decreased by 10.6 percent from FY 2011 to FY 2012.
Notes:1. Per capita state and local revenue numbers in comparisons 8 and 9 do not sum to the combined
per capita state and local revenues in this comparison, because the Census Bureau eliminates intergovernmental transactions from combined state and local amounts.
2. Insurance trust revenue includes (a) retirement and social insurance contributions, including unemployment compensation “taxes” received from employees and other government or private employers, and (b) net earnings on investments set aside to provide income for insurance trusts.
Sources: U.S. Census Bureau Annual Surveys of State and Local Government Finances and U.S. Census Bureau Annual Population Estimates
cslf.gsu.edu Center for State and Local Finance

LEGEND
Ranked above 50-state average
Ranked below 50-state average
25 Hawaii 22.19
26 Minnesota 22.06
27 Tennessee 21.93
28 Arkansas 21.87
29 Wisconsin 21.86
30 Arizona 21.59
31 Indiana 21.52
32 Washington 21.34
33 Kansas 20.90
34 Idaho 20.67
35 Pennsylvania 20.65
36 Nevada 20.64
37 Oklahoma 20.52
38 Missouri 20.43
39 Illinois 20.06
40 Colorado 19.73
41 Georgia 19.67
42 Texas 19.63
43 Florida 19.60
44 Massachusetts 19.38
45 New Jersey 18.87
46 Connecticut 18.47
47 South Dakota 17.97
48 Maryland 17.63
49 Virginia 16.85
50 New Hampshire 16.41
1 Alaska 50.07
2 Wyoming 32.10
3 North Dakota 28.60
4 New York 27.90
5 Mississippi 26.81
6 Vermont 26.75
7 New Mexico 26.45
8 Montana 25.46
9 West Virginia 25.42
10 Alabama 25.20
11 Oregon 24.45
12 Delaware 24.32
13 South Carolina 24.07
14 Nebraska 23.75
15 Michigan 23.63
16 Iowa 23.55
17 Utah 23.48
18 Ohio 23.33
19 North Carolina 23.29
20 Rhode Island 23.09
f 50-State Average 22.90
21 California 22.81
22 Kentucky 22.78
23 Louisiana 22.48
24 Maine 22.23
Quick Stats
f In FY 2012, Georgia’s state and local revenue as a percentage of personal income decreased by 4 percentage points from the FY 2011 percentage.
Sources: U.S. Census Bureau Annual Surveys of State and Local Government Finances, and Bureau of Economic Analysis, State Income and Employment Summary
7. State & Local Revenue as a Percentage of Personal Income, FY 2012
RANK STATE IN % RANK STATE IN %
cslf.gsu.edu Center for State and Local Finance

LEGEND
Ranked above 50-state average
Ranked below 50-state average
25 Pennsylvania 6,145
26 Maryland 6,128
27 Oklahoma 6,095
28 Alabama 6,014
29 Washington 5,897
30 Kentucky 5,859
31 Louisiana 5,849
32 North Carolina 5,793
33 Kansas 5,594
34 South Carolina 5,528
35 Indiana 5,493
36 Utah 5,464
37 New Hampshire 5,414
38 Illinois 5,352
39 Nebraska 5,290
40 Virginia 5,265
41 South Dakota 5,214
42 Idaho 5,207
43 Nevada 5,197
44 Missouri 5,156
45 Texas 5,009
46 Colorado 4,948
47 Arizona 4,901
48 Tennessee 4,772
49 Florida 4,257
50 Georgia 4,098
1 Alaska 20,587
2 North Dakota 13,177
3 Wyoming 11,866
4 Vermont 10,140
5 New York 9,160
6 Delaware 8,742
7 Montana 7,614
8 Hawaii 7,611
9 Connecticut 7,603
10 Rhode Island 7,549
11 Massachusetts 7,362
12 New Mexico 7,290
13 Minnesota 7,165
14 West Virginia 7,136
15 Iowa 6,853
f 50-State Average 6,744
16 California 6,594
17 New Jersey 6,487
18 Michigan 6,473
19 Oregon 6,428
20 Maine 6,336
21 Mississippi 6,284
22 Ohio 6,274
23 Wisconsin 6,267
24 Arkansas 6,250
Quick Stats
f Georgia’s per capita state revenue decreased by $1,229 (23.1 percent) in FY 2012, driven by reductions in federal transfers (8.9 percent) and insurance trust revenue (72.1 percent).
Sources: U.S. Census Bureau Annual Surveys of State and Local Government Finances, and U.S. Census Bureau Annual Population Estimates
8. Per Capita State Revenue, FY 2012
RANK STATE IN $ RANK STATE IN $
cslf.gsu.edu Center for State and Local Finance

LEGEND
Ranked above 50-state average
Ranked below 50-state average
25 Maryland 4,599
26 Michigan 4,483
27 North Carolina 4,482
28 Georgia 4,278
29 Vermont 4,270
30 Virginia 4,262
31 Alabama 4,257
32 Mississippi 4,248
33 Indiana 4,245
34 Arizona 4,130
35 South Carolina 4,100
36 Missouri 4,084
37 Rhode Island 4,062
38 New Hampshire 4,050
39 New Mexico 4,025
40 Utah 3,980
41 South Dakota 3,905
42 Montana 3,593
43 Delaware 3,540
44 Maine 3,522
45 Oklahoma 3,470
46 Kentucky 3,368
47 Arkansas 3,330
48 Idaho 3,297
49 West Virginia 2,973
50 Hawaii 2,433
1 New York 8,765
2 Wyoming 8,156
3 Nebraska 6,739
4 California 6,622
5 Alaska 6,589
6 Washington 5,667
7 Colorado 5,343
8 New Jersey 5,293
9 Illinois 5,283
10 Minnesota 5,282
11 Iowa 5,112
12 Massachusetts 4,948
13 North Dakota 4,875
14 Pennsylvania 4,869
15 Tennessee 4,835
16 Louisiana 4,824
17 Kansas 4,804
18 Wisconsin 4,782
19 Connecticut 4,759
20 Ohio 4,721
21 Florida 4,706
f 50-State Average 4,636
22 Nevada 4,619
23 Oregon 4,618
24 Texas 4,609
Quick Stats
f Georgia’s local governments recorded $25.7 billion in own-source revenue in FY 2012, $3.4 billion more than the state government.
f Georgia’s per capita local revenue decreased by $151 in FY 2012 (3.4 percent).
Sources: U.S. Census Bureau Annual Surveys of State and Local Government Finances, and U.S. Census Bureau Annual Population Estimates
9. Per Capita Local Revenue, FY 2012
RANK STATE IN $ RANK STATE IN $
cslf.gsu.edu Center for State and Local Finance
LEGEND
Ranked above 50-state average
Ranked below 50-state average
26 Iowa 23.1
27 Colorado 23.0
28 Nebraska 22.6
29 Alabama 21.9
30 South Carolina 21.7
31 Oklahoma 20.9
32 Hawaii 20.8
33 Rhode Island 20.7
34 New Jersey 20.7
35 Michigan 20.3
f 50-State Average 20.1
36 Vermont 18.6
37 Mississippi 15.5
38 New Mexico 15.2
39 Louisiana 14.6
40 Arizona 13.9
41 North Dakota 6.5
42 New Hampshire 1.5
43 Tennessee 0.9
44 Alaska 0.0
44 Florida 0.0
44 Nevada 0.0
44 South Dakota 0.0
44 Texas 0.0
44 Washington 0.0
44 Wyoming 0.0
1 Oregon 39.4
2 Maryland 38.0
3 Massachusetts 32.3
4 New York 31.3
5 Kentucky 30.9
6 Virginia 30.8
7 North Carolina 30.1
8 California 30.0
9 Delaware 29.8
10 Connecticut 29.5
11 Ohio 28.7
12 Minnesota 28.4
13 Missouri 26.7
14 Utah 25.8
15 Wisconsin 25.5
16 Georgia 25.2
17 Pennsylvania 25.1
18 Idaho 25.0
19 Indiana 24.9
20 West Virginia 24.9
21 Montana 24.9
22 Maine 23.5
23 Illinois 23.3
24 Kansas 23.1
25 Arkansas 23.1
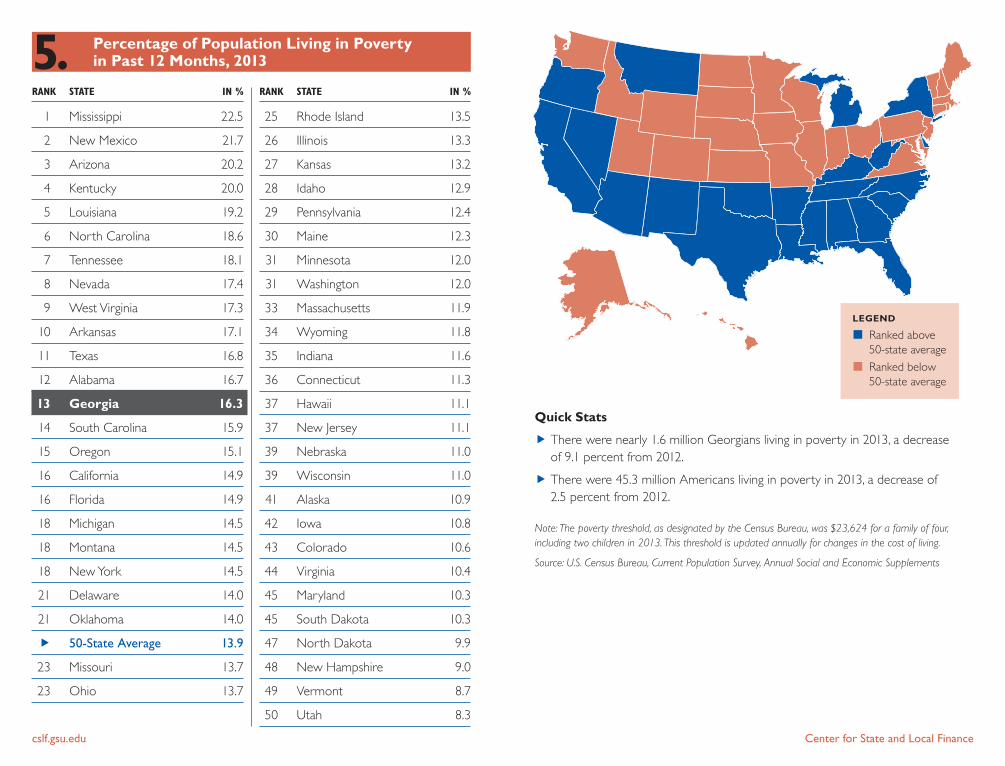
Quick Stats
f Georgia’s per capita individual income tax was $821 in FY 2012, an increase of $40 from FY 2011.
f Seven states have no state individual income tax. New Hampshire and Tennessee tax only dividend and interest income.
Sources: U.S. Census Bureau Annual Surveys of State and Local Government Finances, and U.S. Census Bureau Annual Population Estimates
10.Percentage of Total State & Local Tax Revenue from Individual Income Tax, FY 2012
RANK STATE IN % RANK STATE IN %
cslf.gsu.edu Center for State and Local Finance

LEGEND
Ranked above 50-state average
Ranked below 50-state average
25 Virginia 4,049
26 New Hampshire 3,989
27 Nevada 3,855
28 West Virginia 3,804
29 Oregon 3,790
30 Indiana 3,750
31 Texas 3,746
32 Louisiana 3,682
33 Michigan 3,665
34 New Mexico 3,623
35 Montana 3,603
36 North Carolina 3,534
37 Arkansas 3,524
38 Oklahoma 3,479
39 South Dakota 3,469
40 Kentucky 3,429
41 Missouri 3,388
42 Arizona 3,385
43 Utah 3,347
44 Florida 3,338
45 Georgia 3,257
46 Mississippi 3,253
47 Tennessee 3,095
48 Idaho 3,043
49 South Carolina 3,021
50 Alabama 2,951
1 Alaska 11,857
2 North Dakota 9,444
3 New York 7,739
4 Connecticut 6,945
5 Wyoming 6,666
6 New Jersey 6,067
7 Massachusetts 5,565
8 Hawaii 5,321
9 Minnesota 5,225
10 Illinois 5,164
11 Vermont 5,135
12 Maryland 5,127
13 Rhode Island 4,967
14 California 4,825
15 Wisconsin 4,628
16 Maine 4,620
17 Delaware 4,576
f 50-State Average 4,499
18 Pennsylvania 4,466
19 Iowa 4,410
20 Nebraska 4,379
21 Kansas 4,334
22 Washington 4,268
23 Colorado 4,081
24 Ohio 4,054
Quick Stats
f Georgia recorded $58 more in per capita state and local taxes in FY 2012 compared to FY 2011, an increase of 1.8 percent.
f Nationwide, state and local governments recorded 2.5 percent more per capita state and local taxes in FY 2012.
Sources: U.S. Census Bureau Annual Surveys of State and Local Government Finances, and U.S. Census Bureau Annual Population Estimates
11. Per Capita State & Local Taxes, FY 2012
RANK STATE IN $ RANK STATE IN $
cslf.gsu.edu Center for State and Local Finance

LEGEND
Ranked above 50-state average
Ranked below 50-state average
25 Mississippi 9.7
26 Arkansas 9.7
27 Oregon 9.7
28 Kentucky 9.6
29 Maryland 9.6
30 Nebraska 9.5
31 Michigan 9.5
32 Utah 9.3
33 Arizona 9.2
34 Montana 9.2
35 North Carolina 9.2
36 Washington 9.1
37 Louisiana 9.1
38 Colorado 8.8
39 Georgia 8.8
40 Texas 8.7
41 Idaho 8.7
42 South Carolina 8.5
43 Missouri 8.5
44 Oklahoma 8.4
45 Virginia 8.3
46 Alabama 8.2
47 Florida 8.1
48 New Hampshire 8.0
49 Tennessee 7.9
50 South Dakota 7.6
1 Alaska 23.8
2 North Dakota 16.8
3 New York 14.3
4 Wyoming 12.7
5 Hawaii 12.0
6 Maine 11.6
7 Vermont 11.6
8 Connecticut 11.5
9 Illinois 11.2
10 New Jersey 11.1
11 Minnesota 11.0
12 Wisconsin 10.9
13 West Virginia 10.8
14 Rhode Island 10.8
15 Delaware 10.4
f 50-State Average 10.2
16 California 10.2
17 New Mexico 10.1
18 Ohio 10.1
19 Iowa 10.0
20 Kansas 10.0
21 Indiana 9.8
22 Nevada 9.8
23 Massachusetts 9.8
24 Pennsylvania 9.8
Quick Stats
f Georgia’s state and local taxes as a percentage of personal income remained unchanged at 8.8 percent from FY 2011 to FY 2012.
f Across the United States, state and local taxes as a percentage of personal income also remained unchanged at 10.2 percent.
Sources: U.S. Census Bureau Annual Surveys of State and Local Government Finances, and Bureau of Economic Analysis, State Income and Employment Summary
12.State & Local Taxes as a Percentage of Personal Income, FY 2012
RANK STATE IN % RANK STATE IN %
cslf.gsu.edu Center for State and Local Finance

LEGEND
Ranked above 50-state average
Ranked below 50-state average
25 Florida 1,634
26 Missouri 1,595
27 Georgia 1,572
28 Oregon 1,559
29 North Dakota 1,435
30 Minnesota 1,403
31 Arizona 1,403
32 Nevada 1,396
33 Hawaii 1,360
34 South Carolina 1,319
35 Utah 1,312
36 Indiana 1,252
37 Michigan 1,245
38 Tennessee 1,239
39 North Carolina 1,204
40 New Mexico 1,180
41 Oklahoma 1,163
42 Montana 1,156
43 Alabama 1,072
44 Kentucky 1,032
45 West Virginia 957
46 Idaho 928
47 Delaware 926
48 Mississippi 924
49 Vermont 732
50 Arkansas 714
1 New York 4,090
2 New Jersey 2,974
3 Connecticut 2,655
4 Illinois 2,347
5 New Hampshire 2,318
6 Rhode Island 2,281
7 Wyoming 2,244
8 Maryland 2,225
9 Alaska 2,214
10 Massachusetts 2,137
11 Colorado 2,104
12 Nebraska 2,025
13 Pennsylvania 1,886
14 Texas 1,883
15 Virginia 1,835
16 Wisconsin 1,834
17 Iowa 1,831
18 Ohio 1,809
19 California 1,799
20 Maine 1,777
21 Kansas 1,763
22 Louisiana 1,729
23 Washington 1,712
f 50-State Average 1,657
24 South Dakota 1,646
Quick Stats
f Georgia’s per capita local taxes increased by $4 (0.2 percent), from FY 2011 to FY 2012.
f Nationwide, per capita local taxes increased by 0.4 percent.
Sources: U.S. Census Bureau Annual Surveys of State and Local Government Finances, and U.S. Census Bureau Annual Population Estimates
13.Per Capita Local Taxes, FY 2012
RANK STATE IN $ RANK STATE IN $
cslf.gsu.edu Center for State and Local Finance

LEGEND
Ranked above 50-state average
Ranked below 50-state average
25 Nevada 2,459
26 Montana 2,447
27 New Mexico 2,443
28 Michigan 2,420
29 Kentucky 2,397
30 Nebraska 2,353
31 North Carolina 2,330
32 Mississippi 2,329
33 Oklahoma 2,316
34 Ohio 2,245
35 Oregon 2,231
36 Virginia 2,215
37 Idaho 2,115
38 Utah 2,035
39 Arizona 1,982
40 Colorado 1,977
41 Louisiana 1,953
42 Alabama 1,878
43 Texas 1,862
44 Tennessee 1,856
45 South Dakota 1,823
46 Missouri 1,793
47 Florida 1,705
48 South Carolina 1,702
49 Georgia 1,685
50 New Hampshire 1,671
1 Alaska 9,642
2 North Dakota 8,009
3 Wyoming 4,422
4 Vermont 4,404
5 Connecticut 4,290
6 Hawaii 3,961
7 Minnesota 3,821
8 Delaware 3,650
9 New York 3,649
10 Massachusetts 3,429
11 New Jersey 3,093
12 California 3,026
13 Maryland 2,901
14 West Virginia 2,847
15 Maine 2,843
f 50-State Average 2,842
16 Illinois 2,816
17 Arkansas 2,810
18 Wisconsin 2,794
19 Rhode Island 2,686
20 Pennsylvania 2,580
21 Iowa 2,579
22 Kansas 2,570
23 Washington 2,556
24 Indiana 2,498
Quick Stats
f Georgia’s per capita state taxes increased by $54 in FY 2012, a 3.3 percent increase.
f Nationwide, per capita state taxes increased by 7.7 percent.
Sources: U.S. Census Bureau Annual Surveys of State and Local Government Finances, and U.S. Census Bureau Annual Population Estimates
14.Per Capita State Taxes, FY 2012
RANK STATE IN $ RANK STATE IN $
cslf.gsu.edu Center for State and Local Finance

LEGEND
Ranked above 50-state average
Ranked below 50-state average
26 South Dakota 1,609
25 Maryland 1,613
27 Washington 1,602
28 Oklahoma 1,556
29 New Jersey 1,552
30 Pennsylvania 1,548
31 Indiana 1,421
33 North Carolina 1,415
32 California 1,418
34 Iowa 1,408
35 Illinois 1,384
36 Alabama 1,380
37 South Carolina 1,373
38 Colorado 1,351
40 Wisconsin 1,324
39 Idaho 1,327
41 Missouri 1,302
42 Texas 1,238
43 Nebraska 1,230
44 Georgia 1,187
45 New Hampshire 1,089
46 Utah 1,081
47 Florida 1,057
48 Virginia 1,039
49 Nevada 950
50 Kansas 559
1 Alaska 3,454
2 Vermont 2,651
3 New York 2,584
4 New Mexico 2,281
5 Rhode Island 2,280
6 West Virginia 2,146
7 Kentucky 2,074
8 Arkansas 2,013
10 Mississippi 1,986
9 Oregon 1,992
11 Massachusetts 1,985
12 Maine 1,972
14 Connecticut 1,870
15 North Dakota 1,866
13 Delaware 1,879
16 Hawaii 1,837
17 Louisiana 1,832
18 Michigan 1,811
19 Montana 1,758
20 Ohio 1,708
22 Tennessee 1,673
21 Arizona 1,674
f 50-State Average 1,652
23 Minnesota 1,643
24 Wyoming 1,626
Quick Stats
f Georgia’s top two recipients of federal grants in FY 2014 were: (a) Medical Assistance Plans Division within Georgia Department of Community Health (administers Medicaid): $6.9 billion, and (b) Department of Education (National School Lunch Program, Title 1 Funds to Local Schools, Special Education): $1.7 billion.
Sources: USAspending.gov and U.S. Census Bureau Annual Population Estimates
15.Per Capita Federal Grants, FY 2014
RANK STATE IN $ RANK STATE IN $
cslf.gsu.edu Center for State and Local Finance
LEGEND
Ranked above 50-state average
Ranked below 50-state average
25 New York 7,073
26 Washington 6,959
27 Oregon 6,946
28 Michigan 6,812
29 Arkansas 6,797
30 South Dakota 6,682
31 Montana 6,642
32 Idaho 6,441
33 Colorado 6,407
34 Delaware 6,312
35 Oklahoma 6,241
36 Ohio 6,188
38 Louisiana 6,166
37 New Hampshire 6,167
39 New Jersey 6,114
40 Iowa 6,017
41 California 5,896
42 North Carolina 5,811
43 Nebraska 5,806
44 Wyoming 5,754
45 Georgia 5,317
46 Texas 5,316
47 Illinois 5,299
48 Nevada 5,033
49 Kansas 4,956
50 Utah 4,389
1 North Dakota 76,613
2 Connecticut 17,811
3 Kentucky 16,039
4 Indiana 15,979
5 South Carolina 14,985
6 Pennsylvania 13,990
7 Wisconsin 13,481
8 Alabama 12,537
9 Virginia 10,955
10 Tennessee 10,916
11 Minnesota 10,630
12 Maryland 10,147
13 New Mexico 9,905
14 Massachusetts 9,618
f 50-State Average 9,553
15 Arizona 8,720
16 Alaska 8,571
17 West Virginia 7,733
18 Maine 7,711
19 Rhode Island 7,525
20 Florida 7,443
21 Hawaii 7,401
23 Mississippi 7,139
22 Vermont 7,144
24 Missouri 7,127
Quick Stats
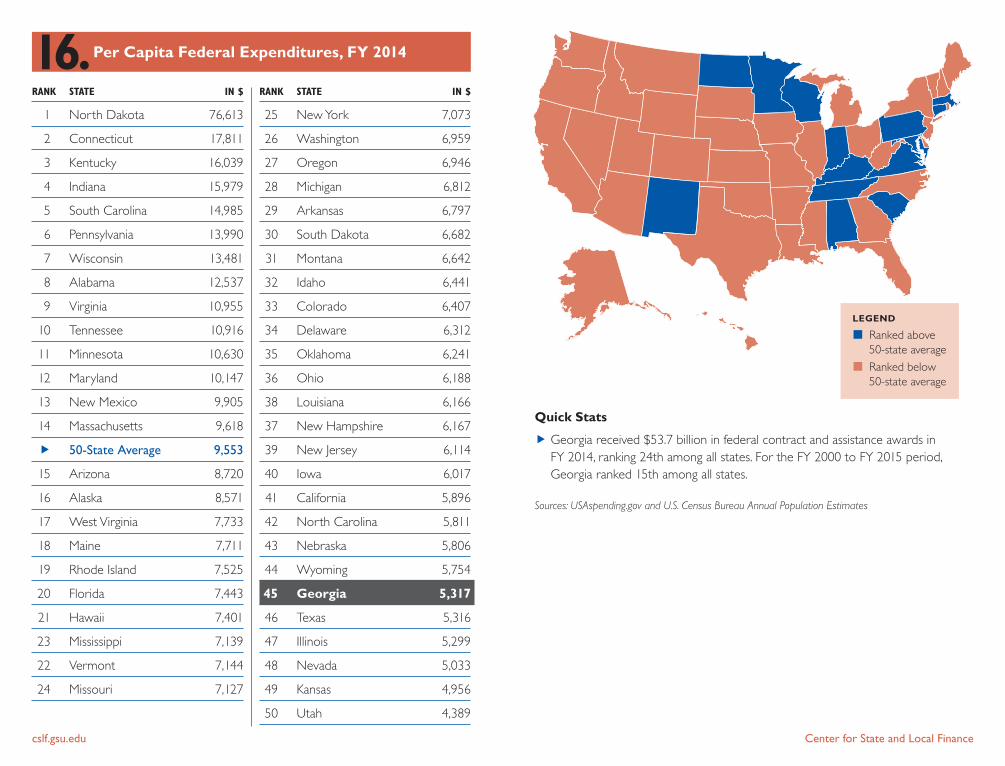
f Georgia received $53.7 billion in federal contract and assistance awards in FY 2014, ranking 24th among all states. For the FY 2000 to FY 2015 period, Georgia ranked 15th among all states.
Sources: USAspending.gov and U.S. Census Bureau Annual Population Estimates
16.Per Capita Federal Expenditures, FY 2014
RANK STATE IN $ RANK STATE IN $
cslf.gsu.edu Center for State and Local Finance

LEGEND
Ranked above 50-state average
Ranked below 50-state average
25 New Jersey 5,702
26 Oklahoma 5,562
27 Virginia 5,530
28 Colorado 5,507
29 California 5,502
30 Nebraska 5,437
31 Alabama 5,072
32 Illinois 5,065
33 Ohio 5,035
34 Washington 4,875
35 South Dakota 4,847
36 Kansas 4,824
37 Michigan 4,789
38 Tennessee 4,693
39 South Carolina 4,654
40 North Carolina 4,377
41 Utah 4,368
42 Indiana 4,287
43 Arizona 4,265
44 Georgia 4,247
45 Idaho 4,149
46 Missouri 3,795
47 New Hampshire 3,793
48 Texas 3,518
49 Florida 3,264
50 Nevada 3,187
1 Alaska 16,057
2 Wyoming 15,658
3 West Virginia 12,041
4 Delaware 9,902
5 Massachusetts 8,577
6 Hawaii 8,222
7 Vermont 7,920
8 North Dakota 7,891
9 Connecticut 7,738
10 Rhode Island 7,468
11 Wisconsin 7,447
12 Arkansas 7,248
13 New Mexico 7,042
14 New York 6,758
15 Pennsylvania 6,680
16 Oregon 6,569
17 Iowa 6,316
f 50-State Average 6,235
18 Mississippi 6,187
19 Maryland 6,105
20 Minnesota 6,100
21 Montana 5,952
22 Louisiana 5,901
23 Kentucky 5,835
24 Maine 5,779
Quick Stats
f Georgia’s per capita state expenditures increased by $99 in FY 2013 compared to FY 2012, an increase of 2.4 percent.
f Nationwide, per capita state expenditures increased by 2.7 percent.
Sources: National Association of State Budget Officers, State Expenditure Report and Fiscal 2012-2014 U.S. Census Annual Population Estimates
17. Per Capita State Expenditures, FY 2013
RANK STATE IN $ RANK STATE IN $
cslf.gsu.edu Center for State and Local Finance

LEGEND
Ranked above 50-state average
Ranked below 50-state average
25 New Jersey 7.3
26 Georgia 6.8
27 West Virginia 5.9
28 Hawaii 5.9
29 Texas 5.7
30 Kansas 5.0
31 Tennessee 4.1
32 Kentucky 3.5
33 Illinois 3.4
34 Idaho 2.4
35 California 1.5
36 Wisconsin 1.4
37 Missouri -1.0
38 Oregon -1.2
39 Michigan -1.2
40 Ohio -2.5
41 North Carolina -2.5
42 South Dakota -2.8
43 South Carolina -3.3
44 Washington -5.6
45 Maine -6.1
46 Nevada -6.8
47 New Hampshire -7.6
48 Arizona -8.1
49 Florida -11.1
50 Indiana -16.6
1 Massachusetts 80.9
2 Wyoming 54.2
3 Colorado 51.0
4 Louisiana 45.8
5 Pennsylvania 40.1
6 Delaware 39.7
7 North Dakota 39.6
8 Mississippi 28.4
9 Iowa 27.3
10 Vermont 23.9
11 Oklahoma 21.6
12 Virginia 19.0
13 Arkansas 18.3
14 Maryland 18.1
15 Alaska 18.0
16 Montana 17.8
17 Alabama 16.1
18 Connecticut 12.3
f 50-State Average 12.1
19 Rhode Island 11.2
20 Utah 10.1
21 New York 8.9
22 New Mexico 8.6
23 Nebraska 8.3
24 Minnesota 7.6
Quick Stats
f Total state expenditures, not adjusted for inflation and population, increased by 47 percent in Georgia and by an average rate of 49 percent across all 50 states.
Sources: National Association of State Budget Officers, State Expenditure Report, Fiscal 2012-2014, National Association of State Budget Officers, State Expenditure Report, Fiscal 2004-2006, and U.S. Census Annual Population Estimates
18.Percentage Change in Real Per Capita State Expenditures, FY 2004 – FY 2013
RANK STATE IN % RANK STATE IN %
cslf.gsu.edu Center for State and Local Finance

LEGEND
Ranked above 50-state average
Ranked below 50-state average
25 Kentucky 2,142
26 Kansas 2,119
27 North Carolina 2,054
28 Iowa 2,037
29 Nebraska 1,920
30 Montana 1,918
31 Tennessee 1,861
32 Louisiana 1,819
33 Oklahoma 1,814
34 Georgia 1,803
35 Utah 1,726
36 Idaho 1,668
37 Texas 1,609
38 Arkansas 1,607
39 Mississippi 1,583
40 South Dakota 1,527
41 Oregon 1,517
42 Colorado 1,508
43 Alabama 1,473
44 Missouri 1,327
45 Arizona 1,313
46 South Carolina 1,299
47 Florida 1,249
48 Nevada 1,140
49 New Hampshire 957
50 Michigan 897
1 Alaska 9,850
2 Wyoming 6,359
3 Connecticut 5,286
4 Hawaii 4,021
5 Massachusetts 3,990
6 Delaware 3,955
7 New Jersey 3,501
8 Minnesota 3,456
9 North Dakota 3,067
10 Rhode Island 3,053
11 New York 2,994
12 New Mexico 2,708
13 Maryland 2,547
14 California 2,513
15 Wisconsin 2,445
f 50-State Average 2,439
16 Ohio 2,371
17 Illinois 2,351
18 West Virginia 2,311
19 Maine 2,289
20 Virginia 2,277
21 Washington 2,220
22 Pennsylvania 2,169
23 Indiana 2,159
24 Vermont 2,157
Quick Stats
f Georgia’s per capita general fund expenditures increased by $65 (3.7 percent) from FY 2012 to FY 2013.
f Georgia’s total general fund expenditures were $18 billion in FY 2013, an increase of $779 million from FY 2012.
Note: The general fund, the predominant fund for financing a state’s operations, receives revenues from broad-based state taxes. Specific functions are financed differently from state to state.
Sources: National Association of State Budget Officers, State Expenditure Report, Fiscal 2012-2014, and U.S. Census Bureau Annual Population Estimates
19.Per Capita General Fund Expenditures, FY 2013
RANK STATE IN $ RANK STATE IN $
cslf.gsu.edu Center for State and Local Finance

LEGEND
Ranked above 50-state average
Ranked below 50-state average
25 Maryland 4,381 3,444 7,826
26 Louisiana 3,348 4,459 7,806
27 Michigan 3,118 4,606 7,724
28 Missouri 3,383 4,299 7,682
29 Wisconsin 4,017 3,599 7,616
30 Florida 1,972 5,619 7,591
31 Indiana 3,443 4,138 7,581
32 Arizona 2,213 5,271 7,484
33 Vermont 5,416 1,890 7,306
34 Ohio 2,909 4,124 7,033
35 South Dakota 4,323 2,696 7,019
36 Utah 2,475 4,432 6,907
37 North Dakota 2,969 3,791 6,761
38 Maine 4,219 2,282 6,502
39 Alabama 1,810 4,307 6,117
40 Iowa 2,005 3,903 5,907
41 West Virginia 3,936 1,948 5,884
42 Tennessee 955 4,783 5,739
43 Montana 3,975 1,750 5,725
44 Georgia 1,351 4,273 5,624
45 North Carolina 1,876 3,333 5,209
46 Oklahoma 2,614 2,308 4,923
47 Mississippi 2,409 2,475 4,884
48 Arkansas 1,240 3,494 4,734
49 Wyoming 2,291 1,864 4,156
50 Idaho 2,473 1,442 3,915
1 New York 6,930 10,415 17,345
2 Massachusetts 11,948 2,504 14,452
3 Alaska 8,083 4,907 12,990
4 Connecticut 8,893 3,022 11,915
5 New Jersey 7,306 4,285 11,591
6 Illinois 4,995 6,364 11,359
7 Rhode Island 8,751 2,586 11,337
8 California 4,034 6,994 11,028
9 Washington 4,218 6,743 10,961
10 Nevada 1,414 9,129 10,544
11 Texas 1,749 8,627 10,375
12 Pennsylvania 3,618 6,518 10,135
13 Hawaii 6,030 4,040 10,070
14 Colorado 3,082 6,818 9,899
15 Kentucky 3,446 6,248 9,693
16 Kansas 2,377 6,870 9,247
17 Minnesota 2,459 6,545 9,004
18 Delaware 6,322 2,658 8,980
19 Oregon 3,535 5,333 8,868
20 South Carolina 3,145 5,408 8,553
f 50-State Average 3,833 4,490 8,324
21 New Hampshire 6,077 2,073 8,150
22 Nebraska 1,117 7,022 8,139
23 Virginia 3,391 4,582 7,974
24 New Mexico 3,622 4,296 7,918
Quick Stats
f Georgia’s per capita state and local government debt outstanding increased by $89 (1.6 percent) from FY 2011 to FY 2012.
f Nationwide, the 50-state average per capita state and local government debt outstanding decreased by 0.6 percent.
Sources: U.S. Census Bureau Annual Surveys of State and Local Government Finances and U.S. Census Bureau Annual Population Estimates
20.Per Capita State & Local Debt Outstanding, FY 2012
STATE LOCAL S&L RANK IN $ IN $ IN $
STATE LOCAL S&L RANK IN $ IN $ IN $
cslf.gsu.edu Center for State and Local Finance

LEGEND
Ranked above 50-state average
Ranked below 50-state average
19 South Dakota* AA+ -- --
27 Oklahoma AA+ Aa2 AA+
27 Alabama AA Aa1 AA+
27 Montana AA Aa1 AA+
27 New Hampshire AA Aa1 AA+
27 West Virginia AA Aa1 AA+
32 Kansas* AA+ Aa2 --
32 Arkansas AA Aa1 --
32 Colorado* AA Aa1 --
35 Mississippi AA Aa2 AA+
35 Nevada AA Aa2 AA+
37 Hawaii AA Aa2 AA
37 Louisiana AA Aa2 AA
37 Maine AA Aa2 AA
37 New York AA Aa2 AA
37 Rhode Island AA Aa2 AA
37 Wisconsin AA Aa2 AA
43 Connecticut AA Aa3 AA
43 Michigan AA− Aa2 AA
44 Kentucky* AA− Aa2 AA−
46 Pennsylvania AA− Aa3 AA−
46 Arizona* AA− Aa3 --
48 California A Aa3 A
48 New Jersey A Aa3 A
50 Illinois A− A3 A
1 Alaska AAA Aaa AAA
1 Delaware AAA Aaa AAA
1 Georgia AAA Aaa AAA
1 Indiana* AAA Aaa --
1 Iowa* AAA Aaa AAA
1 Maryland AAA Aaa AAA
1 Missouri AAA Aaa AAA
1 Nebraska* AAA -- --
1 North Carolina AAA Aaa AAA
1 Texas AAA Aaa AAA
1 Utah AAA Aaa AAA
1 Virginia AAA Aaa AAA
1 Wyoming* AAA -- --
14 Florida AAA Aa1 AAA
14 South Carolina AA+ Aaa AAA
14 Tennessee AA+ Aaa AAA
14 Vermont AA+ Aaa AAA
18 New Mexico AA+ Aaa --
19 Massachusetts AA+ Aa1 AA+
19 Minnesota AA+ Aa1 AA+
19 Ohio AA+ Aa1 AA+
19 Oregon AA+ Aa1 AA+
19 Washington AA+ Aa1 AA+
19 Idaho* AA+ Aa1 --
19 North Dakota* AA+ Aa1 --
Quick Stats
f Georgia is one of seven states that have maintained an AAA rating from S&P since 2001.
* States with no outstanding general obligation debt. Shown are the ratings these states would likely receive if they decided to issue general obligation debt.
Note: States are ranked based on the average value of their bond ratings on a 10-point scale, with AAA rating equal to 10 points.
Sources: JLARC, “Virginia Compared to the Other States,” 2015 Edition (ratings as of December 2014) and The PEW Charitable Trusts, State Credit Ratings from Standard & Poor’s, 2001-2014, http://www.pewtrusts.org/en/research-and-analysis/blogs/stateline/2014/06/09/sp-ratings-2014
21.State Credit Ratings, 2014
RANK STATE S&P MOODY’S FITCH RANK STATE S&P MOODY’S FITCH
cslf.gsu.edu Center for State and Local Finance

LEGEND
Ranked above 50-state average
Ranked below 50-state average
25 Wisconsin 1,278
26 Oklahoma 1,277
27 Arizona 1,271
28 Michigan 1,264
29 Iowa 1,253
30 Colorado 1,211
31 Illinois 1,205
32 Hawaii 1,187
33 Idaho 1,163
34 New Jersey 1,162
35 Alabama 1,156
36 Texas 1,114
37 North Dakota 1,080
38 Montana 1,065
39 Florida 1,037
40 Wyoming 1,036
41 South Carolina 1,025
42 Nebraska 975
43 New Hampshire 972
44 South Dakota 965
45 Virginia 923
46 Georgia 904
47 Kansas 892
48 Utah 752
49 Nevada 724
50 Washington 579
1 Vermont 2,240
2 New York 1,970
3 Alaska 1,964
4 Maine 1,888
5 Rhode Island 1,855
6 Pennsylvania 1,796
7 New Mexico 1,762
8 Delaware 1,704
9 Connecticut 1,684
10 West Virginia 1,623
11 Mississippi 1,616
12 Massachusetts 1,607
13 Arkansas 1,525
14 Minnesota 1,484
15 Louisiana 1,480
16 Ohio 1,470
17 Tennessee 1,447
18 Oregon 1,403
19 California 1,382
20 Missouri 1,358
21 Indiana 1,338
f 50-State Average 1,319
22 North Carolina 1,313
23 Maryland 1,284
24 Kentucky 1,279
Quick Stats
f Georgia’s per capita Medicaid expenditures increased by $39 (4.5 percent) from FY 2012 to FY 2013.
f Georgia’s total Medicaid expenditures in FY 2013 were $9.0 billion, a 5.3 percent increase from FY 2012.
f Nationwide, Medicaid expenditures grew by 5.8 percent from FY 2012 to FY 2013.
Sources: National Association of State Budget Officers, State Expenditure Report, Fiscal 2012-2014, and U.S. Census Bureau, Annual Population Estimates
22.Per Capita Medicaid Expenditures, FY 2013
RANK STATE IN $ RANK STATE IN $
cslf.gsu.edu Center for State and Local Finance

LEGEND
Ranked above 50-state average
Ranked below 50-state average
26 Delaware 22.7
27 Alabama 22.6
28 Connecticut 22.4
f 50-State Average 22.2
29 New York 22.1
30 Wisconsin 21.5
31 Illinois 21.2
32 South Carolina 21.0
33 South Dakota 20.9
34 Oregon 20.6
35 Kansas 20.6
36 North Carolina 20.5
37 New Jersey 20.2
38 Louisiana 19.5
39 Michigan 19.4
40 Montana 18.7
41 Virginia 18.3
42 Washington 18.3
43 Hawaii 17.2
44 Utah 17.0
45 Alaska 16.5
46 Colorado 16.5
47 California 16.4
48 Nevada 15.7
49 North Dakota 14.1
50 Wyoming 13.2
1 Tennessee 31.9
2 Maine 31.8
3 Minnesota 30.0
4 Florida 27.2
5 Rhode Island 27.0
6 Massachusetts 26.4
7 Arkansas 26.4
8 Missouri 26.0
9 Oklahoma 25.5
10 Mississippi 25.2
11 Vermont 25.1
12 Arizona 24.9
13 West Virginia 24.5
14 Kentucky 24.3
15 Idaho 24.3
16 Iowa 24.3
17 Texas 24.0
18 Maryland 23.9
19 Indiana 23.8
20 Pennsylvania 23.6
21 Nebraska 23.4
22 New Mexico 23.1
23 New Hampshire 22.9
24 Ohio 22.9
25 Georgia 22.8
Quick Stats
f Georgia’s per capita expenditure for public assistance was $1,027 in FY 2012.
Sources: U.S. Census Bureau Annual Surveys of State and Local Government Finances and U.S. Census Bureau Population Estimates
23.Percentage of Total State Expenditures for Public Assistance, FY 2012
RANK STATE IN % RANK STATE IN %
cslf.gsu.edu Center for State and Local Finance

LEGEND
Ranked above 50-state average
Ranked below 50-state average
26 Indiana 86.2
f 50-State Average 85.9
27 Colorado 85.9
28 Louisiana 85.8
29 Kentucky 85.5
30 Oregon 84.9
31 Tennessee 84.8
32 Ohio 84.5
32 West Virginia 84.5
34 Mississippi 84.4
35 Idaho 83.7
36 Oklahoma 83.6
37 California 83.1
38 Alaska 82.8
39 Arkansas 82.7
40 South Carolina 82.5
41 Montana 82.2
42 Alabama 81.8
43 Georgia 81.6
44 Wyoming 81.3
45 New Mexico 80.7
45 North Carolina 80.7
47 Florida 77.9
48 Arizona 77.5
49 Texas 77.4
50 Nevada 77.0
1 Massachusetts 95.8
2 Hawaii 94.3
3 Minnesota 92.3
4 Delaware 91.6
5 Vermont 90.8
6 South Dakota 90.2
7 Rhode Island 89.8
8 Iowa 89.6
9 Wisconsin 89.5
10 New York 89.4
11 Connecticut 89.3
12 Kansas 89.1
13 Nebraska 88.8
14 Pennsylvania 88.7
15 Maine 88.4
16 Maryland 88.0
17 Michigan 87.8
18 Missouri 87.6
19 Illinois 87.4
20 New Hampshire 87.3
20 Utah 87.3
22 Virginia 87.2
23 North Dakota 86.9
24 Washington 86.8
25 New Jersey 86.3
Quick Stats
f The percentage of persons under 65 covered by health insurance in Georgia increased from 78.3 percent to 81.6 percent from 2012 to 2013.
f In 2013, 61.7 percent of Georgians under 65 years of age had private insurance, and 20.1 percent had public health insurance (Medicare, Medicaid, VA Health Care, CHIP, state health plans).
Note: Percentages for private/public health insurance do not add to total coverage because some individuals report having health insurance coverage from both private and public sources.
Sources: U.S. Census Bureau, Current Population Survey, Annual Social and Economic Supplement; and U.S. Census Bureau, 2013 American Community Survey
24.Percentage of Population Under Age 65 With Health Insurance Coverage, 2013
RANK STATE IN % RANK STATE IN %
cslf.gsu.edu Center for State and Local Finance

LEGEND
Ranked above 50-state average
Ranked below 50-state average
26 Florida 6.2
f 50-State Average 6.1
27 North Dakota 6.1
28 Illinois 6.0
29 Texas 5.8
30 Montana 5.7
31 New Hampshire 5.7
32 Idaho 5.6
33 Alaska 5.6
34 New Mexico 5.5
35 Nevada 5.5
36 Nebraska 5.3
37 Arizona 5.3
38 Utah 5.2
39 Colorado 5.1
40 Minnesota 5.1
41 Oregon 5.0
42 New York 4.9
43 California 4.8
44 Connecticut 4.7
45 Wyoming 4.6
46 New Jersey 4.5
46 Washington 4.5
48 Vermont 4.4
49 Massachusetts 4.2
50 Iowa 4.1
1 Mississippi 9.7
2 Louisiana 8.7
3 Alabama 8.6
4 Arkansas 7.6
5 West Virginia 7.6
6 Ohio 7.3
7 Indiana 7.2
8 Maine 7.0
8 Michigan 7.0
10 North Carolina 7.0
11 Georgia 6.9
12 South Carolina 6.9
13 Oklahoma 6.8
14 Tennessee 6.8
15 Pennsylvania 6.7
16 Maryland 6.6
17 Hawaii 6.5
17 South Dakota 6.5
19 Missouri 6.5
20 Rhode Island 6.5
21 Kansas 6.4
22 Kentucky 6.4
23 Delaware 6.3
24 Wisconsin 6.2
25 Virginia 6.2
Quick Stats
f Georgia’s infant mortality rate increased from 6.3 to 6.9 per 1,000 live births from 2010 to 2013.
Source: CDC, Detailed tables for the National Vital Statistics Report: “Deaths, final data for 2013” (Table 22)
25.Infant Mortality Rate, 2013
RANK STATE PER 1,000 LIVE BIRTHS RANK STATE PER 1,000 LIVE BIRTHS
cslf.gsu.edu Center for State and Local Finance

LEGEND
Ranked above 50-state average
Ranked below 50-state average
25 Kansas 10,713
26 Virginia 10,600
27 Louisiana 10,402
28 Washington 10,347
29 Missouri 10,026
30 Montana 9,830
31 South Carolina 9,818
32 Oregon 9,752
33 Arkansas 9,430
34 Georgia 9,402
35 Colorado 9,328
36 California 9,314
37 Kentucky 9,105
38 New Mexico 9,088
39 Texas 9,015
40 Alabama 8,521
41 Nevada 8,515
42 South Dakota 8,485
43 Florida 7,923
44 Tennessee 7,701
45 Oklahoma 7,603
46 North Carolina 7,494
47 Mississippi 7,483
48 Arizona 7,233
49 Utah 6,836
50 Idaho 6,410
1 New York 20,812
2 New Jersey 18,977
3 Connecticut 17,911
4 Wyoming 16,838
5 Vermont 16,458
6 Massachusetts 15,869
7 Alaska 15,534
8 Maryland 15,096
9 Pennsylvania 14,781
10 Rhode Island 14,484
11 New Hampshire 14,020
12 Delaware 13,752
13 Illinois 12,900
14 West Virginia 12,500
15 Maine 12,367
16 Ohio 12,280
17 Minnesota 12,237
18 Hawaii 12,130
19 North Dakota 11,727
20 Wisconsin 11,531
f 50-State Average 11,337
21 Iowa 11,142
22 Michigan 11,120
23 Nebraska 11,051
24 Indiana 10,973
Quick Stats
f In 2012, 46.9 percent of public school funding came from local sources, 42.5 percent from state sources, and 10.6 percent from federal sources.
f In 2012, Georgia’s public schools recorded nearly $1.6 billion in capital expenditures.
Source: U.S. Census Bureau, 2012 Census of Governments: Finance – Survey of School System Finances; Public Elementary-Secondary Education Finances: Fiscal Year 2012 (Table 11 – State and local data only)
26.State and Local Per-Pupil Funding, Pre-K to 12, 2011-12
RANK STATE IN $ RANK STATE IN $
cslf.gsu.edu Center for State and Local Finance

LEGEND
Ranked above 50-state average
Ranked below 50-state average
25 Nevada 5,603
26 Wisconsin 5,544
27 Iowa 5,407
28 Maine 5,406
29 New Hampshire 5,395
30 Louisiana 5,392
31 Oregon 5,363
32 Montana 5,350
33 Alabama 5,303
34 North Carolina 5,231
35 South Carolina 5,011
36 Illinois 4,896
37 Idaho 4,631
38 Missouri 4,607
39 Mississippi 4,475
40 Georgia 4,466
41 Virginia 4,426
42 Colorado 4,391
43 Oklahoma 4,320
44 Texas 4,087
45 Tennessee 4,023
46 Utah 3,896
47 Nebraska 3,876
48 Florida 3,273
49 South Dakota 3,093
50 Arizona 3,018
1 Vermont 15,600
2 Hawaii 11,829
3 Alaska 11,531
4 Wyoming 9,466
5 Delaware 9,189
6 New York 8,824
7 Minnesota 8,306
8 Arkansas 8,037
9 New Jersey 7,819
10 Indiana 7,413
11 New Mexico 7,244
12 Connecticut 7,150
13 West Virginia 7,140
14 Maryland 7,005
15 Michigan 6,893
16 North Dakota 6,748
17 Massachusetts 6,721
18 Washington 6,701
19 Kansas 6,535
f 50-State Average 6,189
20 California 5,870
21 Pennsylvania 5,813
22 Kentucky 5,751
23 Ohio 5,725
24 Rhode Island 5,670
Quick Stats
f State per-pupil funding in Georgia decreased by 0.7 percent from 2010-2011 to 2011-2012.
Source: U.S. Census Bureau, 2012 Census of Governments: Finance – Survey of School System Finances; Public Elementary-Secondary Education Finances: Fiscal Year 2012 (Table 11 – State data only)
27. State Per-Pupil Funding, Pre-K to 12, 2011-12
RANK STATE IN $ RANK STATE IN $
cslf.gsu.edu Center for State and Local Finance

LEGEND
Ranked above 50-state average
Ranked below 50-state average
25 Kentucky 50,560
26 Indiana 50,289
27 Montana 49,893
28 Virginia 49,826
29 Texas 49,690
30 Colorado 49,615
31 Nebraska 49,539
32 Maine 49,232
33 Louisiana 49,067
34 Alabama 48,720
35 North Dakota 48,666
36 South Carolina 48,430
37 Kansas 48,221
38 Florida 47,780
39 Tennessee 47,742
40 Arkansas 47,319
41 Missouri 46,750
42 New Mexico 45,727
43 Utah 45,695
44 Arizona 45,335
45 West Virginia 45,086
46 North Carolina 44,990
47 Oklahoma 44,549
48 Idaho 44,465
49 Mississippi 42,187
50 South Dakota 40,023
1 New York 76,409
2 Massachusetts 73,195
3 California 71,396
4 Connecticut 70,583
5 New Jersey 68,238
6 Alaska 65,891
7 Rhode Island 64,696
8 Maryland 64,546
9 Pennsylvania 63,701
10 Michigan 62,166
11 Illinois 60,124
12 Delaware 59,305
13 Oregon 58,638
14 New Hampshire 57,057
f 50-State Average 56,610
15 Wyoming 56,583
16 Hawaii 56,291
17 Vermont 55,958
18 Ohio 55,913
19 Nevada 55,813
20 Minnesota 54,752
21 Wisconsin 53,679
22 Washington 52,969
23 Georgia 52,924
24 Iowa 52,032
Quick Stats
f In Georgia, the average salary of public school teachers increased slightly, by 0.1 percent, from 2012-2013 to 2013-2014.
f In the fall of 2013, Georgia had a student-teacher ratio of 15.8 to 1, compared to a national average of 15.9 to 1.
Source: National Education Association Rankings & Estimates: Rankings of the States 2014 and Estimates of School Statistics, 2015
28.Average Salary of Public School Teachers, 2013-14
RANK STATE IN $ RANK STATE IN $
cslf.gsu.edu Center for State and Local Finance

LEGEND
Ranked above 50-state average
Ranked below 50-state average
26 Missouri 88.7
27 New Jersey 88.5
28 Virginia 88.4
29 Delaware 88.3
f 50-State Average 88.2
30 Illinois 87.8
31 Indiana 87.6
32 Florida 86.8
33 Oklahoma 86.7
34 Arizona 85.9
34 Rhode Island 85.9
36 North Carolina 85.7
37 New York 85.6
37 South Carolina 85.6
37 Tennessee 85.6
40 Georgia 85.5
41 Nevada 85.2
42 West Virginia 84.6
43 Alabama 84.5
44 Arkansas 84.4
45 New Mexico 84.3
46 Kentucky 84.1
47 Louisiana 83.1
48 Mississippi 82.4
49 Texas 81.9
50 California 81.7
1 Wyoming 93.5
2 New Hampshire 92.8
3 Montana 92.7
4 Minnesota 92.4
5 Maine 91.8
6 Alaska 91.6
6 Iowa 91.6
6 South Dakota 91.6
9 North Dakota 91.5
9 Utah 91.5
9 Vermont 91.5
12 Hawaii 91.0
13 Wisconsin 90.9
14 Colorado 90.5
15 Nebraska 90.2
16 Kansas 90.1
16 Washington 90.1
18 Massachusetts 89.9
19 Connecticut 89.7
19 Oregon 89.7
21 Idaho 89.4
21 Michigan 89.4
23 Pennsylvania 89.2
24 Maryland 89.1
25 Ohio 89.0
Quick Stats
f Georgia’s percentage of population older than 25 years of age with at least a high school education increased from 85.0 percent to 85.5 percent from 2012 to 2013.
f In 2013, 28.3 percent of Georgians 25 years and older had completed a bachelor’s degree or higher, compared to the 50-state average of 28.9 percent.
Source: American Community Survey, One Year Estimates, 2012, 2013
29.Percentage of Population 25 Years & Older With at Least a High School Education, 2013
RANK STATE 2013 (IN %) RANK STATE 2013 (IN %)
cslf.gsu.edu Center for State and Local Finance

30.Average Annual In-State Tuition & Fees at Public Four-Year Institutions, 2014-15
RANK STATE IN $ RANK STATE IN $
LEGEND
Ranked above 50-state average
Ranked below 50-state average
Quick Stats
f Average tuition and fees at Georgia’s public four-year higher education institutions increased by $115 (1.4 percent) from 2013-2014 to 2014-2015.
f Average tuition and fees at Georgia’s private nonprofit four-year institutions was $29,578 in 2014-2015.
Source: College Board, Trends in College Pricing, 2014
1 New Hampshire 14,712
2 Vermont 14,419
3 Pennsylvania 13,246
4 New Jersey 13,002
5 Illinois 12,770
6 Michigan 11,909
7 South Carolina 11,449
8 Delaware 11,448
9 Massachusetts 10,951
10 Rhode Island 10,934
11 Virginia 10,899
12 Washington 10,846
13 Connecticut 10,620
14 Minnesota 10,527
15 Arizona 10,398
16 Ohio 10,100
17 Hawaii 9,740
18 Colorado 9,487
19 Alabama 9,470
20 Maine 9,422
21 Kentucky 9,188
22 California 9,173
23 Indiana 9,023
f 50-State Average 9,012
24 Oregon 8,932
25 Texas 8,830
26 Wisconsin 8,781
27 Maryland 8,724
28 Tennessee 8,541
29 Missouri 8,383
30 Georgia 8,094
31 Kansas 8,086
32 Iowa 7,857
33 South Dakota 7,653
34 Arkansas 7,567
35 North Dakota 7,513
36 Nebraska 7,404
37 Louisiana 7,314
38 New York 7,292
39 Oklahoma 6,895
40 Mississippi 6,861
41 North Carolina 6,677
42 West Virginia 6,661
43 Idaho 6,602
44 Nevada 6,418
45 Florida 6,351
46 Montana 6,279
47 New Mexico 6,190
48 Utah 6,177
49 Alaska 6,138
50 Wyoming 4,646
cslf.gsu.edu Center for State and Local Finance

LEGEND
Ranked above 50-state average
Ranked below 50-state average
25 New York 14.8
26 Delaware 14.8
27 South Dakota 14.7
28 Arkansas 14.4
29 Connecticut 13.5
30 Alaska 12.7
31 Wyoming 12.7
32 Pennsylvania 11.2
33 Illinois 10.9
34 Wisconsin 10.7
35 Michigan 10.3
36 Texas 8.9
37 South Carolina 8.7
38 Vermont 8.5
39 Minnesota 8.3
40 Nebraska 7.4
41 Ohio 7.3
42 North Dakota 7.2
43 Massachusetts 7.1
44 Indiana 6.7
45 Iowa 5.8
46 New Jersey 5.6
47 Maryland 5.5
48 Missouri 5.0
49 Montana 3.5
50 Maine -0.3
1 Louisiana 54.4
2 Georgia 46.1
3 Arizona 43.4
4 Colorado 36.8
5 Washington 33.9
6 Florida 33.0
7 North Carolina 33.0
8 Hawaii 32.6
9 Alabama 32.0
10 Nevada 27.7
11 Tennessee 26.6
12 California 26.6
13 Mississippi 25.2
14 Virginia 24.1
15 Idaho 22.1
16 Utah 22.1
17 West Virginia 20.9
18 New Hampshire 20.1
f 50-State Average 17.9
19 New Mexico 16.9
20 Oregon 16.9
21 Kentucky 16.7
22 Rhode Island 16.2
23 Kansas 15.8
24 Oklahoma 15.0
Quick Stats
f Georgia’s public two-year in-district tuition and fees increased by 24.5 percent from 2009-2010 to 2014-2015.
Note: Data provided by The College Board is adjusted for inflation to 2014 dollars using the Consumer Price Index – All Urban Consumers.
Source: College Board, Trends in College Pricing, 2014
31.Percentage Change in In-State Tuition & Fees at Public Four-Year Institutions, 2009-10 to 2014-15
RANK STATE IN % RANK STATE IN %
cslf.gsu.edu Center for State and Local Finance

LEGEND
Ranked above 50-state average
Ranked below 50-state average
25 Minnesota 256
27 Delaware 243
26 South Dakota 244
28 Tennessee 242
29 Louisiana 242
30 Idaho 229
32 Washington 222
33 Montana 222
31 New Jersey 223
34 Virginia 214
35 Maine 204
37 Florida 197
36 Massachusetts 199
38 Wisconsin 193
39 South Carolina 188
40 Ohio 182
41 Nevada 172
42 Michigan 168
43 Oregon 159
44 Rhode Island 158
45 Missouri 157
46 Vermont 148
47 Arizona 131
49 Colorado 127
48 Pennsylvania 129
50 New Hampshire 82
1 Wyoming 604
2 North Dakota 554
3 Alaska 522
4 New Mexico 411
5 Hawaii 374
6 Nebraska 366
7 North Carolina 364
8 Arkansas 338
9 Mississippi 325
10 Illinois 317
11 Alabama 297
12 Maryland 288
13 Connecticut 283
15 Georgia 276
14 West Virginia 279
18 Utah 271
17 California 272
16 Oklahoma 272
19 Kentucky 271
20 New York 268
21 Kansas 266
22 Iowa 265
f 50-State Average 259
23 Texas 258
24 Indiana 257
Quick Stats
f Georgia’s per capita state support for public and private higher education increased by 5.2 percent from FY 2013 to FY 2014.
Source: James C. Palmer, ed. Grapevine, Summary Tables FY 2012-2013, FY 2013-2014
32.Per Capita State Support for Public & Private Higher Education, FY 2014
RANK STATE IN $ RANK STATE IN $
cslf.gsu.edu Center for State and Local Finance

LEGEND
Ranked above 50-state average
Ranked below 50-state average
25 Louisiana 168,001
26 Oregon 165,480
27 Kentucky 154,788
28 Oklahoma 145,401
29 Kansas 138,310
30 Mississippi 131,104
31 Iowa 127,407
32 Utah 119,692
33 Arkansas 119,608
34 New Mexico 98,630
35 Connecticut 88,681
36 Nebraska 79,704
37 West Virginia 76,202
38 Nevada 64,497
39 Idaho 56,177
40 Hawaii 40,417
41 Montana 39,484
42 New Hampshire 36,988
43 North Dakota 36,927
44 Maine 36,577
45 Delaware 35,657
46 South Dakota 33,677
47 Rhode Island 31,309
48 Wyoming 24,986
49 Vermont 20,955
50 Alaska 20,464
1 California 1,511,300
2 Texas 994,745
3 Florida 608,221
4 New York 565,830
5 North Carolina 402,199
6 Ohio 401,874
7 Michigan 399,953
8 Pennsylvania 358,820
9 Georgia 347,733
10 Illinois 326,329
11 Virginia 318,166
12 New Jersey 274,341
13 Arizona 269,902
14 Indiana 249,019
15 Washington 245,011
16 Maryland 232,684
17 Wisconsin 223,777
f 50-State Average 222,751
18 Minnesota 204,046
19 Missouri 196,831
20 Alabama 195,693
21 Tennessee 190,485
22 Colorado 184,836
23 Massachusetts 172,574
24 South Carolina 172,049
Quick Stats
f From FY 2013 to FY 2014, Georgia’s FTE enrollment in public higher education decreased by 2.0 percent.
f Although FTE enrollment decreased annually in Georgia from FY 2011 to FY 2014, FTE enrollment in Georgia in FY 2014 was 11.9 percent higher than FTE enrollment in FY 2008.
Note: Full-time equivalent enrollment equates student credit hours to full-time, academic year students, but excludes medical students.
Source: State Higher Education Executive Officers, State Higher Education Finance FY 2014 (April 2015)
33.FTE Student Enrollment in Public Higher Education, FY 2014
RANK STATE FTE RANK STATE FTE
cslf.gsu.edu Center for State and Local Finance

LEGEND
Ranked above 50-state average
Ranked below 50-state average
25 Wisconsin 5,786
26 Washington 5,700
27 Alabama 5,673
28 Kansas 5,648
29 Louisiana 5,606
30 West Virginia 5,530
31 New Jersey 5,520
32 Utah 5,506
33 Iowa 5,335
34 Minnesota 5,327
35 Missouri 5,297
36 Arizona 5,171
37 Delaware 5,052
38 Indiana 5,005
39 Montana 4,939
40 South Carolina 4,894
41 South Dakota 4,878
42 Virginia 4,779
43 Michigan 4,765
44 Rhode Island 4,690
45 Ohio 4,314
46 Oregon 4,214
47 Pennsylvania 3,654
48 Colorado 3,022
49 Vermont 2,816
50 New Hampshire 2,360
1 Wyoming 15,561
2 Alaska 13,978
3 Illinois 12,293
4 North Carolina 8,562
5 New York 8,454
6 Texas 8,050
7 New Mexico 8,029
8 North Dakota 7,888
9 Nebraska 7,840
10 Arkansas 7,653
11 Hawaii 7,618
12 Maryland 7,512
13 California 7,509
14 Georgia 7,297
15 Connecticut 7,192
16 Oklahoma 7,080
17 Nevada 7,016
18 Idaho 7,004
19 Tennessee 6,959
20 Kentucky 6,824
21 Mississippi 6,514
f 50-State Average 6,409
22 Maine 6,252
23 Massachusetts 6,073
24 Florida 5,798
Quick Stats
f Georgia’s higher education appropriations per FTE student increased by 6.7 percent from FY 2013 to FY 2014 (constant adjusted to 2014 dollars).
f Georgia’s higher education appropriations per FTE student in FY 2014 was 23.2 percent lower in FY 2014 than in FY 2008 (constant adjusted 2014 dollars).
Notes:1. Educational appropriations are a measure of state and local support available for public higher
education operating expenses including ARRA funds; they exclude appropriations for independent institutions, financial aid for students attending independent institutions, research, hospitals and medical education.
2. Adjustment factors, to arrive at constant dollar figures, include Cost of Living Adjustment (COLA), Enrollment Mix Index (EMI), and Higher Education Cost Adjustment (HECA). The COLA is not a measure of inflation over time.
Source: State Higher Education Executive Officers, State Higher Education Finance FY 2014 (April 2015)
34.Higher Education Appropriations per FTE Student, FY 2014
RANK STATE IN $ RANK STATE IN $
cslf.gsu.edu Center for State and Local Finance
GAS DIESELRANK STATE IN CENTS PER GALLON
LEGEND
Ranked above 50-state average
Ranked below 50-state average
25 Georgia 26.53 30.10
26 Nebraska 26.50 25.90
27 Idaho 25.00 25.00
28 Utah 24.50 24.50
29 Kansas 24.03 26.03
30 Wyoming 24.00 24.00
31 New Hampshire 23.83 23.83
32 Delaware 23.00 22.00
32 North Dakota 23.00 23.00
34 Virginia 22.38 26.08
35 Colorado 22.00 20.50
35 Iowa 22.00 23.50
35 South Dakota 22.00 24.00
38 Arkansas 21.80 22.80
39 Tennessee 21.40 18.40
40 Alabama 20.87 21.85
41 Louisiana 20.01 20.01
42 Texas 20.00 20.00
43 Arizona 19.00 27.00
44 New Mexico 18.88 22.88
45 Mississippi 18.78 18.40
46 Missouri 17.30 17.30
47 Oklahoma 17.00 14.00
48 South Carolina 16.75 16.75
49 New Jersey 14.50 17.50
50 Alaska 11.30 11.80
1 Pennsylvania 50.50 64.20
2 California 45.39 40.60
3 New York 45.09 46.28
4 Hawaii 45.00 42.38
5 Connecticut 43.22 54.50
6 North Carolina 37.75 37.75
7 Washington 37.50 37.50
8 Florida 36.42 33.67
9 West Virginia 34.60 34.60
10 Nevada 33.15 28.56
11 Rhode Island 33.00 33.00
12 Wisconsin 32.90 32.90
13 Vermont 31.97 32.00
14 Oregon 31.07 30.34
15 Illinois 30.72 39.49
16 Maryland 30.30 31.05
17 Michigan 30.26 33.98
18 Maine 30.01 31.21
19 Indiana 29.85 44.26
20 Minnesota 28.60 28.60
21 Ohio 28.00 28.00
22 Montana 27.75 28.50
23 Kentucky 27.60 24.60
f 50-State Average 27.47 28.63
24 Massachusetts 26.54 26.54
Quick Stats
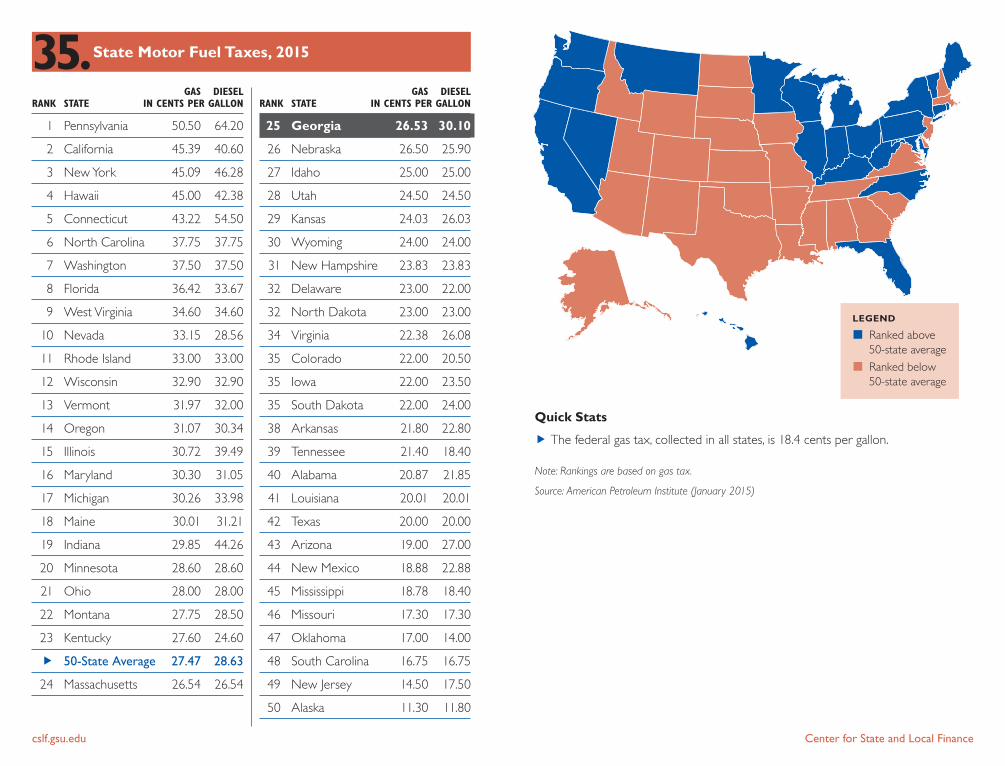
f The federal gas tax, collected in all states, is 18.4 cents per gallon.
Note: Rankings are based on gas tax.
Source: American Petroleum Institute (January 2015)
35.State Motor Fuel Taxes, 2015
GAS DIESELRANK STATE IN CENTS PER GALLON
cslf.gsu.edu Center for State and Local Finance

LEGEND
Ranked above 50-state average
Ranked below 50-state average
25 Illinois 559
26 Idaho 552
27 New York 524
28 Virginia 515
29 New Mexico 496
30 Arkansas 489
31 Missouri 487
32 Oregon 477
33 Connecticut 473
34 Alabama 466
35 New Jersey 465
36 Ohio 465
37 Colorado 460
38 California 439
39 Texas 434
40 Indiana 432
41 Hawaii 432
42 Rhode Island 418
43 Florida 411
44 North Carolina 402
45 Massachusetts 392
46 Tennessee 385
47 Arizona 357
48 Michigan 332
49 South Carolina 331
50 Georgia 312
1 North Dakota 1,843
2 Alaska 1,750
3 Wyoming 1,317
4 South Dakota 1,133
5 Vermont 1,071
6 Montana 1,046
7 Maryland 859
8 Delaware 779
9 Iowa 771
10 West Virginia 697
11 Utah 687
12 Pennsylvania 679
13 Maine 669
14 Wisconsin 668
15 Minnesota 664
16 Nebraska 657
f 50-State Average 631
17 Kansas 626
18 Nevada 610
19 Oklahoma 606
20 Washington 600
21 Louisiana 600
22 Mississippi 582
23 Kentucky 568
24 New Hampshire 562
Quick Stats
f Of the $3.1 billion Georgia spent on roads in FY 2012, $1.9 billion (61.7 percent) was capital spent mainly on road construction.
f Georgia ranked sixth in total vehicle miles traveled in 2013 with 109 billion miles.
Sources: U.S. Census Bureau 2012/2011 Annual Survey of State and Local Government Finances; U.S. Census Bureau, Population Estimates; and Federal Highway Administration, Office of Highway Policy Information, Highway Statistics, 2013
36.Per Capita State & Local Road Expenditures, FY 2012
RANK STATE IN $ RANK STATE IN $
cslf.gsu.edu Center for State and Local Finance

LEGEND
Ranked above 50-state average
Ranked below 50-state average
25 Washington 8,667
26 Iowa 8,572
27 South Dakota 8,496
28 Oregon 8,272
29 Colorado 7,926
30 South Carolina 7,691
31 Arizona 7,156
32 Illinois 6,678
33 Hawaii 6,577
34 Rhode Island 6,379
35 Michigan 6,336
36 Florida 6,287
37 Missouri 6,229
38 Tennessee 6,112
39 Pennsylvania 5,985
40 Arkansas 5,781
41 Idaho 5,458
42 Kentucky 5,373
43 Mississippi 5,238
44 Louisiana 5,074
45 Texas 5,038
46 Alabama 5,011
47 Ohio 4,278
48 Indiana 3,662
49 Minnesota 3,448
50 Georgia 2,628
1 Alaska 21,811
2 Wyoming 18,019
3 West Virginia 15,780
4 North Dakota 15,442
5 California 14,928
6 Vermont 13,658
7 Utah 13,368
8 Virginia 13,027
9 Montana 12,920
10 New York 12,880
11 Maine 12,773
12 Massachusetts 12,715
13 New Mexico 12,528
14 New Hampshire 12,467
15 Delaware 11,942
16 Wisconsin 11,767
17 Nebraska 11,056
18 Maryland 10,460
19 Oklahoma 9,842
20 Connecticut 9,732
f 50-State Average 9,224
21 North Carolina 9,195
22 New Jersey 8,953
23 Nevada 8,833
24 Kansas 8,779
Quick Stats
f Georgia had 536,532 total offenders in correctional facilities, juvenile residential placement, or under community supervision (probation) in FY 2012. Of this total, 89 percent were on probation.
f In FY 2012, Georgia had the highest number of offenders under community supervision per 100,000 adult residents in the nation. Georgia’s number was 6,192, compared to the national average of 1,804.
Sources: U.S. Census Bureau 2011/2012 Annual Survey of State and Local Government Finances; Bureau of Justice Statistics, Probation and Parole in the United States, 2011 and 2012; Bureau of Justice Statistics, Prisoners in 2012; and Office of Juvenile Justice and Delinquency Prevention, The Census of Juveniles in Residential Placement 2011
37. State Corrections Expenditures per Offender
RANK STATE IN $ RANK STATE IN $
cslf.gsu.edu Center for State and Local Finance

LEGEND
Ranked above 50-state average
Ranked below 50-state average
25 Maine 1.6
26 Iowa 1.6
27 Washington 1.5
28 Virginia 1.5
29 Minnesota 1.5
30 North Carolina 1.5
31 Colorado 1.5
32 Massachusetts 1.5
33 Michigan 1.4
34 Maryland 1.4
35 Missouri 1.4
36 New Hampshire 1.4
37 Idaho 1.4
38 Indiana 1.3
39 Georgia 1.3
40 Wisconsin 1.3
41 Pennsylvania 1.2
42 Tennessee 1.2
43 New York 1.2
44 Texas 1.2
45 Ohio 1.2
46 Arizona 1.1
47 California 1.0
48 Illinois 1.0
49 Nevada 1.0
50 Florida 0.9
1 Hawaii 4.0
2 Alaska 3.7
3 Delaware 2.9
4 North Dakota 2.7
5 Wyoming 2.3
6 Vermont 2.3
7 West Virginia 2.2
8 New Mexico 2.2
9 Arkansas 2.2
10 Montana 2.0
11 Mississippi 1.9
12 Kentucky 1.9
13 Utah 1.9
14 Alabama 1.8
15 Rhode Island 1.8
f 50-State Average 1.7
16 Connecticut 1.7
17 Oklahoma 1.7
18 Kansas 1.7
19 Nebraska 1.7
20 South Dakota 1.7
21 Oregon 1.7
22 Louisiana 1.7
23 South Carolina 1.7
24 New Jersey 1.6
Quick Stats
f In 2013, Georgia had 128,795 state government FTEs. This represents a 0.7 percent decrease from 2008.
Notes:1. Full-time equivalent (FTE) is a computed statistic representing the number of full-time employees
that could have been employed if the reported number of hours worked by part-time employees had been worked by full-time employees. This statistic is calculated by dividing the “part-time hours paid” by the standard number of hours for full-time employees and then adding the resulting quotient to the number of full-time employees.
2. FTE per 100 persons is calculated as state government FTE divided by state population, divided by 100.
Sources: U.S. Census Bureau 2012 and 2013 Annual Survey of Public Employment and Payroll (Mar. 2012, Mar. 2013) and U.S. Census Bureau, Annual Population Estimates
38.State Government FTEs per 100 Persons, 2013
RANK STATE FTE PER 100 PERSONS RANK STATE FTE PER 100 PERSONS
cslf.gsu.edu Center for State and Local Finance
AUTHOR BIOElton Davis, a graduate research assistant at the Center for State and Local Finance, recently completed his Master’s in Economics from the Andrew Young School of Policy Studies at Georgia State University. His professional experience includes both financial management and operations roles within manufacturing and healthcare technology firms. In addition, he is a former Air Force navigator. Previously, Elton earned a MBA at Southern Methodist University and a B.S. at the United States Air Force Academy. His research interests include public finance challenges related to healthcare, education, and transportation policy.
Notes
cslf.gsu.edu Center for State and Local Finance

Center for State & Local FinanceAndrew Young School of Policy Studies, Georgia State University
14 Marietta St. NW, 4th Floor, Atlanta, GA 30303P.O. Box 3992, Atlanta, GA 30302-3992