Embed Size (px)
Citation preview

CLIMAS Southwest Climate Outlook
Issued: July 20, 2004
1 July 2004 Climate Summary 2 Feature: Monsoon forecasting could
improve following study 3 Diary of a Monsoon Forecaster
Recent Conditions 5 Temperature 6 Precipitation 7 U.S. Drought Monitor 8 New Mexico Drought Status 9 Arizona Reservoir Levels 10 New Mexico Reservoir Levels11 Fire Summary12 Monsoon Summary
Forecasts 13 Temperature Outlook 14 Precipitation Outlook 15 Seasonal Drought Outlook 16 Wildland Fire Outlook 17 El Niño Status and Forecast
Forecast Verification 18 Temperature Verification 19 Precipitation Verification
Focus Page 20 Monsoon Forecast
July 2004 Climate SummaryHydrological Drought – Hydrological drought continues in the Southwest.
• Interior Arizona and Rio Grande corridor reservoir levels continue to fall.
• Current storage in Lake Powell and Lake Mead storage is well below average and is expected to decline through the summer months.
Precipitation – The summer monsoon arrived late in the Southwest. Thus far, sum-mer precipitation has been well below average across most of New Mexico and parts of Arizona. June storms helped eastern New Mexico.
Temperature – Temperatures have been about average across most of the Southwest during the past month.
Climate Forecasts – Seasonal forecasts indicate considerably increased probabilities of above-average temperatures across Arizona and most of New Mexico through the summer months, but only slightly increased probabilities of above-average temperatures across western and southern Arizona for the fall and early winter. An experimental monsoon forecast shows good chances for above-average precipitation during the heart of the monsoon season.
El Niño – Forecasts indicate a 40 percent chance, at best, of the development of El Niño (wet Southwest) this winter.
The Bottom Line – Hydrological drought is expected to persist in most of the Southwest for the foreseeable future.
In this issue:
Disclaimer - This packet contains official and non-official forecasts, as well as other information. While we make every effort to verify this informa-tion, please understand that we do not warrant the accuracy of any of these materials. The user assumes the entire risk related to the use of this data. CLIMAS disclaims any and all warranties, whether expressed or implied, including (without limita-tion) any implied warranties of merchantability or fitness for a particular purpose. In no event will CLIMAS or the University of Arizona be liable to you or to any third party for any direct, indirect, incidental, consequential, special or exemplary damages or lost profit resulting from any use or misuse of this data.
The climate products in this packet are available on the web:http://www.ispe.arizona.edu/climas/forecasts/swoutlook.html
The Southwest Climate Outlook is published monthly by the Climate Assessment for the Southwest Project at the University of Arizona. This work is funded, in part, by the U.S. Bureau of Reclamation and the Technology Re-search Initiative Fund of the University of Arizona Water Sustainability Program.
Fire + Rain = SummerThis month we feature new recent conditions pages on the summer mon-soon and fire activity in the Southwest. In addition, our monthly focus page looks at an experimental monsoon forecast produced by Arizona’s State Climatologist.
This year’s monsoon has been sleepy, by and large, but the monsoon is in-famous for its spatial inhomogeneity—i.e., it can produce torrential down-pours on one side of the street, while the other side remains bone dry.
Here are some of the summer success stories for 2004: Arizona record high single day pre-cipitation—Payson (2.56 in. on July 14); New Mexico record high single day precipitation —Clines Corners (1.91 in. on July 11). Nogales, Arizona has received 2.78 in. of monsoon precipitation thus far; Nogales has received at least a trace of precipitation each day since July 8, the official start of the monsoon at the Tucson National Weather Service forecast of-fice. (All data quoted are unofficial and have not been subjected to quality control).

Southwest Climate Outlook, July 2004
2 | Feature Article
BY MELANIE LENART
Many Southwesterners greet the North American monsoon with joy, perhaps appreciating that half of some area’s an-nual precipitation can come during this seasonal gathering of thunderclouds. But the timing of the monsoon’s arrival and the length of its stay are just two of many factors that generally have eluded prediction, thus limiting opportunities for society to make plans around its visit.
This year, a host of scientists from 30 dif-ferent institutions in the United States, Mexico, and Central America are hoping to improve future forecasts by intensively monitoring the monsoon’s physical features as part of the North American Monsoon Experiment (NAME).
“The goal of NAME 2004 is to improve our understanding of the daily cycle of precipitation in the complex terrain of northwestern Mexico and the south-western U.S.,” explained Wayne Hig-gins, chair of the NAME Science Work-ing Group and lead principal investiga-tor on the project. “The dataset gathered this summer will be used to improve our ability to simulate and ultimately pre-dict monsoon precipitation months to seasons in advance using state-of-the-art computer models.”
Traditionally, weather forecasts address a week or less in the future, while climate forecasts apply to longer time frames such as months or seasons. Understand-ing how weather and climate are related can lead to improvements in climate forecasting, though.
Climatologists often issue seasonal fore-casts, hoping to aid decision making by various members of society in sec-tors ranging from ranching to tourism.
Firefighters count on the monsoon to give them a break from battling blazes, health officials relate its arrival to future valley fever outbreaks, and water man-agers cross their fingers that some runoff will reach reservoirs.
However, predictions for summer pre-cipitation are less reliable than those for winter precipitation in the Southwest. This is largely because the patterns that influence winter precipitation are much weaker during the summer, Higgins said.
Erik Pytlak, science and operations of-ficer for the Tucson National Weather Service office and U.S. rotational team leader for NAME, agreed that predicting summer rainfall remains challenging.
“Right now, the monsoon is probably one of the least understood weather phenomenon in North America. And what we’re trying to do is change that fact,” he explained. “We want to see improvements in the forecasts not only hours in advance, but months in advance.”
Pytlak and a cadre of 30 meteo-rologists from around the West will be issuing weather forecasts on a daily basis during the field season from the NAME Fore-cast Operations Center in Tuc-son to help researchers located in western Mexico identify interesting features of the mon-soon for enhanced monitoring.
These features, such as surges of tropical moisture or heavy pre-cipitation events in Arizona and New Mexico, will be studied using an array of instruments, including surface weather sta-tions, wind profilers, balloons, radar, research airplanes, and research ships. The ships are based in the Gulf of California, while the land-based systems
are tracking the monsoon from more than 100 different locations.
NAME is also fostering a two-way ex-change of information, technology, and training between U.S. and Mexican weather services. Mexico City serves as a base of operations for weather forecast-ing along with Tucson. The binational effort reflects the nature of the monsoon itself, which recognizes no political bor-ders. The monsoon typically begins in Mexico in June, moving northward into the southwestern United States by July (Figure A).
Unfortunately, the timing of monsoon onset in Mexico doesn’t necessarily help predict when it will arrive in the United States, as Higgins and others reported in the Journal of Climate in March 1999.
Although Arizona State Climatologist Andrew Ellis and Mexico’s Servicio Meteorólógico Nacional (the Mexican
Monsoon forecasting could improve following study
continued on page 3
Figure A. The map shows the mean calendar date of monsoon onset, based on the time frame 1963–1988. Onset definitions vary depending on region because of differences in rainfall regimes (see Higgins, et al., Journal of Climate, March 1999). Although average onset date may change slightly if different time frames are used, the relative timing of the northward progression of the monsoon should remain intact.
July 14 July 13 July 9
July 13 July 8 July 7
July 11 July 6 July 3
June 29 June 25 June 27
June 21 June 22 June 23
June 16 June 17
June 14
June 11
June 14
June 10
June 7 June 8
June 5
June 6June 6
NAME project targets summer rainfall in U.S. and Mexico

Southwest Climate Outlook, July 2004
3 | Feature Article
national weather service) both predict above-average rainfall this monsoon season, forecasting monsoon strength remains as much of an art as a science at this point.
“In our experience, northwestern Mexico is the most difficult region to forecast in the long term—one month to one season of rainfall. At this time we don’t have a clear understanding of all the physical mechanisms that help to initi-ate rainfall in that part of the country,” noted Miguel Cortez Vázquez, leader of the seasonal rainfall forecast for Servicio Meteorólógico Nacional and Mexico ro-tational team leader for NAME.
Researchers hope that will change in the years following this summer’s intensive NAME field season, which is expected to extend from July 1 through August 15. During the season, researchers expect to capture interactions among several key features of the monsoon sys-tem, including tropical storms, surges of moisture from the eastern Tropical Pa-cific, and clusters of thunderstorms that organize into large-scale storms.
In addition, they will be using detailed measurements taken at different eleva-tions in the Sierra Madre Occidental range to understand more clearly how mountains influence precipitation pat-terns, Cortez said.
Like northwestern Mexico, much of the U.S. West has mountain ranges that help swoop up potential storm clouds to higher altitudes, where the moisture they contain is more likely to condense into raindrops.
In the short-term, researchers want to understand how the complexities posed by mountainous landscape and the vari-ous monsoon features influence summer rainfall patterns. But in the longer time frame of the NAME project (2000–2008), some hope to place the monsoon
NAME, continued
continued on page 4
BY RICK BRANDT
I recently finished a five-day shift as an assistant forecaster with the North Ameri-can Monsoon Experiment (NAME). During that time, I worked with two other meteorologists at the forecast operations center at the Tucson National Weather Service office where we produced forecasts for the study region.
We focused on five periods: a summary of important weather features during the previous day and forecasts for 24 hours, 24–48 hours, 3–5 days, and 6–10 days. I wrote summaries of the previous day, describing information such as the approximate quantity of precipitation received in different areas and the pressure patterns. I also made 24-hour forecasts, while the other meteorologists worked on the remaining forecast periods. The predictions were developed using forecasting models, observations, radar and satellite imagery, and personal experience and education. The computer models calculated numerous atmospheric variables that we use to forecast the weather. The surface observations and radar and satellite imagery showed us the recent and current conditions. This information helped us decide how much to rely on the models before we issued a forecast.
At 2 p.m. each day, the fore-casters, science directors, and several other participants at-tended a briefing, where the summary and forecasts were presented and discussed. This served to update everyone, discuss the opinions of others, and decide if we wanted to initiate additional data-gath-ering methods, such airplane measurements of humidity.
The monsoon did not officially begin in Arizona during my time at the operations center. It was interesting, however, to watch the northward march of precipitation through Mexico. As the moisture moved farther north, each of the forecasters ventured an estimate of the official monsoon onset in southeastern Arizona. I wish I could say that I chose July 8, but my prediction of July 11 was too pessimistic by three days. Perhaps I fell into the all-too-common trap for meteorologists—relying too heavily on computer models and not paying enough attention to what was actually occurring. This experience was a good reminder that even when I think I know what is going to happen with the weather, Mother Nature can sometimes toss a curve ball at me.
The experience with NAME was quite enjoyable and educational. In addition to increasing my knowledge of the monsoon and testing my forecasting abilities, I collaborated with talented meteorologists and rubbed shoulders with some of the big names in monsoon research. It was fascinating to gather knowledge from them and at the same time realize that despite their years and decades of experi-ence, they, too, are still learning.
Rick Brandt, a graduate student on the CLIMAS project, monitors monthly climate data and regularly contributes to the Southwest Climate Outlook.
Diary of a Monsoon Forecaster
Rick Brandt in the NAME Forecast Operations Center.

Southwest Climate Outlook, July 2004
4 | Feature Article
within a larger context so that they can better predict future seasons using glob-al atmospheric circulation patterns and sea surface temperatures as a guide.
Previous research by Higgins and oth-ers, published in the Journal of Climate between 1997 and 2001, identified sev-eral important factors that can influence monsoon onset and intensity, including: 1) Monsoons that arrive early tend to stay longer and produce more rainfall. 2) There was a tendency for summer rainfall to be higher than average during years when it was lower than average in the U.S. Great Plains and vice-versa. 3) Above-average summer rainfall tends to follow below-average winter precipi-tation here as well as above-average pre-cipitation in the Pacific Northwest.
The first finding was supported by a paper published earlier this year by Ellis and colleagues in the International Jour-nal of Climatology. Their analysis of the monsoon seasons from 1950 through 2001 indicated that season length basi-cally defines whether it’s a relatively wet or dry season.
Using Phoenix as a case study, they found that, on average, a wet season lasts from about June 25 through Oct. 1, while a dry season runs from about July 12 through Sept. 1. Interestingly, the fraction of “monsoon days,” defined by moisture in the air as well as rainfall events, remained consistent at about two-thirds within either type of season.
The third finding by Higgins and his colleagues hints at an El Niño connec-tion, because the Southwest and Pacific Northwest tend to respond in opposite ways to El Niño. However, correlation of monsoon strength with El Niño is very weak in the southwestern United States, researchers agree. El Niño is identified by year-to-year fluctuations in sea surface temperature (SST) in the tropical Pacific. Higgins
and others are also considering how SST changes in the northern Pacific, north-ern Atlantic, and Gulf of California re-late to southwestern summer rainfall.
“The importance of the relationship between long period fluctuations in the North Pacific SST and variability in the Arizona-New Mexico monsoon cannot be overemphasized, since understanding it potentially could lead to improved prediction of abnormal weather over spells of years,” Higgins stated in a 2000 paper he co-wrote.
Sea surface temperatures in the Gulf of California also influence the monsoon, as Cortez pointed out. A team of re-searchers led by David Mitchell of the Desert Research Institute in Nevada re-ported in 2002 in the Journal of Climate that monsoonal rains begin in some regions only after an SST threshold is reached in specific parts of the Gulf of California, the dominant source of monsoonal moisture.
Meanwhile, other researchers have found correlations between monsoon strength and snow levels. Once Himala-yan Mountain snowpack was identified as a factor influencing the strength of the Asian monsoon, researchers began to explore how the North American monsoon relates to snowpack.
Winters with abundant snowfall near the monsoon region can dampen the land-heating that pulls in monsoonal winds, researchers hypothesized. A monsoon system is defined by the shift in wind direction that occurs when average land temperatures surpass sea temperatures long enough to draw in moisture-laden winds from the sea.
David Gutzler of the University of New Mexico found that low April 1 snow-pack tended to correlate with strong monsoon seasons in the southwestern United States. However, the relation-ship is weaker for Arizona than it is for
New Mexico, he reported in 2000 in the Journal of Climate, and is inconsistent within the full time frame he examined.
Similarly, research led by Timothy Hawkins of Arizona State University and colleagues found summer snow cover in the northwestern United States appeared linked to monsoon strength in the Southwest in their 2002 Journal of Climate paper. Again, less snow often meant more monsoon rainfall.
Incidentally, both southwestern and northwestern snowpack fell below- average this past winter, a situation which helps fuel hopes for a strong monsoon season in the Southwest. “Snowpack in the Rockies seems to play an important role in rainfall in Arizona and New Mexico. But it looks to me like snowpack in the Rockies is not an important issue for Mexico,” Cortez noted. “In my opinion, soil moisture and vegetation play an important role.”
In northwestern Mexico, lower soil moisture correlates with a weaker mon-soon season, Cortez said. This indicates that other factors besides land heating are at play, and further illustrates the challenge in untangling different influ-ences on monsoon strength.
Every year, it seems, researchers find interesting new correlations between monsoon strength and timing and other factors. Perhaps in the years to come, the NAME project will provide insights that allow researchers to relate their findings to physical mechanisms and use their understanding to improve forecasts for summer precipitation. If that hap-pens, Southwesterners may be able to prepare better for the anticipated annual visit from their eccentric old friend, the North American monsoon.
Melanie Lenart is a postdoctoral re-search associate with the Climate As-sessment for the Southwest.
NAME, continued

Southwest Climate Outlook, July 2004
5 | Recent Conditions
Temperature (through 7/15/04)Sources: Western Regional Climate Center, High Plains Regional Climate Center
The past 10 months have shown above-average temperatures over most of the Southwest (Figure 1a). The warmest loca-tions were along the Colorado River and in southwestern Arizona, with the coolest temperatures in the north-central portions of both Arizona and New Mexico (Figure 1b). The cooler temperatures in the central and western mountains of New Mexico and the Mogollon Rim are evident in Figure 1b. June 16–July 15 had near average temperatures for virtually the entire region, as most locations were within two degrees Fahrenheit of their averages (Figures 1c and 1d). The larg-est departures (4–6 degrees below average) were in western Yavapai County in northwestern Arizona and southwestern Navajo County in east-central Arizona. North-central Co-conino County in Arizona had the warmest temperatures during the period (4–6 degrees above average). Statistics for Tucson and Albuquerque support the figures. The Tucson National Weather Service reported an average June tem-perature of 84.8 degrees F, which is only 0.7 degrees above average and the coolest in five years. At Albuquerque, New Mexico, the average temperature was 75.1 degrees F, 0.3 de-grees above average (Albuquerque National Weather Service). Neither location experienced any record maximum or mini-mum temperatures.
Notes:The water year begins on October 1 and ends on September 30 of the following year. Water year is more commonly used in association with precipitation; water year temperature can be used to measure the tem-peratures associated with the hydrological activity during the water year.
Average refers to the arithmetic mean of annual data from 1971–2000. Departure from average temperature is calculated by subtracting current data from the average. The result can be positive or negative.
The continuous color maps (Figures 1a, 1b, 1c) are derived by taking measurements at individual meteorological stations and mathemati-cally interpolating (estimating) values between known data points. The dots in Figure 1d show data values for individual stations. Interpolation procedures can cause aberrant values in data-sparse regions.
Figures 1c and 1d are experimental products from the High Plains Regional Climate Center.
On the Web:For these and other temperature maps, visit: http://www.wrcc.dri.edu/recent_climate.html and http://www.hprcc.unl.edu/products/current.html
For information on temperature and precipitation trends, visit: http://www.cpc.ncep.noaa.gov/trndtext.htm
Figure 1a. Water year '03–'04 (through July 14, 2004) departure from average temperature.
Figure 1b. Water year '03–'04 (through July 14, 2004) average temperature.
Figure 1c. Previous 30 days (June 16–July 15, 2004) departure from average temperature (interpolated).
Figure 1d. Previous 30 days (June 16–July 15, 2004) departure from average temperature (data collection locations only).
˚F
-1
-3
543210
-2
-4-5
˚F
8075706560555045403530
˚F
6420-2
-6-4
˚F
6420
-2
-6-4

Southwest Climate Outlook, July 2004
6 | Recent Conditions
Precipitation (through 7/15/04)Source: High Plains Regional Climate Center
Precipitation remains below average for much of Arizona during the water year (Figure 2a and 2b). Conditions in New Mexico appear better than Arizona, but about one-third of the state remains at 70 percent or less of average precipita-tion. Eastern New Mexico has seen the most improvement, as that region experienced above-average precipitation during June thanks to a series of cold fronts, according to the Albu-querque National Weather Service (NWS). This is reflected in Figures 2c and 2d, especially in the northeastern plains. Until June 22, when Albuquerque received 0.01 inch of rain, the city had 72 consecutive days without measurable precipitation, the fifth longest period on record (KOBTV, Albuquerque, June 23, 2004). Southeastern and western Arizona were very dry during the past 30 days. The Tucson NWS recorded only a trace of precipitation during June and is currently more than 0.75 inches behind the average July amount. The patterns in both states are a dramatic improve-ment over the 30-day period from May 18–June 16 (not shown), when most of the Southwest received less than 25 percent of average precipitation. With the official arrival of the monsoon (July 8 in Tucson and July 12 in Phoenix), the prospect of precipitation is greater. The scattered thunder-storms typical of this period mean that some locations may receive significant precipitation, while others see very little.
Notes:The water year begins on October 1 and ends on September 30 of the following year. As of October 1, 2003 we are in the 2004 water year. The water year is a more hydrologically sound measure of climate and hydro-logical activity than is the standard calendar year.
Average refers to the arithmetic mean of annual data from 1971–2000. Percent of average precipitation is calculated by taking the ratio of cur-rent to average precipitation and multiplying by 100.
The continuous color maps (Figures 2a, 2c) are derived by taking mea-surements at individual meteorological stations and mathematically interpolating (estimating) values between known data points.Interpolation procedures can cause aberrant values in data-sparse regions.
The dots in Figures 2b and 2d show data values for individual meteoro-logical stations.
On the Web:For these and other precipitation maps, visit: http://www.hprcc.unl.edu/products/current.html
For National Climatic Data Center monthly precipitation and drought reports for Arizona, New Mexico, and the Southwest region, visit: http://lwf.ncdc.noaa.gov/oa/climate/research/2003/perspectives.html#monthly
Figure 2a. Water year '03–'04 through July 15, 2004 percent of average precipitation (interpolated).
Figure 2b. Water year '03–'04 through July 15, 2004 percent of average precipitation (data collection locations only).
Figure 2c. Previous 30 days (June 16–July 15, 2004) percent of average precipitation (interpolated).
Figure 2d. Previous 30 days (June 16–July 15, 2004) percent of average precipitation (data collection locations only).
1751501301201101009080705025
%
%
30020015013011010090705025
5
%
30020015013011010090705025
5
%
1751501301201101009080705025

Southwest Climate Outlook, July 2004
7 | Recent Conditions
U.S. Drought Monitor (released 7/15/04)Sources: U.S. Department of Agriculture, National Drought Mitigation Center, National Oceanic and Atmospheric Administration
The drought conditions in the western United States re-mained similar to last month as of July 17 (Figure 3). The only noticeable changes in the Southwest were in New Mexico, where drought severity increased in the central and extreme northern areas, and the severity weakened in the east. These data follow well with the Albuquerque National Weather Service reports of above-average precipitation in eastern New Mexico. With the monsoon now affecting the region, the prospect of slight improvement is present, but a few months of thunderstorms will not compensate for the previous five-plus years of drought. Arizona farmers are some of the hardest-hit by the drought with some turning to crops that require less water, and others selling their land to
Notes:The U.S. Drought Monitor is released weekly (every Thursday) and repre-sents data collected through the previous Tuesday. The inset (lower left) shows the western United States from the previous month’s map.
The U.S. Drought Monitor maps are based on expert assessment of variables including (but not limited to) the Palmer Drought Severity Index, soil moisture, streamflow, precipitation, and measures of vegeta-tion stress, as well as reports of drought impacts. It is a joint effort of the several agencies; the author of this monitor is Mark Svoboda from the National Drought Mitigation Center.
On the Web:The best way to monitor drought trends is to pay a weekly visit to the U.S. Drought Monitor website: http://www.drought.unl.edu/dm/monitor.html
developers (Los Angeles Times, July 4, 2004). Increased water restrictions, lower water delivery from the Salt River Project (allocations were cut by 33 percent for the second straight year), and resultant increased production costs for farmers have led to higher crop prices. This has resulted in more con-sumers purchasing foreign produce. In the same article, Gary Nabhan of Northern Arizona University warned that produc-tivity after the drought may never reach pre-drought levels.
Figure 3. Drought Monitor released July 15, 2004 (full size) and June 17, 2004 (inset, lower left).
Drought Impact Types
Delineates Dominant Impacts
A = Agricultural (crops, pastures, grasslands)
H = Hydrological (water)
AH = Agricultural and HydrologicalD3 Extreme Drought
D4 Exceptional
Drought Intensity
D0 Abnormally Dry
D1 Moderate Drought
D2 Severe Drought

Southwest Climate Outlook, July 2004
8 | Recent Conditions
New Mexico Drought Status (through 6/16/04)Source: New Mexico Natural Resources Conservation Service
News about the dry conditions in the state and resultant water shortages continues. The El Paso Times (June 27, 2004) reports low water levels at Elephant Butte Reservoir may mean that only about 38 percent of the water normally al-located to water users will be available this year. Elsewhere, the state engineer’s office issued a proposal in which the office could distribute water to senior water users before junior us-ers received their supply during dry periods (U.S. Water News Online, July 2004). Senior water users are those entities that have held water rights for the longest period. A study being performed by Christopher Duffy of the Pennsylvania State University suggests that water from melting mountain snow pack could take several decades to reach valleys when it trav-els underground (Associated Press, July 6, 2004), which means that the 1950s drought and the current dry conditions could both be contributing to the depleted water levels in valley aquifers in New Mexico and elsewhere. Low precipitation amounts in the central New Mexico are causing disagree-ments about water rights between residents and state officials. Due to low water levels and slow recharge in Bonito Lake the amount of water being released to areas south of the reservoir has been reduced (Ruidoso News, July 13, 2004). The Albu-querque National Weather Service forecast office reports that recent rainfall in eastern New Mexico has led to improve-ment in range and pasture lands there. However, only 23 per-cent of the range and pasture land in the state is rated good or excellent.
Notes:The New Mexico drought status maps are produced monthly by the New Mexico Drought Monitoring Workgroup. When near-normal condi-tions exist, they are updated quarterly. The maps are based on expert assessment of variables including, but not limited to, precipitation, drought indices, reservoir levels, and streamflow.
The figures have not been updated since last month’s packet. Figure 4a shows short-term or meteorological drought conditions. Meteorologi-cal drought is defined usually on the basis of the degree of dryness (in comparison to some “normal” or average amount) over a relatively short duration (e.g., months). Figure 4b refers to long-term drought, some-times known as hydrological drought. Hydrological drought is associated with the effects of relatively long periods of precipitation shortfalls (e.g., many months to years) on water supplies (i.e., streamflow, reservoir, and lake levels, groundwater). This map is organized by river basins—the white regions are areas where no major river system is found.
On the Web:For the most current New Mexico drought status map, visit:http://www.nm.nrcs.usda.gov/snow/drought/drought.html
Information on Arizona drought can be found at: http://www.water.az.gov/gdtf/
Normal
Advisory
Alert
Emergency
Warning
Figure 4a. Short-term drought map based on meteorological conditions as of June 16, 2004.
Note: Map is delineated byclimate divisions (bold) andcounty lines.
Not Update
d
Figure 4b. Long-term drought map based on hydrological conditions as of June 16, 2004.
Normal
Advisory
Alert
Emergency
Warning
Note: Map is delineated byriver basins (bold) andcounty lines.
Not Update
d

Legend
5
Gila River
Little
Colorado
River
Colorado
River
VerdeRiver
Salt River
Figure 5. Arizona reservoir levels for June 2004 as a percent of capacity, the map also depicts the average level and last year's storage for each reservoir, while the table also lists current and maximum storage levels.
1
7
6
Reservoir Average
0%
100%
50%Current Level
Last Year's Level
3
4
8
9
2
Reservoir Name1. Lake Powell2. Lake Mead3. Lake Mohave4. Lake Havasu5. Show Low Lake6. Lyman Reservoir7. San Carlos8. Verde River System9. Salt River System
43% 10,476.0 24322.0 54% 14,042.0 26159.0 94% 1,696.2 1810.0 94% 583.1 619.0 53% 2.7 5.1 14% 4.2 30.0 2% 21.3 875.0 43% 122.6 287.4 45% 903.9 2025.8
Capacity Level Current Storage Max Storage
size of cups is representational of reservoir
size, but not to scale
Southwest Climate Outlook, July 2004
9 | Recent Conditions
Arizona Reservoir Levels(through 6/30/04)Source: National Water and Climate Center
Storage in Arizona reservoirs either remained steady or de-creased at all nine locations in Figure 5. Lakes Mohave and Havasu, which are maintained to meet irrigation and potable water delivery obligations in Arizona and California, are both near 95 percent capacity. The greatest decrease in capacity (6 percent) occurred at Show Low Lake and Lyman Reservoir, both at the headwaters of the Little Colorado River. San Carlos Lake, already exceedingly low, dropped 1 percent. The San Carlos Apache tribal council recently requested that a minimum storage level be set for the lake (Arizona Silver Belt, June 23, 2004). The tribe attributed the low levels to exces-sive upstream pumping of water, drought conditions, and no established minimum pool. A subsequent study by the U.S. Bureau of Reclamation and the U.S. Fish and Wildlife Service proposed a minimum storage of 75,000 acre-feet, or about 8.5 percent of capacity.
While the storage in Lake Powell actually increased slightly from May to June, the low level of the reservoir is causing trouble for hydroelectric power generation in Arizona and Colorado (Denver Post, July 6, 2004). Pressure caused by wa-ter entering the turbines at Glen Canyon Dam has dropped, leading to a 30 percent decrease in power generation capacity.
Notes:The map gives a representation of current storage levels for reservoirs in Arizona. Reservoir locations are numbered within the blue circles on the map, corresponding to the reservoirs listed in the table. The cup next to each reservoir shows the current storage level (blue fill) as a percent of total capacity. Note that while the size of each cup varies with the size of the reservoir, these are representational and not to scale. Each cup also represents last year’s storage level (red line) and the 1971–2000 reservoir average (dotted line).
The table details more exactly the current capacity level (listed as a percent of maximum storage). Current and maximum storage levels are given in thousands of acre-feet for each reservoir.
These data are based on reservoir reports updated monthly by the Na-tional Water and Climate Center of the U.S. Department of Agriculture’s Natural Resource Conservation Service. For additional information, con-tact Tom Pagano at the National Water Climate Center ([email protected]; 503-414-3010) or Larry Martinez, Natural Resource Conser-vation Service, 3003 N. Central Ave, Suite 800, Phoenix, Arizona 85012-2945; 602-280-8841; [email protected]).
On the Web:Portions of the information provided in this figure can be accessed at the NRCS website: http://www.wcc.nrcs.usda.gov/wsf/reservoir/resv_rpt.html
Lake Mead also had a decrease in storage. The Las Vegas Sun (June 25, 2004) reported that approximately 33 percent more water is being removed from the reservoir than is entering it. In addition, the elevation of the lake has dropped 95 feet in the past four years. States in the Colorado River Basin are cur-rently working on water management and conservation plans that will be submitted to the Interior Department, according to the Sun.

Legend
Reservoir Average
0%
100%
50%Current Level
Last Year's Level
Gila
San Juan River
Canadian
River
Rio
Grand
eRiver
PecosRiver
60% 1025.3 1,696.0 30% 120.1 400.0 53% 98.9 186.3 23% 130.1 554.5 10% 50.3 502.3 11% 228.3 2,065.0 15% 48.8 331.5 13% 18.5 147.5 28% 1.7 6.0 26% 26.5 102.0 11% 47.1 447.0 49% 7.9 16.0 34% 86.3 254.0
Capacity Level Current Storage Max StorageReservoir Name1. Navajo2. Heron3. El Vado4. Abiquiu5. Cochiti6. Elephant Butte7. Caballo8. Brantley9. Lake Avalon10. Sumner11. Santa Rosa12. Costilla13. Conchas
5
7
10
11
8
12
3
4
13
12
9
6
Figure 6. New Mexico reservoir levels for June 2004 as a percent of capacity, the map also depicts the average level and last year's storage for each reservoir, while the table also lists current and maximum storage levels.
size of cups is representational of reservoir
size, but not to scale
Southwest Climate Outlook, July 2004
10 | Recent Conditions
New Mexico Reservoir Levels(through 6/30/04)Source: National Water and Climate Center
Many New Mexico reservoirs remained well below capacity through June. Despite the low levels, the Natural Resources Conservation Service reports that most reservoirs are at or above last year’s storage. Those that are lower than last year are mainly along the Rio Grande. Costilla, El Vado, and Navajo lakes have the highest capacities, ranging from 49 to 60 per-cent. The rest of the reservoirs are below 35 percent capacity.
Six of the thirteen reservoirs shown in Figure 6 had increased storage in the past month with the greatest improvements at Sumner Lake (21 percent) and Conchas Lake (25 percent) in the east-central portion of the state. According to New Mexico State Parks, Sumner Lake was closed to all boating on June 21 and remains closed as of July 16, despite the dramatic increase. Costilla Reservoir in northeastern New Mexico ex-perienced the largest drop at 16 percent. The June weather highlights, issued by the Albuquerque National Weather Service, indicates that precipitation in the state was generally above average in eastern New Mexico, especially in the north-east, while the western portion of the state was mainly drier than average for the month. Except for the large decrease at Costilla Reservoir, the changes in capacities since May reflect this trend.
Notes:The map gives a representation of current storage levels for reservoirs in New Mexico. Reservoir locations are numbered within the blue circles on the map, corresponding to the reservoirs listed in the table. The cup next to each reservoir shows the current storage level (blue fill) as a percent of total capacity. Note that while the size of each cup varies with the size of the reservoir, these are representational and not to scale. Each cup also represents last year’s storage level (red line) and the 1971–2000 reservoir average (dotted line).
The table details more exactly the current capacity level (listed as a percent of maximum storage). Current and maximum storage levels are given in thousands of acre-feet for each reservoir.
These data are based on reservoir reports updated monthly by the Na-tional Water and Climate Center of the U.S. Department of Agriculture’s Natural Resource Conservation Service. For additional information, con-tact Tom Pagano at the National Water Climate Center ([email protected]; 503-414-3010) or Dan Murray, NRCS, USDA, 6200 Jefferson NE, Albuquerque, NM 87109; 505-761-4436; [email protected]).
On the Web:Portions of the information provided in this figure can be accessed at the NRCS website: http://www.wcc.nrcs.usda.gov/wsf/reservoir/resv_rpt.html
June brought news of more water restrictions across the state. The Deming Headlight (June 22, 2004) reported that an ordi-nance requiring low-flow appliances in all new buildings went into effect. Along with above-normal rain in Clovis, New Mexico, residents gave Mother Nature a hand by reducing water use. Following a water shortage warning from the New Mexico American Water Company, residents decreased their water use by more than one million gallons over a four-day period in late June (Clovis News Journal, June 25, 2004).

Southwest Fire Summary(updated 7/15/04)Source: Southwest Coordination Center
Notes: The fires discussed here are “large” fires, defined as those covering 100 acres or more, which have been reported by federal, state, or tribal agen-cies during 2004. The figures include information both for current fires and for fires that have been suppressed. Figure 7a shows a table of year-to-date fire information for Arizona and New Mexico. Prescribed burns are not included in these numbers. Figure 7b indicates the approximate location of past and present fires, both wildfires and prescribed burns. The orange fire symbols indicate wildfires ignited by humans or light-ning. The green fire symbols are prescribed fires started by fire manage-ment officials. The name of each fire is provided next to the symbol.
On the Web:These data are obtained from the Southwest Area Wildland Fire Operations website:
http://www.fs.fed.us/r3/fire/swapredictive/swaintel/daily/ytd-daily-state.htmhttp://www.fs.fed.us/r3/fire/swapredictive/swaintel/daily/ytd-large-map.jpg
Figure 7b shows the locations of suppressed and current large fires in the Southwest as of July 15. In total, 1,492 fires have burned 211,666 acres in Arizona and 531 fires in New Mexico have burned 82,418 acres (Figure 7a). Average acres burned for the entire calendar year for the two states (since 1992) is 165,540 (Arizona) and 267,680 (New Mexico).
The Nutall fire received local, regional, and national media coverage, as it threatened the $130 million Mount Graham International Observatory and nearby communities. As of July 16, the fire (combined with the Gibson fire) had burned 29,400 acres, with costs upwards of $10 million.
Other fires that began in June include the Jacket fire southeast of Flagstaff, Arizona, which had burned 17,043 acres with a cost of $301,344 and the Willow fire southwest of Payson, Arizona, which burned 119,500 acres at a cost of $10,163,000 as of July 16. The Granny and Rincon fires north of Silver City, New Mexico, were ignited in late June and had burned 4842 acres and 2384 acres, respectively, as of July 7; the total firefighting cost for these fires is $25,000. The Military fire east of San Car-los, Arizona, began on July 6 and burned 231 acres as of July 9. The cost-to-date is $574,016. The Peppin Fire was contained on June 25 after burning 65,000 acres near Ruidoso, New Mexico; it started on May 10.
Southwest Climate Outlook, July 2004
11 | Recent Conditions
LocationHuman Caused
Fires
Human caused
acres
Lightning caused fires
Lightning caused
acres Total Fires Total Acres
Arizona 1,001 43,355 491 168,311 1,492 211,666
New Mexico 245 16,875 286 65,543 531 82,418
Total 1,246 60,230 777 233,854 2,023 294,084
Figure 7a. Year-to-date fire information for Arizona and New Mexico as of July 15, 2004.
Figure 7b. Year-to-date wildland fire location. Map depicts large fire of greater than 100 acres burned as of July 15, 2004.
Wildland Fire
Prescribed Burns

Monsoon Summary (through 7/14/04)
Source: Western Regional Climate Center
The 2004 summer monsoon season officially began in Tucson on July 8, and in Phoenix on July 12. The onset of the mon-soon was five days later than average in both locations. Stud-ies by leading monsoon researchers at the NOAA Climate Prediction Center show that late monsoons are often drier than average. Much of the Southwest has received little mois-ture during the first two weeks of July, except for extreme southern Arizona and parts of northeastern New Mexico, where 1.75 to 2 inches of rain has fallen (Figure 8a). To date, July precipitation (a rough proxy for monsoon precipita-tion) has been below-average throughout Arizona and most of New Mexico (Figures 8b and 8c). The regions where July precipitation has been most below-average include southeast-ern Arizona and southwestern, central and parts of eastern New Mexico. This is not surprising, as these are areas that receive more than half of their annual precipitation during the summer; thus a lack of early monsoon season precipita-tion is noticeable in these areas. Monsoon precipitation has been accumulating steadily across southern and southwest-ern Mexico since at least mid-June (not shown), with some bursts of activity in northeastern Mexico in late June and up the Sierra Madre Occidental of Mexico in late June and since around July 5. Rainfall during the weekend of July 16–18 (after Southwest Climate Outlook production began) may have boosted monsoon precipitation totals, especially in parts of Arizona.
Notes:Average refers to the arithmetic mean of annual data from 1971–2000. Percent of average precipitation is calculated by taking the ratio of cur-rent to average precipitation and multiplying by 100. Departure from average precipitation is calculated by subtracting the average from the current precipitation.
The continuous color maps (Figures 8a-8c) are derived by taking mea-surements at individual meteorological stations and mathematically interpolating (estimating) values between known data points. Interpola-tion procedures can cause aberrant values in data-sparse regions.The data used to create these maps is provisional and have not yet been subjected to rigorous quality control.
Figure 8a. Total precipitation in inches July 1– July 14, 2004 .
Figure 8b. Departure from average precipitation in inches July 1–July 14, 2004.
Figure 8c. July 1–July 14, 2004 percent of average precipitation (interpolated).
6.255.504.754.003.252.501.751.000.500.250.10
in.
3.753.002.251.500.70
0-0.75-1.50-2.25-3.00-3.75
in.
80040020015012510075502552
%
Southwest Climate Outlook, July 2004
12 | Recent Conditions

Southwest Climate Outlook, July 2004
13 | Forecasts
Temperature Outlook (August 2004–January 2005)Source: NOAA Climate Prediction Center
The NOAA-CPC temperature outlook for August–October indicates increased chances of above-average temperatures for much of the western United States, with the greatest chances in Arizona, and below-average temperatures in the northern Great Plains (Figure 9a). The September–November and October–December periods (Figures 9b and 9c) are similar and show increased chances of above-average temperatures from east-central California and central Nevada into south-western New Mexico. The outlook for November–January (Figure 9d) continues the increased chances for above-average temperatures in the Southwest and extends it northward and eastward. Temperature forecasts from the International Re-search Institute for Climate Prediction (not shown) are nearly identical for the entire range of forecast periods. The CPC forecast is based primarily on long-term temperature trends, and indications from statistical forecast tools.
Notes:These outlooks predict the likelihood (chance) of above-average, average, and below-average temperature, but not the magnitude of such varia-tion. The numbers on the maps do not refer to degrees of temperature.
The NOAA-CPC outlooks are a 3-category forecast. As a starting point, the 1971–2000 climate record is divided into 3 categories, each with a 33.3 percent chance of occurring (i.e., equal chances, EC). The forecast indicates the likelihood of one of the extremes—above-average (A) or below-average (B)—with a corresponding adjustment to the other extreme category; the “average” category is preserved at 33.3 likelihood, unless the forecast is very strong.
Thus, using the NOAA-CPC temperature outlook, areas with light brown shading display a 33.3–39.9 percent chance of above-average, a 33.3 percent chance of average, and a 26.7–33.3 percent chance of below- average temperature. A shade darker brown indicates a 40.0–50.0 per-cent chance of above-average, a 33.3 percent chance of average, and a 16.7–26.6 percent chance of below-average temperature, and so on.
Equal Chances (EC) indicates areas where the reliability (i.e., ‘skill’) of the forecast is poor; areas labeled EC suggest an equal likelihood of above-average, average, and below-average conditions, as a “default option” when forecast skill is poor.
On the Web:For more information on CPC forecasts, visit: http://www.cpc.ncep.noaa.gov/products/predictions/multi_season/13_seasonal_outlooks/color/churchill.html(note that this website has many graphics and may load slowly on your computer)
For IRI forecasts, visit: http://iri.columbia.edu/climate/forecast/net_asmt/
Figure 9a. Long-lead national temperature forecast for August–October 2004.
Figure 9b. Long-lead national temperature forecast for September–November 2004.
Figure 9d. Long-lead national temperature forecast for November 2004–January 2005.
Figure 9c. Long-lead national temperature forecast for October–December 2004.
EC= Equal chances. No forecasted anomalies.
A= Above50.0–59.9%40.0–49.9%33.3–39.9%
>60.0%
B= Below33.3–39.9%40.0–49.9%

Southwest Climate Outlook, July 2004
14 | Forecasts
Precipitation Outlook (August 2004–January 2005)Source: NOAA Climate Prediction Center
Notes:These outlooks predict the likelihood (chance) of above-average, average, and below-average precipitation, but not the magnitude of such varia-tion. The numbers on the maps do not refer to inches of precipitation.
The NOAA-CPC outlooks are a 3-category forecast. As a starting point, the 1971–2000 climate record is divided into 3 categories, each with a 33.3 percent chance of occurring (i.e., equal chances, EC). The forecast indicates the likelihood of one of the extremes—above-average (A) or below-average (B)—with a corresponding adjustment to the other extreme category; the “average” category is preserved at 33.3 likelihood, unless the forecast is very strong.
Thus, using the NOAA-CPC precipitation outlook, areas with light green shading display a 33.3–39.9 percent chance of above-average, a 33.3 percent chance of average, and a 26.7–33.3 percent chance of below- average precipitation. A shade darker green indicates a 40.0–50.0 per-cent chance of above-average, a 33.3 percent chance of average, and a 16.7–26.6 percent chance of below-average precipitation, and so on.
Equal Chances (EC) indicates areas where the reliability (i.e., ‘skill’) of the forecast is poor; areas labeled EC suggest an equal likelihood of above-average, average, and below-average conditions, as a “default option” when forecast skill is poor.
On the Web:For more information on CPC forecasts, visit: http://www.cpc.ncep.noaa.gov/products/predictions/multi_season/13_seasonal_outlooks/color/churchill.html(note that this website has many graphics and may load slowly on your computer)
For IRI forecasts, visit: http://iri.columbia.edu/climate/forecast/net_asmt/
40.0–49.9%33.3–39.9%
A= Above
33.3–39.9%40.0–49.9%
B= Below
EC= Equal chances. No forecasted anomalies.
Figure 10a. Long-lead national precipitation forecast for August–October 2004.
Figure 10b. Long-lead national precipitation forecast for September–November 2004.
Figure 10d. Long-lead national precipitation forecast for November 2004–January 2005.
Figure 10c. Long-lead national precipitation forecast for October–December 2004.
The NOAA-CPC precipitation outlook withholds judgment for virtually the entire Southwest for August–January. The exception is extreme northwestern Arizona, where a slightly increased chance of below-average precipitation is forecast from August–October. The International Research Institute for Climate Prediction (IRI) forecasts a similar scenario (not shown), but extends the forecast for below-average precipita-tion over much of Arizona. This time frame contains a por-tion of the monsoon, which ends in mid-September on aver-age. Although much of Arizona received near or above-aver-age precipitation from April–June (Figure 14b), moderate to extreme drought still covers most of the state (see Figure 3). The increased chances of below-average precipitation could exacerbate drought conditions if they occur. CPC forecasters note that ENSO conditions are currently below the threshold required to produce significant impacts on U.S. climate.

Southwest Climate Outlook, July 2004
15 | Forecasts
Seasonal Drought Outlook(through October 2004)Sources: NOAA Climate Prediction Center
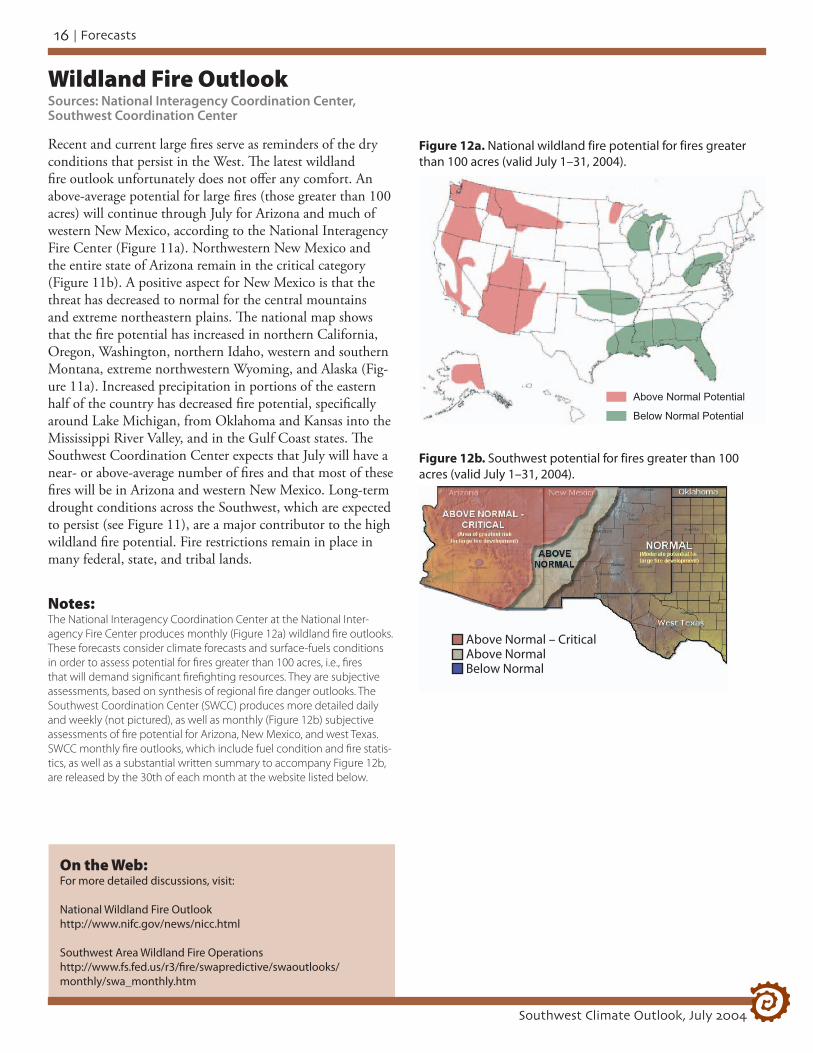
Current drought conditions are expected to persist through October for much of the Great Basin and Rocky Mountain states according to the Climate Prediction Center (Figure 11). Western and northern Arizona and southern California are also included in this category. These areas are forecast to have above-normal wildland fire potential through the end of July (Figure 12a and 12b). The seasonal drought outlook also predicts that the drought will be ongoing in New Mexico and much of the remainder of Arizona, but some improvements are possible. Other areas that may experience improvement are the western portions of the Great Plains. The sections of Arizona and New Mexico where minor improvements are possible are generally in regions where the water year (since October 1, 2003 through the most recent analysis on July 15) precipitation currently is near or above average. Tempera-tures in much of this region also have increased chances of being warmer than normal through October (see Figure 9a), which could lead to increased evaporation rates. No precipi-tation anomalies are expected for this period (see Figure 10a).
Notes:The delineated areas in the Seasonal Drought Outlook (Figure 11) are defined subjectively and are based on expert assessment of numerous indicators, including outputs of short- and long-term forecasting models.
On the Web:For more information, visit: http://www.drought.noaa.gov/
At a river briefing held earlier this month in Casa Grande, Jack Long of the Hohokam Irrigation and Drainage District told the attendees about current problems that have arisen due to the drought, such as higher demand for water from the Central Arizona Project and regional surface water short-ages (Coolidge Examiner, July 14, 2004). As municipalities increase water use, other locations are affected, because less water is available. Long warned of other potential drought effects—using groundwater to compensate for water short-ages and increased costs and lower availability of hydropower. Water restrictions in many Southwestern communities are aimed at reducing such possibilities. Although water short-age, hydropower, and other related issues might not seem evident, taking steps now can help avoid future problems if the drought worsens.
Figure 11. Seasonal drought outlook through October 2004 (release date July 15, 2004).
Drought to persist or intensify
Drought ongoing, some improvements
Drought likely to improve, impacts ease
Drought development likely
Wildland Fire OutlookSources: National Interagency Coordination Center, Southwest Coordination Center
Recent and current large fires serve as reminders of the dry conditions that persist in the West. The latest wildland fire outlook unfortunately does not offer any comfort. An above-average potential for large fires (those greater than 100 acres) will continue through July for Arizona and much of western New Mexico, according to the National Interagency Fire Center (Figure 11a). Northwestern New Mexico and the entire state of Arizona remain in the critical category (Figure 11b). A positive aspect for New Mexico is that the threat has decreased to normal for the central mountains and extreme northeastern plains. The national map shows that the fire potential has increased in northern California, Oregon, Washington, northern Idaho, western and southern Montana, extreme northwestern Wyoming, and Alaska (Fig-ure 11a). Increased precipitation in portions of the eastern half of the country has decreased fire potential, specifically around Lake Michigan, from Oklahoma and Kansas into the Mississippi River Valley, and in the Gulf Coast states. The Southwest Coordination Center expects that July will have a near- or above-average number of fires and that most of these fires will be in Arizona and western New Mexico. Long-term drought conditions across the Southwest, which are expected to persist (see Figure 11), are a major contributor to the high wildland fire potential. Fire restrictions remain in place in many federal, state, and tribal lands.
Notes:The National Interagency Coordination Center at the National Inter-agency Fire Center produces monthly (Figure 12a) wildland fire outlooks. These forecasts consider climate forecasts and surface-fuels conditions in order to assess potential for fires greater than 100 acres, i.e., fires that will demand significant firefighting resources. They are subjective assessments, based on synthesis of regional fire danger outlooks. The Southwest Coordination Center (SWCC) produces more detailed daily and weekly (not pictured), as well as monthly (Figure 12b) subjective assessments of fire potential for Arizona, New Mexico, and west Texas. SWCC monthly fire outlooks, which include fuel condition and fire statis-tics, as well as a substantial written summary to accompany Figure 12b, are released by the 30th of each month at the website listed below.
On the Web:For more detailed discussions, visit:
National Wildland Fire Outlookhttp://www.nifc.gov/news/nicc.html
Southwest Area Wildland Fire Operationshttp://www.fs.fed.us/r3/fire/swapredictive/swaoutlooks/ monthly/swa_monthly.htm
Above Normal Potential
Below Normal Potential
Figure 12a. National wildland fire potential for fires greater than 100 acres (valid July 1–31, 2004).
Figure 12b. Southwest potential for fires greater than 100 acres (valid July 1–31, 2004).
Above Normal – Critical
Below NormalAbove Normal
Southwest Climate Outlook, July 2004
16 | Forecasts

El Niño Status and ForecastSources: NOAA Climate Prediction Center, International Research Institute for Climate Prediction
Notes:Figure 13a shows the International Research Institute for Climate Predic-tion (IRI) probabilistic El Niño-Southern Oscillation (ENSO) forecast for overlapping three month seasons. The forecast expresses the probabili-ties (chances) of the occurrence of three ocean conditions in the ENSO-sensitive Niño 3.4 region, as follows: El Niño, defined as the warmest 25 percent of Niño 3.4 sea-surface temperatures (SSTs) during the three month period in question; La Niña conditions, the coolest 25 percent of Niño 3.4 SSTs; and neutral conditions where SSTs fall within the remain-ing 50 percent of observations. The IRI probabilistic ENSO forecast is a subjective assessment of current model forecasts of Niño 3.4 SSTs that are made monthly. The forecast takes into account the indications of the individual forecast models (including expert knowledge of model skill), an average of the models, and other factors.
Figure 13b shows the standardized three month running average values of the Southern Oscillation Index (SOI) from January 1980 through April 2004. The SOI measures the atmospheric response to SST changes across the Pacific Ocean Basin. The SOI is strongly associated with climate effects in the Southwest. Values greater than 0.5 represent La Niña condi-tions, which are frequently associated with dry winters and sometimes with wet summers. Values less than -0.5 represent El Niño conditions, which are often associated with wet winters.
On the Web:For a technical discussion of current El Niño conditions, visit: http://www.cpc.ncep.noaa.gov/products/analysis_monitoring/enso_advisory/
For more information about El Niño and to access graphics simi-lar to the figures on this page, visit: http://iri.columbia.edu/climate/ENSO/
Figure 13b shows that near-neutral El Niño-Southern Oscil-lation (ENSO) conditions have persisted in the Niño 3.4 region for the at least the past nine months. Some features on the chart that stand out are the extremely strong El Niño events of 1982–1983, 1987–1988, 1992, and 1997–1998. Several strong La Niña episodes are also present in the recent record, specifically in the late 1980s and around the turn of the millennium. No apparent pattern exists in the data. In some cases a strong El Niño is followed by near-neutral con-ditions, such as after the 1982–1983 El Niño, while other instances show a strong La Niña followed a strong El Niño, e.g., after 1987–1988 and after 1997–1998.
The IRI forecast indicates that near-neutral conditions will continue for the remainder of the summer (Figure 13a). The potential for La Niña to develop are much below average historical probabilities of 25 percent well into next year. The chance for an El Niño to develop is increasing and exceeds the historical average beginning in the August through Octo-ber period, with the highest probabilities (40 percent) from
the October–December 2004 and February–April 2005 time frames. El Niño typically means a wet winter for the south-western United States. Relief from the dry conditions in the region could occur, but neutral ENSO conditions are still the most likely forecast. The NOAA-CPC believes that near-neutral conditions will continue for at least the next three months.
Figure 13a. IRI probabilistic ENSO forecast for El Niño 3.4 monitoring region (released July 15, 2004). Colored lines represent average historical probability of El Niño, La Niña, and neutral.
El NiñoNeutralLa Niña
April–June2005
July–Sept2004
Aug–Oct
Sept–Nov
Oct–Dec
Nov–Jan
Dec–Feb
Jan–March
Feb–Apr
Time Period
March– May
100
90
80
70
60
50
40
30
20
10
0
Pro
bab
ility
(%)
-4.0
-3.0
-2.0
-1.0
0.0
1.0
2.0
1980
1982
1984
1986
1988
1990
1992
1994
1996
1998
2000
2002
2004
Year
SOI V
alu
e
Figure 13b. The standardized values of the Southern Oscillation Index from January 1980–April 2004. La Niña/El Niño occurs when values are greater than 0.5 (blue) or less than -0.5 (red) respectively. Values between these thresholds are relatively neutral (green).
El Niño
La Niña
Southwest Climate Outlook, July 2004
17 | Forecasts

Temperature Verification(April–June 2004)Source: NOAA Climate Prediction Center
Notes:Figure 14a shows the NOAA Climate Prediction Center (CPC) tempera-ture outlook for the months April–June 2004. This forecast was made in March 2004.
The April–June 2004 NOAA CPC outlook predicts the likelihood (chance) of above-average, average, and below-average temperature, but not the magnitude of such variation. The numbers on the maps do not refer to degrees of temperature. Care should be exercised when comparing the forecast (probability) map with the observed temperature maps described below.
Using past climate as a guide to average conditions and dividing the past record into 3 categories, there is a 33.3 percent chance of above-average, a 33.3 percent chance of average, and a 33.3 percent chance of below-average temperature. Thus, using the NOAA CPC likelihood forecast, in areas with light brown shading there is a 33.3–39.9 percent chance of above-average, a 33.3 percent chance of average, and a 26.7–33.3 percent chance of below-average precipitation. Equal Chances (EC) indicates areas where reliability (i.e., the skill) of the forecast is poor and no prediction is offered.
Figure 14b shows the observed departure of temperature (°F) from the average for April–June 2004.
In all of the figures on this page, the term average refers to the 1971–2000 average. This practice is standard in the field of climatology.
On the Web:For more information on CPC forecasts, visit: http://www.cpc.ncep.noaa.gov/products/predictions/multi_season/13_seasonal_outlooks/color/churchill.html
Figure 14a. Long-lead U.S. temperature forecast for April–June 2004 (issued March 2004).
BEC
EC
EC
33.3–39.9%40.0–49.9%
B= Below
EC= Equal chances. No forecasted anomalies.
40.0–49.9%33.3–39.9%A= Above
EC
A
A
A
˚F
Figure 14b. Average temperature departure (in degrees F) for April–June 2004.
543210
-1-2-3-4-5
Except for the far northern Great Plains, the lower Rio Grande Valley, and some scattered pockets of below-average temperatures, the continental United States was warmer than average from April–June (Figure 14b). The highest values were in the West and from the central Atlantic Coast into the lower Ohio River Valley. The above-average tem-perature departures in the western states were well captured by the NOAA-CPC forecast (Figure 14a). The prediction for increased chances of above-average temperatures missed the mark in the lower Rio Grande Valley, where observed temperatures were several degrees below average. In general, the prediction for increased chances of below-average tem-peratures in the northern Great Plains was on target, but the forecast extended slightly farther south than what was actually observed. Moreover, the forecast did not predict the below-average temperatures in the western Great Lakes. The regions of cooler-than-average temperatures in west-central and east-central Arizona and west-central New Mexico were also missed. The coarse resolution of the forecasts precludes detecting these sub-regional areas.
Southwest Climate Outlook, July 2004
18 | Forecast Verification

Precipitation Verification(April–June 2004)Source: NOAA Climate Prediction Center
Extremely dry conditions dominated much of central Cali-fornia and western Nevada from April–June (Figure 15b). The northwestern Great Plains were drier than average. Re-gions that experienced much above-average precipitation dur-ing the period include portions of the western Great Lakes, the Ohio River Valley, and from southwestern California and Nevada to southern Mississippi. Southwestern Arizona reciprocation was more than 300 percent of the 1971–2000 average. This is not highly significant, because April–June is usually characterized by low precipitation totals. Otherwise, much of the nation experienced near-average precipitation. The CPC forecast for increased chances of above-average precipitation in the Pacific Northwest and northern Rocky Mountains was well placed (Figure 15a), despite some slightly below-average precipitation in western Washington. Much of Florida experienced below-average precipitation, as forecasted by CPC. From southern Colorado southeastward into extreme southern Mississippi and Alabama, where in-creased chances of below-average precipitation were predict-ed, wetter-than-average conditions were observed. The CPC April–June forecast reserved judgment for the remainder of the United States.
Notes:Figure 15a shows the NOAA Climate Prediction Center (CPC) precipita-tion outlook for the months April–June 2004. This forecast was made in March 2004.
The April–June 2004 NOAA CPC outlook predicts the likelihood (chance) of above-average, average, and below-average precipitation, but not the magnitude of such variation. The numbers on the maps do not refer to inches of precipitation. Care should be exercised when comparing the forecast (probability) map with the observed precipitation maps described below.
Using past climate as a guide to average conditions and dividing the past record into 3 categories, there is a 33.3 percent chance of above-average, a 33.3 percent chance of average, and a 33.3 percent chance of below-average precipitation. Thus, using the NOAA CPC likelihood forecast, in areas with light brown shading there is a 33.3–39.9 percent chance of above-average, a 33.3 percent chance of average, and a 26.7–33.3 percent chance of below-average precipitation. Equal Chances (EC) indicates areas where reliability (i.e., the skill) of the forecast is poor and no prediction is offered.
Figure 15b shows the observed percent of average precipitation ob-served April–June 2004.
In all of the figures on this page, the term average refers to the 1971–2000 average. This practice is standard in the field of climatology.
On the Web:For more information on CPC forecasts, visit: http://www.cpc.ncep.noaa.gov/products/predictions/multi_season/13_seasonal_outlooks/color/churchill.html
Figure 15b. Percent of average precipitation observed from April to June 2004.
%
800400200150125100
755025
52
33.3–39.9%40.0–49.9%
B= Below
EC= Equal chances. No forecasted anomalies.
ECEC
EC
B
B
AEC
A= Above 33%–40%> 40%
Figure 15a. Long-lead U.S. precipitation forecast for April–June 2004 (issued March 2004).
Southwest Climate Outlook, July 2004
19 | Forecast Verification

Monsoon ForecastSource: Andrew Ellis, Arizona State University
More Information:For future forecasts of the middle and end of the monsoon sea-son, contact Andrew Ellis, Arizona State University, 602-965-4263, [email protected].
Southwest Climate Outlook, July 2004
20 | Focus Pages
Figure 16b. Map of the greater U.S. monsoon region.
Figure 16a. Map of monson forecast “local region” (includes Phoenix area and Salt and Verde Riverwatersheds).
Notes:This is an experimental forecast, made monthly beginning in March. We present here the highly simplified results of a forecast using data through June 2004. Forecasts were constructed for two regions. The “lo-cal region,” shown in Figure 16a, includes Phoenix northward to the Salt and Verde River watersheds. This region is of special interest to Phoenix area decision makers, and the Salt River Project, which provides water to the greater Phoenix metro region. The greater U.S. monsoon region (Fig-ure 16b) was delineated using a statistical analysis of precipitation data, as described in a 2002 paper by Hawkins et al. in the Journal of Climate. The forecast season was divided into three 40-day periods, as follows: June 15–July 24, July 25–September 2, September 3–October 12.
For each region, monsoon season strength was modeled using statistical techniques (linear regression). Statistical equations (using predictors such as snow cover, sea surface temperatures, teleconnection indices) predicted a combination of variables that characterize humidity and precipitation for the forecast regions; these predicted variables were combined to create an index of monsoon strength. The statistical mod-els were constructed using data from 1973–2002.
Amounts of precipitation (Figure 16d), precipitation frequency, and other variables (not shown), were calculated from the predicted monsoon strength. Monsoon strength was also expressed qualitatively (Figure 16c).
The forecast for the greater U.S. monsoon region calls for a weak beginning, a strong mid-season, and a moderate end to the 2004 Southwest U.S. monsoon (Figure 16c). According to State Climatologist Andrew Ellis (Arizona State University), forecast skill should be best for the mid-season forecast; the end-of-season forecast is most difficult to predict. Regional average precipitation totals for the combined beginning and middle-season forecasts, which should be used as a rough guideline, predict slightly above-average total precipitation through early September. The beginning-of-season weak mon-soon forecast follows moderate monsoon forecasts made with data from earlier in the year (not shown); to date, this forecast is spot on. Forecasts for the middle and end seasons have been consistently for strong and moderate monsoon, respectively.
The forecast for the “local region” (see notes) calls for a mod-erate beginning, a strong mid-season, and a moderate end to the 2004 Southwest U.S. monsoon. Local region average precipitation totals for the combined beginning and middle-season forecasts, which should be used as a rough guideline, predict solidly above-average total precipitation through early September. Of note, the beginning-of-season moderate monsoon forecast for the local region follows two months of successive weak monsoon forecasts.
Time PeriodAverage Precipitation (Inches)
Local Region Greater U.S.
June 15–July 24 1.9 1.5
July 25–Sept 2 3.8 4.7
Sept 3–Oct 12 1.5 2.4
Time PeriodMonsoon Strength
Local Region Greater U.S.
June 15–July 24 Moderate Weak
July 25–Sept 2 Strong Strong
Sept 3–Oct 12 Moderate Moderate
Figure 16c. Forecasted monsoon strength for the Arizona “local region” and greater U.S. monsoon region.
Figure 16d. Average precipitation (inches) for the Arizona “local region” and greater U.S. monsoon region.