Embed Size (px)
Citation preview

STATE BUDGET OVERVIEW
Ellen Jeffries, Director SENATE FISCAL AGENCY
August 7, 2014
http://www.senate.michigan.gov/sfa/
The Economy and State Revenue
2
10 8 10 10 617 11 15
25
-1,764
-1,378
-2,216
-1,256
-2,164
-2,838
-1,626
-2,183
-8,736
Recession
1948-49 1953-54 1957-58 1960-61 1974-75 1981-82 1990-91 2001-02 2008-09
Consecutive Months of Declining Employment (Y1)
Decline in Wage & Salary Employment (Y2)
2008-09 Recession Longer and More Severe
Magnitude and Duration of Post-World War II Recessions
Source: Bureau of Labor Statistics, U.S. Department of Labor
Note: Only includes recessionswhere employment declined for six
consecutive months or more.
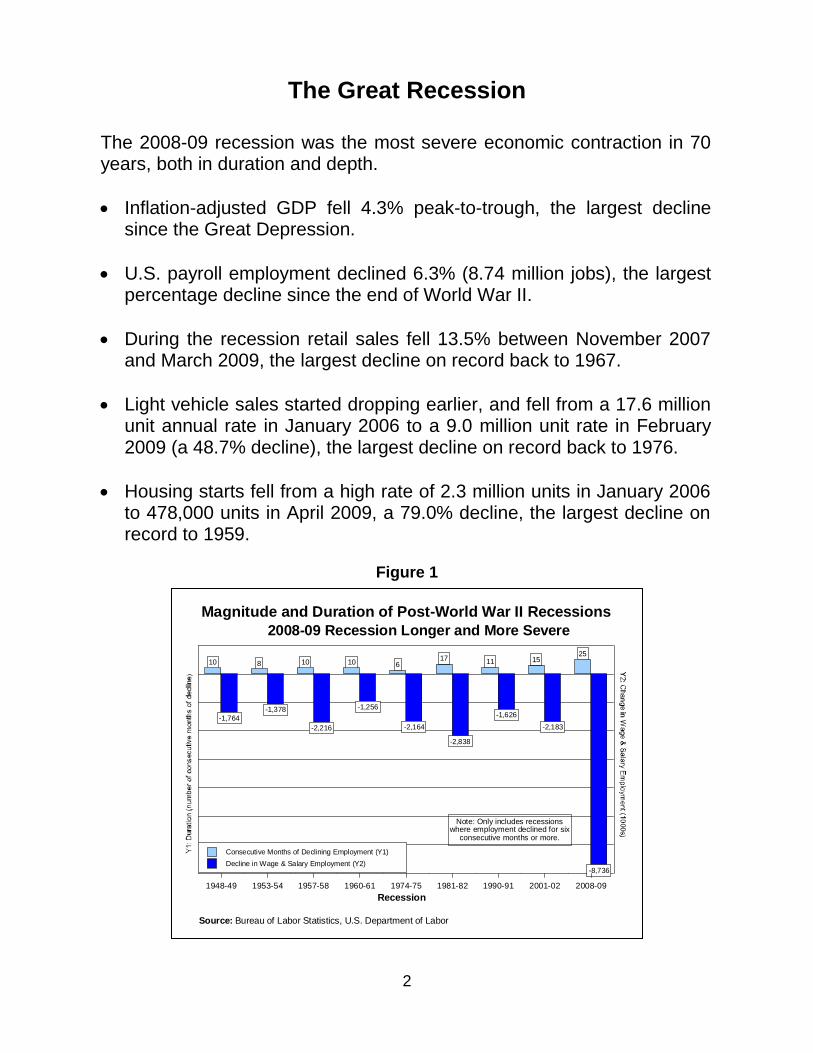
The Great Recession
The 2008-09 recession was the most severe economic contraction in 70 years, both in duration and depth.
Inflation-adjusted GDP fell 4.3% peak-to-trough, the largest decline since the Great Depression.
U.S. payroll employment declined 6.3% (8.74 million jobs), the largest percentage decline since the end of World War II.
During the recession retail sales fell 13.5% between November 2007 and March 2009, the largest decline on record back to 1967.
Light vehicle sales started dropping earlier, and fell from a 17.6 million unit annual rate in January 2006 to a 9.0 million unit rate in February 2009 (a 48.7% decline), the largest decline on record back to 1976.
Housing starts fell from a high rate of 2.3 million units in January 2006 to 478,000 units in April 2009, a 79.0% decline, the largest decline on record to 1959.
Figure 1
3
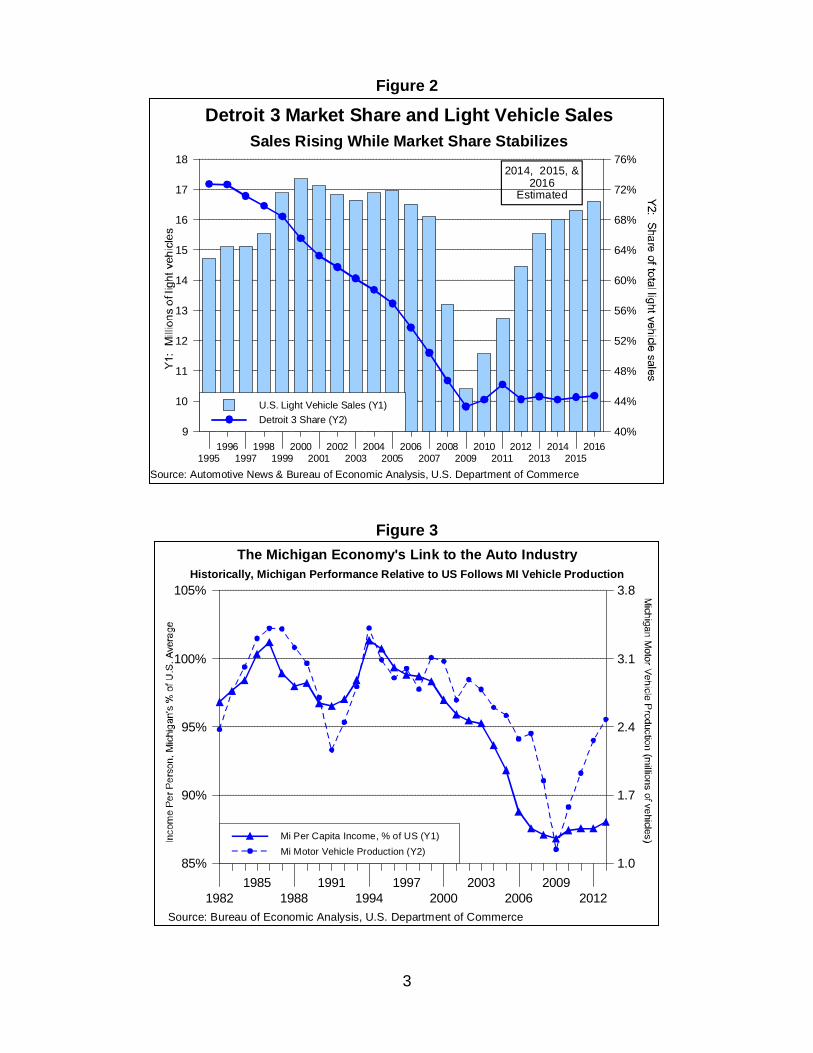
Figure 2
Figure 3
19951996
19971998
19992000
20012002
20032004
20052006
20072008
20092010
20112012
20132014
20152016
9
10
11
12
13
14
15
16
17
18
40%
44%
48%
52%
56%
60%
64%
68%
72%
76%
U.S. Light Vehicle Sales (Y1)
Detroit 3 Share (Y2)
Sales Rising While Market Share Stabilizes
Detroit 3 Market Share and Light Vehicle Sales
Source: Automotive News & Bureau of Economic Analysis, U.S. Department of Commerce
2014, 2015, &2016
Estimated
1982
1985
1988
1991
1994
1997
2000
2003
2006
2009
2012
85%
90%
95%
100%
105%
1.0
1.7
2.4
3.1
3.8
Mi Per Capita Income, % of US (Y1)
Mi Motor Vehicle Production (Y2)
Historically, Michigan Performance Relative to US Follows MI Vehicle Production
The Michigan Economy's Link to the Auto Industry
Source: Bureau of Economic Analysis, U.S. Department of Commerce
4
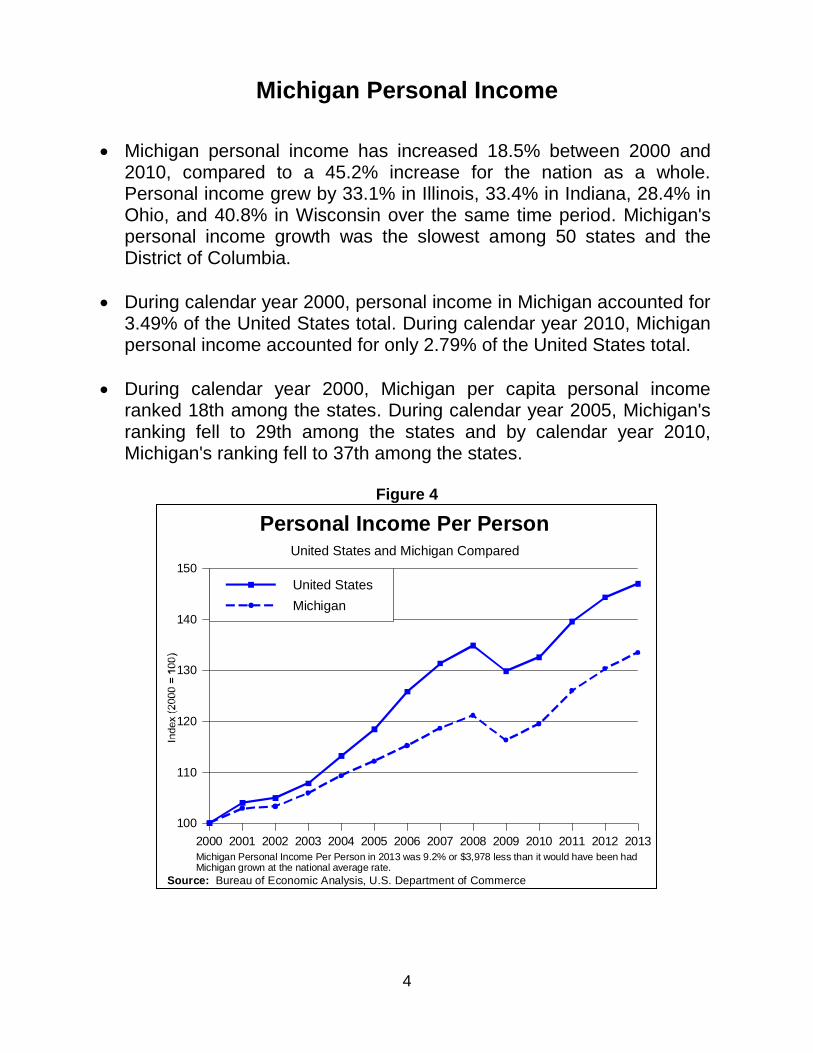
Michigan Personal Income
Michigan personal income has increased 18.5% between 2000 and 2010, compared to a 45.2% increase for the nation as a whole. Personal income grew by 33.1% in Illinois, 33.4% in Indiana, 28.4% in Ohio, and 40.8% in Wisconsin over the same time period. Michigan's personal income growth was the slowest among 50 states and the District of Columbia.
During calendar year 2000, personal income in Michigan accounted for 3.49% of the United States total. During calendar year 2010, Michigan personal income accounted for only 2.79% of the United States total.
During calendar year 2000, Michigan per capita personal income ranked 18th among the states. During calendar year 2005, Michigan's ranking fell to 29th among the states and by calendar year 2010, Michigan's ranking fell to 37th among the states.
Figure 4
2000 2001 2002 2003 2004 2005 2006 2007 2008 2009 2010 2011 2012 2013
100
110
120
130
140
150
United States
Michigan
United States and Michigan Compared
Personal Income Per Person
Michigan Personal Income Per Person in 2013 was 9.2% or $3,978 less than it would have been hadMichigan grown at the national average rate.
Source: Bureau of Economic Analysis, U.S. Department of Commerce
5
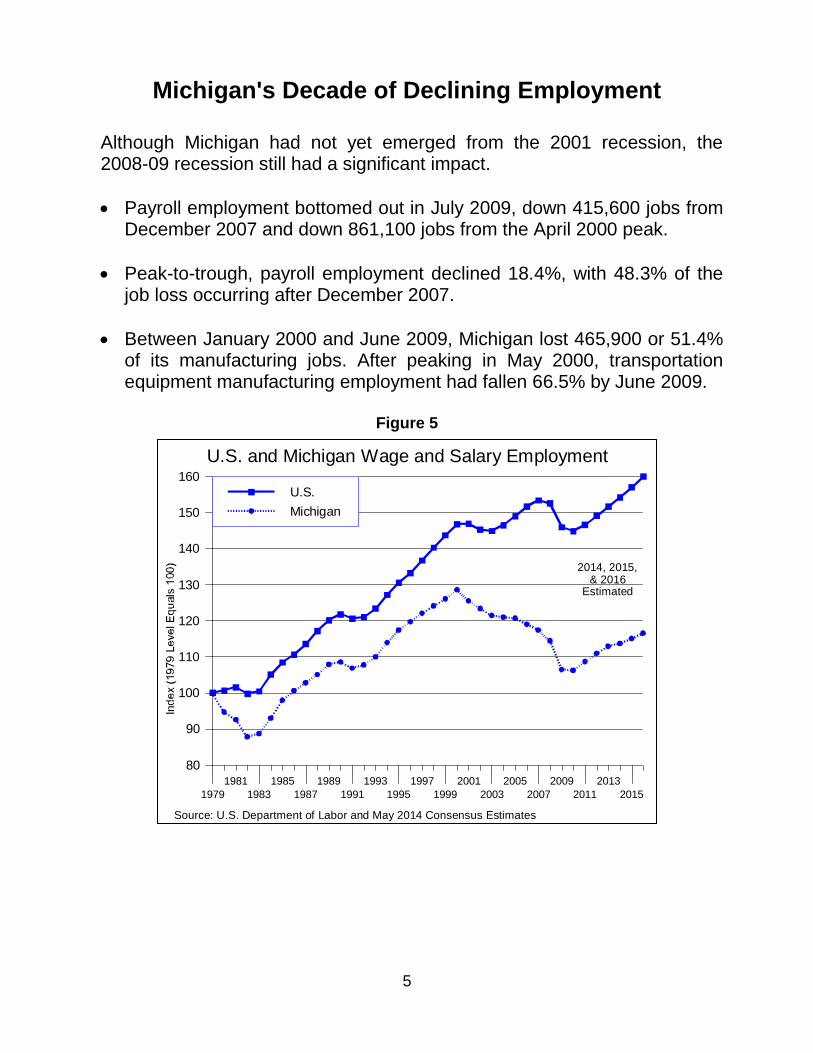
Michigan's Decade of Declining Employment Although Michigan had not yet emerged from the 2001 recession, the 2008-09 recession still had a significant impact.
Payroll employment bottomed out in July 2009, down 415,600 jobs from December 2007 and down 861,100 jobs from the April 2000 peak.
Peak-to-trough, payroll employment declined 18.4%, with 48.3% of the job loss occurring after December 2007.
Between January 2000 and June 2009, Michigan lost 465,900 or 51.4% of its manufacturing jobs. After peaking in May 2000, transportation equipment manufacturing employment had fallen 66.5% by June 2009.
Figure 5
1979
1981
1983
1985
1987
1989
1991
1993
1995
1997
1999
2001
2003
2005
2007
2009
2011
2013
2015
80
90
100
110
120
130
140
150
160
U.S.
Michigan
U.S. and Michigan Wage and Salary Employment
2014, 2015,& 2016
Estimated
Source: U.S. Department of Labor and May 2014 Consensus Estimates
6
Figure 6
Figure 7
8.3%
10.5%
29.0%
-1.3%
0.6%
-22.9%
-5.5%
-36.0%
-32.6%
-12.7%
-1.0%
-5.7%
-4.0%
21.8%
-23.8%
-8.5%
-23.0%
-19.3%
-65.1%
-50.6%
-41.9%
-18.4%
% Change in Jobs, April 2000 to July 2009, Seasonally Adj.
Government
Leisure/Hospitality
Ed./Health Serv.
Prof./Bus. Serv.
Financial Activities
Information
Trade, Tran., Util.
Trans. Eq. Mfg.
Manufacturing
Construction
Total
-80.0% -60.0% -40.0% -20.0% 0 20.0% 40.0%
Michigan
U.S.
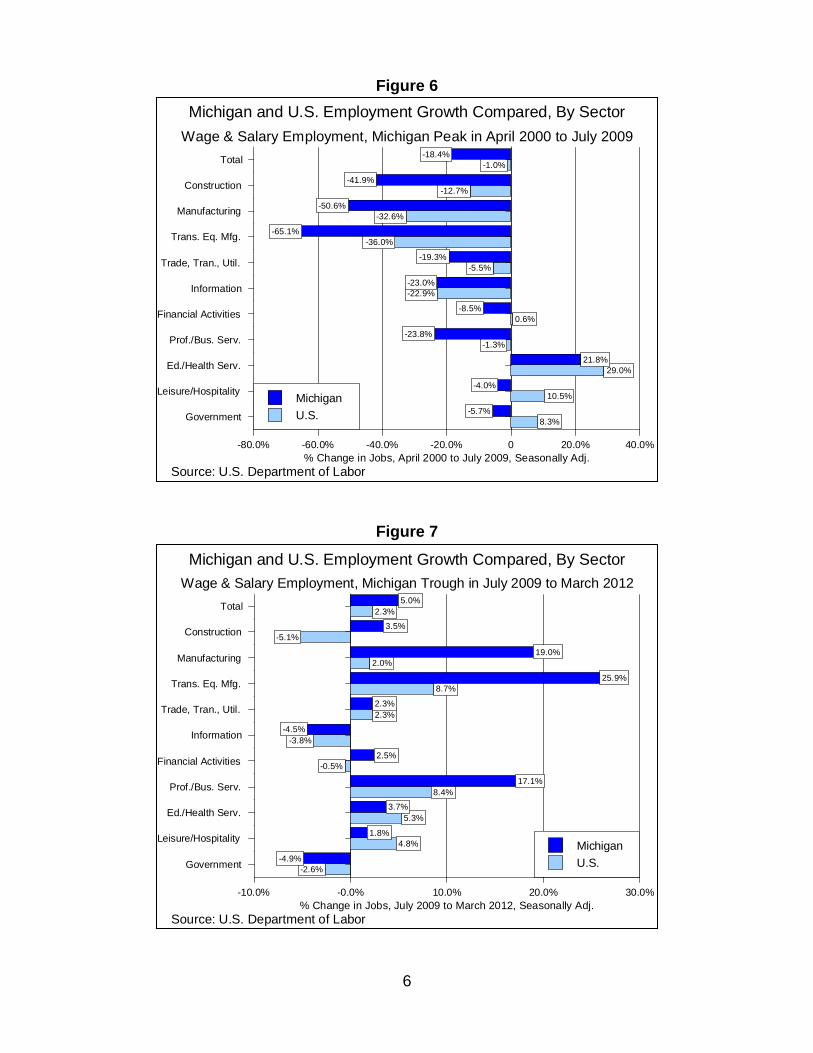
Wage & Salary Employment, Michigan Peak in April 2000 to July 2009
Michigan and U.S. Employment Growth Compared, By Sector
Source: U.S. Department of Labor
-2.6%
4.8%
5.3%
8.4%
-0.5%
-3.8%
2.3%
8.7%
2.0%
-5.1%
2.3%
-4.9%
1.8%
3.7%
17.1%
2.5%
-4.5%
2.3%
25.9%
19.0%
3.5%
5.0%
% Change in Jobs, July 2009 to March 2012, Seasonally Adj.
Government
Leisure/Hospitality
Ed./Health Serv.
Prof./Bus. Serv.
Financial Activities
Information
Trade, Tran., Util.
Trans. Eq. Mfg.
Manufacturing
Construction
Total
-10.0% -0.0% 10.0% 20.0% 30.0%
Michigan
U.S.
Wage & Salary Employment, Michigan Trough in July 2009 to March 2012
Michigan and U.S. Employment Growth Compared, By Sector
Source: U.S. Department of Labor
7
Figure 8
-0.3%
6.2%
3.8%
7.4%
1.9%
-0.7%
3.5%
6.0%
1.7%
6.6%
3.4%
-2.3%
2.9%
0.6%
5.3%
2.5%
3.8%
2.6%
8.8%
5.3%
6.4%
2.3%
% Change in Jobs, March 2012 to Apr. 2014, Seasonally Adj.
Government
Leisure/Hospitality
Ed./Health Serv.
Prof./Bus. Serv.
Financial Activities
Information
Trade, Tran., Util.
Trans. Eq. Mfg.
Manufacturing
Construction
Total
-5.0% 0 5.0% 10.0% 15.0% 20.0%
Michigan
U.S.
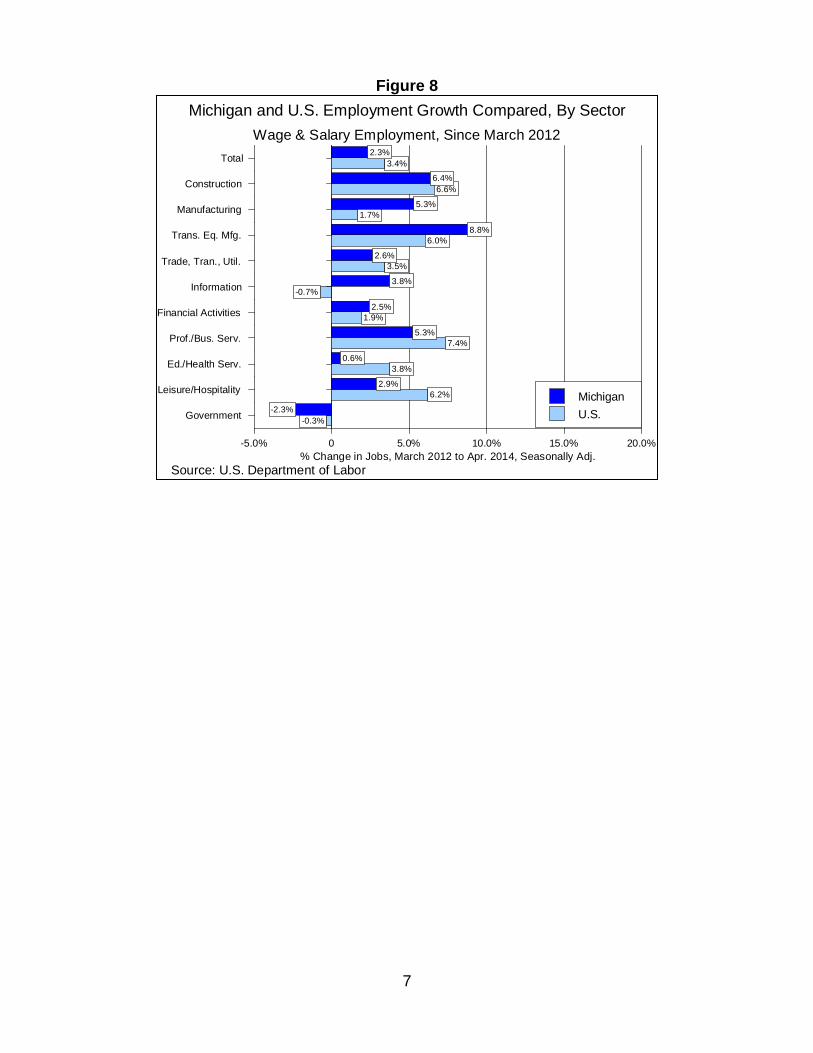
Wage & Salary Employment, Since March 2012
Michigan and U.S. Employment Growth Compared, By Sector
Source: U.S. Department of Labor
8
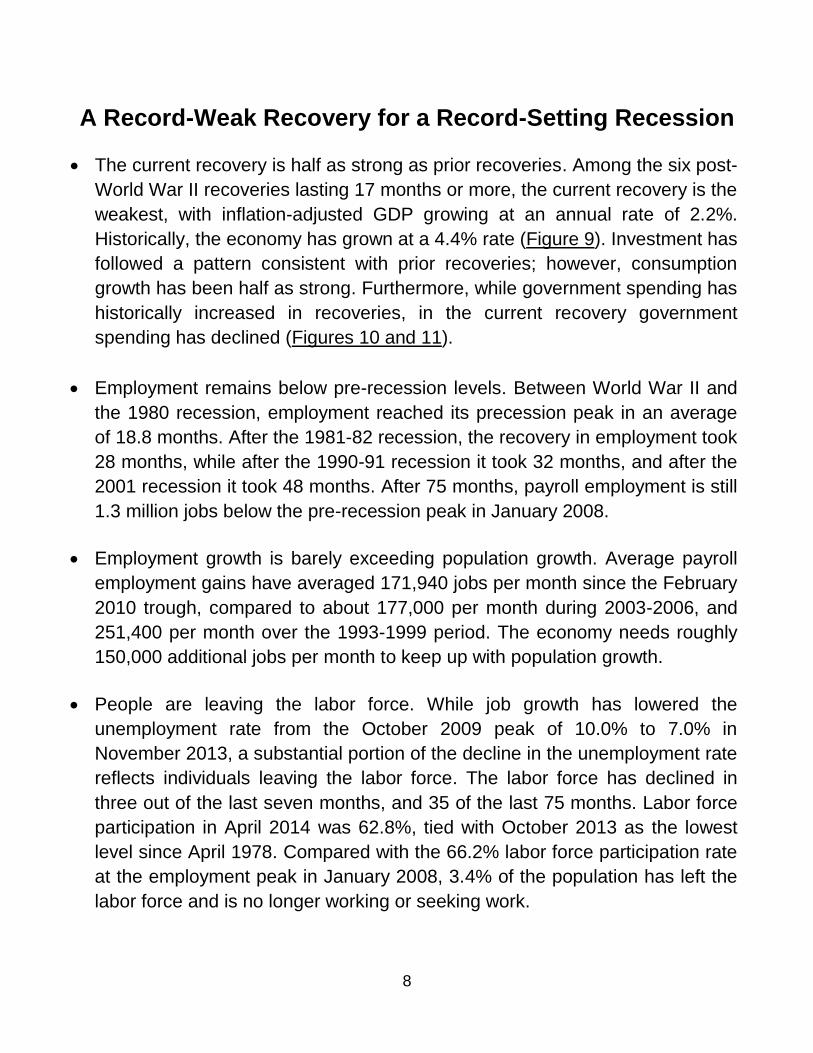
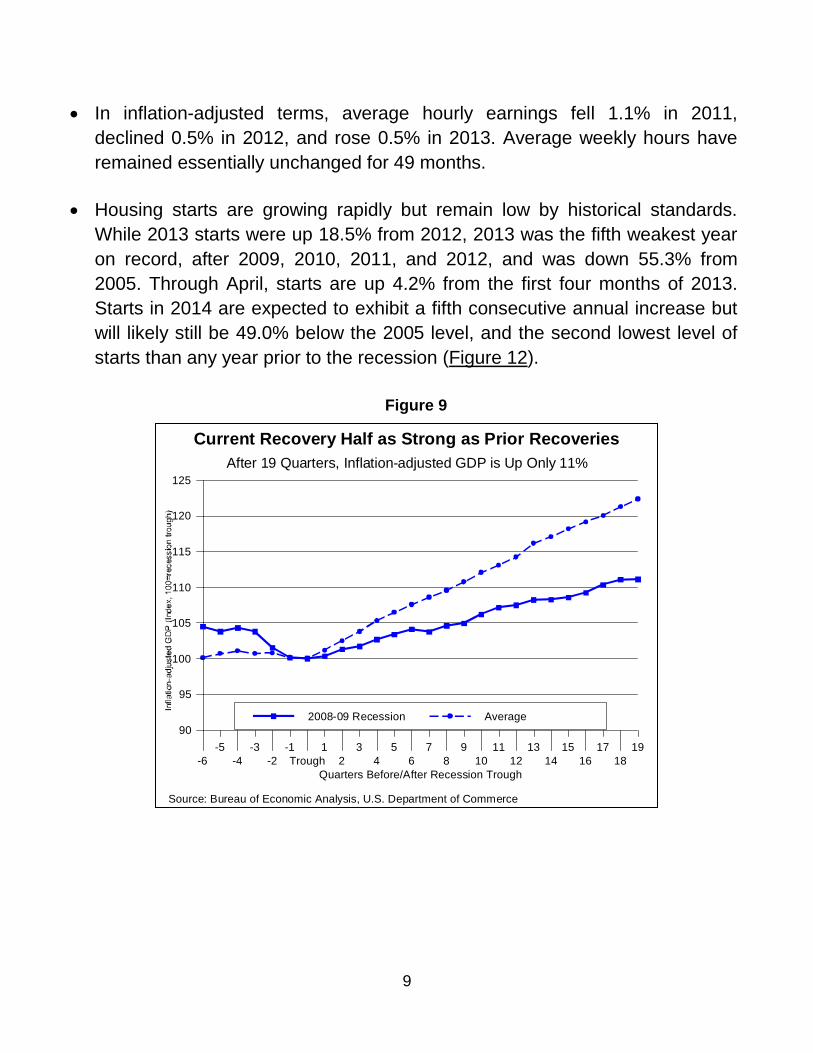
A Record-Weak Recovery for a Record-Setting Recession
The current recovery is half as strong as prior recoveries. Among the six post-
World War II recoveries lasting 17 months or more, the current recovery is the
weakest, with inflation-adjusted GDP growing at an annual rate of 2.2%.
Historically, the economy has grown at a 4.4% rate (Figure 9). Investment has
followed a pattern consistent with prior recoveries; however, consumption
growth has been half as strong. Furthermore, while government spending has
historically increased in recoveries, in the current recovery government
spending has declined (Figures 10 and 11).
Employment remains below pre-recession levels. Between World War II and
the 1980 recession, employment reached its precession peak in an average
of 18.8 months. After the 1981-82 recession, the recovery in employment took
28 months, while after the 1990-91 recession it took 32 months, and after the
2001 recession it took 48 months. After 75 months, payroll employment is still
1.3 million jobs below the pre-recession peak in January 2008.
Employment growth is barely exceeding population growth. Average payroll
employment gains have averaged 171,940 jobs per month since the February
2010 trough, compared to about 177,000 per month during 2003-2006, and
251,400 per month over the 1993-1999 period. The economy needs roughly
150,000 additional jobs per month to keep up with population growth.
People are leaving the labor force. While job growth has lowered the
unemployment rate from the October 2009 peak of 10.0% to 7.0% in
November 2013, a substantial portion of the decline in the unemployment rate
reflects individuals leaving the labor force. The labor force has declined in
three out of the last seven months, and 35 of the last 75 months. Labor force
participation in April 2014 was 62.8%, tied with October 2013 as the lowest
level since April 1978. Compared with the 66.2% labor force participation rate
at the employment peak in January 2008, 3.4% of the population has left the
labor force and is no longer working or seeking work.
9
In inflation-adjusted terms, average hourly earnings fell 1.1% in 2011,
declined 0.5% in 2012, and rose 0.5% in 2013. Average weekly hours have
remained essentially unchanged for 49 months.
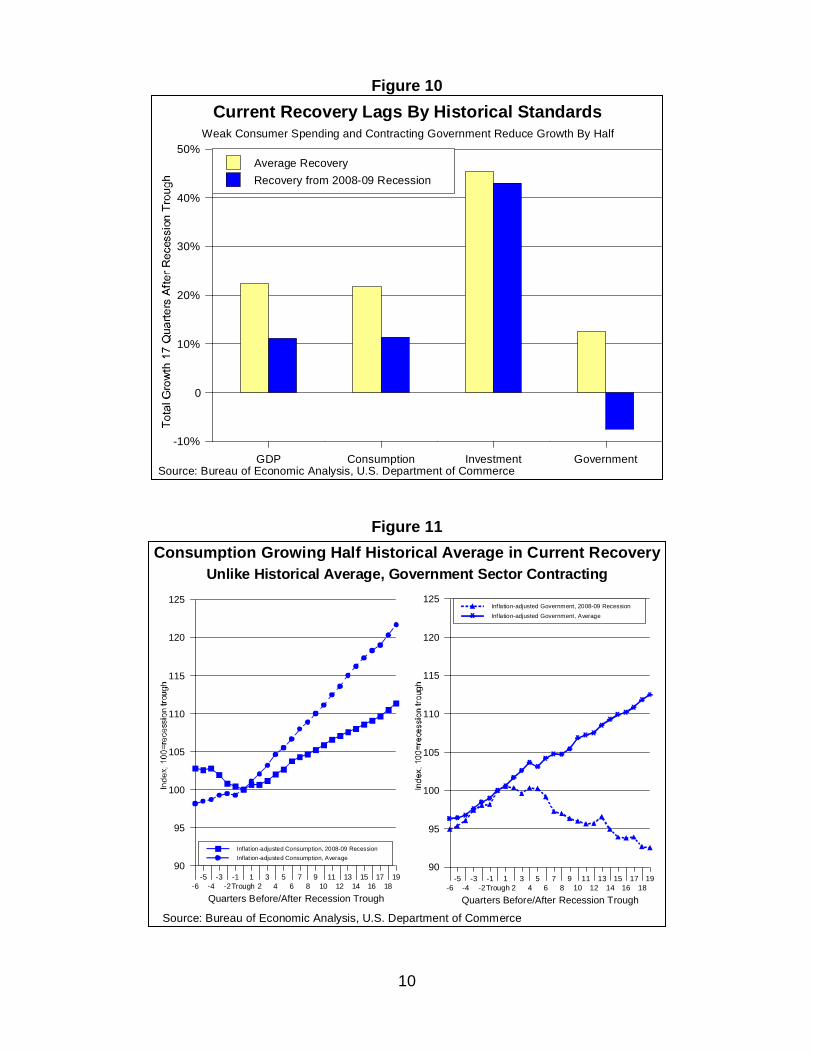
Housing starts are growing rapidly but remain low by historical standards.
While 2013 starts were up 18.5% from 2012, 2013 was the fifth weakest year
on record, after 2009, 2010, 2011, and 2012, and was down 55.3% from
2005. Through April, starts are up 4.2% from the first four months of 2013.
Starts in 2014 are expected to exhibit a fifth consecutive annual increase but
will likely still be 49.0% below the 2005 level, and the second lowest level of
starts than any year prior to the recession (Figure 12).
Figure 9
Quarters Before/After Recession Trough
-6
-5
-4
-3
-2
-1
Trough
1
2
3
4
5
6
7
8
9
10
11
12
13
14
15
16
17
18
19
90
95
100
105
110
115
120
125
2008-09 Recession Average
After 19 Quarters, Inflation-adjusted GDP is Up Only 11%
Current Recovery Half as Strong as Prior Recoveries
Source: Bureau of Economic Analysis, U.S. Department of Commerce
10
Quarters Before/After Recession Trough
-6
-5
-4
-3
-2
-1
Trough
1
2
3
4
5
6
7
8
9
10
11
12
13
14
15
16
17
18
19
90
95
100
105
110
115
120
125
Inflation-adjusted Consumption, 2008-09 Recession
Inflation-adjusted Consumption, Average
Source: Bureau of Economic Analysis, U.S. Department of Commerce
Quarters Before/After Recession Trough
-6
-5
-4
-3
-2
-1
Trough
1
2
3
4
5
6
7
8
9
10
11
12
13
14
15
16
17
18
19
90
95
100
105
110
115
120
125Inflation-adjusted Government, 2008-09 Recession
Inflation-adjusted Government, Average
Consumption Growing Half Historical Average in Current Recovery
Unlike Historical Average, Government Sector Contracting
Figure 10
Figure 11
GDP Consumption Investment Government
-10%
0
10%
20%
30%
40%
50%
Average Recovery
Recovery from 2008-09 Recession
Weak Consumer Spending and Contracting Government Reduce Growth By Half
Current Recovery Lags By Historical Standards
Source: Bureau of Economic Analysis, U.S. Department of Commerce
11
Figure 12
1995Q1
1998Q1
2001Q1
2004Q1
2007Q1
2010Q1
2013Q1
0
500
1,000
1,500
2,000
2,500
2.0%
3.0%
4.0%
5.0%
6.0%
7.0%
Housing Starts (Y1)
Residential Investment, Share of GDP (Y2)
Housing's Weak Recovery
Source: Census Bureau and Bureau of Economic Analysis, U.S. Dept. of Commerce
12
Recent U.S. Economic Highlights
While the economy is growing, the growth rate is inconsistent. In the third
quarter of 2013, inflation-adjusted GDP grew by 4.1%, the most rapid
increase in two years and only the second time since the first quarter of 2006
that economic growth has exceeded a 4.0% rate. However, inflation-adjusted
GDP increased only 2.6% in the fourth quarter of 2013. In the first quarter of
2014, inflation-adjusted GDP increased only 0.1%, the same growth rate as
in the fourth quarter of 2012.
Nationally, payroll employment has risen for 43 consecutive months, and in
April 2014 was 6.6% above the February 2010 trough (but 0.1% below the
pre-recession peak).
The U.S. unemployment rate in April 2014 was 6.3%, down from 7.5% in
April 2013 and well below the October 2009 peak of 10.0%. Compared with
one year ago, most of the improvement reflects job gains, with the labor force
up by 62,000 persons and employment up by 2.0 million jobs.
Light vehicle sales have improved, and are near pre-recession levels. Light
vehicle sales totaled 15.5 million units in 2013, up 7.5% from 2012 and
34.4% from 2010. Since June 2013, light vehicles sales have averaged 15.7
million units, below the 16-17 million unit rate experienced between 1998 and
2007, but well above the 10.4 million units in 2009. March 2014 sales, at an
annualized rate of 16.3 million units, tied November 2013 as the highest rate
since May 2007.
With the exception of November 2013, housing starts in April 2014 were at
the highest seasonally adjusted rate since February 2008.
13
Recent Michigan Economic Highlights
Job growth is slowing. As of April 2014, payroll employment has remained
relatively flat for 12 months. April 2014 employment was up 0.6% from the
year-ago level. Payroll employment in 2014 is expected to finish up 0.7% from
the 2012 level, the third consecutive annual increase but a smaller gain than in
2011 (2.3%), 2012 (1.8%), and 2013 (1.4%).
The labor force is no longer shrinking. Michigan's unemployment rate was
7.4% in April 2014, down from 8.8% in April 2013, and down from the 14.2%
peak in August 2009. A sizeable portion of the improvement in the
unemployment rate reflects people leaving the labor force. Compared with
August 2009, employment is up by 232,975 (5.6%) jobs but 101,100 people
(2.1%) have left the labor force. The size of the labor force fell for 23
consecutive months between March 2010 and January 2012, and declined in
the last six months of 2013. During the first four months of 2014, the size of
the labor force has increased every month, rising by 54,530.
Despite the weather, Michigan motor vehicle production in January and
February 2014 was up 9.7% from the year-ago level.
Michigan personal income is now growing closer to the national average. In
2012, total personal income increased 3.5%, compared with the U.S. average
of 4.2%, ranking Michigan 39th. However, in 2013, Michigan personal income
increased 2.5%, near the national average of 2.6%, and ranking Michigan
24th.
When incoming growth is measured on a per-person basis, Michigan ranked
23rd in 2012 with personal income per person growing 3.4%, the same as the
national average. In 2013, Michigan ranked 9th with personal income per
person growing 2.4%, compared with the national average of 1.8%. In 2013,
Illinois ranked 18th, Indiana ranked 32nd, Ohio ranked 19th, and Wisconsin
ranked 7th.
14
State Revenue
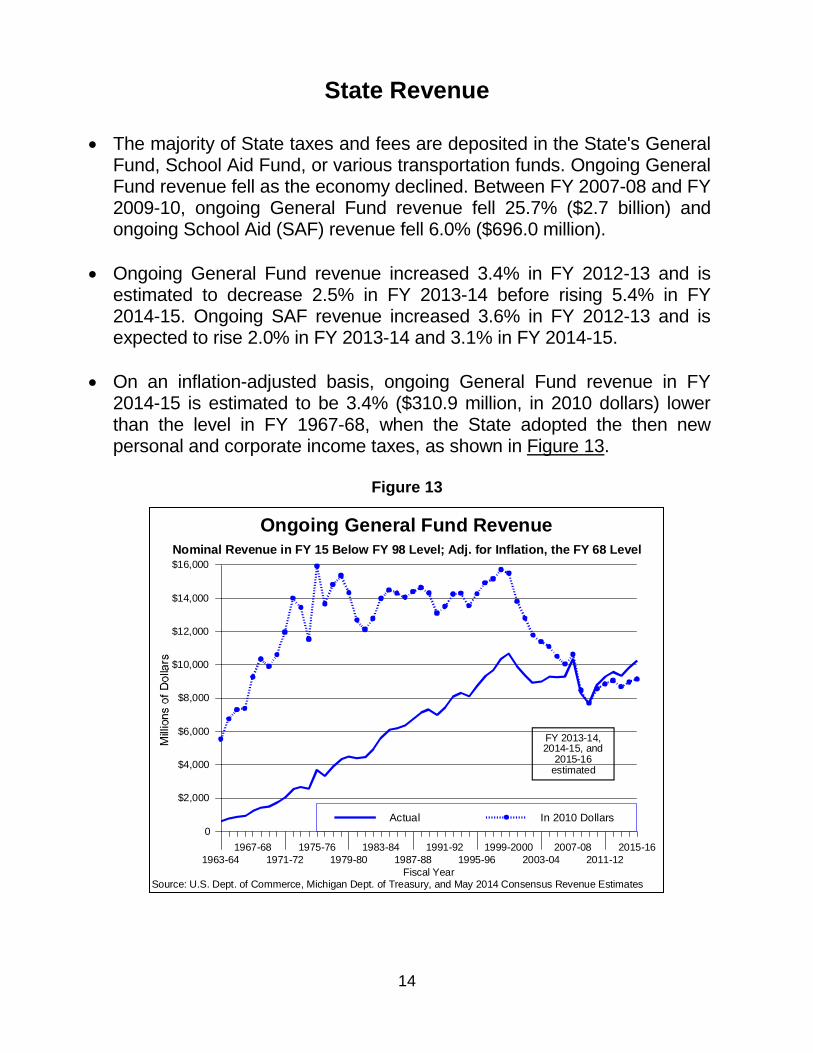
The majority of State taxes and fees are deposited in the State's General Fund, School Aid Fund, or various transportation funds. Ongoing General Fund revenue fell as the economy declined. Between FY 2007-08 and FY 2009-10, ongoing General Fund revenue fell 25.7% ($2.7 billion) and ongoing School Aid (SAF) revenue fell 6.0% ($696.0 million).
Ongoing General Fund revenue increased 3.4% in FY 2012-13 and is estimated to decrease 2.5% in FY 2013-14 before rising 5.4% in FY 2014-15. Ongoing SAF revenue increased 3.6% in FY 2012-13 and is expected to rise 2.0% in FY 2013-14 and 3.1% in FY 2014-15.
On an inflation-adjusted basis, ongoing General Fund revenue in FY 2014-15 is estimated to be 3.4% ($310.9 million, in 2010 dollars) lower than the level in FY 1967-68, when the State adopted the then new personal and corporate income taxes, as shown in Figure 13.
Figure 13
Fiscal Year
1963-64
1967-68
1971-72
1975-76
1979-80
1983-84
1987-88
1991-92
1995-96
1999-2000
2003-04
2007-08
2011-12
2015-16
0
$2,000
$4,000
$6,000
$8,000
$10,000
$12,000
$14,000
$16,000
Actual In 2010 Dollars
Nominal Revenue in FY 15 Below FY 98 Level; Adj. for Inflation, the FY 68 Level
Ongoing General Fund Revenue
Source: U.S. Dept. of Commerce, Michigan Dept. of Treasury, and May 2014 Consensus Revenue Estimates
FY 2013-14,2014-15, and
2015-16estimated
15
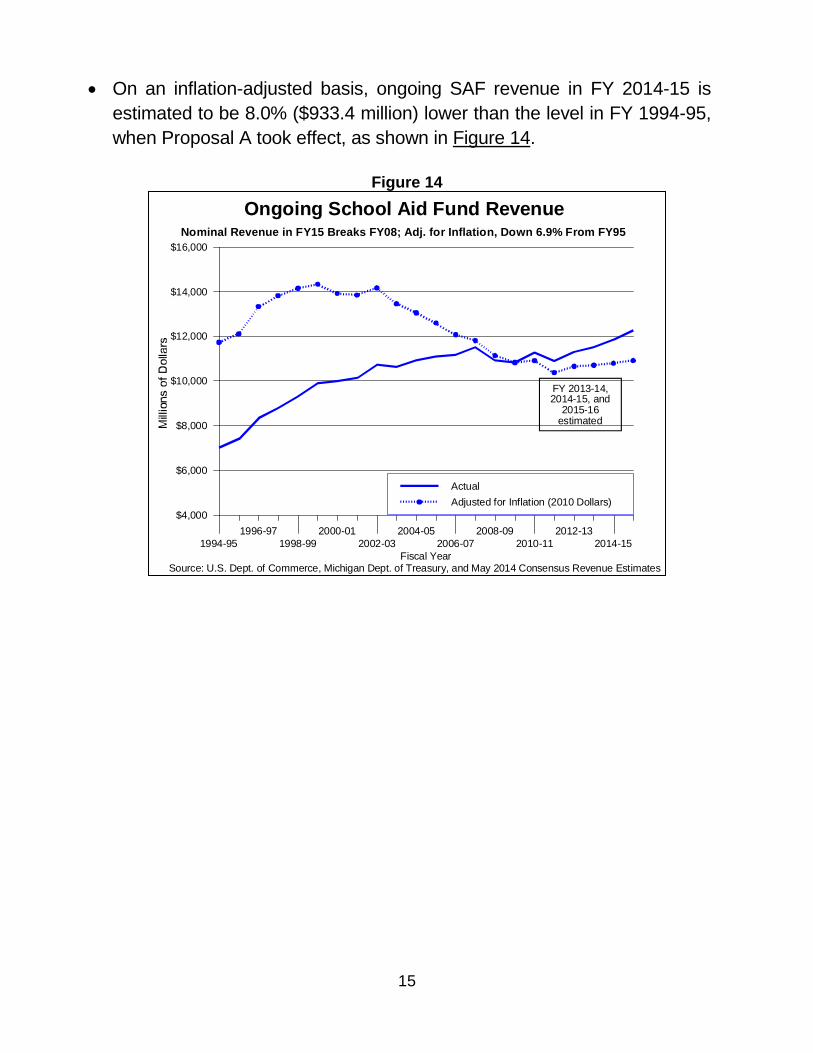
On an inflation-adjusted basis, ongoing SAF revenue in FY 2014-15 is
estimated to be 8.0% ($933.4 million) lower than the level in FY 1994-95,
when Proposal A took effect, as shown in Figure 14.
Figure 14
Fiscal Year
1994-95
1996-97
1998-99
2000-01
2002-03
2004-05
2006-07
2008-09
2010-11
2012-13
2014-15
$4,000
$6,000
$8,000
$10,000
$12,000
$14,000
$16,000
Actual
Adjusted for Inflation (2010 Dollars)
Nominal Revenue in FY15 Breaks FY08; Adj. for Inflation, Down 6.9% From FY95
Ongoing School Aid Fund Revenue
Source: U.S. Dept. of Commerce, Michigan Dept. of Treasury, and May 2014 Consensus Revenue Estimates
FY 2013-14,2014-15, and
2015-16estimated
16
6.4%6.1%
5.1%
1.1%
-2.7%
2.9%
6.5%
8.3%
6.0%6.1%5.5%
5.9%
7.9%
6.1%
-1.6%-1.5%-0.8%
1.8%
4.5%
1.0%1.2%0.5%
-9.1%
-2.1%
9.3%
7.3%
4.6%
0.9%
3.5%3.8%
Fiscal Year
'86-'87
'87-'88
'88-'89
'89-'90
'90-'91
'91-'92
'92-'93
'93-'94
'94-'95
'95-'96
'96-'97
'97-'98
'98-'99
'99-2000
2000-01
'01-'02
'02-'03
'03-'04
'04-'05
'05-06
'06-07
'07-08
'08-09
'09-10
'10-11
'11-12
'12-13
'13-14
'14-15
'15-16
-12.0%
-9.0%
-6.0%
-3.0%
0
3.0%
6.0%
9.0%
12.0%
and School Aid Fund Baseline Revenue
Change in General Fund/General Purpose
(Annual Percentage Change)
May 2014Consensus Estimate
Forecast for State Revenue
Pursuant to State statute, there are Consensus Revenue Estimating Conferences held in January and May of each year in which the State Treasurer, and the Directors of the House and Senate Fiscal Agencies, meet to agree on the amount of State revenue available for the State budget.
The Governor and the Legislature will use the revenue estimates from the May 15, 2014, Conference to finalize the FY 2014-15 budget. The Governor's budget recommendation for FY 2014-15 was based on the January 2014 Conference.
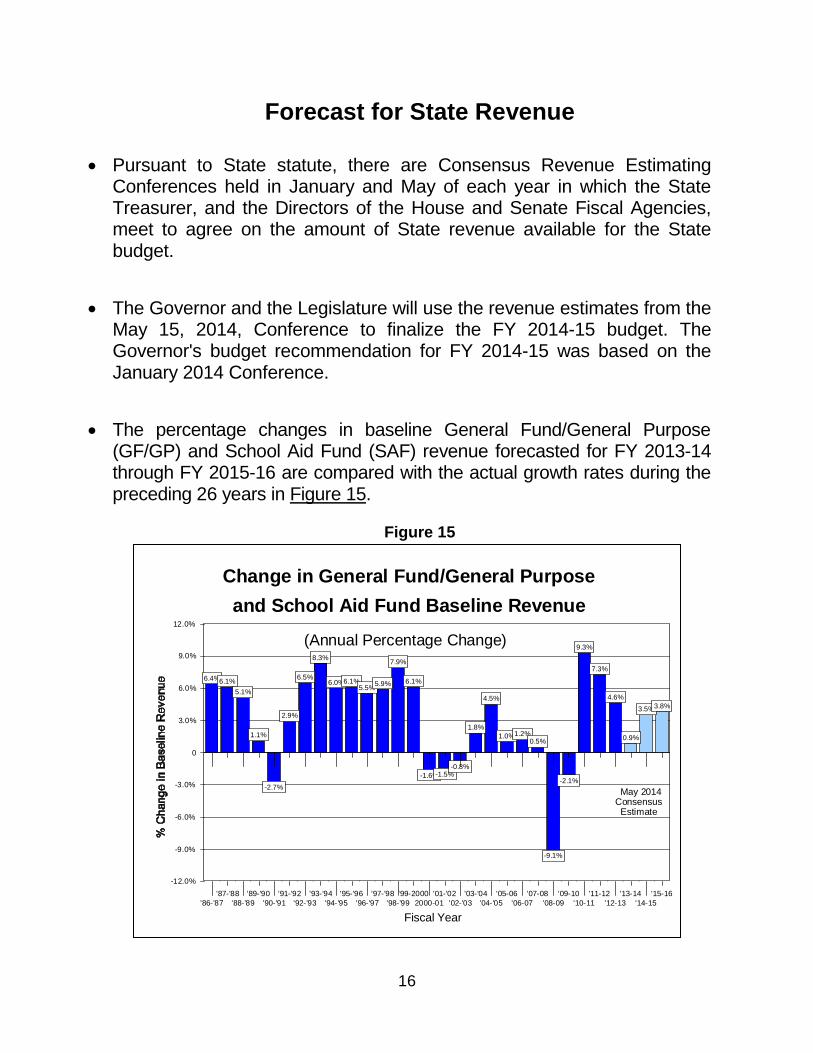
The percentage changes in baseline General Fund/General Purpose (GF/GP) and School Aid Fund (SAF) revenue forecasted for FY 2013-14 through FY 2015-16 are compared with the actual growth rates during the preceding 26 years in Figure 15.
Figure 15
17
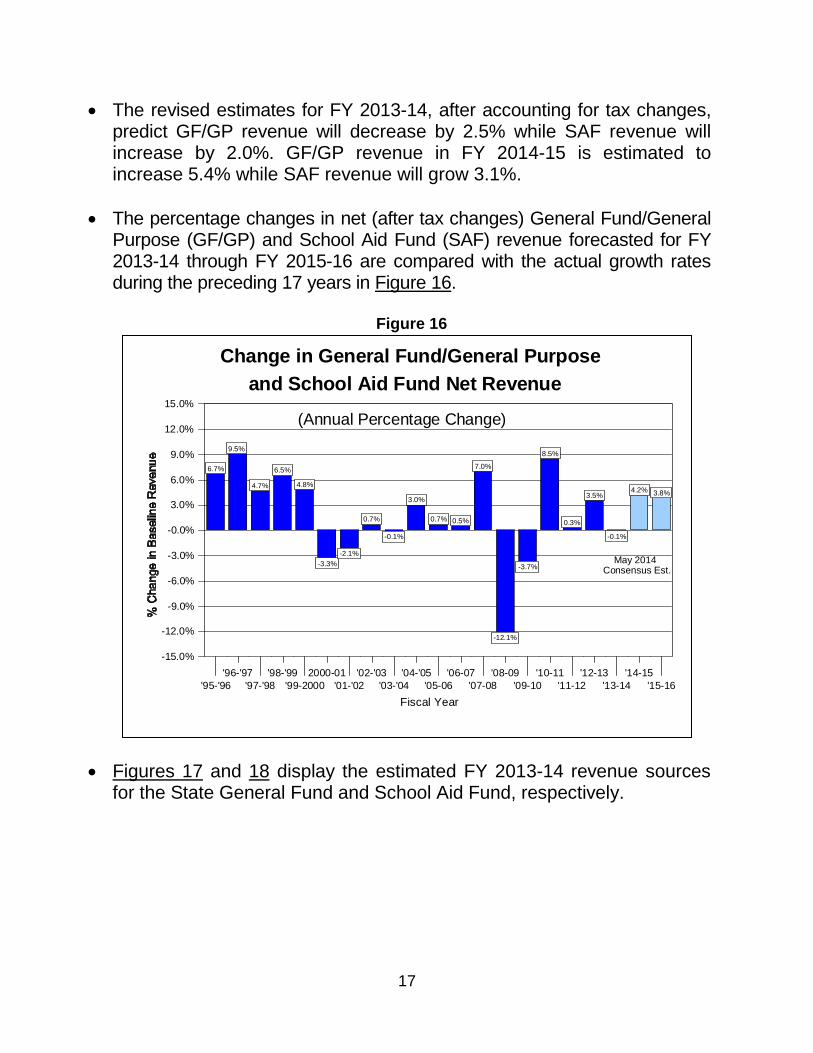
The revised estimates for FY 2013-14, after accounting for tax changes, predict GF/GP revenue will decrease by 2.5% while SAF revenue will increase by 2.0%. GF/GP revenue in FY 2014-15 is estimated to increase 5.4% while SAF revenue will grow 3.1%.
The percentage changes in net (after tax changes) General Fund/General Purpose (GF/GP) and School Aid Fund (SAF) revenue forecasted for FY 2013-14 through FY 2015-16 are compared with the actual growth rates during the preceding 17 years in Figure 16.
Figure 16
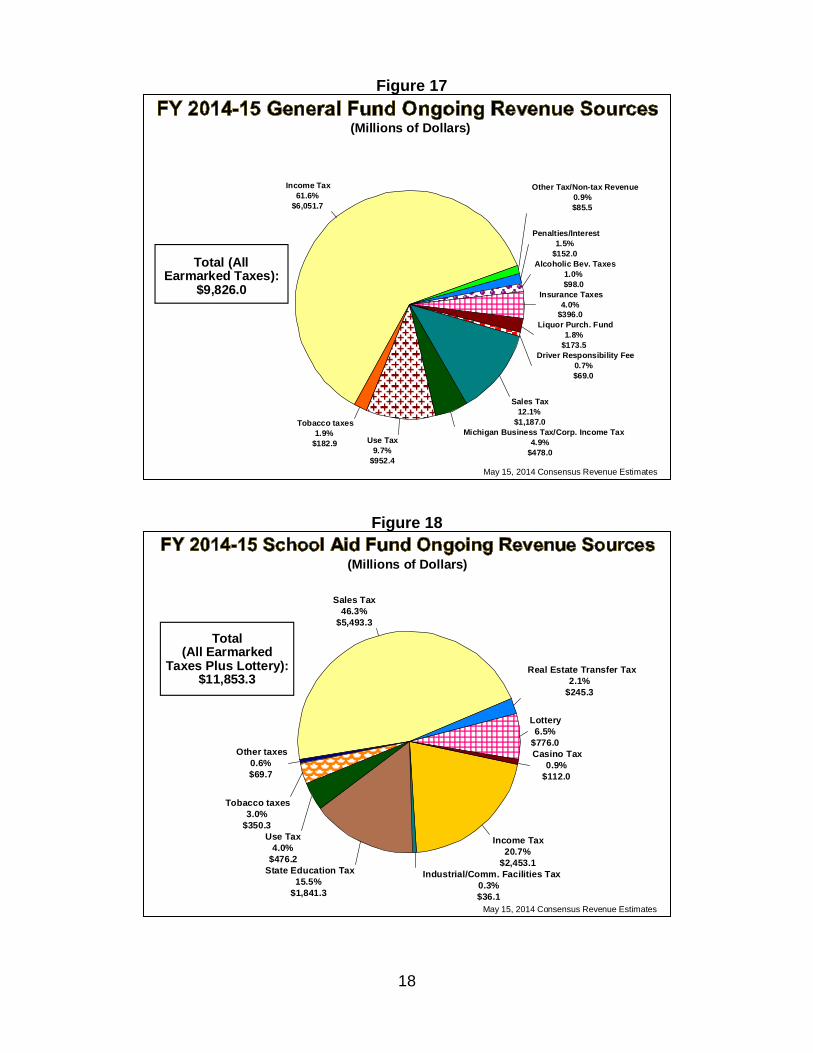
Figures 17 and 18 display the estimated FY 2013-14 revenue sources for the State General Fund and School Aid Fund, respectively.
6.7%
9.5%
4.7%
6.5%
4.8%
-3.3%
-2.1%
0.7%
-0.1%
3.0%
0.7% 0.5%
7.0%
-12.1%
-3.7%
8.5%
0.3%
3.5%
-0.1%
4.2% 3.8%
Fiscal Year
'95-'96
'96-'97
'97-'98
'98-'99
'99-2000
2000-01
'01-'02
'02-'03
'03-'04
'04-'05
'05-06
'06-07
'07-08
'08-09
'09-10
'10-11
'11-12
'12-13
'13-14
'14-15
'15-16
-15.0%
-12.0%
-9.0%
-6.0%
-3.0%
-0.0%
3.0%
6.0%
9.0%
12.0%
15.0%
and School Aid Fund Net Revenue
Change in General Fund/General Purpose
(Annual Percentage Change)
May 2014Consensus Est.
18
Figure 17
Figure 18
Income Tax
61.6%
$6,051.7
Tobacco taxes
1.9%
$182.9 Use Tax
9.7%
$952.4
Michigan Business Tax/Corp. Income Tax
4.9%
$478.0
Sales Tax
12.1%
$1,187.0
Driver Responsibility Fee
0.7%
$69.0
Liquor Purch. Fund
1.8%
$173.5
Insurance Taxes
4.0%
$396.0
Alcoholic Bev. Taxes
1.0%
$98.0
Penalties/Interest
1.5%
$152.0
Other Tax/Non-tax Revenue
0.9%
$85.5
(Millions of Dollars)
May 15, 2014 Consensus Revenue Estimates
Total (AllEarmarked Taxes):
$9,826.0
Sales Tax
46.3%
$5,493.3
Other taxes
0.6%
$69.7
Tobacco taxes
3.0%
$350.3
Use Tax
4.0%
$476.2
State Education Tax
15.5%
$1,841.3
Industrial/Comm. Facilities Tax
0.3%
$36.1
Income Tax
20.7%
$2,453.1
Casino Tax
0.9%
$112.0
Lottery
6.5%
$776.0
Real Estate Transfer Tax
2.1%
$245.3
(Millions of Dollars)
Total(All Earmarked
Taxes Plus Lottery):$11,853.3
May 15, 2014 Consensus Revenue Estimates
19
State Tax Expenditures
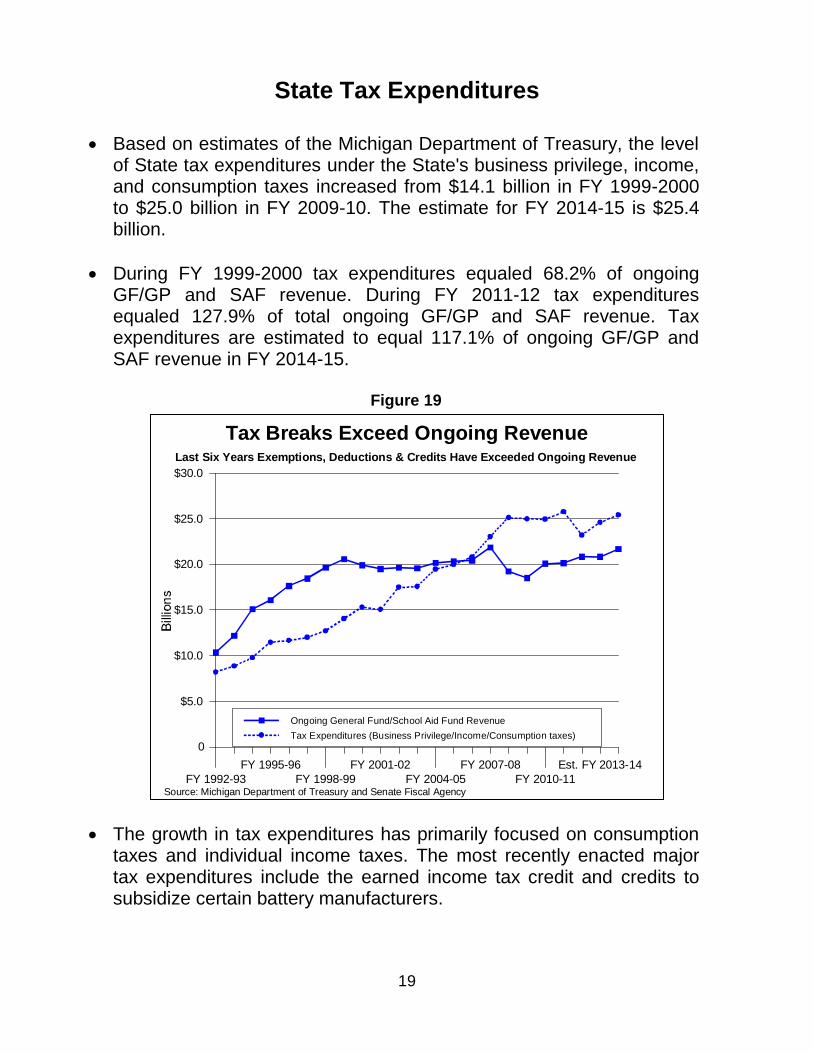
Based on estimates of the Michigan Department of Treasury, the level of State tax expenditures under the State's business privilege, income, and consumption taxes increased from $14.1 billion in FY 1999-2000 to $25.0 billion in FY 2009-10. The estimate for FY 2014-15 is $25.4 billion.
During FY 1999-2000 tax expenditures equaled 68.2% of ongoing GF/GP and SAF revenue. During FY 2011-12 tax expenditures equaled 127.9% of total ongoing GF/GP and SAF revenue. Tax expenditures are estimated to equal 117.1% of ongoing GF/GP and SAF revenue in FY 2014-15.
Figure 19
The growth in tax expenditures has primarily focused on consumption taxes and individual income taxes. The most recently enacted major tax expenditures include the earned income tax credit and credits to subsidize certain battery manufacturers.
FY 1992-93
FY 1995-96
FY 1998-99
FY 2001-02
FY 2004-05
FY 2007-08
FY 2010-11
Est. FY 2013-14
0
$5.0
$10.0
$15.0
$20.0
$25.0
$30.0
Ongoing General Fund/School Aid Fund Revenue
Tax Expenditures (Business Privilege/Income/Consumption taxes)
Last Six Years Exemptions, Deductions & Credits Have Exceeded Ongoing Revenue
Tax Breaks Exceed Ongoing Revenue
Source: Michigan Department of Treasury and Senate Fiscal Agency
20
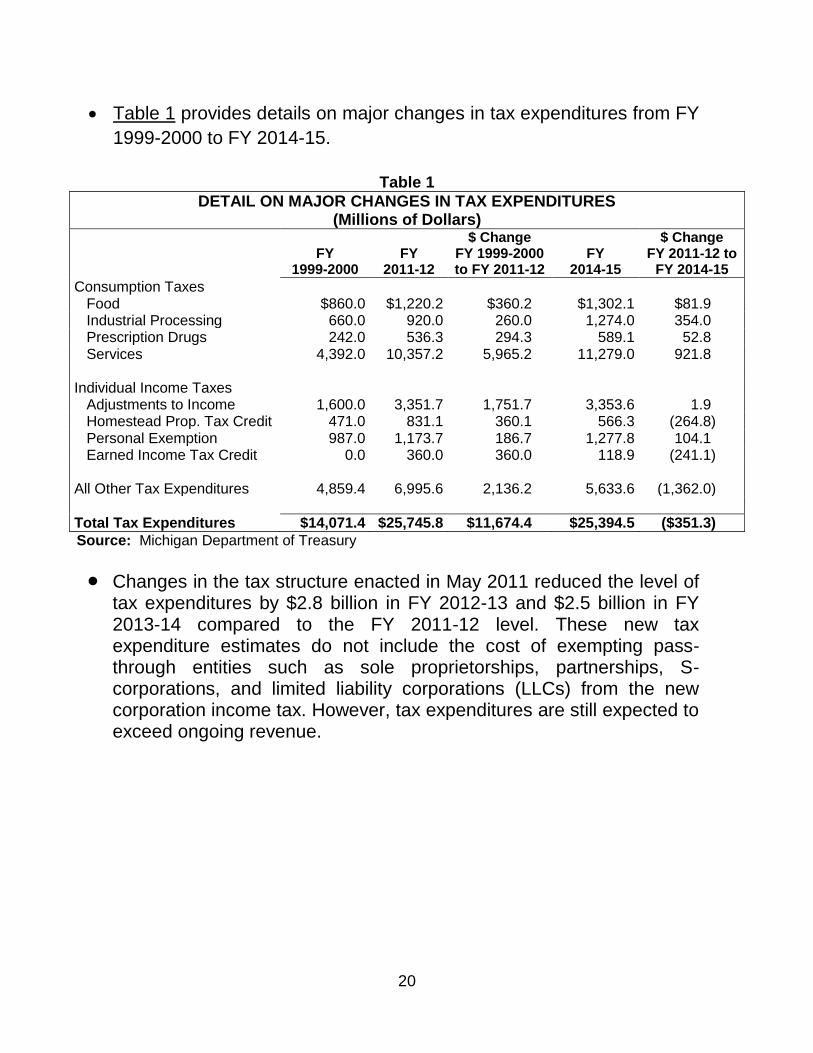
Table 1 provides details on major changes in tax expenditures from FY
1999-2000 to FY 2014-15.
Table 1
DETAIL ON MAJOR CHANGES IN TAX EXPENDITURES (Millions of Dollars)
FY
1999-2000
FY 2011-12
$ Change FY 1999-2000 to FY 2011-12
FY 2014-15
$ Change FY 2011-12 to
FY 2014-15
Consumption Taxes Food $860.0 $1,220.2 $360.2 $1,302.1 $81.9
Industrial Processing 660.0 920.0 260.0 1,274.0 354.0
Prescription Drugs 242.0 536.3 294.3 589.1 52.8
Services 4,392.0 10,357.2 5,965.2 11,279.0 921.8
Individual Income Taxes Adjustments to Income 1,600.0 3,351.7 1,751.7 3,353.6 1.9
Homestead Prop. Tax Credit 471.0 831.1 360.1 566.3 (264.8) Personal Exemption 987.0 1,173.7 186.7 1,277.8 104.1 Earned Income Tax Credit 0.0 360.0 360.0 118.9 (241.1)
All Other Tax Expenditures 4,859.4 6,995.6 2,136.2 5,633.6 (1,362.0)
Total Tax Expenditures $14,071.4 $25,745.8 $11,674.4 $25,394.5 ($351.3)
Source: Michigan Department of Treasury
Changes in the tax structure enacted in May 2011 reduced the level of tax expenditures by $2.8 billion in FY 2012-13 and $2.5 billion in FY 2013-14 compared to the FY 2011-12 level. These new tax expenditure estimates do not include the cost of exempting pass-through entities such as sole proprietorships, partnerships, S-corporations, and limited liability corporations (LLCs) from the new corporation income tax. However, tax expenditures are still expected to exceed ongoing revenue.
21
Tax Code Restructuring
Public Acts 38, 39, and 40 of 2011 restructured Michigan's business
and personal income taxes.
The existing Michigan Business Tax (MBT) was repealed and replaced with a new 6.0% Corporate Income Tax (CIT).
Changes to the Michigan personal income tax include: freezing the personal income tax rate at 4.35% until January 1, 2013 (later modified to October 1, 2012, by PA 223 of 2012), modifying pension deductions and the homestead property tax credit, reducing the earned income tax credit (EITC), and eliminating most of the other credits, deductions, and exemptions. The current income tax rate is 4.25%.
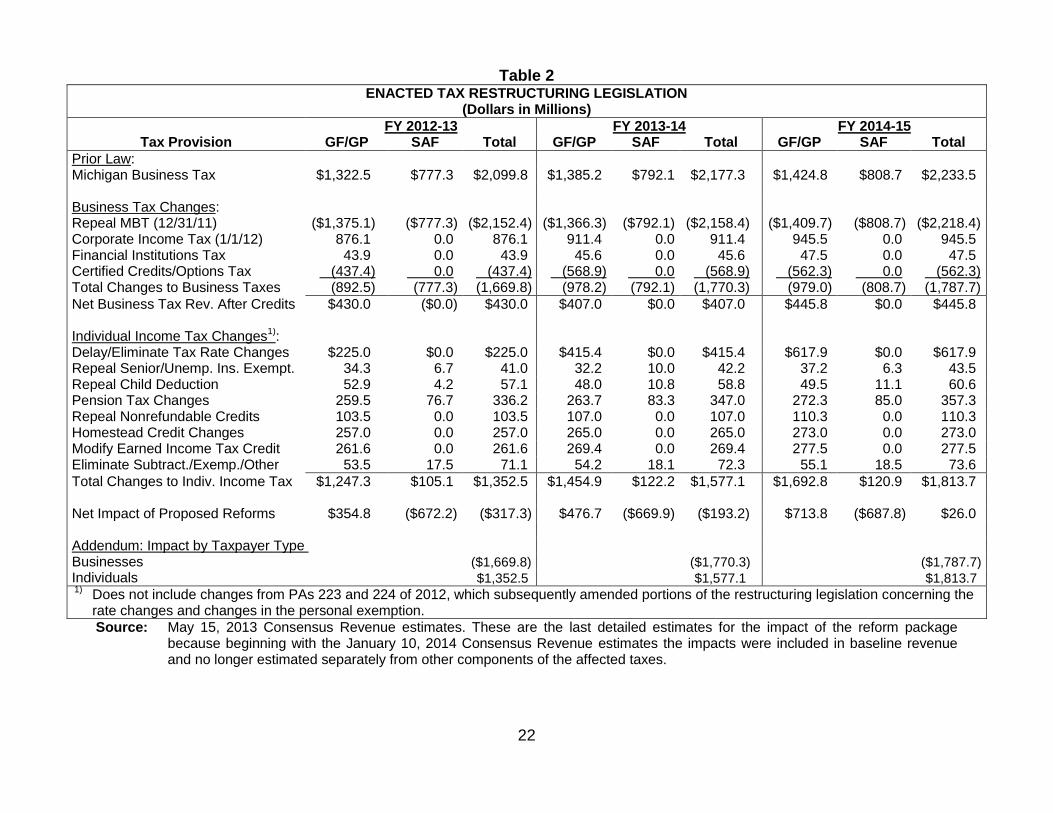
Table 2 outlines estimates of the fiscal impact for the State GF/GP and the School Aid Fund of the tax restructuring. The first year of the full impact of the changes will be FY 2012-13 when it is estimated that GF/GP revenue will increase by $385.5 million and School Aid Fund revenue will decrease by $669.9 million.
22
Table 2 ENACTED TAX RESTRUCTURING LEGISLATION
(Dollars in Millions)
FY 2012-13 FY 2013-14 FY 2014-15 Tax Provision GF/GP SAF Total GF/GP SAF Total GF/GP SAF Total
Prior Law: Michigan Business Tax $1,322.5 $777.3 $2,099.8 $1,385.2 $792.1 $2,177.3 $1,424.8 $808.7 $2,233.5
Business Tax Changes: Repeal MBT (12/31/11) ($1,375.1) ($777.3) ($2,152.4) ($1,366.3) ($792.1) ($2,158.4) ($1,409.7) ($808.7) ($2,218.4) Corporate Income Tax (1/1/12) 876.1 0.0 876.1 911.4 0.0 911.4 945.5 0.0 945.5 Financial Institutions Tax 43.9 0.0 43.9 45.6 0.0 45.6 47.5 0.0 47.5 Certified Credits/Options Tax (437.4) 0.0 (437.4) (568.9) 0.0 (568.9) (562.3) 0.0 (562.3) Total Changes to Business Taxes (892.5) (777.3) (1,669.8) (978.2) (792.1) (1,770.3) (979.0) (808.7) (1,787.7)
Net Business Tax Rev. After Credits $430.0 ($0.0) $430.0 $407.0 $0.0 $407.0 $445.8 $0.0 $445.8
Individual Income Tax Changes1)
: Delay/Eliminate Tax Rate Changes $225.0 $0.0 $225.0 $415.4 $0.0 $415.4 $617.9 $0.0 $617.9 Repeal Senior/Unemp. Ins. Exempt. 34.3 6.7 41.0 32.2 10.0 42.2 37.2 6.3 43.5 Repeal Child Deduction 52.9 4.2 57.1 48.0 10.8 58.8 49.5 11.1 60.6 Pension Tax Changes 259.5 76.7 336.2 263.7 83.3 347.0 272.3 85.0 357.3 Repeal Nonrefundable Credits 103.5 0.0 103.5 107.0 0.0 107.0 110.3 0.0 110.3 Homestead Credit Changes 257.0 0.0 257.0 265.0 0.0 265.0 273.0 0.0 273.0 Modify Earned Income Tax Credit 261.6 0.0 261.6 269.4 0.0 269.4 277.5 0.0 277.5 Eliminate Subtract./Exemp./Other 53.5 17.5 71.1 54.2 18.1 72.3 55.1 18.5 73.6
Total Changes to Indiv. Income Tax $1,247.3 $105.1 $1,352.5 $1,454.9 $122.2 $1,577.1 $1,692.8 $120.9 $1,813.7
Net Impact of Proposed Reforms $354.8 ($672.2) ($317.3) $476.7 ($669.9) ($193.2) $713.8 ($687.8) $26.0 Addendum: Impact by Taxpayer Type Businesses ($1,669.8) ($1,770.3) ($1,787.7) Individuals $1,352.5 $1,577.1 $1,813.7 1)
Does not include changes from PAs 223 and 224 of 2012, which subsequently amended portions of the restructuring legislation concerning the rate changes and changes in the personal exemption.
Source: May 15, 2013 Consensus Revenue estimates. These are the last detailed estimates for the impact of the reform package because beginning with the January 10, 2014 Consensus Revenue estimates the impacts were included in baseline revenue and no longer estimated separately from other components of the affected taxes.
23
-$0.6
$0.0 $0.2
-$2.4
-$3.9-$4.2
-$4.4-$4.2
-$4.9-$5.3
-$4.7
-$8.0
-$8.9
-$6.2
-$5.2
-$5.9
-$7.7 -$7.6-$7.8
FY '97-98
FY '98-'99
FY 1999-2000
FY '00-'01
FY '01-'02
FY '02-'03
FY '03-'04
FY '04-'05
FY '05-'06
FY '06-'07
FY' 07-'08
FY '08-'09
FY '09-'10
FY '10-'11
FY '11-'12
FY '12-'13
FY '13-'14
FY '14-15
FY '15-16
-$10.0
-$8.0
-$6.0
-$4.0
-$2.0
0
$2.0
Constitutional Revenue Limit
Source: Department of Technology, Management, and Budget, and May 2014 Consensus Revenue Estimates
Constitutional Revenue Limit
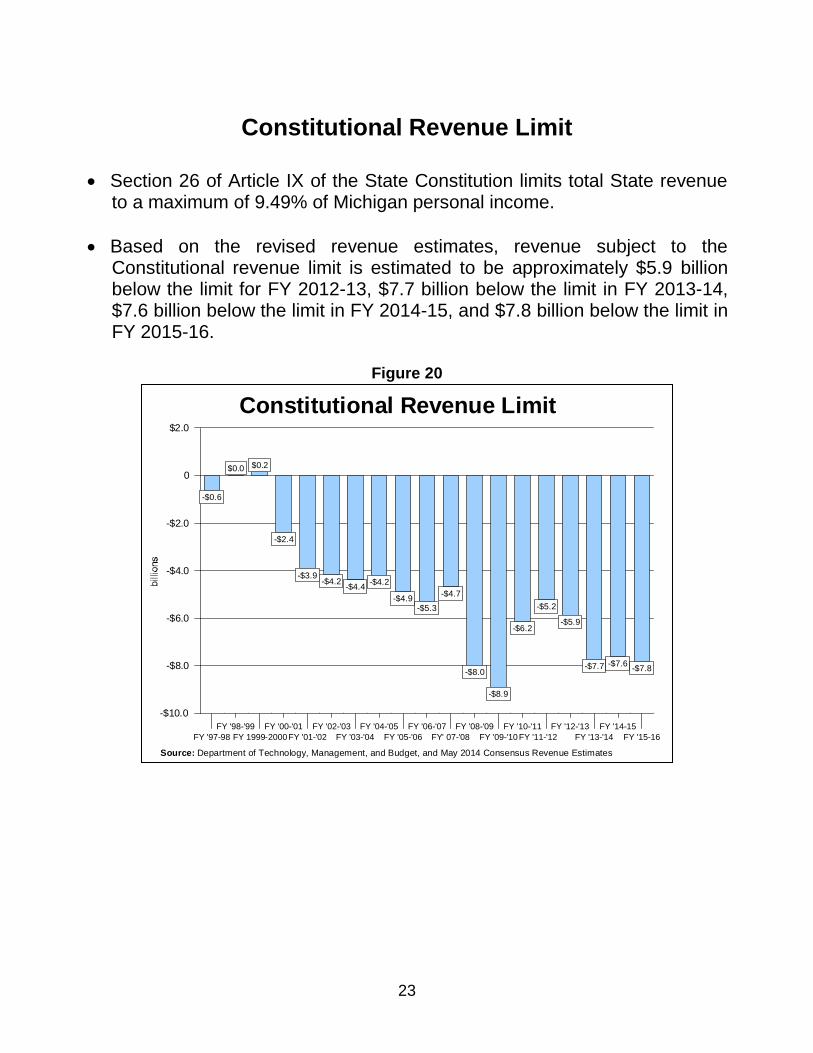
Section 26 of Article IX of the State Constitution limits total State revenue
to a maximum of 9.49% of Michigan personal income.
Based on the revised revenue estimates, revenue subject to the Constitutional revenue limit is estimated to be approximately $5.9 billion below the limit for FY 2012-13, $7.7 billion below the limit in FY 2013-14, $7.6 billion below the limit in FY 2014-15, and $7.8 billion below the limit in FY 2015-16.
Figure 20
24
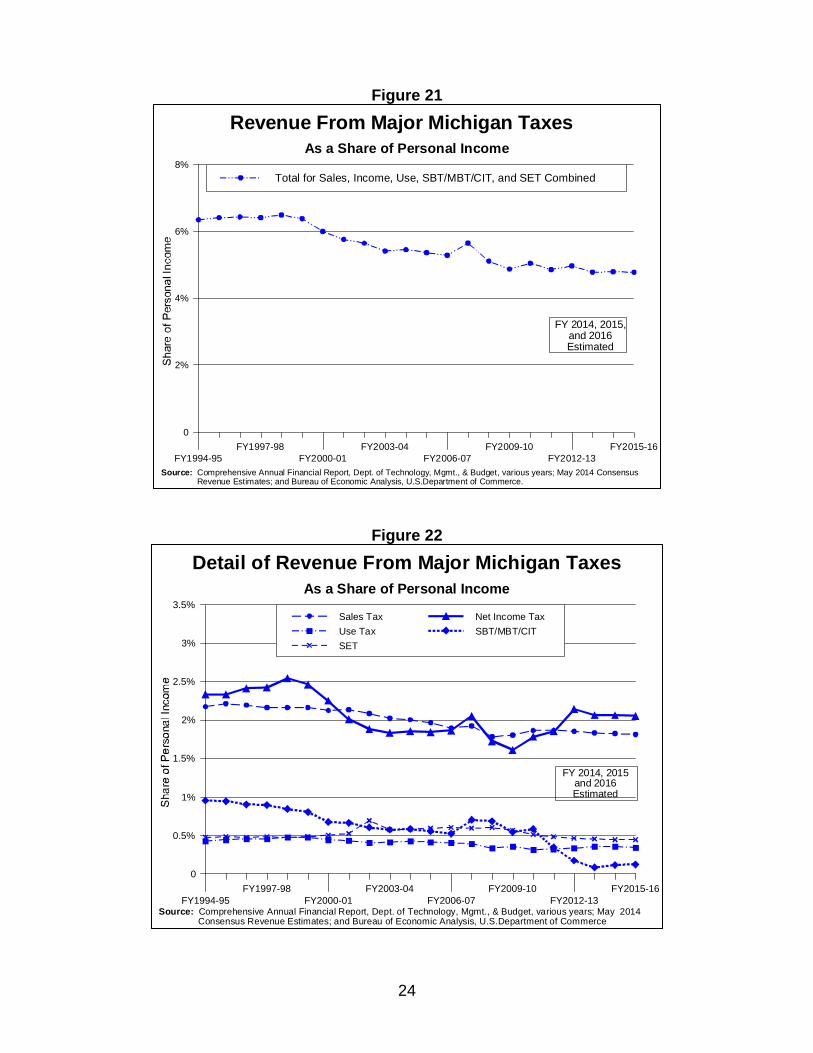
Figure 21
Figure 22
FY1994-95
FY1997-98
FY2000-01
FY2003-04
FY2006-07
FY2009-10
FY2012-13
FY2015-16
0
2%
4%
6%
8%
Total for Sales, Income, Use, SBT/MBT/CIT, and SET Combined
As a Share of Personal Income
Revenue From Major Michigan Taxes
Source: Comprehensive Annual Financial Report, Dept. of Technology, Mgmt., & Budget, various years; May 2014 Consensus Revenue Estimates; and Bureau of Economic Analysis, U.S.Department of Commerce.
FY 2014, 2015,and 2016Estimated
FY1994-95
FY1997-98
FY2000-01
FY2003-04
FY2006-07
FY2009-10
FY2012-13
FY2015-16
0
0.5%
1%
1.5%
2%
2.5%
3%
3.5%
Sales Tax Net Income Tax
Use Tax SBT/MBT/CIT
SET
As a Share of Personal Income
Detail of Revenue From Major Michigan Taxes
Source: Comprehensive Annual Financial Report, Dept. of Technology, Mgmt., & Budget, various years; May 2014 Consensus Revenue Estimates; and Bureau of Economic Analysis, U.S.Department of Commerce
FY 2014, 2015and 2016Estimated
25
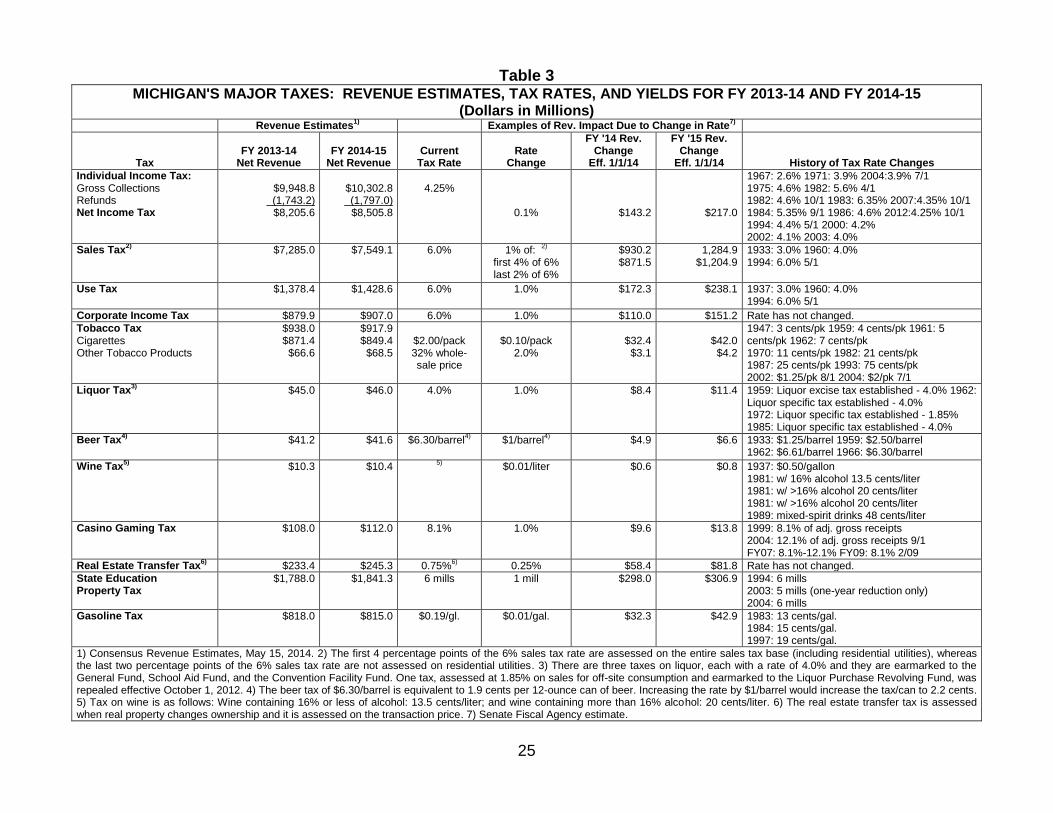
Table 3 MICHIGAN'S MAJOR TAXES: REVENUE ESTIMATES, TAX RATES, AND YIELDS FOR FY 2013-14 AND FY 2014-15
(Dollars in Millions) Revenue Estimates
1) Examples of Rev. Impact Due to Change in Rate
7)
Tax FY 2013-14
Net Revenue FY 2014-15
Net Revenue Current
Tax Rate Rate
Change
FY '14 Rev. Change
Eff. 1/1/14
FY '15 Rev. Change
Eff. 1/1/14 History of Tax Rate Changes
Individual Income Tax: Gross Collections Refunds Net Income Tax
$9,948.8
(1,743.2) $8,205.6
$10,302.8 (1,797.0)
$8,505.8
4.25%
0.1%
$143.2
$217.0
1967: 2.6% 1971: 3.9% 2004:3.9% 7/1 1975: 4.6% 1982: 5.6% 4/1 1982: 4.6% 10/1 1983: 6.35% 2007:4.35% 10/1 1984: 5.35% 9/1 1986: 4.6% 2012:4.25% 10/1 1994: 4.4% 5/1 2000: 4.2% 2002: 4.1% 2003: 4.0%
Sales Tax2)
$7,285.0 $7,549.1 6.0% 1% of:
2)
first 4% of 6% last 2% of 6%
$930.2 $871.5
1,284.9 $1,204.9
1933: 3.0% 1960: 4.0% 1994: 6.0% 5/1
Use Tax
$1,378.4 $1,428.6 6.0%
1.0% $172.3 $238.1 1937: 3.0% 1960: 4.0% 1994: 6.0% 5/1
Corporate Income Tax $879.9 $907.0 6.0% 1.0% $110.0 $151.2 Rate has not changed.
Tobacco Tax Cigarettes Other Tobacco Products
$938.0 $871.4 $66.6
$917.9 $849.4 $68.5
$2.00/pack 32% whole- sale price
$0.10/pack
2.0%
$32.4 $3.1
$42.0 $4.2
1947: 3 cents/pk 1959: 4 cents/pk 1961: 5 cents/pk 1962: 7 cents/pk 1970: 11 cents/pk 1982: 21 cents/pk 1987: 25 cents/pk 1993: 75 cents/pk 2002: $1.25/pk 8/1 2004: $2/pk 7/1
Liquor Tax3)
$45.0 $46.0 4.0% 1.0% $8.4 $11.4 1959: Liquor excise tax established - 4.0% 1962: Liquor specific tax established - 4.0% 1972: Liquor specific tax established - 1.85% 1985: Liquor specific tax established - 4.0%
Beer Tax4) $41.2 $41.6 $6.30/barrel
4) $1/barrel
4) $4.9 $6.6 1933: $1.25/barrel 1959: $2.50/barrel
1962: $6.61/barrel 1966: $6.30/barrel
Wine Tax5)
$10.3 $10.4
5)
$0.01/liter $0.6 $0.8 1937: $0.50/gallon
1981: w/ 16% alcohol 13.5 cents/liter 1981: w/ >16% alcohol 20 cents/liter 1981: w/ >16% alcohol 20 cents/liter 1989: mixed-spirit drinks 48 cents/liter
Casino Gaming Tax
$108.0 $112.0 8.1% 1.0% $9.6 $13.8 1999: 8.1% of adj. gross receipts 2004: 12.1% of adj. gross receipts 9/1 FY07: 8.1%-12.1% FY09: 8.1% 2/09
Real Estate Transfer Tax6) $233.4 $245.3 0.75%
6) 0.25% $58.4 $81.8 Rate has not changed.
State Education Property Tax
$1,788.0 $1,841.3 6 mills 1 mill $298.0 $306.9 1994: 6 mills 2003: 5 mills (one-year reduction only) 2004: 6 mills
Gasoline Tax
$818.0 $815.0 $0.19/gl. $0.01/gal. $32.3 $42.9 1983: 13 cents/gal. 1984: 15 cents/gal. 1997: 19 cents/gal.
1) Consensus Revenue Estimates, May 15, 2014. 2) The first 4 percentage points of the 6% sales tax rate are assessed on the entire sales tax base (including residential utilities), whereas the last two percentage points of the 6% sales tax rate are not assessed on residential utilities. 3) There are three taxes on liquor, each with a rate of 4.0% and they are earmarked to the General Fund, School Aid Fund, and the Convention Facility Fund. One tax, assessed at 1.85% on sales for off-site consumption and earmarked to the Liquor Purchase Revolving Fund, was repealed effective October 1, 2012. 4) The beer tax of $6.30/barrel is equivalent to 1.9 cents per 12-ounce can of beer. Increasing the rate by $1/barrel would increase the tax/can to 2.2 cents. 5) Tax on wine is as follows: Wine containing 16% or less of alcohol: 13.5 cents/liter; and wine containing more than 16% alcohol: 20 cents/liter. 6) The real estate transfer tax is assessed when real property changes ownership and it is assessed on the transaction price. 7) Senate Fiscal Agency estimate.
The Budget Process
27
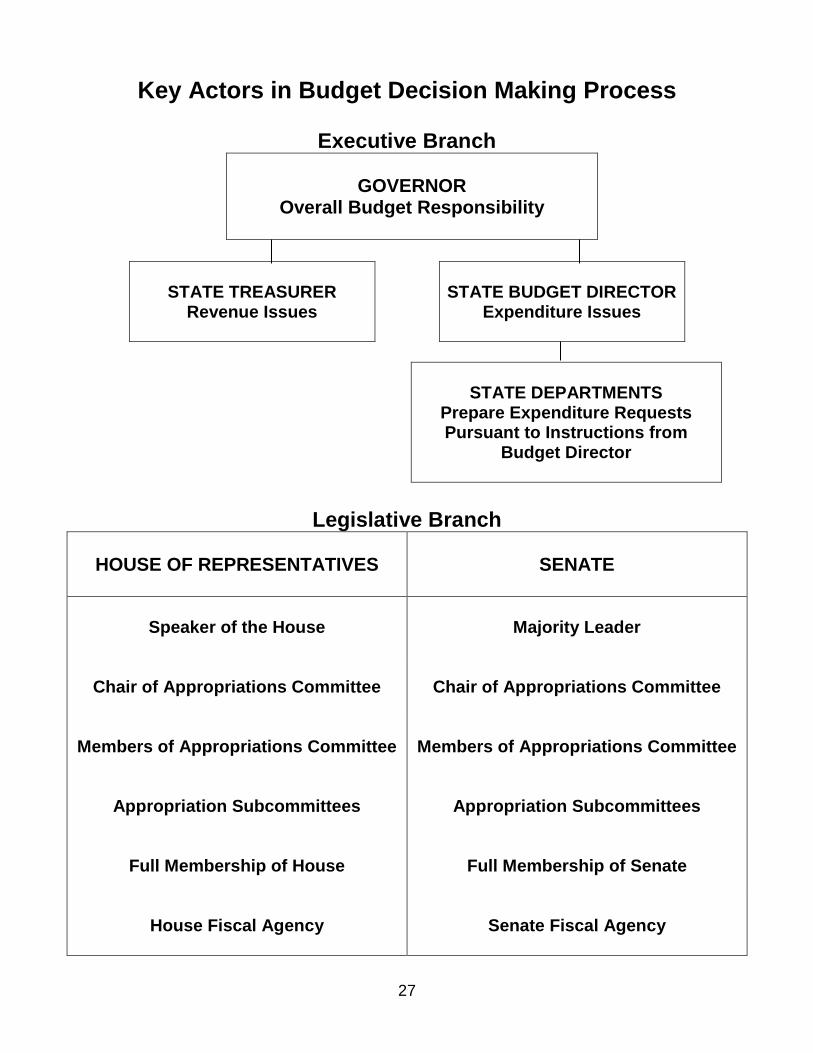
Key Actors in Budget Decision Making Process
Executive Branch
GOVERNOR Overall Budget Responsibility
STATE TREASURER Revenue Issues
STATE BUDGET DIRECTOR
Expenditure Issues
STATE DEPARTMENTS
Prepare Expenditure Requests Pursuant to Instructions from
Budget Director
Legislative Branch
HOUSE OF REPRESENTATIVES
SENATE
Speaker of the House
Majority Leader
Chair of Appropriations Committee
Chair of Appropriations Committee
Members of Appropriations Committee
Members of Appropriations Committee
Appropriation Subcommittees
Appropriation Subcommittees
Full Membership of House
Full Membership of Senate
House Fiscal Agency
Senate Fiscal Agency
28
Key Actors in Budget Decision Making Process
State Departments and Outside Interest Groups
Education Institutions
Units of Local Government
Nonprofit Associations
Multi-client Lobbyists
Single Issue Lobbyists
General Public
29
Preparation of Executive Budget
State Treasurer (Incoming $$$)
Revenue Estimates
Tax Policy
Cash Management
Debt Management
Budget Director (Outgoing $$$)
Issues Budget Directions
Reviews and Analyzes Agency Requests
Filters Requests from Outside Groups
Prepares Final Budget Documents
Oversees Legislative Budget Process for Governor
Management of Current Year Budget
30
Presentation of Executive Budget to the Legislature
Prescribed by Statute
Executive Press Releases
Joint Meeting of the House and Senate Appropriations Committee
o Budget Director Presentation
Documentation o Summaries
o Executive Budget Bills
o Line Item Detail
Legislative Budget Responsibilities
Consideration of Executive Budget
Adoption of Annual Appropriation Bills
Review of Governor's Line Item Vetoes
Monitoring and Oversight of Current Year Budget
31
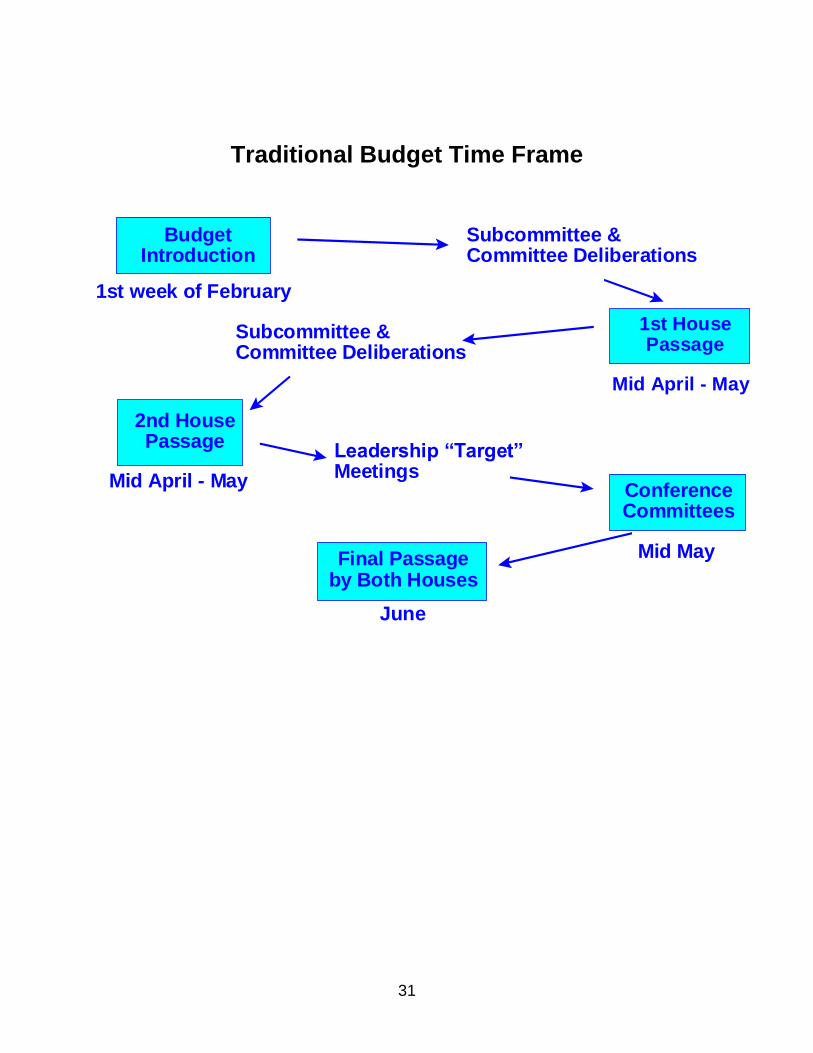
Traditional Budget Time Frame
BudgetIntroduction
Mid April - May
Mid April - MayConferenceCommittees
Mid MayFinal Passageby Both Houses
June
1st HousePassage
2nd HousePassage
1st week of February
Subcommittee &Committee Deliberations
Subcommittee &Committee Deliberations
Leadership “Target”Meetings
32
Mandated Budget Requirements and Restrictions State Budget Process Constitutional Requirements
Budget Submission Date (Sec. 18 of Article V)
Balanced Budget Requirement (Sec. 31 of Article IV)
Revenue Limit (Sec. 26 of Article IX)
State and Local Spending Split (Sec. 30 of Article IX)
Expenditure Limit (Sec. 28 of Article IX)
Appropriation Reductions (Sec. 20 of Article V)
Line Item Veto (Sec. 19 of Article V)
Limits on State General obligation Debt (Sec. 15 of Article IX)
Mandated Budget Requirements and Restrictions State Budget Process Statutory Requirements
Public Act 421 of 1984 provides the basic statutory framework for the State budget process. Some of the major provisions include:
Role of State Budget Director
Fiscal Year Period
Budget Submission Date
Consensus Revenue Estimating Conference
Counter-cyclical Budget and Economic Stabilization Fund
Operating Funds
Implementation of Constitutional Requirements
33
Mandated Budget Requirements and Restrictions Boilerplate Requirements
Intent language contained in appropriation bills is referred to as boilerplate. Boilerplate language is used to accomplish the following objectives:
Imposes Conditions on Appropriations
Reporting Requirements
Imposes Specific Spending Criteria
Specific Michigan Budget Practices
Several features of Michigan's budget process that result from historical practices impact on final budget decisions. These include:
Strong Executive Branch Influence
Strong Legislative Appropriations Committees
Numerous Appropriations Bills
Incremental Changes in Budget
Strong Threat of Line Item Veto
34
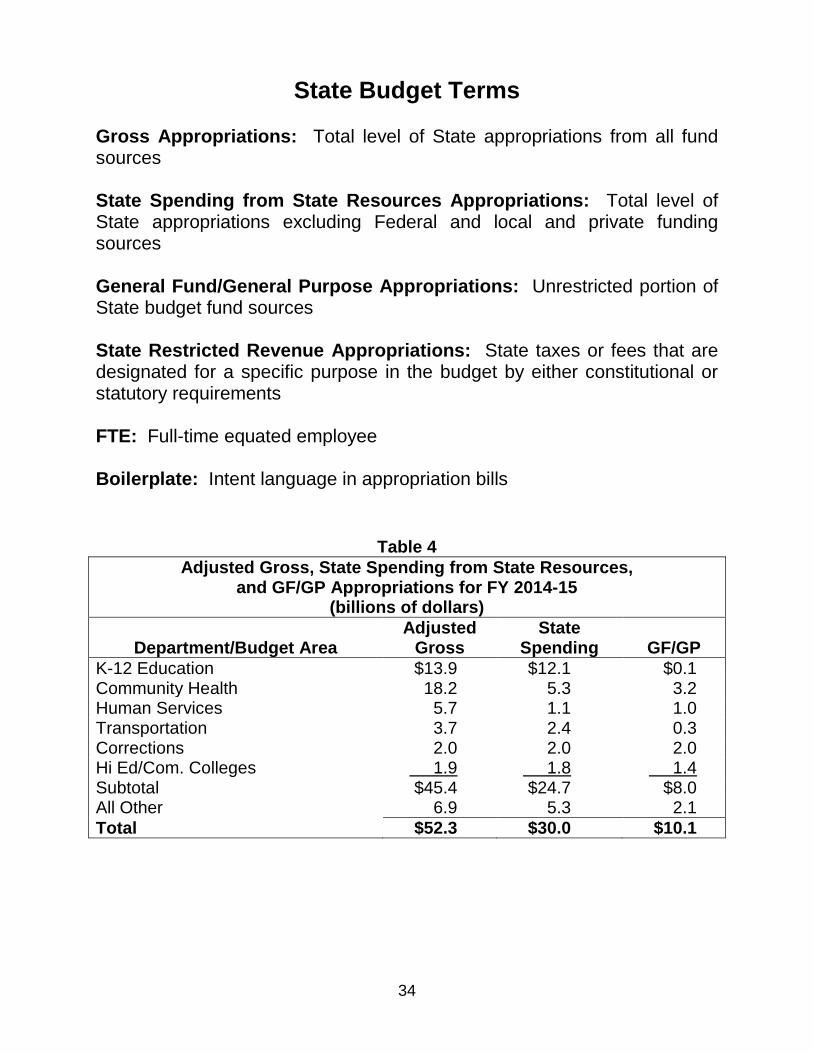
State Budget Terms
Gross Appropriations: Total level of State appropriations from all fund sources State Spending from State Resources Appropriations: Total level of State appropriations excluding Federal and local and private funding sources General Fund/General Purpose Appropriations: Unrestricted portion of State budget fund sources State Restricted Revenue Appropriations: State taxes or fees that are designated for a specific purpose in the budget by either constitutional or statutory requirements FTE: Full-time equated employee Boilerplate: Intent language in appropriation bills
Table 4
Adjusted Gross, State Spending from State Resources, and GF/GP Appropriations for FY 2014-15
(billions of dollars)
Department/Budget Area
Adjusted Gross
State Spending
GF/GP
K-12 Education $13.9 $12.1 $0.1 Community Health 18.2 5.3 3.2 Human Services 5.7 1.1 1.0 Transportation 3.7 2.4 0.3 Corrections 2.0 2.0 2.0 Hi Ed/Com. Colleges 1.9 1.8 1.4 Subtotal $45.4 $24.7 $8.0 All Other 6.9 5.3 2.1
Total $52.3 $30.0 $10.1

The State Budget FY 2014-15
36
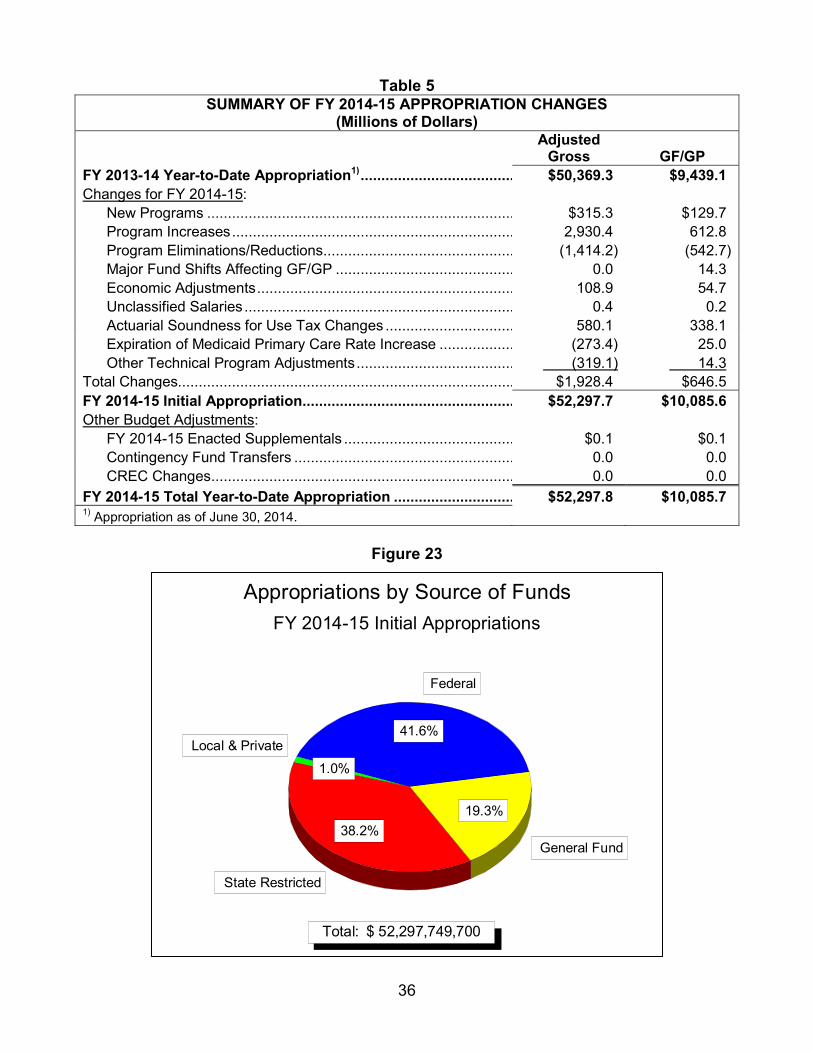
Table 5 SUMMARY OF FY 2014-15 APPROPRIATION CHANGES
(Millions of Dollars) Adjusted
Gross GF/GP FY 2013-14 Year-to-Date Appropriation1)..................................... $50,369.3 $9,439.1Changes for FY 2014-15: New Programs .......................................................................... $315.3 $129.7 Program Increases .................................................................... 2,930.4 612.8 Program Eliminations/Reductions .............................................. (1,414.2) (542.7) Major Fund Shifts Affecting GF/GP ........................................... 0.0 14.3 Economic Adjustments .............................................................. 108.9 54.7 Unclassified Salaries ................................................................. 0.4 0.2 Actuarial Soundness for Use Tax Changes ............................... 580.1 338.1 Expiration of Medicaid Primary Care Rate Increase .................. (273.4) 25.0 Other Technical Program Adjustments ...................................... (319.1) 14.3 Total Changes................................................................................. $1,928.4 $646.5 FY 2014-15 Initial Appropriation ................................................... $52,297.7 $10,085.6Other Budget Adjustments: FY 2014-15 Enacted Supplementals ......................................... $0.1 $0.1 Contingency Fund Transfers ..................................................... 0.0 0.0 CREC Changes ......................................................................... 0.0 0.0
FY 2014-15 Total Year-to-Date Appropriation ............................. $52,297.8 $10,085.71) Appropriation as of June 30, 2014.
Figure 23
Federal
41.6%Local & Private
1.0%
State Restricted
38.2%General Fund
19.3%
FY 2014-15 Initial Appropriations
Appropriations by Source of Funds
Total: $ 52,297,749,700
37
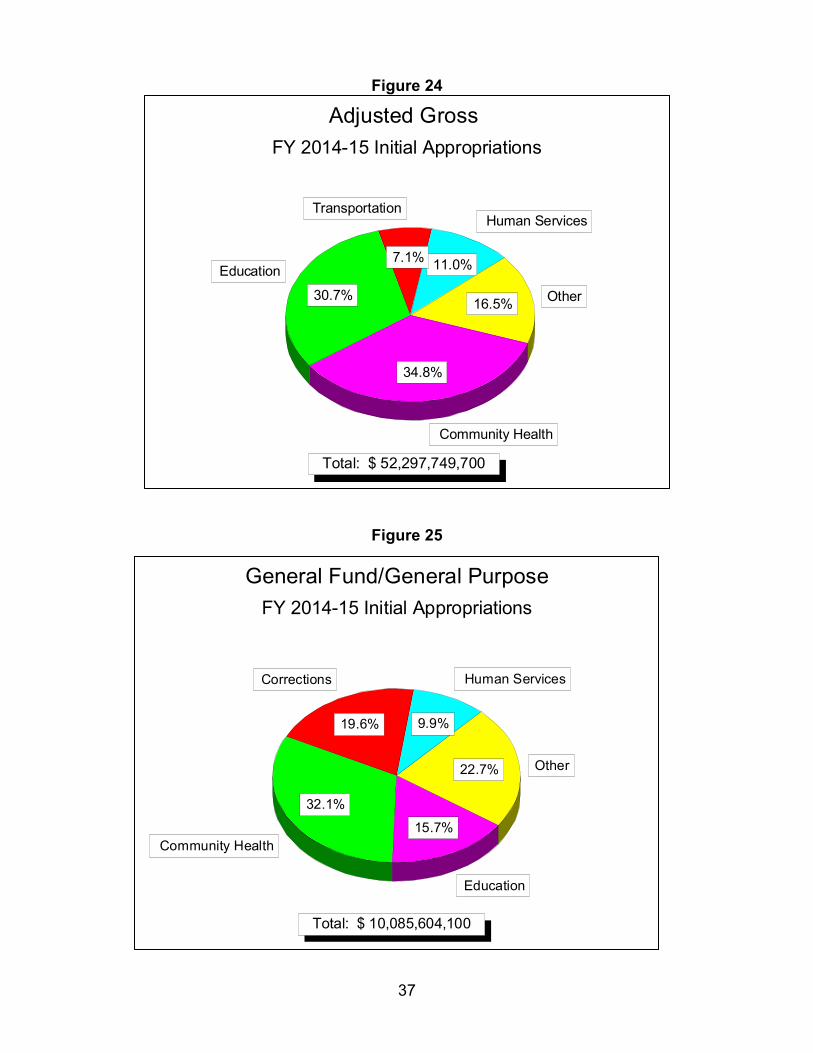
Figure 24
Figure 25
Human Services
11.0%
Transportation
7.1%Education
30.7%
Community Health
34.8%
Other16.5%
FY 2014-15 Initial Appropriations
Adjusted Gross
Total: $ 52,297,749,700
Human Services
9.9%
Corrections
19.6%
Community Health
32.1%
Education
15.7%
Other22.7%
FY 2014-15 Initial Appropriations
General Fund/General Purpose
Total: $ 10,085,604,100
38
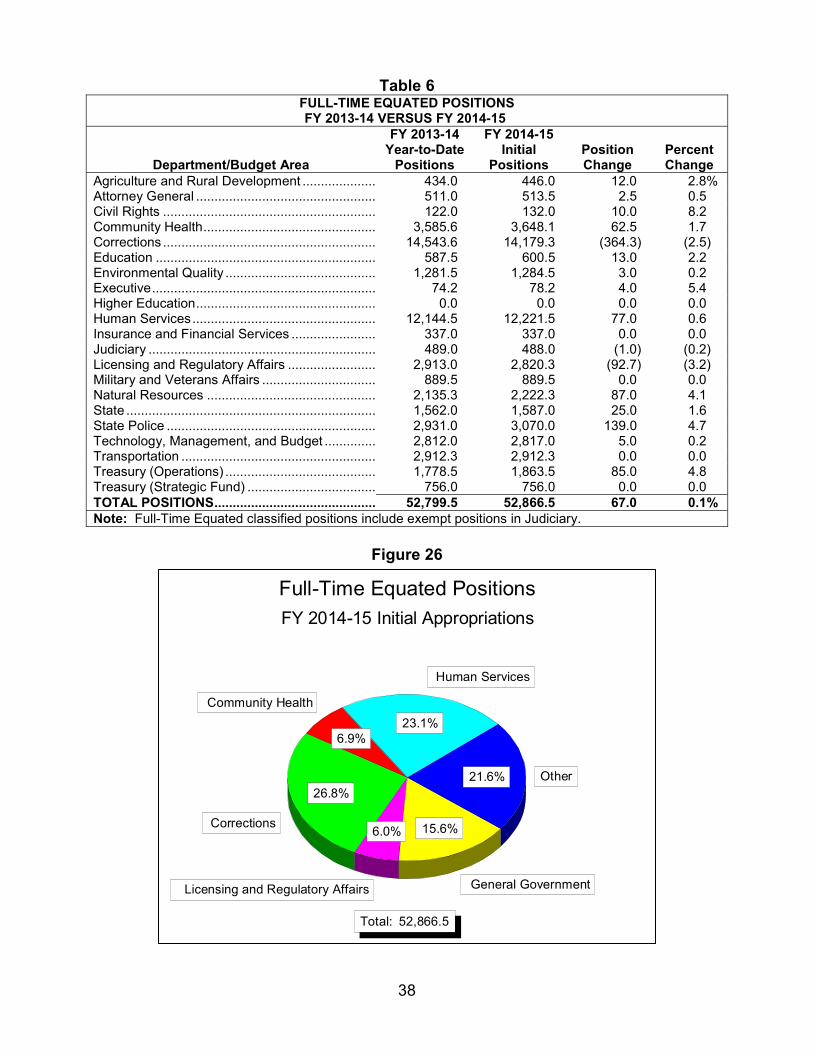
Table 6 FULL-TIME EQUATED POSITIONSFY 2013-14 VERSUS FY 2014-15
Department/Budget Area
FY 2013-14 Year-to-Date
Positions
FY 2014-15 Initial
PositionsPosition Change
Percent Change
Agriculture and Rural Development .................... 434.0 446.0 12.0 2.8% Attorney General ................................................. 511.0 513.5 2.5 0.5 Civil Rights .......................................................... 122.0 132.0 10.0 8.2 Community Health ............................................... 3,585.6 3,648.1 62.5 1.7 Corrections .......................................................... 14,543.6 14,179.3 (364.3) (2.5) Education ............................................................ 587.5 600.5 13.0 2.2 Environmental Quality ......................................... 1,281.5 1,284.5 3.0 0.2 Executive ............................................................. 74.2 78.2 4.0 5.4 Higher Education ................................................. 0.0 0.0 0.0 0.0 Human Services .................................................. 12,144.5 12,221.5 77.0 0.6 Insurance and Financial Services ....................... 337.0 337.0 0.0 0.0 Judiciary .............................................................. 489.0 488.0 (1.0) (0.2) Licensing and Regulatory Affairs ........................ 2,913.0 2,820.3 (92.7) (3.2) Military and Veterans Affairs ............................... 889.5 889.5 0.0 0.0 Natural Resources .............................................. 2,135.3 2,222.3 87.0 4.1 State .................................................................... 1,562.0 1,587.0 25.0 1.6 State Police ......................................................... 2,931.0 3,070.0 139.0 4.7 Technology, Management, and Budget .............. 2,812.0 2,817.0 5.0 0.2 Transportation ..................................................... 2,912.3 2,912.3 0.0 0.0 Treasury (Operations) ......................................... 1,778.5 1,863.5 85.0 4.8 Treasury (Strategic Fund) ................................... 756.0 756.0 0.0 0.0 TOTAL POSITIONS ............................................ 52,799.5 52,866.5 67.0 0.1% Note: Full-Time Equated classified positions include exempt positions in Judiciary.
Figure 26
Human Services
23.1%
Community Health
6.9%
Corrections
26.8%
Licensing and Regulatory Affairs
6.0%
General Government
15.6%
Other21.6%
FY 2014-15 Initial Appropriations
Full-Time Equated Positions
Total: 52,866.5
39
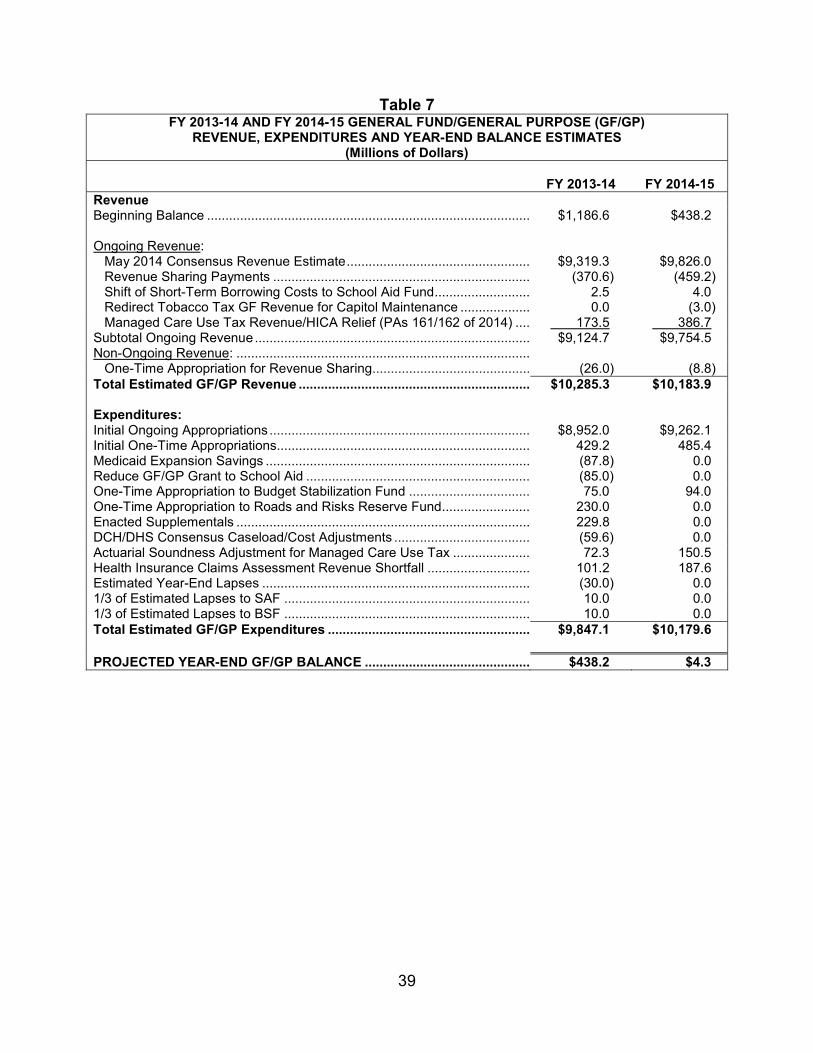
Table 7 FY 2013-14 AND FY 2014-15 GENERAL FUND/GENERAL PURPOSE (GF/GP)
REVENUE, EXPENDITURES AND YEAR-END BALANCE ESTIMATES (Millions of Dollars)
FY 2013-14 FY 2014-15 Revenue Beginning Balance ........................................................................................ $1,186.6 $438.2
Ongoing Revenue: May 2014 Consensus Revenue Estimate .................................................. $9,319.3 $9,826.0 Revenue Sharing Payments ...................................................................... (370.6) (459.2) Shift of Short-Term Borrowing Costs to School Aid Fund .......................... 2.5 4.0 Redirect Tobacco Tax GF Revenue for Capitol Maintenance ................... 0.0 (3.0) Managed Care Use Tax Revenue/HICA Relief (PAs 161/162 of 2014) .... 173.5 386.7 Subtotal Ongoing Revenue ........................................................................... $9,124.7 $9,754.5 Non-Ongoing Revenue: ................................................................................ One-Time Appropriation for Revenue Sharing........................................... (26.0) (8.8) Total Estimated GF/GP Revenue ............................................................... $10,285.3 $10,183.9
Expenditures: Initial Ongoing Appropriations ....................................................................... $8,952.0 $9,262.1 Initial One-Time Appropriations..................................................................... 429.2 485.4 Medicaid Expansion Savings ........................................................................ (87.8) 0.0 Reduce GF/GP Grant to School Aid ............................................................. (85.0) 0.0 One-Time Appropriation to Budget Stabilization Fund ................................. 75.0 94.0 One-Time Appropriation to Roads and Risks Reserve Fund ........................ 230.0 0.0 Enacted Supplementals ................................................................................ 229.8 0.0 DCH/DHS Consensus Caseload/Cost Adjustments ..................................... (59.6) 0.0 Actuarial Soundness Adjustment for Managed Care Use Tax ..................... 72.3 150.5 Health Insurance Claims Assessment Revenue Shortfall ............................ 101.2 187.6 Estimated Year-End Lapses ......................................................................... (30.0) 0.0 1/3 of Estimated Lapses to SAF ................................................................... 10.0 0.0 1/3 of Estimated Lapses to BSF ................................................................... 10.0 0.0 Total Estimated GF/GP Expenditures ....................................................... $9,847.1 $10,179.6
PROJECTED YEAR-END GF/GP BALANCE ............................................. $438.2 $4.3
40
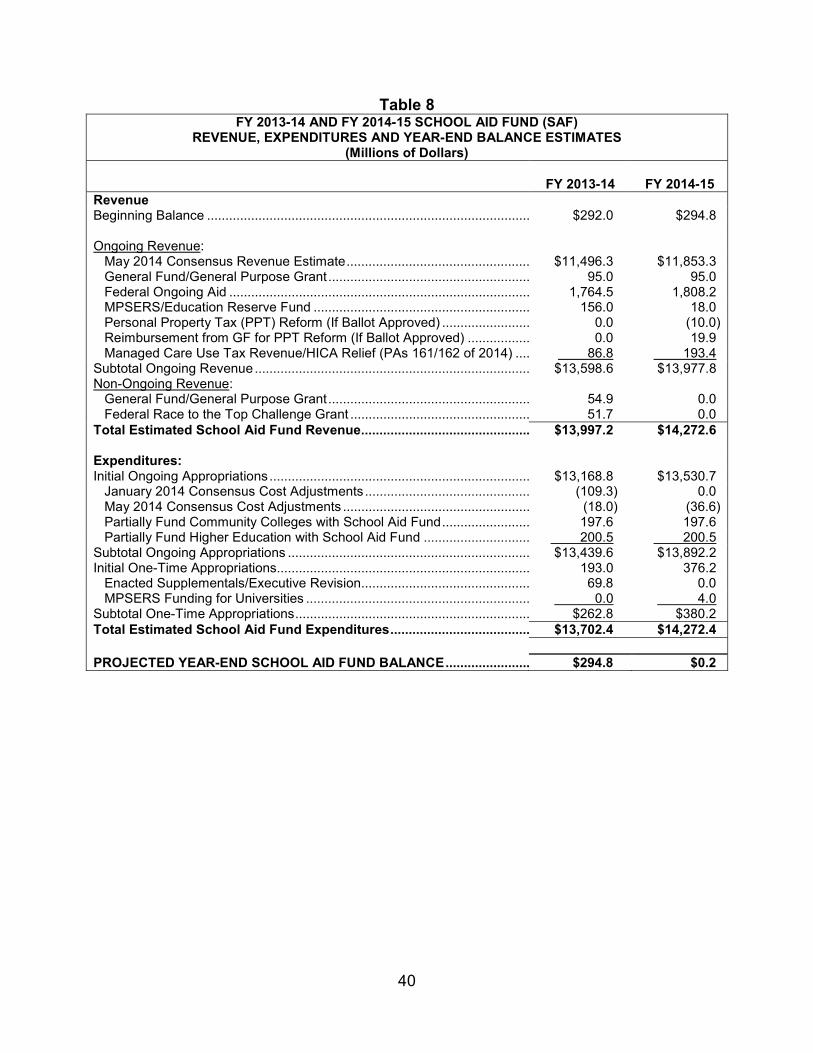
Table 8 FY 2013-14 AND FY 2014-15 SCHOOL AID FUND (SAF)
REVENUE, EXPENDITURES AND YEAR-END BALANCE ESTIMATES (Millions of Dollars)
FY 2013-14 FY 2014-15 Revenue Beginning Balance ........................................................................................ $292.0 $294.8
Ongoing Revenue: May 2014 Consensus Revenue Estimate .................................................. $11,496.3 $11,853.3 General Fund/General Purpose Grant ....................................................... 95.0 95.0 Federal Ongoing Aid .................................................................................. 1,764.5 1,808.2 MPSERS/Education Reserve Fund ........................................................... 156.0 18.0 Personal Property Tax (PPT) Reform (If Ballot Approved) ........................ 0.0 (10.0) Reimbursement from GF for PPT Reform (If Ballot Approved) ................. 0.0 19.9 Managed Care Use Tax Revenue/HICA Relief (PAs 161/162 of 2014) .... 86.8 193.4 Subtotal Ongoing Revenue ........................................................................... $13,598.6 $13,977.8 Non-Ongoing Revenue: General Fund/General Purpose Grant ....................................................... 54.9 0.0 Federal Race to the Top Challenge Grant ................................................. 51.7 0.0 Total Estimated School Aid Fund Revenue.............................................. $13,997.2 $14,272.6
Expenditures: Initial Ongoing Appropriations ....................................................................... $13,168.8 $13,530.7 January 2014 Consensus Cost Adjustments ............................................. (109.3) 0.0 May 2014 Consensus Cost Adjustments ................................................... (18.0) (36.6) Partially Fund Community Colleges with School Aid Fund ........................ 197.6 197.6 Partially Fund Higher Education with School Aid Fund ............................. 200.5 200.5 Subtotal Ongoing Appropriations .................................................................. $13,439.6 $13,892.2 Initial One-Time Appropriations..................................................................... 193.0 376.2 Enacted Supplementals/Executive Revision.............................................. 69.8 0.0 MPSERS Funding for Universities ............................................................. 0.0 4.0 Subtotal One-Time Appropriations ................................................................ $262.8 $380.2 Total Estimated School Aid Fund Expenditures...................................... $13,702.4 $14,272.4 PROJECTED YEAR-END SCHOOL AID FUND BALANCE....................... $294.8 $0.2
41
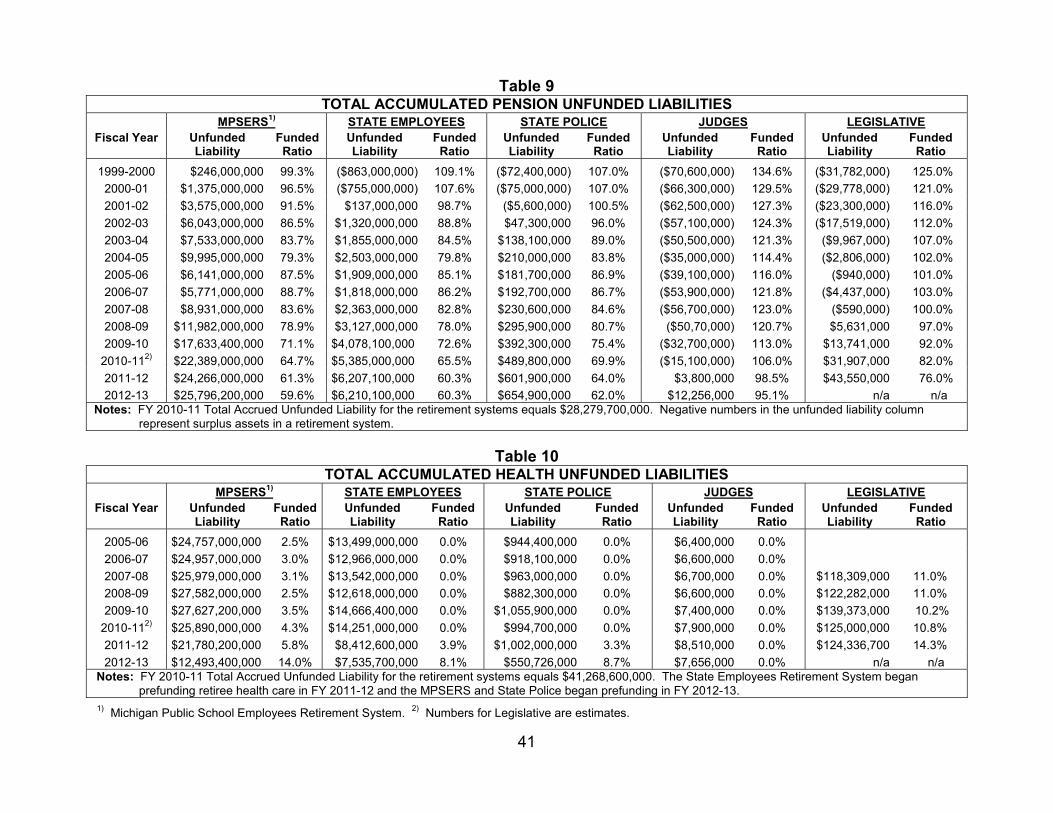
Table 9 TOTAL ACCUMULATED PENSION UNFUNDED LIABILITIES
MPSERS1) STATE EMPLOYEES STATE POLICE JUDGES LEGISLATIVEFiscal Year Unfunded
Liability Funded
Ratio Unfunded Liability
Funded Ratio
Unfunded Liability
Funded Ratio
Unfunded Liability
Funded Ratio
Unfunded Liability
Funded Ratio
1999-2000 $246,000,000 99.3% ($863,000,000) 109.1% ($72,400,000) 107.0% ($70,600,000) 134.6% ($31,782,000) 125.0%
2000-01 $1,375,000,000 96.5% ($755,000,000) 107.6% ($75,000,000) 107.0% ($66,300,000) 129.5% ($29,778,000) 121.0%
2001-02 $3,575,000,000 91.5% $137,000,000 98.7% ($5,600,000) 100.5% ($62,500,000) 127.3% ($23,300,000) 116.0%
2002-03 $6,043,000,000 86.5% $1,320,000,000 88.8% $47,300,000 96.0% ($57,100,000) 124.3% ($17,519,000) 112.0%
2003-04 $7,533,000,000 83.7% $1,855,000,000 84.5% $138,100,000 89.0% ($50,500,000) 121.3% ($9,967,000) 107.0%
2004-05 $9,995,000,000 79.3% $2,503,000,000 79.8% $210,000,000 83.8% ($35,000,000) 114.4% ($2,806,000) 102.0%
2005-06 $6,141,000,000 87.5% $1,909,000,000 85.1% $181,700,000 86.9% ($39,100,000) 116.0% ($940,000) 101.0%
2006-07 $5,771,000,000 88.7% $1,818,000,000 86.2% $192,700,000 86.7% ($53,900,000) 121.8% ($4,437,000) 103.0%
2007-08 $8,931,000,000 83.6% $2,363,000,000 82.8% $230,600,000 84.6% ($56,700,000) 123.0% ($590,000) 100.0%
2008-09 $11,982,000,000 78.9% $3,127,000,000 78.0% $295,900,000 80.7% ($50,70,000) 120.7% $5,631,000 97.0%
2009-10 $17,633,400,000 71.1% $4,078,100,000 72.6% $392,300,000 75.4% ($32,700,000) 113.0% $13,741,000 92.0%
2010-112) $22,389,000,000 64.7% $5,385,000,000 65.5% $489,800,000 69.9% ($15,100,000) 106.0% $31,907,000 82.0%
2011-12 $24,266,000,000 61.3% $6,207,100,000 60.3% $601,900,000 64.0% $3,800,000 98.5% $43,550,000 76.0%
2012-13 $25,796,200,000 59.6% $6,210,100,000 60.3% $654,900,000 62.0% $12,256,000 95.1% n/a n/a Notes: FY 2010-11 Total Accrued Unfunded Liability for the retirement systems equals $28,279,700,000. Negative numbers in the unfunded liability column
represent surplus assets in a retirement system.
Table 10 TOTAL ACCUMULATED HEALTH UNFUNDED LIABILITIES
MPSERS1) STATE EMPLOYEES STATE POLICE JUDGES LEGISLATIVEFiscal Year Unfunded
Liability Funded
Ratio Unfunded Liability
Funded Ratio
Unfunded Liability
Funded Ratio
Unfunded Liability
Funded Ratio
Unfunded Liability
Funded Ratio
2005-06 $24,757,000,000 2.5% $13,499,000,000 0.0% $944,400,000 0.0% $6,400,000 0.0%
2006-07 $24,957,000,000 3.0% $12,966,000,000 0.0% $918,100,000 0.0% $6,600,000 0.0%
2007-08 $25,979,000,000 3.1% $13,542,000,000 0.0% $963,000,000 0.0% $6,700,000 0.0% $118,309,000 11.0%
2008-09 $27,582,000,000 2.5% $12,618,000,000 0.0% $882,300,000 0.0% $6,600,000 0.0% $122,282,000 11.0%
2009-10 $27,627,200,000 3.5% $14,666,400,000 0.0% $1,055,900,000 0.0% $7,400,000 0.0% $139,373,000 10.2%
2010-112) $25,890,000,000 4.3% $14,251,000,000 0.0% $994,700,000 0.0% $7,900,000 0.0% $125,000,000 10.8%
2011-12 $21,780,200,000 5.8% $8,412,600,000 3.9% $1,002,000,000 3.3% $8,510,000 0.0% $124,336,700 14.3%
2012-13 $12,493,400,000 14.0% $7,535,700,000 8.1% $550,726,000 8.7% $7,656,000 0.0% n/a n/a Notes: FY 2010-11 Total Accrued Unfunded Liability for the retirement systems equals $41,268,600,000. The State Employees Retirement System began
prefunding retiree health care in FY 2011-12 and the MPSERS and State Police began prefunding in FY 2012-13.
1) Michigan Public School Employees Retirement System. 2) Numbers for Legislative are estimates.
Recent State Appropriation History
43
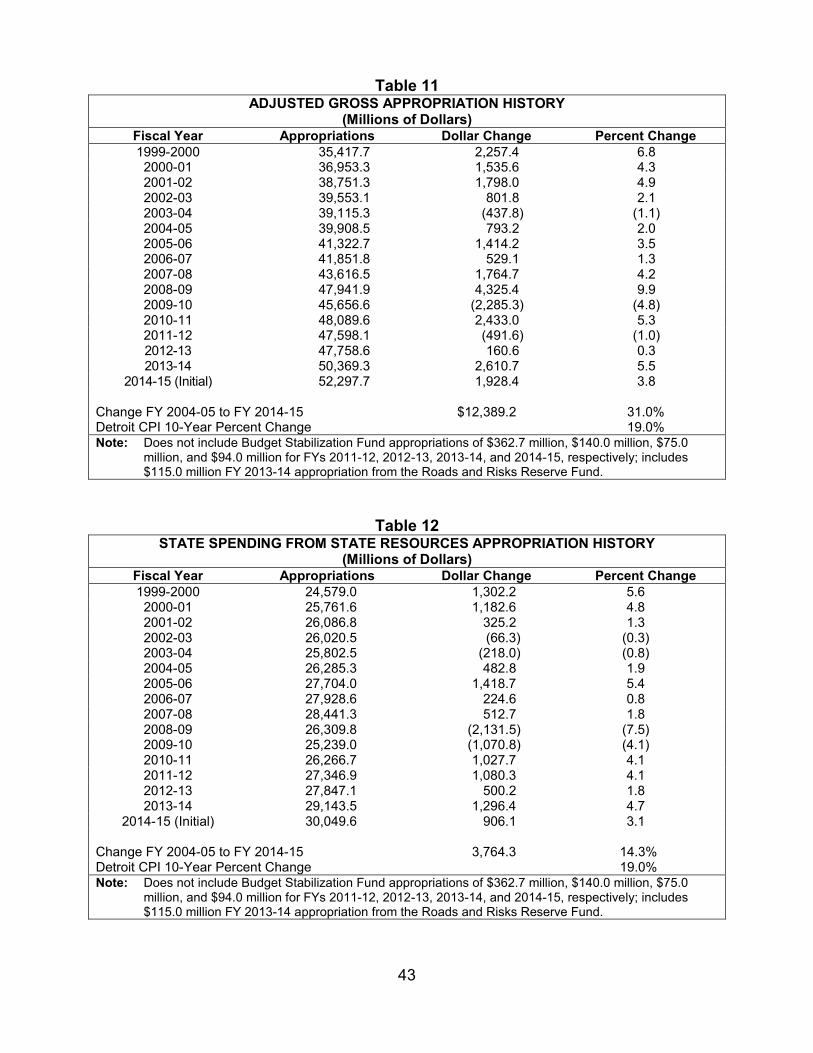
Table 11 ADJUSTED GROSS APPROPRIATION HISTORY
(Millions of Dollars) Fiscal Year Appropriations Dollar Change Percent Change1999-2000 35,417.7 2,257.4 6.8 2000-01 36,953.3 1,535.6 4.3 2001-02 38,751.3 1,798.0 4.9 2002-03 39,553.1 801.8 2.1 2003-04 39,115.3 (437.8) (1.1) 2004-05 39,908.5 793.2 2.0 2005-06 41,322.7 1,414.2 3.5 2006-07 41,851.8 529.1 1.3 2007-08 43,616.5 1,764.7 4.2 2008-09 47,941.9 4,325.4 9.9 2009-10 45,656.6 (2,285.3) (4.8) 2010-11 48,089.6 2,433.0 5.3 2011-12 47,598.1 (491.6) (1.0) 2012-13 47,758.6 160.6 0.3 2013-14 50,369.3 2,610.7 5.5
2014-15 (Initial) 52,297.7 1,928.4 3.8
Change FY 2004-05 to FY 2014-15 $12,389.2 31.0% Detroit CPI 10-Year Percent Change 19.0% Note: Does not include Budget Stabilization Fund appropriations of $362.7 million, $140.0 million, $75.0
million, and $94.0 million for FYs 2011-12, 2012-13, 2013-14, and 2014-15, respectively; includes $115.0 million FY 2013-14 appropriation from the Roads and Risks Reserve Fund.
Table 12 STATE SPENDING FROM STATE RESOURCES APPROPRIATION HISTORY
(Millions of Dollars) Fiscal Year Appropriations Dollar Change Percent Change 1999-2000 24,579.0 1,302.2 5.6 2000-01 25,761.6 1,182.6 4.8 2001-02 26,086.8 325.2 1.3 2002-03 26,020.5 (66.3) (0.3) 2003-04 25,802.5 (218.0) (0.8) 2004-05 26,285.3 482.8 1.9 2005-06 27,704.0 1,418.7 5.4 2006-07 27,928.6 224.6 0.8 2007-08 28,441.3 512.7 1.8 2008-09 26,309.8 (2,131.5) (7.5) 2009-10 25,239.0 (1,070.8) (4.1) 2010-11 26,266.7 1,027.7 4.1 2011-12 27,346.9 1,080.3 4.1 2012-13 27,847.1 500.2 1.8 2013-14 29,143.5 1,296.4 4.7
2014-15 (Initial) 30,049.6 906.1 3.1
Change FY 2004-05 to FY 2014-15 3,764.3 14.3% Detroit CPI 10-Year Percent Change 19.0% Note: Does not include Budget Stabilization Fund appropriations of $362.7 million, $140.0 million, $75.0
million, and $94.0 million for FYs 2011-12, 2012-13, 2013-14, and 2014-15, respectively; includes $115.0 million FY 2013-14 appropriation from the Roads and Risks Reserve Fund.
44
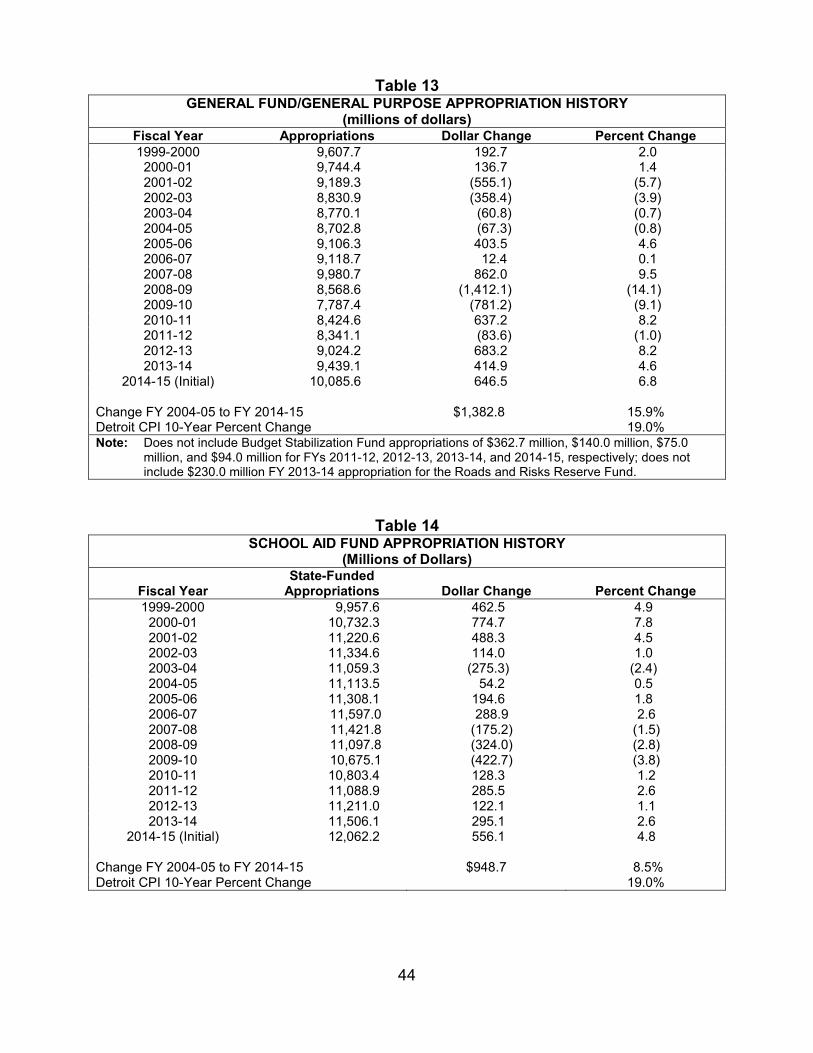
Table 13 GENERAL FUND/GENERAL PURPOSE APPROPRIATION HISTORY
(millions of dollars) Fiscal Year Appropriations Dollar Change Percent Change1999-2000 9,607.7 192.7 2.0 2000-01 9,744.4 136.7 1.4 2001-02 9,189.3 (555.1) (5.7) 2002-03 8,830.9 (358.4) (3.9) 2003-04 8,770.1 (60.8) (0.7) 2004-05 8,702.8 (67.3) (0.8) 2005-06 9,106.3 403.5 4.6 2006-07 9,118.7 12.4 0.1 2007-08 9,980.7 862.0 9.5 2008-09 8,568.6 (1,412.1) (14.1) 2009-10 7,787.4 (781.2) (9.1) 2010-11 8,424.6 637.2 8.2 2011-12 8,341.1 (83.6) (1.0) 2012-13 9,024.2 683.2 8.2 2013-14 9,439.1 414.9 4.6
2014-15 (Initial) 10,085.6 646.5 6.8
Change FY 2004-05 to FY 2014-15 $1,382.8 15.9% Detroit CPI 10-Year Percent Change 19.0% Note: Does not include Budget Stabilization Fund appropriations of $362.7 million, $140.0 million, $75.0
million, and $94.0 million for FYs 2011-12, 2012-13, 2013-14, and 2014-15, respectively; does not include $230.0 million FY 2013-14 appropriation for the Roads and Risks Reserve Fund.
Table 14 SCHOOL AID FUND APPROPRIATION HISTORY
(Millions of Dollars)
Fiscal Year State-Funded
Appropriations Dollar Change
Percent Change 1999-2000 9,957.6 462.5 4.9
2000-01 10,732.3 774.7 7.8 2001-02 11,220.6 488.3 4.5 2002-03 11,334.6 114.0 1.0 2003-04 11,059.3 (275.3) (2.4) 2004-05 11,113.5 54.2 0.5 2005-06 11,308.1 194.6 1.8 2006-07 11,597.0 288.9 2.6 2007-08 11,421.8 (175.2) (1.5) 2008-09 11,097.8 (324.0) (2.8) 2009-10 10,675.1 (422.7) (3.8) 2010-11 10,803.4 128.3 1.2 2011-12 11,088.9 285.5 2.6 2012-13 11,211.0 122.1 1.1 2013-14 11,506.1 295.1 2.6
2014-15 (Initial) 12,062.2 556.1 4.8
Change FY 2004-05 to FY 2014-15 $948.7 8.5% Detroit CPI 10-Year Percent Change 19.0%
45
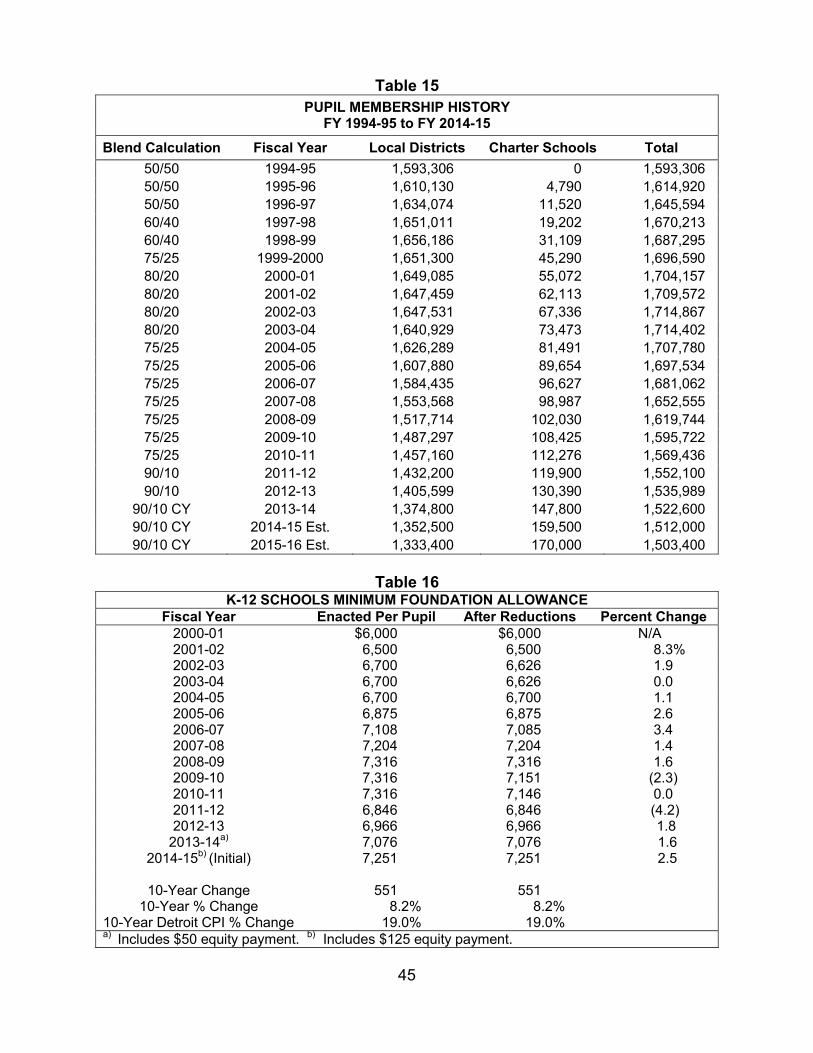
Table 15 PUPIL MEMBERSHIP HISTORY
FY 1994-95 to FY 2014-15
Blend Calculation Fiscal Year Local Districts Charter Schools Total
50/50 1994-95 1,593,306 0 1,593,306 50/50 1995-96 1,610,130 4,790 1,614,920 50/50 1996-97 1,634,074 11,520 1,645,594 60/40 1997-98 1,651,011 19,202 1,670,213 60/40 1998-99 1,656,186 31,109 1,687,295 75/25 1999-2000 1,651,300 45,290 1,696,590 80/20 2000-01 1,649,085 55,072 1,704,157 80/20 2001-02 1,647,459 62,113 1,709,572 80/20 2002-03 1,647,531 67,336 1,714,867 80/20 2003-04 1,640,929 73,473 1,714,402 75/25 2004-05 1,626,289 81,491 1,707,780 75/25 2005-06 1,607,880 89,654 1,697,534 75/25 2006-07 1,584,435 96,627 1,681,062 75/25 2007-08 1,553,568 98,987 1,652,555 75/25 2008-09 1,517,714 102,030 1,619,744 75/25 2009-10 1,487,297 108,425 1,595,722 75/25 2010-11 1,457,160 112,276 1,569,436 90/10 2011-12 1,432,200 119,900 1,552,100 90/10 2012-13 1,405,599 130,390 1,535,989
90/10 CY 2013-14 1,374,800 147,800 1,522,600 90/10 CY 2014-15 Est. 1,352,500 159,500 1,512,000 90/10 CY 2015-16 Est. 1,333,400 170,000 1,503,400
Table 16
K-12 SCHOOLS MINIMUM FOUNDATION ALLOWANCE Fiscal Year Enacted Per Pupil After Reductions Percent Change
2000-01 $6,000 $6,000 N/A 2001-02 6,500 6,500 8.3%2002-03 6,700 6,626 1.9 2003-04 6,700 6,626 0.02004-05 6,700 6,700 1.1 2005-06 6,875 6,875 2.6 2006-07 7,108 7,085 3.42007-08 7,204 7,204 1.4 2008-09 7,316 7,316 1.62009-10 7,316 7,151 (2.3) 2010-11 7,316 7,146 0.0 2011-12 6,846 6,846 (4.2)2012-13 6,966 6,966 1.8
2013-14a) 7,076 7,076 1.6 2014-15b) (Initial) 7,251 7,251 2.5
10-Year Change 551 551
10-Year % Change 8.2% 8.2% 10-Year Detroit CPI % Change 19.0% 19.0% a) Includes $50 equity payment. b) Includes $125 equity payment.
46
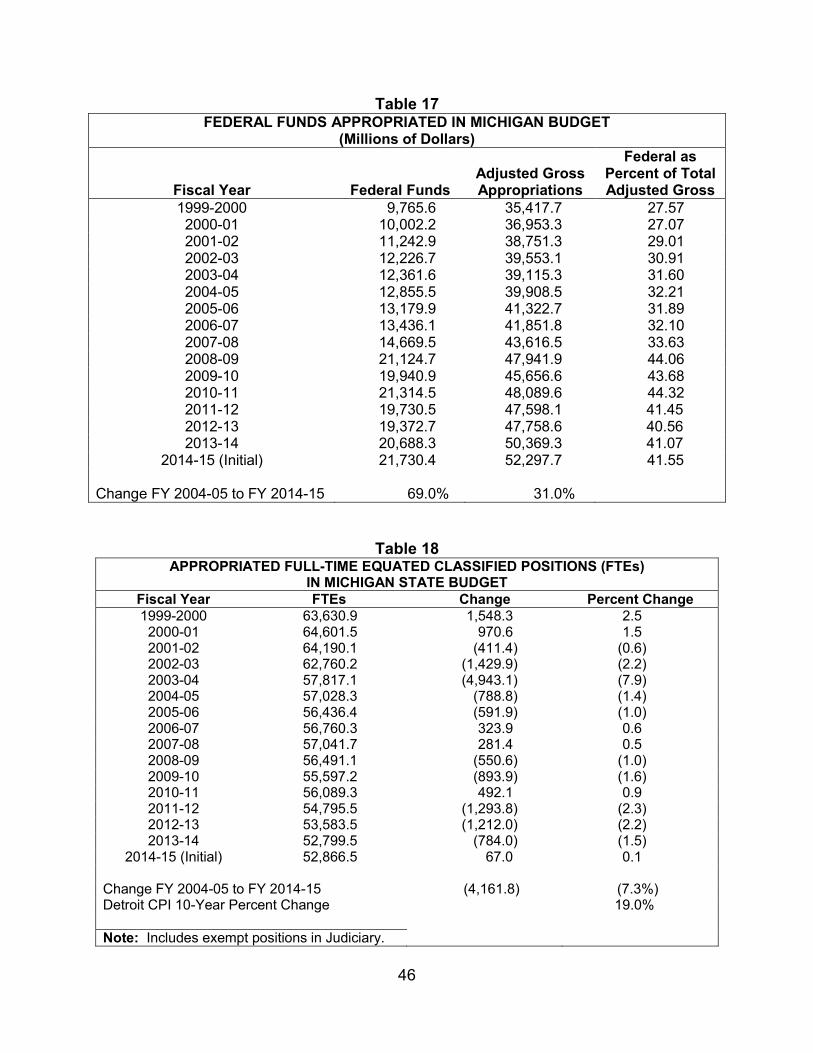
Table 17
FEDERAL FUNDS APPROPRIATED IN MICHIGAN BUDGET (Millions of Dollars)
Fiscal Year Federal Funds Adjusted Gross Appropriations
Federal as Percent of Total Adjusted Gross
1999-2000 9,765.6 35,417.7 27.57 2000-01 10,002.2 36,953.3 27.07 2001-02 11,242.9 38,751.3 29.01 2002-03 12,226.7 39,553.1 30.91 2003-04 12,361.6 39,115.3 31.60 2004-05 12,855.5 39,908.5 32.21 2005-06 13,179.9 41,322.7 31.89 2006-07 13,436.1 41,851.8 32.10 2007-08 14,669.5 43,616.5 33.63 2008-09 21,124.7 47,941.9 44.06 2009-10 19,940.9 45,656.6 43.68 2010-11 21,314.5 48,089.6 44.32 2011-12 19,730.5 47,598.1 41.45 2012-13 19,372.7 47,758.6 40.56 2013-14 20,688.3 50,369.3 41.07
2014-15 (Initial) 21,730.4 52,297.7 41.55 Change FY 2004-05 to FY 2014-15 69.0% 31.0%
Table 18 APPROPRIATED FULL-TIME EQUATED CLASSIFIED POSITIONS (FTEs)
IN MICHIGAN STATE BUDGET Fiscal Year FTEs Change Percent Change1999-2000 63,630.9 1,548.3 2.5
2000-01 64,601.5 970.6 1.5 2001-02 64,190.1 (411.4) (0.6) 2002-03 62,760.2 (1,429.9) (2.2) 2003-04 57,817.1 (4,943.1) (7.9) 2004-05 57,028.3 (788.8) (1.4) 2005-06 56,436.4 (591.9) (1.0) 2006-07 56,760.3 323.9 0.6 2007-08 57,041.7 281.4 0.5 2008-09 56,491.1 (550.6) (1.0) 2009-10 55,597.2 (893.9) (1.6) 2010-11 56,089.3 492.1 0.9 2011-12 54,795.5 (1,293.8) (2.3) 2012-13 53,583.5 (1,212.0) (2.2) 2013-14 52,799.5 (784.0) (1.5)
2014-15 (Initial) 52,866.5 67.0 0.1
Change FY 2004-05 to FY 2014-15 (4,161.8) (7.3%) Detroit CPI 10-Year Percent Change 19.0% Note: Includes exempt positions in Judiciary.
47
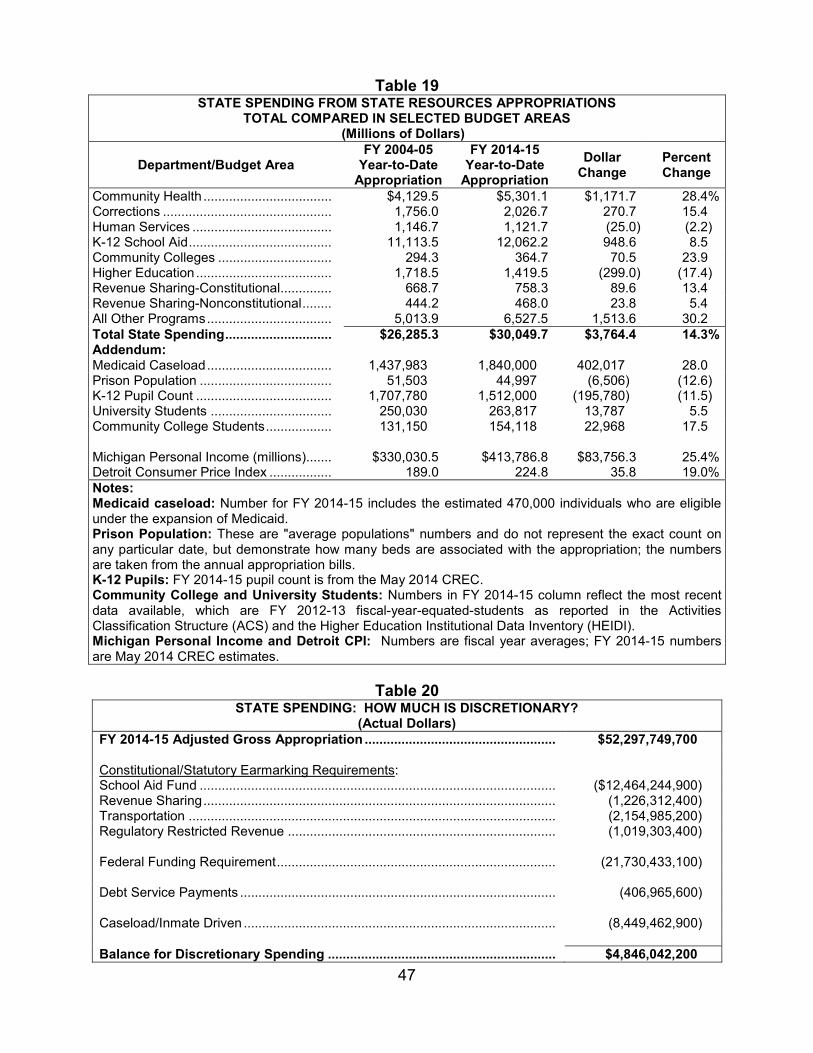
Table 19 STATE SPENDING FROM STATE RESOURCES APPROPRIATIONS
TOTAL COMPARED IN SELECTED BUDGET AREAS (Millions of Dollars)
Department/Budget Area FY 2004-05
Year-to-Date Appropriation
FY 2014-15Year-to-Date
Appropriation
Dollar Change
Percent Change
Community Health ................................... $4,129.5 $5,301.1 $1,171.7 28.4%Corrections .............................................. 1,756.0 2,026.7 270.7 15.4 Human Services ...................................... 1,146.7 1,121.7 (25.0) (2.2) K-12 School Aid ....................................... 11,113.5 12,062.2 948.6 8.5 Community Colleges ............................... 294.3 364.7 70.5 23.9 Higher Education ..................................... 1,718.5 1,419.5 (299.0) (17.4) Revenue Sharing-Constitutional.............. 668.7 758.3 89.6 13.4 Revenue Sharing-Nonconstitutional ........ 444.2 468.0 23.8 5.4 All Other Programs .................................. 5,013.9 6,527.5 1,513.6 30.2 Total State Spending ............................. $26,285.3 $30,049.7 $3,764.4 14.3%Addendum: Medicaid Caseload .................................. 1,437,983 1,840,000 402,017 28.0 Prison Population .................................... 51,503 44,997 (6,506) (12.6) K-12 Pupil Count ..................................... 1,707,780 1,512,000 (195,780) (11.5) University Students ................................. 250,030 263,817 13,787 5.5 Community College Students .................. 131,150 154,118 22,968 17.5
Michigan Personal Income (millions)....... $330,030.5 $413,786.8 $83,756.3 25.4%Detroit Consumer Price Index ................. 189.0 224.8 35.8 19.0%Notes: Medicaid caseload: Number for FY 2014-15 includes the estimated 470,000 individuals who are eligible under the expansion of Medicaid. Prison Population: These are "average populations" numbers and do not represent the exact count on any particular date, but demonstrate how many beds are associated with the appropriation; the numbersare taken from the annual appropriation bills. K-12 Pupils: FY 2014-15 pupil count is from the May 2014 CREC. Community College and University Students: Numbers in FY 2014-15 column reflect the most recent data available, which are FY 2012-13 fiscal-year-equated-students as reported in the Activities Classification Structure (ACS) and the Higher Education Institutional Data Inventory (HEIDI). Michigan Personal Income and Detroit CPI: Numbers are fiscal year averages; FY 2014-15 numbers are May 2014 CREC estimates.
Table 20
STATE SPENDING: HOW MUCH IS DISCRETIONARY? (Actual Dollars)
FY 2014-15 Adjusted Gross Appropriation .................................................... $52,297,749,700
Constitutional/Statutory Earmarking Requirements: School Aid Fund ................................................................................................. ($12,464,244,900) Revenue Sharing ................................................................................................ (1,226,312,400) Transportation .................................................................................................... (2,154,985,200) Regulatory Restricted Revenue ......................................................................... (1,019,303,400)
Federal Funding Requirement ............................................................................ (21,730,433,100)
Debt Service Payments ...................................................................................... (406,965,600)
Caseload/Inmate Driven ..................................................................................... (8,449,462,900)
Balance for Discretionary Spending .............................................................. $4,846,042,200