Embed Size (px)
Citation preview

CRS Report for CongressPrepared for Members and Committees of Congress
State and Local Government Debt: An Analysis
Steven Maguire Specialist in Public Finance
April 14, 2011
Congressional Research Service
7-5700 www.crs.gov
R41735

State and Local Government Debt
Congressional Research Service
Summary The financial consequences of the recession that spanned from December 2007 through June 2009 have increased congressional interest in the financial health of state and local governments. State and local tax revenues declined, expenditures climbed, and debt increased. Even though tax revenue has begun to rebound, expenditures for unemployment benefits and other social programs remain elevated. Also, federal aid to states, which had increased as part of the American Recovery and Reinvestment Act, has begun to recede. Federal outlays for grants in aid to state and local governments rose from $538 billion in FY2009 to $608.4 billion in FY2010 and are estimated to be $625.2 billion in FY2011. The FY2012 budget provides $584.3 billion in outlays for aid to state and local governments in 2012.
In response to these state and local government fiscal headwinds, several hearings have been held early in the 112th Congress to examine the health of state and local government finances and the potential effects on the economic recovery. The hearings focused on a range of issues important to state and local governments as well as federal policy makers. The role of state and local government debt was one of these issues. The federal government has a significant stake in this debt market, as the tax expenditure for tax-exempt bonds issued by state and local governments was recently estimated to be $161.6 billion over the 2010 to 2014 budget window.
This report first provides a broad overview of state and local government finances and how these governments incorporate borrowing into their budgets. The second section reports data on state and local government debt and how that debt has changed over time. This section includes a comparative analysis of these debt parameters for each state. The third section discusses different economic perspectives on the use of debt by governments and if governments are intrinsically biased toward borrowing more than is considered economically optimal. The discussion provides background for Congress as it deliberates potential changes in the oversight of the primary and secondary markets for state and local government debt.
Issues related to state and local government finances, such as government pensions and health benefits, are also addressed. This report will be updated as legislative events warrant.
State and Local Government Debt
Congressional Research Service
Contents State and Local Government Finances .........................................................................................1
State and Local Government Debt .........................................................................................1 Operating Budget and Capital Budget .............................................................................2 The Unemployment Trust Fund and Pension Debt ...........................................................3
Holders of State and Local Government Debt........................................................................3 Measuring State and Local Government Debt..............................................................................5
Relative Measures of State and Local Government Debt........................................................5 How Has State Debt Changed Over Time? ............................................................................7
State Government Debt ...............................................................................................................8 Fiscal Illusion and Debt Versus Taxes....................................................................................9 Ricardian Equivalence and Debt Capitalization ................................................................... 10 Change in State Debt from FY2002 to FY2009 ................................................................... 10 Change in State Debt from FY2002 to FY2009, by State ..................................................... 11
Other State Fiscal Strains: Pensions and Declining Federal Aid ................................................. 13 Pension Obligation Bonds ................................................................................................... 13 Federal Aid ......................................................................................................................... 14 State Obligations: Debt and Unfunded Pension Liabilities ................................................... 14
Economics of State and Local Government Debt ....................................................................... 15 Crowding Out of Domestic Investment and Net Exports...................................................... 15 Economic Efficiency of Tax-Exempt Debt........................................................................... 16
Congressional Action ................................................................................................................ 17
Figures Figure 1. Holders of State and Local Government Debt Outstanding ...........................................4
Figure 2. State and Local Debt Outstanding as Percent of Own-Source Revenue .........................6
Figure 3. Level of State Debt and General Revenue.....................................................................8
Figure 4. General Revenue Change from Previous Fiscal Year................................................... 11
Figure 5. State Debt as Percentage of State Personal Income ..................................................... 12
Figure 6. State Debt and Unfunded Pension Liabilities as Percent of State GDP ........................ 15
Tables Table A-1. Relative Measure of State and Local Government Debt Outstanding ........................ 19
Table A-2. Change in State Debt and Interest Expense from FY2002 to FY2009........................ 21
Table A-3. State Debt and Unfunded Pension Obligations.......................................................... 23
State and Local Government Debt
Congressional Research Service
Appendixes Appendix. ................................................................................................................................. 19
Contacts Author Contact Information ...................................................................................................... 24

State and Local Government Debt
Congressional Research Service 1
State and Local Government Finances The fiscal health of many states has been severely strained by the prolonged economic slowdown following the recent recession, even after the official end of the recession in June 2009. State and local tax revenues have declined, expenditures for social insurance programs have increased, and federal assistance has begun to recede as federal aid related to the American Recovery and Reinvestment Act (ARRA) expires. Further, state and local governments are required to balance current operating budgets either annually or biannually. State and local governments have used a combination of rainy day fund withdrawals, tax increases, spending reductions, and in some instances, borrowing to meet these balanced budget requirements.1
Congress has become increasingly concerned that state financial difficulties may lead states to take actions that could have an adverse impact on the economic recovery and that they may need additional federal government assistance. Part of this concern has focused on debt issued by state and local governments. This report will describe state and local government debt and analyze how debt is incorporated into state and local budgets. The report will also analyze the role the federal government has in state and local government debt structure.
Other issues of interest to Congress include bond default risk (or more generally, state bankruptcy) and public pension underfunding. Bond default risk and underfunding public pensions are both integral parts of state and local finance, though somewhat beyond the scope of this report. Clearly, during economic downturns, the risk of bond default rises. In particular, those bonds secured by specific revenue streams and not the general obligation of the issuing jurisdiction are at greatest risk. Even so, municipal default has been relatively rare, only 54 defaults from 1970 to 2009, and has yet to become a significant issue in municipal finance.2 As for public pensions, debt is rarely used to finance future obligations and is generally discouraged by public finance professionals. Nonetheless, some states have used debt to fund pensions.3
State and Local Government Debt As noted earlier, the level of state and local government debt and purported growth of this debt during the recession has generated significant congressional interest.4 Some observers have suggested that the pressure to provide additional federal assistance has increased as states are purportedly relying more on debt to finance operations. For example, H.R. 344, the Fiscal Responsibility Effective Enforcement Act, would prohibit the Federal Reserve Board (the Fed) from buying short-term municipal securities, thus reducing the probability that the Fed would be 1 An overview of some techniques used to “manage” state budget constraints can be found in the following: Eileen Norcross, Fiscal Evasion in State Budgeting, Mercatus Center, George Mason University, Working Paper no. 10-39, July 2010. 2 For more on the history, see Moody’s Investor Service, “U.S. Municipal Bond defaults and Recoveries, 1970-2009,” February 2010. As for future defaults, though difficult to predict, the Bond Dealers of America reports that “in the last four years and during the height of the recession, only seven municipal governments filed for bankruptcy.” See Mike Nicholas, Chief Executive Officer, Bond Dealers of America, as reported in the The Bond Buyer, February 28, 2011. 3 James B. Burnham, “Risky Business?: Evaluating the Use of Pension Obligations Bonds,” Government Finance Review, June 2003, p. 12-17. 4 For more on state and local government debt, see CRS Report RL30638, Tax-Exempt Bonds: A Description of State and Local Government Debt, by Steven Maguire.

State and Local Government Debt
Congressional Research Service 2
asked to “bail-out” state and local governments. Congress has also held several hearings on policies addressing the fiscal health of state and local governments.5 This section will describe the type of state and local government debt analyzed here and who holds this debt.
Operating Budget and Capital Budget
In contrast to the federal government, most state and local governments maintain two budgets, an operating budget and a capital budget. The operating budget funds current expenditures such as employee salaries, payment for services, and interest payments on debt. Current revenues, such as taxes, fees, user charges, and intergovernmental aid, finance these expenditures. When observers refer to state and local government budget deficits, they are almost always referring to the operating budget.
The timing of state and local revenue collection, however, typically does not match spending. Thus, most governments issue short-term debt to finance current spending then use future revenue to repay this debt. These notes are called revenue anticipation notes or tax anticipation notes. It is important to note that almost every state and local government is required to maintain a balanced operating budget from fiscal year to fiscal year, so only in rare circumstances is short-term debt carried over into the next fiscal year.6
The capital budget is typically used to finance infrastructure (or public capital) investment. The capital budget looks forward as far as 10 years for some states.7 The role of debt differs in the operating and capital budgets. Long-term debt is almost always intended for capital projects and as such is included in the capital budget. However, the interest expense on debt issued for the capital budget is included in the operating budget.
No uniform definition of a “capital” expenditure exists, though most lean toward a common principal. The National Association of State Budget Officers (NASBO) provides the following brief explanation of how states identify spending for inclusion in the capital budget:
States define the types of expenditures allowed in capital budgets to include such items as construction, improvements, land acquisition, site improvements, major renovations, and equipment. Definitions may also specify the anticipated useful life of a project and a minimum level of expenditure, with $25,000 being the most frequent minimum for capital budget expenditures.8
5 U.S. Congress, Senate Committee on the Budget, Challenges for the U.S. Economy, 112th Cong., 1st sess., February 3, 2011; U.S. Congress, House Committee on Oversight and Government Reform, Subcommittee on TARP, Financial Services and Bailouts of Public and Private Programs, State and Municipal Debt: The Coming Crisis?, 112th Cong., 1st sess., February 9, 2011; and U.S. Congress, House Committee on Oversight and Government Reform, Subcommittee on TARP, Financial Services and Bailouts of Public and Private Programs, State and Municipal Debt: The Coming Crisis? Part II, 112th Cong., 1st sess., March 15, 2011. U.S. Congress, House Committee on Oversight and Government Reform, State and Municipal Debt: Tough Choices Ahead, 112th Cong., 1st sess., April 14, 2011. 6 National Association of State Budget Officers (NASBO), “Budget Processes in the States,” Washington, DC, Summer 2008, available at http://www.nasbo.org/LinkClick.aspx?fileticket=AaAKTnjgucg%3d&tabid=38. 7 NASBO, “Capital Budgeting in the States,” Washington, DC, November 1999, available at http://www.nasbo.org/LinkClick.aspx?fileticket=yfDocTSXHU4=&tabid=84. 8 NASBO, “Capital Budgeting in the States,” 1999, p. 8.
State and Local Government Debt
Congressional Research Service 3
The ambiguity in some facets of this explanation is readily apparent. For example, the difference between a “major renovation” and a “minor renovation” may be arbitrary.
Nevertheless, the use of capital budgets and balanced budget rules makes it relatively difficult for state and local governments to issue debt to fund current operating expenses. Some states, however, do have some flexibility to shift spending between the operating and capital budgets, from fiscal year to fiscal year, and from account to account. This flexibility diminishes the seemingly disciplined treatment of debt. In addition, many states create and use special purpose authorities for debt issuance. These special authorities, though part of state government, are typically not constrained by the budget discipline tools described above.9
The Unemployment Trust Fund and Pension Debt
State and local governments also incur future liabilities that are not bonds. For example, many states borrow directly from the federal government to finance current expenditures for unemployment compensation (UC).10 During recessions, the balance of these funds often falls to a point where states borrow to pay benefits. States can borrow from outside sources or from the federal government. As of February 18, 2011, 31 states and the U.S. Virgin Islands had borrowed a combined $43 billion through trust fund loans from the federal government.11 These debts will be repaid through higher taxes on employers in most cases. A thorough examination of this type of debt and accompanying interest costs, though significant in some states, is beyond the scope of this report (for example, California owes over $10 billion to the federal government or 23% of the total outstanding).
Pension funds—in particular, defined benefit retirement funds—are also a significant liability or debt incurred by states and local governments. Recent studies have estimated that many state pensions are underfunded; one set the underfunding at $1 trillion.12 As with UC programs, a thorough examination of this type of debt is beyond the scope of this report.
Holders of State and Local Government Debt In addition to the discipline of budgetary rules, state and local government debt issuance is also constrained by the financial markets. As with any borrower, state and local governments need willing creditors to incur debt. The relative safety of state and local government debt and the federal income tax exclusion on interest payments on state and local bonds has created a strong demand for state and local government debt. What is also important to note is that entities that are otherwise non-taxable (or untaxable foreign entities) have little interest in tax-exempt state and local debt.
9 An overview of some techniques used to “manage” state budget constraints can be found in the following: Eileen Norcross, Fiscal Evasion in State Budgeting, Mercatus Center, George Mason University, Working Paper no. 10-39, July 2010. 10 CRS Report RS22954, The Unemployment Trust Fund (UTF): State Insolvency and Federal Loans to States, by Julie M. Whittaker. 11 United States Department of Labor, Employment and Training Administration, “Trust Fund Loans,” Washington, DC, available at http://www.workforcesecurity.doleta.gov/unemploy/budget.asp#tfloans, visited February 23, 2011. 12 Pew Center for the States, “The Trillion Dollar Gap: Underfunded State Retirement Systems and the Road to Reform,” Washington, DC, February 2010, available at http://downloads.pewcenteronthestates.org/The_Trillion_Dollar_Gap_final.pdf.

State and Local Government Debt
Congressional Research Service 4
Individuals are the primary holders of state and local government debt. Figure 1 shows the holders of all outstanding municipal debt as of the fourth quarter of 2010.13 Households, mutual funds, and money market funds represent holdings of individuals and compose approximately two-thirds (67%) of all debt outstanding. Individual holdings are represented in shades of blue. In past years, the individual share was larger as commercial banks and the rest of the world (ROW) held considerably less municipal debt. The recent increase in tax-exempt bond holdings by corporations and ROW can be attributed to the change in the more favorable tax treatment of corporate-held tax-exempt debt and Build America Bonds (BABs).14 BABs are taxable and offer higher interest rates than tax-exempt bonds thus making them more attractive to non-taxable entities such as pension funds and international investors.
Figure 1. Holders of State and Local Government Debt Outstanding As of the Fourth Quarter of 2010 in Billions of Dollars
Source: CRS presentation of data from Federal Reserve Board, Flow of Funds Accounts, Flows and Outstandings, Fourth Quarter 2010.
Notes: The parts labeled “individuals” are chiefly owed by individuals directly or indirectly through the specified type of investment vehicle.
The next section provides more detail on the level of state and local government debt. The discussion relies on data provided publicly by the Federal Reserve Board and U.S. Bureau of the Census and attempts to establish the current debt position of state and local governments and how it has changed over time.
13 This total includes the debt issued by nonprofit organizations and nonfinancial businesses. 14 For further analysis of Build America Bonds, see CRS Report R40523, Tax Credit Bonds: Overview and Analysis, by Steven Maguire.

State and Local Government Debt
Congressional Research Service 5
Measuring State and Local Government Debt The Fed and the United States Census Bureau (Census) publish information on state and local government debt outstanding. Both sources exhibit the relative importance of long-term debt. The Fed data are more current whereas the Census reports detailed data for both state and local government debt, albeit less current.
The Fed reports that, as of the third quarter of 2010, $2.39 trillion of state and local government debt was outstanding. Of this total, long-term debt composed 94.6%.15 The Census reports that for FY2008, the latest year available, total state and local government outstanding debt was $2.55 trillion ($1 trillion in state debt and $1.55 trillion in local debt).16 The Census further reports that in FY2008 state long-term debt was 98.6% of state total outstanding debt and local long-term debt was 98.0% of local total outstanding debt.
The amount of state and local government debt outstanding provides an indication of the relative magnitude of government borrowing. The government issuer, however, is not obligated to repay all of this debt; much of this debt is issued through debt vehicles called revenue bonds. Revenue bonds commit (or are secured by) a specified revenue stream, not the full faith and credit of the issuer. From 1996 through 2010, roughly one-third of state and local government debt issued was general obligation debt and two-thirds was specific revenue-secured debt.17
By comparison, total corporate and foreign bonds held by U.S. residents was $11.4 trillion at the close of the third quarter of 2010, and U.S. Treasury debt just recently reached $14.1 trillion.18 Most corporate debt and all federal debt is backed by the full faith and credit of the issuer.
Relative Measures of State and Local Government Debt The level of debt outstanding is best understood in the context of capacity to service that debt. One common measure of capacity to service debt is a jurisdiction’s own-source revenue, excluding transfers from the federal government. This metric includes revenue from taxes (e.g., sales, income, and property) and revenue from fees and charges (e.g., public college tuition and recreation fees). It could be argued that own-source revenue may be the best metric to gauge capacity to service debt because state and local governments have a great deal of control over these revenue sources.
A narrower measure of capacity to service debt is using current tax revenue alone. Capacity would seem smaller using this measure and would make the local government situation look
15 Federal Reserve Board, “Flow of Funds Accounts, Flows and Outstandings, Third Quarter 2010,” available at http://www.federalreserve.gov/releases/z1/. This total does not include the amounts issued by nonprofit organizations and nonfinancial corporate businesses. 16 United States Census Bureau, State and Local Government Finances FY2008, released July 7, 2010. The Fed reports $2.68 trillion outstanding for 2008 17 Thomson-Reuters as provided by the Securities Industry and Financial Markets Association (SIFMA). Data available at http://www.sifma.org/research/statistics.aspx. 18 For more on Treasury debt outstanding, see CRS Report RL31967, The Debt Limit: History and Recent Increases, by D. Andrew Austin and Mindy R. Levit.
State and Local Government Debt
Congressional Research Service 6
relatively more precarious as they rely less on current taxes and more on user charges and fees than state governments.
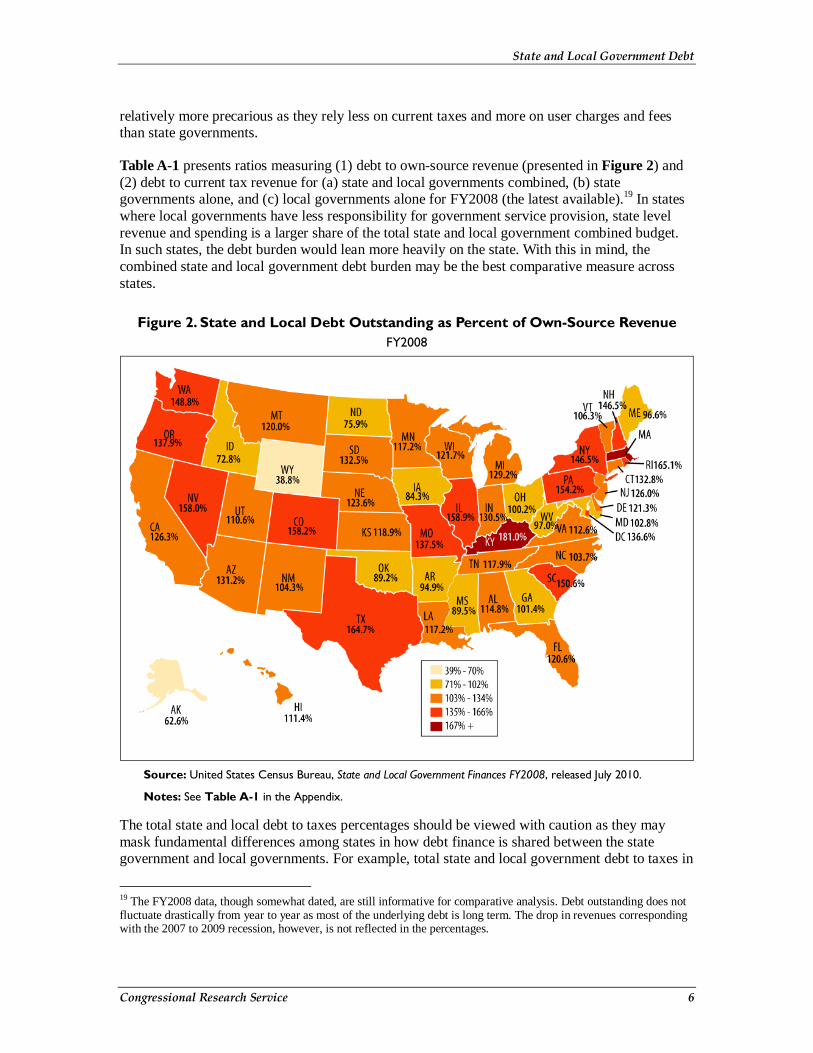
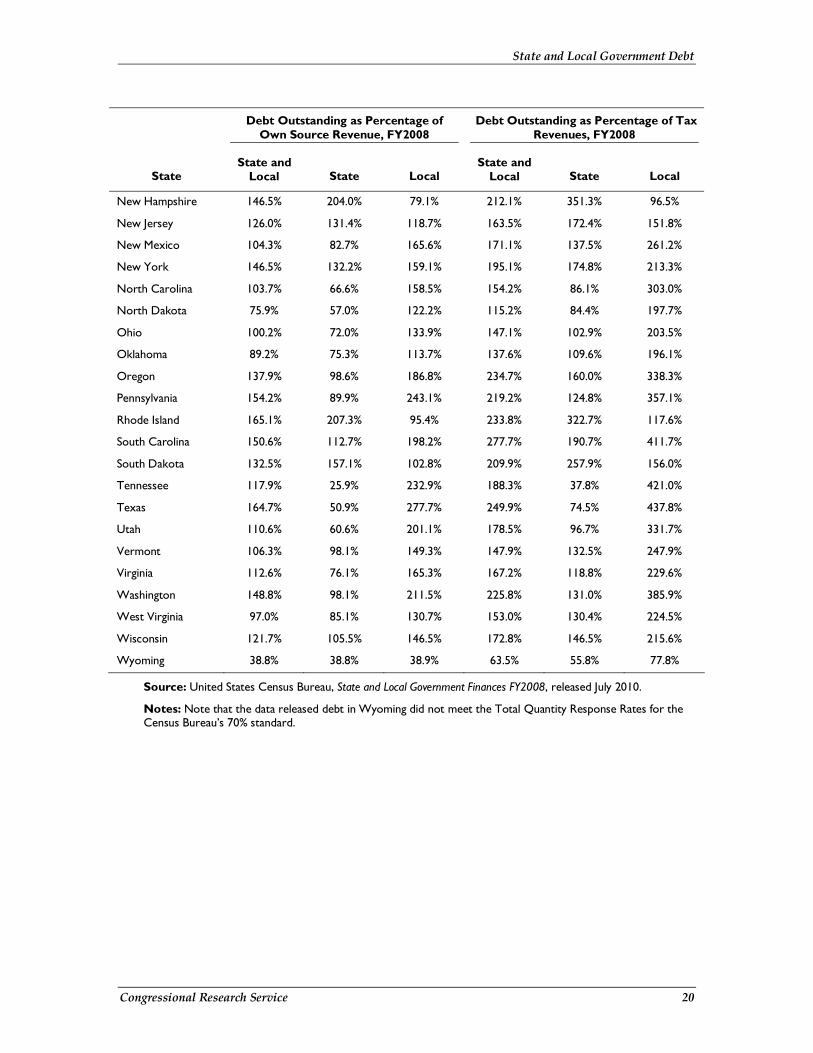
Table A-1 presents ratios measuring (1) debt to own-source revenue (presented in Figure 2) and (2) debt to current tax revenue for (a) state and local governments combined, (b) state governments alone, and (c) local governments alone for FY2008 (the latest available).19 In states where local governments have less responsibility for government service provision, state level revenue and spending is a larger share of the total state and local government combined budget. In such states, the debt burden would lean more heavily on the state. With this in mind, the combined state and local government debt burden may be the best comparative measure across states.
Figure 2. State and Local Debt Outstanding as Percent of Own-Source Revenue FY2008
Source: United States Census Bureau, State and Local Government Finances FY2008, released July 2010.
Notes: See Table A-1 in the Appendix.
The total state and local debt to taxes percentages should be viewed with caution as they may mask fundamental differences among states in how debt finance is shared between the state government and local governments. For example, total state and local government debt to taxes in
19 The FY2008 data, though somewhat dated, are still informative for comparative analysis. Debt outstanding does not fluctuate drastically from year to year as most of the underlying debt is long term. The drop in revenues corresponding with the 2007 to 2009 recession, however, is not reflected in the percentages.
State and Local Government Debt
Congressional Research Service 7
New Hampshire and Tennessee are 212.1% and 188.3%, respectively. From this, one might conclude that, from a risk perspective, Tennessee’s debt policies are relatively more sound than New Hampshire’s. The state of New Hampshire does have the highest debt burden of all states (debt was 351% of taxes collected in FY2008) yet local governments in New Hampshire have the second lowest debt burden (debt was 97% of taxes collected). Whereas in Tennessee, the state had the lowest debt to taxes percentage of just 37.8%, but local governments in Tennessee had a debt to taxes percentage of 421.0%. Only five states had local governments with a higher debt-to-taxes percentage than Tennessee.
The difference between New Hampshire and Tennessee highlights how examining measures of state debt alone may understate potential debt strain at the sub-state government level. And, to the extent states may be indirectly responsible for the finances of sub-state governments, risk could be transferred from the local governments to state governments.
How Has State Debt Changed Over Time? The recession that began in December 2007 and ended June 2009 created significant fiscal strain on state and local governments.20 The economy was in recession for over half of FY2008 and all of FY2009. Over this period, revenues declined and elevated spending intended to counter the effects of a slowed economy created what the National Association of State Budget Officers called “one of the worst periods in State fiscal conditions since the great depression.”21 In addition, federal assistance provided by the American Recovery and Reinvestment Act of 2009 is scheduled to expire and future pension obligations, for both retirement and health benefits, have created unease among many financial analysts and policymakers.
This section examines how state finances have changed over the FY2002 to FY2009 period. These years were selected for comparison because they are fairly representative of recent changing economic conditions. Both the beginning and end are considered economic troughs corresponding with the two most recent recessions. The recession of 2001 spanned from March 2001 to November 2001, which includes the beginning of FY2002 (for most states that would have been July 1, 2001). The data endpoint, FY2009, corresponds with the end of the most recent recession in June 2009.
Figure 3 shows the level of state general revenue, intergovernmental aid from the federal government, total state debt outstanding, and interest expense. The average annual growth rate for state debt outstanding over the period was 7.4% and total revenue, including intergovernmental aid, grew at an annual average rate of 2.2%. If intergovernmental aid were excluded, the average annual growth rate of state own-source revenue was 1.1% from 2002 to 2009.
20 National Bureau of Economic Research, “U.S. Business Cycle Expansions and Contractions,” available at http://www.nber.org/cycles/cyclesmain.html, visited January 31, 2011. 21 NASBO, “The Fiscal Survey of States: Fall 2010,” Washington, DC, p. vii., available at http://www.nasbo.org/LinkClick.aspx?fileticket=EQnlICsAJD8%3d&tabid=38.

State and Local Government Debt
Congressional Research Service 8
Figure 3. Level of State Debt and General Revenue FY2002 to FY2009 in Current Dollars
Source: CRS calculations based on United States Census Bureau, State Government Finances: 2009, available at http://www.census.gov/govs/state/.
The relatively continuous rise and slight drop in state general revenues in FY2009 is likely a key contributor to the current stress on state and local government operating budgets. State operating budgets, which as a general rule must be balanced from fiscal year to fiscal year, do not include levels of debt outstanding. The operating budget, however, does include interest payments on level of debt outstanding. These state interest payments outpaced state GDP growth over the same period, yet, as a portion of debt outstanding, declined from 5.2% to 4.5% from FY2002 to FY2009.
The lower (relative to state GDP) interest payments likely reflect falling interest rates over the last 20 years. In 1992, the average municipal bond rate was 6.41%, falling to 5.05% in 2002, and then to 4.64% in 2009.22 As interest rates drop, states replace (or current refund) outstanding high interest rate bonds with lower interest rate bonds.23 Also, any “new money” debt issuances carry a lower interest cost.
State Government Debt Some policymakers have suggested that the level of state debt may grow, given the need to close current operating budget gaps, possibly with increased reliance on debt.24 The budget gaps are relatively large from a historical perspective though state definitions of “deficit” vary
22 Office of Management and Budget, “Economic Report of the President,” Table B-73, February 2011. The interest rate dropped further in 2010 to 4.16%. 23 Municipal bonds typically include a 10-year call provision where the issuer can buy back outstanding debt. 24 For a discussion, see U.S. Congress, House Committee on Oversight and Government Reform, Subcommittee on TARP, Financial Services and Bailouts of Public and Private Programs, State and Municipal Debt: The Coming Crisis, 112th Cong., 1st sess., February 19, 2011.

State and Local Government Debt
Congressional Research Service 9
considerably. The National Conference of State Legislatures (NCSL) estimates a FY2011 budget gap of $26.7 billion and a FY2012 budget gap of $82.1 billion.25 States are generally reluctant to address gaps in the operating budget by reducing general fund spending that could be included in state capital budgets, which are financed primarily with debt. There is some evidence, however, to suggest that some states may have used this budget for financial flexibility. For example, despite the economic slowdown, capital spending increased 4.7% in FY2009, and was estimated to have grown 5.5% in FY2010.26 This additional spending was financed with additional debt and federal funds.
In addition, the NASBO reports that 32.5% of spending on capital projects in FY2009 was financed with bonds. Other non-general fund sources, such as dedicated fees and fund surpluses, composed another 35.1% of capital spending. General fund financing of capital projects represented 5.9% and federal funds the remaining 26.5%. These levels reflect a change in the mix of funding sources. General fund financing of capital projects decreased by 35.9% whereas federal fund financing increased 15.3% and bond-financed spending increased 10.6%. The implication is that in recent years states may have relied more on debt financing of capital projects that in the past were paid with general fund revenues.
Many states, some researchers contend, may suffer from a so-called “fiscal illusion” that makes debt (or federal grants) appear to be “cheaper” than using general fund revenues. As a result, they argue, states spend more than they otherwise would if the spending were financed exclusively with general fund revenues. In times of budget stress, the incentives for using debt are even greater. Following is a brief discussion of research that has examined the tradeoff between financing spending with debt, federal aid, or current general fund revenues.
Fiscal Illusion and Debt Versus Taxes The fundamental question of how to finance expenditures settles on the choice between selling bonds or using current tax revenues. Fiscal illusion, as it applies to state and local government debt, refers to the perception of current taxpayers that public goods financed with debt are cheaper than using current taxes because payment is shifted to the future.27 In theory, this illusion encourages more public spending than would otherwise be the case. This choice is principally a tradeoff between using taxes collected today versus taxes collected in the future.
Nevertheless, debt finance accomplishes two principal objectives of public finance. First, for debt issued for capital projects, the users of public infrastructure are repaying the debt through tax payments. This is typically called “pay-as-you-use” (payuse) financing and is considered more equitable as the taxpayers receiving the benefit are paying the taxes needed to repay the bond. Second, the use of debt smoothens spending on (often) large and expensive infrastructure projects. Without a bond issue, the jurisdiction would be required to make periodic lump sum payments for infrastructure. Accordingly, taxes would fluctuate as the payments are made.
25 National Conference of State Legislatures, “NCSL Fiscal Brief: Top Fiscal Issues for 2011 Legislative Sessions,” January 3, 2011, p. 1. 26 All expenditure data are from the National Association of State Budget Officers, “Fiscal Year 2009 State Expenditure Report,” Fall 2010. The report is available at http://www.nasbo.org/. 27 A singular definition of “fiscal illusion” does not exist. J. Buchanan, Public Finance in Democratic Process, University of North Carolina Press, 1967.
State and Local Government Debt
Congressional Research Service 10
Some jurisdictions, however, use a pay-as-you-go (paygo) system and “save” tax revenue and plan spending to match the saving and revenue structure. This requires a disciplined system of maintaining taxes and accurately anticipating future spending needs. One study concluded that ideally, a mix of the two financing mechanisms, depending on economic conditions, could maximize efficiency.28 According to the study, during times of economic growth and budget surpluses, jurisdictions should use paygo and during economic downturns, payuse would be preferred. Stated differently, debt financed capital spending is more efficient during times of economic stress, and in time of surplus, using current revenue to finance capital spending is more efficient. This appears to reflect the recent experience.
Ricardian Equivalence and Debt Capitalization One response to the fiscal illusion theory that suggests governments will borrow and spend “too much,” is that the current generation will save more today in anticipation of the future taxes needed to repay the debt.29 The theory presumes the current generation is interested in maintaining the consumption patterns of the next generation. To achieve this, the current generation saves and then transfers at death to the next generation an amount needed to retire debt incurred by the current generation. The net amount of debt would be unchanged. The list of restrictive assumptions needed to achieve the balance of planned saving to match debt repayment has led some to question the robustness of the so-called Ricardian Equivalence Model (REM).
A second response to the “over borrowing” critique relies on a model similar in principle to the REM. The debt capitalization model posits that future debt payments are “capitalized” into the value of property at the state and local government level.30 In this theory, higher debt translates into lower property values as the market “capitalizes” or incorporates the requirement to repay future debt into the value of property today. As a result, the current generation “pays” for debt through lower property values today.
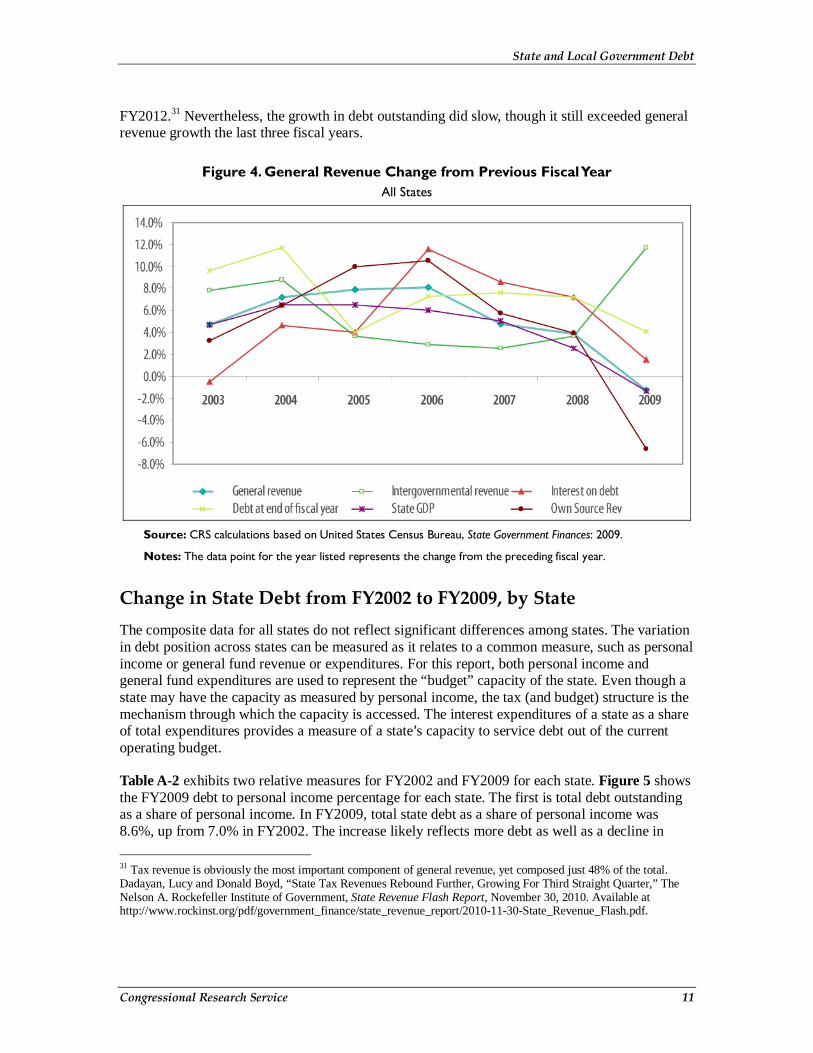
Change in State Debt from FY2002 to FY2009 As noted earlier, the last two recessions mark the beginning and end of the era examined. The level of state debt has increased from 59.9% of general revenue in FY2002 to 69.9% of general revenue in FY2009, and may increase further as the pace of the economic recovery and lagging housing market may continue to depress state (and local) revenue for FY2010, FY2011, and possibly FY2012. Figure 4 shows that general revenue growth actually declined in FY2009. The recession ended just before the beginning of FY2010 and the lag between economic decline and corresponding drop in revenues suggests that FY2010 may also exhibit a decline as well. State tax revenue, however, has shown recent improvement and may help alleviate some fiscal strain in
28 Wen Wang and Yilin Hou, “Pay-as-You-Go Financing and Capital Outlay Volatility: Evidence from the States over Two Recent Economic Cycles,” Public Budgeting and Finance, vol. 29, no. 4, 2009, pp. 90-107. 29 Barro, R.J., “Are Government Bonds Net Wealth?,” Journal of Political Economy, vol. 82, no. 6, 1974, pp. 1095-1117. 30 These applications are relevant for state and local governments more so than federal level governments. For more, see Eichenberger, Reiner, and David Stadelman, “How Federalism Protects Future Generations from Today’s Public Debts,” Review of Law and Economics, vol. 6, no. 3, 2010; and Banzahaf, H.S., and W.E. Oates, “On Ricardian Equivalence in Local Public Finance,” June 2008, available at http://ssrn.com/abstract=1248002.
State and Local Government Debt
Congressional Research Service 11
FY2012.31 Nevertheless, the growth in debt outstanding did slow, though it still exceeded general revenue growth the last three fiscal years.
Figure 4. General Revenue Change from Previous Fiscal Year All States
Source: CRS calculations based on United States Census Bureau, State Government Finances: 2009.
Notes: The data point for the year listed represents the change from the preceding fiscal year.
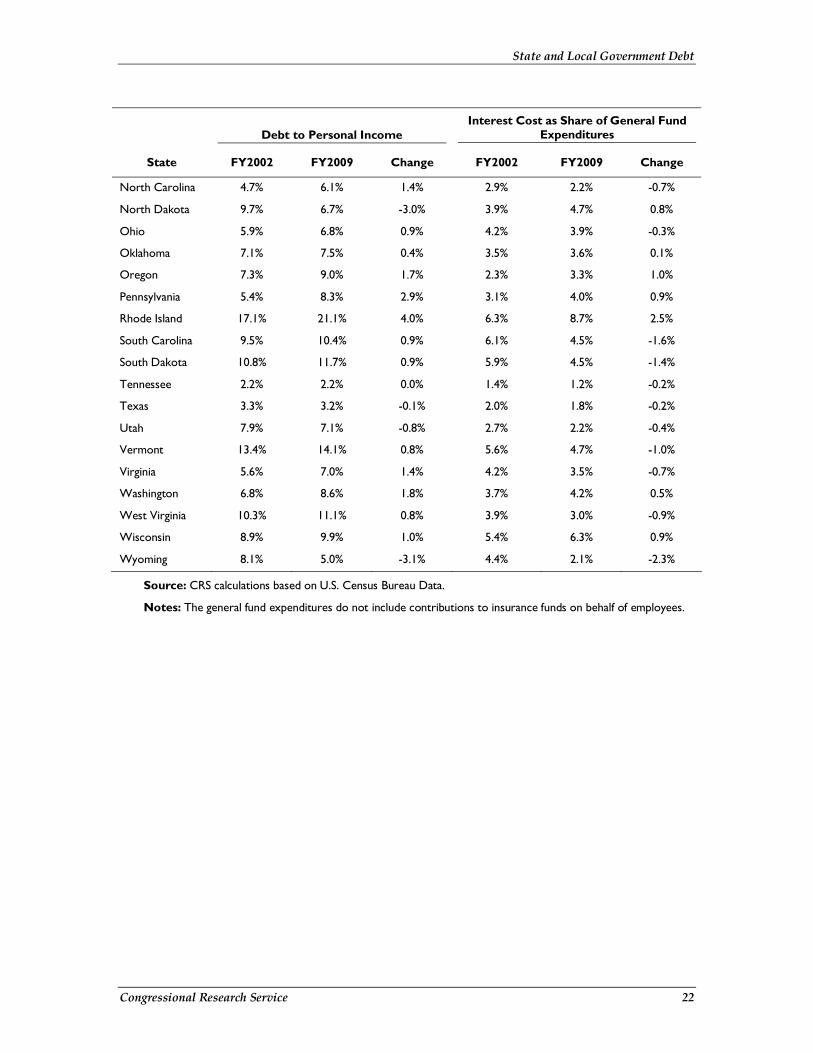
Change in State Debt from FY2002 to FY2009, by State The composite data for all states do not reflect significant differences among states. The variation in debt position across states can be measured as it relates to a common measure, such as personal income or general fund revenue or expenditures. For this report, both personal income and general fund expenditures are used to represent the “budget” capacity of the state. Even though a state may have the capacity as measured by personal income, the tax (and budget) structure is the mechanism through which the capacity is accessed. The interest expenditures of a state as a share of total expenditures provides a measure of a state’s capacity to service debt out of the current operating budget.
Table A-2 exhibits two relative measures for FY2002 and FY2009 for each state. Figure 5 shows the FY2009 debt to personal income percentage for each state. The first is total debt outstanding as a share of personal income. In FY2009, total state debt as a share of personal income was 8.6%, up from 7.0% in FY2002. The increase likely reflects more debt as well as a decline in
31 Tax revenue is obviously the most important component of general revenue, yet composed just 48% of the total. Dadayan, Lucy and Donald Boyd, “State Tax Revenues Rebound Further, Growing For Third Straight Quarter,” The Nelson A. Rockefeller Institute of Government, State Revenue Flash Report, November 30, 2010. Available at http://www.rockinst.org/pdf/government_finance/state_revenue_report/2010-11-30-State_Revenue_Flash.pdf.

State and Local Government Debt
Congressional Research Service 12
personal income in FY2009 given the severity of the recession. State debt as a share of personal income was over 21% in three states: Massachusetts, Alaska, and Rhode Island. In contrast, state debt in Nebraska, Texas, and Tennessee was below 4% of personal income. In addition, 12 states reduced debt as a share of personal income from FY2002 to FY2009. Overall, state debt outstanding has increased, though the overall debt position has been relatively stable for most states through FY2009.
Figure 5. State Debt as Percentage of State Personal Income FY2009
Source: CRS calculations based on U.S. Census Bureau Data, available at http://www.census.gov/govs/state/.
Notes: See Table A-2 in the Appendix.
The second set of data shows the relative importance of interest expense in state expenditures (excluding intergovernmental expenditures).32 These data could be used as an indicator of the “affordability” of the debt load discussed above. As mentioned previously, debt is typically incurred for large capital projects and most (48) states use a separate capital budget to account for this debt. The state operating budget incorporates the capital budget through the interest expense, which appears as an expenditure in the operating budget. Total state interest expense in FY2002 and FY2009 was 4.5% of general fund expenditures.
32 These expenditures are sometimes referred to as “general fund” expenditures.

State and Local Government Debt
Congressional Research Service 13
Other State Fiscal Strains: Pensions and Declining Federal Aid Some have suggested that post-employment pensions for government workers are underfunded and compelling states to devote more revenue to shoring up pension funds. Recent reports have suggested that the amount needed to fully fund promised benefits could be as high as $1 trillion. For example, an analysis by the Pew Center on the States found that “at the end of fiscal year 2008, there was a $1 trillion gap between the $2.35 trillion states and participating localities had set aside to pay for employees’ retirement benefits and the $3.35 trillion price tag of those promises.”33
Future pension obligations, however, impact current operating deficits only to the extent that annual contributions will need to rise to fully fund pensions. Data for state and local governments for FY2008 show that government pension expenditures account for just under 3% of total expenditures or $82 billion for all state and local government pensions. These contributions are for future retirees. Payments for already retired or separated workers is a significantly larger expense ($180 billion in FY2008). These payments are funded through employee retirement trust funds, not from general fund revenue.
Pension Obligation Bonds Some governments have issued bonds to finance annual pension payments as a means to alleviate some fiscal strain. These bonds, called “pension obligation bonds” (POBs), are taxable and the issuing governments invest the proceeds of the POBs in the pension fund. The intent is for the return of the invested proceeds to exceed the interest cost on the bonds. The portion of pension assets funded with POBs is very small.34 A recent study found that the “amount of POBs issued any one year has never been more than 1% of total assets in public pensions.”35 The same researchers concluded that
Nevertheless, it appears that POBs have the potential to be useful tools in the hands of the right governments at the right time. Issuing a POB may allow well-heeled governments to gamble on the spread between interest rate costs and asset returns or to avoid raising taxes during a recession. Unfortunately, most often POB issuers are fiscally stressed and in a poor position to shoulder the investment risk. As such, most POBs appear to be issued by the wrong governments at the wrong time.36
33 The Pew Center on the States, “The Trillion Dollar Gap: Underfunded State Retirement Systems and the Roads to Reform,” February 2010, available at http://downloads.pewcenteronthestates.org/The_Trillion_Dollar_Gap_final.pdf. 34 Illinois, however, offered $3.7 billion of pension obligation bonds on March 10, 2011. 35 Munnell, Alicia, Thad Calabrese, Ashby Monk, and Jean-Peirre Aubry, “Pension Obligation Bonds: Financial Crisis Exposes Risks,” Center for State and Local Government Excellence, January 2010, p. 7. Available at http://www.slge.org/vertical/Sites/%7BA260E1DF-5AEE-459D-84C4-876EFE1E4032%7D/uploads/%7BD84F0CBF-78F0-41C1-93ED-84CACA92DE48%7D.PDF. 36 Ibid.
State and Local Government Debt
Congressional Research Service 14
Federal Aid According to the United State Census Bureau, the federal government provided the states $497.8 billion in FY2009, or one-third of state general revenue.37 NASBO reports that federal funds financed 29.5% of expenditures ($457.0 billion) in FY2009, rising to 34.7% ($563.7 billion) in FY2010.38 As federal assistance contained in the American Recovery and Reinvestment Act (ARRA) gradually expires, the FY2011 federal share will likely decline somewhat. Currently, states are preparing the FY2012 budgets and are anticipating the need to increase revenue and reduce expenditures to replace the lost federal aid.
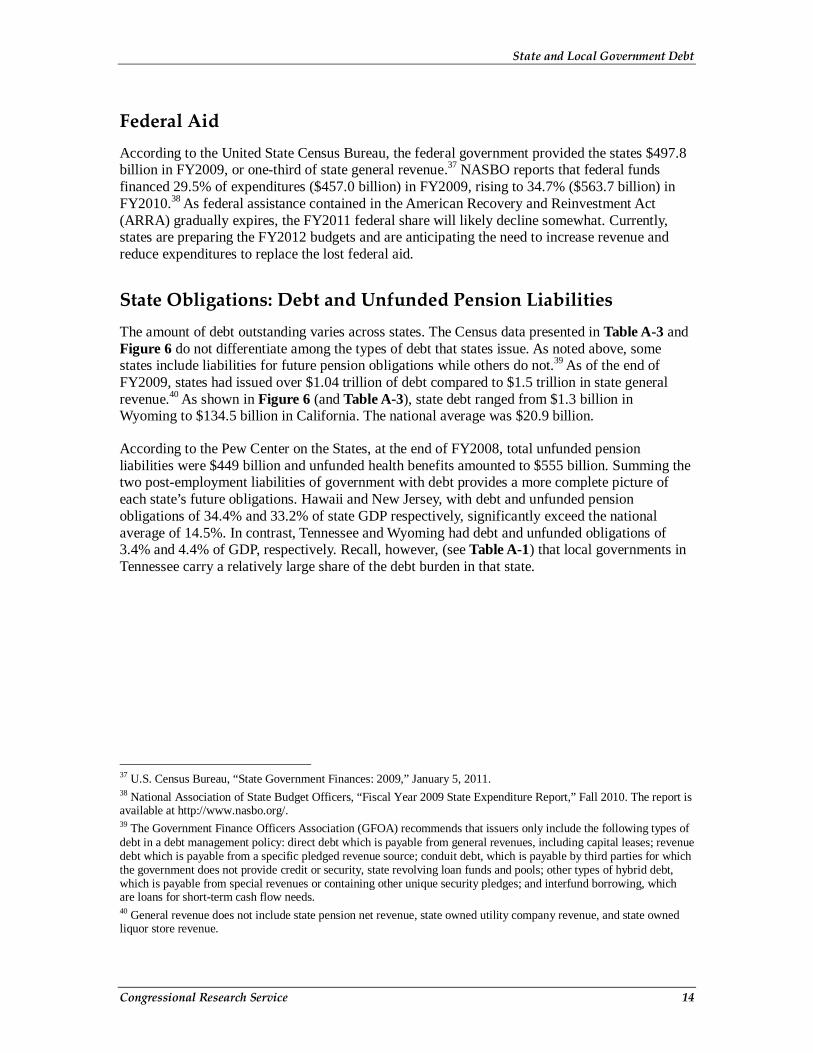
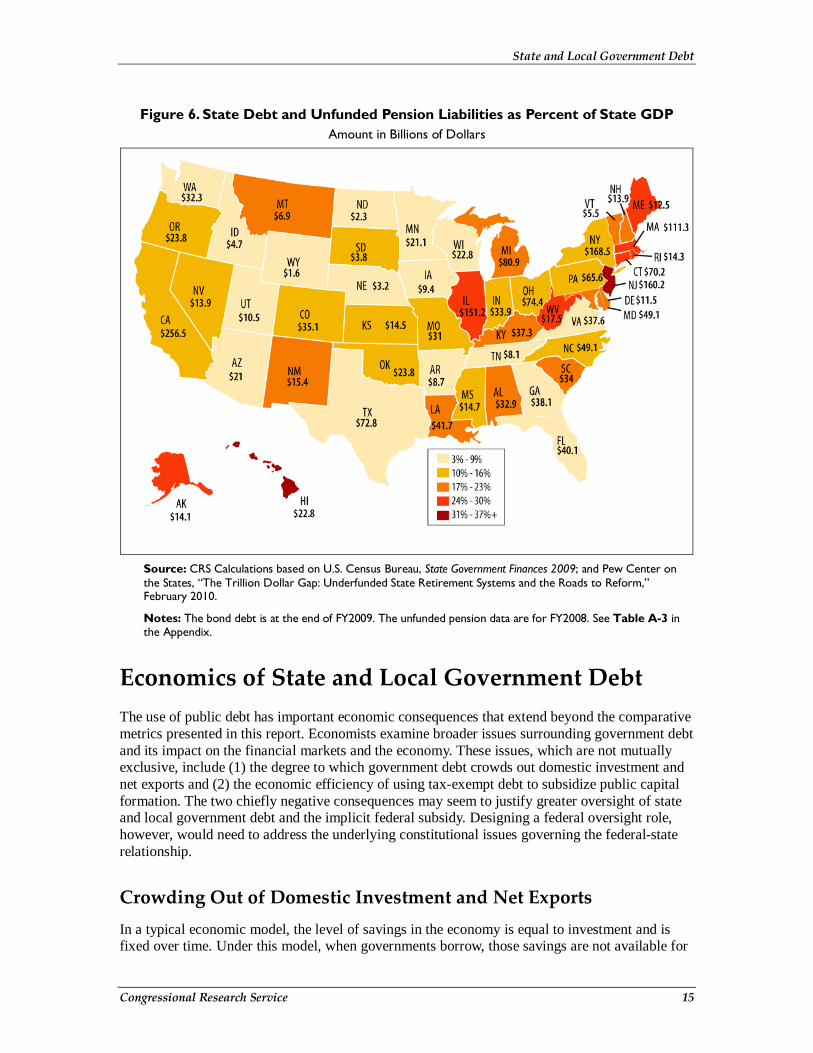
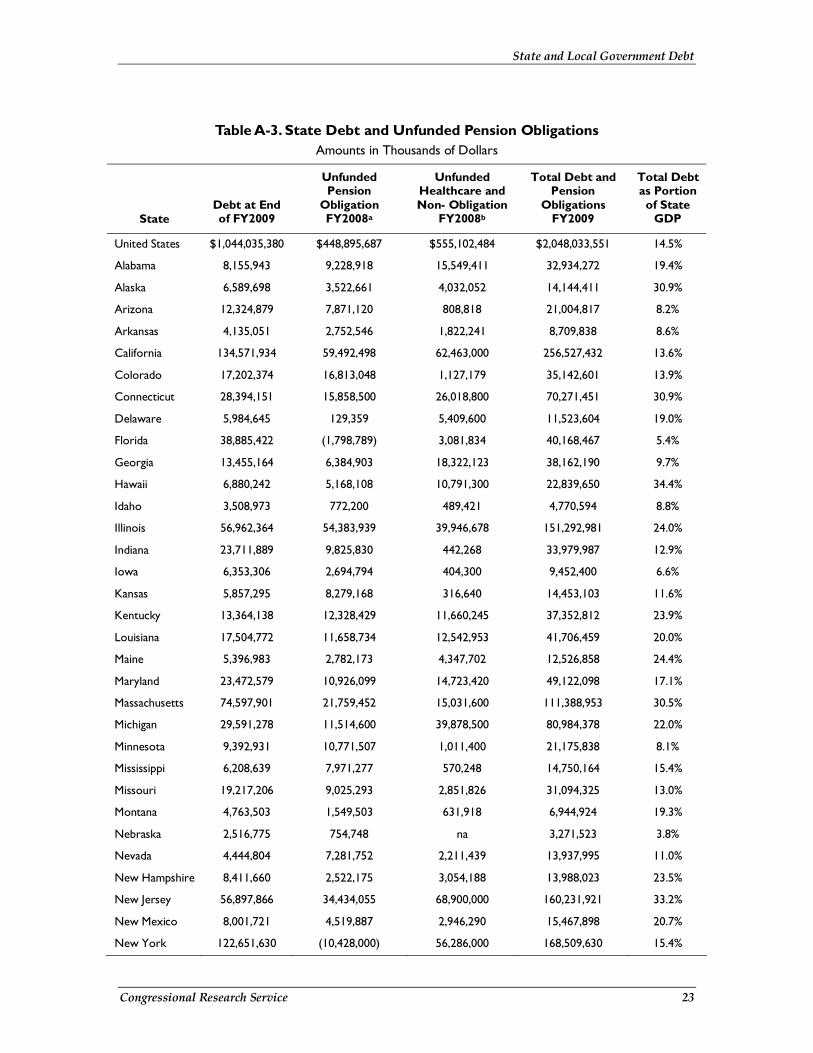
State Obligations: Debt and Unfunded Pension Liabilities The amount of debt outstanding varies across states. The Census data presented in Table A-3 and Figure 6 do not differentiate among the types of debt that states issue. As noted above, some states include liabilities for future pension obligations while others do not.39 As of the end of FY2009, states had issued over $1.04 trillion of debt compared to $1.5 trillion in state general revenue.40 As shown in Figure 6 (and Table A-3), state debt ranged from $1.3 billion in Wyoming to $134.5 billion in California. The national average was $20.9 billion.
According to the Pew Center on the States, at the end of FY2008, total unfunded pension liabilities were $449 billion and unfunded health benefits amounted to $555 billion. Summing the two post-employment liabilities of government with debt provides a more complete picture of each state’s future obligations. Hawaii and New Jersey, with debt and unfunded pension obligations of 34.4% and 33.2% of state GDP respectively, significantly exceed the national average of 14.5%. In contrast, Tennessee and Wyoming had debt and unfunded obligations of 3.4% and 4.4% of GDP, respectively. Recall, however, (see Table A-1) that local governments in Tennessee carry a relatively large share of the debt burden in that state.
37 U.S. Census Bureau, “State Government Finances: 2009,” January 5, 2011. 38 National Association of State Budget Officers, “Fiscal Year 2009 State Expenditure Report,” Fall 2010. The report is available at http://www.nasbo.org/. 39 The Government Finance Officers Association (GFOA) recommends that issuers only include the following types of debt in a debt management policy: direct debt which is payable from general revenues, including capital leases; revenue debt which is payable from a specific pledged revenue source; conduit debt, which is payable by third parties for which the government does not provide credit or security, state revolving loan funds and pools; other types of hybrid debt, which is payable from special revenues or containing other unique security pledges; and interfund borrowing, which are loans for short-term cash flow needs. 40 General revenue does not include state pension net revenue, state owned utility company revenue, and state owned liquor store revenue.
State and Local Government Debt
Congressional Research Service 15
Figure 6. State Debt and Unfunded Pension Liabilities as Percent of State GDP Amount in Billions of Dollars
Source: CRS Calculations based on U.S. Census Bureau, State Government Finances 2009; and Pew Center on the States, “The Trillion Dollar Gap: Underfunded State Retirement Systems and the Roads to Reform,” February 2010.
Notes: The bond debt is at the end of FY2009. The unfunded pension data are for FY2008. See Table A-3 in the Appendix.
Economics of State and Local Government Debt The use of public debt has important economic consequences that extend beyond the comparative metrics presented in this report. Economists examine broader issues surrounding government debt and its impact on the financial markets and the economy. These issues, which are not mutually exclusive, include (1) the degree to which government debt crowds out domestic investment and net exports and (2) the economic efficiency of using tax-exempt debt to subsidize public capital formation. The two chiefly negative consequences may seem to justify greater oversight of state and local government debt and the implicit federal subsidy. Designing a federal oversight role, however, would need to address the underlying constitutional issues governing the federal-state relationship.
Crowding Out of Domestic Investment and Net Exports In a typical economic model, the level of savings in the economy is equal to investment and is fixed over time. Under this model, when governments borrow, those savings are not available for

State and Local Government Debt
Congressional Research Service 16
private domestic investment, raising interest rates and making private borrowing more expensive. The higher interest rate also leads to net inflows of foreign capital as investors look to invest in the United States. The dollar would strengthen resulting in a drop in net exports as dollar-denominated goods become more expensive.
State and local government debt, thus, is often seen as having a significant impact on the macroeconomy, and some economists argue that if state government borrowing becomes “excessive” that borrowing could have a negative impact on private domestic investment and net exports.41 As such, the economic impact of state and local government debt issuance is generally perceived as of congressional interest as is the role of the federal government in either promoting or impeding the issuance of state debt.42
Economic Efficiency of Tax-Exempt Debt The federal government currently provides a tax preference for state and local government debt.43 The latest estimate of the federal tax expenditure for tax-exempt state and local government debt is $161.6 billion over the 2010 to 2014 forecast window.44 This tax expenditure is the direct cost to the federal government of the exclusion of interest paid on state and local government debt from individual and corporate income taxes.
The tax preference provided through tax-exempt bonds, however, has been criticized as “not a cost-effective means of transferring resources from the federal government to state and local governments.”45 Congress may act to more fully explore alternatives to tax-exempt financing considering the volume of tax-exempt financing and the economic inefficiency. Following is a brief discussion of why tax-exempt bonds are seen as an economically inefficient means of federal assistance to state and local governments.
Consider a 35% marginal tax rate investor who purchases a 5% tax-exempt bond with principal amount of $1 million to be repaid over 20 years. Each year for 20 years this taxpayer receives $50,000 in tax-exempt interest income. Each year the federal government forgoes collecting $24,500 (investor tax rate multiplied by what the taxable interest would have been) of revenue because the revenue loss is based upon the yield the taxpayer forgoes (the taxable yield) and the taxes that would have been collected on that interest income. For example, if the investor had purchased a taxable bond carrying a 7% interest rate, he would have received $70,000 in interest income and paid $24,500 in income taxes on that income (35% times $70,000).46
41 This holds for all government debt, not just state and local government debt. 42 Aizenman, Joshua, and Gurnail Kaur Pasricha, “Net Fiscal Stimulus During the Great Recession,” National Bureau of Economic Research, no. 16779, February 2011. 43 CRS Report RL30638, Tax-Exempt Bonds: A Description of State and Local Government Debt, by Steven Maguire. 44 U.S. Congress, Joint Committee on Taxation, “Estimates of Federal Tax Expenditures for Fiscal Years 2010 to 2014,” JCS-3-10, December 10, 2010. 45 Donald B. Marron, Acting Director of the U.S. Congressional Budget Office, Economic Issues in the Use of Tax-Preferred Financing, Testimony before the Committee on Ways and Means, Subcommittee on Select Revenue Measures, March 16, 2006. 46 The decision about preferred alternatives is critical to estimates of the revenue loss from tax-exempt bonds. An entire range of financial and real assets exists with different yields, risk, and degree of preferential taxation. It is not true that the municipal bond purchaser’s preferred alternative is always a taxable bond though it is a sound approximation.

State and Local Government Debt
Congressional Research Service 17
The previous example presents the fundamental economic inefficiency of tax-exempt bonds. The after-tax rate of return for the tax-exempt bond is the full 5% ($50,000 divided by $1 million). The after-tax rate of return for the taxable bond is 4.55% ($45,500 divided by $1 million). Theoretically, the federal government is providing an additional $4,500 to this investor for purchasing the tax-exempt bond.
Also, consider that the issuer is receiving a subsidy through lower interest costs. In this example, the issuer receives a two-percentage-point (the difference between a taxable rate of 7% and a tax-exempt rate of 5%) discount on debt or $20,000 which is less than the $24,500 tax expenditure. In theory, the federal government could provide the issuer with a direct subsidy of up to $24,500 to the issuer yielding a smaller revenue loss.
Over time, the size of the federal subsidy for state and local government debt issuance has varied along with macroeconomic factors and more directly with the marginal income tax rates. The historical average interest rate on high-grade corporate bonds from 1939 to 2010 was 6.26% and for high-grade municipal debt, 4.89%. In 2010, the average was 4.94% for corporate debt and 4.16% for municipal debt.47 The relatively high municipal bond rate in 2010, 0.84 of the taxable rate, confers a significant tax preference to higher tax rate investors.
Congressional Action This report examines the complexities of state and local government finance and how the magnitude of state fiscal stress varies considerably from state to state. Congress has recently held hearings examining the fiscal health of state and local governments and has offered legislation in two areas related to state and local fiscal health analyzed in this report: government debt and government pensions.
State and local debt, although growing, has not reached the point where widespread default seems likely. To date, few defaults have occurred and interest costs for debt outstanding represented a relatively modest 3.5% of total state and local government expenditures (4.5% of state expenditures in FY2009). More recent government budget data may show that for selected local government issuers, such as governmental authorities that rely on specialized revenue streams, interest costs have risen and default—and possible state government intervention—may be more likely than in the past. Prolonged weakness in the economy would certainly raise this probability.
Some policymakers are concerned that state and local governments are issuing too much debt, increasing the risk of potential default. In response, Congress may seek to increase oversight of the municipal bond market. Historically, the federal government has not actively engaged in regulating how state and local governments finance activities.48 Congress has limited authority as the Tower Amendment to the Securities and Exchange Act of 1934 explicitly prohibits the federal government from requiring
any issuer of municipal securities, directly or indirectly through a purchaser or prospective purchaser of securities from the issuer, to file with the [Securities and Exchange]
47 Office of Management and Budget, Economic Report of the President 2011, Washington, D.C., February 2011. 48 For example, S. 251 in the 112th Congress would explicitly prohibit the Fed from assisting state and local governments and authorities through purchasing their debt or offering guarantees.

State and Local Government Debt
Congressional Research Service 18
Commission or the [Municipal Securities Rulemaking] Board prior to the sale of such securities by the issuer any application, report, or document in connection with the issuance, sale, or distribution of such securities.49
Congress does confer a tax preference to state and local government bond issuers and could modify this tax preference to induce changes in bond disclosure requirements. Also, the Internal Revenue Service (IRS) currently audits selected outstanding tax-exempt bond issues to determine if the bonds comply with tax law. Expanding these audits may help ensure that the tax-exemption and associated federal revenue loss is merited.
Congress may also examine alternatives to tax-exempt bonds for subsidizing state and local government capital investment. In the 112th Congress, several bills have been introduced to extend and expand a modified version of Build America Bonds (BABs) including H.R. 11, H.R. 736, H.R. 747, and H.R. 992. BABs are viewed by many observers as a more efficient alternative to tax-exempt bonds.
Congress may also take a more active role in the oversight of state and local government pensions. Legislation has been introduced to address state pension issues. H.R. 567 and S. 347 would require greater transparency of state and local government pension systems. Recently, Moody’s, one of the primary bond rating agencies, announced that it would begin integrating tax-supported debt and unfunded pension liabilities when evaluating state bond ratings.50
In the near term, however, annual pension costs represent roughly 3% of state and local government operating expenditures ($82 billion in FY2008). As such, the underfunded pension systems are a longer term concern and, for most states, have a marginal impact on short term operating deficits.
49 Securities Exchange Act of 1934, Section 15B(d)(1). 50 Albano, Christine, “Moody’s to Weigh Tax-Backed Debt, Pension Liabilities Together,” The Bond Buyer, January 28, 2011.

State and Local Government Debt
Congressional Research Service 19
Appendix.
Table A-1. Relative Measure of State and Local Government Debt Outstanding FY2008
Debt Outstanding as Percentage of
Own Source Revenue, FY2008 Debt Outstanding as Percentage of Tax
Revenues, FY2008
State State and
Local State Local State and
Local State Local
United States Total 131.2% 94.0% 176.4% 191.7% 128.5% 281.9%
Alabama 114.8% 59.4% 192.8% 199.5% 93.4% 393.1%
Alaska 62.6% 47.4% 156.0% 102.3% 77.1% 264.7%
Arizona 131.2% 57.8% 220.3% 189.6% 76.8% 356.0%
Arkansas 94.9% 41.9% 253.7% 137.6% 56.9% 461.6%
California 126.3% 85.6% 171.6% 183.4% 103.9% 319.2%
Colorado 158.2% 108.4% 201.3% 254.5% 165.0% 340.5%
Connecticut 132.8% 155.5% 92.5% 159.2% 188.8% 108.4%
Delaware 121.3% 109.4% 168.0% 213.9% 195.3% 284.1%
District of Columbia 136.6% 0.0% 136.6% 177.5% 0.0% 177.5%
Florida 126.0% 88.5% 153.6% 193.8% 118.1% 266.1%
Georgia 101.4% 55.4% 142.7% 150.3% 72.3% 240.9%
Hawaii 111.4% 83.6% 204.2% 155.0% 117.1% 277.9%
Idaho 72.8% 71.0% 75.5% 116.0% 92.5% 182.5%
Illinois 158.9% 144.2% 174.7% 214.7% 183.2% 253.3%
Indiana 130.5% 95.3% 180.1% 202.8% 131.8% 339.8%
Iowa 84.3% 69.7% 103.4% 133.9% 105.0% 176.8%
Kansas 118.9% 58.3% 198.2% 176.6% 81.5% 320.8%
Kentucky 181.0% 85.9% 374.2% 271.2% 121.4% 638.6%
Louisiana 117.2% 104.5% 134.5% 177.6% 148.9% 223.1%
Maine 96.6% 101.3% 87.8% 131.4% 139.9% 116.4%
Maryland 102.8% 108.4% 95.2% 137.3% 146.8% 124.8%
Massachusetts 194.6% 227.8% 129.7% 273.0% 328.1% 173.2%
Michigan 129.2% 81.2% 205.7% 199.9% 117.3% 358.9%
Minnesota 117.2% 42.5% 244.8% 168.5% 52.1% 501.5%
Mississippi 89.5% 71.9% 115.1% 144.7% 93.5% 286.8%
Missouri 137.5% 125.4% 150.8% 206.9% 179.7% 240.4%
Montana 120.0% 137.9% 85.0% 187.7% 200.3% 156.3%
Nebraska 123.6% 46.9% 204.0% 186.6% 64.3% 344.4%
Nevada 158.0% 56.3% 251.4% 235.2% 69.5% 461.7%
State and Local Government Debt
Congressional Research Service 20
Debt Outstanding as Percentage of
Own Source Revenue, FY2008 Debt Outstanding as Percentage of Tax
Revenues, FY2008
State State and
Local State Local State and
Local State Local
New Hampshire 146.5% 204.0% 79.1% 212.1% 351.3% 96.5%
New Jersey 126.0% 131.4% 118.7% 163.5% 172.4% 151.8%
New Mexico 104.3% 82.7% 165.6% 171.1% 137.5% 261.2%
New York 146.5% 132.2% 159.1% 195.1% 174.8% 213.3%
North Carolina 103.7% 66.6% 158.5% 154.2% 86.1% 303.0%
North Dakota 75.9% 57.0% 122.2% 115.2% 84.4% 197.7%
Ohio 100.2% 72.0% 133.9% 147.1% 102.9% 203.5%
Oklahoma 89.2% 75.3% 113.7% 137.6% 109.6% 196.1%
Oregon 137.9% 98.6% 186.8% 234.7% 160.0% 338.3%
Pennsylvania 154.2% 89.9% 243.1% 219.2% 124.8% 357.1%
Rhode Island 165.1% 207.3% 95.4% 233.8% 322.7% 117.6%
South Carolina 150.6% 112.7% 198.2% 277.7% 190.7% 411.7%
South Dakota 132.5% 157.1% 102.8% 209.9% 257.9% 156.0%
Tennessee 117.9% 25.9% 232.9% 188.3% 37.8% 421.0%
Texas 164.7% 50.9% 277.7% 249.9% 74.5% 437.8%
Utah 110.6% 60.6% 201.1% 178.5% 96.7% 331.7%
Vermont 106.3% 98.1% 149.3% 147.9% 132.5% 247.9%
Virginia 112.6% 76.1% 165.3% 167.2% 118.8% 229.6%
Washington 148.8% 98.1% 211.5% 225.8% 131.0% 385.9%
West Virginia 97.0% 85.1% 130.7% 153.0% 130.4% 224.5%
Wisconsin 121.7% 105.5% 146.5% 172.8% 146.5% 215.6%
Wyoming 38.8% 38.8% 38.9% 63.5% 55.8% 77.8%
Source: United States Census Bureau, State and Local Government Finances FY2008, released July 2010.
Notes: Note that the data released debt in Wyoming did not meet the Total Quantity Response Rates for the Census Bureau’s 70% standard.

State and Local Government Debt
Congressional Research Service 21
Table A-2. Change in State Debt and Interest Expense from FY2002 to FY2009 Debt as Share of Personal Income and Interest as Share of General Fund Expenditures
Debt to Personal Income Interest Cost as Share of General Fund
Expenditures
State FY2002 FY2009 Change FY2002 FY2009 Change
United States 7.0% 8.6% 1.5% 4.5% 4.5% 0.0%
Alabama 5.5% 5.2% -0.4% 2.0% 2.0% 0.0%
Alaska 24.9% 21.8% -3.1% 5.0% 3.7% -1.2%
Arizona 2.9% 5.6% 2.7% 1.9% 2.8% 0.9%
Arkansas 4.6% 4.4% -0.2% 1.8% 1.6% -0.2%
California 6.0% 8.6% 2.6% 4.7% 5.4% 0.6%
Colorado 4.5% 8.2% 3.6% 3.4% 5.8% 2.4%
Connecticut 13.9% 14.7% 0.8% 8.2% 8.4% 0.2%
Delaware 15.1% 16.9% 1.8% 7.5% 5.2% -2.3%
Florida 4.0% 5.4% 1.4% 3.2% 3.4% 0.3%
Georgia 3.3% 4.0% 0.7% 2.2% 2.6% 0.4%
Hawaii 15.1% 12.6% -2.5% 7.1% 4.4% -2.7%
Idaho 7.3% 7.2% -0.1% 4.4% 3.6% -0.8%
Illinois 8.2% 10.5% 2.3% 6.2% 7.1% 0.8%
Indiana 5.4% 10.9% 5.5% 2.8% 4.4% 1.5%
Iowa 4.4% 5.6% 1.2% 1.5% 2.2% 0.7%
Kansas 2.8% 5.3% 2.5% 1.9% 3.5% 1.6%
Kentucky 6.8% 9.6% 2.8% 3.5% 2.9% -0.6%
Louisiana 8.0% 10.4% 2.4% 4.3% 4.5% 0.2%
Maine 11.6% 11.2% -0.3% 5.1% 4.2% -0.9%
Maryland 6.1% 8.5% 2.4% 4.6% 4.5% -0.1%
Massachusetts 17.8% 22.8% 5.0% 12.3% 11.7% -0.7%
Michigan 7.2% 8.6% 1.4% 4.3% 3.7% -0.6%
Minnesota 3.7% 4.3% 0.5% 2.3% 3.2% 0.8%
Mississippi 6.3% 6.9% 0.6% 2.6% 1.8% -0.8%
Missouri 7.6% 8.9% 1.3% 4.2% 4.5% 0.3%
Montana 11.8% 14.0% 2.3% 5.0% 4.0% -0.9%
Nebraska 4.2% 3.6% -0.7% 2.5% 1.7% -0.8%
Nevada 5.4% 4.5% -0.9% 3.9% 3.5% -0.4%
New Hampshire 12.1% 14.9% 2.8% 10.7% 8.6% -2.2%
New Jersey 9.4% 13.1% 3.7% 5.1% 5.8% 0.7%
New Mexico 9.7% 12.0% 2.3% 3.0% 3.0% 0.0%
New York 13.0% 13.5% 0.5% 8.0% 7.0% -1.0%
State and Local Government Debt
Congressional Research Service 22
Debt to Personal Income Interest Cost as Share of General Fund
Expenditures
State FY2002 FY2009 Change FY2002 FY2009 Change
North Carolina 4.7% 6.1% 1.4% 2.9% 2.2% -0.7%
North Dakota 9.7% 6.7% -3.0% 3.9% 4.7% 0.8%
Ohio 5.9% 6.8% 0.9% 4.2% 3.9% -0.3%
Oklahoma 7.1% 7.5% 0.4% 3.5% 3.6% 0.1%
Oregon 7.3% 9.0% 1.7% 2.3% 3.3% 1.0%
Pennsylvania 5.4% 8.3% 2.9% 3.1% 4.0% 0.9%
Rhode Island 17.1% 21.1% 4.0% 6.3% 8.7% 2.5%
South Carolina 9.5% 10.4% 0.9% 6.1% 4.5% -1.6%
South Dakota 10.8% 11.7% 0.9% 5.9% 4.5% -1.4%
Tennessee 2.2% 2.2% 0.0% 1.4% 1.2% -0.2%
Texas 3.3% 3.2% -0.1% 2.0% 1.8% -0.2%
Utah 7.9% 7.1% -0.8% 2.7% 2.2% -0.4%
Vermont 13.4% 14.1% 0.8% 5.6% 4.7% -1.0%
Virginia 5.6% 7.0% 1.4% 4.2% 3.5% -0.7%
Washington 6.8% 8.6% 1.8% 3.7% 4.2% 0.5%
West Virginia 10.3% 11.1% 0.8% 3.9% 3.0% -0.9%
Wisconsin 8.9% 9.9% 1.0% 5.4% 6.3% 0.9%
Wyoming 8.1% 5.0% -3.1% 4.4% 2.1% -2.3%
Source: CRS calculations based on U.S. Census Bureau Data.
Notes: The general fund expenditures do not include contributions to insurance funds on behalf of employees.
State and Local Government Debt
Congressional Research Service 23
Table A-3. State Debt and Unfunded Pension Obligations Amounts in Thousands of Dollars
State Debt at End of FY2009
Unfunded Pension
Obligation FY2008a
Unfunded Healthcare and Non- Obligation
FY2008b
Total Debt and Pension
Obligations FY2009
Total Debt as Portion of State
GDP
United States $1,044,035,380 $448,895,687 $555,102,484 $2,048,033,551 14.5%
Alabama 8,155,943 9,228,918 15,549,411 32,934,272 19.4%
Alaska 6,589,698 3,522,661 4,032,052 14,144,411 30.9%
Arizona 12,324,879 7,871,120 808,818 21,004,817 8.2%
Arkansas 4,135,051 2,752,546 1,822,241 8,709,838 8.6%
California 134,571,934 59,492,498 62,463,000 256,527,432 13.6%
Colorado 17,202,374 16,813,048 1,127,179 35,142,601 13.9%
Connecticut 28,394,151 15,858,500 26,018,800 70,271,451 30.9%
Delaware 5,984,645 129,359 5,409,600 11,523,604 19.0%
Florida 38,885,422 (1,798,789) 3,081,834 40,168,467 5.4%
Georgia 13,455,164 6,384,903 18,322,123 38,162,190 9.7%
Hawaii 6,880,242 5,168,108 10,791,300 22,839,650 34.4%
Idaho 3,508,973 772,200 489,421 4,770,594 8.8%
Illinois 56,962,364 54,383,939 39,946,678 151,292,981 24.0%
Indiana 23,711,889 9,825,830 442,268 33,979,987 12.9%
Iowa 6,353,306 2,694,794 404,300 9,452,400 6.6%
Kansas 5,857,295 8,279,168 316,640 14,453,103 11.6%
Kentucky 13,364,138 12,328,429 11,660,245 37,352,812 23.9%
Louisiana 17,504,772 11,658,734 12,542,953 41,706,459 20.0%
Maine 5,396,983 2,782,173 4,347,702 12,526,858 24.4%
Maryland 23,472,579 10,926,099 14,723,420 49,122,098 17.1%
Massachusetts 74,597,901 21,759,452 15,031,600 111,388,953 30.5%
Michigan 29,591,278 11,514,600 39,878,500 80,984,378 22.0%
Minnesota 9,392,931 10,771,507 1,011,400 21,175,838 8.1%
Mississippi 6,208,639 7,971,277 570,248 14,750,164 15.4%
Missouri 19,217,206 9,025,293 2,851,826 31,094,325 13.0%
Montana 4,763,503 1,549,503 631,918 6,944,924 19.3%
Nebraska 2,516,775 754,748 na 3,271,523 3.8%
Nevada 4,444,804 7,281,752 2,211,439 13,937,995 11.0%
New Hampshire 8,411,660 2,522,175 3,054,188 13,988,023 23.5%
New Jersey 56,897,866 34,434,055 68,900,000 160,231,921 33.2%
New Mexico 8,001,721 4,519,887 2,946,290 15,467,898 20.7%
New York 122,651,630 (10,428,000) 56,286,000 168,509,630 15.4%

State and Local Government Debt
Congressional Research Service 24
State Debt at End of FY2009
Unfunded Pension
Obligation FY2008a
Unfunded Healthcare and Non- Obligation
FY2008b
Total Debt and Pension
Obligations FY2009
Total Debt as Portion of State
GDP
North Carolina 19,910,714 504,760 28,741,560 49,157,034 12.3%
North Dakota 1,752,558 546,500 81,276 2,380,334 7.5%
Ohio 27,949,184 19,502,065 27,025,738 74,476,987 15.8%
Oklahoma 9,855,393 13,172,407 359,800 23,387,600 15.2%
Oregon 12,494,686 10,739,000 609,793 23,843,479 14.4%
Pennsylvania 41,924,042 13,724,480 9,956,800 65,605,322 11.8%
Rhode Island 9,180,938 4,353,892 788,189 14,323,019 29.9%
South Carolina 15,313,021 10,052,684 8,638,076 34,003,781 21.3%
South Dakota 3,626,024 182,870 76,406 3,885,300 10.1%
Tennessee 4,847,786 1,602,802 1,746,879 8,197,467 3.4%
Texas 30,438,160 13,781,228 28,611,584 72,830,972 6.4%
Utah 6,267,888 3,611,399 672,843 10,552,130 9.3%
Vermont 3,426,670 461,551 1,614,581 5,502,802 21.6%
Virginia 24,301,179 10,723,000 2,621,000 37,645,179 9.2%
Washington 24,603,219 (179,100) 7,901,610 32,325,729 9.6%
West Virginia 6,501,995 4,968,709 6,108,398 17,579,102 27.8%
Wisconsin 20,913,355 252,600 1,700,396 22,866,351 9.4%
Wyoming 1,320,852 144,353 174,161 1,639,366 4.4%
Source: CRS Calculations based on U.S. Census Bureau, State Government Finances 2009; and Pew Center on the States, “The Trillion Dollar Gap: Underfunded State Retirement Systems and the Roads to Reform,” February 2010.
Notes: The Pew Center pension data are from FY2008. As most pensions are heavily invested, the data do not reflect the sharp decline in assets value in the last half of 2008 and in 2009. Thus, the underfunding should be viewed as a conservative estimate.
a. Data are estimates from Pew Center on the States, 2010.
b. Data are estimates from Pew Center on the States, 2010.
Author Contact Information Steven Maguire Specialist in Public Finance [email protected], 7-7841