Embed Size (px)
Citation preview

Version – I Draft Report
State Action Plan on Climate Change for
Andhra Pradesh
Submitted
to Ministry of Environment and Forests,
Government of India, New Delhi
EPTRI
Environment Protection Training and Research Institute
Survey No. 91/4, Gachibowli, Hyderabad – 500 032
16th July, 2011
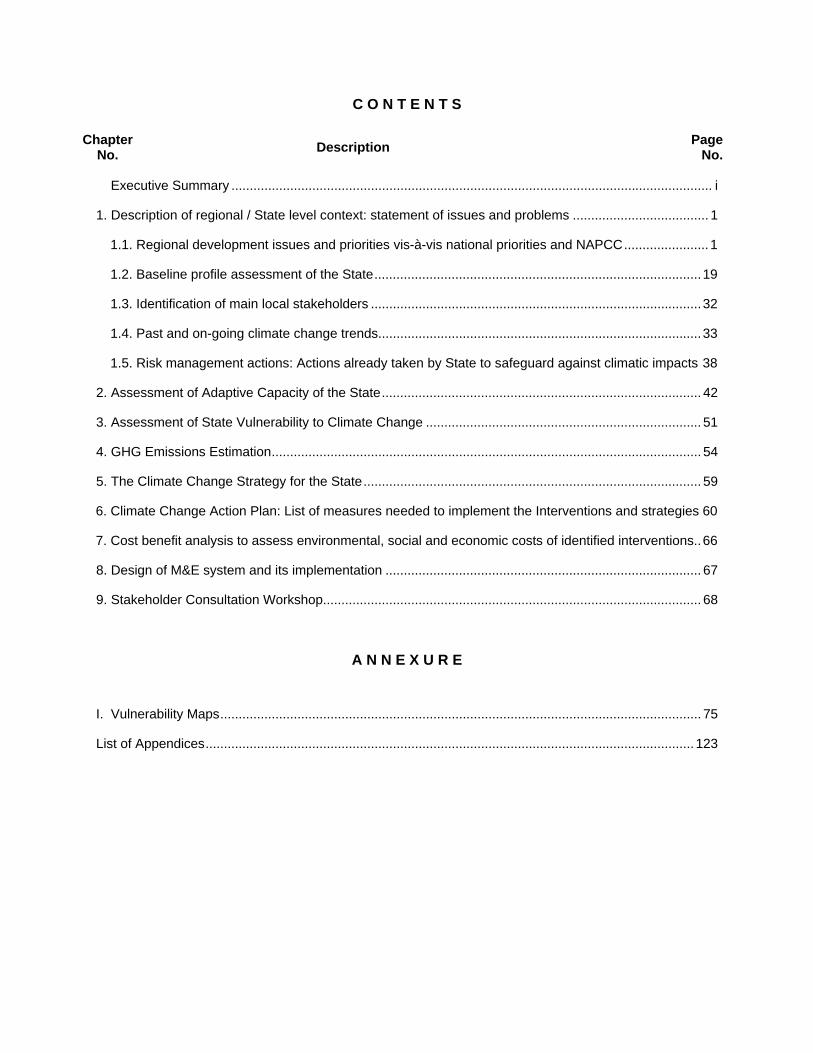
C O N T E N T S
Chapter No. Description Page
No. Executive Summary ................................................................................................................................... i
1. Description of regional / State level context: statement of issues and problems ..................................... 1
1.1. Regional development issues and priorities vis-à-vis national priorities and NAPCC.......................1
1.2. Baseline profile assessment of the State.........................................................................................19
1.3. Identification of main local stakeholders ..........................................................................................32
1.4. Past and on-going climate change trends........................................................................................33
1.5. Risk management actions: Actions already taken by State to safeguard against climatic impacts 38
2. Assessment of Adaptive Capacity of the State....................................................................................... 42
3. Assessment of State Vulnerability to Climate Change ........................................................................... 51
4. GHG Emissions Estimation..................................................................................................................... 54
5. The Climate Change Strategy for the State............................................................................................ 59
6. Climate Change Action Plan: List of measures needed to implement the Interventions and strategies 60
7. Cost benefit analysis to assess environmental, social and economic costs of identified interventions..66
8. Design of M&E system and its implementation ...................................................................................... 67
9. Stakeholder Consultation Workshop....................................................................................................... 68
A N N E X U R E
I. Vulnerability Maps................................................................................................................................... 75
List of Appendices..................................................................................................................................... 123

LIST OF EXHIBITS
Exhibit No. Description Page
No.
1. Priority areas under NAPCC .....................................................................................................................5
2. Percentage of Urban Population in Andhra Pradesh………………………………………………………..15
3. Sectoral Trend Growth (in %) in A P.......................................................................................................23
4. Number of newly established units from 2002-03 to 2008-09 in A.P......................................................26
5. District wise Human Poverty Index of districts of Andhra Pradesh.........................................................27
6. Land use Pattern of Andhra Pradesh......................................................................................................29
7. Classification of Forests in Andhra Pradesh...........................................................................................30
8. Forest distribution of Andhra Pradesh ....................................................................................................30
9. Agro Climatic Zones of AP......................................................................................................................31
10. Flood hazard map of the State..............................................................................................................37
11. Periodicity of occurrence of Drought in various parts of the country ....................................................38
12. Adaptive Capacity Index for Districts of AP ..........................................................................................50
13. Districts with high exposure to coastal disasters like floods and cyclones ...........................................52
14. Districts with high exposure to Drought ................................................................................................53 15. Emissions from Agriculture sector ……………………………………….………………………………….54 16. Emissions from Power Generation……………………………………….………………………………….55 17. Emissions from Power Consumption ...…………………………………………………………………….55 18. Emissions from Power Purchase …..………………………………….…………………...……………….55 19. Emissions from Transport ………….………………………………….………………...………………….56 20. Emissions from Solid Waste ………..………………………………….……………………...…………….56 21. Total GHG emission ……………………………………….……………………………………………..….57 22. GHG emission intensity ……………………………………….……………………………………………..58
23. Stakeholder profile from different centers .............................................................................................70
24. Coastal Vulnerability Index and risk levels of different segments of AP coast .....................................75
25. A snapshot of stakeholder mapping....................................................................................................128

LIST OF TABLES
Table No. Description Page
No.
1. Maximum height of storm surge of sea waves ........................................................................................8
2. Increase in length of Hope Island spit......................................................................................................9
3. Priority areas for health research...........................................................................................................11
4. Districts affected by vector borne diseases ...........................................................................................11
5. Districts affected due to water borne diseases ......................................................................................13
6. Districts affected by air borne diseases ..................................................................................................14
7. Agro-climatic zone wise division of the State.........................................................................................20
8. Trend Rate of growth in GSDP and Per capita GSDP: AP and All India...............................................22
9. Per Capita GSDP per Worker (in Rs) in Agricultural and Non agricultural Activities.............................25
10. Industrial Progress in A.P ....................................................................................................................26
11. Land utilization in Andhra Pradesh from 1990-91 to 2007-08 (Area in hectare),..................................28
12. Season-wise rainfall data, 2008 -09 (in millimeter)...............................................................................34
13. District-wise distribution of cyclones crossing AP coast (1891-2009) ..................................................35
14. Human, livestock and crop losses recorded between 2003 & 2008.....................................................36
15. Existing cyclone shelters district wise ...................................................................................................39 16. Few facts on the State GHG emissions for 2010-11……………………………………………………….57
17. Indicators identified for the aspects of Adaptive Capacity ....................................................................69
18. Stakeholder consultation schedule .......................................................................................................76
19. Detailed description of strategic intervenions ………………………………………………………………78

LIST OF ABBREVIATIONS
APPCB Andhra Pradesh Pollution Control Board
APRLP Andhra Pradesh Rural Livelihood Project
APSRTC Andhra Pradesh State Road Transport Corporation
ATR Action Taken Reports
BMTPC Building Materials and Technology Promotion Council
BRT Bus Rapid Transit
CC Climate Change
CCAP Climate Change Action Plan
CFLs Compact Fluorescent Lamps
COMAPS Coastal Ocean Monitoring & Prediction Systems
CRIDA Central Research Institute for Dry land Agriculture
CWC Cyclone warning centers
DCA Drug Control Administration
DDA Delaware Department of Agriculture
DH Directorate of Health
DPAP Drought Prone Areas Programme
EPTRI Environment Protection Training and Research Institute
GoAP Government of Andhra Pradesh
GSDP Gross State Domestic product
HDI Human Development Index
IAEP Integrated Afforestation & Eco-development Project
ICDP Integrated Cotton Development Programme
ICRISAT International Crops Research Institutes for the Semi-Arid Tropics
IMD India Meteorological Department
INCOIS Indian National Center for Ocean Information Service
IPM Institute of Preventive Medicine
IT Information Technology
IWMI International Water Management Institute
JGSY Jawahar Gram Samridhi Yojna
LEDs Light Emitting Diode
LPG Liquid Petroleum Gas
LULUCF Land Use, Land-Use Change and Forestry
MARSIS Marine Satellite Information Service
MoEF Ministry of Environment & Forests
MoHA Ministry of Home Affairs
NAPCCC National Action Plan on Climate Change

NDMA National Disaster Management Authority
NGOs Non Governmental Organizations
NMT Non Motorized Transport
NSAP National Social Assistance Programme
OECD Organization for Economic Co-operation and Development
P&T Postal and Telegraph
PHCs Primary Health Centers
PWD Public Works Division
REIA Rapid Environmental Impact Assessment
SELMAM Sea Level Monitoring and Modeling
SEZ Social Economic Zone
SGRY Sampoorna Grameen Rozgar Yojana
SSP Social Security Pensions
SVPs Sector Vulnerability Profiles
UNDP United Nations Development Programme
UNFCCC United Nation Framework Convention on Climate Change
VSS Vana Samraksha Samities
WMO World Meteorological Organization
WRP Work Participation Rate

SAPCC – AP - EPTRI
i
EXECUTIVE SUMMARY
Living and coping with uncertain impacts of climate change is no longer a choice; it is essential for our survival. Climate change poses a challenge to sustainability of social and economic development, livelihoods of communities and environmental management in India. India has pursued a strong domestic agenda to counter climate change while maintaining its growth objective and engaging constructively with the international community. The Government of India released the National Action Plan on Climate Change (NAPCC) in 2008 as part of an ambitious domestic action plan to address climate change. The NAPCC focuses on mitigation of climate change (CC) and protecting the vulnerable sections of society through an inclusive and sustainable development strategy that also enhances ecological sustainability and innovation. It identifies eight missions in the area of Solar Energy, Enhanced Energy Efficiency, Sustainable Agriculture, Sustainable Habitat, Water, Himalayan Ecosystem, Increasing forest cover and Strategic Knowledge on CC. In line with the NAPCC, India’s Five Year Plans intends to include a strategy for sustainable growth which will help the country to transform to a low carbon economy.
Although the Central Government is the key authority in shaping the climate change policy and creating the necessary institutional mechanism for its implementation, involvement of the State Governments in this process is crucial. With the formulation of a national policy on CC, it has become imperative to achieve coherence between strategies and actions at national and State levels. Most of the adaptation challenges such as coastal zone disasters, droughts, adverse human health effect, depleting water resources, are experienced at the State level and programmes aimed at improving the adaptive ability are also undertaken and implemented at State level. For certain sectors like industries and energy, the solution lies in implementing mitigation interventions at the State level. In this context, the State Government of Andhra Pradesh has taken this initiative to prepare the State Level Action Plan on Climate Change (SAPCC) to enable it to address existing and future climate risks and vulnerabilities.
Key objectives of SAPCC include:
• Inclusive and sustainable development of the State that protects the vulnerable sections of society from adverse effects of CC
• Improved ecological sustainability
• Provide a framework to undertake actions that deliver benefits for growth and development while mitigating and adapting to CC

SAPCC – AP - EPTRI
ii
• Prioritize adaptation/mitigation options for the State and identify financing options
• Engineering new and innovative policies/mechanisms to promote sustainable development
Major CC issues for the State arise in the agriculture sector and for the long coastline. Agriculture is severely affected by variability in rainfall and temperature patterns, while rising sea levels and extreme events of marine origin, such as cyclones pose problems for the coastal areas. Besides these, other critical areas of concern are food security, increasing number of climate vulnerable habitats (like slums or village dwellings) and climate vulnerable infrastructure (like roads and bridges which may be washed away by floods).
The SAPCC has been designed around the existing policies of the State Government by taking into consideration ongoing programmes and schemes being implemented at the State level, as well as the NAPCC. The existing policies of the government include ISOPOM (integrated scheme for oils, pulses, oil palm and maize), ICDP, Polambadi, National Agriculture Insurance Scheme (NAIS), Rashtriya Krishi Vikas Yojana (RKVY), Jalayagnam, A.P. Integrated Rural Development Program, Rajiv Awas Yojana etc. The SAPCC would be integrated into the State level planning process, so that the resource allocation for implementation of the identified adaptation/mitigation interventions can be made with an objective to achieve the development goals of the State Government. These goals1 include:
• eradication of extreme hunger and poverty • achievement of universal primary education • reduction in child mortality • promotion of gender equality • reduction of prevalence of malaria and other diseases • achievement of environmental sustainability
The SAPCC is a dynamic and flexible policy framework which will follow a continuous interactive process to reflect the changes and developments happening at the national, State and local levels. The stakeholders’ consultation process is an important aspect of SAPCC. Stakeholder engagement and consultation aligns them into the planning framework, and broadens and deepens perspectives and involvement in implementation of the State Action Plans for building a climate resilient economy. This SAPCC has been designed following stakeholders’ concerns and issues.
1 As also Stated in Millennium Development Goals for the State: http://www.rd.ap.gov.in/velugu/pdf/vpaper_base_asssen.pdf

SAPCC – AP - EPTRI
iii
The SAPCC has followed a structured approach to formulate and implement adaptation strategies, policies and measures to ensure human development in the face of climate variability and change. It is developed around four major principles:
• Adaptation to short-term climate variability and extreme events serves as a starting point for reducing vulnerability to longer-term climate change.
• Adaptation policies and interventions are assessed in a State developmental context. • Adaptation occurs at different levels in society, including the local level. • The adaptation strategy and the process by which it is implemented are equally
important.
Implementing the SAPCC will be characterized by:
• Strong stakeholder engagement . • Assessing the vulnerability of districts and enhancing their adaptive capacity. • Analysis of adaptation/mitigation options to cope with current and future climate change. • A programme to monitor, evaluate and improve the impact of the adaptation/mitigation
activities.
Stat
e Ac
tion
Plan
on
Clim
ate
chan
ge
Issue identification and analysis
Formulation of a climate change strategy
Engaging stakeholders
Review and synthesize existing information on vulnerability and adaptation
GHG inventorization
Review policy process
Identify adaptation and mitigation options for each of sectors / vulnerable zones
Feasibility and expected impact assessment of those identified adaptation and mitigation options
Prioritization
1. Identify major sectors (in line with the ‘National Action Plan on Climate Change’ which are prone to climate change
2. Identify stakeholders3. Clarify the roles of stakeholder4. Manage the dialogue process5. Collect feedbacks of stakeholders
1. Assessing the exposure of the system of interest to climate stimulus;2. Assessing the adaptive capacity of the system of interest to deal with climate
stimulus3. Determining the vulnerabi lity of the system of interest to climate stimulus
1. Identification of sectors 2. Identification of emission sources3. Collection of fuel and electricity consumption data 4. Determining the emission factors 5. Sector wise GHG emission mapping
1. Relationship between key policy processes and climate change adaptation;2. Potential for integrating adaptation concerns into policy agendas; and3. Ways to improve existing linkages for policy coherence and to strengthen commitment
to adaptation.
1. Compilation of issues identified under each of sectors2. Compilation of vulnerable zones 3. Compilation of existing State policies which bears significant contribution in increasing
adaptive and mitigating capacity4. Synthesize previous studies (national or State level) on potential adaptation options
national 5. Synthesize global best practices from climate change (adaptation and mitigation) front6. Identification of preliminary list of adaptation and mitigation options suitable for Andhra
Pradesh
1. Assessment of cost effectiveness of the indentified adaptation and mitigation options 2. Identification of critical success factors and challenges (if implemented) for each of the
adaptation and mitigation options 3. Vulnerability impact assessment of the prioritized zones in view of expected climate
change benefits from those identified adaptation and mitigation options 4. Stakeholder mapping for each of the identified adaptation and mitigation options in order
to identify the priority and importance of the stakeholders
1. Prioritize adaptation or mitigation options based on the feasibility and impact assessment conducted in the previous step
Approach Followed to develop State Action Plan on Climate Change
A detailed diagnostic study, following the UNDP methodologies (UNDP Adaptation Policy Framework and Human Development Index) has been performed to assess the climate change

SAPCC – AP - EPTRI
iv
vulnerability profile of Andhra Pradesh. It is based on the basic hypothesis that climate change vulnerability of a region is a function of two key variables:
• adaptive capacity of the region • physical exposure of the region to climatic events
An index has been developed to estimate these two parameters.16 major sectors which are seriously impacted by CC (agriculture, coastal zone, disaster management, rural development, transport, energy, industry, tourism, mining, forestry and biodiversity, urban development and waste management, health and family welfare, animal husbandry, fisheries, irrigation and water2) have been identified for the State. The issues, concerns and specific interventions for these sectors have been discussed. Adaptation interventions have been designed for sectors such as agriculture, coastal zone, disaster management, rural development, transport, tourism, mining, forestry and biodiversity, urban development and waste management, health and family welfare, animal husbandry, fisheries, irrigation and water while mitigation options have been identified for energy, industry and transport. A list of sectoral concerns, adaptation/mitigation interventions and corresponding challenges has been tabulated here.
Most critical sectoral concerns/issues
Key interventions Key implementation challenges
Agriculture
Lot of land falls in the rain shadow areas; hence farmers face acute shortage of water. Dwindling groundwater levels further add to farmers' woes
► Increase percentage of sown area under irrigation- water harvesting, check dams, dug out farm ponds and conservation furrows.
► Increase canal irrigation, reduce dependency on well irrigation.
► Adopt groundwater recharge practices.
► Sharing of water resources between States, regions, individuals.
Farmers facing debts on account of losses due to failure in crops
► Crop diversification. R&D to develop heat/drought resistant varieties of crops.
► Establishment of an institutional
► Farmer's acceptability of modified crops and effect of these crops on eco-system sustainability
2 Animal husbandry, fisheries and irrigation have been clubbed together with agriculture

SAPCC – AP - EPTRI
v
Most critical sectoral concerns/issues
Key interventions Key implementation challenges
framework to maximize incentives for agriculture
► Access to crop financing for tenant farmers (already legislated)
Coastal Zone
Loss of life and infrastructure due to cyclonic events
► Increasing cyclone shelter density in affected districts,
► Implementing technologically advanced early warning system for cyclones
► Accurate monitoring and prediction system development
► Integration of IT enabled infrastructure into traditional coastal disaster management infrastructure
Wetland loss ► Restoration and conservation of mangrove forests across the coast
► Unregulated land use pattern e.g.change from mangrove forest to aquaculture practice
Disaster Management
Losses due to Cyclones Floods, Tsunamis and similar events
► Advanced Weather prediction and early warning systems
► Space technology capable of detecting weather changes
► A network of ground and water based prediction system
► Effective policies and manual for the respective DM agencies for climate change linked disasters
► Increasing cyclone shelter density
► Interlinking of rivers and canals
► Accuracy in prediction, warning and monitoring systems
► High investments and funding in technology
► Requirement of qualified technical personnel in operations and management
► Timely co-ordination between various components of system.

SAPCC – AP - EPTRI
vi
Most critical sectoral concerns/issues
Key interventions Key implementation challenges
Losses due to Drought ► Up gradation of early warning systems
► Canal and water management
► Rainwater harvesting
Rural Development
Depletion of natural water resources and other ecological resources
• Water management - river/canal management
• Resistance from adversely affected users, industrial, agricultural and commercial
Loss in livelihood of poorer section of rural society (which are dependent on climate sensitive sectors)
• Early warning system for disasters like cyclones, drought and floods
• Reaching the vulnerable sections which are located at remote areas in specific timeframe during disaster
Health & Family Welfare
Vector/water/air borne diseases
• Massive strengthening of the public sector health system
• Government funding and collaboration for R&D on vaccines and other preventive measures.
• Universal vaccinations to those likely to be exposed, to prevent diseases onset.
• Availability of funds and skilled manpower for the public sector health system.
• Management of the health system
Extreme weather related health effects
• Research for improved prediction of weather events, improved surveillance
• Availability of technology in development of improved prediction of weather events and improved surveillance

SAPCC – AP - EPTRI
vii
Most critical sectoral concerns/issues
Key interventions Key implementation challenges
• Tourism
Safeguard natural resources and biodiversity
• Research, monitor and address impacts of climate change on natural resource and biodiversity
• Resistance to conservation efforts by parties seeking immediate profit.
Impacts of climate change on tourism
• Education/awareness raising on impacts of climate on tourism among tourism businesses staff, as well as tourists
• Lack of information and training facilities.
Forestry & Biodiversity
Degradation of forests and deforestation
• Revitalize community based initiatives like Joint Forest Management, Integrated Afforestation & Eco-development Project (IAEP) to check forest degradation and loss of biodiversity
• Promote shelter belt plantations in coastal areas to reduce damage from cyclones etc.
• Afforestation by using native species and replantation of same deforested species
• Developing technological infrastructure for predicting cyclones, storms and tidal waves.
Extinction of many species due to loss of forests and unchecked killing. Marine life at danger due to loss of plankton
• Creation of biodiversity registers for documenting genetic diversity and associated knowledge
• Effective implementation of Protected Area System under Wildlife Conservation Act and of National Biodiversity Conservation Act, 2001
• Regulatory framework for controlling biodiversity depletion
• Control of pollution to protect biodiversity

SAPCC – AP - EPTRI
viii
Most critical sectoral concerns/issues
Key interventions Key implementation challenges
Urban Development & Waste Management
Sewerage designs of old cities not adequate to accommodate the precipitations during the major weather disasters
• Development of efficient sanitation and sewerage systems to accommodate sudden surge due to excess rainfall and storms.
• High capital investment
• Lack of private sector participation
• Execution challenges in terms of disturbing existing urban infrastructure of old cities
Generation of huge quantum of solid waste in urban areas.
• Development of an integrated waste management system and waste utilization system
• Public-private partnership for both technology and investment
• Developing an attractive revenue model for private sector
Mining
Deforestation and land degradation
• Mandatory compensatory afforestation
• Ensuring environmentally safe mine closure.
• Legislation and enforcement consent of mining industry in view of cost and management issues
Water Pollution • Effluent treatment plants for liquid waste
• Technology, Investment and enforcement
Transport
Rural transport infrastructure is prone to extreme climate change related events like cyclones and floods.
• Setting up climate change resilient road infrastructure to ensure adequate connectivity even in extreme climatic condition
• Funds and land allocation
SAPCC – AP - EPTRI
ix
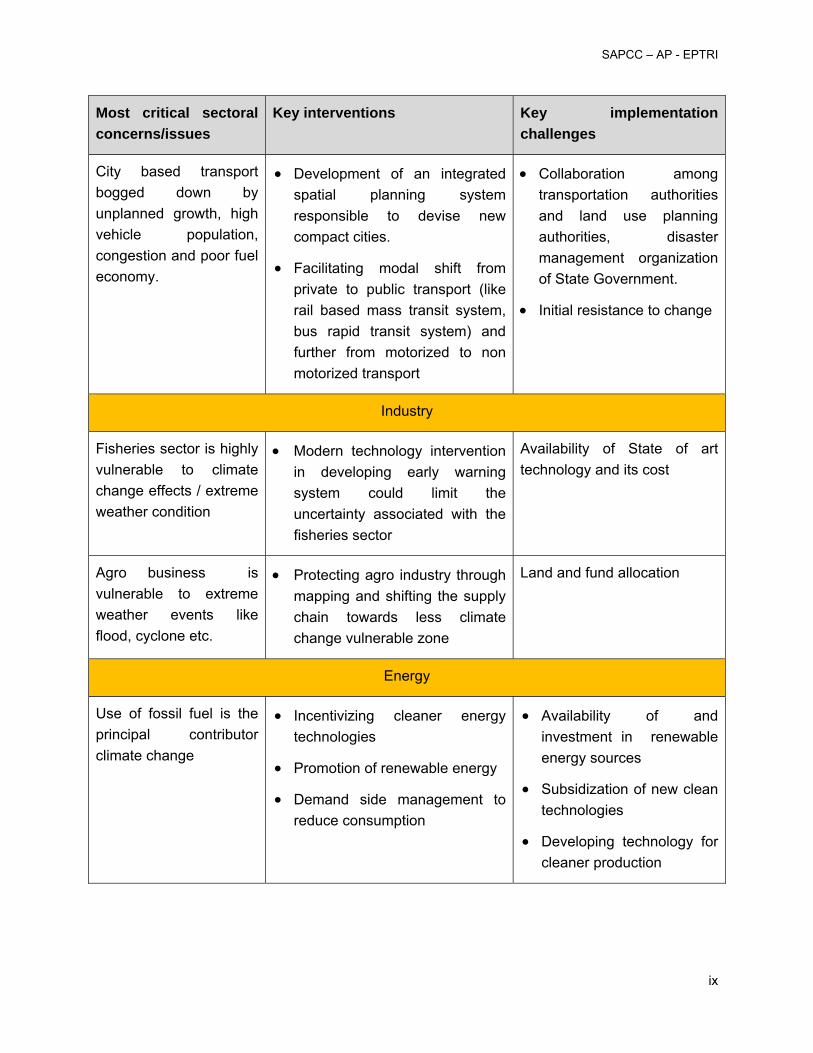
Most critical sectoral concerns/issues
Key interventions Key implementation challenges
City based transport bogged down by unplanned growth, high vehicle population, congestion and poor fuel economy.
• Development of an integrated spatial planning system responsible to devise new compact cities.
• Facilitating modal shift from private to public transport (like rail based mass transit system, bus rapid transit system) and further from motorized to non motorized transport
• Collaboration among transportation authorities and land use planning authorities, disaster management organization of State Government.
• Initial resistance to change
Industry
Fisheries sector is highly vulnerable to climate change effects / extreme weather condition
• Modern technology intervention in developing early warning system could limit the uncertainty associated with the fisheries sector
Availability of State of art technology and its cost
Agro business is vulnerable to extreme weather events like flood, cyclone etc.
• Protecting agro industry through mapping and shifting the supply chain towards less climate change vulnerable zone
Land and fund allocation
Energy
Use of fossil fuel is the principal contributor climate change
• Incentivizing cleaner energy technologies
• Promotion of renewable energy
• Demand side management to reduce consumption
• Availability of and investment in renewable energy sources
• Subsidization of new clean technologies
• Developing technology for cleaner production
SAPCC – AP - EPTRI
x
The SAPCC for Andhra Pradesh provides a common and generic framework to usher an era of climate resilient sustainable development for the State. The five key strategies for the State can be summarized as:
• Address State specific priority issues while creating appropriate environment for implementation of NAPCC at State level
• Mobilize stakeholders/institutions to work in a collaborative manner towards an integrated solution to CC through inter-departmental consultations, stakeholder involvement, regular planning and budgetary processes
• Mainstream CC Adaptation into State level planning and development in order to enhance climate resilience of the State economy
• Give importance to key economic drivers, food security, health and human settlements
• Safeguard natural resources and biodiversity from CC impacts
Proper coordination between local Panchayati Raj institutions, district administration, State Departments and Central Government would ensure successful implementation of adaptation and mitigation interventions and meet the objectives of the NAPCC at the State level.

SAPCC – AP - EPTRI
1
1 DESCRIPTION OF REGIONAL / STATE LEVEL CONTEXT: STATEMENT OF ISSUES AND PROBLEMS
1.1 Regional development issues and priorities vis-à-vis national priorities and NAPCC
a) What is Climate Change?
Climate change refers to a change in the State of the climate that can be identified (e.g. using statistical tests)…by changes that persist for an extended period, usually decades or longer. It refers to any change in climate over time, whether due to natural variability or as a result of human activity.” Climate change resulting from carbon dioxide (CO2) and other greenhouse gas (GHG) emissions viz. methane, nitrous oxide, hydrofluorocarbons, perfluorocarbons and sulphur hexafluoride is the gravest environmental challenge ever faced by the humanity. The global atmospheric concentration of CO2 has increased from pre-industrial level of 280 parts per million (ppm) to 379 ppm in 2005. Consequently, the global average surface temperature has already increased by 0.74°C from above pre-industrial times. IPCC Fourth Assessment Report projects that even if the concentrations of all greenhouse gases and aerosols are kept constant at year 2000 levels, a further warming of about 0.1°C per decade would be expected and in different emission scenarios, a further warming of 1.1ºC to 6.4ºC over the 21st century (best estimates: 1.8ºC - 4ºC) is likely to happen. Scientists warn that the impact of this increase on the ecosystem and human welfare would be severe, especially in the developing countries. With these facts in the background, the world is currently negotiating the targets and the burden-sharing mechanism to reduce the global GHG emissions post 2012.
b) The Global Initiatives taken
The first major step taken globally in the year 1988 was the setting up of the Intergovernmental Panel on Climate Change (IPCC). The panel was set up by the United Nations and World Meteorological Organization (WMO) to assess the technical issues that were being raised in debates on climate change, so policy makers are armed with facts from collective scientific endeavor. The IPCC comprises representatives from about 140 governments to consider the science that is currently known about climate change. The IPCC publishes reports that provide governments with a sound summary of knowledge and facts to debate from.
The other notable global action was taken by conducting the United Nations Framework Convention on Climate Change (UNFCCC) at the Rio, Brazil in the year 1992 to combat climate change.

SAPCC – AP - EPTRI
2
The Convention aimed at the stabilization of GHG concentrations in the atmosphere at a level that would prevent dangerous anthropogenic (man-made) interference with the climate system. This should be achieved within a time-frame sufficient to allow ecosystems to adapt naturally to climate change, to ensure that food production is not threatened, and to enable sustainable economic development. The convention concluded with the framing of the Kyoto Protocol. The Kyoto Protocol talks about setting up of binding targets for 37 industrialized countries and the European community for reducing greenhouse gas (GHG) emissions. This amounts to an average of five per cent against 1990 levels over the five-year period 2008-2012.
The Kyoto Protocol was adopted in Kyoto, Japan, on 11 December 1997 and entered into force on 16 February 2005. The Kyoto mechanisms are the major attraction of the protocol as they have attained a lot of importance and attention in the market economy. The Kyoto Protocol offers them an additional means of meeting their targets by way of three market-based mechanisms. The Kyoto mechanisms are Emissions trading – known as “the carbon market", Clean development mechanism (CDM) and Joint implementation (JI). The mechanisms help stimulate green investment and help Parties meet their emission targets in a cost-effective way.
The most recent event held was the United Nations Climate Change Conference (COP 16) Cancún, Mexico, from 29 November to 10 December 2010. The outcome of the summit was an agreement adopted by the States' parties that called for a large "Green Climate Fund," and a "Climate Technology Center" and network. It looked forward to a second commitment period for the Kyoto Protocol.
c) India’s response to the global initiatives
• India is the world’s fourth largest economy and fifth largest GHG emitter with a total GHG emission of 1727.71 (with LULUCF) for the year 2007.
CO2 emissions were 1221.76 million tons; CH4 emissions were 20.56 million tons; and N2O emissions were 0.24 million tons
• vulnerable to climate change mainly because of the existence of large costal belt, GHG
emissions from Energy, Industry, Agriculture, and Waste sectors constituted 58%, 22%, 17% and 3% of the net CO2 eq emissions respectively.
• India is dependence on agriculture and coastal habitations. • The monsoons are shifting westwards making central India drier. The number of rainy
days is decreasing and amount of rainfall in a single day is increasing.

SAPCC – AP - EPTRI
3
• The mean and maximum temperatures analysed for 12 of the major Indian cities show an increase, as do the sea temperatures and the droughts, which have increased over the past 3 decades. The projections for the last quarter of 21st century shows more variations in northern India and over Himalayas that puts the Himalayan glaciers at threat.3
India has in place a number of key statutes, institutions, policies and programs that provide a framework for GHG abatement in the cities. While there is no single comprehensive low carbon policy or programme, there are policies and programs, which address CC issues directly or indirectly.
Many of these policies are contained in the Five Year Plans developed by the Planning Commission to guide economic policy in India. For instance, the Eleventh Five Year Plan (2007-2012), commits the country to reduce energy intensity of GDP by 20 percent between the period 2007 and 2017. The Eleventh Plan also seeks to boost access to cleaner and renewable energy by exploiting existing resources (e.g., hydropower and wind power) developing nuclear power, and also supporting research in newer areas such as bio fuels from agro-waste and solar energy4
Other policies are found in the Integrated Energy Policy approved by the Planning Commission in 2006 with the broad objective of meeting energy demand “at the least cost in a technically efficient, economically viable and environmentally sustainable manner.”
In December 2005, the Government of India launched the Jawaharlal Nehru National Urban Renewal Mission (JNNURM) to encourage reforms and fast track planned development of 63 identified cities. JNNURM is directly funding these cities to undertake land-use planning, build infrastructure like urban transport and undertake water, sanitation and solid waste management projects. Many cities are implementing co-benefit projects under JNNURM to reduce their GHG emissions.
d) National Action Plan on Climate Change
India has a strong domestic agenda to counter climate change while constructively engaging with the international community to address global warming. However, in doing so India is facing the challenge of sustaining its rapid economic growth rate. India’s National Action Plan on Climate Change (NAPCC), released on 30th June, 2008, is the first major milestone to achieve the objectives of a socially inclusive and sustainable economic growth. The primary objective of 3 Indian Institute of Tropical Meteorology (IITM),2010 4 Eleventh Five Year Plan, Planning Commission, Government of India, 2008

SAPCC – AP - EPTRI
4
this national action plan was to maintain a high growth rate, while protecting the poor and vulnerable sections of society and achieve ecological sustainability.
The NAPCC identifies eight National Missions to provide a multi-pronged and integrated framework for addressing climate change. The focus of NAPCC is on adaptation/mitigation, energy efficiency and natural resource conservation and capacity building/stakeholder involvement on climate change issues.
The eight missions are: National Solar Mission, National Mission for Enhanced Energy Efficiency, National Water Mission, National Mission on Sustainable Habitat, National Mission for Sustaining the Himalayan Ecosystem, National Mission for a Green India, National Mission for Sustainable Agriculture and National Mission on Strategic Knowledge for Climate Change.
e) State Action Plan on Climate Change
In 2009, the Ministry of Environment and Forests called upon the States to expeditiously prepare the State Action Plans on Climate Change consistent with the strategy outlined in National Action Plan on Climate Change.
State Government of Andhra Pradesh is in the process developing the same. In doing so key prioritization blocks have been identified. A snapshot of the same has been presented in Exhibit 1, depicting key focus areas under national action plan and corresponding areas identified for Andhra Pradesh where State Government could contribute substantially.

SAPCC – AP - EPTRI
5
Exhibit 1: Priority areas under NAPCC
Some of the priority blocks are major contributors to climate change, where policy intervention is needed to mitigate the climate change effects. On the contrary there are few priority blocks which are exposed to the physical risks of climate change and here State Government has to be proactive in developing adaptation strategies. Strategy formulation has to be preceded by identification and analyzing the issues.
The aim of preparing the SAPCC for Andhra Pradesh is to get a fair idea about how the State’s key sectors would be affected due to CC and what adaptive/mitigation interventions to be taken to counter the same.
Objectives
• Identify key sectors and issues of the State in relation to climate change • GHG estimation for the State • Identify climate change risks and vulnerability of each identified key sectors • Formulation of adaption and mitigation action plan • Stakeholder consultation • Information and knowledge management for the State
India’s ‘N at iona l Act ion P lan on Clim ate Change ’: A nat iona l st rategy
- To adap t to cl im at e change- To enhance t he eco log ica l sust ainab il i ty
Pr io r i t y areas under t he nat ional p lan Pr iorit y b locks ident if ied for ‘St at e act ion p lan on c limat e change, Andhra Pradesh’
? Solar m is si on
? Mi ss i on f or enha nced ene rg y e f f i c ien cy
? Mi ss i on f or su st ai nabl e ha bit at
? Mi ss i on f or su st ai nin g Hi m al ay an ec o-sy s t em
? Wat er
? Mi ss i on f or gr een Indi a
? Mi ss i on f or su st ai nabl e ag ri c ult u re
? Mi ss i on f or st r at egi c know l edg e o f cl im ate c hang e
? Energy – exposed t o CC
? Indust ry - Mi t iga t ion
? Transport - M it igat ion ? Urban habitat – Mi t iga t ion /
Adap t at ion
? Fores t ry & bio dive rsit y –Adap t at ion
? A gricult ure – Adapt a t ion
Ot he r pr io r ity areas under t he na t iona l p lan? P rom o t ion of low carbon in t ensive power
gene ra t ion ; ? More and m or e Renewab le pow er gene ra t ion ? A dap t at ion plann ing t o f igh t cl im a t e c hange e ffect s
? Energy - Mit igat ion
? Healt h - A dapt a t ion ? Coasta l disast er m anagem ent -
A dap t at ion
? Se tt ing up of cl im a te dat a bank s and un ive rsit i e s
? Sust ainab le wa te r managem en t pract i ces

SAPCC – AP - EPTRI
6
f) Relevant climate change issues of the key sectors of the State
1. Forestry and Biodiversity:
The forest area in the State has remained unchanged since 2000 till about 2008 and stands at about 63,814 sq km which is about 23% of the total geographic area of the State5. It stands sixth in terms of forest area of Indian States;6 however it is much behind in terms of percentage area under forests (after almost 20 States). The average forest area per capita is 0.07 hectares, one of the lowest proportions in the world7.
Typical climate change related issues in the forestry sector of the State are:
• Wind erosion: Soil is eroded due to strong winds especially in deforested areas. The areas susceptible to soil erosion are situated near the forest hills and water flows through these areas through innumerable gullies, nallas etc to finally join a river. Flooding could further contribute to soil erosion, but could also deposit silt, leading to creation of fertile floodplains over time.
• Cyclonic storms and tidal waves cause damage to forests especially in the 9 coastal districts of the State.
• The area of degraded forest has shown a decreasing trend (CAGR of about -2%): from 35044 sq km in 1996 to 27681 sq km in 2000 and 23885 sq km in 2006. Presently, degraded forest area in the State is about 22775 sq km8. This is mainly due to reasons such as agricultural encroachment, quarries, coal mines, hydroelectric projects, shifting cultivation of the local communities and extraction of non timber forest products.
• Increasing acidity of sea water (due to more dissolution of CO2) imperils the growth and survival of plankton (i.e. fish food) which in turn leaves many fishes foodless. This also endangers the marine biodiversity of the State.
• Due to changes in climate, there is a disturbance in the timing of flowering and appearance of pollinators. Moreover, excessive use of pesticides/insecticides, loss of forests (natural habitats for pollinators), air pollution etc have also decreased the appearance of pollinators.
5 http://forest.ap.nic.in/Facts%20and%20Figures/facts_and_figures-2009.pdf page 6 6 http://www.frienvis.nic.in/forestcover2003/forestcovermain.htm 7 http://www.unep-wcmc.org/forest/restoration/docs/India.pdf 8 State of Forest Report-2008: Andhra Pradesh, Principal Chief Conservator of Forests, Hyderabad, page 4

SAPCC – AP - EPTRI
7
2. Coastal area:
Andhra Pradesh is one of the six States/ U.Ts of India adjoining the Bay of Bengal with a coastline of 974 km and continental shelf area of 33,227 sq. km. The average width of the productive continental shelf area is 32 km with rich pelagic and demersal fisheries. The continental shelf area narrows from north to south.9
Critical sectoral concerns related to climate change in coastal region are identified below:
• More than 103 cyclones have affected AP this century, of which 31 were severe cyclones. Scientific prediction says that both frequency and severity of cyclones will go up due to CC.
• East Coast is considered to be one of the most cyclone prone areas of the world. An analysis of A.P the frequencies of cyclones on the East and West coasts of India during 1891- 1990 shows that nearly 262 cyclones occurred (92 severe) in a 50 km wide strip on the East Coast.
• In coastal Andhra Pradesh, huge requirement of water for aquaculture and lack of irrigation facilities have caused dependence on groundwater, reportedly resulting in seawater intrusion.
• Out of 31.57 million people from coastal districts of Andhra Pradesh, approximately 2.9 million are vulnerable to cyclones. According to an estimate by the Department of Disaster Management, Government of Andhra Pradesh, about 44 percent of the State is vulnerable to tropical storms and related hazards.
There is an increase in average earth temperature and corresponding increased sea-surface temperature, resulting in further volumetric expansion of sea surface leading to build up of more frequent and intensified cyclonic activity and associated storm surges in the coastal zone. The following table provides the record of maximum height of storm surges experienced by various coastal regions of Andhra Pradesh.
9 State of Environment Report A.P, 2009

SAPCC – AP - EPTRI
8
Table 1: Maximum height of storm surge of sea waves10
Place Maximum height
Kalingapatnam 2.8 m
Vishakhapatnam 2.6 m
Kakinada 3.0 m
Machilipatnam 5.5 m
Ongole 4.5 m
Nellore 2.8 m
• Lack of irrigation facilities, large scale aquaculture is leading to heavy dependence on
groundwater reportedly resulting in seawater intrusion into the fresh water aquifers in the east coast.11,12, 13 This is increasing salinity of soil and affecting agricultural productivity.
• Vishakhapatnam port appears in the OECD list of port cities on high risk and vulnerability to extreme climate change events14
• Construction of thermal power plants, pharmaceutical plants ports, ship breaking units and sand mining activities are causing coastal level erosion and severe marine pollution. As a result, the number of dead zones in the sea (i.e. area in the sea where no fish is found) and migration of fishes to deeper waters, have increased manifold in the past few years pressing fishing communities to distress and insecurity.15 Pronounced coastal erosion is mainly attributed to anthropogenic forcing16,17,18 like destruction of mangrove belt, extensive aquaculture, shrimp farming and black sand mining along the east coast of India.
10 Revenue (Disaster Management) Department, GoAP 11 Nageswara Rao,K.(2005), Seawater intrusion due to freshwater draft in coastal aquifers, Jalvigyan Sameeksha, Vol.20 12 Mahesha, A. (1995) Parametric studies on the advancing interface in coastal aquifers due to linear variation of freshwater level. Water Resource. Res., 31(10), 2437-2444. 13 Bithin Datta , Harikrishna Vennalakanti, Anirban Dhar” Modeling and control of saltwater intrusion in a coastal aquifer of Andhra Pradesh, India” Journal of Hydro-environment Research 3 (2009) 148-159 14Nicholls, R. J. et al. (2008), “Ranking Port Cities with High Exposure and Vulnerability to Climate Extremes: Exposure Estimates”, OECD Environment Working Papers, No. 1, OECD Publishing. doi: 10.1787/011766488208 Nicholls, R. J. et al. (2008), “Ranking Port Cities with High Exposure and Vulnerability to Climate Extremes: Exposure Estimates”, OECD Environment Working Papers, No. 1, OECD Publishing. doi: 10.1787/011766488208 -andhra-pradesh/} 16 Baskaran R (2004) Coastal erosion. Current Science, Vol., 86,p. 25 17 Hema Malini, B. and Nageswara Rao, K., 2004. Coastal erosion and habitat loss along the Godavari delta front – a fallout of dam construction (?). Current Science, Vol., 87, pp.1232-1236 18 Nageswara Rao, K. Subraelu, P., Venkateswara Rao, T., Hema Malini, B., Ratheesh, R., Bhattacharya, S., Rajawat, A.S. and Ajai, 2008. Sea-level rise and coastal vulnerability: an assessment of Andhra Pradesh coast, India through remote sensing and GIS, Journal of Coastal Conservation, Vol. 12, pp. 195-207, DOI: 10.1007/s11852-009-0042-2

SAPCC – AP - EPTRI
9
• As an estimate 9.2 km length of Andhra Pradesh coast is affected by erosion19 Erosion of the coastline is noticed along the Bay of Bengal at Uppada, Vishakhapatnam, Bheemunipatnam and on the northern side of the Godavari River, i.e., from the Godavari River mouth to the tip of Hope Island.20 Elongation and enlargement of Hope Island in the north and northwest directions is remarkably visible from the increase in the length of sand spit in last century as tabulated below:
Table 2: Increase in length of Hope Island spit
Year Length of Hope Island Spit, km
1937-1938 15.60
1975-1976 16.33
1986 16.93
1996 17.75
1998 18.00
2001 18.20
3. Transport:
Increase in fuel combustion due to increase in transportation, and corresponding GHG emissions are major concerns for Andhra Pradesh.
Key issues
• Urban area The sudden growth of cities and large-scale migration of rural population to urban
areas has increased the population and density. The population is disproportionate to the available infrastructural facilities21. Higher population and rising income levels have increased the vehicular population multi-fold (almost 200% in the last 10 years).
19 National Hydrographic Office, Dehradun 20 R. Ramasubramanian, L. Gnanappazham, T. Ravishankar and M. Navamuniyammal,” Mangroves of Godavari – analysis through remote sensing approach” Wetlands Ecology and Management (2006) 14: 29–37 21 Report published on Hyderabad city by Centre of Science and Environment

SAPCC – AP - EPTRI
10
The share of public transport is low; share of public transport in Hyderabad is 44% which is far below the global best practices
Because of the high vehicle population in urban area road congestion has become a growing concern, resulting in poor fuel economy.
• Although incentive program is there in place (like tax exemption for battery / compressed natural gas / solar power driven vehicles) penetration of low carbon fuel usage is negligible. Andhra Pradesh holds tremendous potential in Natural Gas availability. However In
comparison to the potential, mobilization of CNG in transportation sector is not adequate (In Hyderabad 1623 vehicles are CNG driven; a mere 0.08% of the total vehicle population of Hyderabad.22)
• Lack of organized efforts to promote fuel efficiency improvement and eco-driving habits for ‘vehicles in use’ among drivers or owners of the vehicles (private or governmental).
4. Health Care
During the last few decades there is considerable improvement in the health status of the population in Andhra Pradesh. Smallpox was eradicated. The prevalence of Malaria is expected to be reduced from 85 per 10000 population in 2000-01 to 30 per 10000 population by 2010-11. The Infant Mortality Rate23 and Maternal Mortality Ratio are reported to be 49% and 9.1 respectively. However the sickness in the community is dominated by communicable diseases including vector borne diseases water borne diseases and air borne diseases. However, the link between CC and human health is still not fully established.
Effects of Climate Change on Public Health of Andhra Pradesh: Extreme climate events are expected to become more frequent as a result of climate change. Climate extremes can have devastating effects on human societies. The effects of climate change are expected to have substantial impacts on our human settlements and our development trajectory. Priority health research areas for different risk factors resulting from climate change are shown in the following table.
22 Source: http://www.eai.in/ref/fe/nag/nag.html 23 Infant Mortality Rate (SRS 2009)

SAPCC – AP - EPTRI
11
Table 3: Priority areas for health research
Risk Factors Health effects Priority focus areas
Temperature, humidity, precipitation
Vector borne diseases Climate related diseases transmission dynamics, improved surveillance
Precipitation, water temperature
Water borne diseases Climate and water related diseases
Local air pollution and stagnant air masses
Air pollution related health effects
Combined effects of climate factors and air pollution, weather related allergens
Extreme heat or cold Temperature related illness
Improved prediction, warming and response
Source : Climate change and human health : WHO
Key issues related to the State of human health include the following:
• Impacts of Vector Borne Diseases • Impacts of Water- Borne Diseases • Impacts of Air pollution related health effects • Impacts of extreme weather related health effects
• Impacts of Vector Borne Diseases due to climate change: High morbidity exists in Andhra Pradesh due to transmission of infectious disease agents. The occurrence of these agents is sensitive to weather conditions. Vector borne diseases typically exhibit seasonal patterns related to temperature and rainfall.
Table 4: Districts affected by vector borne diseases24
Affected Districts Disease Cases Registered
Srikakulam
Malaria
90,676 (2006 to Feb 2009) Vizianagaram
Vishakhapatnam
24Andhra Pradesh State Report

SAPCC – AP - EPTRI
12
Affected Districts Disease Cases Registered
East Godavari
Khammam
Prakasam
Japanese Encephalitis
49 (2006 to Feb 2009) Anantapur
Warangal
Karimnagar
Guntur
Kurnool
Kadapa
Chittor
Overall State Dengue 1120 (from 2006 to May 2009
Chikungunya 549 (In the year 2009 till 27th May)
Changes in climate that can affect the potential transmission of vector-borne diseases include temperature, humidity, altered rainfall, soil moisture and rising sea level.
• Impacts of Water Borne Diseases due to climate change: Climate conditions affect the water availability and quality, the timings and intensity of rainfall can affect the transport of the disease causing organisms into the water supply, particularly in lower income area.

SAPCC – AP - EPTRI
13
Table 5: Districts affected due to water borne diseases25
Affected Districts Disease Cases Registered
Anathapur
Diarrhoea
61254 (2002 to May 2008) Kadapa
Nalgonda
Nizamabad
West Godavari
Rangareddy Cholera 631 (2002 to May 2008)
Nellore
Nizamabad
Rangareddy Jaundice 3514 (2002 to May 2008)
Hyderabad
Changes in climate that can affect the potential transmission of water-borne diseases include precipitation.
• Impacts of Air Borne Diseases due to climate change: Weather affects the concentration of harmful air pollutants. Much of the rural population of Andhra Pradesh cook using traditional biomass fuels (e.g., dung, crop residues, wood, and charcoal) which cause indoor pollution. Also, high vehicle population using fossil fuels results in exposure to very high concentrations of air pollutants.
25 Andhra Pradesh State Report

SAPCC – AP - EPTRI
14
Table 6: Districts affected by air borne diseases26
Affected Districts Disease Cases Registered
Nizamabad Tuberculosis Curative rate is low <80% (Based on quarterly report for 1st quarter 2009)
Rangareddy
Hyderabad H1N1 686 (April 2009 to October 2009)
Mahabubnagar
Changes in climate that can affect the potential transmission of Air-borne diseases include air currents, air temperature, moisture content etc.
• Impacts of extreme weather related health effects: Andhra Pradesh is experiencing extreme weather changes like cyclones, floods, droughts and heat waves. Along the Andhra Pradesh coast, the section between Nizampatnam and Machilipatnam is most prone to storm surges, causing deaths by drowning as well as outbreaks of diseases and injuries.
Andhra Pradesh has historically been prone to drought and has been the third highest drought prone State after Rajasthan and Karnataka. Starvation and malnutrition leading to vulnerability to disease or even starvation deaths are the consequences of droughts.
During the year 2003 (between May and June) heat wave conditions in Andhra Pradesh claimed more than 3,000 lives.
5. Urban Habitat
Indian cities are predicted to be at high risk due to climate change. This situation maybe accentuated due to 500 million people who are predicted to be added in 7000 urban settlements by 206027. Andhra Pradesh has also shown a large population shift to the urban areas over the last 100 years.
26 Andhra Pradesh State Report 27 McGranahan and Mercutollio, 2007

SAPCC – AP - EPTRI
15
Exhibit 2: Percentage of Urban Population in Andhra Pradesh
The rate of the growth of the urban population in Andhra Pradesh was 14.63% for the period of 1991-01 and the urbanization of the State is almost in concurrence with the urbanization of the country.
Vulnerabilities of the urban poor can be a direct result of climate change, such as flooding or drought, or an indirect result, such as higher incidence of disease or an increase in food prices. The impact of climate change on the urban poor is thus often disguised and entangled with other socio-economic and urban issues.
Key issues:
• Increasing energy use in the urban areas due to the changing pattern of urban livelihood and increasing average temperature/extended summer every year
• Drainage of the cities not adequate to accommodate the precipitations during the heavy rains.
• Demand on water resources due to the growth in the urban population and therefore increased pressure on the water supply infrastructure.
• Consequent generation of large quantity of sewage. • Generation of huge quantum of solid waste. • Increased threat to urban health due to vector borne diseases. • Increased rate of private transportation leading to huge pressure on the road
infrastructure and the increased level of the emissions across the urban regions.

SAPCC – AP - EPTRI
16
6. Rural Habitat
Majority of the rural population are largely dependent on agriculture, which is sensitive to climate.
Key issues:
• Deterioration of natural water resources and other ecological resources impacting the livelihood of rural population
• Due to lack of opportunities in the rural areas, there is large migration of rural population to urban areas, is in turn putting pressure on the urban infrastructure.
• The poor living along the coastal line are most vulnerable to disasters like floods and cyclones. The housing is mostly kutcha in nature.
7. Agriculture:
Agriculture plays a pivotal role in the economy of Andhra Pradesh with paddy, millets and cotton being the major crops
Rainfall
Erratic and decreased rainfall especially winter rainfall has a negative impact on winter crops (Rabi crops), especially in the rainfed areas. The NE Monsoon deviated from normal by -45% in 2008-09, -27% in 2006-07, 45% in 2005-06 etc. Rainfed agriculture is risky due to unpredictable rains. For example in Mahabubnagar in the year 2005-06, there was 61% excess rainfall while in Anantapur it rained 43% more than normal. However in the year 2008, districts like Mahaboobnagar, Srikakulam, Adilabad, Nalgonda recorded deficit rainfall in the range of 60-99%.
Temperature
Temperature fluctuations affect Rabi crops severely. Studies show that every 1deg C rise in temperature reduces wheat production by 4-5 million tons on a national scale. This would have severe implications for the crop production in Andhra Pradesh also. Heat waves result in dehydration of plants which is not regained by night. Damaging effect appears to be

SAPCC – AP - EPTRI
17
caused by rapid dissipation of reserve carbohydrates that slow down new leaf production and poor recovery from defoliation.
Power availability for agricultural purposes
Farm power intensity in the State is yet to achieve the envisaged level due to relatively slow adoption of tractor and other mechanical devices. The government has a target of 3.2kWh/ha, 3.6 kWh/ha and 4 kWh/ha in 2009-10, 2010-11 and 2011-12 respectively. Dependency and vulnerability of the sector on natural climatic events has caused crop failures and distress among the farmers.
Key issues:
• Decrease in winter rainfall has a negative impact on winter crops (Rabi crops) especially in the rainfed areas.
• Temperature fluctuations affect Rabi crops severely. • Heat waves result in dehydration of plants • The decrease in area under crops on account of insufficient rainfall, particularly in the
South- West Monsoon period.28 • Rainfed agriculture has become risky due to unpredictable rains. • Due to loss in vegetation, heavy run-off takes place resulting in wastage of water and
soil erosion. • Dryland areas (parts of Anantapur, Kurnool, Kadapa, west Guntur, east
Mahaboobnagar, Prakasam, Nalgonda) exist in the State where annual rainfall is less than 550 mm and farming is not viable29.
• Loss in fertility of soil in many areas due to excessive use of fertilizers and pesticides.
8. Mining
The State is endowed with a number of minerals such as Limestone (34% of the national deposit), Coal (10% of the national deposit), Mica (86% of the national deposit), Dolomite (11% of the national deposit), Bauxite (40% of the national deposit), Barytes (96% of the national deposit), Clays (30% of the national deposit), heavy mineral beach sands (40% of
28 Agriculture statistics 2009-10 29 http://agri.ap.nic.in/action/AgricultureActionPlan%202009-10.html page 6

SAPCC – AP - EPTRI
18
the national deposit). Most of the mining activity in the State is concentrated in Khammam, Warangal, Adilabad, Karimnagar, Prakasam and Anantapur districts..30
Key issues:
• Depletion and degradation of surface water , aquifers and leaching from dumps • Land degradation and large scale deforestation, noise and vibration, destruction of
habitat, loss of bio-diversity, • The activities in open cast coal mining like blasting, drilling, excavation, truck loading
and transportation are responsible for the increase of suspended particulate matter in the air
• Dislocation of human communities and health impacts on the community living in close proximity to the mine areas.
9. Tourism
Andhra Pradesh attracts the largest number of tourists among all the States. Recognition of importance of tourism for sustainability of local communities and heritage has led to theme-based and specialized forms of tourism. Prominent eco-tourism sites include Araku Valley, Borra Caves, Ananthagiri Hills in Visakhapatnam, and Horseley Hills in Chittoor District.
Andhra Pradesh is the leading State in the country in attracting maximum number of domestic tourists. In 2009, 15731 million domestic tourists visited Andhra Pradesh. This marks an increase of 14% over 2008. Because of its close connections to the environment and climate, tourism is considered to be a climate-sensitive32 economic sector like agriculture and transportation. Tourism is affected by a very wide range of environmental and socio-economic factors, and has been continuously adapting to challenges and crisis situations, such as natural disasters, epidemics, economic downturns, political events etc showing great resilience. Therefore, the capacity of the tourism sector to adapt to climate change is thought to be relatively high due to its dynamic nature.
30 State of environment report , AP , 2009 31 Tourism Policy 2010 32 Climate Change and Tourism-UNEP
SAPCC – AP - EPTRI
19
Key issues:
• Habitat loss and degradation, caused by logging for firewood and timber materials, are major threats to restricted-range of species. 33
• Poaching , hunting and unsustainable exploitation threaten both flora and fauna • Changes in coastal and marine systems, species and ecosystem services, damage
to infrastructure, water shortages and water contamination due to sea level rise, global warming and ocean acidification. Coral reef destruction, Mangrove destruction.
• Tourism transportation and usage of high carbon intensive fuels in resort/tourist spots cause high levels of CO2 emissions which increase the pollution levels in tourist places like Tirupati, Hyderabad etc. 34
1.2 Baseline profile assessment of the State
a) Demographic overview of the State
Andhra Pradesh occupies a total land area of 275,045 km2. The State has a total population of 8,46,65,533. The population density is 308 persons per sq. km. The male population is 4,25,09,881 and the female population is 4,21,55,652 forming a sex ratio of 992:1000. The literacy rate of the State is 67.66 %.35
Natural Resources
In the State as a whole, three distinct physical zones can be discerned, viz., i) the coastal plains, ii) the Eastern Ghats and iii) the Western pen plains. The coastal plains stretch along the State’s coast from the northern most point in Srikakulam district to the southernmost point in Nellore district. In the middle of this region is located the shallow fresh water lake of Kolleru covering an area of about 260 sq km during rainy season.
33 The Peacock Parachute Tarantula (Poecilotheria metallica) is a very rare, Critically Endangered spider known from a single location in the Eastern Ghats of Andhra Pradesh, India. 34 Balaji Colony, Gandhi Road and railway station with SPM recorded at around 350 µg/m3units in Tirupati. Increased pollution levels in Hyderabad have increased the incidence of respiratory disorders among the traffic police personnel from 0.36% in 2003 to around 3.5% in 2009 (APPCB, Hyderabad). 35 Census 2011
SAPCC – AP - EPTRI
20
River Basins
Andhra Pradesh is popularly referred to as a “River State”. Nearly 75% of the State territory is covered by the basins of three major rivers - Godavari, Krishna and Pennar and their tributaries. In addition, there are 17 other rivers like Sarada, Nagavali, Musi and other streams. The Godavari with its 1464 km length, of which about 772 km lies within the State, is the longest and the broadest river in South India
Climate
The State experiences tropical climate with slight variations depending on the elevation and maritime influence and varies according to the three regions. The rainfall is received from both the South-West and North- East monsoons, predominantly the former, but precipitation varies across the State. A detailed description is given in section 1.4.
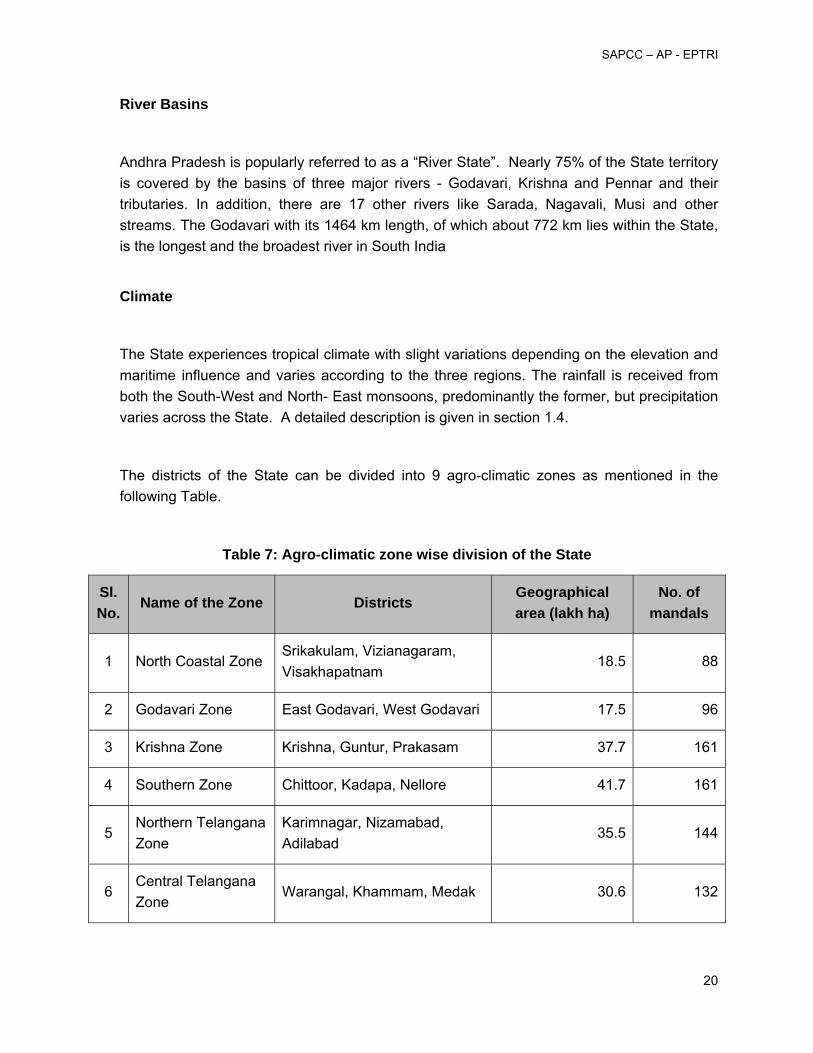
The districts of the State can be divided into 9 agro-climatic zones as mentioned in the following Table.
Table 7: Agro-climatic zone wise division of the State
Sl. No.
Name of the Zone Districts Geographical area (lakh ha)
No. of mandals
1 North Coastal Zone Srikakulam, Vizianagaram, Visakhapatnam
18.5 88
2 Godavari Zone East Godavari, West Godavari 17.5 96
3 Krishna Zone Krishna, Guntur, Prakasam 37.7 161
4 Southern Zone Chittoor, Kadapa, Nellore 41.7 161
5 Northern Telangana Zone
Karimnagar, Nizamabad, Adilabad
35.5 144
6 Central Telangana Zone
Warangal, Khammam, Medak 30.6 132

SAPCC – AP - EPTRI
21
Sl. No.
Name of the Zone Districts Geographical area (lakh ha)
No. of mandals
7 Southern Telangana Zone
Mahabubnagar, Nalgonda, Rangareddy (+ Hyderabad)
39.3 164
8 Scarce Rainfall zone
Kurnool, Anantapur 36.2 117
9 High Altitude & Tribal Areas Zone
High Altitude & Tribal Areas of Srikakulam, Visakhapatnam, East Godavari, Khammam and Adilabad districts
18 40
It is an agriculturally-prosperous State in India and has districts rich in mineral resources. With a gross irrigated area of over 60 lakh hectares. The State has Godavari and Krishna as the two major perennial rivers, each with its tributaries and also has over 17 small rivers and streams. The State has 63,814 sq. km of Forest area accounting to 23.2 % of the total geographical area36.
b) Economic overview of the State
Andhra Pradesh is regarded as one of the most progressive States of India today. GSDP grew at the rate of from 2.11 per cent in the 1960s to 3.03 percent in the 1970s; to 5.21 per cent in the 1980s and 5.42 per cent in the 1990s. After a moderate performance during the Ninth Five Year Plan (1997-98 to 2001-02), the economy of the State accelerated in the Tenth Five Year Plan (2002-03 to 2006-07), registering substantial growth rate. The table below depicts a comparison of rate of growth of GSDP of AP with Indian GDP.
36 AP Fact file, http://www.aponline.gov.in, accessed on 09 March 2011.

SAPCC – AP - EPTRI
22
Table 8: Trend Rate of growth in GSDP and Per capita GSDP: AP and All India
Year
AP India
GSDP Per capita GDP Per capita
1960-61 to 1970-71 2.11 0.26 3.43 1.23
1970-71 to 1980-81 3.02 0.94 3.38 1.12
1980-81 to 1990-91 5.21 3.04 5.37 3.24
1990-91 to 2000-01 5.42 4.01 5.94 3.98
2000-01 to 2004-05 5.89 4.83 6.08 4.37
1983-84 to 1993-94 5.93 3.85 5.23 3.14
1993-94 to 2003-04 5.66 4.46 5.83 3.98
2004-05 to 2005-06 13.88 12.7 14.08 12.3
2005-06 to 2006-07 17.62 16.1 16.61 15
2006-07 to 2007-08* 21.2 19.9 15.92 14.8
2007-08 to 2008-09# 13.98 13.3 15.3 13.4
2008-09 to 2009-10$ 13.4 14.5
2009-10 to 2010-11@ 18 17.3
At 1993-94 constant prices * Revised # Provisional $ Quick @ Advance
Source: New Series (1993-94) GSDP, Directorate of Economics & Statistics (DES), Hyderabad
Directorate of economics and Statistics, Andhra Pradesh and C.S.O., New Delhi

SAPCC – AP - EPTRI
23
Andhra Pradesh’s GSDP has almost doubled in the past five years from 224.7 thousand crores in 2004-05 to 415.8 thousand crores in 2008-09.37
Exhibit 3: Sectoral Trend Growth (in %) in A P
Exhibit No.3 represents trends of the sectoral growth of the State. In addition to the above trend in contribution toward GDP the following trend is reported in Human Development Report, 2007 for employment opportunities provided in the major sectors of the economy. The employment structure in urban Andhra Pradesh indicates that the share of the primary/agriculture sector is shrinking and is being replaced by an increase in the share of secondary and tertiary/service sectors38. For instance, between 1993-94 and 2004-05 the share of agriculture in total urban workforce in the State declined from 16 to 10%, whereas the share of the secondary sector increased from 28.8 to 29.8 and the tertiary sector has shown a 5.4% point increase from 54.8 to 60.2% during this period. Within non-agriculture, the growth of the workforce is higher in the service sector (2.8 percentage points) than the secondary sector (2.2%) during the same period. The share of manufacturing alone increased from 19 to 19.5% and the workforce in this sector grew at a rate of 2.1%. These
37 Directorate of Economics and Statistics, Andhra Pradesh and C.S.O., New Delhi 38 Primary Sector: Economic activity depends mainly on exploitation of natural resources-Agriculture and agriculture related activities are the primary sectors of an economy. Secondary Sector: Main activity involves manufacturing- All industrial production where physical goods are produced come under the secondary sector. Tertiary Sector: Activity involves providing intangible goods like services-Financial services, management consultancy, telephony and IT.

SAPCC – AP - EPTRI
24
facts indicate that the dominance of the service sector has been increasing in the urban economy.
The sectoral composition of GSDP of Andhra Pradesh shows that while the contribution of the primary sector (agriculture and allied industries) has been declining continuously (from 45% in 1980-81 to 24% in 2004-05), there has been a corresponding increase in both the secondary (19% to 25%) and tertiary (35 to 50%) sectors, though the growth of the latter is much higher.
During 1980s, GSDP growth averaged 6.03% - higher than the national GDP average growth of 5.68 %. In mid nineties there was a slippage. GSDP growth during 1995–2002 averaged 5.67%, which is lower than the national GDP average of 6.13%. The growth during the 10th Plan rose to 7.42%, just below the national average of 7.65. Based on the growth of 7.42% achieved during the 10th Plan, 9.5% annual growth in overall economy is projected during 11th plan (2007–2012). The sectoral projections are as follows:
• 5% for agriculture
• 10% for industrial sector
• 11% for livestock sector
Andhra Pradesh has witnessed development on the industrial front, with the Information Technology (IT) sector at the core of its growth. Andhra Pradesh has emerged as the preferred destination in the country for IT and IT enabled service providers.
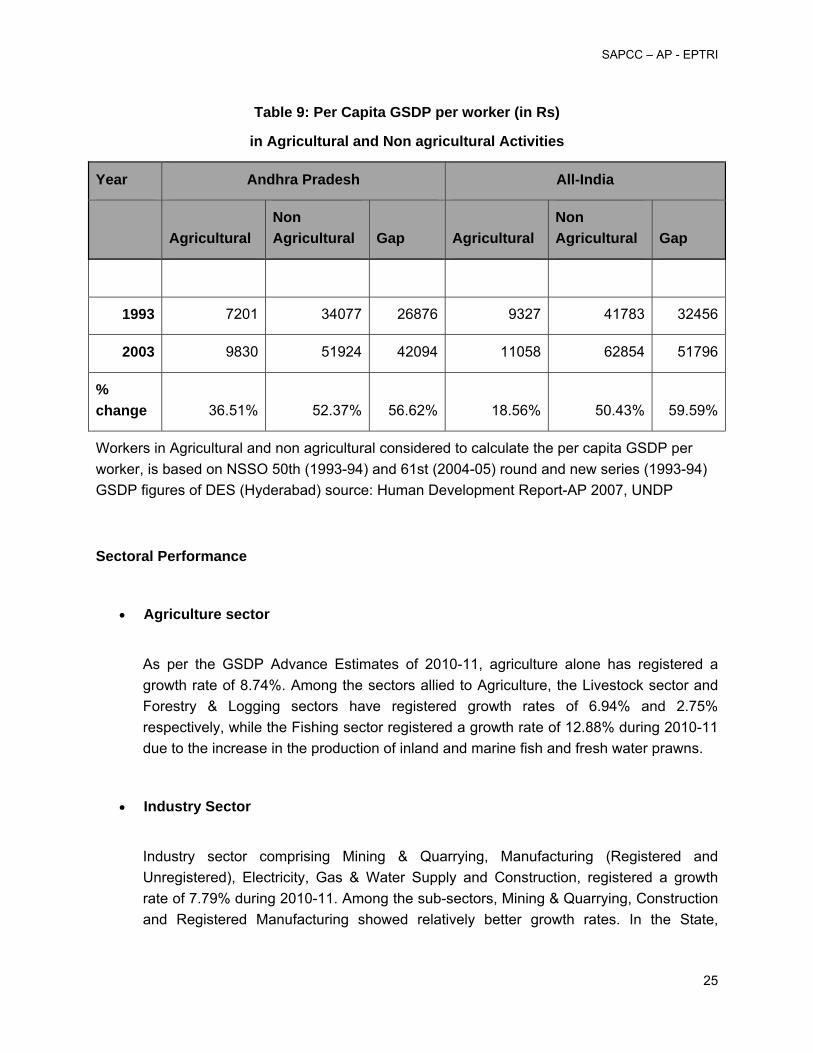
The following table gives a comparison of per capita GSDP per worker in Agricultural and Non Agricultural Activities. In agriculture (including agriculture related activities) per worker was Rs. 7201 in 1993-94 which increased to Rs. 9830 in 2004-05, an increase of 36.5%. On the other hand, the per capita GSDP value added in non-agriculture per worker increased by about 52.4% from Rs. 34077 to Rs. 51924 during the same period. The gap between agriculture and non-agriculture in terms of per capita value added per worker has increased from Rs. 26876 to Rs. 42094.39
39 Human Development Report-2007, AP, UNDP
SAPCC – AP - EPTRI
25
Table 9: Per Capita GSDP per worker (in Rs)
in Agricultural and Non agricultural Activities
Year Andhra Pradesh All-India
Agricultural Non Agricultural Gap Agricultural
Non Agricultural Gap
1993 7201 34077 26876 9327 41783 32456
2003 9830 51924 42094 11058 62854 51796
% change 36.51% 52.37% 56.62% 18.56% 50.43% 59.59%
Workers in Agricultural and non agricultural considered to calculate the per capita GSDP per worker, is based on NSSO 50th (1993-94) and 61st (2004-05) round and new series (1993-94) GSDP figures of DES (Hyderabad) source: Human Development Report-AP 2007, UNDP
Sectoral Performance
• Agriculture sector
As per the GSDP Advance Estimates of 2010-11, agriculture alone has registered a growth rate of 8.74%. Among the sectors allied to Agriculture, the Livestock sector and Forestry & Logging sectors have registered growth rates of 6.94% and 2.75% respectively, while the Fishing sector registered a growth rate of 12.88% during 2010-11 due to the increase in the production of inland and marine fish and fresh water prawns.
• Industry Sector
Industry sector comprising Mining & Quarrying, Manufacturing (Registered and Unregistered), Electricity, Gas & Water Supply and Construction, registered a growth rate of 7.79% during 2010-11. Among the sub-sectors, Mining & Quarrying, Construction and Registered Manufacturing showed relatively better growth rates. In the State,
SAPCC – AP - EPTRI
26
industries like Pharmaceuticals, Iron & Steel, IT Industry, Travel & Tourism, Food and Beverage and various other types of industries are coming to the forefront.
The contribution to GSDP from industries is 14.55% for the year 2007-08 against 12.87% in the year 2002-03. The table below shows distribution of various manufacturing/industrial establishments in State.
Table 10: Industrial Progress in A.P
Number of Registered factories in the State 1,62,499
Large scale enterprises 4,099
Micro and small enterprises 1,58,128
Industrial Estates/development areas 272
(Source: APIDC, 2009)
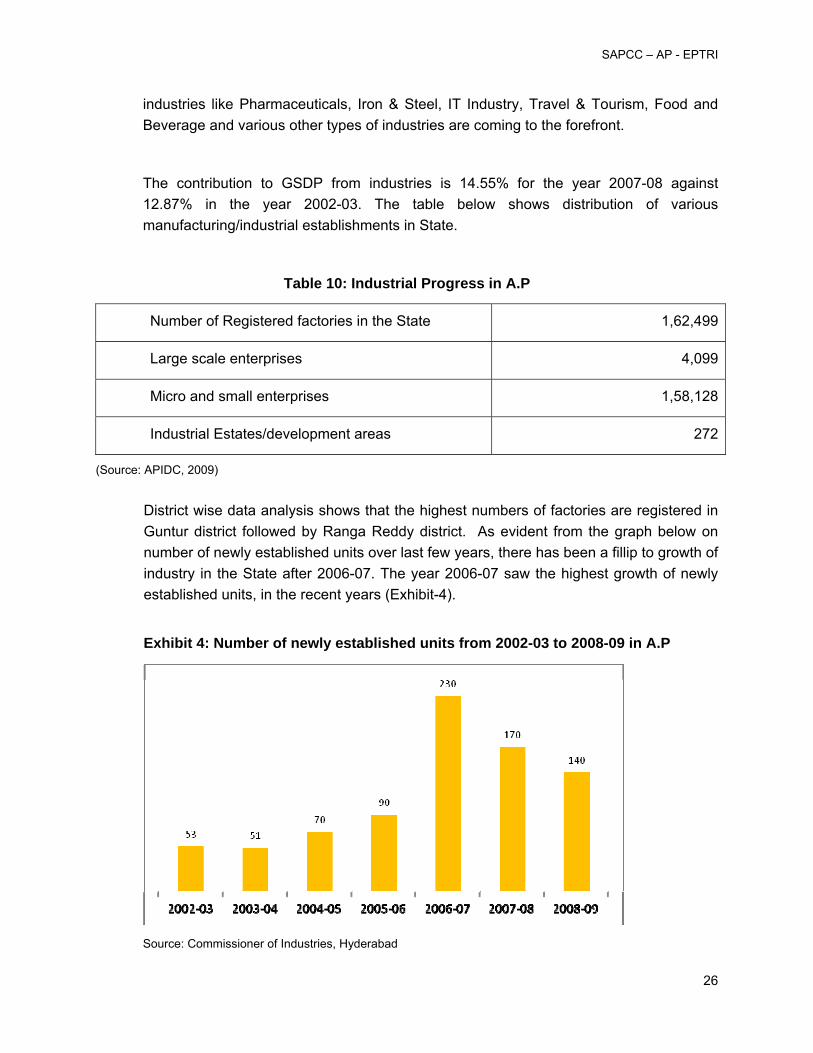
District wise data analysis shows that the highest numbers of factories are registered in Guntur district followed by Ranga Reddy district. As evident from the graph below on number of newly established units over last few years, there has been a fillip to growth of industry in the State after 2006-07. The year 2006-07 saw the highest growth of newly established units, in the recent years (Exhibit-4).
Exhibit 4: Number of newly established units from 2002-03 to 2008-09 in A.P
Source: Commissioner of Industries, Hyderabad

SAPCC – AP - EPTRI
27
• Service Sector
Service Sector comprising Trade, Hotels & Restaurants, Transport by other means & Storage, Communications, Banking & Insurance, Real EState & Business Services and Community, Social & Personal services registered a growth rate of 9.61% during the year 2010-11. Among the subsectors, Public Administration, Real EState, Ownership of Dwellings & Business Services and Transport by Other Means and Storage have shown significant growth. Within the service sector, employment in information and communication technology (ICT) related activities have been growing fast in Andhra Pradesh. More than 90% of the employment generated in this sector (ICT) is located in urban areas, especially in big cities like Hyderabad and Visakhapatnam.
Exhibit 5: District wise Human Poverty Index of districts of Andhra Pradesh
Human Poverty Index40 is developed considering flowing socio economic indicators: adult illiteracy rate and percentage of children (6-14 age) not attending school for education; infant mortality rate for health; and percentage of household without access to basic amenities like drinking water, housing, sanitation, cooking fuel and electricity for command over resources. From the above graph it can be concluded that between 1991 and 2001 the deprivation levels were brought down in all the districts. Importantly, the rate of decline during 1991-2001 in the level of deprivation was higher in those districts where levels of deprivation were relatively higher in 1991. But Mahaboobnagar was an exception and this was one backward district with the lowest rate of change during the period. However, the relative position of many districts did not change. The three most backward districts and
40 Human Development Report 2007, Andhra Pradesh 2007

SAPCC – AP - EPTRI
28
relatively the most deprived ones were Vizianagaram, Srikakulam and Mahabubnagar. Hyderabad, Rangareddy, Krishna and Guntur were districts that were the least deprived.
c) Land Use Patterns
Table 11: Land utilization in Andhra Pradesh from 1990-91 to 2007-08 (Area in Hectare)41,42
Land Use 1990-91 1994-95 1999-00 2004-05 2007-08
Total Geographical Area 27440049 27440049 27440049 27440049 27440049
Forest Area 6267989 6245404 6199225 6199225 6210000
Barren Land 2096413 2070137 2106539 2083664 2059000
Land Put to Non-Agricultural Purposes 2306746 2500203 2511583 2607795 2637000
Permanent Pastures 842961 762612 681674 676062 571000
Miscellaneous Trees 261863 246870 242560 277805 306000
Culturable Waste 780300 778800 781315 694418 659000
Other Fallows 1377459 1745019 1452004 1650702 1500000
Current Fallows 2484532 2726331 2760725 2818639 2719000
Net Sown Area 11021786 10364673 10610025 10327470 10756000
Area Sown More than Once 2170928 2418438 2413013 2191078 2811000
Total Cropped Area 13192714 1278111 13023038 12518548 13567000
The above Table clearly depicts that the land put to non Non-Agricultural activities had increased by 14% from 23.06 lakh ha in 1990-91 to 26.37 lakh ha in 2007-08. The area under fallow land also increased by 9.4% from 24.84 lakh ha to 27.19 lakh ha. The Land Utilization 41 Compendium of Area and Land Use Statistics of Andhra Pradesh, 1955-56 to 2004-05, Directorate of Economics and Statistics 42 An Outline of Agricultural Situation in Andhra Pradesh 2007-08, DES, Hyderabad

SAPCC – AP - EPTRI
29
Statistics for the year 2009-2010, out of the Total Geographical Area of 275.04 lakh hectares in the State, Net Area Sown including Fish Culture was 100.85 lakh hectare constituting 36.7 %. Area under Forest was 62.10 lakh hectare and accounted for 22.6 %. During the year 2009-2010 the Net Area Sown (including Fish Culture) decreased to 100.85 lakh hectares from 109.58 lakh hectares in 2008-2009, showing a decrease of 7.97 %.
The land utilization pattern of Andhra Pradesh is depicted in the following exhibit:
Exhibit 6: Land use Pattern of Andhra Pradesh43
37%
12%7%
2%1%
23%
10%
6%2%
Net Area Sown Current Fallow Barren & Uncultivable LandCulturable Waste Misc. Tree crops ForestLand put to Non Agricultural Uses Other Fallow Lands Permanent pastures
Andhra Pradesh has 63,814 sq. km. of forest area constituting 23.2% of the total geographical area. Exhibits 7 and 8 below give the distribution of forest into different classes in Andhra Pradesh and corresponding forest distribution across the State. Timber, Bamboo, Firewood, Charcoal, Beedi leaves etc are the major forest products of economic value.
A variety of 1800 species of medicinal and aromatic plants are cultivated on about 10,000 hectares in the State. Large scale cultivation of plants of medicinal value is carried out in the districts of Vishakhapatnam, Prakasam, Guntur and Anantapur. Amla, (Emblica officinalis), Vasa (Adhatoda Beddomei), Aloe Vera, Nelavemu (Andrographis paniculata), Aswagandha (Withania somnifera) and Coleus are the major medicinal plants cultivated in the State.
43 Agricultural statistics at a glance , AP 2009-10
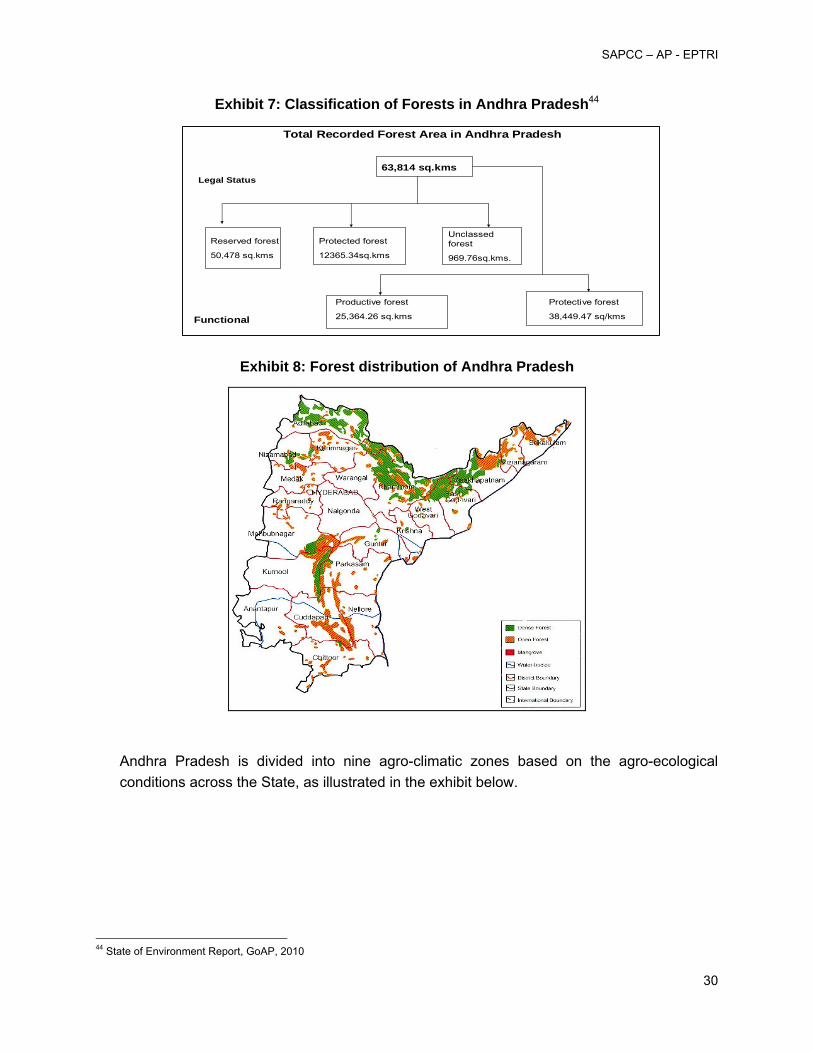
SAPCC – AP - EPTRI
30
Exhibit 7: Classification of Forests in Andhra Pradesh44
Exhibit 8: Forest distribution of Andhra Pradesh
Andhra Pradesh is divided into nine agro-climatic zones based on the agro-ecological conditions across the State, as illustrated in the exhibit below.
44 State of Environment Report, GoAP, 2010
Total Recorded Forest Area in Andhra Pradesh
Legal Status
Reserved forest
50,478 sq.kms
Protected forest
12365.34sq.kms
Unclassed forest
969.76sq.kms.
63,814 sq.kms
Functional
Productive forest
25,364.26 sq.kms
Protective forest
38,449.47 sq/kms

SAPCC – AP - EPTRI
31
Exhibit 9: Agro Climatic Zones of AP45
Krishna Godavari delta is one of the most fertile areas of Andhra Pradesh and is often referred to as the ‘Rice Bowl’ of South India. Besides rice Andhra Pradesh is also a leading producer of cash crops like Tobacco, Groundnut, Chillies, Turmeric, Oilseeds, Cotton, Sugar and Jute. Andhra Pradesh also produces some of the finest varieties of Grapes, Mangoes, Guavas, Sapotas, Papayas and Bananas.
With its strategic positioning in central region of the Indian subcontinent, The State favorable climatic conditions support a variety of flora and fauna. Besides the favorable climatic conditions Andhra Pradesh’s varied topography ranging from the hills of Eastern Ghats and Nallamallas to the shores of Bay of Bengal supports varied ecotypes, in turn supporting a rich diversity of flora and fauna. Andhra Pradesh’s forest can be divided into four major groups based on the biotic characteristics namely: Deccan Plateau (53%), Central plateau (35%), Eastern Highlands (11%) and Eastern Coastal plains (1%). Dry deciduous trees like Teak, Terminalias, Dalbergias, Pterocarpus, Anogeissus constitute the tree species found in forest of Andhra Pradesh. Beside these deciduous trees some rare endemic plants like Cycas beddomei, Pterocarpus santalinus, Terminalia pallid, Syzygium alternifolium, Shorea tumburgia, Psilotumnudam etc are also found in the State.
Double banded or the Jerdon’s Courser (rhinoptilus bitorquatus), the endangered, nocturnal and elusive bird is found in its last known habitat in Andhra Pradesh. Similarly, The Great Indian Bustard, a highly endangered species, found in Rollapadu Wildlife Sanctuary in Kurnool, the 45 Acharya N.G Ranga Agriculture University Handbook, 2009

SAPCC – AP - EPTRI
32
lone ideal habitat of this large handsome bird in Andhra. The Golden gecko and the Slender Loris are the other endemic and endangered species found in the State.
The hills of Eastern Ghats House a rich biological diversity for a variety of flora and fauna to flourish. It provides a natural habitat for a diversity of fauna ranging from Tiger, Panther, Wolf, Wild Dog, hyena, Sloth Bear, Gaur, Black Buck, Chinkara, Chowsingha, Nilgai, Cheetal, Sambar and number of birds and reptiles.
Beside this coastal region of Andhra Pradesh provides a breeding ground for endangered sea turtles and a variety of fish species like Oil Sardines, Anchovies, Lesser Sardines, Penaeid Prawns, Mackerel, Ribbon Fishes, Carangids, Croakers, Perches and Crabs. The backwaters of Pulicat Lake are feeding grounds for rare bird species like Flamingo & Grey Pelican. Mangrove forests housing Fishing Cat and Otters can be found spread over the estuaries of Krishna and Godavari rivers. The dominant mangrove vegetation comprises Rhizophora mucronata, R. apiculata, Avicennia marina, A. alfa, A. officinalis, Ceriops decandra, Bruguiera gymnorrhiza, Lumnitzera racemosa, Sonneratia apetala, Excoecaria agallocha, Acanthus ilicifolius, Xylocarpus moluccensis, Suaeda nudiflora46.
1.3 Identification of main local stakeholders
Analyzing the capacity of stakeholders to cope with and adapt to climatic events is fundamental in characterizing current and possible future vulnerability. Understanding the role of stakeholders in the decision-making process will assist in the implementation of adaptation policies. In short, stakeholders are central to the adaptation process. A participatory approach has been adopted for preparation of the CCAP comprising of a range of stakeholders as well as individual consultations. Over 200 stakeholders representing a cross section of government institutions, administrators, national NGOs, professionals, and academia covering a wide range of sectors were engaged in the process. The stakeholder capacity building workshops were organized in Hyderabad, Tirupati, Visakhapatnam and Vijayawada. Stakeholders also discussed and communicated their views and opinions on sectoral climate change issues.
Participatory initiatives are more likely to be sustainable because they build on local capacity and knowledge, and because the participants have “ownership” of any decisions made and are thus more likely to comply with them. Participatory initiatives are thus more likely to be compatible with long-term development plans. This can help decision-makers gain greater
46 Central Marine Fisheries Research Institute, (CMFRI),2008

SAPCC – AP - EPTRI
33
insight into the communities they serve, enabling them to work more effectively and produce better results. In turn, the communities can learn how the decision-making process works and how they can influence it effectively.
The process of working and achieving things together can strengthen communities and build adaptive capacity through developing awareness of the issues within the community, as well as finding ways to address them. It can reinforce local organizations, and build up confidence, skills and the capacity to cooperate. In this way it increases people’s potential for reducing their part of vulnerability. This, in turn, empowers people and enables them to tackle other challenges, individually and collectively. The CCAP has been designed with stakeholder participation, through priority-setting and voicing preferences, and accords with people’s right to participate in decisions that affect their lives. Processes of engagement can improve the likelihood of equity in decision-making and provide solutions for conflict situations.
Details of stakeholder consultation are as in Chapter 9.
1.4 Past and on-going climate change trends
a) Climate and Temperature
The State has a tropical climate with moderate to subtropical weather. Humid to semi humid conditions prevail in the coastal areas while arid to semi-arid situations are prevalent in the interior parts of the State, particularly Rayalaseema and some districts of Telangana. The areas covered by Deccan Plateau are characterized by hot summers with relatively mild winters. Summer temperatures range from a mean maximum of 40°C to a mean minimum of 30°C, while winter temperatures range from 22°C to 14°C47. The monsoon season from June to December registers rainfall of about 89 cms. In coastal areas, the mean maximum temperature ranges from 27oC to 30oC in January and from 34oC to 41oC in May which is the hottest month. The mean minimum temperature varies from 17oC to 20oC in December, which is the 48coolest month, to 27oC or 28oC in May and June. In Rayalaseema region, the mean maximum temperature ranges from 30oC in December to 40oC in May. Maximum temperature even up to 47oC has also been recorded though for few days. In Telangana region, the mean maximum temperature varies between 40oC and 43oC in May and the mean minimum temperature is 13oC to 17oC in December and January. The minimum temperature falls rapidly after October, and less than 10oC has also been recorded on individual days.
47 Draft Andhra Pradesh State Disaster Management Plan, Volume 1 (August 2010) , Government of AP 48 State of Environment Report for Andhra Pradesh (2009) Submitted to MoEF
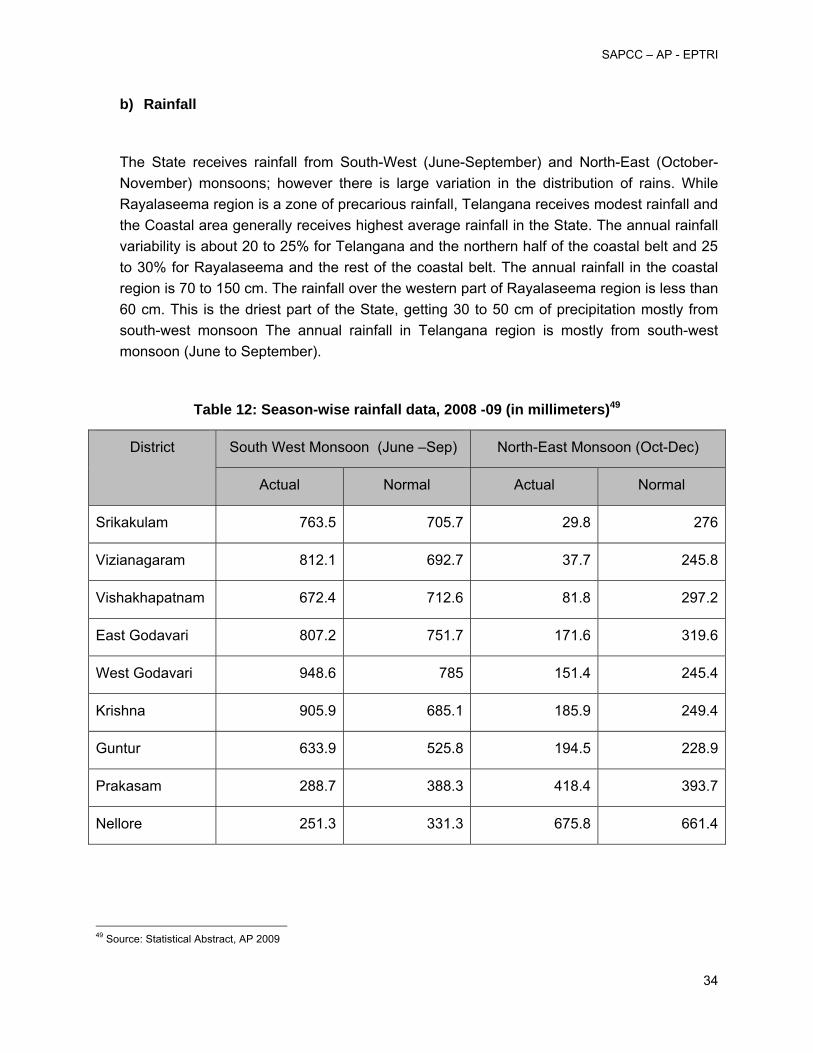
SAPCC – AP - EPTRI
34
b) Rainfall
The State receives rainfall from South-West (June-September) and North-East (October-November) monsoons; however there is large variation in the distribution of rains. While Rayalaseema region is a zone of precarious rainfall, Telangana receives modest rainfall and the Coastal area generally receives highest average rainfall in the State. The annual rainfall variability is about 20 to 25% for Telangana and the northern half of the coastal belt and 25 to 30% for Rayalaseema and the rest of the coastal belt. The annual rainfall in the coastal region is 70 to 150 cm. The rainfall over the western part of Rayalaseema region is less than 60 cm. This is the driest part of the State, getting 30 to 50 cm of precipitation mostly from south-west monsoon The annual rainfall in Telangana region is mostly from south-west monsoon (June to September).
Table 12: Season-wise rainfall data, 2008 -09 (in millimeters)49
District South West Monsoon (June –Sep) North-East Monsoon (Oct-Dec)
Actual Normal Actual Normal
Srikakulam 763.5 705.7 29.8 276
Vizianagaram 812.1 692.7 37.7 245.8
Vishakhapatnam 672.4 712.6 81.8 297.2
East Godavari 807.2 751.7 171.6 319.6
West Godavari 948.6 785 151.4 245.4
Krishna 905.9 685.1 185.9 249.4
Guntur 633.9 525.8 194.5 228.9
Prakasam 288.7 388.3 418.4 393.7
Nellore 251.3 331.3 675.8 661.4
49 Source: Statistical Abstract, AP 2009

SAPCC – AP - EPTRI
35
c) Humidity
Humidity is high in the coastal belt throughout the year with an average of 70 to 80% in the morning but decreases in the afternoon by 10 to 15% in the areas away from the coast. In the interior, the afternoon values are low and the humidity drops sometimes even below 30%. High humidity50 (70 to 80%) also prevails in the morning over Rayalaseema from July to November. The humidity is 50 to 60% in the morning and 25 to 35% in the afternoon from February to May. March is the driest month, when the relative humidity drops down to less than 20% in the afternoon. In Telangana, humidity is as high as 80% during monsoon months (July-September). In the dry months of March, April and May, humidity is generally low with an average of 25 to 30%.
d) Cyclones
Along Andhra Pradesh coast, the section between Nizampatnam and Machilipatnam is most prone to storm surges. Andhra Pradesh coast between Ongole and Machilipatnam is recognized as vulnerable to high surges among the segments of the east coast. The severity of the cyclone and storm surge is expected to increase as a consequence of climate change.
Table 13: District-wise distribution of cyclones crossing AP coast (1891-2009)51
Sl. No
District No of Cyclones
Severe Cyclone Medium-Normal Cyclone
1 Nellore 11 21
2 Krishna 8 15
3 East Godavari 4 11
4 Srikakulam 4 10
5 Vishakapatnam 3 7
6 Prakasham 2 4
50 State of Environment Report for Andhra Pradesh (2009) Submitted to MoEF 51 Revenue (DM) Department, Government of Andhra Pradesh

SAPCC – AP - EPTRI
36
Sl. No
District No of Cyclones
Severe Cyclone Medium-Normal Cyclone
7 Guntur 1 2
8 West Godavari 0 0
9 Vijayanagaram 0 0
Table 14: Human, livestock and crop losses recorded between 2003 & 2008
Type of Calamity
Date No. of Districts affected
Population affected
(lacs)
Human casualty
Livestock losses
Houses damaged
Cropped area damaged
Estimated value of loss (Cr INR)
Cyclone 15-16 Dec, 2003
6 42.68 44 102324 17147 265741 765.92
Source: Revenue (Disaster Management) Department, GoAP
An analysis of the frequencies of cyclones on the East of India during 1891- 1990 shows that nearly 262 cyclones occurred (92 severe) in a 50 km wide strip on the East Coast52, The recorded frequency of cyclones per year along the Bay of Bengal is four and inevitably one of the four transforms into a severe cyclone causing human and property losses Severe cyclones have become common events occurring every two to three years. Out of 31.57 million people living in the coastal districts of AP, approximately 2.9 million are vulnerable to cyclones53. Loss of lives and livestock is compounded by the loss of agricultural crops. While the nine coastal districts of Andhra Pradesh are severely vulnerable to cyclonic storms and damages resulting due to cyclones, agricultural crop losses could be devastating.
e) Floods
Floods by nature depend on several factors; one being incessant rains, cyclonic rains in a short period of time crippling natural drainage. However, other factors such as nature of the
52 State Disaster Management Plan, 2010, GoAP 53 Revenue (Disaster Management II) Department, GoAP

SAPCC – AP - EPTRI
37
collecting basin, nature of the streams, type of soil, natural and man-made vegetation, amount of rainfall etc. determine the type and extent of floods.
The Godavari and the Krishna rivers have well-defined stable courses; their natural and manmade banks are capable of carrying flood discharges with the exception of their delta areas. Floods often caused by unplanned growth, improper upkeep of drainage systems and mismanagement of discharges from dams though they are erroneously thought to be always of natural origin.
Exhibit 10: Flood hazard map of the State54
f) Droughts
Revenue (Relief) Department, Government of Andhra Pradesh defines drought as a condition arising out of scarce rainfall. Central Water Commission defines drought as a situation occurring when the annual rainfall is less than 75% of the normal (defined over 30 years average). Drought is a normal, recurrent feature of climate. It occurs in virtually all climatic zones, but its characteristics vary significantly from one region to another. Andhra
54 Source: BMPTC, MoHUPA, Vulnerability Atlas of India

SAPCC – AP - EPTRI
38
Pradesh has historically been prone to drought like conditions especially in Rayalaseema, Telangana, parts of Andhra region and has been third highest drought prone State after Rajasthan and Karnataka55.
Exhibit 11: Periodicity of occurrence of Drought in various parts of the country56
g) Heat Waves
A heat wave is a climatologically extreme event involving abnormally higher temperature relative to normal57 during the months of April-June. During the year 2003 (between May and June) heat wave conditions in Andhra Pradesh claimed more than 3,000 lives.
1.5 Risk management actions: Actions already taken by State to safeguard against climatic impacts
The State has implemented interventions in different sectors, some of which are discussed below.
55 Drought in Andhra Pradesh: Long term impacts and adaptation strategies, South Asia Environment and Social Development Department, World Bank, September 2005 56 Crisis Management Plan - Drought, Ministry of Agriculture, Government of India 57 Draft Andhra Pradesh State Disaster Management Plan, Volume 1 (August 2010), Government of AP

SAPCC – AP - EPTRI
39
Implemented Adaptation interventions for Health Sector:
• National Vector Borne Diseases Control Programme • Revised National TB Control Programme • Maternal and Infant deaths control programme • Education and literacy are the major adaptation moves
Implemented Adaptation interventions for Coastal Habitat:
• Cyclone shelters have been constructed in coastal villages that are prone to cyclones in coastal districts. There is also a major NDMA and ward level funded programme for cyclone shelters.
Table 15: Existing cyclone shelters district wise
District No of villages with
cyclone shelters
Srikakulam 139
Vizianagaram 42
Vishakapatnam 146
East Godavari 170
West Godavari 66
Krishna 166
Guntur 120
Prakasam 90
Nellore 191
Khammam 6

SAPCC – AP - EPTRI
40
• India Meteorological department has a well established organizational setup for cyclone observation, tracking, forecasting and issuing cyclone warning through its cyclone warning center located in Vishakhapatnam.
• Restoration of over 500 hectares of mangroves in India's Andhra Pradesh region has cost $3 million over seven years, but has increased the population of edible crabs and fodder for livestock thereby boosting local incomes while increasing biodiversity such as otter and birds.58
• Andhra Pradesh has a strong flood monitoring system. • Water harvesting measures and building infrastructures to control the consequences of
drought. • Coastal Regulation Zone Notification 2011, envisages prohibition of certain activities
and regulation of certain other activities over 500 m width of the coast from High Tide Line (HTL).
• In 1998, the Department of Ocean development established the Integrated Coastal Zone Management (ICZM) project directorate. Preparation of Integrated Coastal Zone Management Plan, Coastal Vulnerability Maps is completed. A quantity of about 4 lakhs cu. mts. of sand is being pumped for the beach nourishment every year on Visakhapatnam port by incurring an expenditure of about INR 6.00 crores59.
• A number of monitoring and modeling exercise are in progress by central government like:
-Sea Level Monitoring and Modeling (SELMAM)
-Marine Satellite Information Service (Marsis)
-Coastal Ocean Monitoring & Prediction Systems (COMAPS)
Implemented Adaptation interventions for Agriculture Sector:
• Financial support to the farmers in the event of crop failure as a result of drought, cyclone incidence of pest & diseases etc.
• Crop Insurance • Adoption of inter cultivation • Stocking of quality seeds well in60 advance for immediate distribution for re-sowing in
the areas affected by drought and floods. • To encourage the farmers to adopt progressive farming practices, high value in-puts
and higher technology in agriculture.
58 Nellemann, C., E. Corcoran (eds). 2010. Dead Planet, Living Planet – Biodiversity and Ecosystem Restoration for Sustainable Development. A Rapid Response Assessment. United Nations Environment Programme, GRID-Arendal. www. grida.no 59 http://www.vizagport.com/Favourites/Environment.aspx 60 Website of Department of Agriculture (Government of AP)
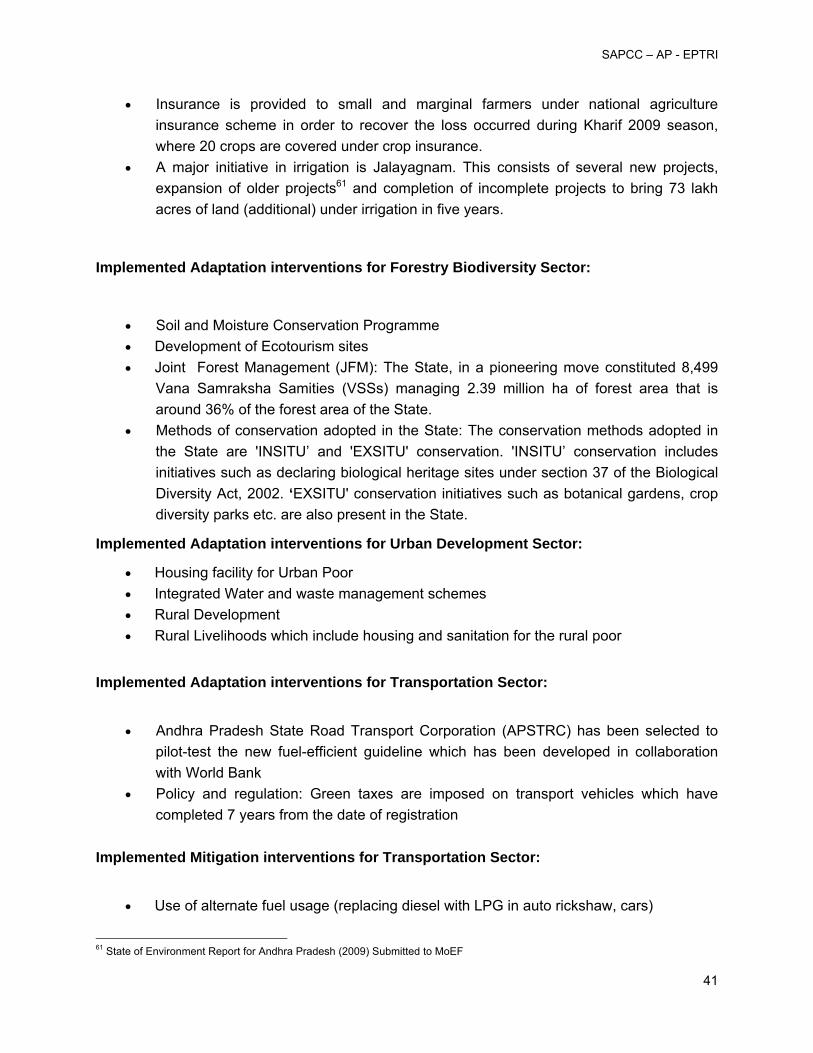
SAPCC – AP - EPTRI
41
• Insurance is provided to small and marginal farmers under national agriculture insurance scheme in order to recover the loss occurred during Kharif 2009 season, where 20 crops are covered under crop insurance.
• A major initiative in irrigation is Jalayagnam. This consists of several new projects, expansion of older projects61 and completion of incomplete projects to bring 73 lakh acres of land (additional) under irrigation in five years.
Implemented Adaptation interventions for Forestry Biodiversity Sector:
• Soil and Moisture Conservation Programme • Development of Ecotourism sites • Joint Forest Management (JFM): The State, in a pioneering move constituted 8,499
Vana Samraksha Samities (VSSs) managing 2.39 million ha of forest area that is around 36% of the forest area of the State.
• Methods of conservation adopted in the State: The conservation methods adopted in the State are 'INSITU’ and 'EXSITU' conservation. 'INSITU’ conservation includes initiatives such as declaring biological heritage sites under section 37 of the Biological Diversity Act, 2002. ‘EXSITU' conservation initiatives such as botanical gardens, crop diversity parks etc. are also present in the State.
Implemented Adaptation interventions for Urban Development Sector:
• Housing facility for Urban Poor • Integrated Water and waste management schemes • Rural Development • Rural Livelihoods which include housing and sanitation for the rural poor
Implemented Adaptation interventions for Transportation Sector:
• Andhra Pradesh State Road Transport Corporation (APSTRC) has been selected to pilot-test the new fuel-efficient guideline which has been developed in collaboration with World Bank
• Policy and regulation: Green taxes are imposed on transport vehicles which have completed 7 years from the date of registration
Implemented Mitigation interventions for Transportation Sector:
• Use of alternate fuel usage (replacing diesel with LPG in auto rickshaw, cars)
61 State of Environment Report for Andhra Pradesh (2009) Submitted to MoEF

SAPCC – AP - EPTRI
42
2 ASSESSMENT OF ADAPTIVE CAPACITY OF THE STATE
This section addresses the assessment and enhancement of the adaptive capacity of both the social and physical systems of the different districts of the State, so that these systems are better equipped to cope with the climate change, including variability.
Adaptive capacity is the property of a system, either social or physical, to adjust itself and expand its coping range under existing climate variability, or future climate conditions. In practical terms, adaptive capacity is the ability to design, implement and maintain an effective adaptation strategy for each of the social or physical aspects of the system, or to develop the ability to react to evolving hazards. The objective behind enhancement of the adaptive capacity is to reduce the stresses on the system due to the occurrence and/or the magnitude of harmful outcomes resulting from climate-related hazards. The adaptation process requires the capacity to learn from previous experiences to cope with current climate, and to apply these lessons to cope with future climate, including surprises.
The Adaptive Capacity of a system is represented by the set of instruments or resources available to the system to cope with the vulnerabilities arising out of the climate change effects. Such instruments of the system may include natural, financial, institutional or human, and might include access to ecosystems, information, expertise, and social networks.
The’ Adaptive Capacity’ for the different districts of the State of the Andhra Pradesh has been developed on the basis of the following key determinants of the adaptive capacity of each district:
• Economic status
• Demographic status
• Infrastructure status
• Education status
• Health status
These key determinants are estimated based on a set of determinants/factors which are already estimated by Human Development Report, 2007.

SAPCC – AP - EPTRI
43
Economic Resource
The Economic resource endowment is the indication of the capability of a district to adapt to the adverse effects of CC and therefore, higher economic resource endowment means higher adaptive capacity. However, there are a number of separate determining parameters which will give an overview of the economic status of the district. With a higher economic indicator, the district will be better equipped to face climate disorders and adapt to the changes.
Demographic Status
The Demographic status of the district denotes the position of the district in terms of the area and category (sex, caste etc) of the population. This gives an indication of the difficulty that the district may face to implement any adaptive interventions due to high population density.
Infrastructure facility
Development of infrastructure is important to enhance the climate resilience of a district or State. Therefore, with a higher infrastructure facility and better access to these facilities, the district can have a better adaptability towards climate change. In this aspect also there are a number of parameters which will aggregate to give an overview of the Infrastructure Indices of the district relative to the other districts of the State.
Education Status
Access to education is a major factor to develop CC adaptability through human capital endowment. Higher the literacy rate of the district, easier it is to disseminate knowledge of the climate disorders and build awareness amongst the population.
Access to Health Infrastructure
Climate change is always associated with a number of health issues. Therefore access to better health infrastructure help the population to adapt to the diseases and health problems arising out of the adverse effect of climate change. Therefore, better the health infrastructure and access to health, higher will be the Adaptive Capacity.

SAPCC – AP - EPTRI
44
Other Determinant(s)
Apart from these parameters, there are a number of the other parameters which also contribute to the development of the adaptive capacity, having either a positive or negative impact on the adaptive capacity. Therefore a few pre-calculated Determinant(s) have been used for the calculation of the Adaptive Capacity.
Table 16: Indicators identified for the aspects of Adaptive Capacity
Determinant Indicator Explanation
Economic Resources
Per capita GDP of the districts of the State
This aspect demonstrates the economic capability of the district. Higher the determinant, higher is the adaptive capacity.
Percentage of Agricultural workers
This determinant helps us to understand the percentage of the total workforce involved in agricultural activities. Since agriculture is highly prone to CC vulnerability, the higher the percentages of agricultural workforce lower will be the adaptive capacity.
Demographic Status
Area of the District Larger the area, higher the investment required and hence lower is the adaptive capacity.
Population and Population Density
This determines the density of the population in a district. Higher the value of population density, higher the number of affected people and higher will be the requirement of economic resource to fight any event. Therefore, a higher value of this indicator denotes a lower adaptive capacity.

SAPCC – AP - EPTRI
45
Determinant Indicator Explanation
Percentage of the Urban population in Slums
The urban population is disaggregated into urban poor and urban resilient. Higher the populations in the urban slums, lower will their access to the infrastructure for basic amenities. Therefore, this will lower the adaptive capacity.
Infrastructure facility
Road density
The Road density denotes the access of the population to the roadways. This will improve the ways to commute and therefore contribute to a higher adaptive capacity.
Percentage of population which has access to amenities like Bank and Post Office
The access to the basic amenities like banks and post office would improve the adaptive capability of the population by increasing the access to credit, savings and communications.
Percentage of population who have the access to telephones
Telecommunication facilities may be used as an effective system for issuing an early warning, providing updated weather information, agricultural information. Therefore, better telecommunication facility will contribute to a higher adaptive capacity.
Percentage of population living in kutcha houses
Better housing for poor improves the adaptive capacity.

SAPCC – AP - EPTRI
46
Determinant Indicator Explanation
Education Status
Percentage of population served by schools,
Higher the schooling and literacy rate of the districts, easier it will be to create climate change awareness. Therefore, the adaptive capacity is directly proportional to the literacy rate.
Literacy Rate of males and females
Access to Health Infrastructure
Percentage of population served by Primary Health Centers and Hospitals
Access to health care improves the capability of the population to have a better health. This therefore improves the adaptive capacity, since the population is equipped to withstand any outbreak of diseases as an effect of the Climate Change.
Environmental Determinants
Land, Forest, Water These parameter indices are taken from the Human Development Report 2007 developed by the Govt. of AP. The higher the indices, better the adaptive capacity of the district.
Safe Drinking Water, Sanitation and Fuel

SAPCC – AP - EPTRI
47
Approach for estimating the Adaptive Capacity
Each aspect of the determinant has been converted to a normalized index value. Each normalized index value of the aspects has been aggregated to obtain the determinant value and these determinant values have been again aggregated into an overall index of adaptive capacity. The main conceptual challenge in such an exercise is the disparate units for each of the individual indicators that make up each determinant. There are various ways for normalizing values of disparate units. One of the most notable was the normalization procedure applied for the Human Development Index (HDI) reported annually by the United Nations Development Programme (UNDP). The HDI combines different indicators of overall index of development.
The procedure for normalization is as follows:
(Value of District – Minimum Value of the District)
Normalized Value = - (1)
(Maximum Value of the District – Minimum Value of the District)
In the context of the Adaptive Capacity, the maximum and minimum values of each of the aspects of the determinant have been determined on the basis of the districts included in the index. This type of normalization process has been adopted due to its simplicity and relevance, particularly for indices whose purpose is to provide relative information.
In the context of climate change vulnerability assessment, such a normalization procedure was used in India by O’Brien et al. (2004). In the context of our adaptive-capacity index, the normalization procedure used is based on the above citations and presented below as equations.
(Value of District – Minimum Value of the District)
Normalized Value = - (2a)
(Maximum Value of the District – Minimum Value of the District)
(Where in the higher the value better the adaptive capacity)

SAPCC – AP - EPTRI
48
(Value of District – Minimum Value of the District)
Normalized Value = 1- - (2b)
(Maximum Value of the District – Minimum Value of the District)
(Where in the lower the value better the adaptive capacity)
Equation 2a and 2b were used to calculate normalized values for each of the determinant indicators relative across the different districts. Each indicator within a determinant was considered to be of equal importance and hence assigned equal weightage. Based on this equal weighting, a single aggregated value for the determinant was arrived at as the average of the normalized indicator values. Also, each determinant was considered to be of equal importance in calculating the overall adaptive capacity index for each district. Based on this assumed weighting, adaptive capacity index for each district was calculated as the average of the aggregated determinant values.
The following formula denotes the estimation of the Adaptive capacity based on the averaging method mentioned above:
----- (3)
Where,
Iij – The indicator for the ith Indices for the jth district
n – Total number of the Indices considered for the Adaptive capacity calculation.
Results
The capacity of each district to adapt to climate shocks and stresses is a major determinant of the sustainable and climate-resilient development of the State. The higher the adaptive capacity, the better the district is equipped to face the climate change exposures. However, the analysis and determination of the Adaptive Capacity is best undertaken from a relative

SAPCC – AP - EPTRI
49
perspective, wherein the adaptive capacity of a district is compared with the rest and also with the physical exposure of the district to climate variation. It is also important to remember that the indicator values are normalized scores of the actual original indicator aspect value i.e., they are scores which are relative to the value of the indicator in all other districts. These scores are numbers between 0 and 1 with a score of 1 signifying that a district has the highest value for this indicator compared to all other districts, while a score of 0 signifies that a district has the lowest indicator compared to the rest.
With development of the Adaptive Capacity index of the districts, the risks of the systems have been identified and the same should be considered while designing an adaptation project. For projects using the adaptive-capacity approach, it is possible to develop an adaptive capacity baseline. Since there are few clear, quantitative indicators of adaptive capacity, this baseline will generally be constructed from qualitative indicators. Based on the existing adaptive capacity an adaptation strategy for each district can be developed to improve their coping capability over and above the baseline. Policies should provide individuals, communities and organizations with sufficient flexibility to pursue adaptation strategies appropriate to their circumstances depending on their existing adaptive capacity index. New policies should be assessed in terms of their potential impacts on adaptive capacity, particularly for groups and systems that already exhibit high vulnerability and/or exposure to climate hazards.
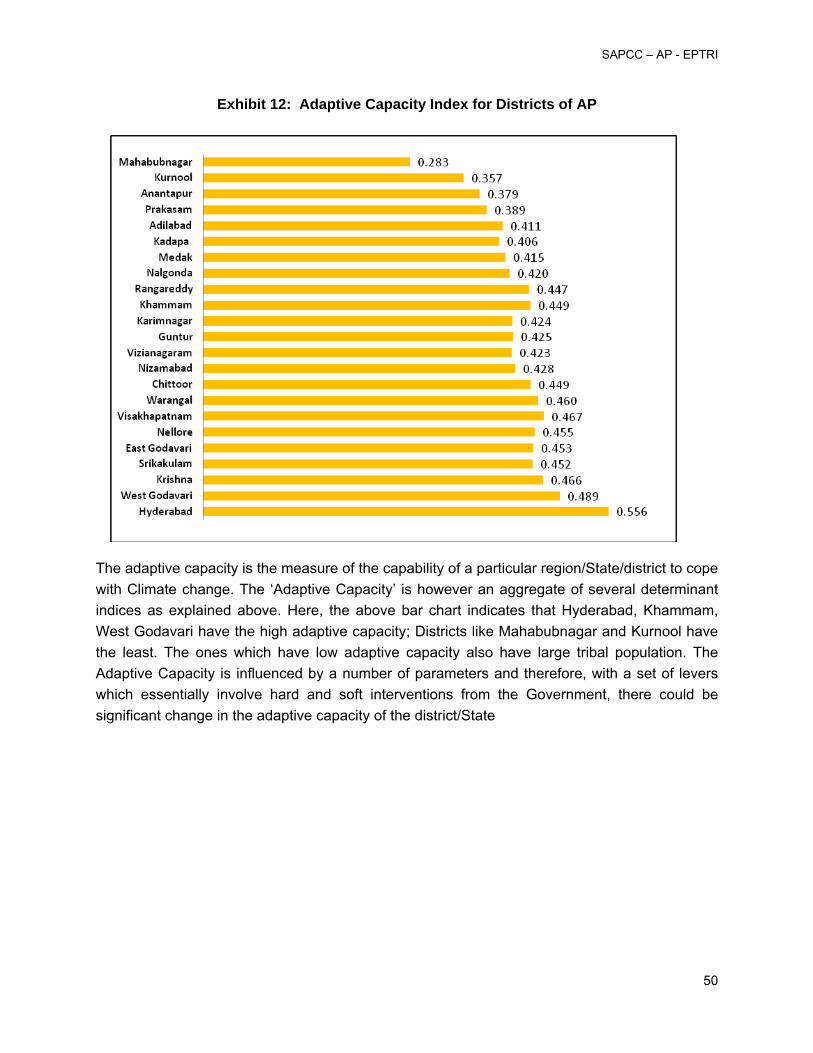
SAPCC – AP - EPTRI
50
Exhibit 12: Adaptive Capacity Index for Districts of AP
The adaptive capacity is the measure of the capability of a particular region/State/district to cope with Climate change. The ‘Adaptive Capacity’ is however an aggregate of several determinant indices as explained above. Here, the above bar chart indicates that Hyderabad, Khammam, West Godavari have the high adaptive capacity; Districts like Mahabubnagar and Kurnool have the least. The ones which have low adaptive capacity also have large tribal population. The Adaptive Capacity is influenced by a number of parameters and therefore, with a set of levers which essentially involve hard and soft interventions from the Government, there could be significant change in the adaptive capacity of the district/State

SAPCC – AP - EPTRI
51
3 ASSESSMENT OF STATE VULNERABILITY TO CLIMATE CHANGE
Vulnerability varies widely across communities, sectors and regions of the State. Comparisons of vulnerability tend to focus on local indicators, e.g., to group less developed regions or communities or to compare progress in human development among regions with similar economic conditions. At a State level the vulnerability assessment will contribute to setting development priorities and specifying policy actions.
Sectoral assessments provide detail and targets for strategic development plans. At a local or community level, vulnerable groups can be identified and adaptation measures can be designed and implemented.
As a part of the development of the State Level Action Plan on Climate Change, it is planned to develop a Vulnerability Map for the State. This will clearly demarcate the State into zones, which are prone to climate change vulnerability and therefore would require special interventions by the State government to develop climate change resilience in those areas. Apart from identifying the vulnerabilities of different regions of the State towards exposure to climate change, the sensitivity of different sectors towards climate change was also assessed.
The ordinary use of the word ‘vulnerability’ refers to the capacity to be wounded, i.e., the degree to which a system is likely to experience harmful effects due to exposure to a hazard. The vulnerability of a socio-economic and environmental system to climate change is conceptualized as a function of a system’s exposure to climate change effects and its adaptive capacity to deal with those effects. The more exposed a system is to a particular climate stimulus, the greater the system vulnerability; conversely, the greater the adaptive capacity of the system to a given climate event, the lower its vulnerability.
V = f (E, A) ------ (1)
Where
V = Vulnerability of system to climate stimulus in a period of time
E = Exposure of system to climate stimulus in a period of time
A = Adaptive capacity of system to deal with climate stimulus in a period of time
The emergence of the ‘vulnerability’ approach coincides with the realization that experiences and lessons learned building resilience to existing climate stresses are important prerequisites
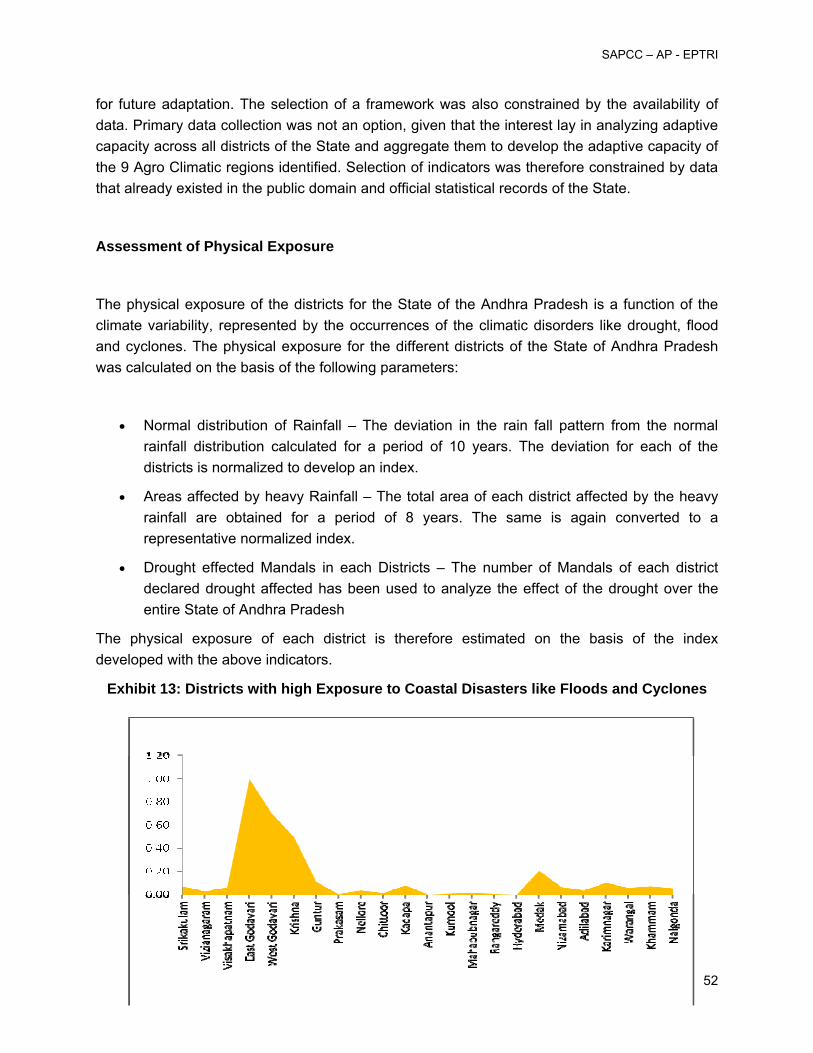
SAPCC – AP - EPTRI
52
for future adaptation. The selection of a framework was also constrained by the availability of data. Primary data collection was not an option, given that the interest lay in analyzing adaptive capacity across all districts of the State and aggregate them to develop the adaptive capacity of the 9 Agro Climatic regions identified. Selection of indicators was therefore constrained by data that already existed in the public domain and official statistical records of the State.
Assessment of Physical Exposure
The physical exposure of the districts for the State of the Andhra Pradesh is a function of the climate variability, represented by the occurrences of the climatic disorders like drought, flood and cyclones. The physical exposure for the different districts of the State of Andhra Pradesh was calculated on the basis of the following parameters:
• Normal distribution of Rainfall – The deviation in the rain fall pattern from the normal rainfall distribution calculated for a period of 10 years. The deviation for each of the districts is normalized to develop an index.
• Areas affected by heavy Rainfall – The total area of each district affected by the heavy rainfall are obtained for a period of 8 years. The same is again converted to a representative normalized index.
• Drought effected Mandals in each Districts – The number of Mandals of each district declared drought affected has been used to analyze the effect of the drought over the entire State of Andhra Pradesh
The physical exposure of each district is therefore estimated on the basis of the index developed with the above indicators.
Exhibit 13: Districts with high Exposure to Coastal Disasters like Floods and Cyclones
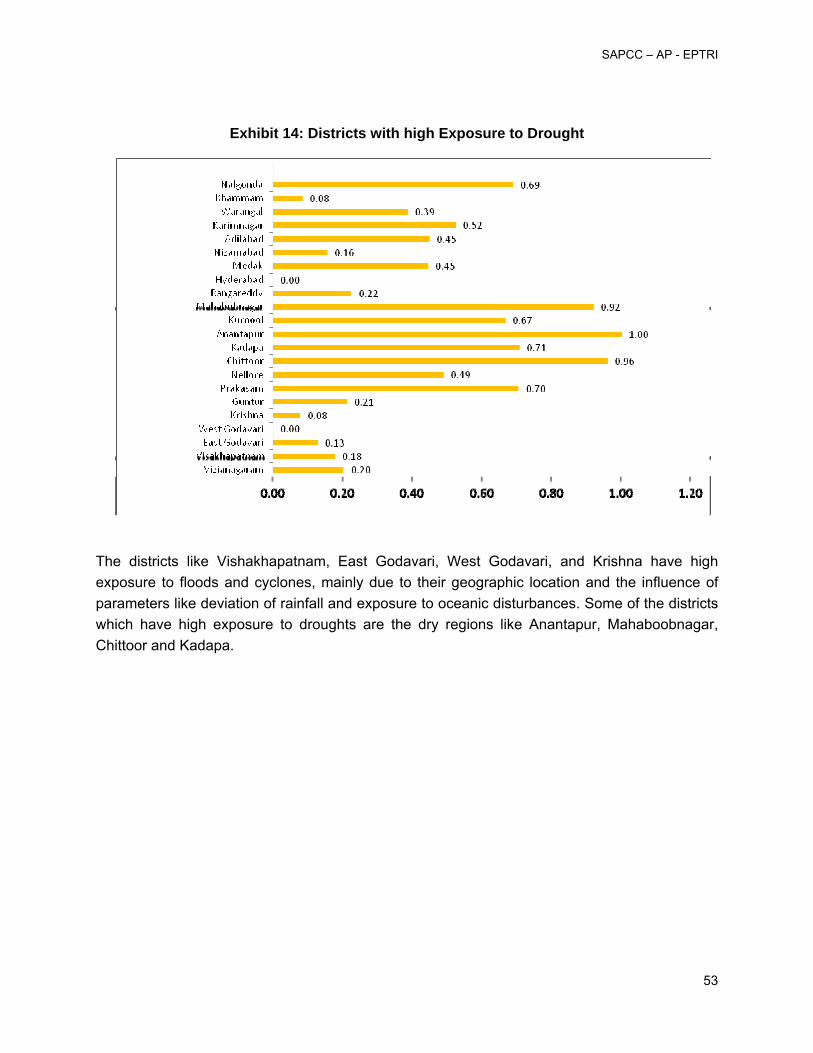
SAPCC – AP - EPTRI
53
Exhibit 14: Districts with high Exposure to Drought
The districts like Vishakhapatnam, East Godavari, West Godavari, and Krishna have high exposure to floods and cyclones, mainly due to their geographic location and the influence of parameters like deviation of rainfall and exposure to oceanic disturbances. Some of the districts which have high exposure to droughts are the dry regions like Anantapur, Mahaboobnagar, Chittoor and Kadapa.

SAPCC – AP - EPTRI
54
4 GHG EMISSIONS ESTIMATION
The GHG emission inventory for the State has been estimated based on guidelines of internationally accepted protocols such as Greenhouse Gas Protocol (World Business Council for Sustainable Development and World Resources Institute) and ISO 14064. Emission factors have been considered as per 2006 IPCC Guidelines for National Greenhouse Gas Inventories.
The operational boundary setting for the GHG emission estimation has been done in accordance with the Control Approach in accordance with the guidelines of the Greenhouse Gas Protocol.
The sectors which have been considered for the GHG estimation are agriculture, Power, Waste and transport.
In the agriculture sector, rice and jute crops contribute majorly to the sectoral emissions GHG emissions due to jute contributes a minor part to the total emissions, due to the fact that the state grows a small quantity of jute.
Exhibit 15: Emissions from Agriculture sector

SAPCC – AP - EPTRI
55
Exhibit 16: Emissions from Power Generation
Exhibit 17: Emissions from Power Consumption
The emissions from the total power consumption in AP state are growing at a CAGR of 9.4%.
Exhibit 18: Emissions from Power Purchase

SAPCC – AP - EPTRI
56
The emissions from the power purchased outside AP has seen a dip between 2005 and 2006 and has been showing an increasing trend till 2007-08.
Exhibit 19: Emissions from Transport
The carbon emissions are calculated taking into the account the fuel (petrol and diesel) consumed in the vehicles from the year 2004 to 2010. The CAGR of the carbon emissions is 9.5%.The emissions have been increasing at a constant pace from the years, shown in the graph.
Exhibit 20: Emissions from Solid Waste
The landfill disposal method is been considered for computing the methane emissions from solid waste generated in the state. The CAGR of the emissions is as high as 11.5%.
The graph below shows the total GHG emissions of the AP state, which includes emissions from agriculture, livestock, power, transport and solid waste. The graph shows a linear increasing trend of GHG emissions. From 455 million tons in 2003-04 , it has grown to around 1600 million tons of CO2 eq.

SAPCC – AP - EPTRI
57
Exhibit 21: Total GHG Emission
Emissions intensity is the level of GHG emissions per unit of economic activity, measured at the state level as GSDP. The GHG emission intensity for the year 2010-11 is 2372 tons of CO2 eq / INR Crore GSDP.
The per capita emission of the state is 10.39 tons CO2/capita, considering the total Population and the total GHG emissions which include emissions from agriculture, power, solid waste and transport.
Table 16: Few facts on the State GHG emissions for 2010-11
The emission intensity of the state shows an increasing trend as illustrated in the graph below.
State GSDP (INR Crore)
Population Total GHG Emissions (million ton CO2)
GHG emission intensity (tons CO2/INR crore GSDP)
Per Capita Emission(tons CO2/capita)
3,71,007 8,46,55,533 880 2372 10.39

SAPCC – AP - EPTRI
58
Exhibit 22: GHG Emission Intensity:
2000
2050
2100
2150
2200
2250
2300
2350
2400
2450
2004 ‐ 05 2005‐ 06 2006‐07 2007‐ 08 2008 ‐ 09 2009‐10 2010‐11
Emission Intensity ( tons CO2/INR crore GSDP)

SAPCC – AP - EPTRI
59
5 THE CLIMATE CHANGE STRATEGY FOR THE STATE
Guiding Principles in Strategy & Action Plan Formulation
The climate change strategy and action plan have been based on 5 main guiding principles:
• Pursue pragmatic solutions, in line with the national development agenda: The strategy is focused around supporting the objective of the Central Government on NAPCC, inclusive growth and ensuring economic sustainability for the long term. Actions would be undertaken which deliver benefits for growth and development, while mitigating climate change and ensuring ecological sustainability.
• Initiate process to mobilize significant investments: An estimation of additional resource requirements and exploration of existing and new carbon finance potential has to be carried out. Linking national policies and programmes for consistency and financial/policy support would be another major action point.
• Mobilize people/institutions to work towards integrated solutions: This would involve building broader stakeholder engagement to widen perspectives and involvement in implementation. Considering governance and institutional contexts, appropriate institutional arrangements and building capacities have to be ensured, keeping in view the coordination between departments, stakeholders and integration with regular planning and budgetary processes.
• Harness the wealth of expertise and knowledge already available in the State and the country on climate change: Investment in knowledge and research is essential to reduce climate related uncertainty and improve knowledge about appropriate responses.
• Contribute towards developing the State: State specific issues have to be considered and prioritized while creating appropriate enabling environment for implementation of NAPCC at State level.
In socio-economic terms, the key strategic areas which underpin the State development strategy, effectively reach the entire population of the State. Success and sustainability of the investments are of critical importance. All of the thrusts of Andhra Pradesh’s development framework show vulnerabilities to climate change. Adaptive measures will be necessary to ensure their long term resilience and sustainability in the face of climate change. In order to effectively align Andhra Pradesh’s developmental objectives with the sustainability agenda, this strategic action plan aggregates findings across sectors, and addresses them in an integrated manner which reflects the national priorities articulated through the NAPCC.

SAPCC – AP - EPTRI
60
6. CLIMATE CHANGE ACTION PLAN: INTERVENTIONS NEEDED TO IMPLEMENT THE STRATEGIES
a) Forestry and Biodiversity:
• Strengthening of protection and conservation. • To check soil erosion and conserve moisture, restoration of old breached tanks in the
forests are needed. Contour trenching, construction of permanent rock fill dams across streams in forest areas, digging of kuntas, desilting saucer pits to arrest reoperation of water are some of the other measures that may be adopted. For implementing the strategy the coordination among communities by forming suitable action groups within the community, finance in form of funds, land and manpower would be needed.
• Strengthening of the Integrated Afforestation & Eco-development Project (IAEP) to check forest degradation and loss of biodiversity, promote ecological restoration and environmental conservation and eco-development, promote shelter belt plantations in coastal areas to reduce damage from cyclones. Revitalize community based initiative like Joint Forest Management
• Forest fire management • Enhancement of public and private investments for raising plantations for enhancing the
cover and density of forests • Creation of biodiversity registers for documenting genetic diversity and associated
knowledge • Effective implementation of Protected Area System under Wildlife Conservation Act and
National Biodiversity Conservation Act, 2001
b) Coastal area:
• Cyclone shelters: Increasing the number of provided cyclone shelters, providing all weather connectivity to cyclone shelters.
• Beach nourishment/ recharging: Involves the importing of sand or gravel to nullify losses due to erosion. Beach nourishment may be adopted for protection and beach development. Combination of nourishment of beaches with seawall/groynes will create beach in front of protected area and eliminate erosion.
• Dikes/Surge barriers /sea walls: to be provided at exposed frontages with extensive and high value backshore assets.
• Port upgrade (raising elevation): Port (such as Vishakhapatnam) up gradation required in line with rising sea level is required.

SAPCC – AP - EPTRI
61
• Building codes/flood wise buildings: Development of structural design norms for construction taking place in coastal regions in line with international standards.62
• Restoration and plantation of new mangrove belts across the coast. Discouraging aquaculture and shrimp farming activities in mangroves.
• Change water abstraction pattern: judicious use and control abstraction by industrial units and aquaculture units in the region.
• Freshwater injection: Recharging wells should be constructed to recharge depleting aquifers with freshwater.
• Upgrade drainage systems: Better and more efficient drainage system both for rainwater and agricultural runoff.
• Waste disposal to ocean: Stricter norms and monitoring program for disposal of untreated industrial and municipal waste into the oceans.
c) Disaster Management
• Up gradation of cyclone prediction and early warning systems. • Strengthen State/District/Regional Disaster Management Policies and Manuals
d) Transport:
• Develop an integrated spatial planning system – Mobility needs is directly proportional to the energy consumption. Develop a structure that provides all kinds of services locally for inhabitants, less transportation is needed. Mobility choices like good access to public transportation are easier to achieve when integrated planning is in the norm. In essence an ‘Integrated planning and logistics: Mixed land use' – could reduce the climate change effect substantially.
• Bus Rapid Transit (BRT) -financially viable, increases speed and safety, and diminishes congestion and pollution.
• Promote non motorized transport (NMT) mode like walking and cycling by provision of cycling tracks and walkways for pedestrians.
• Travel demand and supply management.63 • Rail-based mass transit systems are less congesting than road based systems and can
be very important for those who are peripherally located and have long journeys to access employment in the cities.
63 Car users should pay the true cost of using a car in crowded urban environments either through Tax on vehicle miles travelled – Many European countries have implemented the same strategy to restrict travel demand.

SAPCC – AP - EPTRI
62
• Already enacted incentive programs for cleaner fuel usage (like CNG, LPG, electric vehicle) will be successful if the same is coupled with: Improvement in access to information- Strategic tie up with manufacturing companies to supply CNG / LPG fuelled vehicle at cheaper rate- Up-stream logistic integration to ensure reliable and efficient alternative fuel distribution - Conversion of public vehicles into CNG fuelled vehicles. - Promotion of electric vehicles, setting up infrastructure like charging stations.64
e) Health Care
• Develop early warning systems for disease outbreaks. Disseminate information on appropriate individual behavior to avoid exposure to vectors.
• PHC concerned constituting Medical teams and mobile teams should be supplied with required drugs and equipment with instructions to rush to the affected areas without waiting for further instructions.
• Sponsor research and development on vaccines and other preventive measures. Provide low-cost vaccinations to those likely to be exposed.
• System for detection of contagious diseases and potential epidemics. • Improving the reach of drugs to people on time. • Develop and enforce regulations of air pollutants • Education and outreach on the risks of exposure to air pollutants.
f) Urban Habitat
• Development of a well integrated waste management system. The management should
start from segregated waste collection from different locations to end use of the waste. The waste can be used for power generation or other such activities.
• Toilet facilities in the urban slums, for better living conditions, reducing the problems related to access to water and sewerage.
• Develop a proper city drainage system to accommodate sudden surge of the water due to the excess rainfall and other climate events.
• Improving the sanitation facilities in urban Slum areas and in rural areas.

SAPCC – AP - EPTRI
63
g) Rural development
• Encouraging and enabling the farmers to grow diverse crops which are less water
intensive. Educating and training farmers on crop management. Building infrastructure for harvesting and storing the harvested crops.
• Developing proper road connectivity (specifically for rural population) and/or climate change resilient road network in order to: facilitate quality heath support in emergency, facilitate access to quality disaster management programs (rescue programs) and facilitate accessing safe and secure supply chain.
• Provision of pucca dwellings for the poor living along the coastal line, who are the most vulnerable to coastal disasters.
h) Agriculture:
• Composting of organic wastes for enhancing soil quality and fertility. Composting is
widely practiced by farmers. Centralising would increase energy use. • Establish Specific Centres for critical climate analysis and to study likely impacts of
Climate Change on crops • Researches on breeding of heat and photo insensitive crop varieties, erection of poly
houses, alternative cropping patterns capable of withstanding extremities in weather, dry spells, flooding and variable moisture availability, etc.
• Establish of biotechnology R&D centres for agriculture in the State. • Check excessive fertilizer/pesticide use by promotion of bio-fertilizer. • Promote development of crops, with enhanced capacity for CO2 fixation, which in turn
can result in producing high biomass and increased productivity. • Promote diverse livelihoods such as agro-processing and value addition to farm
products to protect against any severe climatic hazards, by diversifying livelihood and enlarging earning potential in allied sectors of agriculture which are not directly affected by climatic impact.65
• Credit provision can help to fund sustainable agriculture and would help to promote self-reliance among farmers and to provide small and short loans and other benefits to them. Government would lend money to a SHG or a community at a subsidized rate with little or no collateral.
65 It may also include promotion of fodder yielding trees like Leucaena, Hardwickia bianta on boundaries etc. and value addition to farm products like extraction of custard apple pulp, Aonla pickle and murabba, Roselle cultivation for coloring fruit products, curry leaf essence preparation.
SAPCC – AP - EPTRI
64
• Strengthening of crop insurance to protect farmers against vagaries of nature, rather
than merely protecting the bank loan. • Agriculture Universities to create a Climate data bank and conduct awareness
programmes/ trainings etc. In each agro-climatic zone establish an agro-meteorological field station for providing weather based advisory, technical advice to farmers and information on market prices. 66
• Increase the percentage of sown area under irrigation. Water harvesting check dam, dug out farm ponds and soil and water conservation measures are required. Increase canal irrigation and make ground water a sustainable resource.
• Interlinking of rivers/canals
i) Tourism
• Research, monitor and address impacts of climate change on natural resources and biodiversity.
• Raise awareness and mobilise stakeholders for conservation of biodiversity and ecosystem services
• Provide incentives for increased rate of technological development in order to develop a well planned strategy to promote the necessity of envisioning a low carbon transport.
• Encourage partnerships between different transport and tourism stakeholders with the objective to reduce emissions through optimizing the value chain.
• Education/ awareness generation on impacts of climate change on tourism among tourism businesses staff, as well as tourists-Insurance cover (or alternative schemes) for the recovery of infrastructural and other damage.
• Installation of energy saving Use of alternative fuels (e.g., biodiesel) and renewable energy sources (e.g., wind, photovoltaic, solar, thermal, geothermal, biomass and waste) in tourism related establishments.
j) Mining • Involving local population in decision making during the planning phase. • Proper rehabilitation and reimbursement provisions for affected population. • Underground Coal Gasification and Carbon Capture & Sequestration implementation in
coal mines. • Establishment of industry wise energy usage benchmarks and making energy audits
compulsory.
66 This would help farmers to plan their cropping cycle by means of minimum tillage, contingent plan measures, organic farming and rain water conservation.

SAPCC – AP - EPTRI
65
• Local participation in developing green belts by distributing saplings and seeds. • Providing penalty clause for violation of effluent standards. • Generation of dispute resolution/ grievance redressal mechanisms.67

SAPCC – AP - EPTRI
66
7 COST BENEFIT ANALYSIS TO ASSESS ENVIRONMENTAL, SOCIAL AND ECONOMIC COSTS OF IDENTIFIED INTERVENTION:
Would be included in the next version.
SAPCC – AP - EPTRI
67
8 DESIGN OF M&E SYSTEM AND IMPLEMENTATION OF THE SAME
Would be included in the next version

SAPCC – AP - EPTRI
68
9 STAKEHOLDER CONSULTATION WORKSHOP
In line with National Action Plan for Climate Change, guidance on development of State Action plan for Climate Change, Government of Andhra Pradesh (GoAP) had conducted four workshops for stakeholder consultation at various centers across the State to identify the key climate change related issues faced by various strata of society. Participants ranging from academicians, researchers, Government officials, private sector employees, NGO professionals, social activists, students, and local citizens were invited, for proper representation of stakeholders.
Public sector/Government Department officials working at State/district level from various government bodies like local municipality, groundwater Department, Forestry Department, Industries Department, Animal Husbandry Department, Mines & Geology Department, Panchayat Raj, Transport Department, Sericulture Department, Health Department, Pollution Control Board, Public Health Engineering Department etc were among the participants of the stakeholder consultation. Officials invited for the stakeholder consultation ranged from higher level executives like Directors, District Heads of Department etc involved in planning and execution of various social and infrastructural schemes, to mid level professionals like municipal engineers, site engineers and electricity department engineers etc. who are actively involved in day to day execution of various schemes run by the Government. Presence of such a mix of officials from government departments insured complete coverage of challenges faced by government from planning and strategy development phase to execution phase.
Representatives from private sector included those from cement industry, steel industry, power sector, metallurgy, chemical manufacturing, sugar industry, tiles, food packaging, distilleries, engineering product manufacturer, pharmaceutical manufacturing etc. the presence of officials from these private sector entities provided an insight into the environmental impacts caused of these industries, the mitigation and adaptation actions being taken by the industries, and emphasized the need of a strong regulatory mechanism.
Besides the above mentioned stakeholders, social activists and NGO workers involved in various micro level social upliftment and climate change related activities like biodiversity conservation, illiteracy eradication, environmental activism, human right activism, leprosy eradication, rural development, women development etc. also participated. Feedbacks received from them were generally focused on socio economic disparity and unregulated pollution discharge from industries. Academicians participating included lecturers, professors from local State run colleges and private colleges, research scholars, students from various technical universities. They emphasized promotion of research and capacity building for developing the

SAPCC – AP - EPTRI
69
adaptive capacity of the affected population. Retired government officials, local residents, villagers were also the part of stakeholder consultation. Their primary concerns were services like drainage and waste handling infrastructure, efficient transportation facility.
The workshops highlighted the 8 missions under NAPCC and the objectives of the SAPCC. The flow of events at the workshop is presented below:
• An indicative matrix (degree of impact vs. probability) of climate sensitive sectors was presented to the stakeholders
• Climate Risks and Opportunities identified for key sectors were also presented to stakeholders
• Feedback from stakeholders was taken through questionnaire and group discussions
The feedback included:
Increase in awareness level about climate change and impact
Climate change experiences of local population
Local risks envisaged in the future for various sectors
Expectations of stakeholders from local bodies, State Government and SAPCC in mitigating and adapting to climate change
Pre Consultation Stakeholder workshops were organized at the centers named below across the State on the mentioned dates:
Table 17: Stakeholder consultation schedule
Location Date No. of participants Profile of participants
Hyderabad 23rd December 2010 29 Academicians, Government and Public sector officials, private sector officials, NGO, civilians, students
Tirupati 27th December 2010 76
Visakhapatnam 18th December 2010 54
Vijayawada 20th December 2010 92

SAPCC – AP - EPTRI
70
Exhibit 23: Stakeholder profile from different centers
Charts depict the profile of participants across four locations of stakeholder consultation workshop.
93%
7%
Hyderabad
3%
47%
13%
7%
30%
Tirupati
9%
70%
13%
7%
Visakhapatnam
9%
35%
16%
15%
25%
Vijayawada
Private sector
Civilians
NGO
Public sector
Academicians
6%
53%
14%
8%
20%
Overall state
Private sector
Civilians
NGOs
Governmentofficials
Academicians
Key concerns/ suggestions•Restrict cars /sales of vehicles and pr omotion of clean er fuel s for vehicles•Develop ing environment ally balanced in dus trial complexes (EB IC)•Fo rest conservation and res torat ion
•Better mun icipal wast e management and drainage system•Development of efficient publ ic transport at ion system•Contro l of vector borne disease
•P romotion of Indian medicine sys tem as a means to al ternat ive livel ihood for agro‐based communities•P romotion to u sage of publ ic tr an spo rt and subs idies to electri c vehicles, removal of old veh icles
•Enhanced use of micro ir rigation, d rip‐sprinkler system etc•Gr een tax is to be col lected‐pro perty util ized for rais ing t he trees•Conservat ion of endanger ed fish species•Disast er warning system implemen tatio n•Impro ving transport infrast ructure in order to promot e pub lic tran spo rt usage•Research & development to develop climat e resistant cr op and livest ock varieties •P romoting energy saving measur es in indus tries and in domestic use•Implemen tation of efficient municip al waste management progr am i .e., so lid , waste water handling etc.•Better regu latory framewo rk for indu strial waste d isposal and treatment•Intr oducin g more NGOs to create awareness at low level/ village l evel meetings
•P romoting the concept o f 3R: reduce, recycle, reu se•Implemen tation of cost effective waste water treatment methods using natu ral pr ocesses•Reduced use of plastic•P romoting cleaner fuel s l ike CNG/LPG for transport ation andmileage based co st mechanism for vehicles•St rict norms to check marine water pollution
Common concerns/suggestions include:•Promotion of renewable energy, alternate fuels, water management practices (groundwater recharging or rain water harvesting)and sustainable agriculture practices (like organic farming)•Awareness enhancement and capacity building programs on CC at community level•Forest conservation and afforestation activities•Restrict polluting industries to specified zones and implement more stringent pollution norms
Chapter 9: Stakeholder Consultation Workshop
SAPCC – AP - EPTRI
71
Based on the feedbacks received from various stakeholders on various sectors influenced by climate change and anthropogenic activities the major areas of prioritization and concern are summarized below:
Agriculture and livestock
• Promotion of organic farming reducing dependence on chemical fertilizers and pesticides
• Development of temperature resistant, flood and drought resistant varieties of crops and temperature resistant breeds of livestock
• Implementing micro irrigation schemes, and constructing more check dams • Awareness and training dissemination of sustainable practices in agriculture • Insurance for crop failure • Reduction in plastic usage • Research and training centers for producing natural fertilizers and pesticides • Promoting farm mechanization • Financial support through micro financing • Protection against seasonal diseases in crops and animals • Review of subsidies to pesticides and fertilizers and subsidies to organic agriculture • Establishing village level agro meteorology centers • Better solid waste management practices like recycling and reuse • Promotion of watershed development program • Promotion of less water intensive hybrid crops
Health
• Impart awareness about preventive measures • Better bio medical waste handling • Encouragement to traditional medical systems like yoga and ayurveda • Better health services in rural and urban slum areas • Alert system against viral infections and water pollution • Promotion of family planning • Awareness of hygiene, healthy practices, sanitation & spread of communicable diseases • Training programs through local bodies like panchayats • Prevention against seasonal disease spread by mosquitoes • Increasing number of hospitals and improving facilities in existing hospitals

SAPCC – AP - EPTRI
72
• Improving sanitation conditions to curb spread of water borne disease like cholera, typhoid etc.
• Allocating a dedicated fund for training and awareness programs • Curbing pollution due to industries and vehicular emissions
Energy and power
• Promotion of renewable energy like solar, biomass, hydro and wind • Improving power availability in rural areas • Generation of power using waste • Promoting usage of energy efficient equipments • Air pollution produced by the thermal power plants and other energy producing plants
should be closely monitored and strict implementation of regulatory emission standards • Micro level penetration of non conventional energy sources • Subsidy on solar power systems and LED lighting system • Development of non conventional sources like geothermal and tidal energy • Promotion to nuclear energy for larger plants instead of coal based technologies • Promoting biomass based energy generation in villages • Making energy audits in industry a norm
Marine and fisheries
• Controlling water pollution due to industrial discharge to ocean and sea • Preserving endangered species • Promotion to mangrove plantation • Conservation of coastlines • Provision of financial aid to fishermen • Training about newer technologies • Putting a check on ring net usage, which causes large scale destruction of marine
habitats • Establishing monitoring systems to check pressures on marine system due to climate
change • Imparting training to fishermen on sustainable fishing practices • Artificial breeding through introduction of cultured seeds into marine waters • Cyclone warning systems for fishermen • Development of green belt across CRZ regulated regions • Insurance for fishermen • Encouraging marine transport

SAPCC – AP - EPTRI
73
Irrigation and water supply
• Water conservation and proper drainage facilities • Promoting rain water harvesting and ground water recharge • Promotion of organic farming, reducing water pollution problems • Encouraging micro irrigation systems • Check on industrial discharge to municipal drainage system • Training and awareness programs • Measures to prevent ground water pollution and contamination • Promoting better irrigation techniques like drip irrigation and sprinklers etc • Regular de-silting of canals and other water retaining structures
Manufacturing
• Stringent pollution control measures • Proper management of manufacturing waste • Ban on ozone depleting chemical usage in industries • Energy and material optimization technique implementation • Proper zoning / siting of industries • Promoting alternatives to plastic • Promoting the zero discharge and environmentally balanced industrial complexes(EBIC) • Implementing energy efficient technologies • Promoting small and medium scale industries • Promotion of non conventional energy usage • Implementing reduce-recycle-reuse based manufacturing units • Introducing energy/carbon tax
Transport
• Promoting public transport usage by strengthening the infrastructure • Promoting electric vehicles by giving subsidies • Providing dedicated cycle lanes • Switching public transport to lower carbon fuels like CNG, LPG & electricity • Promotion of bio diesel blending • Phase out old vehicles from road • Discouraging inefficient vehicles by imposing carbon tax

SAPCC – AP - EPTRI
74
Forestry
• Increasing forest cover • Promoting roadside plantation of trees • Promoting recycling of paper • Curbing wood smuggling from forests • Promoting afforestation in urban areas • Enhancing public participation in afforestation activities • Curb the loss of forests to industry, mining etc.

SAPCC – AP - EPTRI
75
Annex 1
Vulnerability Maps
Exhibit 24: Coastal Vulnerability Index and risk levels of different segments of AP coast68
68 Nageswara Rao, K. Subraelu, P., Venkateswara Rao, T., Hema Malini, B., Ratheesh, R., Bhattacharya, S., Rajawat, A.S. and Ajai, 2008. Sea‐
level rise and coastal vulnerability: an assessment of Andhra Pradesh coast, India through remote sensing and GIS, Journal of Coastal Conservation, Vol. 12, pp. 195‐207, DOI: 10.1007/s11852‐009‐0042‐2

SAPCC – AP - EPTRI
76
Table 18: Data and risk level of the coast in various localities
No Coastal Sector Locality Length of the coast in each risk category
(km)
Low Moderate High
Very High Total
1
Northern sector (Vishakhapatna
m region)
Baruva - 1.9 32.8 2.1 36.8
2 Naupada - 4.9 32.9 0.9 38.7
3 Vamsadhara estuary 5.7 11 22.3 2.2 41.2
4 Nagavali estuary - 13.3 12.5 3.8 29.6
5 Konada - 7.8 14.7 3 25.5
6 Mukkam - 11.4 - - 11.4
7 Vizag-Bhimli coast 4 16 5.2 1.4 26.6
8 Vishakhapatnam city 6.9 14.3 - - 21.2
9 Gangavaram 5.8 14 14.8 - 34.6
10 Sarada-Varaha estuary 1.7 22.3 7.8 - 31.8
11 Tandava estuary - 14.8 1.2 7.7 23.7
12 Uppada coast 5.9 10.4 6.5 17 39.8
Total 30 142.1 150.7 38.1 360.9
13
Central sector(Krishna-Godavari delta
region)
Kakinada - - 11.8 61.7 73.5
14 Nilerevu estuary - - - 31.5 31.5
15 Pandi lagoon - - - 11.4 11.4
16 Surasaniyanam - - 4.3 14.6 18.9
17 Vainateyam estuary - - 22.6 5.9 28.5
18 Vashista estuary - - 18.5 10.3 28.8

SAPCC – AP - EPTRI
77
No Coastal Sector Locality Length of the coast in each risk category
(km)
Low Moderate High
Very High Total
19 Gugoleru creek - - 22.4 9 31.4
20 Manginapudi - - 9.9 18.8 28.7
21 Krishna estuary (Divi) - - - 60.2 60.2
22 Krishna estuary (main) - - 11.9 30,1 11.9
23 Nizampatnam - - 23.9 4.5 28.4
Total 125.3 258 383.3
24
Southern Sector (Pennar delta &
Pulicat lake region)
Vadarevu - 15.4 2.9 - 18.3
25 Ramperu estuary - 12.8 1.3 - 14.1
26 Gudlakamma estuary - 2.7 17.8 12.9 33.4
27 Palleru-Musi estuary - 2.7 17.8 12.9 33.4
28 Manneru estuary - 0.08 27.4 - 27.48
29 Upputeru estuary - - 2.6 26.1 28.7
30 Penner estuary - - 22.6 19.7 42.3
31 Krishnapatnam - 20.9 0.2 7.2 28.3
32 Swarnamukhi estuary - - 4.6 23.7 28.3
33 Durgarajpatnam - - - 23.9 23.9
34 Sriharikota islands - - 4.9 16.9 21.8
Total - 51.8 87.7 146.3 285.8
Grand Total 30 193.9 363.7 442.4 1030

SAPCC – AP - EPTRI
78
Issues Strategic
interventions Critical Success Factors (CSFs)
Resource requirement
Stakeholders to be
benefited
Stakeholders likely to be
affected/ resistant
Key issues of disagreement
Agriculture
Strategic Thrust Area –I Improved agricultural practices with a special focus on dryland agriculture
Erratic rainfall, soil erosion and loss in soil fertility due to excessive use of fertilizers and pesticides, soil erosion etc.
Lever- 1 Composting of organic wastes and animal excreta for restoring soil fertility. Use of urban compost for dryland farming and in places where part of soil is eroded
-Proper waste management system, including in urban areas -Organized cattle waste collection system -Application of composting technology
-Manpower requirement for the collection/ distribution segments -Land requirement -Expert advice on composting techniques
-Energy requirement for municipal waste
-Farmers especially in regions with high soil erosion and/ or low soil fertility
-Composting demand would minimize waste and deprive poor people of fuel and fertilizer.
-Agricultural and animal waste which was earlier used as (free) fuel now will be diverted for producing organic manure. Substitute fuel may have to be bought from outside market
Detailed description of strategic interventions

SAPCC – AP - EPTRI
79
Issues Strategic
interventions Critical Success Factors (CSFs)
Resource requirement
Stakeholders to be
benefited
Stakeholders likely to be
affected/ resistant
Key issues of disagreement
Strategic Thrust Area -2 Use of biotechnology in agriculture
Fluctuations in temperature and rainfall patterns
Lever-1 Researches have to be initiated on breeding of heat and photo insensitive crop varieties, erection of poly houses, alternative cropping patterns capable of withstanding extremities in weather, dry spells, flooding and variable moisture availability etc. Establish biotechnology
-Networking with agricultural research institutes-The new crop variety should support farmer's livelihood -The economics of crop diversification is favourable both in terms of cost of input vs. output price -Uninterrupted supply of seeds of new breed/ variety at regulated price -Type of MSP for the new crop output
-Fund requirement -Expertise for R&D activities
-Farmers NGOs -Doubts and fears on yield of new breeds of crops -Issues with productivity -Introduction of a new crop can disturb the ecological balance of the local system
Detailed description of strategic interventions

SAPCC – AP - EPTRI
80
Issues Strategic
interventions Critical Success Factors (CSFs)
Resource requirement
Stakeholders to be
benefited
Stakeholders likely to be
affected/ resistant
Key issues of disagreement
R&D centres for agriculture in the State.
Strategic Thrust Area -3 Climate related risk management for the agro sector
Lever-1 Easy access to low cost agricultural credit, including for tenant farmers
-Partnerships among banks, Govt, farmers, NGOs -Legislative frame work and implementation mechanism -Formation of cooperatives or community for sanction of funds
-Low interest refinance
- Interest subsidy
-Farmers generally, particularly dryland farmers and tenant farmers
-Private money lenders, who often double as providers of inputs and buyers of output
- Lending without collateral and minimum documentation contrary to current banking practices
- Recovery resort, in absence of collateral
Lever- 2 Strengthening of crop insurance to protect farmers
-Fund requirement
-Farmers
Detailed description of strategic interventions

SAPCC – AP - EPTRI
81
Issues Strategic
interventions Critical Success Factors (CSFs)
Resource requirement
Stakeholders to be
benefited
Stakeholders likely to be
affected/ resistant
Key issues of disagreement
against vagaries of nature rather than merely protecting the bank loan
Strategic Thrust Area -4 Access to information
Lack of awareness among farmers regarding changing climatic patterns and crop prices
Lever-1 Agriculture Universities to create a Climate data bank and conduct awareness programmes/ trainings etc. In each agro-climatic zone establish an agro-meteorological
-Encourage farmers and their families to get associated with universities and free access to knowledge -Use of ICT and mobile based applications to alert farmers/fishermen in case of critical warnings
-Fund requirement (budgetary allocation may be from the various State schemes on training programs in the agri sector such as Polambadi) -PPP for agricultural
-Farmers -Education for children of farmers, rural population generally
- Some initial resistance is expected to the advice to change crop practices
Detailed description of strategic interventions
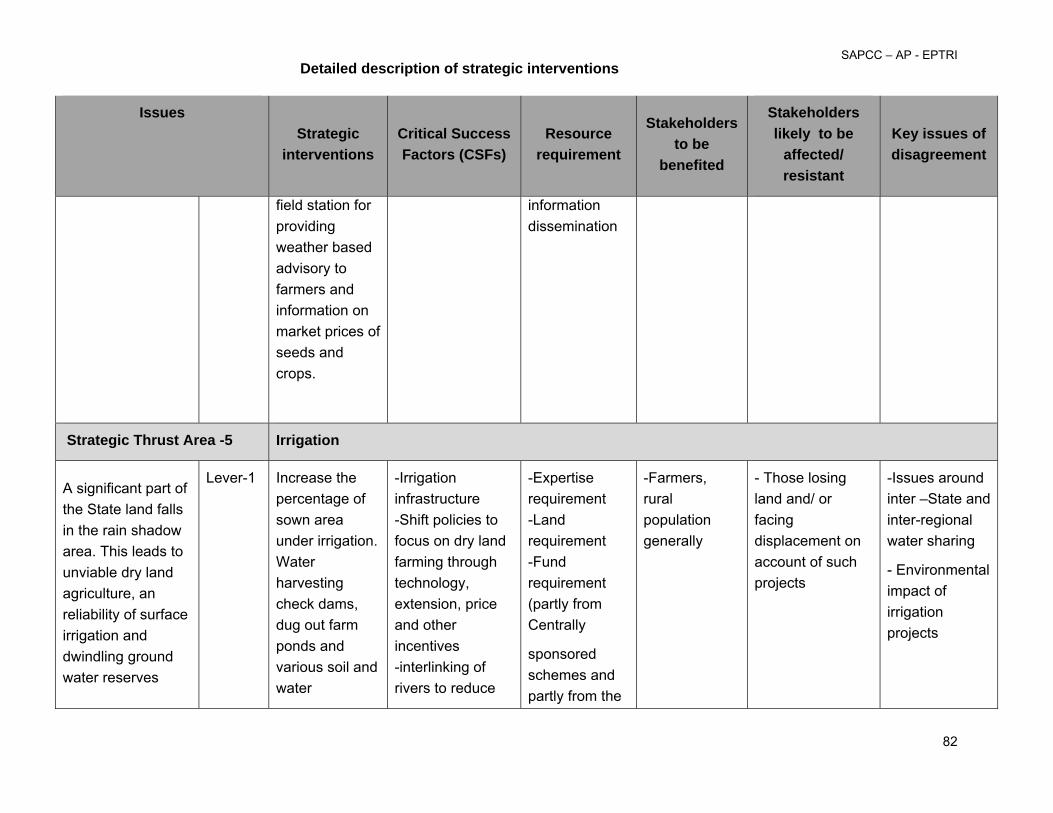
SAPCC – AP - EPTRI
82
Issues Strategic
interventions Critical Success Factors (CSFs)
Resource requirement
Stakeholders to be
benefited
Stakeholders likely to be
affected/ resistant
Key issues of disagreement
field station for providing weather based advisory to farmers and information on market prices of seeds and crops.
information dissemination
Strategic Thrust Area -5 Irrigation
A significant part of the State land falls in the rain shadow area. This leads to unviable dry land agriculture, an reliability of surface irrigation and dwindling ground water reserves
Lever-1 Increase the percentage of sown area under irrigation. Water harvesting check dams, dug out farm ponds and various soil and water
-Irrigation infrastructure -Shift policies to focus on dry land farming through technology, extension, price and other incentives -interlinking of rivers to reduce
-Expertise requirement -Land requirement -Fund requirement (partly from Centrally
sponsored schemes and partly from the
-Farmers, rural population generally
- Those losing land and/ or facing displacement on account of such projects
-Issues around inter –State and inter-regional water sharing
- Environmental impact of irrigation projects
Detailed description of strategic interventions

SAPCC – AP - EPTRI
83
Issues Strategic
interventions Critical Success Factors (CSFs)
Resource requirement
Stakeholders to be
benefited
Stakeholders likely to be
affected/ resistant
Key issues of disagreement
conservation measures are required.
Increase canal irrigation and make ground water a sustainable resource
uncertainty of flows
State)
Coastal Zone
[P] – Protection; [A] – Accommodation; and [R] – Retreat
Strategic Thrust Area -1 Increased frequency and intensity of cyclones/ storm
Cyclone activity along the coastline leading to human and infrastructural
Lever 1 Cyclone shelters [P]: Increasing the number of
-A well designed plan and committed resources
-Funds and project implementation capacity
Coastal population
-Isolated and localized opposition on account of land
Detailed description of strategic interventions

SAPCC – AP - EPTRI
84
Issues Strategic
interventions Critical Success Factors (CSFs)
Resource requirement
Stakeholders to be
benefited
Stakeholders likely to be
affected/ resistant
Key issues of disagreement
loss shelters and providing all weather connectivity to cyclone shelters
- Maintenance of the cyclone shelters
ownership etc. issues.
Lever 2 Beach nourishment is an engineering solution which can be placed with construction of dikes, groynes etc
-Funding and expertise on the subject
Professional s for training and awareness programs
-Beach tourism and associated businesses
-Areas that may suffer beach erosion as a result of the engineering
Strategic Thrust Area -2 Inundation, flood and storm damage (include surge (sea) and backwater effect (river)
Infrastructure damage due to water ingress and storm surges
Lever 1 Dikes/Surge barriers /sea walls [P]: to be provided at exposed
Assessment of economic and human capital across the coast length and
Resources for infrastructure development
Coastal population
People living very close to the coast line/businesses units like resorts
Detailed description of strategic interventions

SAPCC – AP - EPTRI
85
Issues Strategic
interventions Critical Success Factors (CSFs)
Resource requirement
Stakeholders to be
benefited
Stakeholders likely to be
affected/ resistant
Key issues of disagreement
frontages with extensive and high value backshore assets.
providing appropriate cost effective solution from the list of various mitigation measures provide against erosion lever.
Lever 2 Port upgrade (raising elevation) [P]: Port (such as Vishakha
patnam) up gradation required in line with rising sea level is required.
Promoting the philosophy of green port/ sustainable ports for new ports and transformation of old ports.
Financial and technological resources required to develop new building codes and establishing land use planning patterns etc
Detailed description of strategic interventions

SAPCC – AP - EPTRI
86
Issues Strategic
interventions Critical Success Factors (CSFs)
Resource requirement
Stakeholders to be
benefited
Stakeholders likely to be
affected/ resistant
Key issues of disagreement
Lever 3 Building codes/flood wise buildings [A]: Development of structural design norms for construction taking place in coastal regions in line with international standards.
Association of technological institutes and local UDA/ municipal
Determination to enforce the building code.
Technical expertise and enforcement machinery
Coastal population generally
Builders, residential and commercial buyers
Potentially higher costs associated with new building codes
Strategic Thrust Area -3 Saltwater Intrusion
Lever 1 Change water abstraction [A/R]: Judicious use and control of abstraction by
Legislation and enforcement
Develop and promote less
Enforcement machinery
Investments in technology and
Coastal population, municipalities
Industries and aquaculture units
Disagreement on the phenomenon of salt water intrusion
Detailed description of strategic interventions
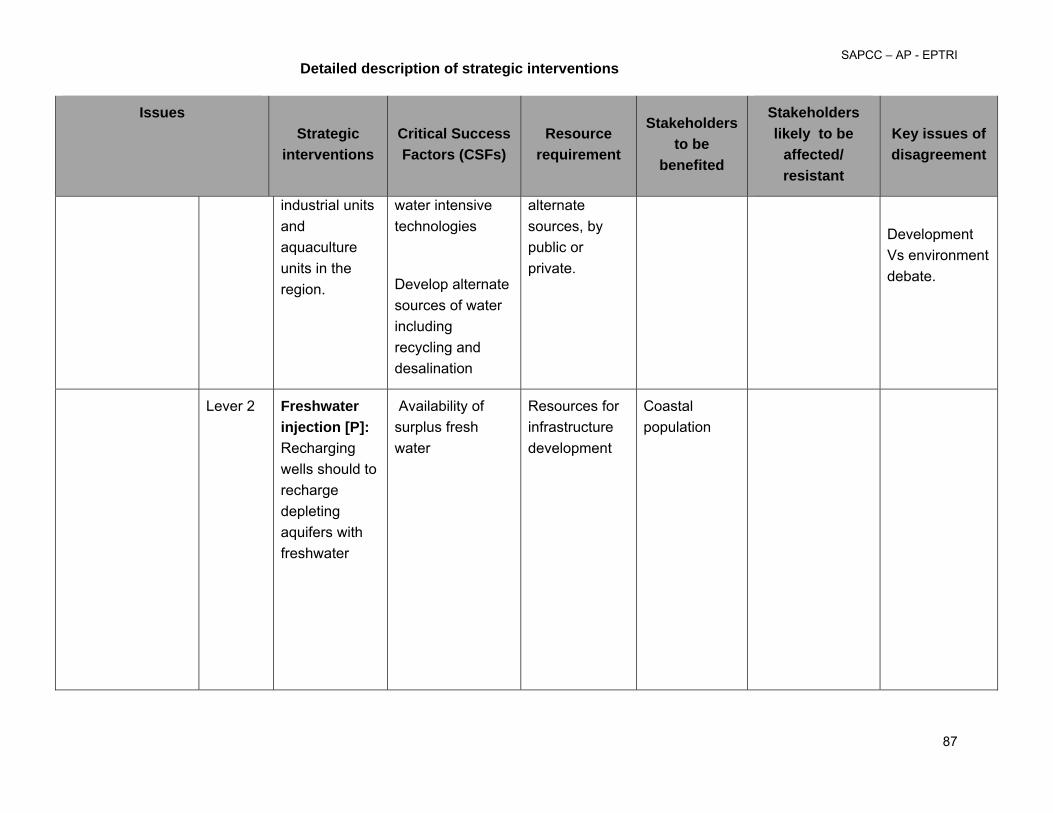
SAPCC – AP - EPTRI
87
Issues Strategic
interventions Critical Success Factors (CSFs)
Resource requirement
Stakeholders to be
benefited
Stakeholders likely to be
affected/ resistant
Key issues of disagreement
industrial units and aquaculture units in the region.
water intensive technologies
Develop alternate sources of water including recycling and desalination
alternate sources, by public or private.
Development Vs environment debate.
Lever 2 Freshwater injection [P]: Recharging wells should to recharge depleting aquifers with freshwater
Availability of surplus fresh water
Resources for infrastructure development
Coastal population
Detailed description of strategic interventions

SAPCC – AP - EPTRI
88
Issues Strategic
interventions Critical Success Factors (CSFs)
Resource requirement
Stakeholders to be
benefited
Stakeholders likely to be
affected/ resistant
Key issues of disagreement
Disaster management
Strategic Thrust Area -1 Cyclone
Lever 1 Reliable and technologically advanced early warning systems, including method of communication
1) Reliable and technologically advanced early warning systems
2) Adequate training for personnel involved
3) Communicating warnings at various stages 4) Raising awareness among local population on the response measures
1) Funds for setting up infrastructure for warning 2) Collaboration between various space, ground, sea based agencies for sharing resources and technologies 3) Collaboration with local telecom and communication companies for
1) Local population 2) Businesses dependent on sea including fishing, shipping, and
Shore-based
infrastructure facilities like power plants 3) Agro-based business units 4) Tourism industry
Detailed description of strategic interventions

SAPCC – AP - EPTRI
89
Issues Strategic
interventions Critical Success Factors (CSFs)
Resource requirement
Stakeholders to be
benefited
Stakeholders likely to be
affected/ resistant
Key issues of disagreement
issuing warning through technologies such as FM radio, or bulk SMS HAM radio, SMS, etc
Lever 2 Mangrove plantation
- Dedicated land for plantation
- Protection and conservation
1) Allocation of necessary funds and personnel to enable growth and regeneration of mangroves
Local population
Occupants/ encroachers of lands required for mangroves
Strategic Thrust Area -2 Floods / Drought
Lever 1 River and Canal management- Interlinking of
1) Construction of new canals/dams and upgrading of old canals/dams
1) Funds for setting up infrastructure and
1) Local population 2) Businesses dependent on
1) Local population who could be evacuated, or
- Disputes about sharing of water resources
Detailed description of strategic interventions

SAPCC – AP - EPTRI
90
Issues Strategic
interventions Critical Success Factors (CSFs)
Resource requirement
Stakeholders to be
benefited
Stakeholders likely to be
affected/ resistant
Key issues of disagreement
rivers/canals 2) Establishment of automated flood detection and warning systems 3) Coordination of various canal and rive management agencies to manage flood flows
4) Construction of groundwater recharge facilities to help in absorbing the excess flood water
communication systems 2) Qualified and trained personnel for assessing and managing the river/canal systems 3) Promotion of water efficient agriculture and industry
4) Wastewater treatment to make it reusable
river water including fishing and infrastructure facilities like power 3) Agriculture and agro-based business units
likely to lose land due to construction of new canal/dams 2) Upstream / downstream business units (including agriculture) whose water resource could get affected 3) Inter-State or regional political conflict/instability
4) Those required to meet cost of technology and infrastructure
- Disputes on sharing of cost of technology and infrastructure
Detailed description of strategic interventions

SAPCC – AP - EPTRI
91
Issues Strategic
interventions Critical Success Factors (CSFs)
Resource requirement
Stakeholders to be
benefited
Stakeholders likely to be
affected/ resistant
Key issues of disagreement
Lever 2 Soil and water conservation
1) Promotion of soil and water conservation technologies
2) Awareness among local communities about advantages of soil and water conservation
3) Enforcement regulations regarding groundwater management
1) Funds for the soil and water conservation programme, including awareness generation
2) Increasing public private partnerships
1) Local population 2) Agriculture and agro based industries 3) Animal husbandry
1) Resistance to discarding or modifying traditional agriculture practices
Lever 3 Strengthen State/District/Regional Disaster Management policies and manuals
1) Effective policies and manual for the various DM agencies for climate change linked disasters
1) Funds allocation for framing the policies and manuals 2) Allocating human and
Local population due to efficient functioning of the disaster management services
Those currently benefiting from adhoc disaster management, namely corrupt officials and non officials.
Motivated disagreements on what constitutes disaster and quantum of relief.
Detailed description of strategic interventions
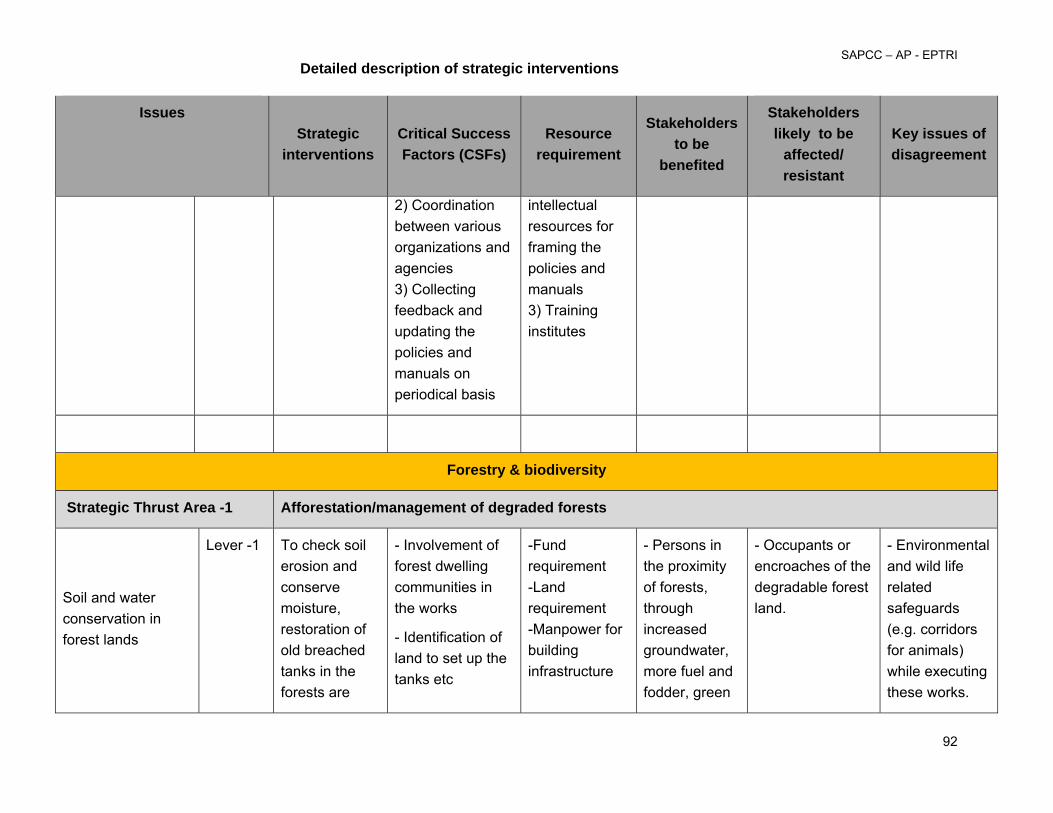
SAPCC – AP - EPTRI
92
Issues Strategic
interventions Critical Success Factors (CSFs)
Resource requirement
Stakeholders to be
benefited
Stakeholders likely to be
affected/ resistant
Key issues of disagreement
2) Coordination between various organizations and agencies 3) Collecting feedback and updating the policies and manuals on periodical basis
intellectual resources for framing the policies and manuals 3) Training institutes
Forestry & biodiversity
Strategic Thrust Area -1 Afforestation/management of degraded forests
Soil and water conservation in forest lands
Lever -1 To check soil erosion and conserve moisture, restoration of old breached tanks in the forests are
- Involvement of forest dwelling communities in the works
- Identification of land to set up the tanks etc
-Fund requirement -Land requirement -Manpower for building infrastructure
- Persons in the proximity of forests, through increased groundwater, more fuel and fodder, green
- Occupants or encroaches of the degradable forest land.
- Environmental and wild life related safeguards (e.g. corridors for animals) while executing these works.
Detailed description of strategic interventions

SAPCC – AP - EPTRI
93
Issues Strategic
interventions Critical Success Factors (CSFs)
Resource requirement
Stakeholders to be
benefited
Stakeholders likely to be
affected/ resistant
Key issues of disagreement
needed. Contour trenching, construction of permanent rock fill dams across streams in forest areas, digging of kuntas, desilting constructions of saucer pits to arrest evaporation of water are some of the other measures that may be adopted.
- Non interference (e.g. grazing) with regenerating forests.
manure etc.
Detailed description of strategic interventions

SAPCC – AP - EPTRI
94
Issues Strategic
interventions Critical Success Factors (CSFs)
Resource requirement
Stakeholders to be
benefited
Stakeholders likely to be
affected/ resistant
Key issues of disagreement
Cyclonic storms and tidal waves cause damage to forests especially in the 9 coastal districts of the state.
Lever -2 Strengthening of the Integrated Afforestation & Eco-development Project (IAEP) and community based programs like Joint Forest Management to check forest degradation and loss of biodiversity, promote ecological restoration and environmental conservation and eco-development, promote
-Availability of funds to drive the afforestation program
-Community involvement in afforestation
-Non interference with regenerating forest.
-Fund requirement -Land requirement -Manpower for building infrastructure
-Communities whose livelihoods depend on forest products
-Occupiers or encroachers of the forest land.
Detailed description of strategic interventions

SAPCC – AP - EPTRI
95
Issues Strategic
interventions Critical Success Factors (CSFs)
Resource requirement
Stakeholders to be
benefited
Stakeholders likely to be
affected/ resistant
Key issues of disagreement
shelter belt plantations in coastal areas to reduce damage from cyclones etc.
Lever- 3 Enhancement of public and private investments for raising plantations for enhancing the cover and density of forests
-Policy framework and financial instruments for such investment
-Fund requirement -Land requirement -Skill set required to advertise and manage the bond
-Communities whose livelihoods depend on forest products -General public
Appropriate-ness of mono-cultures or plantations of exotic species
Strategic Thrust Area -2 Conservation of biodiversity
Extinction of many species due to loss
of forests and
Lever-1 Creation of biodiversity registers for
-Accurate accounting of biodiversity
-Fund requirement -Manpower
-Communities whose livelihoods
- Those likely to be denied free access, enjoyed
Detailed description of strategic interventions

SAPCC – AP - EPTRI
96
Issues Strategic
interventions Critical Success Factors (CSFs)
Resource requirement
Stakeholders to be
benefited
Stakeholders likely to be
affected/ resistant
Key issues of disagreement
unchecked killing. Marine life is at
danger due to loss of plankton
documenting genetic diversity and associated knowledge
Protection and conservation measures
species
- Enforcement of regulations
required to collect information
-Enforcement machinery
depend on forest products
earlier
Energy
Strategic Thrust Area -I Generation of Clean Energy
Lever -1 Develop and implement cleaner coal technologies and R &D for new cleaner coal technologies
The success of clean energy generation depends on the potential of renewable energy in the region. Further the development and
Massive investment in research and generation of renewable energy
The benefits will be more on mitigation side, wherein the emission associated with overall energy generation will
Energy consumers as cost of electricity would rise, and current technology levels
Higher costs of cleaner and renewable energy
Detailed description of strategic interventions

SAPCC – AP - EPTRI
97
Issues Strategic
interventions Critical Success Factors (CSFs)
Resource requirement
Stakeholders to be
benefited
Stakeholders likely to be
affected/ resistant
Key issues of disagreement
Lever- 2 Develop and exploit renewable energy sources like on shore and off shore wind, tide, solar etc.
investment in the R&D initiatives to promote technologies like IGCC is also important for the state utilities.
be reduced
Strategic Thrust Area -2 Developing demand side energy management plan
Lever-1 - Energy efficient electrical systems
- Energy efficient production technologies
- Promotion of incentives for energy efficiency
- Proper pricing
- Energy audits
Private investment in new technology, retrofitting etc.
Will reduce the demand of the electricity and therefore enabling a more access to the energy. This will improve the adaptive capacity of those areas.
Resistance to making investments in new technology or in retrofitting
- Initial costs of the technology (which may repay itself in long run)
Detailed description of strategic interventions

SAPCC – AP - EPTRI
98
Issues Strategic
interventions Critical Success Factors (CSFs)
Resource requirement
Stakeholders to be
benefited
Stakeholders likely to be
affected/ resistant
Key issues of disagreement
Industries
Strategic Thrust Area -1 Making industries climate – resilient
Lever 1 For industries (or the whole supply chain - inbound and outbound logistics) situated in climate change vulnerable areas, government should facilitate shifting supply chain / in adopting climate change resilient infrastructure.
1. Coordination among land use & planning authorities, industry and others concerned. 2. Strategic tie up (knowledge / technology sharing) those having expertise
1. Land 2.Technology 3. Human resources
4. Investments in new infrastructure or shifting of infrastructure
1. Industries 2. Skilled and unskilled workers - new job opportunities
1. Owners of lands required for projects to make industry climate resilient
1. Land allocation could be a major issue
2. Dis-agreements about investing to counter threats that are not imminent.
Detailed description of strategic interventions

SAPCC – AP - EPTRI
99
Issues Strategic
interventions Critical Success Factors (CSFs)
Resource requirement
Stakeholders to be
benefited
Stakeholders likely to be
affected/ resistant
Key issues of disagreement
Lever 2 Incorporation of effective waste management system facilitating more and more recycling / power generation
1. Fund availability 2. Strategic tie up (knowledge / technology sharing) with those having expertise
1.Investments 2. Human resources 3. Expertise (both from strategy / technology ground)
1. Industries 2. Skilled and unskilled workers - new job opportunities 3. Technology suppliers
Lever 3 Awareness building among industry on carbon liabilities and carbon trading opportunities
1. Acquisition of expertise in carbon trading
1. Human resources
2. Efficiency national mechanism
1. Industries 2. Consulting Firms
Detailed description of strategic interventions

SAPCC – AP - EPTRI
100
Issues Strategic
interventions Critical Success Factors (CSFs)
Resource requirement
Stakeholders to be
benefited
Stakeholders likely to be
affected/ resistant
Key issues of disagreement
Transportation
Strategic thrust area 1 Rural transportation infrastructure
1. Rural transport infrastructure (like road connectivity) is susceptable to extreme climate change events like heavy rain fall. This hampers life of common people in the following way - Poor access to various goods and services
- Poor access to disaster management units / rescue services / relief supports
Lever 1 Developing proper road connectivity and climate change resilient road network
• facilitate farmers in accessing safe and secure supply chain
1. Coordination among transportation authorities and land use and planning authorities, disaster management authorities, Health Department
2. Strategic tie up (knowledge / technology sharing) with those having expertise and technology
1. Adequate funding 2. Human resources 3. Expertise and technology
1. Rural population - easy access to goods and services, including disaster/ emergency services
2. Skilled and unskilled workforce - new job opportunities 2. Lower transportation / operating cost for industries and businesses
Not applicable Not applicable
Detailed description of strategic interventions

SAPCC – AP - EPTRI
101
Issues Strategic
interventions Critical Success Factors (CSFs)
Resource requirement
Stakeholders to be
benefited
Stakeholders likely to be
affected/ resistant
Key issues of disagreement
Sustained fund for construction and maintenance
3.Construction industry new business opportunity
Strategic thrust area-2
Urban transport infrastructure
Following issues are identified in the urban area - Explosive growth of cities
-Large-scale migration of rural population to urban areas
- Inadequate infrastructural facilities
- Increase of
Lever 2 Develop an integrated spatial planning system to make goods and service available locally and reduce need for vehicular movement.
1. Coordination among transportation authorities and land use and planning authorities 2. Strategic tie up (knowledge / technology sharing) with those having expertise and technology
1. Substantial fund 2. Human resource (both public and private) 3. Foreign expertise (both from strategy / technology ground) 4. State of art technology
1. Urban population - easy access to all goods and services, less transport cost 2. Skilled and unskilled workforce - new job opportunities 2. Lower transportation / operating
Owners of lands and businesses
affected by land acquisition for infrastructure improvements
Acquiring the land in urban areas for infrastructure improvements is likely to be problematic.
Detailed description of strategic interventions

SAPCC – AP - EPTRI
102
Issues Strategic
interventions Critical Success Factors (CSFs)
Resource requirement
Stakeholders to be
benefited
Stakeholders likely to be
affected/ resistant
Key issues of disagreement
vehicular population multi-fold (almost 200% in the last 10 years) - Share of public transport is low; share of public transport in Hyderabad is 44% way below the global best practices - Road congestion in urban areas
- Poor fuel economy and higher GHG per unit travel
3. Sustained funding for construction and maintenance
cost for industries and businesses 3.Construction industry
Lever 3 Smart infrastructure in urban area to promote non motorized transport (NMT) mode like walking and cycling i.e. - explicit formulation of a local plan for NMT as part of city planning
- provision of separate infrastructure where
1. Improved access to information 2. Promotional strategy 3. Strategic tie up (knowledge / technology sharing) with those expertise and technology
4. Law enforcement
1. Investment in road infrastructure 2. Expertise and technology
1. Urban population - Improvement in public health, less transportation cost 2. Lower transportation / operating cost for industries and businesses 3. Construction industry
4. Businesses associated
Owners of lands and businesses affected by land acquisition for infrastructure
1. Land allocation could be a major issue
Detailed description of strategic interventions
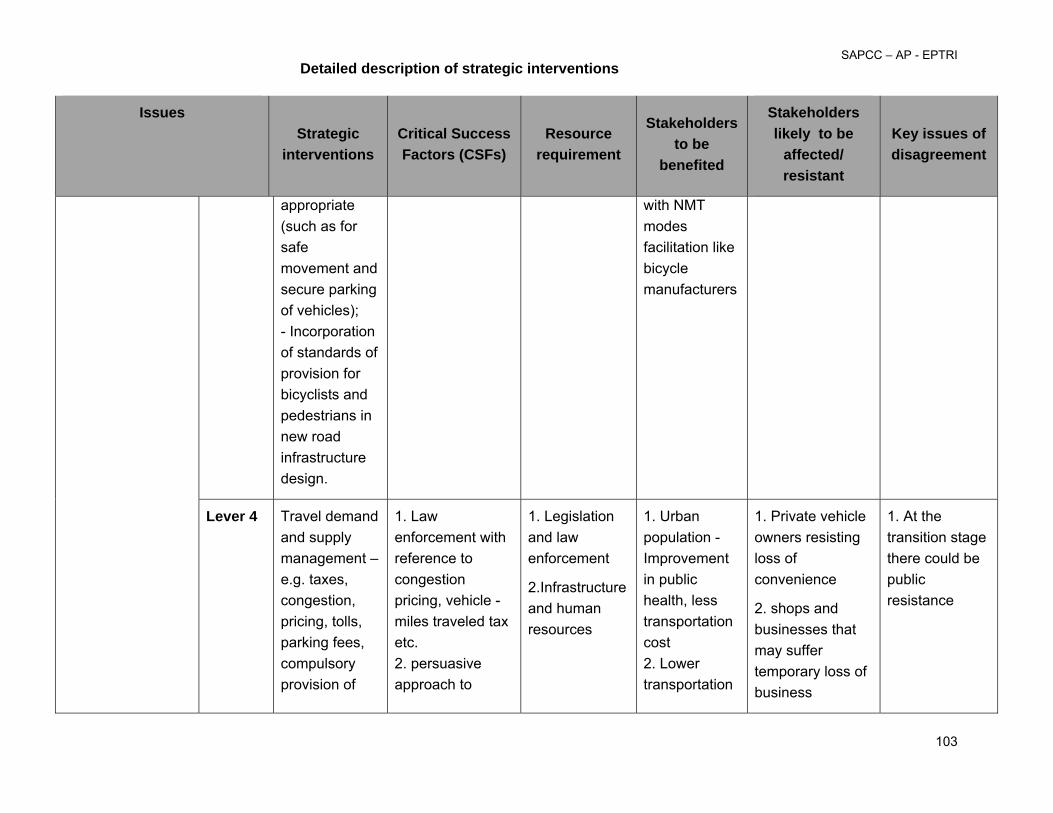
SAPCC – AP - EPTRI
103
Issues Strategic
interventions Critical Success Factors (CSFs)
Resource requirement
Stakeholders to be
benefited
Stakeholders likely to be
affected/ resistant
Key issues of disagreement
appropriate (such as for safe movement and secure parking of vehicles); - Incorporation of standards of provision for bicyclists and pedestrians in new road infrastructure design.
with NMT modes facilitation like bicycle manufacturers
Lever 4 Travel demand and supply management – e.g. taxes, congestion, pricing, tolls, parking fees, compulsory provision of
1. Law enforcement with reference to congestion pricing, vehicle - miles traveled tax etc. 2. persuasive approach to
1. Legislation and law enforcement
2.Infrastructure and human resources
1. Urban population - Improvement in public health, less transportation cost 2. Lower transportation
1. Private vehicle owners resisting loss of convenience
2. shops and businesses that may suffer temporary loss of business
1. At the transition stage there could be public resistance
Detailed description of strategic interventions

SAPCC – AP - EPTRI
104
Issues Strategic
interventions Critical Success Factors (CSFs)
Resource requirement
Stakeholders to be
benefited
Stakeholders likely to be
affected/ resistant
Key issues of disagreement
parking at homes and businesses etc.
cause a modal shift by the public
/ operating cost for industries and businesses
Lever 5 Rail-based mass transit systems that are less congesting than road based systems
1. Explosive and technology
2. Liaison with world class technology suppliers 3. Fund availability
1. Adequate funds 2.Expertise and technology
1. Urban population - easy access to all necessary things, less transport cost, less inconvenience due to less congestion 2. Skilled and unskilled workforce - new job opportunity 3.Construction industry, middle and
1. Owners of lands and businesses affected by land acquisition for the infrastructure
2.Owners of private vehicles
1. Land allocation
Lever 6 Bus rapid transit (BRT) -financially viable, increases speed and safety, and reduces congestion and pollution.
Detailed description of strategic interventions

SAPCC – AP - EPTRI
105
Issues Strategic
interventions Critical Success Factors (CSFs)
Resource requirement
Stakeholders to be
benefited
Stakeholders likely to be
affected/ resistant
Key issues of disagreement
low level contractors - new business opportunity
Health
Strategic Thrust Area -1 Vectors and many infectious disease agents sensitive to weather conditions
Health Outcome: Change of weather conditions leading to infectious diseases, such as malaria, filaria, dengue, chikungunya, influenza etc.
Inadequate early warning systems
Lever-1 Develop early warning systems for disease outbreaks. Disseminate information on appropriate individual behavior to avoid exposure to vectors
Alert early warning systems that can minimize morbidity and mortality, including information dissemination systems
1.Manpower
2.Funding
3.Media
General population
The linkage between CC and diseases is not well established.
Detailed description of strategic interventions

SAPCC – AP - EPTRI
106
Issues Strategic
interventions Critical Success Factors (CSFs)
Resource requirement
Stakeholders to be
benefited
Stakeholders likely to be
affected/ resistant
Key issues of disagreement
Inadequate public sector medical facilities. Lack of quick response medical teams
Lever-2 Well equipped independent quick response medical institutions and teams
Qualified staff, equipment, mobility drugs
Qualified / trained staff, funds for other inputs
General population
- do-
Low levels of research in developing low cost vaccination, rapid diagnostic tests
Lever-3 Sponsor research and development on vaccines and other preventive measures. Provide low-cost vaccinations to those likely to be exposed.
-Deploying researchers in particular fields -Proper lab facilities
- Converting lab technologies to field level
Deploying manpower in particular research fields/ Funding for low cost vaccination research
General population
- do-
Detailed description of strategic interventions

SAPCC – AP - EPTRI
107
Issues Strategic
interventions Critical Success Factors (CSFs)
Resource requirement
Stakeholders to be
benefited
Stakeholders likely to be
affected/ resistant
Key issues of disagreement
Strategic Thrust Area -II
Water borne diseases
Health Outcome: Waterborne Diseases like :Typhoid, Cholera, Diarrhea, Hepatitis, Jaundice, etc
Lack of safe water and sanitation/
sewerage
Lever-1 -Develop and enforce watershed protection
- Ensure safe water supply as per norms
- Ensure 100% coverage of sanitation and sewerage
Undertake vulnerability studies of existing water supply and sanitation systems and
Raising awareness on water management
Identified high risk areas should be closely watched Infrastructure for water supply and sanitation
- Large investments in water supply and sanitation
- Project made implementation and sustained maintenance
Trained personnel
Human and animal population
Generation of funds
Detailed description of strategic interventions

SAPCC – AP - EPTRI
108
Issues Strategic
interventions Critical Success Factors (CSFs)
Resource requirement
Stakeholders to be
benefited
Stakeholders likely to be
affected/ resistant
Key issues of disagreement
ensure that new systems are built to reduce vulnerability.
Strategic Thrust Area -III
Andhra Pradesh has historically been prone to drought like conditions and is the third highest drought prone state after Rajasthan and Karnataka. Adverse weather events such as floods and cyclones (cataclysmic) and droughts and heat weaves (insidious) increase both mortality and morbidity. Apart from physical morbidity, they also cause psychological trauma there might also be deaths and sickness on account of disruption of access to medical services (e.g. infant death during disruption caused by cyclone).
Mortality and morbidity directly or indirectly attributable to extreme weather events
Lever 1
Strengthen of weather events and warning systems
- infrastructure for early warning and trained personnel
- Efficient and responsive public health system
Funds for infrastructure for warning, including collaboration with local telecom and communication companies
Human and animal population Agriculture and Industry/ Business through
Population who might be could be evacuated, or lose the land due to creation of infrastructure
The cost of creating infrastructure for a threat that is not imminent
Detailed description of strategic interventions

SAPCC – AP - EPTRI
109
Issues Strategic
interventions Critical Success Factors (CSFs)
Resource requirement
Stakeholders to be
benefited
Stakeholders likely to be
affected/ resistant
Key issues of disagreement
Equip the population with information about combating such heath out comes
Increase the effectiveness of emergency response during disaster or extreme weather events
Strengthening of the public health system
reduction of work days lost
Detailed description of strategic interventions

SAPCC – AP - EPTRI
110
Issues Strategic
interventions Critical Success Factors (CSFs)
Resource requirement
Stakeholders to be
benefited
Stakeholders likely to be
affected/ resistant
Key issues of disagreement
Urban development- Waste management
Strategic Thrust Area -1 Urban Infrastructure development
Increasing urbanisation, inadequate housing, ever increasing part of the population in urban areas, increasing consumption of goods and energy, consequent solid/ liquid wasted and GHGs.
Lever-1 - Development of energy efficient housing
Incentivization policies that would boost energy efficiency in buildings, The government in association with financial institutions and municipal authorities may introduce micro financing facilities for the poor to assist them to have climate resilient residences.
Human resource and economic resources.
- Savings in energy costs
- New business opportunities
- Savings in transport cost
Resistance to potentially higher capital cost.
Potentially higher capital cost of energy efficient buildings
Lever-2 -Spatial planning of cities to reduce movement and use energy efficient transportation
Those affected by city redevelopment
Lever-3 -Development of renewable energy sources (such as utilization of the solar energy in
Financial resource for the hard ware (like MNRE Incentive). Technological
- Lower recurring energy costs
Those facing higher capital costs on account of regulation.
- Potentially higher capital costs of renewable energy
- Land
Detailed description of strategic interventions
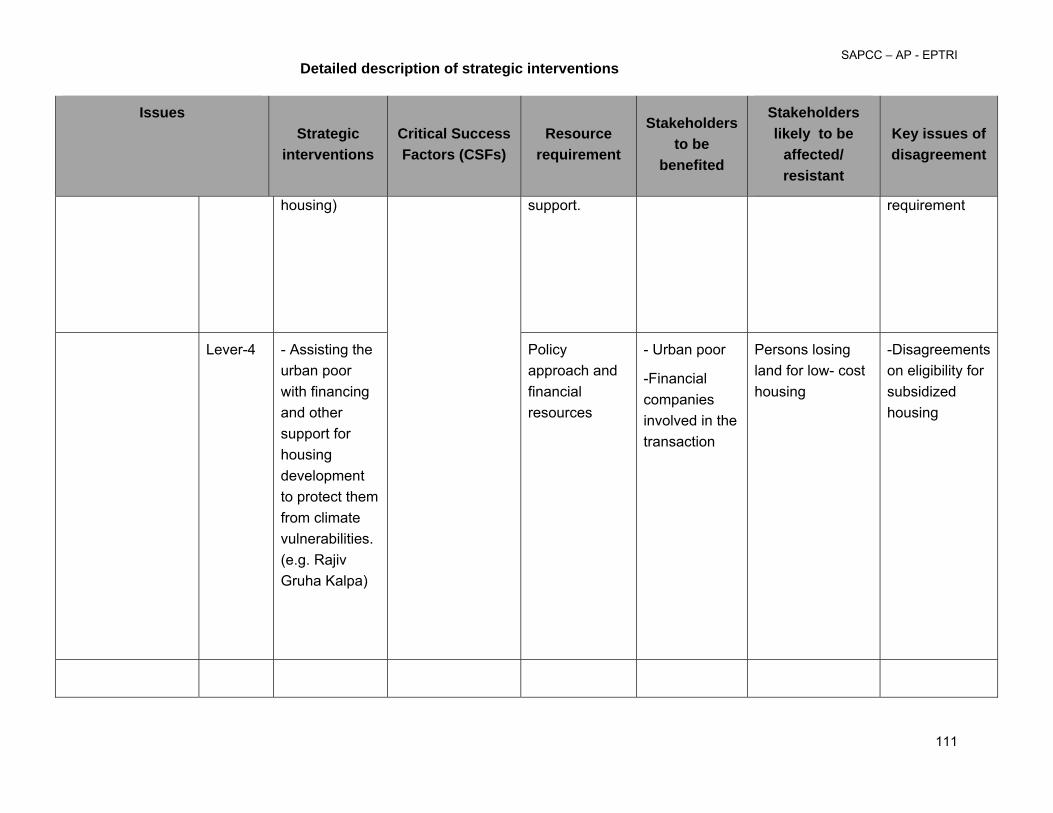
SAPCC – AP - EPTRI
111
Issues Strategic
interventions Critical Success Factors (CSFs)
Resource requirement
Stakeholders to be
benefited
Stakeholders likely to be
affected/ resistant
Key issues of disagreement
housing) support. requirement
Lever-4 - Assisting the urban poor with financing and other support for housing development to protect them from climate vulnerabilities. (e.g. Rajiv Gruha Kalpa)
Policy approach and financial resources
- Urban poor
-Financial companies involved in the transaction
Persons losing land for low- cost housing
-Disagreements on eligibility for subsidized housing
Detailed description of strategic interventions

SAPCC – AP - EPTRI
112
Issues Strategic
interventions Critical Success Factors (CSFs)
Resource requirement
Stakeholders to be
benefited
Stakeholders likely to be
affected/ resistant
Key issues of disagreement
Strategic Thrust Area -2 Urban Waste management and Sewerage facilities
Huge quantum of solid waste generated in the cities.
Lever-1 - Reduction of solid waste e.g. by reducing packaging
- Integrated waste management
from waste collection to final disposal .
- Regulation to reduce solid waste generation
- Reuse and recycle options- Integrated Solid Waste Management
- Efficient city drainage
- Expertise and Investment
- The PPP model is introduced in this area
- Urban population
- Population living in the vicinity of dumps
-Cleaner environment
The unorganized sectors currently operating in the waste collection and disposal will have to be integrated into the system
Drainage designs of the cities not adequate to accommodate high precipitation
Lever-2 - Develop a proper city sewerage management
- Efficient
Financial resources
-Expertise and technology
Urban population
-Businesses
The development of the city drainage system will involve lot of ground work
Detailed description of strategic interventions

SAPCC – AP - EPTRI
113
Issues Strategic
interventions Critical Success Factors (CSFs)
Resource requirement
Stakeholders to be
benefited
Stakeholders likely to be
affected/ resistant
Key issues of disagreement
drainage system of adequate capacity, practice to enable the system accommodate sudden surge of the water occurring due to the excess rainfall and other climate disorders.
and Industries thereby affecting the daily traffic and local livelihood.
Detailed description of strategic interventions

SAPCC – AP - EPTRI
114
Issues Strategic
interventions Critical Success Factors (CSFs)
Resource requirement
Stakeholders to be
benefited
Stakeholders likely to be
affected/ resistant
Key issues of disagreement
Tourism
Strategic Thrust Area -1 Safeguard Natural Resources and Biodiversity
Conservation of biodiversity
Lever 1 -Raise awareness and mobilize stakeholders for conservation of biodiversity and ecosystem services
- Protection of mangroves and reforestation,
reef protection
-Increase public awareness about the value of biodiversity
- Regulation to minimise environmental impact of tourism
Funds for raising awareness and mobilize stakeholders for conservation of biodiversity and ecosystem
Communities whose livelihood
depend on the local ecosystem
Communities and businesses hosting the tourist traffic
Businesses facing regulatory restraints
Detailed description of strategic interventions

SAPCC – AP - EPTRI
115
Issues Strategic
interventions Critical Success Factors (CSFs)
Resource requirement
Stakeholders to be
benefited
Stakeholders likely to be
affected/ resistant
Key issues of disagreement
Strategic Thrust Area -2 Tourism Transportation
Transport technology upgradation to reduce emissions
Lever 1 Incentives and regulation to promote low carbon transport including technology development
-Appropriate laws and policies and enforcement
- Joint action by Government, Industries, users
- Private investments in new or retro-fitted vehicles
- Capacities to supply equipment
-Central/State Government - less dependency on imported fuel, savings to users
- Business opportunity for equipment suppliers
Manufacturers / auxiliary equipment producers (associated to conventional fuel)
Public and private vehicle owners / operators (using conventional fuel)
-Alternative fuel availability could be a major issue
- Resistance to investment needed to retrofit to alternate fuel
Strategic Thrust Area -3 Impacts of climate change causes damage to infrastructure, Water shortages, Water contamination
Lack of awareness on impacts of climate on tourism and tourism on environment
Lever 1 -Education/ awareness raising on two way impacts among tourism
-Raising awareness on two way impacts of climate (damage to infrastructure,
-Human resources to facilitate the best practices on awareness raising to
Tourists, persons in tourism business
Detailed description of strategic interventions
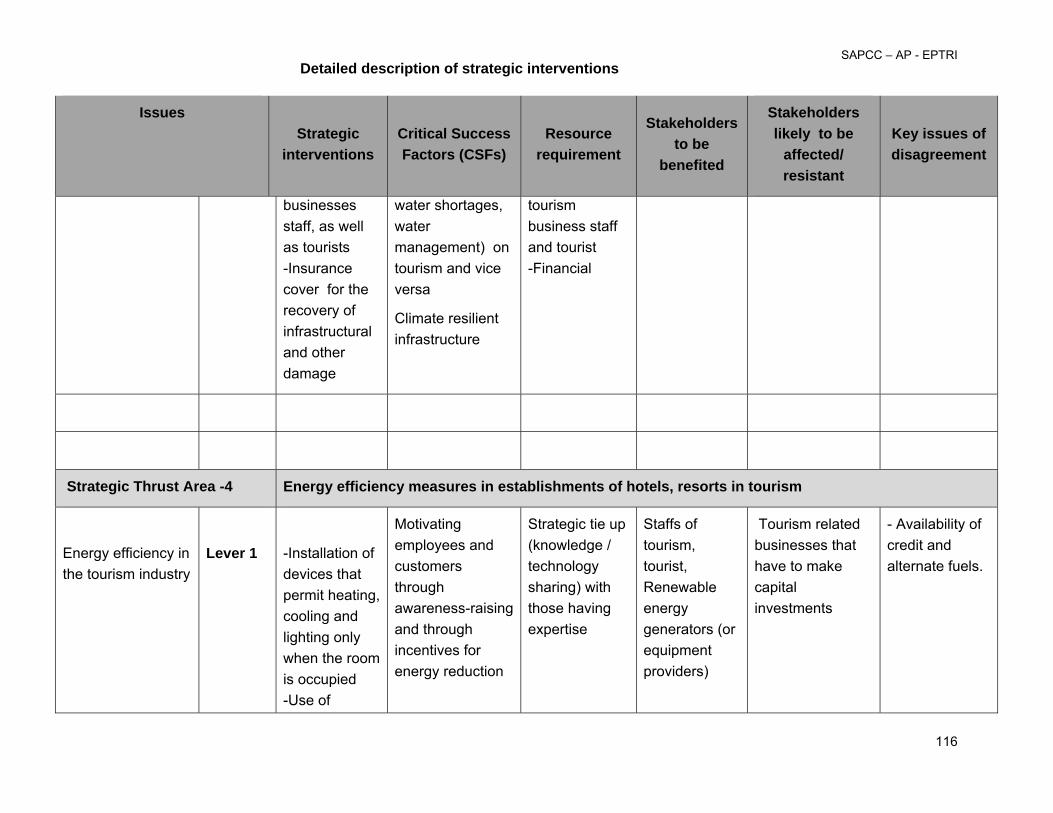
SAPCC – AP - EPTRI
116
Issues Strategic
interventions Critical Success Factors (CSFs)
Resource requirement
Stakeholders to be
benefited
Stakeholders likely to be
affected/ resistant
Key issues of disagreement
businesses staff, as well as tourists -Insurance cover for the recovery of infrastructural and other damage
water shortages, water management) on tourism and vice versa
Climate resilient infrastructure
tourism business staff and tourist -Financial
Strategic Thrust Area -4 Energy efficiency measures in establishments of hotels, resorts in tourism
Energy efficiency in the tourism industry
Lever 1
-Installation of devices that permit heating, cooling and lighting only when the room is occupied -Use of
Motivating employees and customers through awareness-raising and through incentives for energy reduction
Strategic tie up (knowledge / technology sharing) with those having expertise
Staffs of tourism, tourist, Renewable energy generators (or equipment providers)
Tourism related businesses that have to make capital investments
- Availability of credit and alternate fuels.
Detailed description of strategic interventions

SAPCC – AP - EPTRI
117
Issues Strategic
interventions Critical Success Factors (CSFs)
Resource requirement
Stakeholders to be
benefited
Stakeholders likely to be
affected/ resistant
Key issues of disagreement
alternative fuels (e.g., CNG, Biodiesel) and renewable energy sources (e.g., wind, photovoltaic, solar, thermal, geothermal, biomass and waste)
Tourists through lower costs
Businesses through lower costs
Mining
Strategic Thrust Area -1 Deforestation/Land degradation/ Water pollution/ GHG emissions
Land use pattern change due to mining related impacts
Lever 1 -Mandatory compensatory afforestation
- control of pollution
-Quick legislation on Mining, Land Acquisition, R&R
- Transparent and corruption free
Legislation / Policy and enforcement
- Local population
- Workers’ health
-Mining companies
Marginal increase in costs
Detailed description of strategic interventions
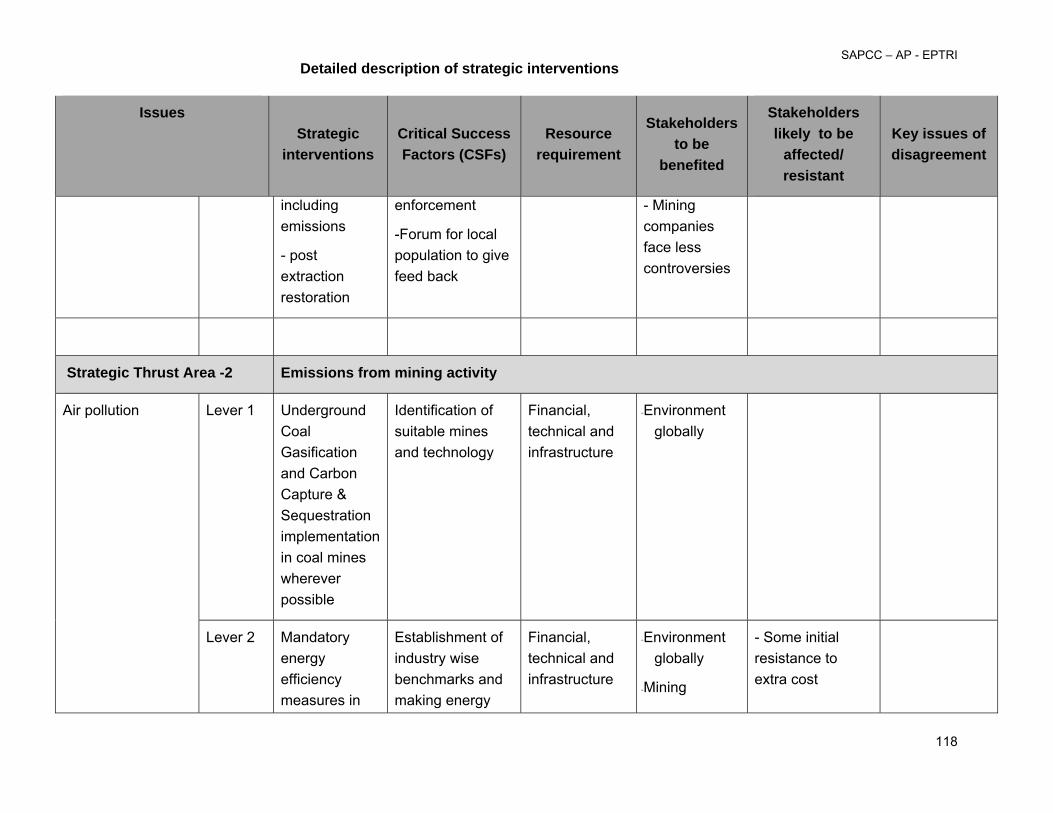
SAPCC – AP - EPTRI
118
Issues Strategic
interventions Critical Success Factors (CSFs)
Resource requirement
Stakeholders to be
benefited
Stakeholders likely to be
affected/ resistant
Key issues of disagreement
including emissions
- post extraction restoration
enforcement
-Forum for local population to give feed back
- Mining companies face less controversies
Strategic Thrust Area -2 Emissions from mining activity
Air pollution Lever 1 Underground Coal Gasification and Carbon Capture & Sequestration implementation in coal mines wherever possible
Identification of suitable mines and technology
Financial, technical and infrastructure
‐Environment globally
Lever 2 Mandatory energy efficiency measures in
Establishment of industry wise benchmarks and making energy
Financial, technical and infrastructure
‐Environment globally
‐Mining
- Some initial resistance to extra cost
Detailed description of strategic interventions

SAPCC – AP - EPTRI
119
Issues Strategic
interventions Critical Success Factors (CSFs)
Resource requirement
Stakeholders to be
benefited
Stakeholders likely to be
affected/ resistant
Key issues of disagreement
mining audits compulsory companies because of cost savings
Strategic Thrust Area -3 Particulate pollution and crop damage due to sediment deposition
Lever 1 Creation of buffer zones around mines by planting trees and providing physical barriers wherever required
Local participation in developing green belts by distributing saplings and seeds
Policy intervention
Farmers: Better crop yield in neighboring areas
Mining companies due to associated cost
Marginal increase on cost
Lever 2 Compulsory installation and operation of air
Penalties for violation of emission
Financial, technical
‐Labour: Better working environment
Mining companies due to associated cost
Marginal increase on cost
Detailed description of strategic interventions

SAPCC – AP - EPTRI
120
Issues Strategic
interventions Critical Success Factors (CSFs)
Resource requirement
Stakeholders to be
benefited
Stakeholders likely to be
affected/ resistant
Key issues of disagreement
pollution control equipment, implementation of suppression techniques
standards ‐Local population
Strategic Thrust Area -5 Water Contamination (Ground/ Surface)
Water pollution Lever 1 ‐ Proper solid and liquid waste management
‐ Control and treatment of industrial effluents
‐
-Mechanism for stakeholder issue reporting
- Penalties for violation of effluent standards
- Policy intervention
- Investment infrastructure
Local population, farmers, local municipalities and Panchayats
Mining companies due to associated cost
Marginal increase on cost
Detailed description of strategic interventions

SAPCC – AP - EPTRI
121
Issues Strategic
interventions Critical Success Factors (CSFs)
Resource requirement
Stakeholders to be
benefited
Stakeholders likely to be
affected/ resistant
Key issues of disagreement
Rural development
Majority of the rural population are largely dependent on agriculture, which is sensitive to climate change
Lever 1 Encouraging crop diversity
1) Encouraging and enabling the farmers to grow diverse crops which are climate change resilient 2) Research for development of climate change resilient crops 3) Educating and training local villagers on crop management 4) Building infrastructure for storing the harvest
1) Funds for support to agriculture, including research 2) Encouraging research into climate change resilient crops 3) Qualified agriculture personnel 4) Access to credit for farmers including tenants
1) Farmers
2) Agri. business
3) Food security for population
‐ Some initial resistance to change
‐ Opposition to genetically modified crops
Detailed description of strategic interventions

SAPCC – AP - EPTRI
122
Issues Strategic
interventions Critical Success Factors (CSFs)
Resource requirement
Stakeholders to be
benefited
Stakeholders likely to be
affected/ resistant
Key issues of disagreement
Deterioration of natural water resources, including uncertainty of rainfall
Lever 2 Integrated Water management – including curtailment of consumption reuse and recovery, groundwater recharge and maintenance of quality
‐ Better understanding of hydro-cycle, both surface and ground
‐ Integrated water management practices
‐ Watershed development
‐ Dissemination of information to users including farmers
‐ Strict control of water quality and effluents
- Large resource requirements in terms of expertise, technology, research, infrastructure (both new and renovation of old infrastructure)
- Population in general including water user segments like agriculture, industry, municipalities etc.
- Initial resistance to the changes in water use practices
Riparian issues – interregional, interstate, local
Detailed description of strategic interventions

SAPCC – AP - EPTRI
123
List of Appendices
Appendix 1: Approach and methodology for development of SAPCC St
ate A
ction
Plan
on C
limat
e cha
nge
Issue identification and analysis
Formulation of a climate change strategy
Engaging stakeholders
Review and synthesize existing information on vulnerability and adaptation
GHG inventorization
Review policy process
Identify adaptation and mitigation options for each of sectors / vulnerable zones
Feasibility and expected impact assessment of those identif ied adaptation and mitigation options
Prioritization
1. Identify major sectors (in line with the ‘National Action Plan on Climate Change’ which are prone to climate change;
2. Identify stakeholders;3. Clarify the roles of stakeholders;4. Manage the dialogue process;5. Collect feedbacks of stakeholders
1. Assessing the exposure of the system of interest to climate stimulus;2. Assessing the adaptive capacity of the system of interest to deal with climate
stimulus;3. Determining the vulnerability of the system of interest to climate stimulus
1. Identification of sectors 2. Identification of emission sources3. Collection of fuel and electricity consumption data 4. Determining the emission factors 5. Sector wise GHG emission mapping
1. Relationship between key policy processes and climate change adaptation;2. Potential for integrating adaptation concerns into policy agendas; and3. Ways to improve existing linkages for policy coherence and to strengthen commitment
to adaptation.
1. Compilation of issues identified under each of sectors2. Compilation of vulnerable zones 3. Compilation of existing state policies which bears significant contribution in increasing
adaptive and mitigating capacity4. Synthesize previous studies (national or state level) on potential adaptation options
national 5. Synthesize global best practices from climate change (adaptation and mitigation) front6. Identification of preliminary list of adaptation and mitigation options suitable for Andhra
Pradesh
1. Assessment of cost effectiveness of the indentified adaptation and mitigation options 2. Identification of critical success factors and challenges (if implemented) for each of the
adaptation and mitigation options 3. Vulnerability impact assessment of the prioritized zones in view of expected climate
change benefits from those identified adaptation and mitigation options 4. Stakeholder mapping for each of the identified adaptation and mitigation options in order
to identify the priority and importance of the stakeholders
1. Prioritize adaptation or mitigation options based on the feasibility and impact assessment conducted in the previous step
Approach Followed to develop State Action Plan on Climate Change
124
Approach and methodology for development for SAPCC
a) Engaging stakeholders
The purpose of this process is to ensure that key stakeholders are fundamentally engaged in developing ‘State Action Plan on Climate Change’. Here “key stakeholders” refers to both those affected by climate change and those best positioned to advance adaptation and mitigation.
This process includes five major tasks:
1. Identify major sectors (in line with the ‘National Action Plan on Climate Change’ which are prone to climate change;
2. Identify stakeholders; 3. Clarify the roles of stakeholders; 4. Manage the dialogue process; 5. Collect feedbacks of stakeholders
This outcome of this event is an active, inclusive stakeholder dialogue and sector specific climate change related issues identified by stake holders.
b) Review and synthesize existing information on vulnerability and adaptation
The main purpose of this process is to develop a Vulnerability Map for the State. This will clearly demark the State into zones, which are prone to climate change vulnerability and therefore would require special interventions by the State authorities to develop climate change resilience in those areas.
The process includes three major tasks:
1. Assessing the exposure of the system of interest to climate stimulus; 2. Assessing the adaptive capacity of the system of interest to deal with climate stimulus; 3. Determining the vulnerability of the system of interest to climate stimulus.
Countries have a range of vulnerabilities to climate change from drought risk to an increased burden of vector-borne diseases. Users will need to narrow the focus of their project to a strategic subset of adaptation priorities.
125
The expected outcome of this assessment is a list of most vulnerable zones where adaptive capacity is low and physical exposure to the climate change is high. Priority will be given to systems where there is both high vulnerability and a high likelihood of significant impacts from climate hazards. Furthermore this assessment will help in developing a list (ranked or unranked) of who is vulnerable, to what, where and to what extent.
c) Methodology for GHG emission assessment
The primary objective of this activity is to sketch the current situation from GHG emission perspective and to give policy makers a snapshot against which to view change. It is against this baseline that the effectiveness of adaptation or mitigation action can later be assessed.
The GHG emission assessment for the State considers 5 major sectors namely industry, land-use, transport, waste and domestic use.
The process includes the following tasks
1. Identification of sectors 2. Identification of emission sources 3. Collection of fuel and electricity consumption data 4. Determining the emission factors 5. Sector wise GHG emission assessment
It needs be stressed in the context that GHGs and their impacts are long term and global. While a GHG assessment of a State might give some indications of where mitigation efforts might be focused, a meticulous inventorisation of GHGs emitted in the territory of a State may really not be needed.

126
Sectoral approach to GHG assessment
Sectors
Land use
Transport
Waste
Industry
Agriculture
Deforestation
Vehicles (heavy/light duty)
Ships
Railways
Municipal waste
Automobile
Textiles & leather
Mines & minerals
Tourism
Service industries
Emission sources•Consumption of fuel in pumps for irrigation•Methane from paddy fields•Cutting down forests for mining activities
•Consumption of fuel in cars (private/taxi /trucks etc)
•Consumption of fuel in airplanes being refueled in AP
•Consumption of fuel in railways (inter-state)
•Methane emissions, emissions from incineration
•Consumption of fuel/power in different manufacturing operations
•Consumption of fuel /power in processing operations
•Methane emissions/power & fuel consumption
•Consumption of fuel/power in different agro processing operations
•Electricity consumption in hotels
Domestic use
Food/agro
Drugs/pharma
Aircrafts
Power
Fuel such as coal/firewood
•Consumption of fuel in ships
•Consumption of power in households
•Emissions from burning of solid/liquid/gas fuels
•Consumption of fuel /power in different operations
•Consumption of power in IT/ITES industries
Data has been collected for all the emission sources as identified above. Appropriate emission factors have been used; where available India specific values have been used else IPCC values have been used.
Review policy process
The major goal of reviewing policy processes is to recognize how adaptive capacity can be developed. Understanding national, sectoral and local policymaking processes is essential for assessing how an adaptation strategy might be implemented through these processes.
Output for this activity might include a brief overview of:
1. Relationship between key policy processes and climate change adaptation;

127
2. Potential for integrating adaptation concerns into policy agendas; and 3. Ways to improve existing linkages for policy coherence and to strengthen commitment
to adaptation.
It will be especially useful to analyze the issue within the policy process where adaptation or mitigation recommendations may be difficult to implement or sustain.
In essence, issues and adaptation priorities can be identified using existing vulnerability assessments, consultations with people likely to be affected, the advice and needs of decision makers, scientific experts, etc.
Formulation of a climate change strategy
An adaptation strategy for a STATE refers to a broad plan of action for addressing impacts of climate change. It entails identification feasible State level interventions in view of the issues identified above and aligning them in a policy world that is full of competing priorities, interest groups, short attention spans, election-driven priorities and a host of potential unpredictable events.
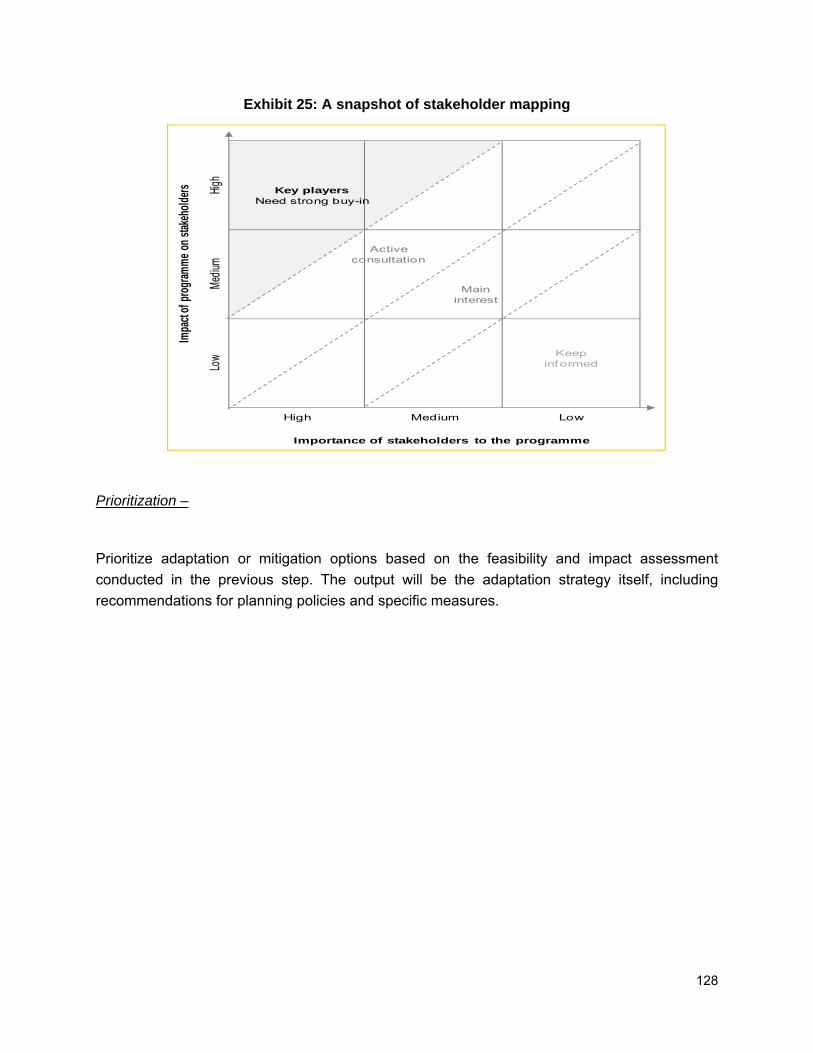
128
Exhibit 25: A snapshot of stakeholder mapping
Importance of stakeholders to the programme
Impa
ct of p
rogram
me on
stake
holde
rs
High Medium Low
Low
Mediu
mHig
h
Key playersNeed strong buy-in
Active consultation
Keep informed
Main interest
Prioritization –
Prioritize adaptation or mitigation options based on the feasibility and impact assessment conducted in the previous step. The output will be the adaptation strategy itself, including recommendations for planning policies and specific measures.