Embed Size (px)
Citation preview

Abhiroop Mukhopadhyay, Assistant Professor, Indian Statistical Institute (Delhi): [email protected]
STATA Hand Out1
STATA Background:
STATA is a Data Analysis and Statistical Software developed by the company
STATA-CORP in 1985. It is widely used by researchers across different fields.
STATA is popular because it provides everything you need for data analysis,
data management and graphics.
STATA's latest version is version 12. Most commands in this hand-out work on
all versions of STATA.
STATA on your computer:
To open STATA, click on the short-cut icon on your desktop which looks like
this -- . This is the icon for STATA 8 (Exercise: whats the version of your
STATA).
The STATA Window
When you open STATA, it will look like the picture below. As you can see,
STATA always has four windows open:
1. The Variables window: this is the box at bottom left corner of the
screen. It shows a list of all of the variables in your dataset.
2. The Command window: this is the window at the bottom right of the
screen. In this window, you type various commands to tell STATA what
to do.
3. The Results window: This is the large black window in the centre of the
screen. This window displays the results generated by the commands
you have entered.
1 The instructor wishes to thank ASER centre for access to its training notes. Some of the material in
this handout has been sourced from there.

Abhiroop Mukhopadhyay, Assistant Professor, Indian Statistical Institute (Delhi): [email protected]
4. The Review window: This is the box in the top left corner. It shows a list
of all the commands you have told STATA to do (i.e. everything you
have typed in the command window). This window is useful if you want
to repeat a command. Therefore, instead of retyping the command, you
can just click on the command that you want to repeat. The command
will then appear in the Command window and you can execute it from
here.
STATA WINDOW
4. Review Window 3. Results Window
1. Variables Window 2. Command Window

Abhiroop Mukhopadhyay, Assistant Professor, Indian Statistical Institute (Delhi): [email protected]
A ZOOMED IN VIEW OF THE RESULT WINDOW (MONOCHROME)
YOU CAN SPOT THE VERSION NUMBER HERE TOO!!! (WHAT IS IT?)
The STATA Toolbar
Across the top of the screen you will see 2 toolbars. On each of these toolbars,
there are a number of buttons that you can use while working with STATA. On
the first toolbar, you will see buttons such as ‘File’ and ‘Edit’ which should
already be familiar to you from programs like MS Excel. If you click on any of
the buttons it will open a menu of options. Other buttons on this toolbar are
not the same as in MS Excel, for example the ‘Data’ ‘Graphics’ and ‘Statistics’
buttons (picture is below). As you work with STATA, you will become familiar
with these buttons
STATA Toolbar (top): THESE MAY VARY VERSION TO VERSION BUT NOT
MUCH
For example, STATA 11 does not have "Prefs" but this functionality is
subsumed into "Edit"
SSSSiiiinnnngggglllleeee----uuuusssseeeerrrr SSSSttttaaaattttaaaa ppppeeeerrrrppppeeeettttuuuuaaaallll lllliiiicccceeeennnnsssseeee::::
999977779999----666699996666----4444666600001111 ((((ffffaaaaxxxx)))) 999977779999----666699996666----4444666600000000 ssssttttaaaattttaaaa@@@@ssssttttaaaattttaaaa....ccccoooommmm 888800000000----SSSSTTTTAAAATTTTAAAA----PPPPCCCC hhhhttttttttpppp::::////////wwwwwwwwwwww....ssssttttaaaattttaaaa....ccccoooommmm SSSSppppeeeecccciiiiaaaallll EEEEddddiiiittttiiiioooonnnn CCCCoooolllllllleeeeggggeeee SSSSttttaaaattttiiiioooonnnn,,,, TTTTeeeexxxxaaaassss 77777777888844445555 UUUUSSSSAAAA 4444999900005555 LLLLaaaakkkkeeeewwwwaaaayyyy DDDDrrrriiiivvvveeee SSSSttttaaaattttiiiissssttttiiiiccccssss////DDDDaaaattttaaaa AAAAnnnnaaaallllyyyyssssiiiissss SSSSttttaaaattttaaaaCCCCoooorrrrpppp____________//// //// ////____________//// //// ////____________//// 11111111....1111 CCCCooooppppyyyyrrrriiiigggghhhhtttt 2222000000009999 SSSSttttaaaattttaaaaCCCCoooorrrrpppp LLLLPPPP ////________ //// ________________//// //// ________________//// ____________ ________________ ________________ ________________ ________________ ((((RRRR))))

Abhiroop Mukhopadhyay, Assistant Professor, Indian Statistical Institute (Delhi): [email protected]
For now on your STATA screen, focus on the second toolbar that is below these
buttons. This toolbar contains a series of short-cut buttons (picture is below).
From left to right, these buttons are as follows:
STATA Toolbar (Short-Cut Buttons: THESE TOO VARY VERSION TO VERSION
1. Open File: clicking on this will allow you to open a data set
2. Save: clicking on this will allow you to save the data set you are
working with
3. Print: clicking on this will print all of your output from the results
window
4. Log: This button creates a ‘log’, or record of all your commands and
results (more on this later)
5. Viewer: Clicking on this button opens a fifth window, called the
Viewer window. The viewer window is used for many things: looking at
STATA help files, viewing results you have saved in a log file, or
browsing through STATA documents online
6. Results: This button brings the results window to the front
7. Graph: If you have made a graph in Stata, clicking on this button will
bring the graph window to the front.
8. Do File Editor: This button opens the Do File editor. In this window,
you can write a series of commands for Stata to do and then run them
all together. STATA will do all of the commands continuously in the
order you have written them (more on this later).
9. Data Editor: This button opens the data editor. You will see the
data displayed just like an MS Excel spreadsheet. Within this window
you can make changes to data.
10. Data Browser: This button opens the data editor. Once again, you
will see the data displayed just like an MS Excel spreadsheet. Within
this window you cannot make changes to data.
11. Go: Sometimes the results of a command take up more space than
the STATA results window can show. When this happens, STATA pauses

Abhiroop Mukhopadhyay, Assistant Professor, Indian Statistical Institute (Delhi): [email protected]
as soon as the results window fills up. To tell STATA to show the rest of
the results, click on the ‘Go’ button.
12. Break: Sometimes the results of a command take up more space
than the results window can show, but you will not want to see the rest
of the results. Therefore, to tell STATA to stop executing the command,
you can click on the “Break” button.
Entering Data into STATA from Other Programs
STATA saves datasets in a file type called .dta. STATA cannot open data in any
other format directly. So, for example, if your data is in Excel (.xls) or some
other program, you will not be able to open it directly using STATA.
To open data from other formats use a simple format convertor called STAT
Transfer.
A SAMPLE SHOT OF STAT TRANSFER

Abhiroop Mukhopadhyay, Assistant Professor, Indian Statistical Institute (Delhi): [email protected]
Opening STATA Data Files
Once your data is in STATA format (.dta) you can open it in STATA and begin
using it. When opening data, you should always go through the following steps.
1. Set STATA’s Memory
Opening a dataset requires STATA to use some amount of your computer’s
memory. Bigger datasets need more memory to open. Running commands
requires more memory again. When you first open STATA, it will be set to use
only 1 megabyte of your computer’s memory. However, this amount may be
too small to open up big datasets and run commands on them. Therefore, it is
very important that before you open any data set in STATA, you tell STATA
how much of your computer’s memory it can use to open and process data.
Small data sets containing only a few observations require less memory than
larger data sets.
type the following into the STATA command window and press enter.
set mem 1m
You could set the memory used to any size you like by changing the number.
For example, later when you work with a large data set which needs 100
megabytes of memory to open. Before opening this datasets, you should type:
set mem 100m
Note: It is not possible to re-set the memory once a data set has been
opened. You must clear the data in STATA’s memory first. Further, if you are
not sure how much memory to use, check the size of your data file, and set the
memory to a number bigger than this.

Abhiroop Mukhopadhyay, Assistant Professor, Indian Statistical Institute (Delhi): [email protected]
RESULTS WINDOW
2. Start a Log File
The next step is to start a ‘log’ file. A log file records any commands that you
type into STATA, as well as the output that these commands generate. The
log file is a record of both your input and your output. This is important as
you can only view the last few commands and results in the results window on
your STATA screen, and not all of the commands you have executed. Once you
open a log file, all of your commands and results are automatically saved in this
file. You can open the file again at some later stage and review everything you
have done. You should always open a log file before beginning a STATA
session.
EASIEST METHOD: Click File > Log > Begin ... at this stage many versions will
ask you for a file name... the file is stored as .smcl (let us store the file as
nss_session 1 in the subdirectory NSS\log
METHOD 2: Click the appropriate short cut icon from STATA tool bar.
111100003333....222200001111MMMM sssseeeetttt mmmmaaaattttssssiiiizzzzeeee 444400000000 mmmmaaaaxxxx.... RRRRHHHHSSSS vvvvaaaarrrrssss iiiinnnn mmmmooooddddeeeellllssss 1111....222255554444MMMM sssseeeetttt mmmmeeeemmmmoooorrrryyyy 111100000000MMMM mmmmaaaaxxxx.... ddddaaaattttaaaa ssssppppaaaacccceeee 111100000000....000000000000MMMM sssseeeetttt mmmmaaaaxxxxvvvvaaaarrrr 5555000000000000 mmmmaaaaxxxx.... vvvvaaaarrrriiiiaaaabbbblllleeeessss aaaalllllllloooowwwweeeedddd 1111....999944447777MMMM sssseeeettttttttaaaabbbblllleeee vvvvaaaalllluuuueeee ddddeeeessssccccrrrriiiippppttttiiiioooonnnn ((((1111MMMM ==== 1111000022224444kkkk)))) ccccuuuurrrrrrrreeeennnntttt mmmmeeeemmmmoooorrrryyyy uuuussssaaaaggggeeee
CCCCuuuurrrrrrrreeeennnntttt mmmmeeeemmmmoooorrrryyyy aaaallllllllooooccccaaaattttiiiioooonnnn
.... sssseeeetttt mmmmeeeemmmm 111100000000mmmm
ooooppppeeeennnneeeedddd oooonnnn:::: 11118888 OOOOcccctttt 2222000011111111,,,, 11110000::::11115555::::44445555 lllloooogggg ttttyyyyppppeeee:::: ssssmmmmccccllll lllloooogggg:::: CCCC::::\\\\UUUUsssseeeerrrrssss\\\\aaaaddddmmmmiiiinnnn\\\\DDDDeeeesssskkkkttttoooopppp\\\\NNNNSSSSSSSS\\\\lllloooogggg\\\\nnnnssssssss____sssseeeessssssssiiiioooonnnn 1111....ssssmmmmccccllll nnnnaaaammmmeeee:::: <<<<uuuunnnnnnnnaaaammmmeeeedddd>>>> .... lllloooogggg uuuussssiiiinnnngggg """"CCCC::::\\\\UUUUsssseeeerrrrssss\\\\aaaaddddmmmmiiiinnnn\\\\DDDDeeeesssskkkkttttoooopppp\\\\NNNNSSSSSSSS\\\\lllloooogggg\\\\nnnnssssssss____sssseeeessssssssiiiioooonnnn 1111....ssssmmmmccccllll""""

Abhiroop Mukhopadhyay, Assistant Professor, Indian Statistical Institute (Delhi): [email protected]
METHOD 3: TYPE log using
"C:\Users\admin\Desktop\NSS\log\nss_session.smcl" IN THE COMMAND
WINDOW (You will ofcourse have to change the path name in this command)
As you keep working on STATA, the log file captures every action that you are
taking. If you would like to close your log file permanently in the middle of
your STATA session - you can do this by typing the following command into the
STATA command window and pressing enter;
log close
If you would like to close your log file temporarily in the middle of your STATA
session - you can do this by typing the following command into the STATA
command window and pressing enter;
log off
If you then want to turn on your log file once again - you can type the following
command into the STATA command window and pressing enter;
log on
When you finish your STATA session, the log records ends as well.
Viewing Log File:
File > Log > View > Browse
Exercise
1. Log begin nss_session 1
2. Type set mem 100m in Command Window
3. Type log off in Command Window

Abhiroop Mukhopadhyay, Assistant Professor, Indian Statistical Institute (Delhi): [email protected]
(From here on, when I say Type, I mean Type in Command Window unless
otherwise specified)
4. Type set mem 1m
5. Type log on
6. Type set mem 50m
7. Type log close
8. View log file.... What don't you see?
Loading Data into STATA
Once you have set the memory and opened a log file, you can open your
dataset. Data is opened the same way as opening a file in MS Word or Excel:
METHOD 1: just click on File on the top right of the STATA screen. From the
drop down menu, click on Open and locate the file you want.
METHOD 2: You can also click the ‘open’ icon referred to earlier on the far left
of the STATA toolbar and locate the file you want.
METHOD 3: use "C:/XX/XXX.dta", clear
clear: clears all previous data in the computers memory.
.........................................................End of Lecture 1..................................
Exploring Data:
THREE METHODS:
1. TOGGLE THE TOOLBAR KEYS
2. GIVE COMMANDS IN THE COMMAND PROMPT

Abhiroop Mukhopadhyay, Assistant Professor, Indian Statistical Institute (Delhi): [email protected]
3. WRITE A PROGRAM FILE WITH ALL THE COMMANDS.
For this talk: we use method 3.
Do files:
• A do-file is a program that you write for STATA. It is called a ‘do-file’
because it is a file that is saved with the suffix ‘.do’.
• Essentially, a do-file is a file in which you can write a list of commands
that you want to run in STATA. When you are finished writing your
commands, you can run the do-file and STATA executes each command in
the do file in the order that you have written them.
• Do-files are a strongly recommended way of working in STATA. This is
because they are permanent records of all the commands and steps that
you used to change/manipulate your original dataset and the results
thereof.
• Saved do-files can be run at a later time to replicate the steps you took
while working with your dataset.
• Do-files can also be shared with other people working on the same dataset
quite easily.
• You can even insert comments into your do-file to help other people follow
your thought process.
How to create a do file:
Take your cursor and check the toolbar... one of them will say "New do file
Editor"...

Abhiroop Mukhopadhyay, Assistant Professor, Indian Statistical Institute (Delhi): [email protected]
The Do-file Window and Toolbar
You will see a window open as shown in Picture below (Again different
versions may be different but same idea)
Screen shot of a Do-File: STATA 9
Do-file Toolbar Space to Write Your Program
Line Numbers Tracked Here

Abhiroop Mukhopadhyay, Assistant Professor, Indian Statistical Institute (Delhi): [email protected]
Screen shot of a Do-File: STATA 11
Line Numbers Tracked Here
The do-file window in the picture closely resembles an empty Notepad
document in MS Windows. You can type your program i.e.
commands/comments on the white space provided in the window.
At the bottom of the window, you will see the text ‘line number: 1’. As you
write your commands and steps in the do-file, you will see the count for
number of lines increase.
On the top of the do-file window you can see buttons like ‘File’ ‘Edit’ ‘Search’
and ‘Tools’. You should already be familiar with these buttons from programs
like Notepad and MS Word.

Abhiroop Mukhopadhyay, Assistant Professor, Indian Statistical Institute (Delhi): [email protected]
On the tool bar: find these two icons in the end.
1. Do Current File: If you select a few lines within your do-file and click
on this button, STATA executes the commands for those selected lines
only. (in later versions of STATA: "Execute Selection")
2. Run Current File: Clicking on this button runs the entire do-file you
have writing without interruption (in later versions of STATA:
"Execute Selection Quietly (run)")
For this presentation, we will click "Do Current File Only" (in later versions
of STATA: "Execute Selection")
To see how it works, let us open an existing do file
Open existing do file.
METHOD 1: File > OPEN > (this will open a file browse window)... choose
Do File format
Click File Name
METHOD 2: Click the "Do file" Icon on short cut toolbar and File open...
Let us click and go to the File NSS_exercise.do in folder ../Do_file

Abhiroop Mukhopadhyay, Assistant Professor, Indian Statistical Institute (Delhi): [email protected]
To Run Selected lines, (lets say the first three lines)... block the three lines
and click "Do Current File"(in later versions of STATA: "Execute Selection")
from the toolbar.

Abhiroop Mukhopadhyay, Assistant Professor, Indian Statistical Institute (Delhi): [email protected]
* Any line beginning with an asterix(*) is a comment in a do file.
1. Command: describe
Purpose: The describe command helps to describe the variables in your
dataset. It provides details on the variable name, whether the variable is
numeric or string, and details of any labels2 attached to the variables and its
values.
2 ‘labels’ refer to descriptions attached to the variable and values of a variable. This will be dealt with in more
detail in Chapter 7.

Abhiroop Mukhopadhyay, Assistant Professor, Indian Statistical Institute (Delhi): [email protected]
• The first column in the results window gives the names of the variables.
• The second column shows the “storage type”. This means the way in
which Stata stores the variable. STATA stores numeric variables as byte,
int, long, float or double (depending on how big the numbers in a
variable are). STATA stores string variables as str.
• The third column shows how much space given to it and what type of
variable it is declared. For example common id : %9s says it is a variable
that has been given nine spaces and its a string
• Fourth variable we will come to later
• Fifth variable are labels given to data set (In the case of NSS data, these
are given during the time of extraction. we come to this later)

Abhiroop Mukhopadhyay, Assistant Professor, Indian Statistical Institute (Delhi): [email protected]
Notice -More- at the end of the page. You have to press space bar for it
to scroll down further.
You might want to describe only one variable in the dataset, rather than
all of them. You can do this by typing describe, followed by the name of
the variable
For example : describe sub_round
2. Command: lookfor
Purpose: This command helps you to find a variable in your dataset. You can
use this command when you are not sure of the variable’s name.
3. Command: browse
Purpose: This command is used when you want to display data in STATA’s
data browser window. This command is useful if you want to take a closer
look at the raw data. When you use the browse command you will see the data
displayed just like an Excel sheet.
ssssuuuubbbb____rrrroooouuuunnnndddd bbbbyyyytttteeee %%%%11110000....0000gggg ssssuuuubbbb----rrrroooouuuunnnndddd vvvvaaaarrrriiiiaaaabbbblllleeee nnnnaaaammmmeeee ttttyyyyppppeeee ffffoooorrrrmmmmaaaatttt llllaaaabbbbeeeellll vvvvaaaarrrriiiiaaaabbbblllleeee llllaaaabbbbeeeellll ssssttttoooorrrraaaaggggeeee ddddiiiissssppppllllaaaayyyy vvvvaaaalllluuuueeee
.... ddddeeeessssccccrrrriiiibbbbeeee ssssuuuubbbb____rrrroooouuuunnnndddd
ssssttttaaaatttteeee bbbbyyyytttteeee %%%%11117777....0000gggg ssssttttaaaatttteeee____66661111 ssssttttaaaatttteeee____rrrreeeeggggiiiioooonnnn iiiinnnntttt %%%%11110000....0000gggg ssssttttaaaatttteeee----rrrreeeeggggiiiioooonnnnssssaaaammmmpppplllleeee bbbbyyyytttteeee %%%%11110000....0000gggg ssssaaaammmmpppplllleeee ssssaaaammmmpppplllleeee ((((cccceeeennnnttttrrrraaaallll----1111,,,, ssssttttaaaatttteeee----2222)))) vvvvaaaarrrriiiiaaaabbbblllleeee nnnnaaaammmmeeee ttttyyyyppppeeee ffffoooorrrrmmmmaaaatttt llllaaaabbbbeeeellll vvvvaaaarrrriiiiaaaabbbblllleeee llllaaaabbbbeeeellll ssssttttoooorrrraaaaggggeeee ddddiiiissssppppllllaaaayyyy vvvvaaaalllluuuueeee
.... llllooooooookkkkffffoooorrrr ssssttttaaaatttteeee

Abhiroop Mukhopadhyay, Assistant Professor, Indian Statistical Institute (Delhi): [email protected]
You cannot make changes to the data from this window. In order to
close the browser window - click on the Cancel button on the top right of
the screen.
You can browse selective variables: For example, if you want to see only
state_region and state: then
browse state state_region

Abhiroop Mukhopadhyay, Assistant Professor, Indian Statistical Institute (Delhi): [email protected]
NOTE: LOOK AT THE ARROW AT 33. While the browser shows Tamil
Nadu, the bar on top which shows what cell you are looking at shows
33. This because while extracting (or later) we can put labels to
values. So the data is numeric but it shows as label when you see the
data.
Digression: ‘codebook’ Command
Purpose: The command codebook can be used to examine full details
of the variables (including the variable labels, code values and labels).
For example Religion values have been labelled in the data: Examine the
labels using the statement

Abhiroop Mukhopadhyay, Assistant Professor, Indian Statistical Institute (Delhi): [email protected]
codebook religion
4. Command: inspect
Purpose: The inspect command provides a quick summary of a numeric
variable. It reports the number of positive, negative and zero values, and the
number of unique and missing values contained within the numeric variable.
This command is useful to get familiar with unknown data quickly and easily.
5. Command: sort
Purpose: The sort command arranges observations in the dataset into
ascending order. The dataset is sorted based on the values of the variables
specified in the command. The sort command is especially useful when
merging two separate data-files.
9999 .... 1111111111111111 9999 ooootttthhhheeeerrrrssss 1111 7777 ZZZZoooorrrrooooaaaassssttttrrrriiiiaaaannnniiiissssmmmm 1111000000002222 6666 BBBBuuuuddddddddhhhhiiiissssmmmm 88880000 5555 JJJJaaaaiiiinnnniiiissssmmmm 2222222222221111 4444 SSSSiiiikkkkhhhhiiiissssmmmm 5555666655555555 3333 CCCChhhhrrrriiiissssttttiiiiaaaannnniiiittttyyyy 8888444488886666 2222 IIIIssssllllaaaammmm 66660000777744441111 1111 HHHHiiiinnnndddduuuuiiiissssmmmm ttttaaaabbbbuuuullllaaaattttiiiioooonnnn:::: FFFFrrrreeeeqqqq.... NNNNuuuummmmeeeerrrriiiicccc LLLLaaaabbbbeeeellll
uuuunnnniiiiqqqquuuueeee vvvvaaaalllluuuueeeessss:::: 8888 mmmmiiiissssssssiiiinnnngggg ....:::: 9999////77779999333300006666 rrrraaaannnnggggeeee:::: [[[[1111,,,,9999]]]] uuuunnnniiiittttssss:::: 1111
llllaaaabbbbeeeellll:::: rrrreeeelllliiiiggggiiiioooonnnn ttttyyyyppppeeee:::: nnnnuuuummmmeeeerrrriiiicccc ((((bbbbyyyytttteeee))))
rrrreeeelllliiiiggggiiiioooonnnn rrrreeeelllliiiiggggiiiioooonnnn
.... ccccooooddddeeeebbbbooooooookkkk rrrreeeelllliiiiggggiiiioooonnnn
ssssttttaaaatttteeee iiiissss llllaaaabbbbeeeelllleeeedddd aaaannnndddd aaaallllllll vvvvaaaalllluuuueeeessss aaaarrrreeee ddddooooccccuuuummmmeeeennnntttteeeedddd iiiinnnn tttthhhheeee llllaaaabbbbeeeellll....
((((33335555 uuuunnnniiiiqqqquuuueeee vvvvaaaalllluuuueeeessss))))1111 33335555 77779999333300006666 #### #### #### #### #### MMMMiiiissssssssiiiinnnngggg ---- #### #### #### #### #### TTTToooottttaaaallll 77779999333300006666 77779999333300006666 ---- #### #### #### #### #### #### #### PPPPoooossssiiiittttiiiivvvveeee 77779999333300006666 77779999333300006666 ---- #### #### #### ZZZZeeeerrrroooo ---- ---- ---- #### NNNNeeeeggggaaaattttiiiivvvveeee ---- ---- ---- TTTToooottttaaaallll IIIInnnntttteeeeggggeeeerrrrssss NNNNoooonnnniiiinnnntttteeeeggggeeeerrrrssss ssssttttaaaatttteeee:::: NNNNuuuummmmbbbbeeeerrrr ooooffff OOOObbbbsssseeeerrrrvvvvaaaattttiiiioooonnnnssss
.... iiiinnnnssssppppeeeecccctttt ssssttttaaaatttteeee
Abhiroop Mukhopadhyay, Assistant Professor, Indian Statistical Institute (Delhi): [email protected]
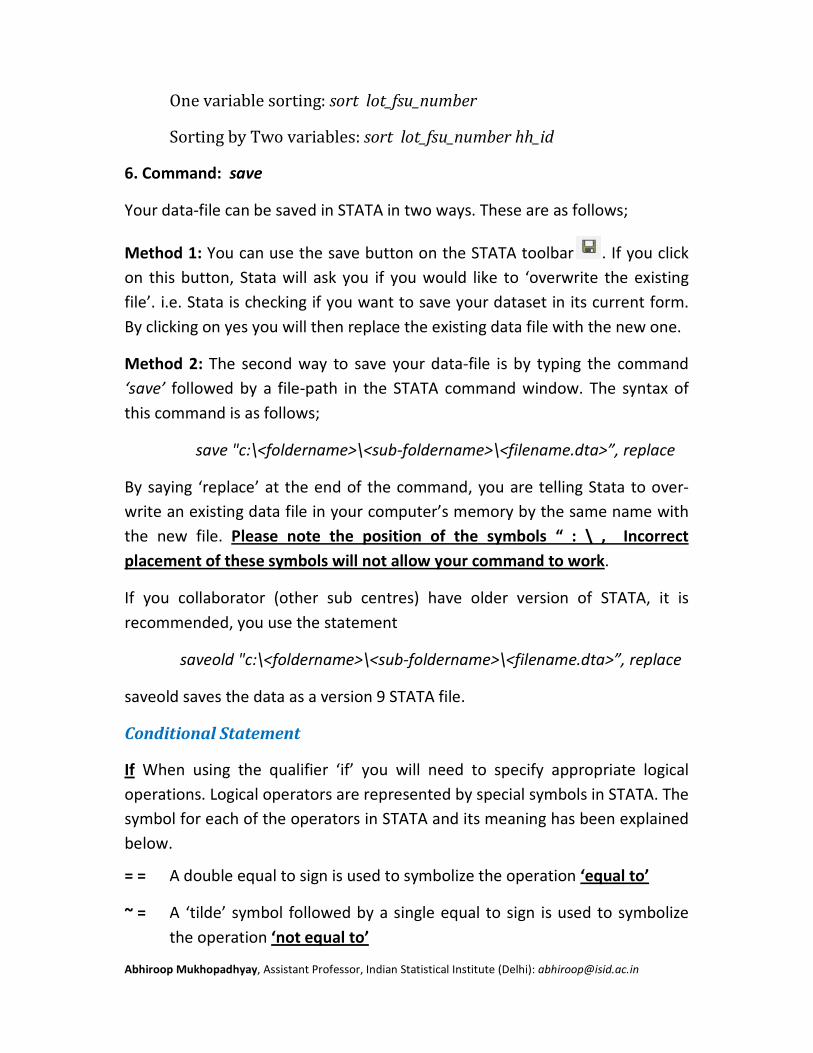
One variable sorting: sort lot_fsu_number
Sorting by Two variables: sort lot_fsu_number hh_id
6. Command: save
Your data-file can be saved in STATA in two ways. These are as follows;
Method 1: You can use the save button on the STATA toolbar . If you click
on this button, Stata will ask you if you would like to ‘overwrite the existing
file’. i.e. Stata is checking if you want to save your dataset in its current form.
By clicking on yes you will then replace the existing data file with the new one.
Method 2: The second way to save your data-file is by typing the command
‘save’ followed by a file-path in the STATA command window. The syntax of
this command is as follows;
save "c:\<foldername>\<sub-foldername>\<filename.dta>”, replace
By saying ‘replace’ at the end of the command, you are telling Stata to over-
write an existing data file in your computer’s memory by the same name with
the new file. Please note the position of the symbols “ : \ , Incorrect
placement of these symbols will not allow your command to work.
If you collaborator (other sub centres) have older version of STATA, it is
recommended, you use the statement
saveold "c:\<foldername>\<sub-foldername>\<filename.dta>”, replace
saveold saves the data as a version 9 STATA file.
Conditional Statement
If When using the qualifier ‘if’ you will need to specify appropriate logical
operations. Logical operators are represented by special symbols in STATA. The
symbol for each of the operators in STATA and its meaning has been explained
below.
= = A double equal to sign is used to symbolize the operation ‘equal to’
~ = A ‘tilde’ symbol followed by a single equal to sign is used to symbolize
the operation ‘not equal to’

Abhiroop Mukhopadhyay, Assistant Professor, Indian Statistical Institute (Delhi): [email protected]
> A greater than sign is used to symbolize the operation ‘greater than’
< A less than sign is used to symbolize the operation ‘less than’
> = A greater than sign followed by a single equal to sing is used to
symbolize the operation ‘greater than and equal to’
< = A less than sign followed by a single equal to sing is used to symbolize
the operation ‘less than and equal to’
& You should already be familiar with this sign. It symbolizes the operation
‘and’
| This sign symbolizes the operation ‘or’
Example : browse if state==33 & sub_round>=2
This will show you the data for state code 33 and when sub round numbers are
2, 3 and 4.
----------------------------------------------------End of Lecture 2-------------------------------
Renaming Variables:
Purpose: Often we receive the data from the data-entry operators we find that
sometimes we have to rename variables in order to make them easy to use
and identify. The command that is used to do this in STATA is called rename.
The syntax for this command is as follows;
rename <variable name> <new variable name>
For example: you want to rename fsu numbers as village.
rename lot_fsu_number village

Abhiroop Mukhopadhyay, Assistant Professor, Indian Statistical Institute (Delhi): [email protected]
Dropping/Keeping Variables and Observations
When working with data, you will sometimes find that there are variables or
observations in your dataset that you do not need. In such a situation the
commands drop or keep can be used in STATA.
6.4.1 The Drop/Keep Commands
Purpose: The command ‘drop’ deletes variables or observations from a
dataset.
The command ‘keep’ works the in the same way as drop, except in this case
you have to specify the variables or observations that you want to keep,
rather than the variables or observations you want to delete.
6.4.2 Dropping/Keeping Variables
If you want to drop a single variable or a list of variables, the syntax to do this
is as follows;
drop <variable list>
keep <variable list>
For example:
drop social_group
will drop social group from the data set
keep common_id mpce_30_days
will give you a data set with just those two variables.
NOTE:
If you save the file at this stage, then the file will only have common_id and
mpce_30_days.
On the other hand, if you do not save the data set, then the last saved version
will still exist and the changes you have made to the data set will be lost as

Abhiroop Mukhopadhyay, Assistant Professor, Indian Statistical Institute (Delhi): [email protected]
soon you close the session. (to access it you have to open that data set
"rural01" in the class example again.
Once you drop or keep, the variables dropped will not be available in the
session (unless the original data set rural01.dta is again loaded).
Dropping /Keeping Observations
If you want to delete observations from a dataset, you can use the
commands drop/keep with qualifier if and the relevant operators.
For example if we want observations for only Hindus, then
drop if religion~=1
OR
keep if religion==1
Multiple Qualifiers can be used: So data for only Hindu Schedule Castes:
keep if religion==1 & social_group==2
Generating a New Variable
When working with data in STATA very often you will find that you need to
generate a new variable to help your analysis. As far as possible, when using
STATA you should always strive to work with a dataset that has primarily
numeric variables. Therefore, if required you should convert string variables
into numeric variables3. Numeric can either be discrete, continuous,
categorical or dummy.
Command: gen
Purpose: In STATA the command to generate a new variable is known as
generate or gen for short. The syntax for this command is as follows;
3 This tutorial will not deal with converting string variables into numeric. For further information on this, you
can visit the UCLA STATA website link - http://www.ats.ucla.edu/stat/stata/faq/destring.htm

Abhiroop Mukhopadhyay, Assistant Professor, Indian Statistical Institute (Delhi): [email protected]
gen <variable name> = <value of the variable>
Note: When generating the variable you only need to use the equal to sign
once.
From the above you can see that when generating new variables you must
always specify the name of the variable and its value.
In the dataset given, let us generate a variable called round and give it the
value 61 as this is data from the 61st round.
There is an error message because the variable round already exists (how will
you check that it already exists?)
Lets say that the variable round has a wrong value. Data inputter have input
the value 55 instead of 61. what would you do?
drop round
gen round=61
NOTE: all newly generated variables come at the end of the data set... SCROLL
DOWN on the variables list window to find the new variable round (check its
indeed 61 by visual inspection)
rrrr((((111111110000))));;;;
eeeennnndddd ooooffff ddddoooo----ffffiiiilllleeee
rrrr((((111111110000))));;;;rrrroooouuuunnnndddd aaaallllrrrreeeeaaaaddddyyyy ddddeeeeffffiiiinnnneeeedddd.... ggggeeeennnn rrrroooouuuunnnndddd====66661111.... .... **** GGGGeeeennnneeeerrrraaaattttiiiinnnngggg aaaa vvvvaaaarrrriiiiaaaabbbblllleeee
.... uuuusssseeee rrrruuuurrrraaaallll00001111,,,, cccclllleeeeaaaarrrr

Abhiroop Mukhopadhyay, Assistant Professor, Indian Statistical Institute (Delhi): [email protected]
Another context: Let us assume that NSS has reported the total household
consumption incorrectly as MPCE in its data set. You realize this and want to
create a variable mpce_corr that divides this incorrect MPCE by household size
to get the correct mpce.
gen mpce_corr= mpce_30_days/ hh_size
Command: replace
Another way to replace the value of 55 by 61 in the original data set (one of
the examples above) is just replace the value of 55 for the variable round to 61.
replace round=61
Combining gen and replace with IF
Example... I want to create a variable which indicates if a household has mpce
less than Rs 800 (poor?).
gen poor=1 if mpce_corr<=800
But what of those that have mpce_correct above 800. STATA puts them as . s
by default. We may want to replace them by 0
replace poor=0 if mpce_corr>800
Analyzing Data:
* For the moment abstract from the idea that there are multipliers.
The ‘sum’ Command
1. The Simple Sum Command: The sum command calculates and then displays
a variety of summary statistics for a dataset. If you type the command sum by
itself (i.e. without specifying any variables) STATA calculates summary
statistics for all the variables in the dataset.

Abhiroop Mukhopadhyay, Assistant Professor, Indian Statistical Institute (Delhi): [email protected]
Example: To illustrate type the following command into the STATA command
window and press enter;
sum
Output: You will see the following output appear on the STATA screen; (Please
note that this is a snapshot of the entire output).
‘sum’ Output
Comment: From the output above you can see that STATA has calculated
summary statistics for all the variables. It can calculate meaningful number
only if the variable is numeric. But all numeric variables need not make sense.
• The first column contains the number of observations for which the
summary statistics have been generated.
Note: If data is missing for a particular observation, STATA will not
include such observations when generating the summary statistics.
This is very important to know as it affects the results of your
interpretation. Therefore, when reporting summary statistics, ensure
that you mention the number of observations that have been included
for a particular statistic
mmmmoooorrrreeee ssssllllnnnnoooo____ooooffff____iiiinnnn~~~~tttt 77779999333300001111 1111....999955554444111122224444 5555....888866660000444411112222 1111 99999999 ffffiiiilllllllleeeerrrr 77779999333300006666 0000 0000 0000 0000 lllleeeevvvveeeellll 77779999333300006666 1111 0000 1111 1111 hhhhhhhh____iiiidddd 77779999333300006666 1111....777755552222666600004444 1111....000044441111888877776666 1111 11110000sssseeeeccccoooonnnndddd____ssssttttaaaa~~~~mmmm 77779999333300006666 2222....222211111111000000005555 ....7777555522220000999988884444 1111 3333 hhhhaaaammmmlllleeeetttt____ggggrrrroooo~~~~oooo 77779999333300006666 1111....333355554444111122222222 ....4444777788882222444499994444 1111 2222ffffoooodddd____ssssuuuubbbb____rrrreeee~~~~nnnn 77779999333300006666 1111777700004444....777799993333 1111000044446666....555511115555 0000 8888333311111111 ssssuuuubbbb____ssssaaaammmmpppplllleeee 77779999333300006666 1111....444499999999333344444444 ....5555000000000000000022227777 1111 2222 ssssuuuubbbb____rrrroooouuuunnnndddd 77779999333300006666 2222....555500002222444422221111 1111....111111117777888866669999 1111 4444 ssssuuuubbbb____ssssttttrrrraaaattttuuuummmm 77779999333300006666 5555....22222222555566667777 4444....333344441111333366667777 1111 33338888 ssssttttrrrraaaattttuuuummmm____nnnnuuuu~~~~rrrr 77779999333300006666 11114444....4444000011117777 11113333....11114444666666666666 1111 99999999 ddddiiiissssttttrrrriiiicccctttt 77779999333300006666 11114444....33333333444466663333 11112222....9999555511117777 1111 77770000ssssttttaaaatttteeee____rrrreeeeggggiiiioooonnnn 77779999333300006666 111188881111....2222444411113333 99993333....77770000666666666666 11111111 333355551111 sssseeeeccccttttoooorrrr 77779999333300006666 1111 0000 1111 1111 ssssaaaammmmpppplllleeee 77779999333300006666 1111 0000 1111 1111 sssscccchhhheeeedddduuuulllleeee____nnnn~~~~rrrr 77779999333300006666 111100000000 0000 111100000000 111100000000 rrrroooouuuunnnndddd 77779999333300006666 66661111 0000 66661111 66661111llllooootttt____ffffssssuuuu____nnnnuuuu~~~~rrrr 77779999333300006666 33335555111100007777....33333333 2222888866665555....666677772222 33330000000000000000 33339999999999999999cccceeeennnnttttrrrreeee____ccccoooodddd~~~~tttt 77779999333300006666 0000 0000 0000 0000 ccccoooommmmmmmmoooonnnn____iiiidddd 0000 VVVVaaaarrrriiiiaaaabbbblllleeee OOOObbbbssss MMMMeeeeaaaannnn SSSSttttdddd.... DDDDeeeevvvv.... MMMMiiiinnnn MMMMaaaaxxxx
.... ssssuuuummmmmmmm

Abhiroop Mukhopadhyay, Assistant Professor, Indian Statistical Institute (Delhi): [email protected]
• The second column lists the arithmetic means for each of the
continuous variables in the dataset.
• The third column lists the standard deviation for each of the
continuous variables in the dataset
• The fourth and fifth columns show the range of values for each
continuous variable. For example, the variable state_region has a
minimum value of 11 and a maximum value of 351.
2. Using the sum Command for a Variable/Variable List: If you type the sum
command followed by a variable or a list of variables, STATA will calculate
summary statistics for only the variables you have specified. The syntax to do
this is as follows;
sum <variable list>
Example: Meaningful Variables
summ mpce_30_days mpce_corr
Output: You will see the following output on your STATA screen;
Comments: From the above output, you can see that STATA has calculated
summary statistics for only those variables listed. We can make the following
points from the above output;
• The summary statistics have been calculated for a total of 79306
observations.
• The mean mpce_30_days is 3130.52 (thus it can't be per capita) while
the mean correct mpce is 678.11
3. Using the sum Command with the Option ‘detail’: So far we have seen how
to generate the mean, standard deviation and range for variables. Suppose
mmmmppppcccceeee____ccccoooorrrrrrrr 77779999333300006666 666677778888....1111000066663333 555511111111....7777111188884444 11117777 22229999333300006666mmmmppppcccceeee____33330000____ddddaaaayyyyssss 77779999333300006666 3333111133330000....55552222 2222333311115555....999911114444 11117777 77770000888822226666 VVVVaaaarrrriiiiaaaabbbblllleeee OOOObbbbssss MMMMeeeeaaaannnn SSSSttttdddd.... DDDDeeeevvvv.... MMMMiiiinnnn MMMMaaaaxxxx
.... ssssuuuummmmmmmm mmmmppppcccceeee____33330000____ddddaaaayyyyssss mmmmppppcccceeee____ccccoooorrrrrrrr

Abhiroop Mukhopadhyay, Assistant Professor, Indian Statistical Institute (Delhi): [email protected]
you want to generate the variance, skewness and kurtosis you can do this by
using the option ‘detail’ in conjunction with the command sum. The syntax
for this command is as follows;
sum <variable list>, detail.
Note: the placement of the comma in the above command. It is always placed
before the word detail. Secondly, within the variable list you can specify one or
more variables.
Example:
summ mpce_corr, detail
Using the sum Command with Qualifiers (‘if’ and ‘by’)
If you want to be specific while generating summary statistics, you can use
the qualifiers ‘if’ and ‘by’ along with the appropriate logical operators. To
illustrate, look at the worked examples below;
Example: What is the distribution of Monthly per capital expenditure of the
poor ( consistent with our exercise, those whose mpce <=800)
summ mpce_corr if poor==1
99999999%%%% 2222555511111111....6666 22229999333300006666 KKKKuuuurrrrttttoooossssiiiissss 333333336666....999900004444666699995555%%%% 1111444422225555 22224444333366663333 SSSSkkkkeeeewwwwnnnneeeessssssss 11110000....4444777722225555222299990000%%%% 1111111111116666 22223333666600008888....66667777 VVVVaaaarrrriiiiaaaannnncccceeee 222266661111888855555555....777777775555%%%% 777788880000....888877775555 22220000444477771111 LLLLaaaarrrrggggeeeesssstttt SSSSttttdddd.... DDDDeeeevvvv.... 555511111111....777711118888444455550000%%%% 555566661111....5555 MMMMeeeeaaaannnn 666677778888....1111000066663333
22225555%%%% 444411117777 22225555 SSSSuuuummmm ooooffff WWWWggggtttt.... 7777999933330000666611110000%%%% 333322225555....2222 22223333....8888 OOOObbbbssss 77779999333300006666 5555%%%% 222277779999....5555 22220000 1111%%%% 222200006666....4444222288886666 11117777 PPPPeeeerrrrcccceeeennnnttttiiiilllleeeessss SSSSmmmmaaaalllllllleeeesssstttt mmmmppppcccceeee____ccccoooorrrrrrrr
.... ssssuuuummmmmmmm mmmmppppcccceeee____ccccoooorrrrrrrr,,,, ddddeeeettttaaaaiiiillll

Abhiroop Mukhopadhyay, Assistant Professor, Indian Statistical Institute (Delhi): [email protected]
Command : "by"
Say I have many categories (social caste), and I want to calculate the mpce for
each social caste. This would need many "IF" statements.
Instead:
by social_group: summ mpce_corr
ERROR MESSAGE OFTEN:
Before using "by" one has to sort the data by social_group
Therefore
sort social_group
by social group: summ mpce_corr
mmmmppppcccceeee____ccccoooorrrrrrrr 66660000666611112222 444499997777....8888222244441111 111144449999....3333444488887777 11117777 888800000000 VVVVaaaarrrriiiiaaaabbbblllleeee OOOObbbbssss MMMMeeeeaaaannnn SSSSttttdddd.... DDDDeeeevvvv.... MMMMiiiinnnn MMMMaaaaxxxx
.... ssssuuuu mmmmppppcccceeee____ccccoooorrrrrrrr iiiiffff ppppoooooooorrrr========1111
nnnnooootttt ssssoooorrrrtttteeeedddd.... bbbbyyyy ssssoooocccciiiiaaaallll____ggggrrrroooouuuupppp:::: ssssuuuummmmmmmm mmmmppppcccceeee____ccccoooorrrrrrrr

Abhiroop Mukhopadhyay, Assistant Professor, Indian Statistical Institute (Delhi): [email protected]
A Short cut way is
bysort social_group: summ mpce_corr
which gives the same output as above...
Now possibilities immense...
Lets say you want to generate mean mpce for all social groups and religions
bysort social_group religion: summ mpce_corr
mmmmppppcccceeee____ccccoooorrrrrrrr 66665555 666699996666....000088889999 444455550000....3333888866669999 222222220000....2222 3333222200004444 VVVVaaaarrrriiiiaaaabbbblllleeee OOOObbbbssss MMMMeeeeaaaannnn SSSSttttdddd.... DDDDeeeevvvv.... MMMMiiiinnnn MMMMaaaaxxxx
---->>>> ssssoooocccciiiiaaaallll____ggggrrrroooouuuupppp ==== ....
mmmmppppcccceeee____ccccoooorrrrrrrr 22222222555500002222 888800008888....5555222255558888 666644447777....1111888855559999 22223333....8888 22224444333366663333 VVVVaaaarrrriiiiaaaabbbblllleeee OOOObbbbssss MMMMeeeeaaaannnn SSSSttttdddd.... DDDDeeeevvvv.... MMMMiiiinnnn MMMMaaaaxxxx
---->>>> ssssoooocccciiiiaaaallll____ggggrrrroooouuuupppp ==== ooootttthhhheeeerrrrssss
mmmmppppcccceeee____ccccoooorrrrrrrr 33330000111111116666 666655551111....777755557777 444488887777....6666999944449999 22225555 22229999333300006666 VVVVaaaarrrriiiiaaaabbbblllleeee OOOObbbbssss MMMMeeeeaaaannnn SSSSttttdddd.... DDDDeeeevvvv.... MMMMiiiinnnn MMMMaaaaxxxx
---->>>> ssssoooocccciiiiaaaallll____ggggrrrroooouuuupppp ==== ooootttthhhheeeerrrr bbbbaaaacccckkkkwwwwaaaarrrrdddd ccccllllaaaassssssss
mmmmppppcccceeee____ccccoooorrrrrrrr 11113333999922229999 555555557777....2222999944448888 333311117777....0000111122227777 11117777 6666999900007777....22225555 VVVVaaaarrrriiiiaaaabbbblllleeee OOOObbbbssss MMMMeeeeaaaannnn SSSSttttdddd.... DDDDeeeevvvv.... MMMMiiiinnnn MMMMaaaaxxxx
---->>>> ssssoooocccciiiiaaaallll____ggggrrrroooouuuupppp ==== sssscccchhhheeeedddduuuulllleeeedddd ccccaaaasssstttteeee
mmmmppppcccceeee____ccccoooorrrrrrrr 11112222666699994444 666644441111....9999000033339999 444411110000....8888888811116666 22220000 7777444455556666....666666667777 VVVVaaaarrrriiiiaaaabbbblllleeee OOOObbbbssss MMMMeeeeaaaannnn SSSSttttdddd.... DDDDeeeevvvv.... MMMMiiiinnnn MMMMaaaaxxxx
---->>>> ssssoooocccciiiiaaaallll____ggggrrrroooouuuupppp ==== sssscccchhhheeeedddduuuulllleeeedddd ttttrrrriiiibbbbeeee
.... bbbbyyyy ssssoooocccciiiiaaaallll____ggggrrrroooouuuupppp:::: ssssuuuummmmmmmm mmmmppppcccceeee____ccccoooorrrrrrrr

Abhiroop Mukhopadhyay, Assistant Professor, Indian Statistical Institute (Delhi): [email protected]
Not the entire output: Just a snapshot
Simple Tabs (One-way Tabulations)
Simple Tab Command: When the tab command is used with one categorical
variable, it reports the frequency of observations within each category as
well as their proportion (percentage) of the whole. The syntax for the simple
tab command is as follows;
tab <variable name>
Example: For example, if you want to generate a frequency distribution table
for the variable ‘social_group’ in the dataset you can type the following
command into the STATA command window and press enter;
tab social_group
Output: You will then see the following output on your STATA screen;
mmmmppppcccceeee____ccccoooorrrrrrrr 555533333333 888800003333....999922226666 444488886666....8888333311114444 111111119999 3333555555550000 VVVVaaaarrrriiiiaaaabbbblllleeee OOOObbbbssss MMMMeeeeaaaannnn SSSSttttdddd.... DDDDeeeevvvv.... MMMMiiiinnnn MMMMaaaaxxxx
---->>>> ssssoooocccciiiiaaaallll____ggggrrrroooouuuupppp ==== sssscccchhhheeeedddduuuulllleeeedddd ttttrrrriiiibbbbeeee,,,, rrrreeeelllliiiiggggiiiioooonnnn ==== BBBBuuuuddddddddhhhhiiiissssmmmm
mmmmppppcccceeee____ccccoooorrrrrrrr 11117777 777733339999....7777000066667777 333333335555....9999111100003333 333388880000....5555 1111666666669999....22225555 VVVVaaaarrrriiiiaaaabbbblllleeee OOOObbbbssss MMMMeeeeaaaannnn SSSSttttdddd.... DDDDeeeevvvv.... MMMMiiiinnnn MMMMaaaaxxxx
---->>>> ssssoooocccciiiiaaaallll____ggggrrrroooouuuupppp ==== sssscccchhhheeeedddduuuulllleeeedddd ttttrrrriiiibbbbeeee,,,, rrrreeeelllliiiiggggiiiioooonnnn ==== SSSSiiiikkkkhhhhiiiissssmmmm
mmmmppppcccceeee____ccccoooorrrrrrrr 4444222200003333 888800006666....000044448888 444444442222....3333444488882222 66662222....22228888555577771111 6666777700007777....22225555 VVVVaaaarrrriiiiaaaabbbblllleeee OOOObbbbssss MMMMeeeeaaaannnn SSSSttttdddd.... DDDDeeeevvvv.... MMMMiiiinnnn MMMMaaaaxxxx
---->>>> ssssoooocccciiiiaaaallll____ggggrrrroooouuuupppp ==== sssscccchhhheeeedddduuuulllleeeedddd ttttrrrriiiibbbbeeee,,,, rrrreeeelllliiiiggggiiiioooonnnn ==== CCCChhhhrrrriiiissssttttiiiiaaaannnniiiittttyyyy
mmmmppppcccceeee____ccccoooorrrrrrrr 111111115555 999944441111....5555222244446666 888844444444....6666777777773333 111199991111....5555 7777111155554444....555577771111 VVVVaaaarrrriiiiaaaabbbblllleeee OOOObbbbssss MMMMeeeeaaaannnn SSSSttttdddd.... DDDDeeeevvvv.... MMMMiiiinnnn MMMMaaaaxxxx
---->>>> ssssoooocccciiiiaaaallll____ggggrrrroooouuuupppp ==== sssscccchhhheeeedddduuuulllleeeedddd ttttrrrriiiibbbbeeee,,,, rrrreeeelllliiiiggggiiiioooonnnn ==== IIIIssssllllaaaammmm
mmmmppppcccceeee____ccccoooorrrrrrrr 6666888844445555 555511110000....2222555522225555 333311111111....8888444477773333 22220000 7777444455556666....666666667777 VVVVaaaarrrriiiiaaaabbbblllleeee OOOObbbbssss MMMMeeeeaaaannnn SSSSttttdddd.... DDDDeeeevvvv.... MMMMiiiinnnn MMMMaaaaxxxx
---->>>> ssssoooocccciiiiaaaallll____ggggrrrroooouuuupppp ==== sssscccchhhheeeedddduuuulllleeeedddd ttttrrrriiiibbbbeeee,,,, rrrreeeelllliiiiggggiiiioooonnnn ==== HHHHiiiinnnndddduuuuiiiissssmmmm
.... bbbbyyyyssssoooorrrrtttt ssssoooocccciiiiaaaallll____ggggrrrroooouuuupppp rrrreeeelllliiiiggggiiiioooonnnn:::: ssssuuuummmmmmmm mmmmppppcccceeee____ccccoooorrrrrrrr

Abhiroop Mukhopadhyay, Assistant Professor, Indian Statistical Institute (Delhi): [email protected]
If you want to also see missing...
tab social_group, missing
TTTToooottttaaaallll 77779999,,,,222244441111 111100000000....00000000 ooootttthhhheeeerrrrssss 22222222,,,,555500002222 22228888....44440000 111100000000....00000000ooootttthhhheeeerrrr bbbbaaaacccckkkkwwwwaaaarrrrdddd ccccllllaaaassssssss 33330000,,,,111111116666 33338888....00001111 77771111....66660000 sssscccchhhheeeedddduuuulllleeeedddd ccccaaaasssstttteeee 11113333,,,,999922229999 11117777....55558888 33333333....66660000 sssscccchhhheeeedddduuuulllleeeedddd ttttrrrriiiibbbbeeee 11112222,,,,666699994444 11116666....00002222 11116666....00002222 ssssoooocccciiiiaaaallll ggggrrrroooouuuupppp FFFFrrrreeeeqqqq.... PPPPeeeerrrrcccceeeennnntttt CCCCuuuummmm....
.... ttttaaaabbbb ssssoooocccciiiiaaaallll____ggggrrrroooouuuupppp
TTTToooottttaaaallll 77779999,,,,333300006666 111100000000....00000000 .... 66665555 0000....00008888 111100000000....00000000 ooootttthhhheeeerrrrssss 22222222,,,,555500002222 22228888....33337777 99999999....99992222ooootttthhhheeeerrrr bbbbaaaacccckkkkwwwwaaaarrrrdddd ccccllllaaaassssssss 33330000,,,,111111116666 33337777....99997777 77771111....55554444 sssscccchhhheeeedddduuuulllleeeedddd ccccaaaasssstttteeee 11113333,,,,999922229999 11117777....55556666 33333333....55557777 sssscccchhhheeeedddduuuulllleeeedddd ttttrrrriiiibbbbeeee 11112222,,,,666699994444 11116666....00001111 11116666....00001111 ssssoooocccciiiiaaaallll ggggrrrroooouuuupppp FFFFrrrreeeeqqqq.... PPPPeeeerrrrcccceeeennnntttt CCCCuuuummmm....
.... ttttaaaabbbb ssssoooocccciiiiaaaallll____ggggrrrroooouuuupppp,,,, mmmmiiiissssssssiiiinnnngggg
Abhiroop Mukhopadhyay, Assistant Professor, Indian Statistical Institute (Delhi): [email protected]
' tab can be combined with 'if' and 'by'
Example: Social Group of the poor
Example: In each religion: Social Group of the poor
Snapshot (Not complete Output)
Cross Tabs (Two-way tabulations)
1. Cross Tabs: When the tab command is used with two categorical variables
it creates a two-way frequency table or a cross-tabulation of the variables.
TTTToooottttaaaallll 66660000,,,,666611112222 111100000000....00000000 .... 55553333 0000....00009999 111100000000....00000000 ooootttthhhheeeerrrrssss 11114444,,,,777722223333 22224444....22229999 99999999....99991111ooootttthhhheeeerrrr bbbbaaaacccckkkkwwwwaaaarrrrdddd ccccllllaaaassssssss 22223333,,,,888855556666 33339999....33336666 77775555....66662222 sssscccchhhheeeedddduuuulllleeeedddd ccccaaaasssstttteeee 11112222,,,,111111116666 11119999....99999999 33336666....22226666 sssscccchhhheeeedddduuuulllleeeedddd ttttrrrriiiibbbbeeee 9999,,,,888866664444 11116666....22227777 11116666....22227777 ssssoooocccciiiiaaaallll ggggrrrroooouuuupppp FFFFrrrreeeeqqqq.... PPPPeeeerrrrcccceeeennnntttt CCCCuuuummmm....
.... ttttaaaabbbb ssssoooocccciiiiaaaallll____ggggrrrroooouuuupppp iiiiffff ppppoooooooorrrr========1111,,,, mmmmiiiissssssssiiiinnnngggg
TTTToooottttaaaallll 6666,,,,999922223333 111100000000....00000000 .... 6666 0000....00009999 111100000000....00000000 ooootttthhhheeeerrrrssss 4444,,,,444411116666 66663333....77779999 99999999....99991111ooootttthhhheeeerrrr bbbbaaaacccckkkkwwwwaaaarrrrdddd ccccllllaaaassssssss 2222,,,,333344449999 33333333....99993333 33336666....11113333 sssscccchhhheeeedddduuuulllleeeedddd ccccaaaasssstttteeee 88883333 1111....22220000 2222....22220000 sssscccchhhheeeedddduuuulllleeeedddd ttttrrrriiiibbbbeeee 66669999 1111....00000000 1111....00000000 ssssoooocccciiiiaaaallll ggggrrrroooouuuupppp FFFFrrrreeeeqqqq.... PPPPeeeerrrrcccceeeennnntttt CCCCuuuummmm....
---->>>> rrrreeeelllliiiiggggiiiioooonnnn ==== IIIIssssllllaaaammmm
TTTToooottttaaaallll 44447777,,,,777777773333 111100000000....00000000 .... 22229999 0000....00006666 111100000000....00000000 ooootttthhhheeeerrrrssss 9999,,,,666611115555 22220000....11113333 99999999....99994444ooootttthhhheeeerrrr bbbbaaaacccckkkkwwwwaaaarrrrdddd ccccllllaaaassssssss 22220000,,,,888866662222 44443333....66667777 77779999....88881111 sssscccchhhheeeedddduuuulllleeeedddd ccccaaaasssstttteeee 11111111,,,,111122222222 22223333....22228888 33336666....11114444 sssscccchhhheeeedddduuuulllleeeedddd ttttrrrriiiibbbbeeee 6666,,,,111144445555 11112222....88886666 11112222....88886666 ssssoooocccciiiiaaaallll ggggrrrroooouuuupppp FFFFrrrreeeeqqqq.... PPPPeeeerrrrcccceeeennnntttt CCCCuuuummmm....
---->>>> rrrreeeelllliiiiggggiiiioooonnnn ==== HHHHiiiinnnndddduuuuiiiissssmmmm
.... bbbbyyyyssssoooorrrrtttt rrrreeeelllliiiiggggiiiioooonnnn:::: ttttaaaabbbb ssssoooocccciiiiaaaallll____ggggrrrroooouuuupppp iiiiffff ppppoooooooorrrr========1111,,,, mmmmiiiissssssssiiiinnnngggg

Abhiroop Mukhopadhyay, Assistant Professor, Indian Statistical Institute (Delhi): [email protected]
Therefore, cross tabs are useful when examining the relationship between
the 2 variables. The syntax for the simple cross-tab command is as follows;
tab <variable name1> <variable name2>
Note: The first variable in your tab command will be displayed in the rows of
the table, and the second variable will be displayed in the columns. Changing
their order will change the interpretation of the table.
Example:
tab social_group poor
More meaningful to have proportions
tab social_group poor, row
row: This calculates row proportion. Therefore in the above table, it would
calculate the proportion of schedule tribe who are poor
TTTToooottttaaaallll 11118888,,,,666688882222 66660000,,,,555555559999 77779999,,,,222244441111 ooootttthhhheeeerrrrssss 7777,,,,777777779999 11114444,,,,777722223333 22222222,,,,555500002222 ooootttthhhheeeerrrr bbbbaaaacccckkkkwwwwaaaarrrrdddd ccccllllaaaassssssss 6666,,,,222266660000 22223333,,,,888855556666 33330000,,,,111111116666 sssscccchhhheeeedddduuuulllleeeedddd ccccaaaasssstttteeee 1111,,,,888811113333 11112222,,,,111111116666 11113333,,,,999922229999 sssscccchhhheeeedddduuuulllleeeedddd ttttrrrriiiibbbbeeee 2222,,,,888833330000 9999,,,,888866664444 11112222,,,,666699994444 ssssoooocccciiiiaaaallll ggggrrrroooouuuupppp 0000 1111 TTTToooottttaaaallll ppppoooooooorrrr
.... ttttaaaabbbb ssssoooocccciiiiaaaallll____ggggrrrroooouuuupppp ppppoooooooorrrr

Abhiroop Mukhopadhyay, Assistant Professor, Indian Statistical Institute (Delhi): [email protected]
Another cut: How much of the poor and non poor are in each social category
tab social_group poor,col
col: calculates the column percentage
• You can do row and col together
• You can combine cross tabs with "bysort"
• You can combine cross tabs with "If"
22223333....55558888 77776666....44442222 111100000000....00000000 TTTToooottttaaaallll 11118888,,,,666688882222 66660000,,,,555555559999 77779999,,,,222244441111 33334444....55557777 66665555....44443333 111100000000....00000000 ooootttthhhheeeerrrrssss 7777,,,,777777779999 11114444,,,,777722223333 22222222,,,,555500002222 22220000....77779999 77779999....22221111 111100000000....00000000 ooootttthhhheeeerrrr bbbbaaaacccckkkkwwwwaaaarrrrdddd ccccllllaaaassssssss 6666,,,,222266660000 22223333,,,,888855556666 33330000,,,,111111116666 11113333....00002222 88886666....99998888 111100000000....00000000 sssscccchhhheeeedddduuuulllleeeedddd ccccaaaasssstttteeee 1111,,,,888811113333 11112222,,,,111111116666 11113333,,,,999922229999 22222222....22229999 77777777....77771111 111100000000....00000000 sssscccchhhheeeedddduuuulllleeeedddd ttttrrrriiiibbbbeeee 2222,,,,888833330000 9999,,,,888866664444 11112222,,,,666699994444 ssssoooocccciiiiaaaallll ggggrrrroooouuuupppp 0000 1111 TTTToooottttaaaallll ppppoooooooorrrr
111100000000....00000000 111100000000....00000000 111100000000....00000000 TTTToooottttaaaallll 11118888,,,,666688882222 66660000,,,,555555559999 77779999,,,,222244441111 44441111....66664444 22224444....33331111 22228888....44440000 ooootttthhhheeeerrrrssss 7777,,,,777777779999 11114444,,,,777722223333 22222222,,,,555500002222 33333333....55551111 33339999....33339999 33338888....00001111 ooootttthhhheeeerrrr bbbbaaaacccckkkkwwwwaaaarrrrdddd ccccllllaaaassssssss 6666,,,,222266660000 22223333,,,,888855556666 33330000,,,,111111116666 9999....77770000 22220000....00001111 11117777....55558888 sssscccchhhheeeedddduuuulllleeeedddd ccccaaaasssstttteeee 1111,,,,888811113333 11112222,,,,111111116666 11113333,,,,999922229999 11115555....11115555 11116666....22229999 11116666....00002222 sssscccchhhheeeedddduuuulllleeeedddd ttttrrrriiiibbbbeeee 2222,,,,888833330000 9999,,,,888866664444 11112222,,,,666699994444 ssssoooocccciiiiaaaallll ggggrrrroooouuuupppp 0000 1111 TTTToooottttaaaallll ppppoooooooorrrr
.... ttttaaaabbbb ssssoooocccciiiiaaaallll____ggggrrrroooouuuupppp ppppoooooooorrrr,,,, ccccoooollll nnnnooookkkkeeeeyyyy

Abhiroop Mukhopadhyay, Assistant Professor, Indian Statistical Institute (Delhi): [email protected]
• The additional option nofreq suppresses the frequency numbers and
reports percentages depending on row and col option
Multipliers
If you are interested in Standard Errors (not reported usually in NSS tables):
then you have to declare the data set as a survey data set and specify strata
and second stage strata (ADVANCED MATERIAL: look at svyset command. After
declaring the data set with the appropriate strata, the same commands as
above go through and standard errors are adjusted for stratification
automatically)
If you are interested in Means and Proportions. you can look at the multipliers
as pure frequency weights.
STATA does not like non integer frequency weights. So first step is a rounding
off
gen freq=round(weight)
These are household multipliers. For Individual multipliers, one has to
mutliply by household size.
Thereafter the same commands as above go through except syntax
becomes
summ <variable name> [fw=freq]
tab < variable name> [fw=freq]
All If, bysort cross tab commands still work

Abhiroop Mukhopadhyay, Assistant Professor, Indian Statistical Institute (Delhi): [email protected]
Merging Files
To merge two files, call the bigger file "master", and the smaller "user". We
need to merge the two files by a common identifier. Let that be called
common_id (unique household id or individual id).
Steps
1. Open the "user.dta" file and sort by common_id and resave it
2. Open the "master.dta" file and sort it by common_id
then
merge common_id using user.dta
A variable _merge is automatically created
It takes the value 1 if the common_id is in the "master.dta" file but not in the
"user.dta" file. It takes the value 2 if the _id is in the "user.dta" file but not in
the "master.dta" file. It takes the value 3 if its in both files.
Merging can take place on basis of two variables also...
If common_id is the unique household number and personal serial number
(person_srl_no) is unique within the household (1,2,3 ...) then both together
define the unique person identification number
In that case merging at the individual level can be on basis of
merge common_id person_srl_no using user.dta
Excel Portability of Output on Results Window
Every table can be copied and pasted directly from the result window onto
excel. Copy as Table option retains the formatting. There are also special free
programs for generating even nicer formatted tables.

Abhiroop Mukhopadhyay, Assistant Professor, Indian Statistical Institute (Delhi): [email protected]
ASSIGNMENT
Three files are given to you.
level02.dta: Contains household characteristics
level04.dta: Contains Household roster level information: age and gender of
members of the household
level05.dta: Contains Individual principal status information
Exercise 1: By dropping or keeping, I want three data sets that keep the
following variables:
level02.dta : hh_id, rel, social_grp, land_own, nregs_job_card
level04.dta : p_id hh_id weight sector state_region district sub_round sex age
level05.dta: prin_act hh_id p_id weight state state_str
After dropping variables, they should be saved as level02new.dta.
level04new.dta and level05.dta
Exercise 2: Describe the variables in these data set
Exercise 3: Merge the three data sets, two at a time.
1. First merge level04new and level05 new on the basis of p_id (if you
want, you can save it and call it level45.dta)
2. Then merge this file with level02new on the basis of hh_id
Exercise 4:
A person is defined as in the labour force if the principal activity numbers are
between 11 and 81. Based on this, calculate the labour force participation rate
for
1. All India all persons/ All India men and All India women
2. Rural persons/ Rural men and Rural Women
3. Urban persons/Urban men and Urban Women


![[IG] Installation Guide - Data Analysis and Statistical … Stata for Windows Upgrade or update? If you are using an earlier Stata release and you are upgrading to Stata 15, or if](https://img.pdfslide.us/doc/110x75/5ae3443f7f8b9ad47c8e061d/ig-installation-guide-data-analysis-and-statistical-stata-for-windows-upgrade.jpg)


![[MI] Multiple Imputation - Duke Universitypublic.econ.duke.edu/stata/Stata-13-Documentation/mi.pdf · 2013-06-12 · Multiple imputation (MI) is a flexible, simulation-based statistical](https://img.pdfslide.us/doc/110x75/5eb947f7f1f4b4048d5334ef/mi-multiple-imputation-duke-2013-06-12-multiple-imputation-mi-is-a-iexible.jpg)