Embed Size (px)
Citation preview

Stat 512 – Lecture 11
Type I/Type II Errors
Open Applets page
Review

Reminders
Project Report Comments If not sure what someone intended, see them
and/or me Remember to keep all of these reports and the
peer feedback forms HW 5
Solutions on line Emailed work was emailed back Grades have been updated on BB

Last Time – Precautions with Inference What do we really mean when we say we are
“95% confident”?
If we did have thousands of samples…
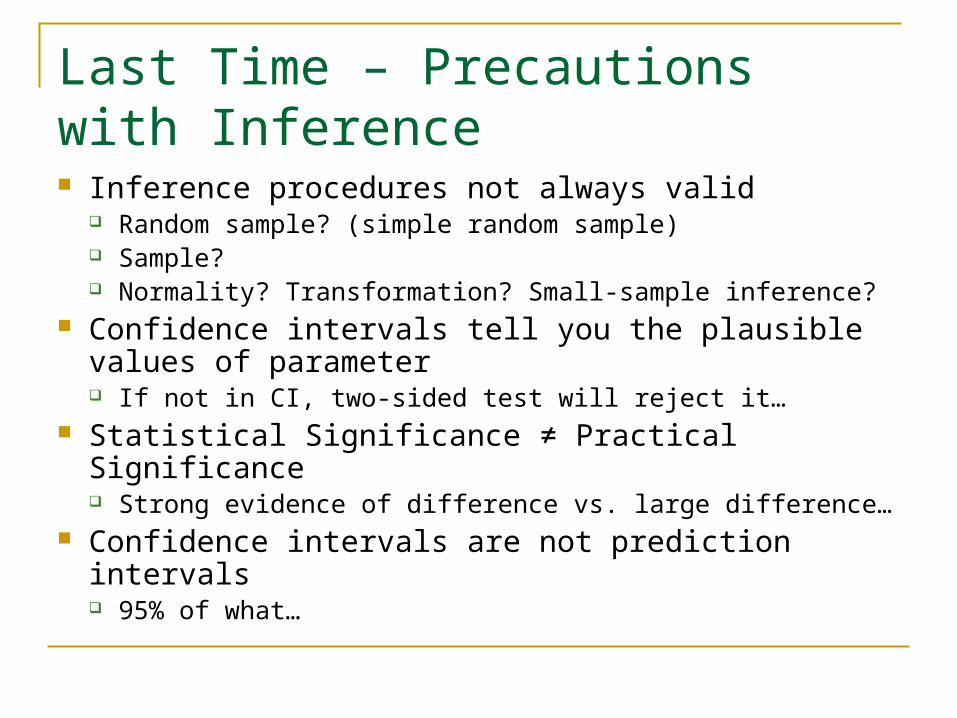
Last Time – Precautions with Inference Inference procedures not always valid
Random sample? (simple random sample) Sample? Normality? Transformation? Small-sample inference?
Confidence intervals tell you the plausible values of parameter If not in CI, two-sided test will reject it…
Statistical Significance ≠ Practical Significance Strong evidence of difference vs. large difference…
Confidence intervals are not prediction intervals 95% of what…

Example 5: Type I and Type II Errors0. Let = current probability of getting a hit Manager
1. H0: = .250 (he hasn’t improved)
Ha: > .250 (he has improved)
Assume H0 is true until convinces manager otherwise.
How well does a .250 hitter need to do in 20 at-bats to convince the manager it didn’t just happen “by chance”?

Example 5: Type I and Type II Errors Number of hits in 20 at-bats by a .250 hitter
Number of successful at-bats
Expect about 5 hits on average
Ranges from 0 to 12 hits
In order for “chance” to not be the easy explanation, would like about 9 hits…
A .250 hitter getting 9 or more hits by chance happens less than 5% of the time…

Example 5: Type I and Type II Errors So manager will be impressed if gets 9 or
more hits in 20 at-bats How often does the .333 hitter do so?
Number of successful at-bats
Not so often!
Pretty likely will that the .333 hitter won’t convince the manager in one set of 20 at-bats
Type II Error = player has improved (null is false) but we fail to detect it (incorrectly fail to reject null hypothesis)

Example 5: Type I and Type II Errors How can we improve the .333 hitter’s
chances? Raise the level of significance?
If we only require him to get 8 or more hits to convince us, is a higher chance we will be convinced!
Downsides?
Easier for a .250 hitter to fool usType I Error = rejecting the null hypothesis when it’s true

Example 5: Type I and Type II Errors Type I and Type II Errors are inversely
related, if we lower the probability of making one type of error, we increase the probabiltiy of making the other BUT, P(Type I Error) ≠ 1- P(Type II Error)

Other options for the player?
More at-bats
Improve more

Midterm Format
Be on time 50 min in classroom, 50 minutes in lab
Alonso-Grover lab/210 Imyim-Yee 213/lab
Bring calculators, erasers, and be ready to use the computers
See review sheets, review problems, review Q and A, and student suggested problems on line
Official OH: W 11-12 (studio), Th 1-2

Midterm Format
Open class notes Don’t expect to have a lot of time to look through
them! Do have access to formulas
Questions similar in format to HW questions Can often answer later parts even if not earlier
parts Show details of calculations

Study Advice
Work problems Start with ideas that we have emphasized
more often

Advice During Exam
If you get stuck on a problem, move on later parts, later problems
Try to hit the highlights in your answer (e.g., not all sources of bias, just the most serious) Be succinct (think before you write)
Read the question carefully Show all of your work, explain well
communication points
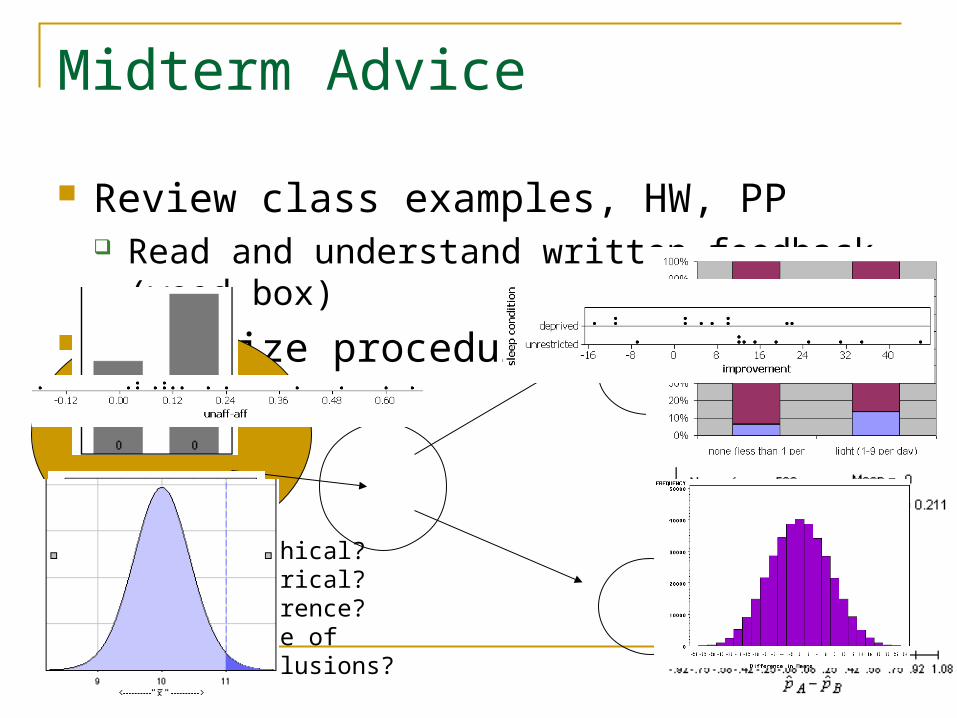
Midterm Advice
Review class examples, HW, PP Read and understand written feedback (wood box)
Summarize procedures, technical conditions
Graphical?Numerical?Inference?Scope of conclusions?
Graphical?Numerical?Inference?Scope of conclusions?

Technical Conditions
z procedures-proportions n>10, n(1->10
If hypothesizing a value for , use it
Otherwise use sample proportion
Simple random sample
t procedures – means n > 30 or normal
population (look at sample) Graph the data
Simple random sample
Tests of significance and confidence intervals

Midterm Advice
3 Distributions
population sampleSampling distribution

Midterm Advice
3 Distributions
population sampleSampling distribution
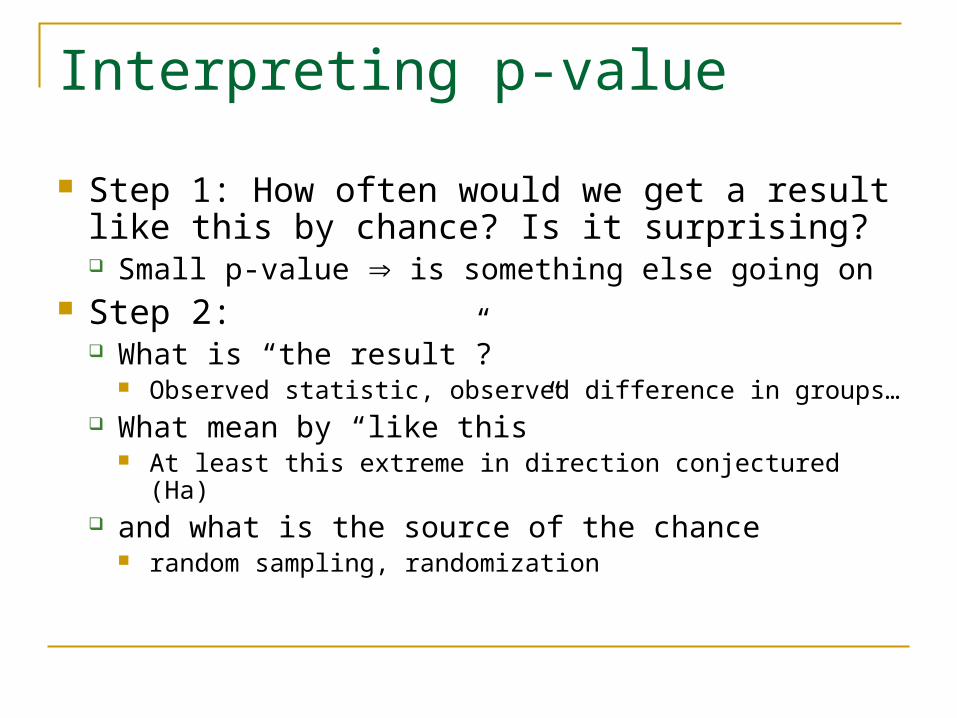
Interpreting p-value
Step 1: How often would we get a result like this by chance? Is it surprising? Small p-value is something else going on
Step 2: What is “the result”?
Observed statistic, observed difference in groups… What mean by “like this”
At least this extreme in direction conjectured (Ha) and what is the source of the chance
random sampling, randomization

HW Comments – HW 4, #3
Population = all adults nationwide Sampling frame = list of phone numbers Sample = respondents Numerical and
graphical summaries Qualitative variable
Inference Is it possible that =.5 but we would observe =
.68 just by chance? Is it probable?
p̂

HW Comments – HW 4, #6
Swain v. Alabama
1. Graphical and numerical summariesOne qualitative variable: sample proportion, bar
graph, 16.9% of sample (called jurors) were black
2. Inference0. parameter, = probability of a called juror being
black (know proportion of eligible jurors that are black, but trying to asses the process by which potential jurors are called to serve)

HW Comments – HW 4, #6
1. Large sample size and assuming above sample is representative of overall process
2. H0: = .26 (blacks are called for jurors at the same rate at which they exist in population)
Ha: < .26 (suspect process is under representing blacks in the population)

HW Comments – HW 4, #6
Assume null hypothesis is true
Proportion of jurors called that are black

HW Comments – HW 5, #1
Variable = whether child took candy or toy Whether children are more likely to take toy
Include the 5 (6) steps for every test of significance Ho/Ha symbols and words TC, output Checking technical conditions, n large, n > 30
Link decision to magnitude of p-value I’m considering this p-value large or I’m considering this p-
value small Finish with a conclusion in “English”
HW Comments – HW 5, #2
OU = each pair (two values, but really just one observation, n = 15)
Experiment? Did they impose the explanatory variable? Random sample?
Confounding variable Related to both EV and RV (e.g., males more likely to be
schizophrenic and more likely to have larger volumes, so when large volume is related to schizophrenia, maybe it’s just more prominent among males)

HW Comments – HW 5, #2
Describe sample Sample skewed to the right, sample
mean/median, sample standard deviation/IQR The behavior of the observed differences…
The center of these differences is around .11 cm3 (median = .11, mean = .20), with standard deviation .2383 cm3 and IQR .3600 cm3.

HW Comments – HW 5, #2
Inference Population = all such pairs of twins Parameter, =mean difference in volume for all
such twin pairs H0: =0 (no difference on average)
Not saying all volumes are equal for all twins Technical conditions?
Large sample size? Normal population of differences? Random sample?

HW Comments – HW 5, #3
Parameter! SE formulas assume simple random sample More complicated sampling methods have
different SE formulas Can still apply: estimate + z(SE) If .25 is not in 99% CI, then if test H0: =.25,
know will reject H0 at the 1% level Two-sided p-value < .01 If .25 is not in the 95% CI, then p-value < .05

HW Comments – HW 5, #4
Needed enough information to confirm it was a rounding discrepancy
Remember to always round up

HW Comments – HW 5, #5
(a) The sample
So what predict about populationShould have similar shape, center, and spread
Can we do better than mean around 90?
x = 90 ($9,000)s = 20.67 ($2,067)Skewed to the right

HW Comments – HW 5, #5
Inference I’m 95% confident that the mean of the population
is between 82.28 and 97.72

BB Questions
Observational study vs. Experiment vs. Randomized Experiment
t vs. z Minitab vs. applets “standard error” Sampling methods