Embed Size (px)
Citation preview

STAT 35000 Exam Jam Solutions
Contents
1 First Day 2Question 1: PDFs, CDFs, and Finding E(X), V (X) . . . . . . . . . . . . . . . . . . . . . . . . . . 2Question 2: Bayesian Inference . . . . . . . . . . . . . . . . . . . . . . . . . . . . . . . . . . . . . . 3Question 3: Binomial to Normal Approximation . . . . . . . . . . . . . . . . . . . . . . . . . . . . 4Question 4: Sampling Distributions . . . . . . . . . . . . . . . . . . . . . . . . . . . . . . . . . . . . 5Question 5: Confidence Intervals . . . . . . . . . . . . . . . . . . . . . . . . . . . . . . . . . . . . . 6Question 6: One Sample Hypothesis Testing, Power . . . . . . . . . . . . . . . . . . . . . . . . . . 7Question 7: Two Sample Hypothesis Testing . . . . . . . . . . . . . . . . . . . . . . . . . . . . . . 9Question 8: Paired Sample Hypothesis Testing . . . . . . . . . . . . . . . . . . . . . . . . . . . . . 10Question 9: One Sample Proportion Hypothesis Testing, Power . . . . . . . . . . . . . . . . . . . . 11Question 10: Simple Linear Regression . . . . . . . . . . . . . . . . . . . . . . . . . . . . . . . . . . 13
2 Day 2 14Question 1: Unions, Intersections, and Bayes Theorem . . . . . . . . . . . . . . . . . . . . . . . . . 14Question 2: Normal Distribution . . . . . . . . . . . . . . . . . . . . . . . . . . . . . . . . . . . . . 15Question 3: Binomial to Normal Approximation . . . . . . . . . . . . . . . . . . . . . . . . . . . . 16Question 4: Confidence Intervals . . . . . . . . . . . . . . . . . . . . . . . . . . . . . . . . . . . . . 17Question 5: One Sample Hypothesis Testing . . . . . . . . . . . . . . . . . . . . . . . . . . . . . . . 18Question 6: One Sample Hypothesis Testing, Power . . . . . . . . . . . . . . . . . . . . . . . . . . 19Question 7: Two Sample Proportion Hypothesis Testing . . . . . . . . . . . . . . . . . . . . . . . . 21Question 8: Simple Linear Regression . . . . . . . . . . . . . . . . . . . . . . . . . . . . . . . . . . 22Question 9: Anova . . . . . . . . . . . . . . . . . . . . . . . . . . . . . . . . . . . . . . . . . . . . . 23
1
Mathematical Sciences Department @ IUPUI STAT 35000 Exam Jam
1 First Day
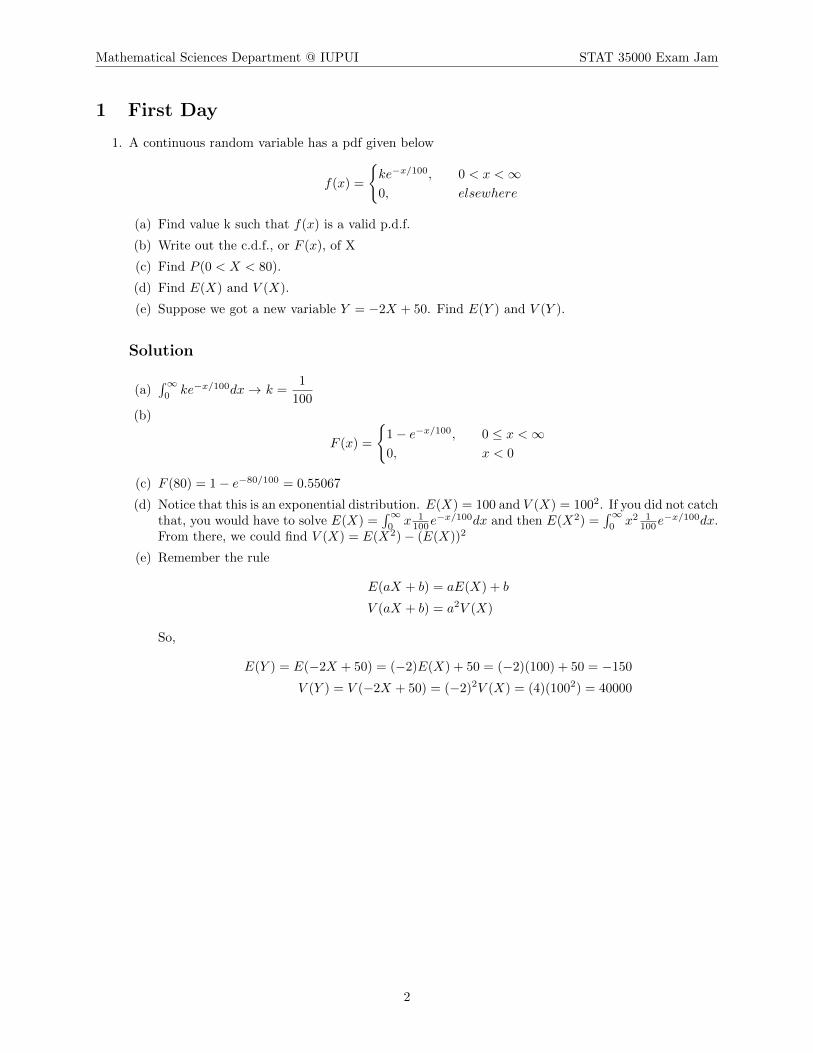
1. A continuous random variable has a pdf given below
f(x) =
{ke−x/100, 0 < x <∞0, elsewhere
(a) Find value k such that f(x) is a valid p.d.f.
(b) Write out the c.d.f., or F (x), of X
(c) Find P (0 < X < 80).
(d) Find E(X) and V (X).
(e) Suppose we got a new variable Y = −2X + 50. Find E(Y ) and V (Y ).
Solution
(a)∫∞0ke−x/100dx→ k =
1
100
(b)
F (x) =
{1− e−x/100, 0 ≤ x <∞0, x < 0
(c) F (80) = 1− e−80/100 = 0.55067
(d) Notice that this is an exponential distribution. E(X) = 100 and V (X) = 1002. If you did not catchthat, you would have to solve E(X) =
∫∞0x 1100e
−x/100dx and then E(X2) =∫∞0x2 1
100e−x/100dx.
From there, we could find V (X) = E(X2)− (E(X))2
(e) Remember the rule
E(aX + b) = aE(X) + b
V (aX + b) = a2V (X)
So,
E(Y ) = E(−2X + 50) = (−2)E(X) + 50 = (−2)(100) + 50 = −150
V (Y ) = V (−2X + 50) = (−2)2V (X) = (4)(1002) = 40000
2

Mathematical Sciences Department @ IUPUI STAT 35000 Exam Jam
2. Suppose that there are two drawers that contain different number of marbles. The first drawer contains5 white marbles and 5 blue marbles. The second drawer contains 9 white marbles and 3 blue marbles.Mike, randomly opens one of the drawers, but he is twice as likely to open the second drawer opposedto the first drawer. Then, without looking, he randomly picks up one marble. Mike does not treateither drawer any different nor the marble.
(a) Create a tree diagram with the corresponding probabilities (The tree should have two layers).
(b) Suppose that we had a following hypothesis,
H0 : Marble was picked from the 1st drawer
Ha : Marble was picked from the 2nd drawer
What is the probability for each hypothesis to happen?
(c) Given that Mike opened the 2nd drawer, what is the probability that the marble is white?
(d) Now, lets say that the marble happens to be blue. What is the updated belief for the twohypothesis? In other words, what is the probability for each hypothesis to happen now? (UseBayes rule)
Solution
(a) Solution is displayed below,
Adrawer ischosen
atrandom
2ndDrawer
White34
Blue142
3
1stDrawer
White12
Blue12
13
(b) There is 13 chance for Null hypothesis and 1
3 chance for Alternative hypothesis to happen.
(c) P (W |2nd) = P (W ∩ 2nd
2nd) =
( 23 )( 3
4 )
( 23 )
= 0.75
(d) P (H0|B) =( 13 )( 1
2 )
( 13 )( 1
2 ) + ( 23 )( 1
4 )= 0.5
P (H1|B) =( 23 )( 1
4 )
( 13 )( 1
2 ) + ( 23 )( 1
4 )= 0.5
3

Mathematical Sciences Department @ IUPUI STAT 35000 Exam Jam
3. Chris loves eating snickers candy. He rolls a fair six sided die and if the die lands on 5, he eats thecandy. Let X denote the amount of snicker bars that Chris eats from a bag of 50.
(a) Name the exact distribution of X and its parameters.
(b) Find P (X ≥ 4).
(c) Name the approximate distribution for X and its parameters. Explain why approximation is valid.
(d) Find the approximate probability that Chris eats 10 or less snickers from the bag of 50, P (X ≤ 10).
Solution
(a) Let X denote the number of candy that Chris eats from the bag of 50. Then X ∼ Binomial(p =16 , n = 50)
(b) P (X ≥ 4) = 1− P (X ≤ 3) = 1− P (X = 0)− P (X = 1)− P (X = 2)− P (X = 3) = .976Using a calculator: 1− binomcdf(50, 16 , 3).
(c) X can be approximated with a normal distribution because n is large (np > 15 and n(1−p) > 15).X ∼ Normal(np = 8.333, npq = 6.944)
(d) Because we are using Binomial to Normal Approximation, we will use 0.5 continuity correction,
thus our answer will be P (X ≤ 9.5) = P (Z ≤ 9.5− 8.333√6.944
) = P (Z ≤ .4427) = 0.671
Using a calculator: normalcdf(−910, 9.5, 8.333,√
(6.944))
4

Mathematical Sciences Department @ IUPUI STAT 35000 Exam Jam
4. Suppose X has the following distribution
x 0 1 3p(x) .1 .5 .4
Suppose we take a random sample of n=2.
(a) Calculate P (X2 = 2).
(b) Find the distribution of X2
(c) Find E[X] and V [X] for n = 2.
Solution
(a) It is useful to create a table first for all of the possible averages.
x 0 1 30 0 .5 1.51 .5 1 23 1.5 2 3
So, P (X = 2) = (.5)(.4) + (.5)(.4) = 0.2 + 0.2 = 0.4
(b) Distribution function is shown below
x 0 .5 1 1.5 2 3p(x) .01 .1 .25 .08 .4 .16
(c) E[X] = E[X] = 1.7
V [X] =V [X]
n=E[X2]− (E[X])2
n=
1.21
2= 0.605
5
Mathematical Sciences Department @ IUPUI STAT 35000 Exam Jam
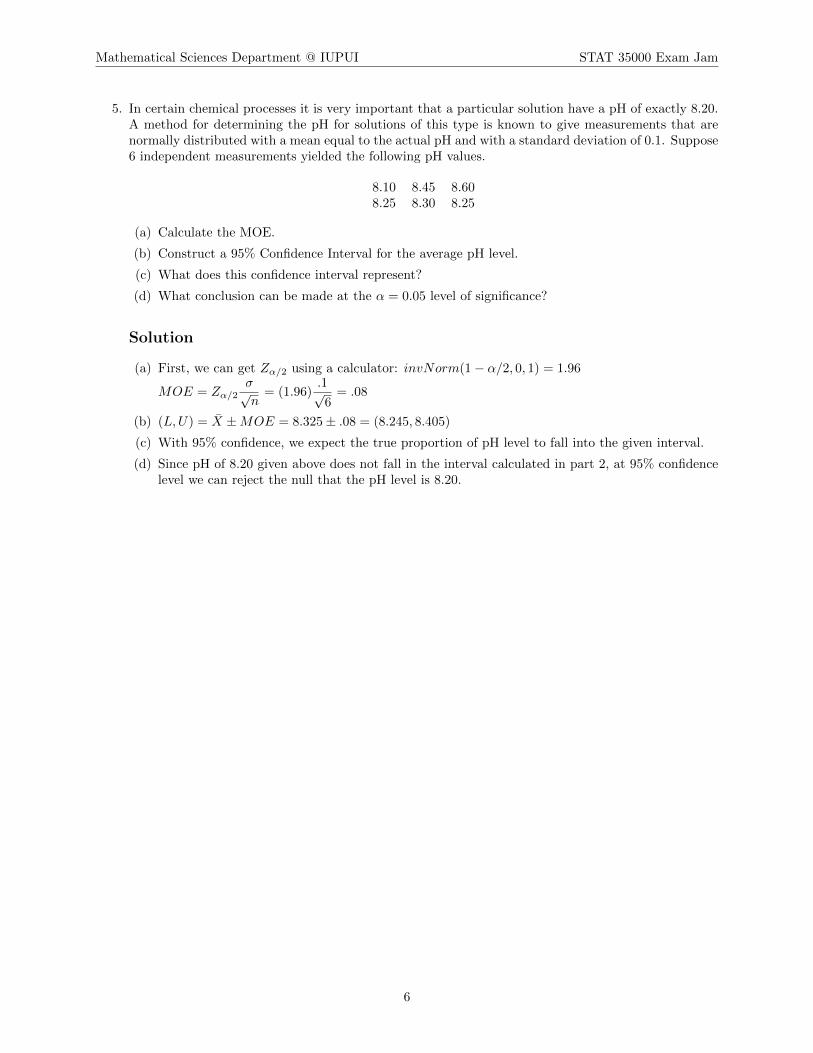
5. In certain chemical processes it is very important that a particular solution have a pH of exactly 8.20.A method for determining the pH for solutions of this type is known to give measurements that arenormally distributed with a mean equal to the actual pH and with a standard deviation of 0.1. Suppose6 independent measurements yielded the following pH values.
8.10 8.45 8.608.25 8.30 8.25
(a) Calculate the MOE.
(b) Construct a 95% Confidence Interval for the average pH level.
(c) What does this confidence interval represent?
(d) What conclusion can be made at the α = 0.05 level of significance?
Solution
(a) First, we can get Zα/2 using a calculator: invNorm(1− α/2, 0, 1) = 1.96
MOE = Zα/2σ√n
= (1.96).1√
6= .08
(b) (L,U) = X ±MOE = 8.325± .08 = (8.245, 8.405)
(c) With 95% confidence, we expect the true proportion of pH level to fall into the given interval.
(d) Since pH of 8.20 given above does not fall in the interval calculated in part 2, at 95% confidencelevel we can reject the null that the pH level is 8.20.
6

Mathematical Sciences Department @ IUPUI STAT 35000 Exam Jam
6. It is advertised that certain machinery on average lasts 12.7 years. Paul wants to test and see whetherthe average life of the machinery is actually less than 12.7 years. He tests 20 machines and finds thatthe sample mean was 11.8. Assume the lifetime of the machinery is normally distributed with standarddeviation of 1.5.
(a) State the null and alternative hypothesis
(b) Name the parameters and describe what they represent.
(c) What method would you use?
i. 1-sample T
ii. 1-sample Z
iii. 2-sample T
iv. 2-sample Z
(d) Calculate the p-value.
(e) Assuming α = .01, state the conclusion and interpret the results in the context of the problem.
(f) Suppose that the true average time a machine lasts is actually 12. For the test above, what is thepower to successfully detect the alternative?
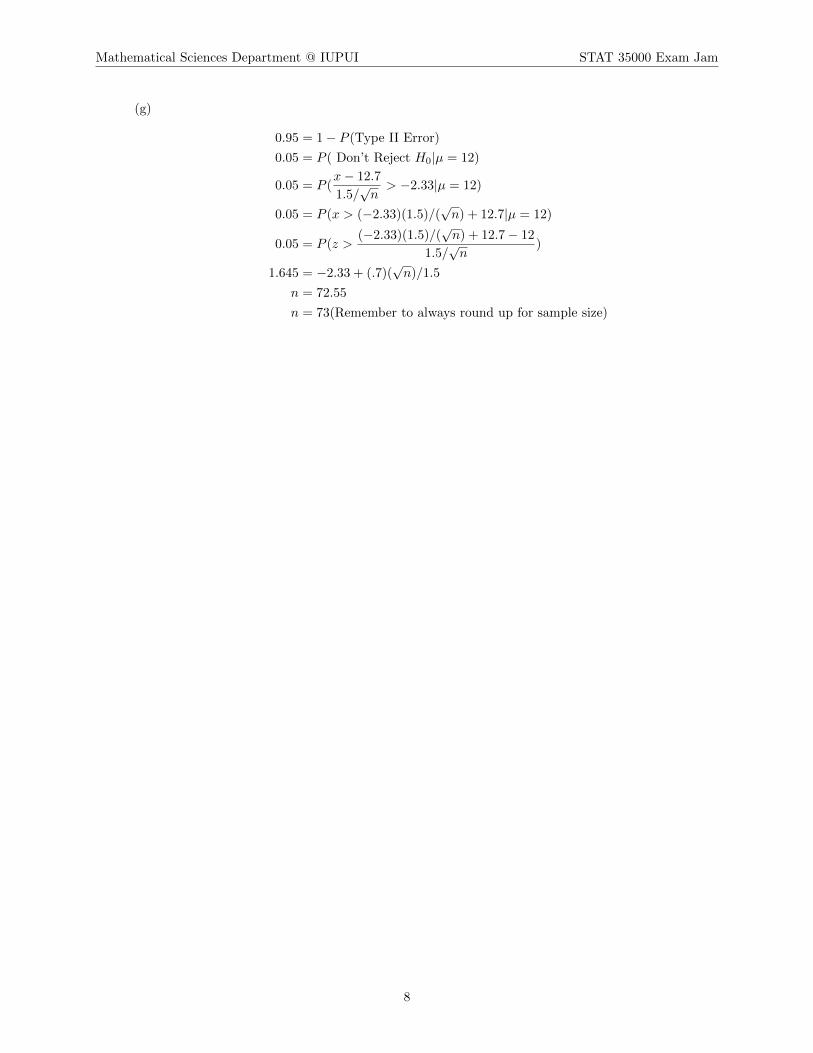
(g) If we want the above power to be 95%, at least how many machines you need to have in yoursample?
Solution
(a) H0 : µ = 12.7Ha : µ < 12.7
(b) µ = average life a certain machinery will last
(c) 1-sample Z because we are told it is normally distributed with σ = 1.5
(d) First, we need to calculate t-stat. z =X − µσ/√n
=11.8− 12.7
1.5/√
20= −2.68. We are looking for
P (z < −2.68) = .0037Using Calculator: normalcdf(−910, 11, 8, 12.7, 1.5√
20)
(e) Because p − val < α, we have sufficient evidence to reject the null hypothesis and state that onaverage, the machinery lasts less than 12.7 years.
(f)
Power = 1− P (Type II Error)
= 1− P ( Don’t Reject H0|µ = 12)
= 1− P (x− 12.7
1.5/√
20> −2.33|µ = 12)
= 1− P (x > 11.92|µ = 12)
= P (x ≤ 11.92|µ = 12)
= Using Calculator: normalcdf(−910, 11.92, 12, 1.5/√
20)
Power = 0.4057
7
Mathematical Sciences Department @ IUPUI STAT 35000 Exam Jam
(g)
0.95 = 1− P (Type II Error)
0.05 = P ( Don’t Reject H0|µ = 12)
0.05 = P (x− 12.7
1.5/√n> −2.33|µ = 12)
0.05 = P (x > (−2.33)(1.5)/(√n) + 12.7|µ = 12)
0.05 = P (z >(−2.33)(1.5)/(
√n) + 12.7− 12
1.5/√n
)
1.645 = −2.33 + (.7)(√n)/1.5
n = 72.55
n = 73(Remember to always round up for sample size)
8

Mathematical Sciences Department @ IUPUI STAT 35000 Exam Jam
7. Mrs. McBroom teaches two different independent classes. Class A has 25 students and Class B has16 students. Both classes took the same standardize exam. Class A average was 80 with standarddeviation of 10 and Class B average was 85 with standard deviation of 7. Mrs. McBroom wants toknow if there is significant difference between the scores in two of her classes (use α = .05).
(a) State the null and alternative hypothesis
(b) What method would you use?
i. 1-sample T
ii. 1-sample Z
iii. 2-sample T
iv. 2-sample Z
(c) Find the test statistic and
(d) Find the rejection region.
(e) Using the rejection region, state the conclusion and interpret the results in the context of theproblem.
Solution
(a) H0 : µA = µBHa : µA 6= µB
(b) 2-sample T test because n1, n2 < 30 and σ is not given.
(c) t =(XA − XB)− (µA − µB)
Sp
√1nA
+ 1nB
=(80− 85)− 0
8.966√
125 + 1
16
= −1.742
Where,
Sp =
√s21(n1 − 1) + s22(n2 − 1)
n1 + n2 − 2=
√(102)(25− 1) + (72)(16− 1)
25 + 16− 2= 8.966
Using Calculator: 2 − SampTTest(x1 = 80, s1 = 10, n1 = 25, x2 = 85, s2 = 7, n2 = 16, µ1 6=µ2, Pooled = Y es)→ −1.742
(d) Rejection region is |t| > tα/2,df or |t| > 2.021 (If you use a table, it will not be an exact t value)Using Calculator: invT (1− 0.025, 39) = 2.023
(e) Since |−1.742| < 2.021 we fail to reject the null hypothesis. We conclude that there is not enoughevidence at α = 0.05 to say that the average score in the two classes is different.
9

Mathematical Sciences Department @ IUPUI STAT 35000 Exam Jam
8. A group of students wanted to see whether their new filter invention could filtrate Zinc out of thedrinking water. Five pairs of data were taken recording the zinc concentration in water before andafter the filtration. The data is shown below.
Zinc % Mean S.D.Before 10 12 9.5 16 13.5 12.2 2.66After 5 8 6 8.5 9.5 7.4 1.85
After-Before -5 -4 -3.5 -7.5 -4 -4.8 1.6
Is there any difference in Zinc Concentration Before and After the filtration?
(a) State the Null and Alternative Hypothesis.
(b) What do the parameter(s) represent?
(c) What method would you use?
i. 1-sample T
ii. 1-sample Z
iii. 2-sample T
iv. 2-sample Z
(d) Calculate test statistic.
(e) State your conclusion and interpret the results in the context for the researcher using α = 0.01
Solution
(a) H0 : µd = 0Ha : µd 6= 0
(b) µd = the average difference before and after the filtration
(c) 1-Sample T test because it is a paired test with n < 30 and σ unknown.
(d) t =x− µds/√n
=−4.8− 0
1.6/√
5= −6.708
Using Calculator: T − Test(µ0 = 0, x = −4.8, s = 1.6, n = 5, µ 6= µ0)→ −6.708
(e) We found that |t| = 6.708 and the critical value with α = 0.01 is tα/2 = 4.604 (Using Calculator:invT (1− .005, 4) = 4.604). Since 6.708 > 4.604, we can reject the null hypothesis and state thatthe filter does work and it eliminates zinc from water at 99% confidence.
10

Mathematical Sciences Department @ IUPUI STAT 35000 Exam Jam
9. The CEO of a large company says that about 60 percent of its 10000 customers are satisfied with theirservices. To test this claim, a local news reporter tests 100 customers. From that sample, 64 said theywere satisfied with the service. Assume α = 0.02.
(a) State the Null and Alternative Hypothesis
(b) Calculate test statistic.
(c) State the conclusion of your test.
(d) Suppose that we later found out that the true percent satisfaction rate was actually 55%. Findthe power of the test.
(e) If we wanted to have a power of 95%, what is the minimal sample size we would need?
Solution
(a)
H0 : p0 = 0.60
Ha : p0 6= 0.60
(b) Our sample proportion is p =64
100. Then we can calculate our test statistic
z =p− p0√
p0(1− p0)/n=
.64− .60√(.6)(.4)/100
= 0.82
Using Calculator: 1− PropZTest(p0 = 0.6, x = 64, n = 100, prop 6= p0)→ 0.816
(c) For a two sided test, assuming α = 0.02, our critical value is zcv = 2.33 (Using Calculator:invNorm(1 − .01, 0, 1) = 2.33). Because our test statistic (0.82) is less than our critical value(2.33), we have insufficient evidence to reject the null hypothesis and state that the true satisfac-tion rate is no different from 0.60.
(d)
Power = 1− P ( Type II Error )
= 1− P ( Don’t Reject H0|p = .55)
= 1− P (−2.33 <p− p0√
(p0)(1− p0)/n< 2.33|p = 0.55)
= 1− P (−2.33 <p− 0.60√
(0.60)(0.40)/100< 2.33|p = 0.55)
= 1− P ((−2.33)√
(0.60)(0.40)/100 + 0.60 < p < (2.33)√
(0.60)(0.40)/100 + 0.60|p = 0.55)
= 1− P (0.486 < p < 0.714|p = 0.55)
= Using Calculator: normalcdf(0.486, 0.714, 0.55,
√(0.55)(0.45)
100) = 0.90
= 1− 0.90
Power = 0.10
11

Mathematical Sciences Department @ IUPUI STAT 35000 Exam Jam
(e)
Power = 1− P ( Type II Error )
0.95 = 1− P ( Don’t Reject H0|p = .55)
0.05 = P (−2.33 <p− p0√
(p0)(1− p0)/n< 2.33|p = 0.55)
0.05 = P (−2.33 <p− 0.60√
(0.60)(0.40)/n< 2.33|p = 0.55)
0.05 = P ((−2.33)√
(0.60)(0.40)/n+ 0.60 < p < (2.33)√
(0.60)(0.40)/n+ 0.60|p = 0.55)
0.05 = P ((−2.33)
√(0.60)(0.40)/n+ 0.60− 0.55√
(0.55)(0.45)/n< z <
(2.33)√
(0.60)(0.40)/n+ 0.60− 0.55√(0.55)(0.45)/n
)
0.05 = P (−2.29 + (0.10)√n < z < 2.29 + (0.10)
√n)
0.05 = P (z < 2.29 + (0.10)√n)
−1.645 = 2.29 + (0.10)√n
n = 1548.4
n = 1549
12
Mathematical Sciences Department @ IUPUI STAT 35000 Exam Jam
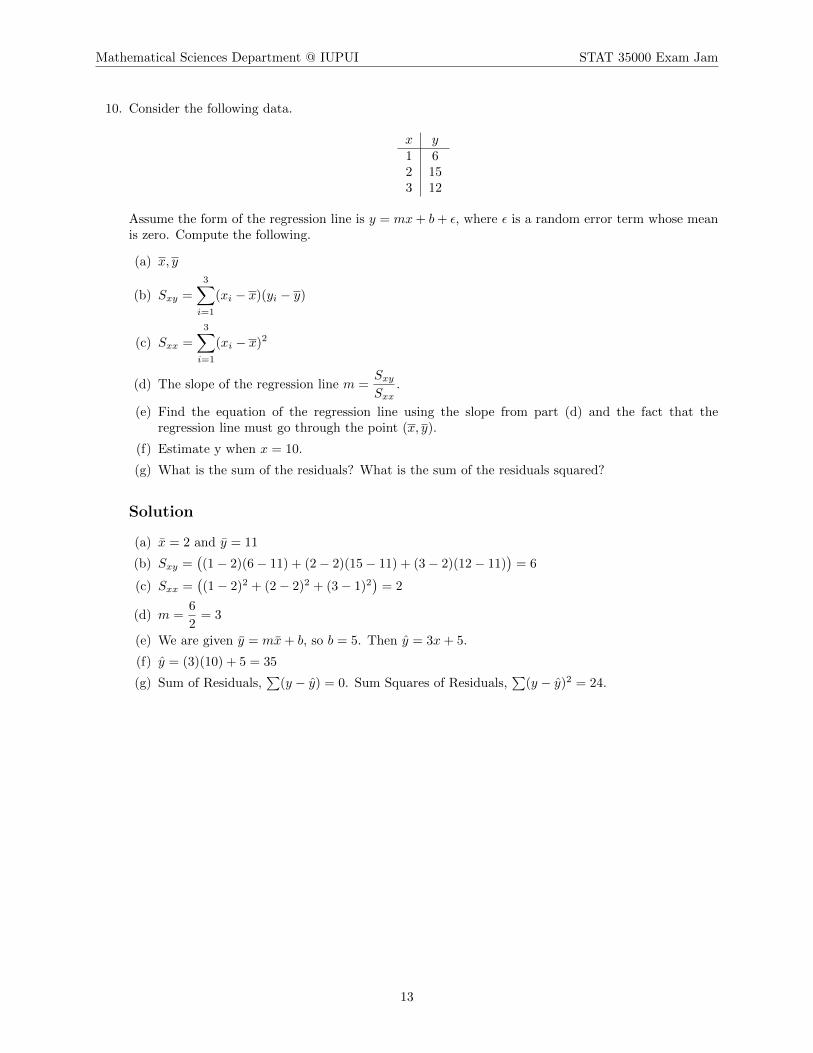
10. Consider the following data.
x y1 62 153 12
Assume the form of the regression line is y = mx+ b+ ε, where ε is a random error term whose meanis zero. Compute the following.
(a) x, y
(b) Sxy =
3∑i=1
(xi − x)(yi − y)
(c) Sxx =
3∑i=1
(xi − x)2
(d) The slope of the regression line m =SxySxx
.
(e) Find the equation of the regression line using the slope from part (d) and the fact that theregression line must go through the point (x, y).
(f) Estimate y when x = 10.
(g) What is the sum of the residuals? What is the sum of the residuals squared?
Solution
(a) x = 2 and y = 11
(b) Sxy =((1− 2)(6− 11) + (2− 2)(15− 11) + (3− 2)(12− 11)
)= 6
(c) Sxx =((1− 2)2 + (2− 2)2 + (3− 1)2
)= 2
(d) m =6
2= 3
(e) We are given y = mx+ b, so b = 5. Then y = 3x+ 5.
(f) y = (3)(10) + 5 = 35
(g) Sum of Residuals,∑
(y − y) = 0. Sum Squares of Residuals,∑
(y − y)2 = 24.
13

Mathematical Sciences Department @ IUPUI STAT 35000 Exam Jam
2 Day 2
1. Suppose that there is 35% that the wife but not the husband will win the raffle ticket. The chancethat both of them will win is 20%. The chance that both of them lose is 40%. Let H=husband winsthe raffle ticket and W=wife wins the raffle ticket.
(a) Calculate the probability that wife OR husband wins the raffle, P (H ∪W ).
(b) Calculate the probability that the husband wins the raffle, P (H).
(c) What is the probability that the wife wins given that the husband wins, P (W |H)?
(d) What is the probability that the husband loses given that the wife has won, P (Hc|W )?
Solution
(a) P (W c ∩Hc) = 1− P (W ∪H), so P (W ∪H) = 1− .4 = .6
(b) P (W ∪H) = P (H) + P (W )− P (H ∩W ), so P (H) = .6− .35 = .25
(c) P (W |H) =P (W ∩H)
P (H)=
.2
.25= .8
(d) P (Hc|W ) =P (Hc ∩W )
P (W )=.35
.55= .64
14
Mathematical Sciences Department @ IUPUI STAT 35000 Exam Jam
2. Suppose that amount of snow accumulation in Jasper is normally distributed. Suppose we take arandom sample of 25 independent measurements and find the mean to be 32.5 and standard deviation9. Let X represent the snow accumulation.
(a) What is the probability that the amount of snow will be between 28.5 and 36.5?
(b) Find the 20th percentile for X.
(c) In order to have margin of error of 2 and be 95% confident, what is the smallest sample size wewould need to have?
Solution
(a) P (28.5 < X < 36.5) = P (−2.22 < Z < 2.22) = .9736Using Calculator: normalcdf(28.5, 36.5, 32.5, 95 )
(b) P (Z ≤ X − 32.5
9/5) = .2→ .84 =
X − 32.5
9/5→ X = 30.99
Using Calculator: invNorm(0.2, 32, 95 )
(c) n =
((Zα/2)(s)
MOE
)2
=
((1.96)(9)
2
)2
= 77.79, so n = 78.
15

Mathematical Sciences Department @ IUPUI STAT 35000 Exam Jam
3. A certain machine produces bottle caps for Coca-Cola. The machine produces 3% defectives. Total of20,000 bottle caps are produced. Let X be the number of defective bottle caps out of 20,000.
(a) What is the name of the exact distribution? (Specify the parameter values)
(b) What is the name of the approximate distribution? (Specify the parameter values) What are theconditions that allow us to use this approximation? (Name the Theorem as well)
(c) Find approximate probability that more than 550 bottle caps are defective.
Solution
(a) X ∼ Binomial(p = .03, n = 20, 000)
(b) X ∼ Normal(600, 582). Since n is large, by Central Limit Theorem we can approximate usingNormal Distribution
(c) Because we are approximating a discrete distribution with a continuous one, we have to use 0.5
continuity correction, so P (X ≥ 550.5) = P (Z ≥ 550.5− 600√582
) = P (Z ≥ −2.05) = P (Z <
2.05)) = .0.9809Using Calculator: normalcdf(550.5, 910, 600,
√582)
16

Mathematical Sciences Department @ IUPUI STAT 35000 Exam Jam
4. A standardized test is given annually to all sixth grade students in the state of Washington. Todetermine the average score of students in a particular district, a school supervisor selects a randomsample of 100 students. The sample mean of these students’ scores is 320 and the sample standarddeviation is 16.
(a) Give a 99% confidence interval estimate of the average score of students in that supervisor’sdistrict.
(b) Interpret the confidence interval found above in words.
(c) Suppose that the district claimed that the average student score was 322. Should we believe thedistrict at 95% confidence level?
(d) If we wanted to have MOE = 5, what is the smallest sample size we should have in order to be90% confident?
Solution
(a) (L,U) = X ± Zα/2s√n
= 320± (2.576)16√100
= 320± 4.12→ (315.88, 324.12)
(b) With 99% confidence, we can say that the true population mean will fall in the interval foundabove.
(c) (L,U) = X±Zα/2s√n
= 320± (1.96)16√100
= 320±3.14→ (316.86, 323.14). Since 322 falls in the
interval found at 95% level, we do not have sufficient evidence to reject the claim. It is plausiblethat the average student score was 322.
(d) n =
((Zα/2)(s)
MOE
)2
=
((1.645)(16)
5
)2
= 27.71 = 28
17

Mathematical Sciences Department @ IUPUI STAT 35000 Exam Jam
5. A car is advertised as having a gas mileage rating of at least 30 mpg for highway driving. If themiles per gallon obtained in five independent experiments are {28, 30, 33, 25, 29}, is the advertisementcorrect?
(a) State the Null and Alternative Hypothesis.
(b) What method would you use?
i. 1-sample T
ii. 1-sample Z
iii. 2-sample T
iv. 2-sample Z
(c) Calculate the test statistic.
(d) Find the Rejection Region using α = 0.05.
(e) Should you believe the advertisement? Explain.
(f) What assumptions are you making?
Solution
(a) H0 : µ = 30Ha : µ < 30
(b) 1-sample T because n < 30 and σ is unknown.
(c) t =X − µs/√
5=
29− 30
2.92/√
5= −.767
Using Calculator: T − Test(µ0 = 30, x = 29, s = 2.92, n = 5, µ < µ0)
(d) RR : (t ≤ tα/2,df ) = (t ≤ −2.132)Using Calculator: invT (0.05, 4) = −2.132
(e) Do not Reject the null because −.767 � −2.132
(f) We assume that the dataset is normally distributed and data sample is random.
18

Mathematical Sciences Department @ IUPUI STAT 35000 Exam Jam
6. Suppose we want to show that children have a different cholesterol level than the national average. Itis known that the mean cholesterol level of Americans is 180 and α = .10. We test 5 children and findthe sample mean to be 200. We also know that the population standard deviation is 20.
(a) State the Null and Alternative Hypothesis.
(b) State the parameters.
(c) What method would you use?
i. 1-sample T
ii. 1-sample Z
iii. 2-sample T
iv. 2-sample Z
(d) Find the p-value
(e) Do we reject or accept the null? Interpret your results.
(f) Suppose that instead of 5 children, we tested 49 children and mean and standard deviationremained the same. Would we reject or accept the null? Interpret your results.
(g) Given that the true value is 190, what sample size we would need to have to have a power of thetest of 90%?
Solution
(a) H0 : µ = 180Ha : µ 6= 180
(b) µ represents the average cholesteral level of children
(c) 1-sample Z test since σ is known
(d) Z =X − µσ/√
5=
200− 180
20/√
5= 2.24, from there we can look up our p− value = .0125 (For one sided
test). Because it is a two sided test (6=), the value should be double, so p− value = .0250.Using Calculator: Z − Test(µ0 = 180, x = 200, s = 20, n = 5, µ 6= µ0)→ p = 0.0253
(e) Since p − value < α, we can reject the null at α = .10 and state that children in fact do have adifferent cholesterol level than national average.
(f) Yes, you would still reject the null since your Z value would be even higher than at n = 5.
19

Mathematical Sciences Department @ IUPUI STAT 35000 Exam Jam
(g)
Power = 1− P ( Type II Error )
0.90 = 1− P ( Don’t Reject H0|µ = 190)
0.10 = P (−1.645 <X − 180
20/√n
< 1.645|µ = 190)
0.10 = P ((−1.645)(20)√
n+ 180 < X <
(1.645)(20)√n
+ 180|µ = 190)
0.10 = P ((−1.645)(20)/
√n+ 180− 190
20/√n
< Z <(1.645)(20)/
√n+ 180− 190
20/√n
)
0.10 = P (Z >(−1.645)(20)/
√n+ 180− 190
20/√n
)
0.10 = P (Z > −1.645 +−10
20/√n
)
0.90 = P (Z ≤ −1.645 +−10
20/√n
)
1.28 = −1.645− 10
20/√n
n = 34.22
n = 35
20

Mathematical Sciences Department @ IUPUI STAT 35000 Exam Jam
7. A famous reporter, Ian, wanted to figure out whether the students at IUPUI were more republicanthan at IU. From his two independent surveys, he found out that 60 students out of a 100 at IUPUIand 65 out of 120 at IU supported the Republican party. Assume α = .05.
(a) State the Null and Alternative Hypothesis.
(b) What do the parameter(s) represent?
(c) What method would you use?
i. 1-sample T
ii. 1-sample Z
iii. 2-sample T
iv. 2-sample Z
(d) Calculate the test statistic.
(e) State your conclusion and interpret the results in the context of the problem.
Solution
(a) H0 : p1 = p2Ha : p1 > p2
(b) p1 = proportion of students at IUPUI that support republican partyp2 = proportion of students at IU that support republican party
(c) 2-sample Z proportion test since n is large
(d) Our sample proportions are p1 = 60100 and p2 = 65
120 . From the hypothesis, we conclude thatp1 − p2 = 0, and then we can calculate our z statistic.
Z =(p1 − p2)− (p1 − p2)√
p1q1n1
+ p2q2n2
=.6− .54√
.0024 + .00207= .87
Using Calculator: 2− PropZTest(x1 = 60, n1 = 100, x2 = 65, n2 = 120, p1 > p2)→ 0.87
(e) We can find critical value for α = .05 which is 1.645 (Using Calculator: invNorm(1−0.05, 0, 1) =1.645).Since .87 � 1.645, we do not have sufficient evidence to reject the null hypothesis at 95% thatthere are more supporters at IUPUI than IU.
21

Mathematical Sciences Department @ IUPUI STAT 35000 Exam Jam
8. A researcher of the MAC wants to know whether visiting the MAC affects the grade the student receivesin a class. He records the number of visits (x) and the score received in a class (y) on 30 randomlyselected students. Summary statistics for the data are as follows: x = 8.5, sx = 4, y = 86.5, sy =12, n = 30.
(a) In view of the question the researcher wants to answer, what is the independent variable, and theresponse variable?
(b) Suppose that correlation between number of visits and exam score is r = 0.95. Find the leastsquares regression equation.
(c) What is predicted score in a class if a student visits the MAC 5 times?
(d) Is the model overestimating or underestimating for the student who visited the MAC 5 times andhas a score of 94%?
(e) Interpret the meaning of slope and the intercept.
(f) Find the 95% confidence interval for the slope of the regression line. Does the 95% confidenceinterval support the claim that β > 3?
Solution
(a) Independent = number of visits. Dependent = Score received in class
(b) β1 = rsysx
= (0.95)12
4= 2.85. Now, lets use the fact that the line has to go through the point
(x, y) so, y = β1x+ β0. From this, we calculate β0 = 62.275. Lastly, y = 2.85x+ 62.275.
(c) y = (2.85)(5) + 62.275 = 76.53
(d) Since y = 76.52% and y = 94%, the model is underestimating.
(e) Slope means that for every one visit in the MAC, the score of the student will increase by 2.85.Intercept tells us that the student who does not visit the MAC will receive a score of 62.275 onaverage.
(f) β1 ± tα/2se(β1) = β1 ± tα/2β1r
√1− r2
n− 2= β1 ±
s√Sxx
= 2.85 ± .347 → (2.487, 3.213). Since the
interval does cover some of the values for β > 3, we do not have sufficient evidence to reject thenull. So, we can’t be certain that β > 3 at 95% confidence level.
22

Mathematical Sciences Department @ IUPUI STAT 35000 Exam Jam
9. Suppose we have four different patient groups that we treat each with different medicine. Each of thegroups has 7 people. The doctors want to know whether there is significant difference in the averagerecovery time between all of the groups, so they run an Anova test. The output is shown below withsome missing entries.
Source df SS MS F p-valueRegression 3 56310 18770 ? ≈ 0Residual ? ? ?
Total 27 75998
Answer the following questions.
(a) What are the residual degrees of freedom?
(b) What is the number of observations, N?
(c) Find SSE.
(d) Find the standard deviation of the regression, σ.
(e) Calculate the F statistic and explain what it means (Include appropriate Hypothesis).
(f) Find R2.
Solution
Source df SS MS F p-value
Regression k − 1 SSR MSR = SSRk−1 F = MSR
MSE Fcdf()
Residual k(n− 1) SSE MSE = SSEk(n−1)
Total kn− 1 SST = SSR+ SSE
(a) df = 24
(b) n = 28
(c) SSE = SST − SSR = 75998− 56310 = 19688
(d) σ =√MSE =
√19688
24= 28.64
(e) F =MSR
MSE=
56310
820.33= 22.88. The hypothesis for an F-statistic is the following
H0 : µ1 = µ2 = µ3 = µ4
Ha : µ1 6= µ2 6= µ3 6= µ4
From the table we can see that the p-value is very small, thus, we would reject the null hypothesisfor any reasonable α level. So, there is significant difference in the mean recovery times betweenthe fours groups.
(f) R2 =SSR
SST=
56310
75998= 0.74.
23