Embed Size (px)
Citation preview
3 September 2019
Startups: job growth engine in the NetherlandsThe Dutch tech ecosystem and its impact on employment
Data powered & crunched by Dealroom.co
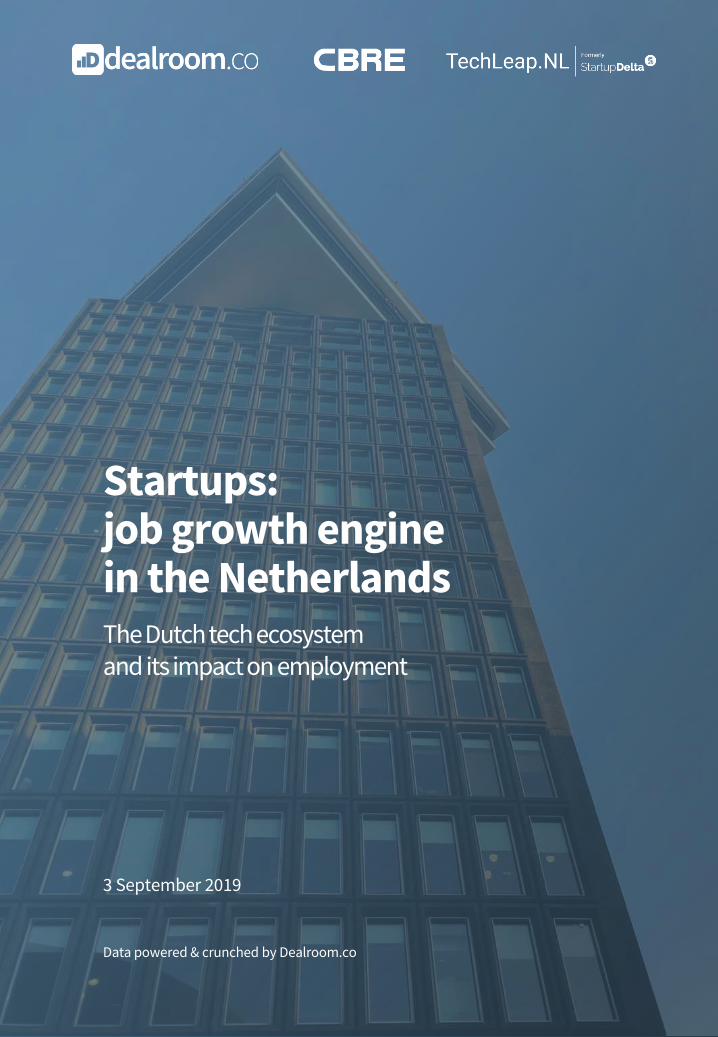
The Dutch startup ecosystem ...
Data powered & crunched by Dealroom.co
Preface
Page / 2
4,311home-grown tech companies
Vast spectrum of startups from early stage startups to established tech companies like Adyen and
Takeaway.com
€ 44 bnstartup value created since 2013
Current, realized and potential future Dutch Unicorns have created a combined value of €44B
108ktotal jobs at tech companies
These 4,311 home-grown tech companies have created 108,000 jobs in the Netherlands alone
+ 19.7knew jobs added in two years
From Dec 2017 to Dec 2018, number of jobs added, representing 11% annual growth
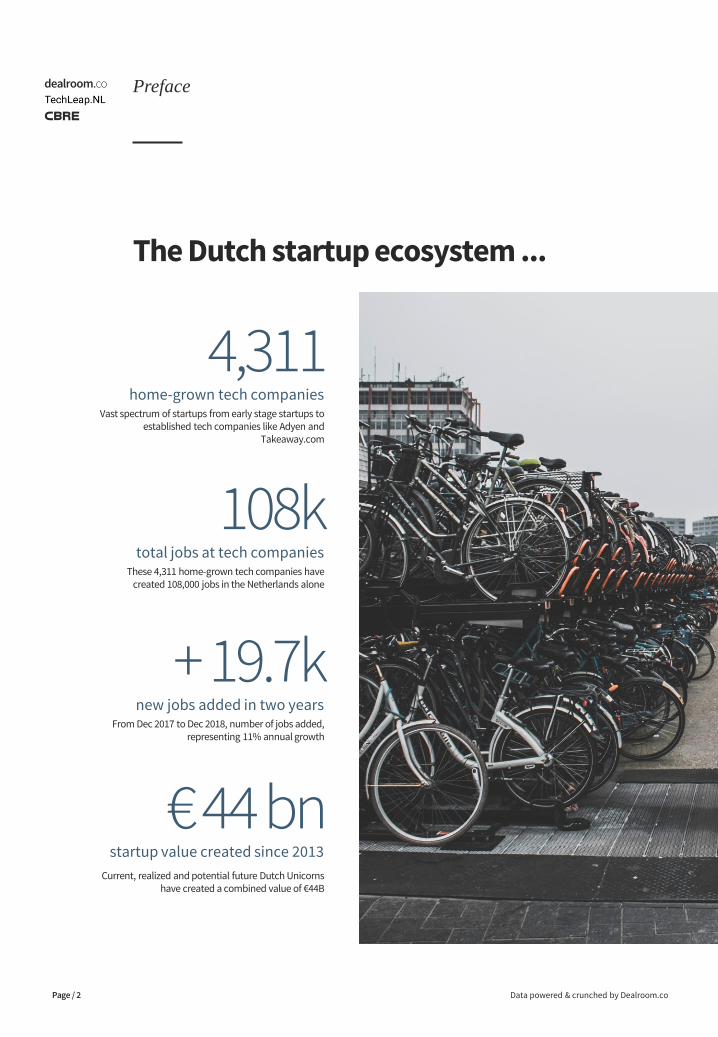
… by the numbers.
Data powered & crunched by Dealroom.co
Preface
66%Dutch startup jobs outside of AmsterdamWhile Amsterdam is the Dutch startup capital, two-thirds of all startup jobs are outside Amsterdam: one-third in the next 8 cities, one-third in dozen other cities
19%Startups backed by venture capitalVenture backed startups scale 3x faster. It takes 15 years for a startup to reach 40 employees, while this takes only 5 years for a startup with €1 million in funding or more.
58%jobs created by younger startupsStartups younger than 10 years, which on average employ “only” 14 people
43%of startups based in non-office buildingsData analysis by CBRE shows that a large number of startups reside in non-office buildings, such as residential buildings, educational use or communal venues
Page / 3
What you need to know.
Data powered & crunched by Dealroom.co
Preface
Page / 4
Startups are the leading job growth engine in the Netherlands, growing faster than any individual sector.
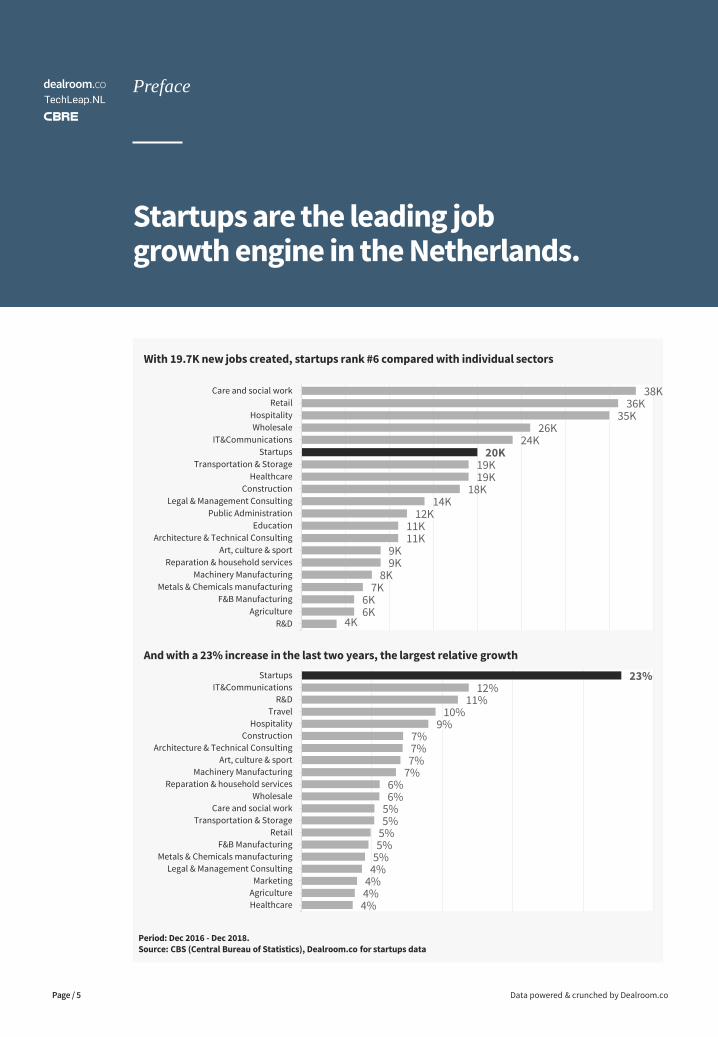
• This number of Dutch startup jobs grew by 19,700 to 108,000 Dutch jobs in the last two years. Theseare jobs in the Netherlands at startups founded in the Netherlands
• This equates to 23% growth in two years. For perspective, this is about twice as fast as job growth inthe IT sector, R&D, and retail (sectoral data from the Central Bureau of Statistics)
• Of the 4,311 startups only 19% are venture capital backed. These venture capital backed startupsgrow their teams 3x faster
While $1 billion+ startups determine investment returns, jobs are evenly spread across large, medium and small startups.
• Since 2013, Dutch startups have created €44 billion in value. The Netherlands ranks #4 in Europe (bycomparison, 7th economy and 9th population in Europe)
• This created value is highly concentrated around a small number of companies, led by Adyen (~€20bn). It’s a distinctive feature of the global startup scene, where a small number of highly successfulstartups determine almost all the investment returns (also known as Power-Law)
• Importantly however, jobs are more evenly distributed across large and small companies, youngerand older startups. The largest employer (Booking.com) only contributes about 5% of total jobs.Adyen only 0.5%! Apparently, the Power-Law applies less to the jobs market
• More than half of all 19,700 new jobs come from companies younger than 10 years. Companies agedbetween 5 and 10 years create the most jobs
Startups are a stable job growth engine; a strong argument for broad-based stimulus of the Dutch startup-climate.
• While startups are (justifiably) seen as risky, in aggregate they provide stable job growth. In fact,81% of the 4,311 companies that have been researched saw an increase in the number of jobs. Only15% saw a decline in their number of jobs
• Large startup successes (such as unicorns) are needed to attract venture capital. After Booking.comand TomTom in 2008, another 10 startups unicorns were created in the Netherlands: an average ofone per year. The big investment returns are concentrated around a handful of companies, makingthe landscape still fragile. By comparison, the UK creates one unicorn per month
• Today, 55% of the 4,311 startups have only 10 employees or less. How many of this futuregeneration will succeed depends partly on the startup-climate: availability of talent, education,experience, and capital. Investing in the future of the Dutch startup-sector should be done at scaleto ensure that the Netherlands can continue to play at the forefront
Startups are the leading job growth engine in the Netherlands.
Period: Dec 2016 - Dec 2018.Source: CBS (Central Bureau of Statistics), Dealroom.co for startups data
Data powered & crunched by Dealroom.co
Preface
Page / 5
And with a 23% increase in the last two years, the largest relative growth
With 19.7K new jobs created, startups rank #6 compared with individual sectors
38K36K
35K26K
24K20K
19K19K
18K14K
12K11K11K
9K9K
8K7K
6K6K
4K
Care and social work
Retail
Hospitality
Wholesale
IT&Communications
Startups
Transportation & Storage
Healthcare
Construction
Legal & Management Consulting
Public Administration
Education
Architecture & Technical Consulting
Art, culture & sport
Reparation & household services
Machinery Manufacturing
Metals & Chemicals manufacturing
F&B Manufacturing
Agriculture
R&D
23%12%
11%10%
9%7%7%7%
7%6%6%
5%5%
5%5%
5%4%
4%4%4%
Startups
IT&Communications
R&D
Travel
Hospitality
Construction
Architecture & Technical Consulting
Art, culture & sport
Machinery Manufacturing
Reparation & household services
Wholesale
Care and social work
Transportation & Storage
Retail
F&B Manufacturing
Metals & Chemicals manufacturing
Legal & Management Consulting
Marketing
Agriculture
Healthcare
Data powered & crunched by Dealroom.coPage / 6
Gligor Micajkov
Ivan Draganov
Lotf Belych
Nils Beers
Director
George Fisher-Wilson
Marketing & Comms
Joep van Vliet
Daan van der Velden
Yoram Wijngaarde
Dennis Huisman
Data Lead
Rutger Huizenga
Communication Lead
IN PARTNERSHIP WITH
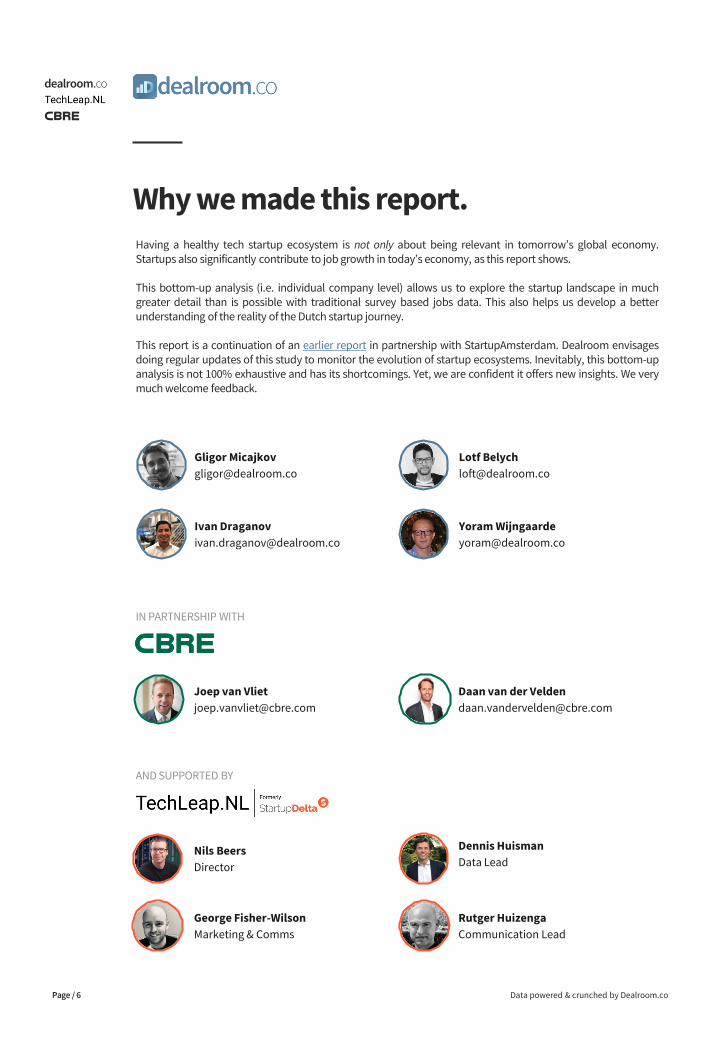
Having a healthy tech startup ecosystem is not only about being relevant in tomorrow’s global economy.Startups also significantly contribute to job growth in today’s economy, as this report shows.
This bottom-up analysis (i.e. individual company level) allows us to explore the startup landscape in muchgreater detail than is possible with traditional survey based jobs data. This also helps us develop a betterunderstanding of the reality of the Dutch startup journey.
This report is a continuation of an earlier report in partnership with StartupAmsterdam. Dealroom envisagesdoing regular updates of this study to monitor the evolution of startup ecosystems. Inevitably, this bottom-upanalysis is not 100% exhaustive and has its shortcomings. Yet, we are confident it offers new insights. We verymuch welcome feedback.
Why we made this report.
AND SUPPORTED BY
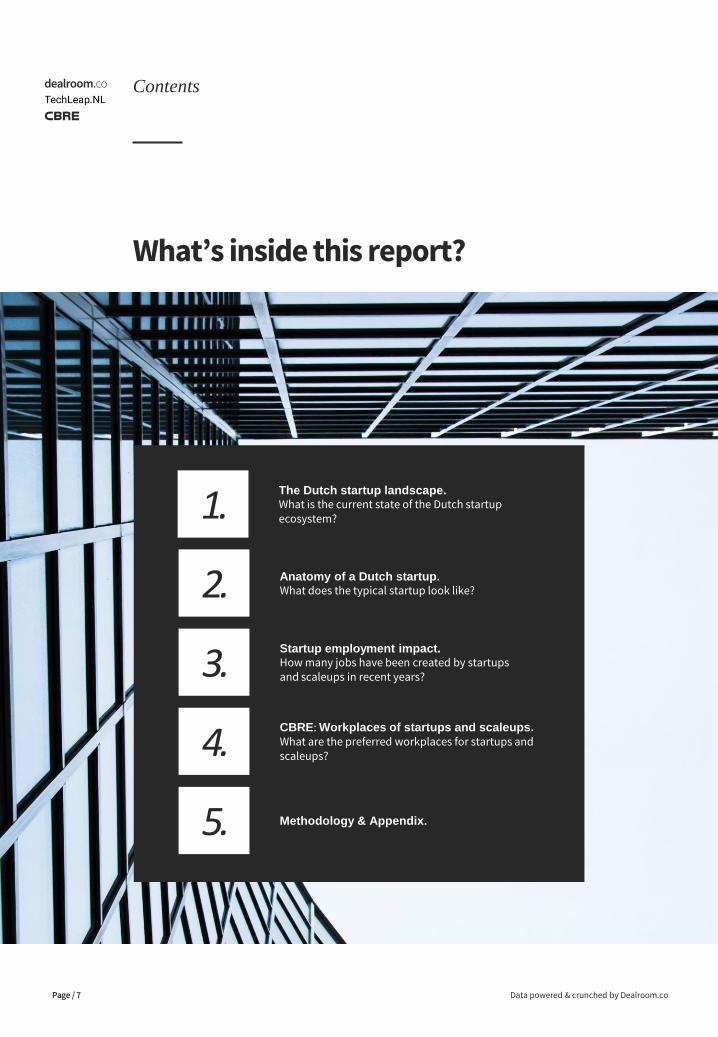
What’s inside this report?
Data powered & crunched by Dealroom.co
Contents
Page / 7
2. Anatomy of a Dutch startup.What does the typical startup look like?
3.Startup employment impact.How many jobs have been created by startups and scaleups in recent years?
4.CBRE: Workplaces of startups and scaleups.
What are the preferred workplaces for startups and scaleups?
5. Methodology & Appendix.
1.The Dutch startup landscape.What is the current state of the Dutch startup ecosystem?
The Dutch startup landscape.Setting the scene: Dutch startup landscape and its performance on the European stage.
Data powered & crunched by Dealroom.co
1.
Page / 8
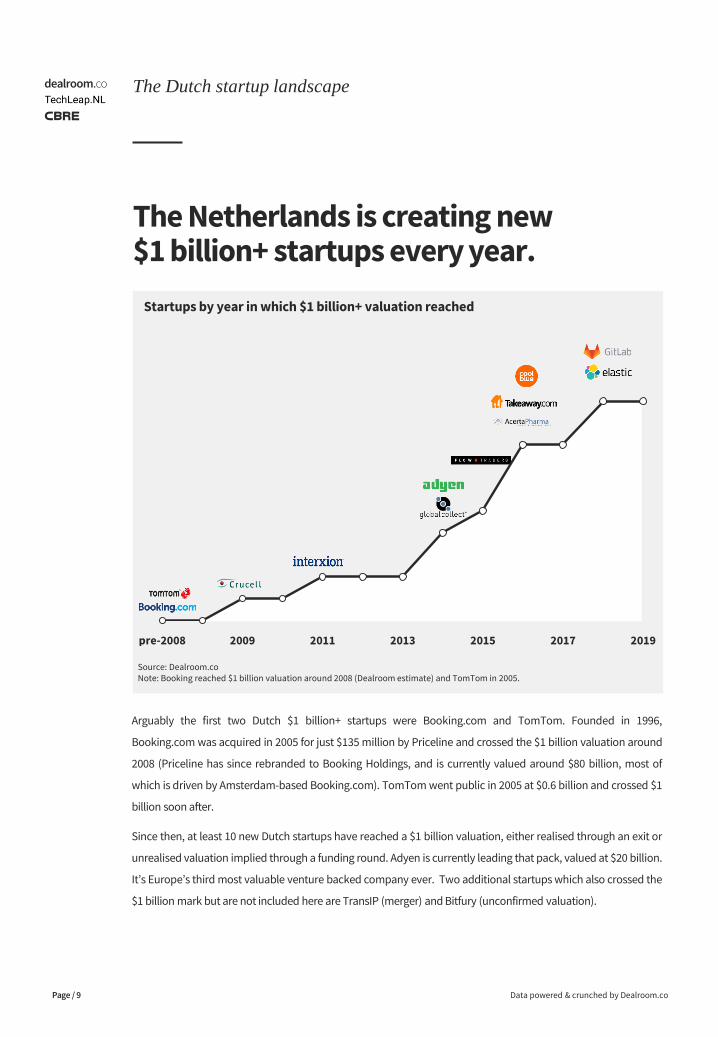
The Netherlands is creating new $1 billion+ startups every year.
Data powered & crunched by Dealroom.co
The Dutch startup landscape
Page / 9
Source: Dealroom.co Note: Booking reached $1 billion valuation around 2008 (Dealroom estimate) and TomTom in 2005.
Startups by year in which $1 billion+ valuation reached
Arguably the first two Dutch $1 billion+ startups were Booking.com and TomTom. Founded in 1996,
Booking.com was acquired in 2005 for just $135 million by Priceline and crossed the $1 billion valuation around
2008 (Priceline has since rebranded to Booking Holdings, and is currently valued around $80 billion, most of
which is driven by Amsterdam-based Booking.com). TomTom went public in 2005 at $0.6 billion and crossed $1
billion soon after.
Since then, at least 10 new Dutch startups have reached a $1 billion valuation, either realised through an exit or
unrealised valuation implied through a funding round. Adyen is currently leading that pack, valued at $20 billion.
It’s Europe’s third most valuable venture backed company ever. Two additional startups which also crossed the
$1 billion mark but are not included here are TransIP (merger) and Bitfury (unconfirmed valuation).
pre-2008 2009 2011 2013 2015 2017 2019
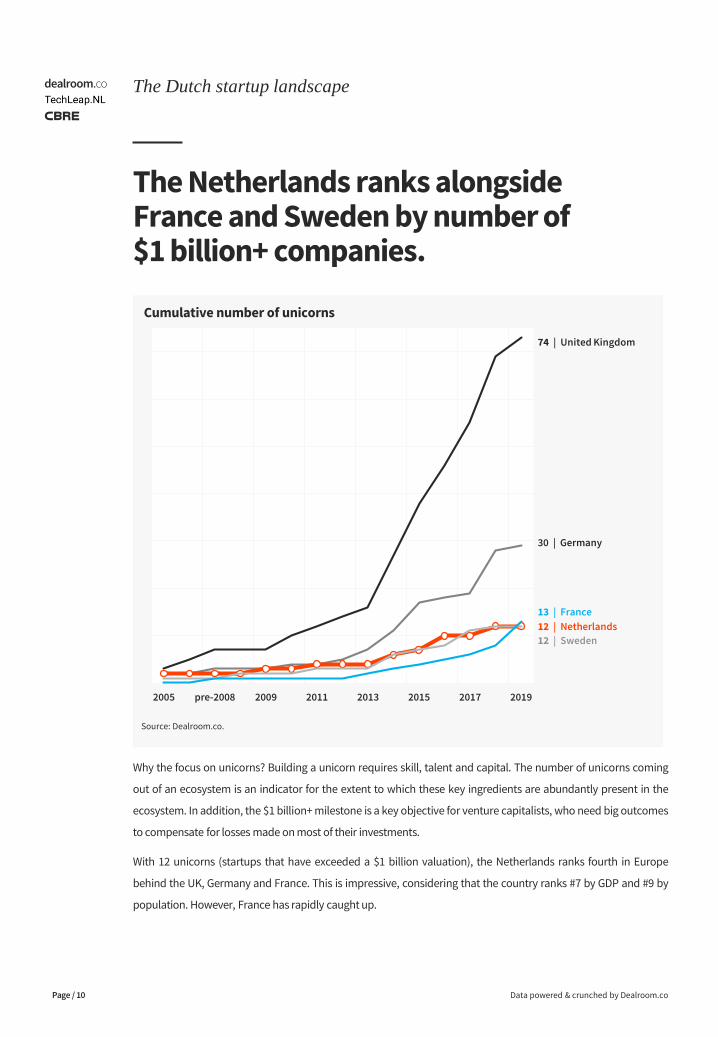
The Netherlands ranks alongside France and Sweden by number of $1 billion+ companies.
Data powered & crunched by Dealroom.co
The Dutch startup landscape
Page / 10
Cumulative number of unicorns
Why the focus on unicorns? Building a unicorn requires skill, talent and capital. The number of unicorns coming
out of an ecosystem is an indicator for the extent to which these key ingredients are abundantly present in the
ecosystem. In addition, the $1 billion+ milestone is a key objective for venture capitalists, who need big outcomes
to compensate for losses made on most of their investments.
With 12 unicorns (startups that have exceeded a $1 billion valuation), the Netherlands ranks fourth in Europe
behind the UK, Germany and France. This is impressive, considering that the country ranks #7 by GDP and #9 by
population. However, France has rapidly caught up.
2005 pre-2008 2009 2011 2013 2015 2017 2019
Source: Dealroom.co.
74 | United Kingdom
30 | Germany
12 | Netherlands
12 | Sweden
13 | France
€ 31B
€ 17B
€ 6B
€ 4B
€ 13B
€ 4B
€ 2B
€ 210B
€ 63B
€ 48B
€ 44B
€ 24B
€ 11B
€ 11B
United Kingdom
Germany
Sweden
Netherlands
France
Spain
Finland
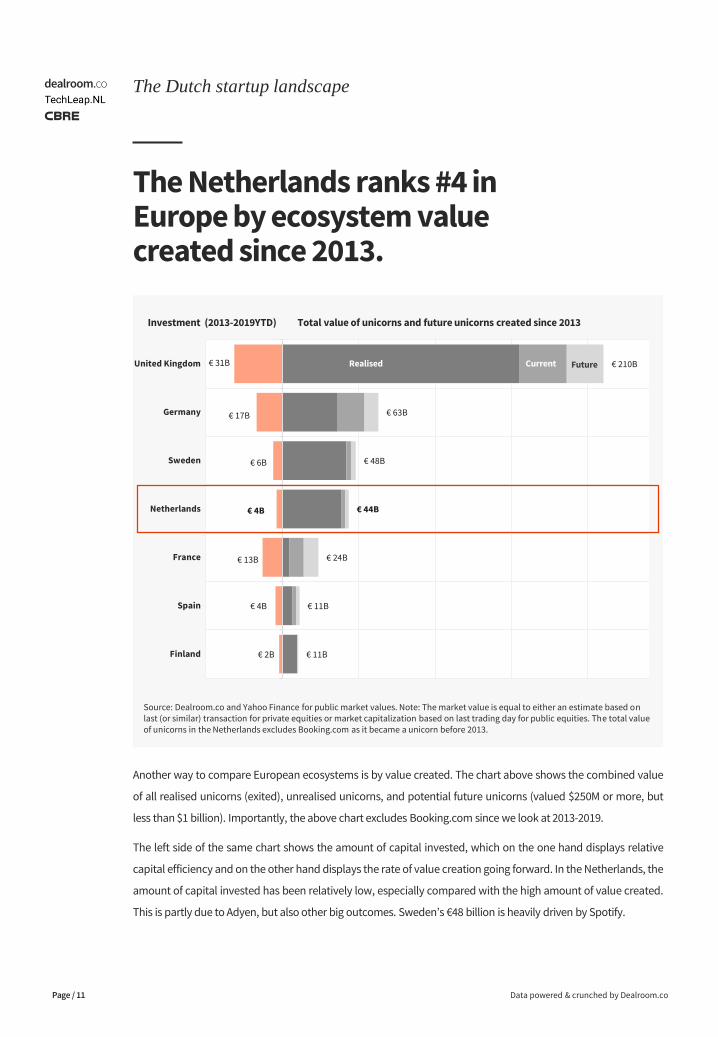
The Netherlands ranks #4 in Europe by ecosystem value created since 2013.
Data powered & crunched by Dealroom.co
The Dutch startup landscape
Page / 11
Source: Dealroom.co and Yahoo Finance for public market values. Note: The market value is equal to either an estimate based on last (or similar) transaction for private equities or market capitalization based on last trading day for public equities. The total value of unicorns in the Netherlands excludes Booking.com as it became a unicorn before 2013.
Investment (2013-2019YTD)
Another way to compare European ecosystems is by value created. The chart above shows the combined value
of all realised unicorns (exited), unrealised unicorns, and potential future unicorns (valued $250M or more, but
less than $1 billion). Importantly, the above chart excludes Booking.com since we look at 2013-2019.
The left side of the same chart shows the amount of capital invested, which on the one hand displays relative
capital efficiency and on the other hand displays the rate of value creation going forward. In the Netherlands, the
amount of capital invested has been relatively low, especially compared with the high amount of value created.
This is partly due to Adyen, but also other big outcomes. Sweden’s €48 billion is heavily driven by Spotify.
Total value of unicorns and future unicorns created since 2013
CurrentRealised Future
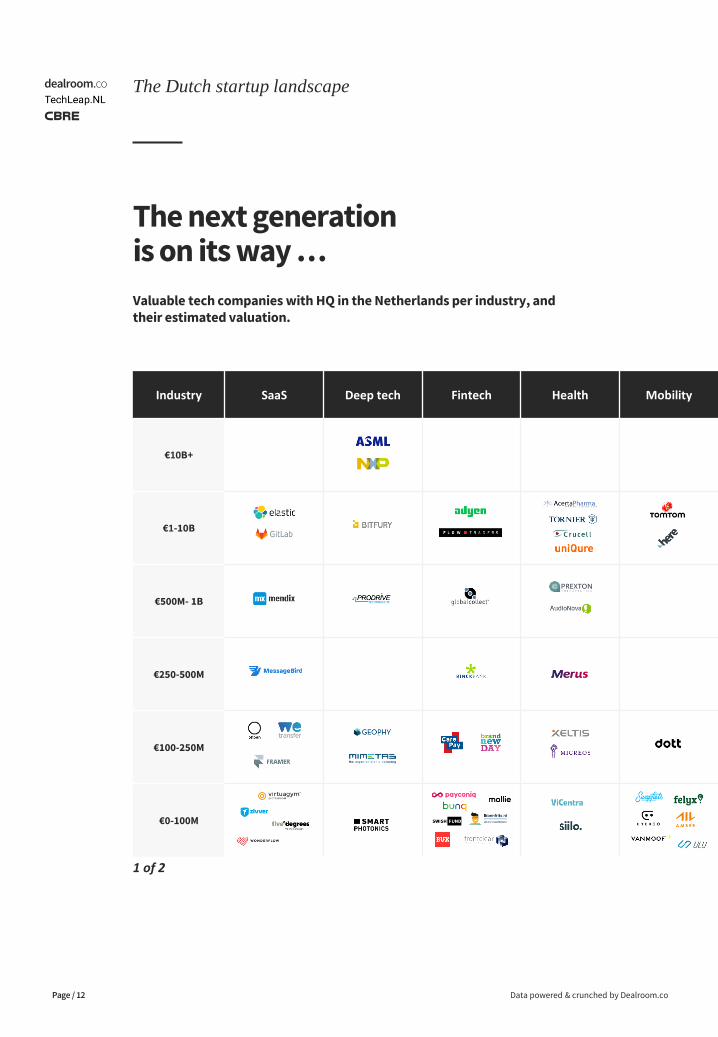
The next generation is on its way …
Valuable tech companies with HQ in the Netherlands per industry, and their estimated valuation.
Data powered & crunched by Dealroom.co
The Dutch startup landscape
Page / 12
Industry SaaS Deep tech Fintech Health Mobility
€10B+
€1-10B
€500M- 1B
€250-500M
€100-250M
€0-100M
1 of 2
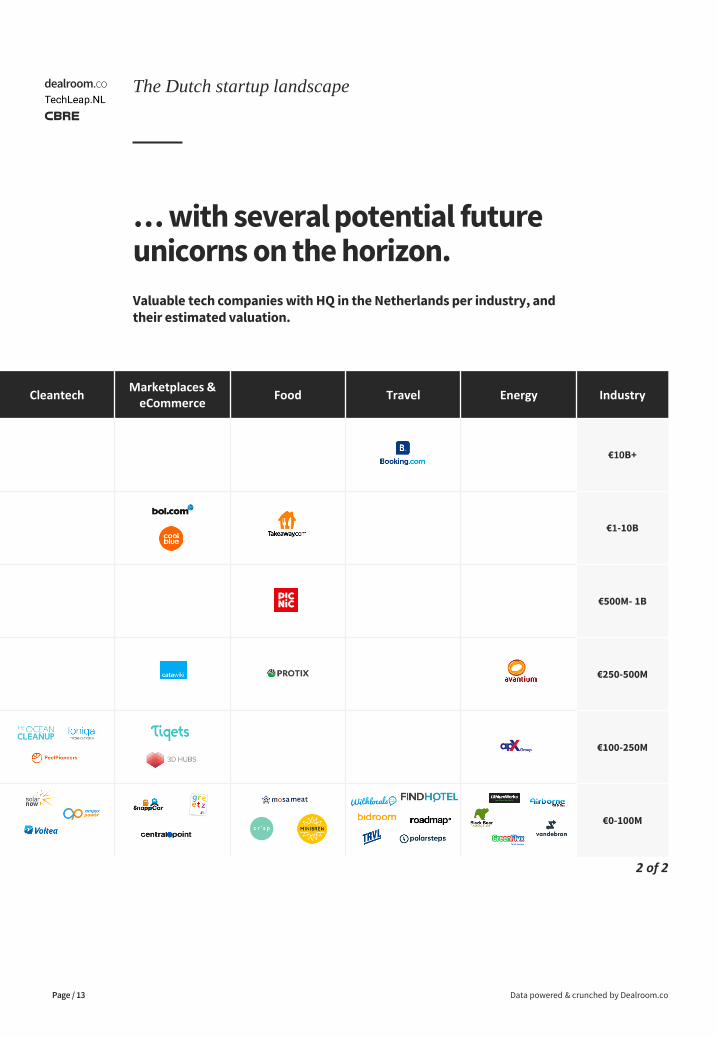
… with several potential future unicorns on the horizon.
Valuable tech companies with HQ in the Netherlands per industry, and their estimated valuation.
Data powered & crunched by Dealroom.co
The Dutch startup landscape
Page / 13
CleantechMarketplaces &
eCommerceFood Travel Energy Industry
€10B+
€1-10B
€500M- 1B
€250-500M
€100-250M
€0-100M
2 of 2
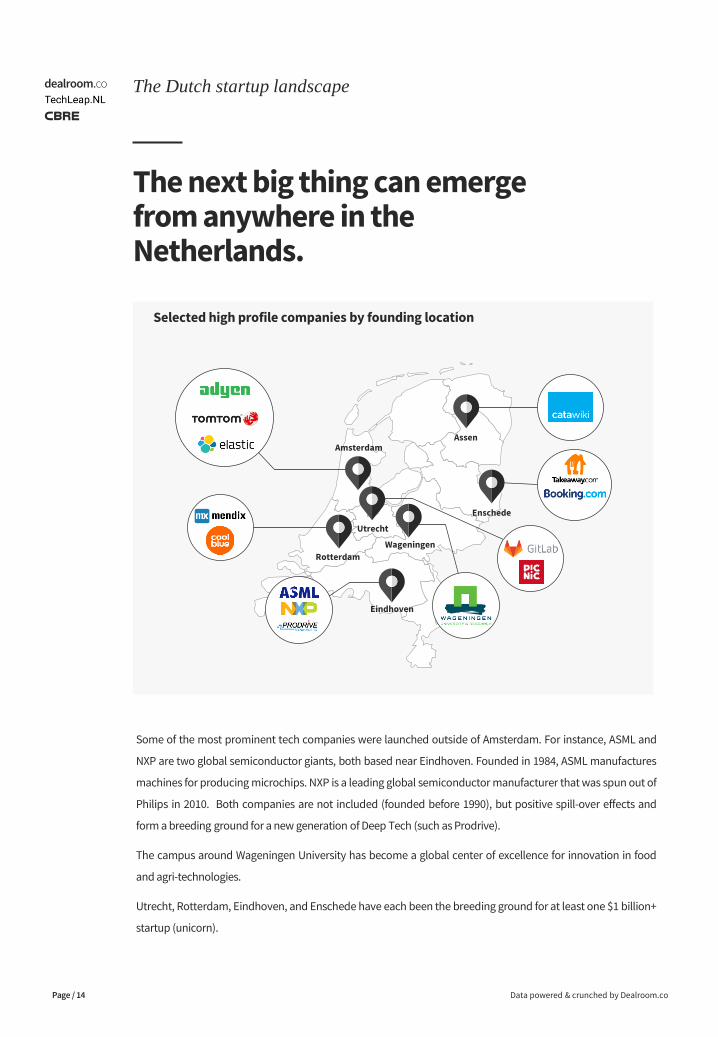
The next big thing can emerge from anywhere in the Netherlands.
Some of the most prominent tech companies were launched outside of Amsterdam. For instance, ASML and
NXP are two global semiconductor giants, both based near Eindhoven. Founded in 1984, ASML manufactures
machines for producing microchips. NXP is a leading global semiconductor manufacturer that was spun out of
Philips in 2010. Both companies are not included (founded before 1990), but positive spill-over effects and
form a breeding ground for a new generation of Deep Tech (such as Prodrive).
The campus around Wageningen University has become a global center of excellence for innovation in food
and agri-technologies.
Utrecht, Rotterdam, Eindhoven, and Enschede have each been the breeding ground for at least one $1 billion+
startup (unicorn).
Data powered & crunched by Dealroom.co
The Dutch startup landscape
Page / 14
Selected high profile companies by founding location
Eindhoven
Rotterdam
AssenAmsterdam
Enschede
Utrecht
Wageningen
Data powered & crunched by Dealroom.co
2.
Page / 15
Anatomy of a Dutch startup.From founding to maturity, what does the typical startup journey look like?
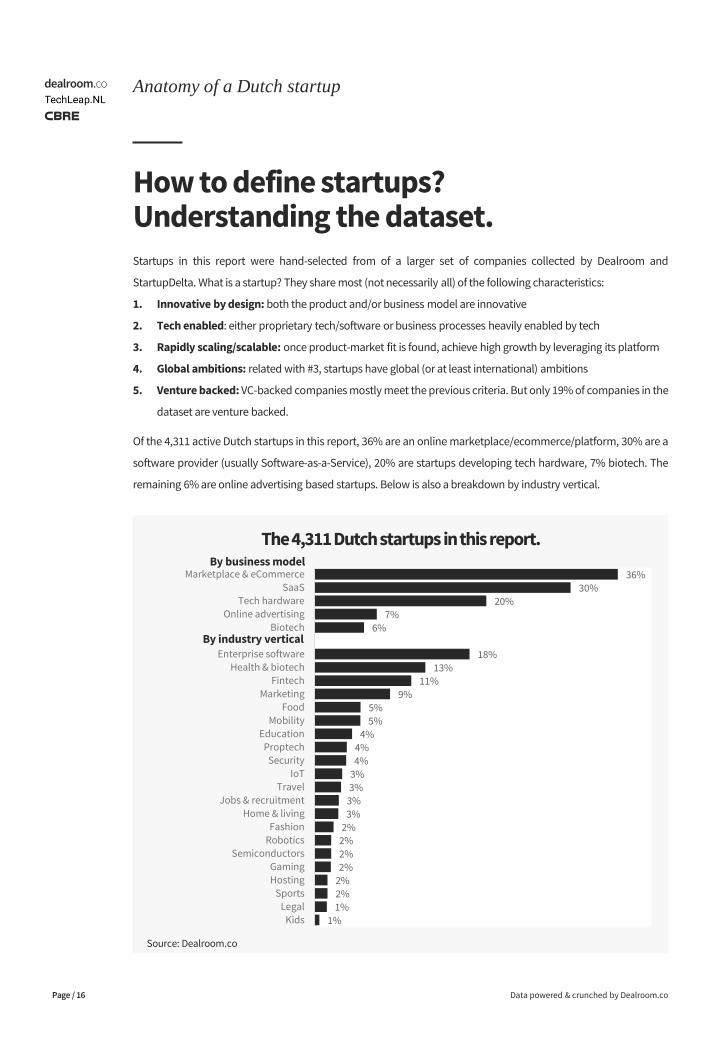
How to define startups? Understanding the dataset.Startups in this report were hand-selected from of a larger set of companies collected by Dealroom and
StartupDelta. What is a startup? They share most (not necessarily all) of the following characteristics:
1. Innovative by design: both the product and/or business model are innovative
2. Tech enabled: either proprietary tech/software or business processes heavily enabled by tech
3. Rapidly scaling/scalable: once product-market fit is found, achieve high growth by leveraging its platform
4. Global ambitions: related with #3, startups have global (or at least international) ambitions
5. Venture backed: VC-backed companies mostly meet the previous criteria. But only 19% of companies in the
dataset are venture backed.
Of the 4,311 active Dutch startups in this report, 36% are an online marketplace/ecommerce/platform, 30% are a
software provider (usually Software-as-a-Service), 20% are startups developing tech hardware, 7% biotech. The
remaining 6% are online advertising based startups. Below is also a breakdown by industry vertical.
Data powered & crunched by Dealroom.co
Anatomy of a Dutch startup
Page / 16
By business model
By industry vertical
The 4,311 Dutch startups in this report.
36%30%
20%7%
6%
18%13%
11%9%
5%5%
4%4%4%
3%3%
3%3%
2%2%2%2%
2%2%1%
1%
Marketplace & eCommerceSaaS
Tech hardwareOnline advertising
Biotech
Enterprise softwareHealth & biotech
FintechMarketing
FoodMobility
EducationProptech
SecurityIoT
TravelJobs & recruitment
Home & livingFashion
RoboticsSemiconductors
GamingHosting
SportsLegal
Kids
Source: Dealroom.co
Only 0.2% of startups reach more than 500 employees; 89% of jobs are with smaller companies.
Data powered & crunched by Dealroom.co
Anatomy of a Dutch startup
Page / 17
0
1,000
2,000
3,000
4,000
5,000
0 5 10 15 20 25 30
Source: Dealroom.co
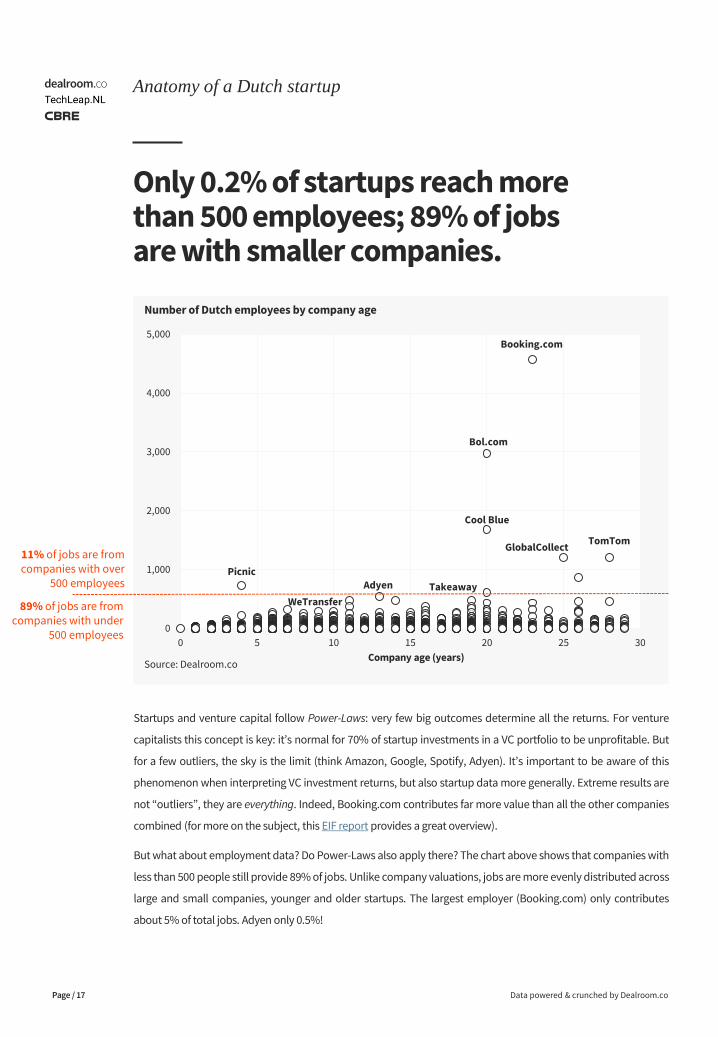
Number of Dutch employees by company age
Startups and venture capital follow Power-Laws: very few big outcomes determine all the returns. For venture
capitalists this concept is key: it’s normal for 70% of startup investments in a VC portfolio to be unprofitable. But
for a few outliers, the sky is the limit (think Amazon, Google, Spotify, Adyen). It’s important to be aware of this
phenomenon when interpreting VC investment returns, but also startup data more generally. Extreme results are
not “outliers”, they are everything. Indeed, Booking.com contributes far more value than all the other companies
combined (for more on the subject, this EIF report provides a great overview).
But what about employment data? Do Power-Laws also apply there? The chart above shows that companies with
less than 500 people still provide 89% of jobs. Unlike company valuations, jobs are more evenly distributed across
large and small companies, younger and older startups. The largest employer (Booking.com) only contributes
about 5% of total jobs. Adyen only 0.5%!
Booking.com
Bol.com
Cool Blue
Picnic
GlobalCollectTomTom
Adyen Takeaway
WeTransfer89% of jobs are from companies with under
500 employees
Company age (years)
11% of jobs are from companies with over
500 employees
0
50
100
150
200
250
300
350
400
450
500
0 5 10 15 20 25 30
Company age (years)
True “hyper-growth” is rare. Most jobs are with companies on a more moderate growth track.
Data powered & crunched by Dealroom.co
Anatomy of a Dutch startup
Page / 18
Source: Dealroom.co
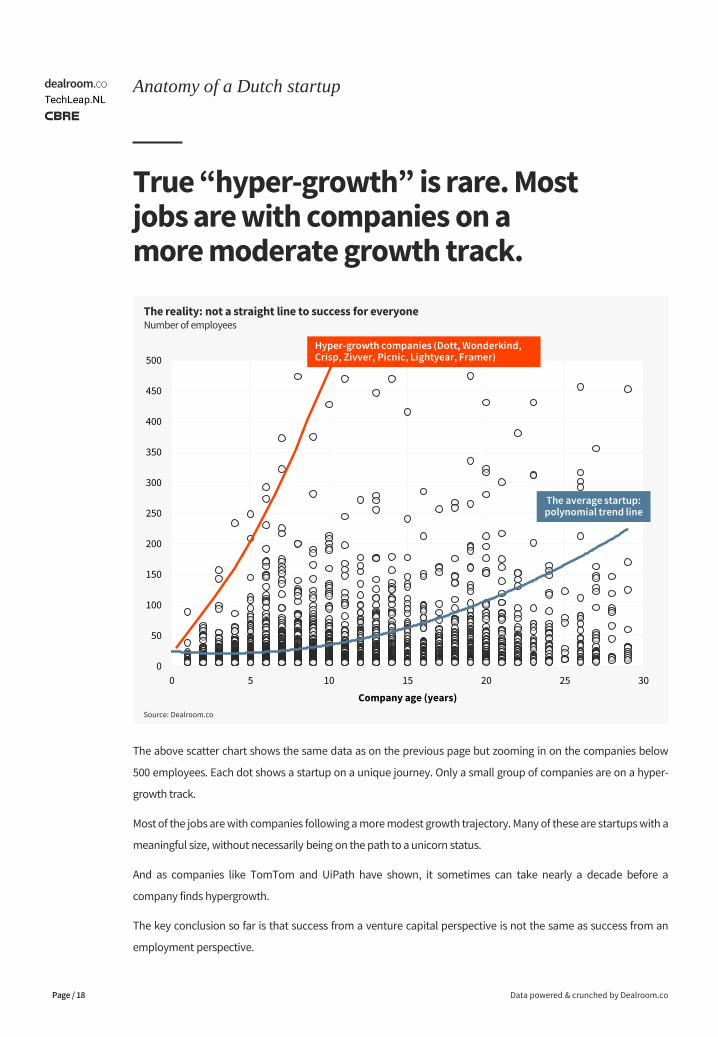
The reality: not a straight line to success for everyoneNumber of employees
The above scatter chart shows the same data as on the previous page but zooming in on the companies below
500 employees. Each dot shows a startup on a unique journey. Only a small group of companies are on a hyper-
growth track.
Most of the jobs are with companies following a more modest growth trajectory. Many of these are startups with a
meaningful size, without necessarily being on the path to a unicorn status.
And as companies like TomTom and UiPath have shown, it sometimes can take nearly a decade before a
company finds hypergrowth.
The key conclusion so far is that success from a venture capital perspective is not the same as success from an
employment perspective.
The average startup: polynomial trend line
Hyper-growth companies (Dott, Wonderkind, Crisp, Zivver, Picnic, Lightyear, Framer)
Only 19% of startups are venture backed.
Data powered & crunched by Dealroom.co
Anatomy of a Dutch startup
Page / 19
Note: bubble size shows number of companies.Source: Dealroom.co
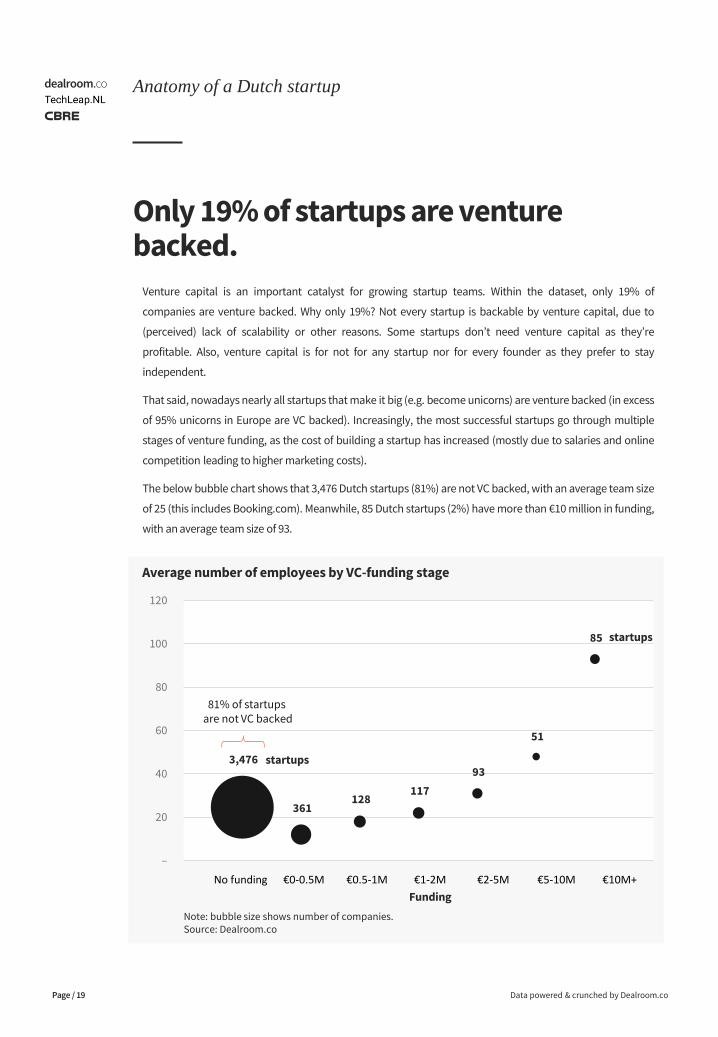
Average number of employees by VC-funding stage
Venture capital is an important catalyst for growing startup teams. Within the dataset, only 19% of
companies are venture backed. Why only 19%? Not every startup is backable by venture capital, due to
(perceived) lack of scalability or other reasons. Some startups don’t need venture capital as they’re
profitable. Also, venture capital is for not for any startup nor for every founder as they prefer to stay
independent.
That said, nowadays nearly all startups that make it big (e.g. become unicorns) are venture backed (in excess
of 95% unicorns in Europe are VC backed). Increasingly, the most successful startups go through multiple
stages of venture funding, as the cost of building a startup has increased (mostly due to salaries and online
competition leading to higher marketing costs).
The below bubble chart shows that 3,476 Dutch startups (81%) are not VC backed, with an average team size
of 25 (this includes Booking.com). Meanwhile, 85 Dutch startups (2%) have more than €10 million in funding,
with an average team size of 93.
No funding €0-0.5M €0.5-1M €1-2M €2-5M €5-10M €10M+
Funding
3,476
361 128
117
93
51
85
–
20
40
60
80
100
120
81% of startups are not VC backed
startups
startups
Venture Capital backed startups scale 3x faster on average.
Data powered & crunched by Dealroom.co
Anatomy of a Dutch startup
Page / 20
Source: Dealroom.co
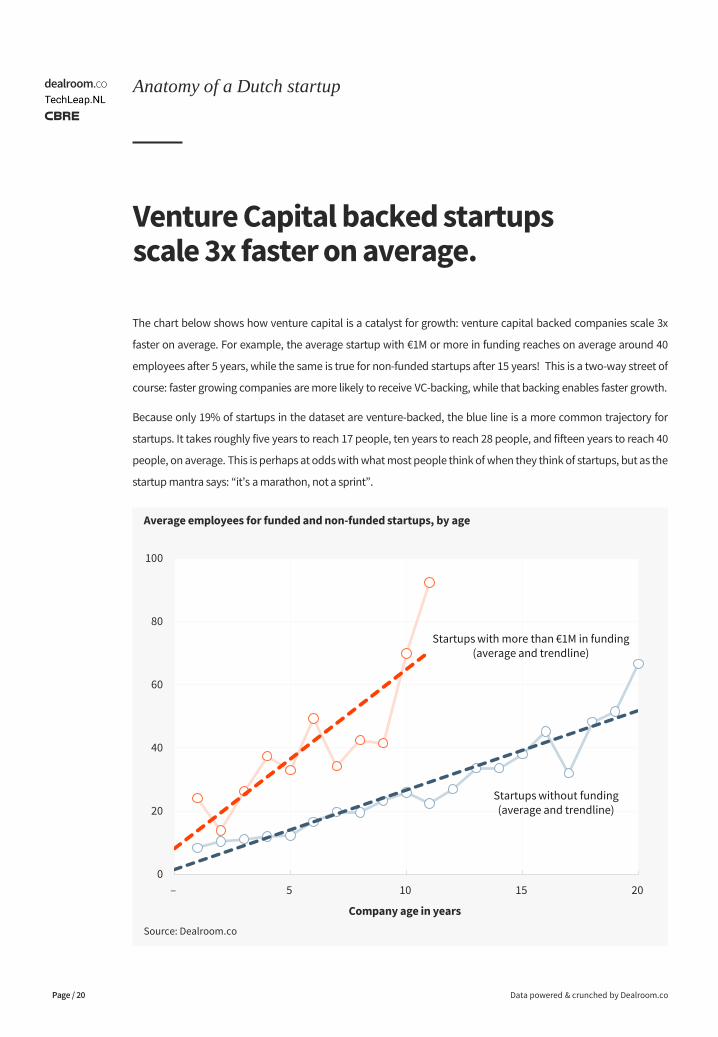
Average employees for funded and non-funded startups, by age
The chart below shows how venture capital is a catalyst for growth: venture capital backed companies scale 3x
faster on average. For example, the average startup with €1M or more in funding reaches on average around 40
employees after 5 years, while the same is true for non-funded startups after 15 years! This is a two-way street of
course: faster growing companies are more likely to receive VC-backing, while that backing enables faster growth.
Because only 19% of startups in the dataset are venture-backed, the blue line is a more common trajectory for
startups. It takes roughly five years to reach 17 people, ten years to reach 28 people, and fifteen years to reach 40
people, on average. This is perhaps at odds with what most people think of when they think of startups, but as the
startup mantra says: “it’s a marathon, not a sprint”.
Sample of older companies too small
0
20
40
60
80
100
– 5 10 15 20
Startups with more than €1M in funding(average and trendline)
Startups without funding(average and trendline)
Company age in years
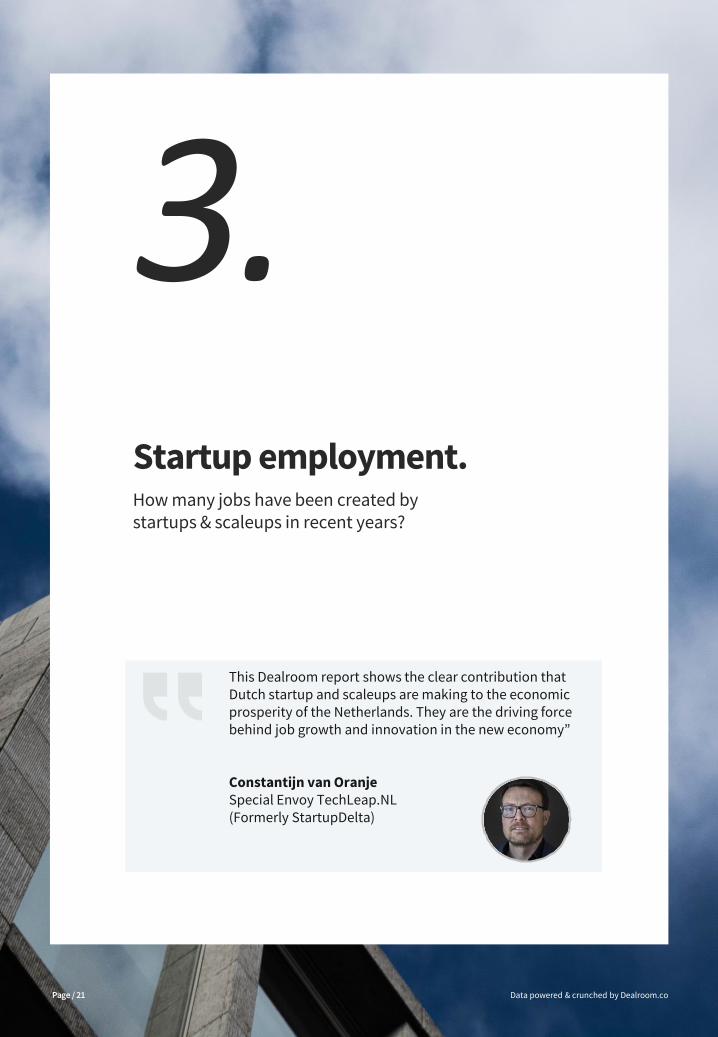
Startup employment.How many jobs have been created bystartups & scaleups in recent years?
Data powered & crunched by Dealroom.co
3.
Page / 21
This Dealroom report shows the clear contribution that Dutch startup and scaleups are making to the economic prosperity of the Netherlands. They are the driving force behind job growth and innovation in the new economy”
Constantijn van OranjeSpecial Envoy TechLeap.NL(Formerly StartupDelta)
Of the 4,311 Dutch startups, 55% have 2-10 employees or less.
Data powered & crunched by Dealroom.co
Startup employment
Page / 22
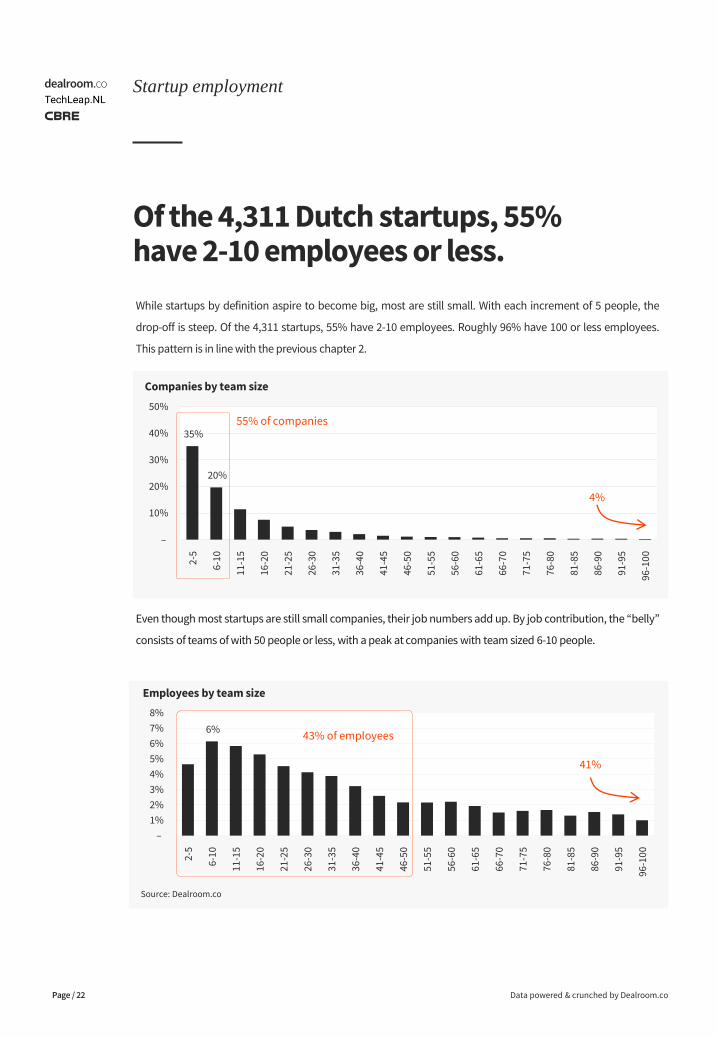
Companies by team size
Even though most startups are still small companies, their job numbers add up. By job contribution, the “belly”
consists of teams of with 50 people or less, with a peak at companies with team sized 6-10 people.
Source: Dealroom.co
35%
20%
–
10%
20%
30%
40%
50%
2-5
6-1
0
11
-15
16
-20
21
-25
26
-30
31
-35
36
-40
41
-45
46
-50
51
-55
56
-60
61
-65
66
-70
71
-75
76
-80
81
-85
86
-90
91
-95
96
-10
0
6%
–
1%
2%
3%
4%
5%
6%
7%
8%
2-5
6-1
0
11
-15
16
-20
21
-25
26
-30
31
-35
36
-40
41
-45
46
-50
51
-55
56
-60
61
-65
66
-70
71
-75
76
-80
81
-85
86
-90
91
-95
96
-10
0
4%
41%
Employees by team size
While startups by definition aspire to become big, most are still small. With each increment of 5 people, the
drop-off is steep. Of the 4,311 startups, 55% have 2-10 employees. Roughly 96% have 100 or less employees.
This pattern is in line with the previous chapter 2.
43% of employees
55% of companies
Combined, startups provide 108K jobs, mainly driven by small and medium sized startups & scaleups.
Data powered & crunched by Dealroom.co
Startup employment
Page / 23
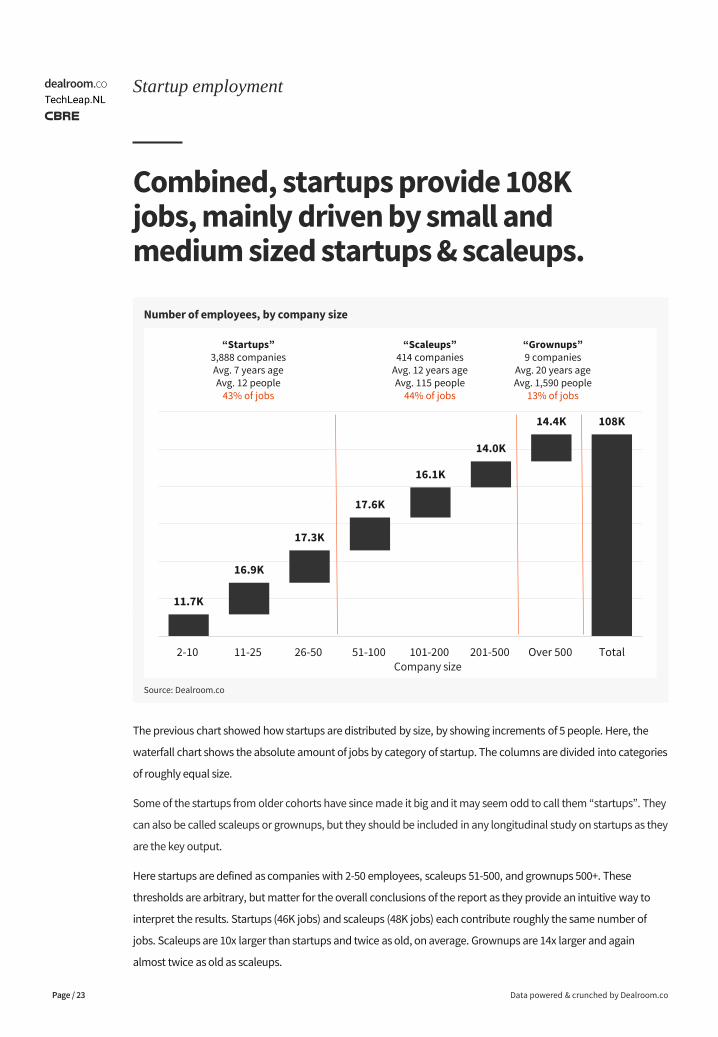
The previous chart showed how startups are distributed by size, by showing increments of 5 people. Here, the
waterfall chart shows the absolute amount of jobs by category of startup. The columns are divided into categories
of roughly equal size.
Some of the startups from older cohorts have since made it big and it may seem odd to call them “startups”. They
can also be called scaleups or grownups, but they should be included in any longitudinal study on startups as they
are the key output.
Here startups are defined as companies with 2-50 employees, scaleups 51-500, and grownups 500+. These
thresholds are arbitrary, but matter for the overall conclusions of the report as they provide an intuitive way to
interpret the results. Startups (46K jobs) and scaleups (48K jobs) each contribute roughly the same number of
jobs. Scaleups are 10x larger than startups and twice as old, on average. Grownups are 14x larger and again
almost twice as old as scaleups.
Source: Dealroom.co
Number of employees, by company size
11.7K
16.9K
17.3K
17.6K
16.1K
14.0K
14.4K 108K
2-10 11-25 26-50 51-100 101-200 201-500 Over 500 Total
“Startups”3,888 companiesAvg. 7 years ageAvg. 12 people
43% of jobs
“Scaleups”414 companies
Avg. 12 years ageAvg. 115 people
44% of jobs
“Grownups”9 companies
Avg. 20 years ageAvg. 1,590 people
13% of jobs
Company size
81% of startups were growing their teams, resulting in 19.7K net new jobs added in the last two years.
Data powered & crunched by Dealroom.co
Startup employment
Page / 24
(100)
(80)
(60)
(40)
(20)
–
20
40
60
80
100
0 100 200 300 400 500
Number of employees 2018
Source: Dealroom.co
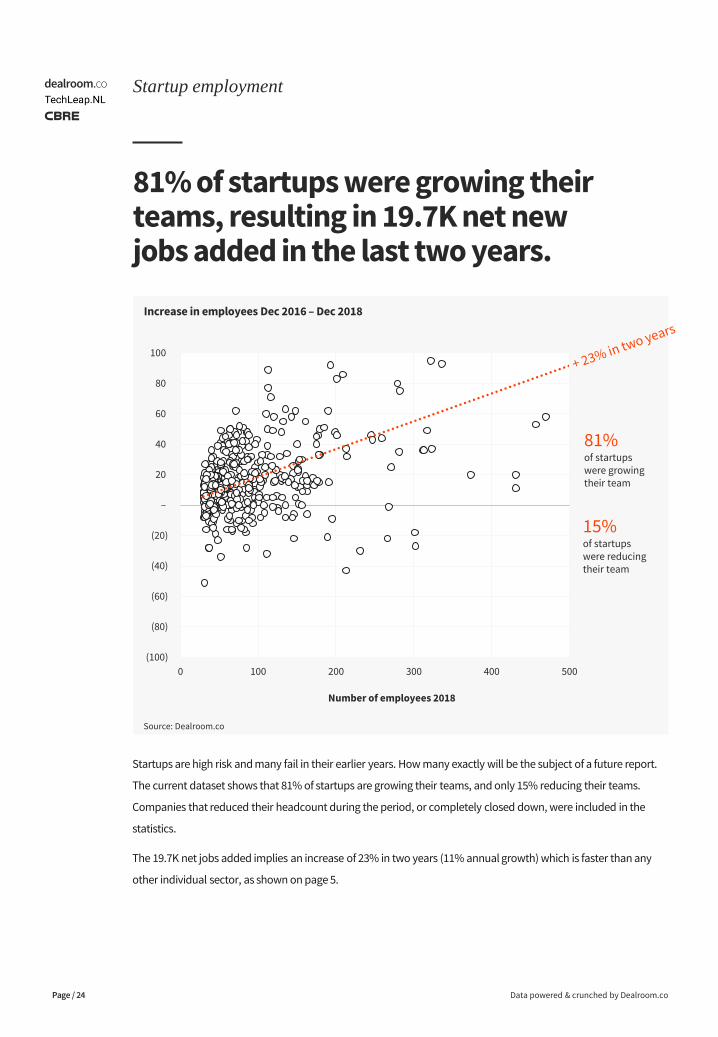
Increase in employees Dec 2016 – Dec 2018
81% of startups were growingtheir team
15% of startups were reducingtheir team
Startups are high risk and many fail in their earlier years. How many exactly will be the subject of a future report.
The current dataset shows that 81% of startups are growing their teams, and only 15% reducing their teams.
Companies that reduced their headcount during the period, or completely closed down, were included in the
statistics.
The 19.7K net jobs added implies an increase of 23% in two years (11% annual growth) which is faster than any
other individual sector, as shown on page 5.
Younger companies add by far the most jobs in absolute and relative terms.
Data powered & crunched by Dealroom.co
Startup employment
Page / 25
Source: Dealroom.co
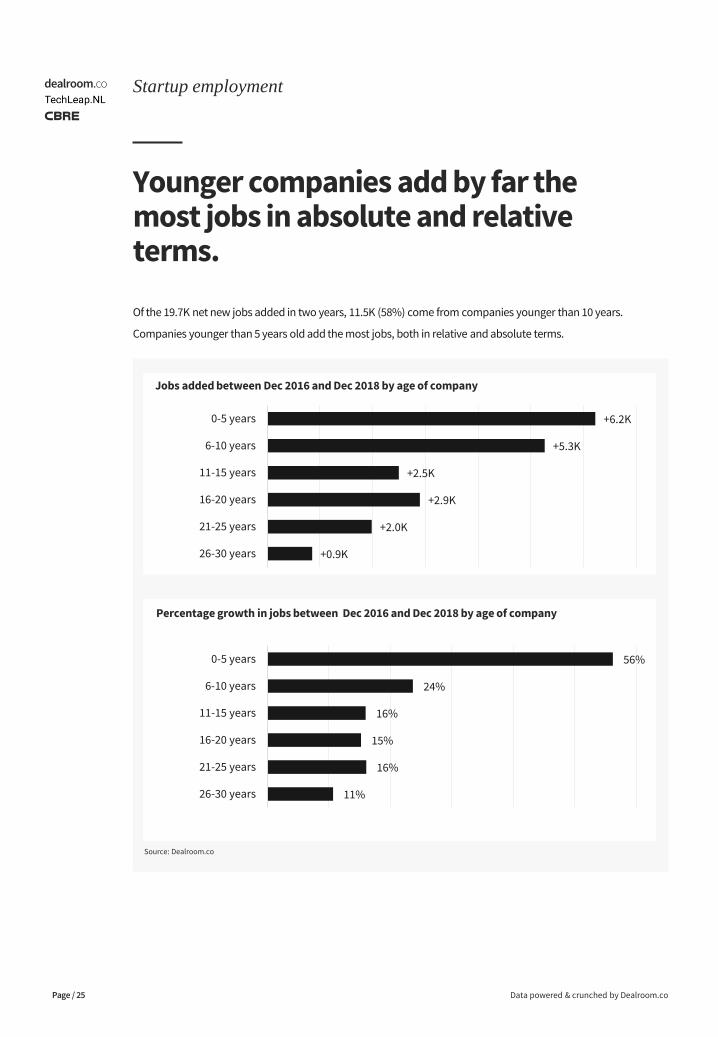
Jobs added between Dec 2016 and Dec 2018 by age of company
Percentage growth in jobs between Dec 2016 and Dec 2018 by age of company
+6.2K
+5.3K
+2.5K
+2.9K
+2.0K
+0.9K
0-5 years
6-10 years
11-15 years
16-20 years
21-25 years
26-30 years
56%
24%
16%
15%
16%
11%
0-5 years
6-10 years
11-15 years
16-20 years
21-25 years
26-30 years
Of the 19.7K net new jobs added in two years, 11.5K (58%) come from companies younger than 10 years.
Companies younger than 5 years old add the most jobs, both in relative and absolute terms.
Enterprise software, fintech and health are the top three contributors.
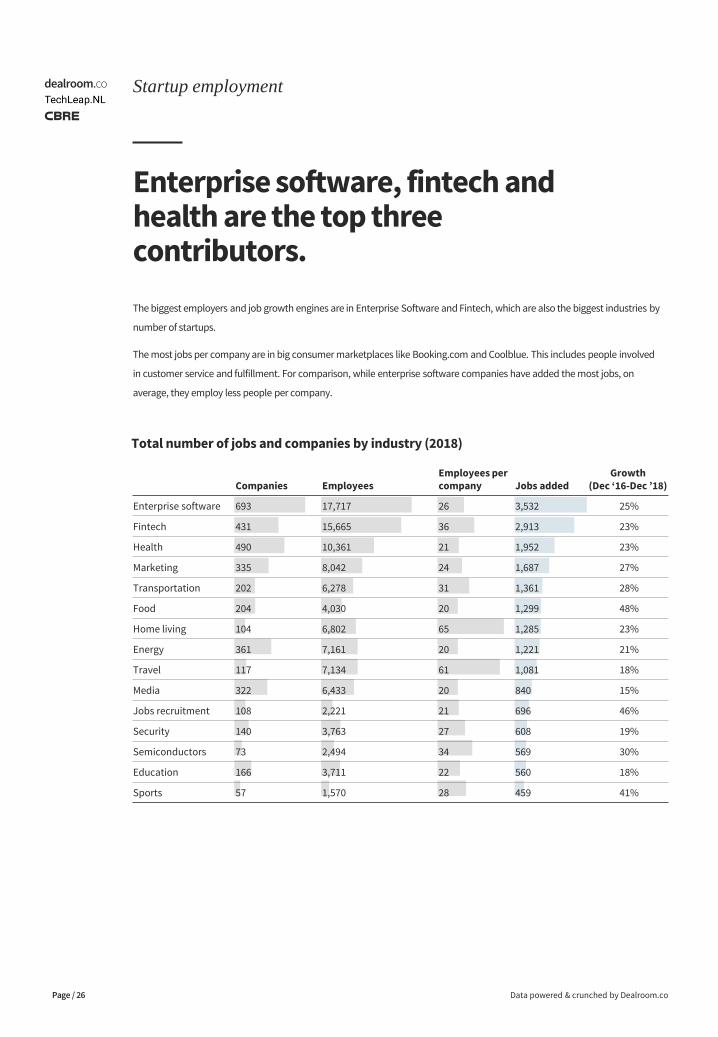
The biggest employers and job growth engines are in Enterprise Software and Fintech, which are also the biggest industries by
number of startups.
The most jobs per company are in big consumer marketplaces like Booking.com and Coolblue. This includes people involved
in customer service and fulfillment. For comparison, while enterprise software companies have added the most jobs, on
average, they employ less people per company.
Data powered & crunched by Dealroom.co
Startup employment
Page / 26
Companies EmployeesEmployees per company Jobs added
Growth(Dec ‘16-Dec ’18)
Enterprise software 693 17,717 26 3,532 25%
Fintech 431 15,665 36 2,913 23%
Health 490 10,361 21 1,952 23%
Marketing 335 8,042 24 1,687 27%
Transportation 202 6,278 31 1,361 28%
Food 204 4,030 20 1,299 48%
Home living 104 6,802 65 1,285 23%
Energy 361 7,161 20 1,221 21%
Travel 117 7,134 61 1,081 18%
Media 322 6,433 20 840 15%
Jobs recruitment 108 2,221 21 696 46%
Security 140 3,763 27 608 19%
Semiconductors 73 2,494 34 569 30%
Education 166 3,711 22 560 18%
Sports 57 1,570 28 459 41%
Total number of jobs and companies by industry (2018)
Two-thirds of all startup jobs are outside of Amsterdam.
Data powered & crunched by Dealroom.co
Startup employment
Page / 27
Source: Dealroom.co
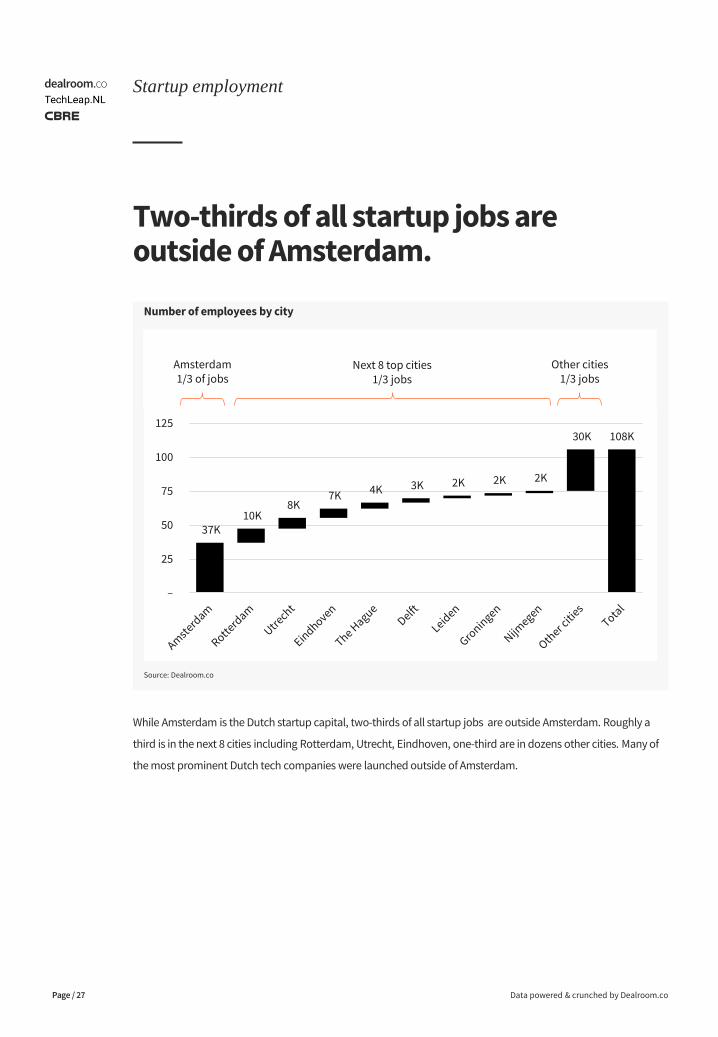
Number of employees by city
While Amsterdam is the Dutch startup capital, two-thirds of all startup jobs are outside Amsterdam. Roughly a
third is in the next 8 cities including Rotterdam, Utrecht, Eindhoven, one-third are in dozens other cities. Many of
the most prominent Dutch tech companies were launched outside of Amsterdam.
37K10K
8K7K 4K 3K 2K 2K 2K
30K 108K
–
25
50
75
100
125
Amsterdam1/3 of jobs
Next 8 top cities1/3 jobs
Other cities1/3 jobs
CBRE: Workplaces of startups and scaleups.Which workplaces do startups prefer?
Data powered & crunched by Dealroom.co
4.
Page / 28
What are the preferred workplaces of startups and scaleups.
Data powered & crunched by Dealroom.co & CBRE
CBRE: Workplaces of startups and scaleups
Page / 29
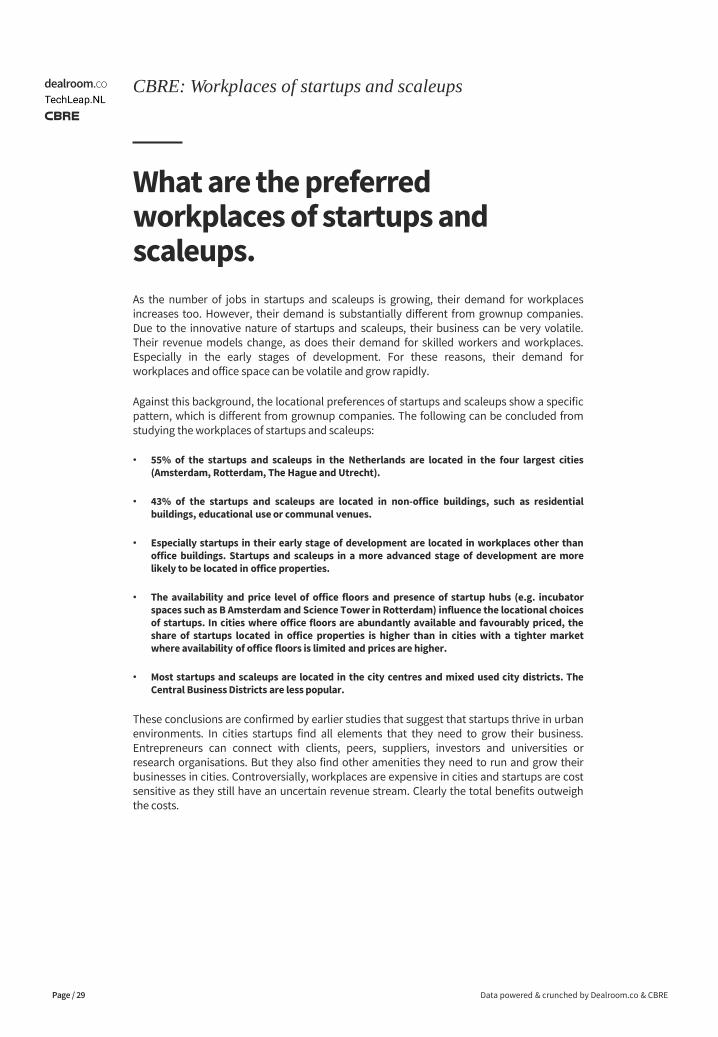
As the number of jobs in startups and scaleups is growing, their demand for workplacesincreases too. However, their demand is substantially different from grownup companies.Due to the innovative nature of startups and scaleups, their business can be very volatile.Their revenue models change, as does their demand for skilled workers and workplaces.Especially in the early stages of development. For these reasons, their demand forworkplaces and office space can be volatile and grow rapidly.
Against this background, the locational preferences of startups and scaleups show a specificpattern, which is different from grownup companies. The following can be concluded fromstudying the workplaces of startups and scaleups:
• 55% of the startups and scaleups in the Netherlands are located in the four largest cities(Amsterdam, Rotterdam, The Hague and Utrecht).
• 43% of the startups and scaleups are located in non-office buildings, such as residentialbuildings, educational use or communal venues.
• Especially startups in their early stage of development are located in workplaces other thanoffice buildings. Startups and scaleups in a more advanced stage of development are morelikely to be located in office properties.
• The availability and price level of office floors and presence of startup hubs (e.g. incubatorspaces such as B Amsterdam and Science Tower in Rotterdam) influence the locational choicesof startups. In cities where office floors are abundantly available and favourably priced, theshare of startups located in office properties is higher than in cities with a tighter marketwhere availability of office floors is limited and prices are higher.
• Most startups and scaleups are located in the city centres and mixed used city districts. TheCentral Business Districts are less popular.
These conclusions are confirmed by earlier studies that suggest that startups thrive in urbanenvironments. In cities startups find all elements that they need to grow their business.Entrepreneurs can connect with clients, peers, suppliers, investors and universities orresearch organisations. But they also find other amenities they need to run and grow theirbusinesses in cities. Controversially, workplaces are expensive in cities and startups are costsensitive as they still have an uncertain revenue stream. Clearly the total benefits outweighthe costs.
Startups by type of location: growing demand for formal offices.
Data powered & crunched by Dealroom.co & CBRE
CBRE: Workplaces of startups and scaleups
Page / 30
Source: Dealroom.co, BAG, CBRE
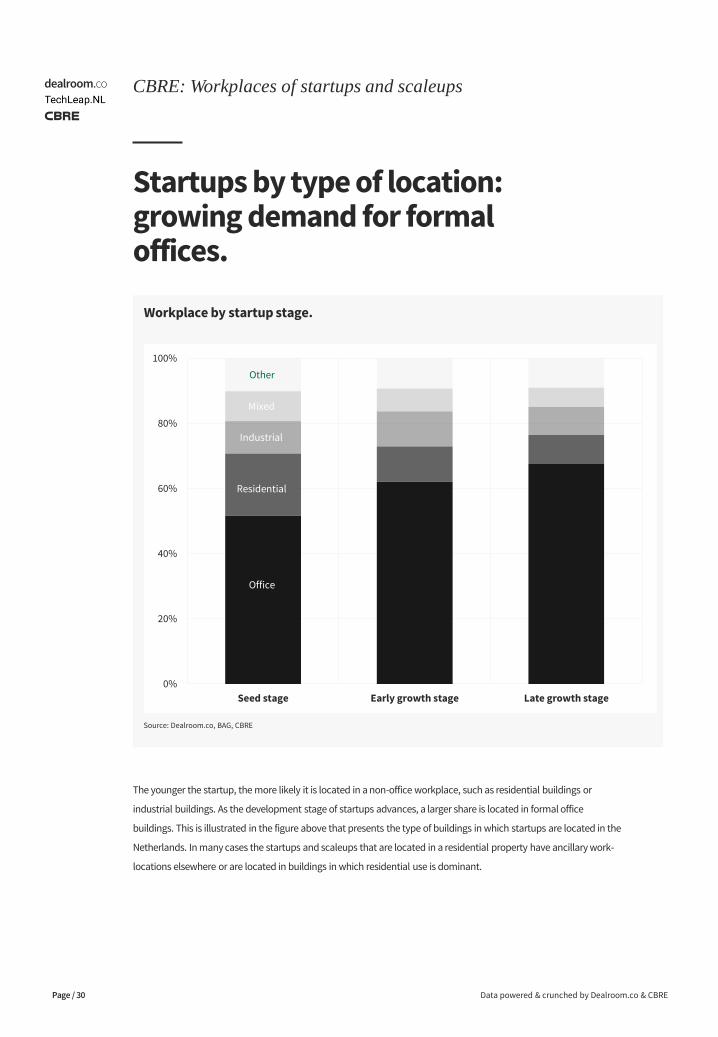
Workplace by startup stage.
The younger the startup, the more likely it is located in a non-office workplace, such as residential buildings or
industrial buildings. As the development stage of startups advances, a larger share is located in formal office
buildings. This is illustrated in the figure above that presents the type of buildings in which startups are located in the
Netherlands. In many cases the startups and scaleups that are located in a residential property have ancillary work-
locations elsewhere or are located in buildings in which residential use is dominant.
0%
20%
40%
60%
80%
100%
Seed stage Early growth stage Late growth stage
Office
Residential
Industrial
Mixed
Other
Startups by type of location: growing demand for formal offices.
Data powered & crunched by Dealroom.co & CBRE
CBRE: Workplaces of startups and scaleups
Page / 31
0% 20% 40% 60% 80% 100%
Utrecht
Amsterdam
The Hague
Rotterdam
Source: Dealroom.co, BAG, CBRE
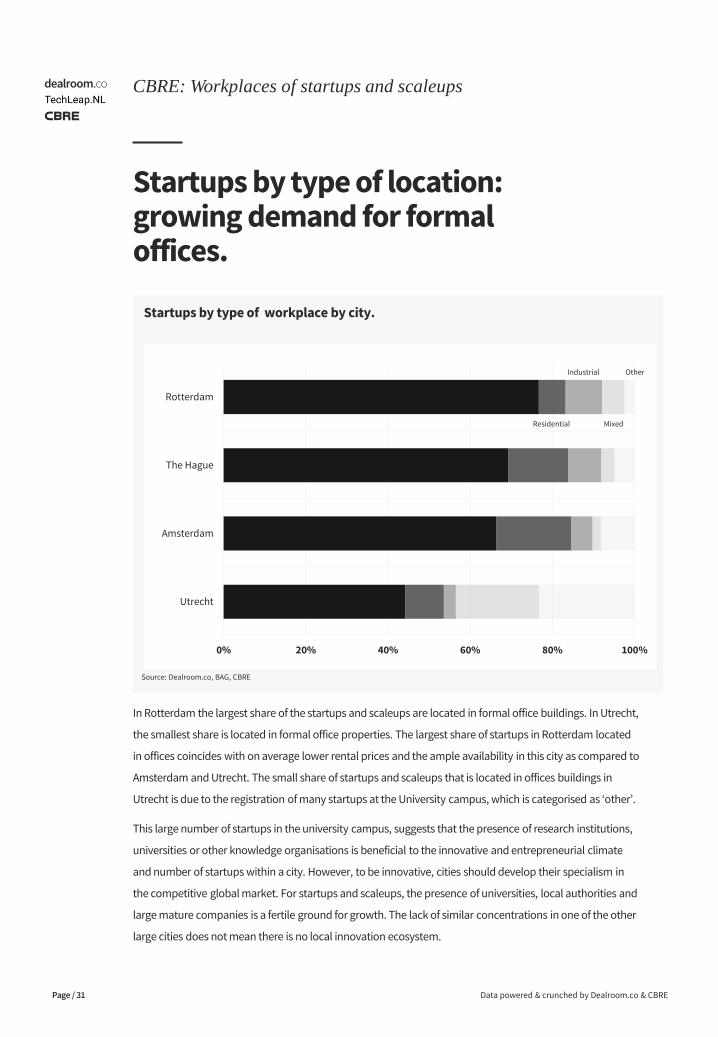
Startups by type of workplace by city.
In Rotterdam the largest share of the startups and scaleups are located in formal office buildings. In Utrecht,
the smallest share is located in formal office properties. The largest share of startups in Rotterdam located
in offices coincides with on average lower rental prices and the ample availability in this city as compared to
Amsterdam and Utrecht. The small share of startups and scaleups that is located in offices buildings in
Utrecht is due to the registration of many startups at the University campus, which is categorised as ‘other’.
This large number of startups in the university campus, suggests that the presence of research institutions,
universities or other knowledge organisations is beneficial to the innovative and entrepreneurial climate
and number of startups within a city. However, to be innovative, cities should develop their specialism in
the competitive global market. For startups and scaleups, the presence of universities, local authorities and
large mature companies is a fertile ground for growth. The lack of similar concentrations in one of the other
large cities does not mean there is no local innovation ecosystem.
Residential
Industrial
Mixed
Other
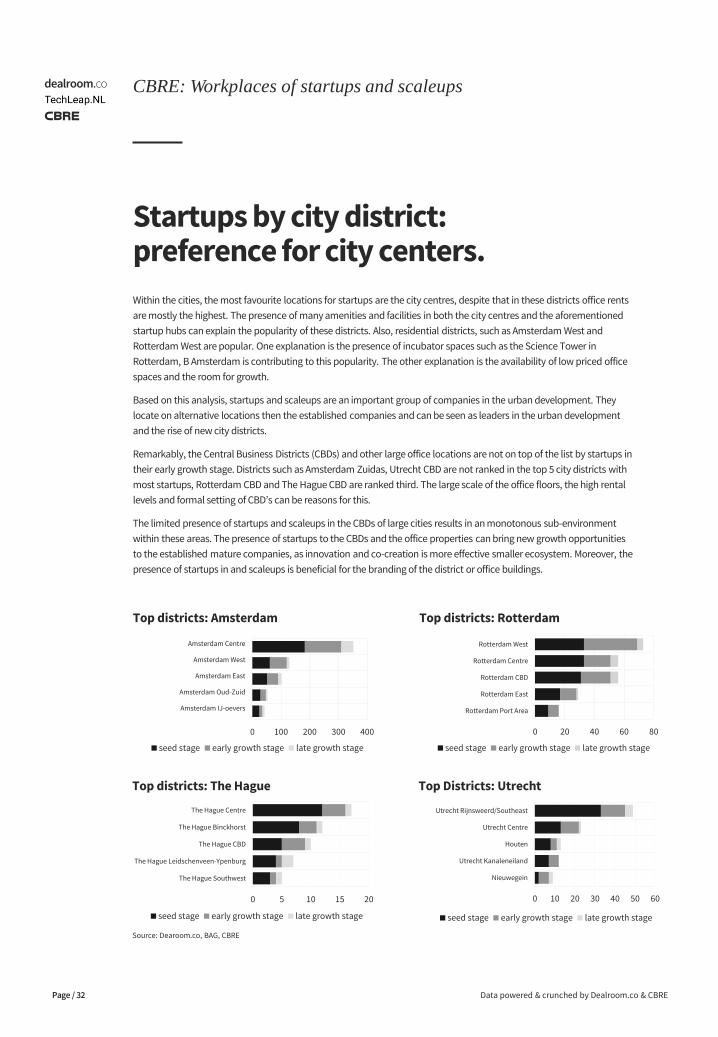
Startups by city district: preference for city centers.
Within the cities, the most favourite locations for startups are the city centres, despite that in these districts office rents
are mostly the highest. The presence of many amenities and facilities in both the city centres and the aforementioned
startup hubs can explain the popularity of these districts. Also, residential districts, such as Amsterdam West and
Rotterdam West are popular. One explanation is the presence of incubator spaces such as the Science Tower in
Rotterdam, B Amsterdam is contributing to this popularity. The other explanation is the availability of low priced office
spaces and the room for growth.
Based on this analysis, startups and scaleups are an important group of companies in the urban development. They
locate on alternative locations then the established companies and can be seen as leaders in the urban development
and the rise of new city districts.
Remarkably, the Central Business Districts (CBDs) and other large office locations are not on top of the list by startups in
their early growth stage. Districts such as Amsterdam Zuidas, Utrecht CBD are not ranked in the top 5 city districts with
most startups, Rotterdam CBD and The Hague CBD are ranked third. The large scale of the office floors, the high rental
levels and formal setting of CBD’s can be reasons for this.
The limited presence of startups and scaleups in the CBDs of large cities results in an monotonous sub-environment
within these areas. The presence of startups to the CBDs and the office properties can bring new growth opportunities
to the established mature companies, as innovation and co-creation is more effective smaller ecosystem. Moreover, the
presence of startups in and scaleups is beneficial for the branding of the district or office buildings.
Data powered & crunched by Dealroom.co & CBRE
CBRE: Workplaces of startups and scaleups
Page / 32
Top districts: Amsterdam
Top districts: The Hague
Source: Dearoom.co, BAG, CBRE
Top districts: Rotterdam
Top Districts: Utrecht
0 100 200 300 400
Amsterdam IJ-oevers
Amsterdam Oud-Zuid
Amsterdam East
Amsterdam West
Amsterdam Centre
seed stage early growth stage late growth stage
0 20 40 60 80
Rotterdam Port Area
Rotterdam East
Rotterdam CBD
Rotterdam Centre
Rotterdam West
seed stage early growth stage late growth stage
0 5 10 15 20
The Hague Southwest
The Hague Leidschenveen-Ypenburg
The Hague CBD
The Hague Binckhorst
The Hague Centre
seed stage early growth stage late growth stage
0 10 20 30 40 50 60
Nieuwegein
Utrecht Kanaleneiland
Houten
Utrecht Centre
Utrecht Rijnsweerd/Southeast
seed stage early growth stage late growth stage
Conclusions and recommendations by CBRE.
Data powered & crunched by Dealroom.co & CBRE
CBRE: Workplaces of startups and scaleups
Page / 33
Relevant for investors and developers:
• As startups are growing in size and maturity, they become occupiers that need to be on the agenda ofproperty developers and property investors.
• In urban development, startups are often seen as front runners. Their locational choices can be interpretedas the future established location for more businesses. This study shows that these locations are outside ofthe traditional CBDs and more likely to be in the city centre or in mixed use areas around the city centre.
• The demand for office space is characterised by (1) low cost and flexibility, but also (2) central urbanlocations, surrounded by amenities.
• The workplace demand of startups and scaleups is volatile. Successful startups and scaleups need a lot ofspace in a short period of time.
• The presence of startups and scaleups in an area or building contributes to branding of the area andbuilding. But is also can result in more tangible collaboration, business development and growth.
Relevant for governments:
• Startups and scaleups thrive in cities where the interaction between startups and scaleups, the localgovernment and knowledge institutions is successful. The presence of these three elements and theirinteraction should be facilitated.
• Startups and scaleups are increasingly contributing to the growth of local employment. They should be onthe agenda of urban planners when creating their office market policies.
• As the number of startups and scaleups is growing, their demand for physical space increases too. Startupsand scaleups compete with other users for the scarce urban space.
• Branding can contribute to the attractiveness of a city. Developing towards a certain specialism is beneficialfor the business growth within a city
• The availability of low cost workplaces coincides with more startups and scaleups being located in officebuildings.
• The presence of knowledge institutions and universities contributes the number of startups in city.
Relevant for corporate occupiers:
• Large corporates and startups need each other to innovate and grow. Geographical vicinity is one of the main enablers, hence understanding locational decision of startups is important for large and mature corporates.
• Large corporates compete for the same talent as startups and scaleups. Being located in the vicinity of startups and scaleups means that large corporates can benefit from the skills workers develop while working in a startup and scaleups.
Methodology & Appendix.How was this report was made?
Data powered & crunched by Dealroom.co
5.
Page / 34
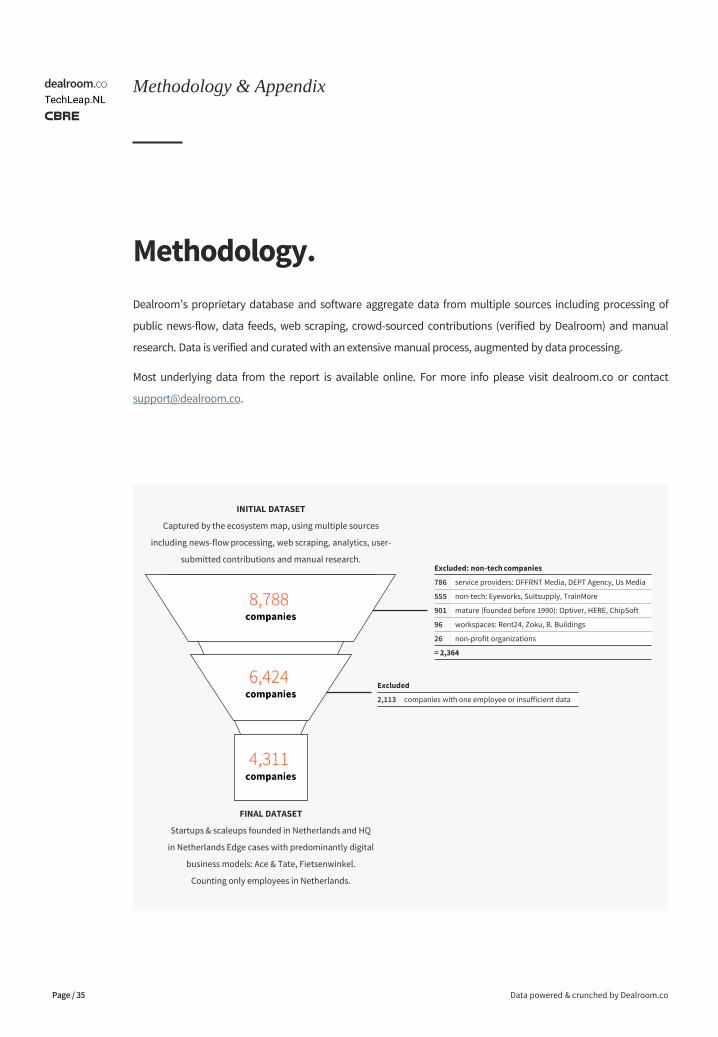
Excluded
2,113 companies with one employee or insufficient data
Excluded: non-tech companies
786 service providers: DFFRNT Media, DEPT Agency, Us Media
555 non-tech: Eyeworks, Suitsupply, TrainMore
901 mature (founded before 1990): Optiver, HERE, ChipSoft
96 workspaces: Rent24, Zoku, B. Buildings
26 non-profit organizations
= 2,364
Methodology.
Dealroom’s proprietary database and software aggregate data from multiple sources including processing of
public news-flow, data feeds, web scraping, crowd-sourced contributions (verified by Dealroom) and manual
research. Data is verified and curated with an extensive manual process, augmented by data processing.
Most underlying data from the report is available online. For more info please visit dealroom.co or contact
Data powered & crunched by Dealroom.co
Methodology & Appendix
Page / 35
INITIAL DATASET
Captured by the ecosystem map, using multiple sources
including news-flow processing, web scraping, analytics, user-
submitted contributions and manual research.
FINAL DATASET
Startups & scaleups founded in Netherlands and HQ
in Netherlands Edge cases with predominantly digital
business models: Ace & Tate, Fietsenwinkel.
Counting only employees in Netherlands.
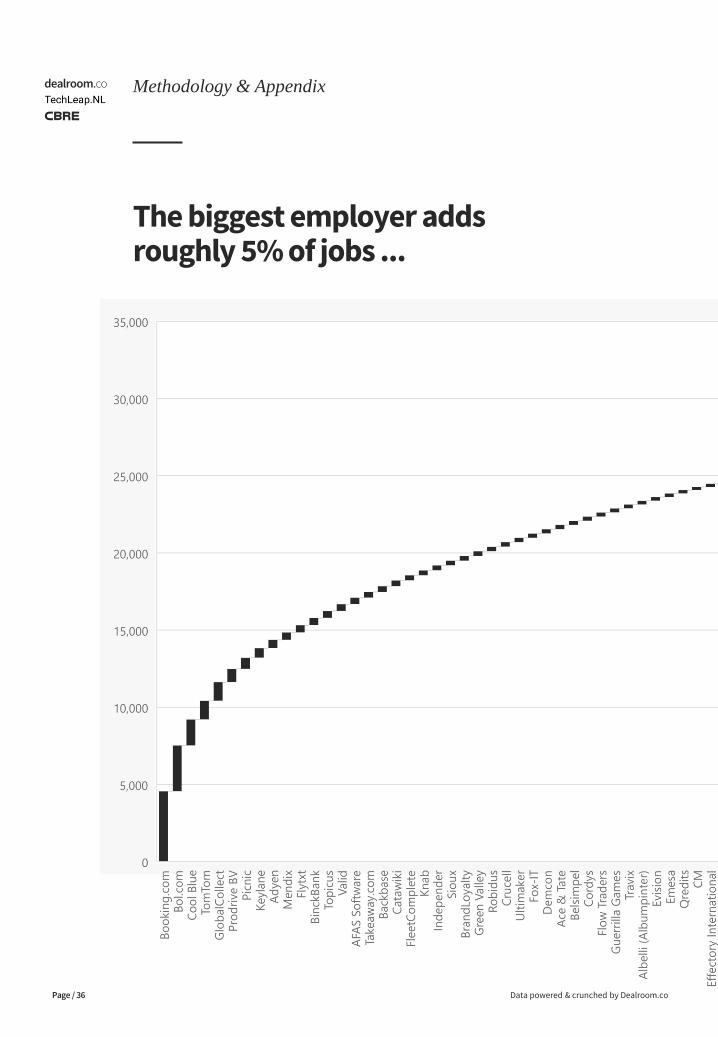
The biggest employer adds roughly 5% of jobs ...
Data powered & crunched by Dealroom.co
Methodology & Appendix
Page / 36
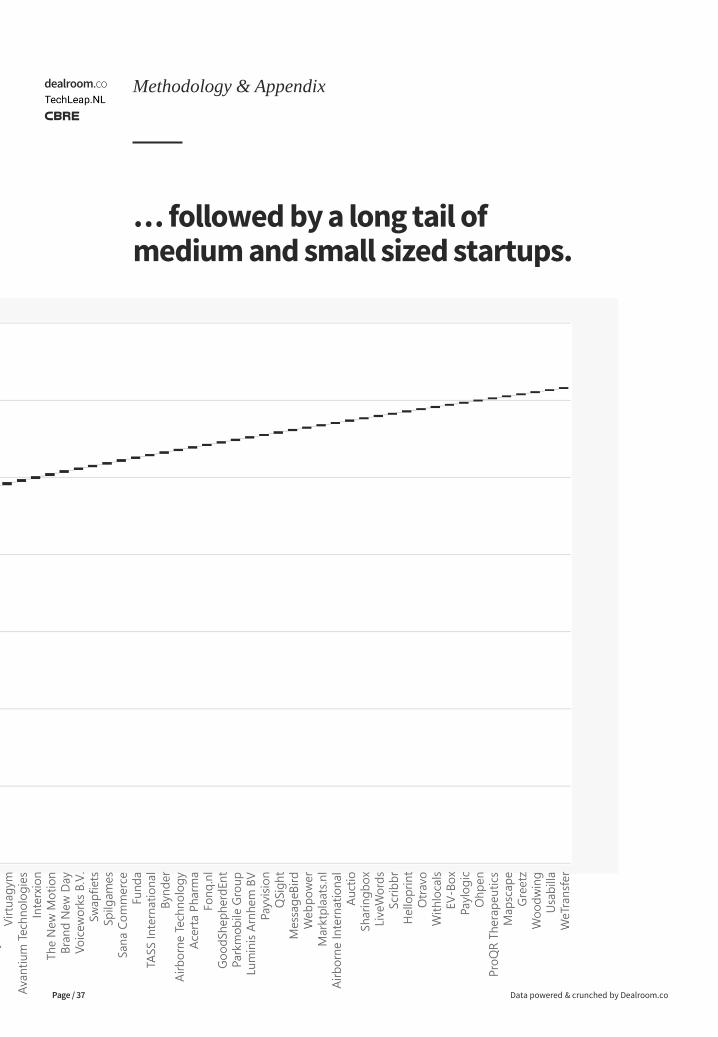
… followed by a long tail of medium and small sized startups.
Data powered & crunched by Dealroom.co
Methodology & Appendix
Page / 37
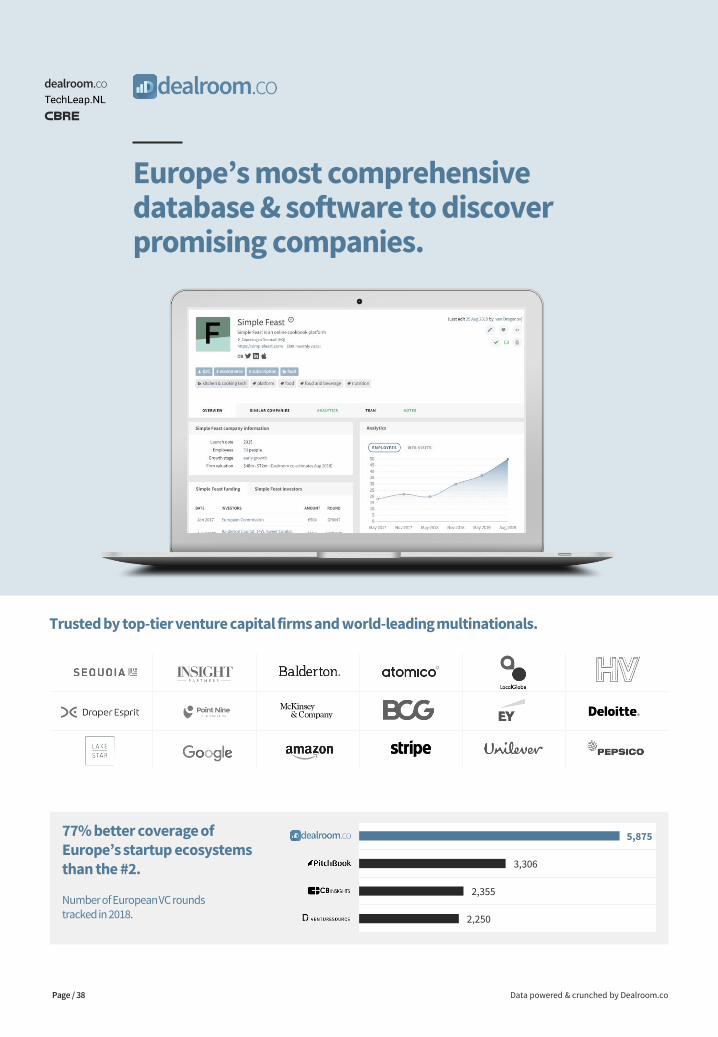
Europe’s most comprehensive database & software to discover promising companies.
Data powered & crunched by Dealroom.coPage / 38
Trusted by top-tier venture capital firms and world-leading multinationals.
77% better coverage of Europe’s startup ecosystems than the #2.
Number of European VC rounds tracked in 2018.
5,875
3,306
2,355
2,250
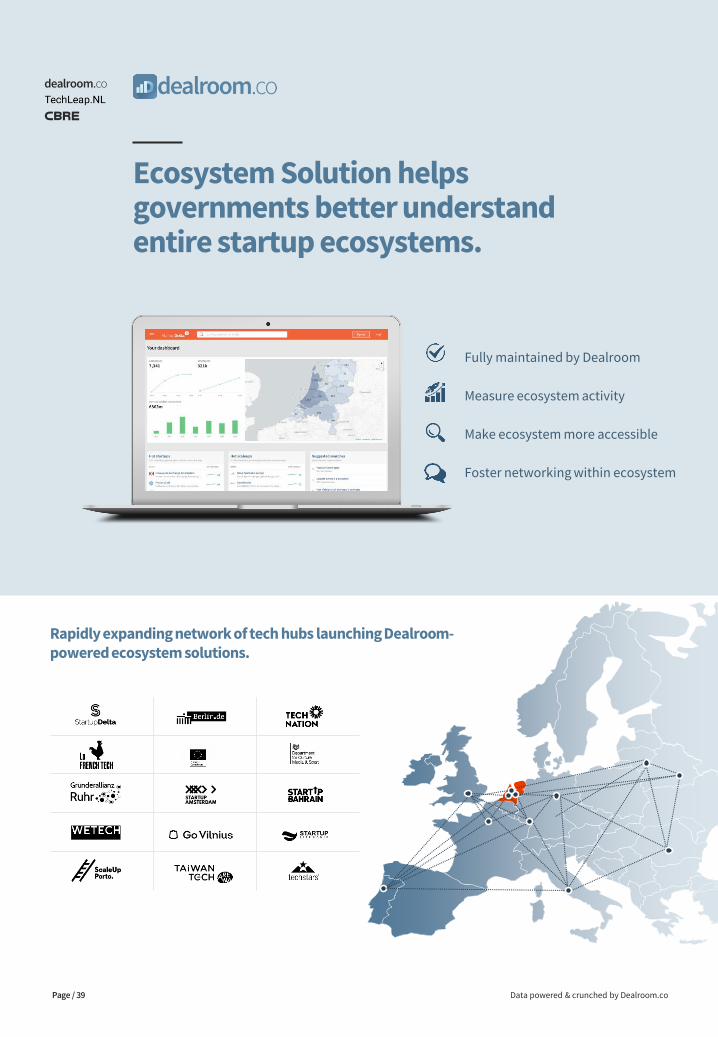
Ecosystem Solution helps governments better understand entire startup ecosystems.
Data powered & crunched by Dealroom.coPage / 39
39
Rapidly expanding network of tech hubs launching Dealroom-powered ecosystem solutions.
Fully maintained by Dealroom
Measure ecosystem activity
Make ecosystem more accessible
Foster networking within ecosystem
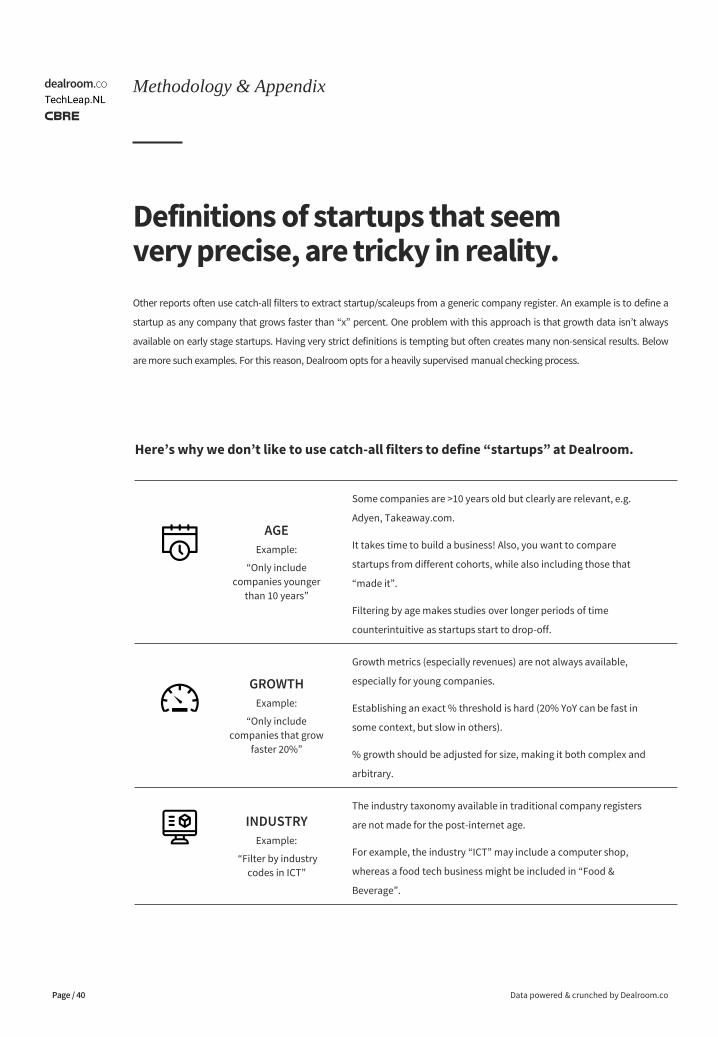
Definitions of startups that seem very precise, are tricky in reality.
Other reports often use catch-all filters to extract startup/scaleups from a generic company register. An example is to define a
startup as any company that grows faster than “x” percent. One problem with this approach is that growth data isn’t always
available on early stage startups. Having very strict definitions is tempting but often creates many non-sensical results. Below
are more such examples. For this reason, Dealroom opts for a heavily supervised manual checking process.
Data powered & crunched by Dealroom.co
Methodology & Appendix
Page / 40
Here’s why we don’t like to use catch-all filters to define “startups” at Dealroom.
AGE
Example:
“Only include
companies younger
than 10 years”
Some companies are >10 years old but clearly are relevant, e.g.
Adyen, Takeaway.com.
It takes time to build a business! Also, you want to compare
startups from different cohorts, while also including those that
“made it”.
Filtering by age makes studies over longer periods of time
counterintuitive as startups start to drop-off.
GROWTH
Example:
“Only include
companies that grow
faster 20%”
Growth metrics (especially revenues) are not always available,
especially for young companies.
Establishing an exact % threshold is hard (20% YoY can be fast in
some context, but slow in others).
% growth should be adjusted for size, making it both complex and
arbitrary.
INDUSTRY
Example:
“Filter by industry
codes in ICT”
The industry taxonomy available in traditional company registers
are not made for the post-internet age.
For example, the industry “ICT” may include a computer shop,
whereas a food tech business might be included in “Food &
Beverage”.
This report is brought to you by:
Founded in Amsterdam in 2013, Dealroom is a global database providing insights on innovative
companies and venture capital investment. Its software, database and bespoke research
enable its clients to stay at the forefront of innovation, discover promising companies and
identify strategic opportunities. Among its clients are world-leading consulting firms,
investment banks, multinationals, tech firms, venture capital & buyout firms and governments.
Data powered & crunched by Dealroom.coPage / 41
At TechLeap.NL, it is our mission to establish the Netherlands as the ideal place to start, scale,
and internationalize innovative businesses. With our unique connection to the government,
corporations, investment funds, startups, and innovation hubs, we aim to merge the Dutch
startup ecosystem into one single connected and ambitious hub. We break down barriers and
improve access to talent, capital and markets.
CBRE Group, Inc. (NYSE:CBRE), a Fortune 500 and S&P 500 company headquartered in Los
Angeles, is the world’s largest commercial real estate services and investment firm (based on
2018 revenue). CBRE offers a broad range of integrated services, including facilities, transaction
and project management; property management; investment management; appraisal and
valuation; property leasing; strategic consulting; property sales; mortgage services and
development services.
Data powered & crunched by Dealroom.co