Embed Size (px)
Citation preview

Starting the Journey
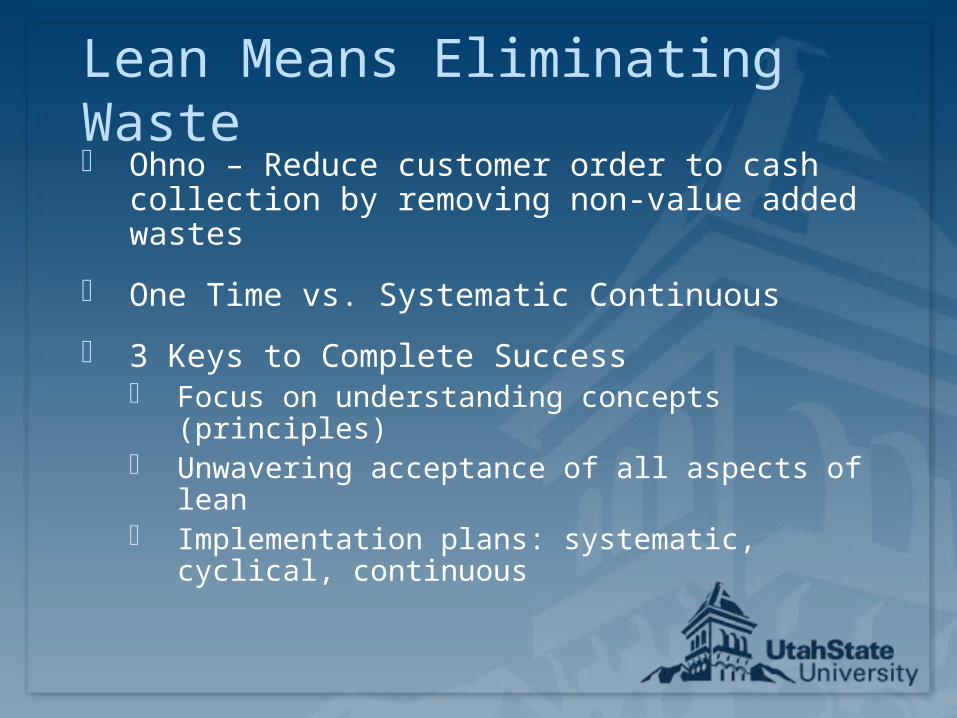
Lean Means Eliminating Waste Ohno – Reduce customer order to cash
collection by removing non-value added wastes
One Time vs. Systematic Continuous
3 Keys to Complete Success Focus on understanding concepts (principles) Unwavering acceptance of all aspects of lean Implementation plans: systematic, cyclical,
continuous
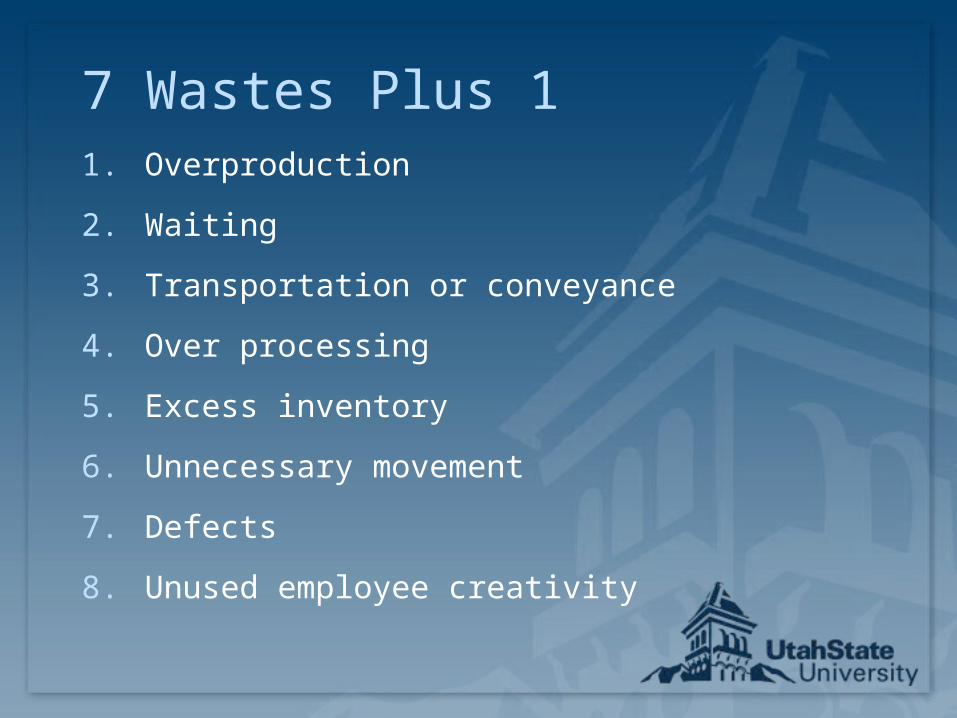
7 Wastes Plus 11. Overproduction
2. Waiting
3. Transportation or conveyance
4. Over processing
5. Excess inventory
6. Unnecessary movement
7. Defects
8. Unused employee creativity
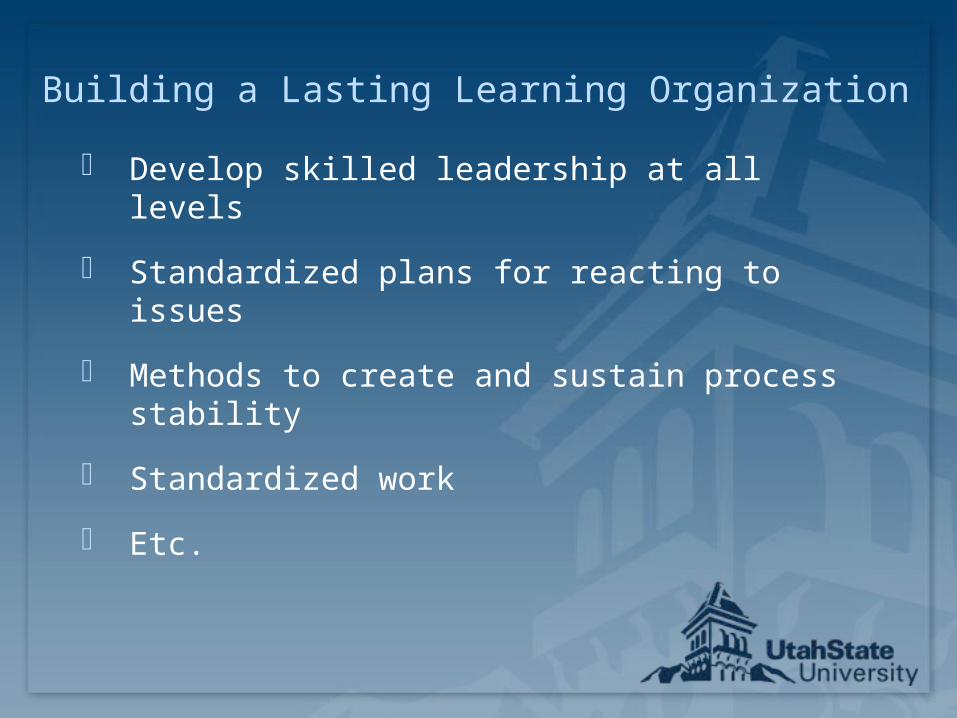
Building a Lasting Learning Organization
Develop skilled leadership at all levels
Standardized plans for reacting to issues
Methods to create and sustain process stability
Standardized work
Etc.
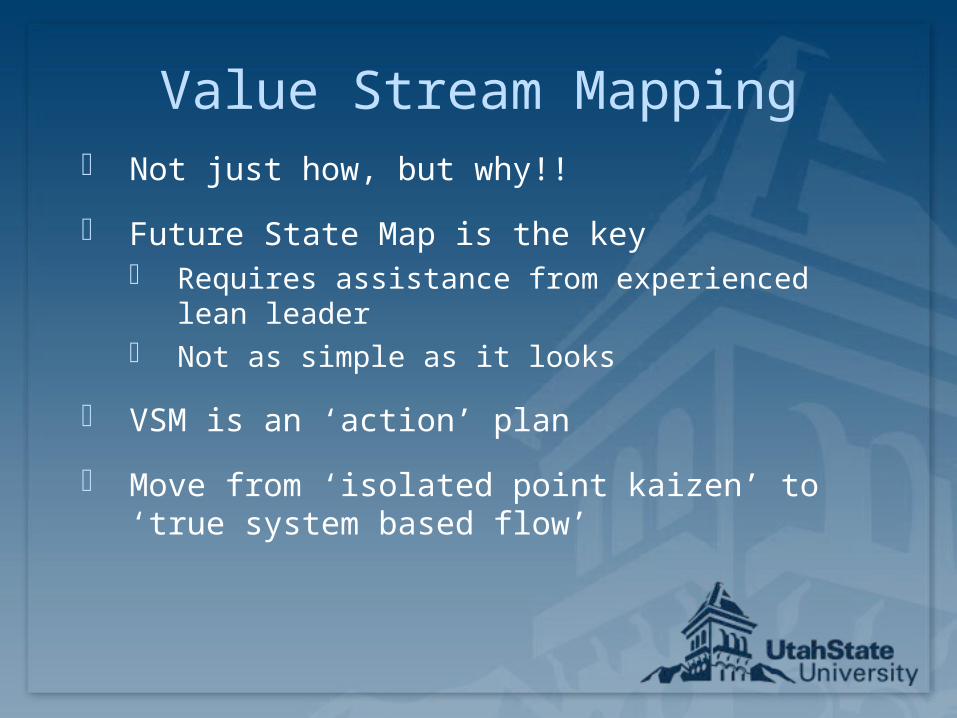
Value Stream Mapping Not just how, but why!!
Future State Map is the key Requires assistance from experienced lean
leader Not as simple as it looks
VSM is an ‘action’ plan
Move from ‘isolated point kaizen’ to ‘true system based flow’
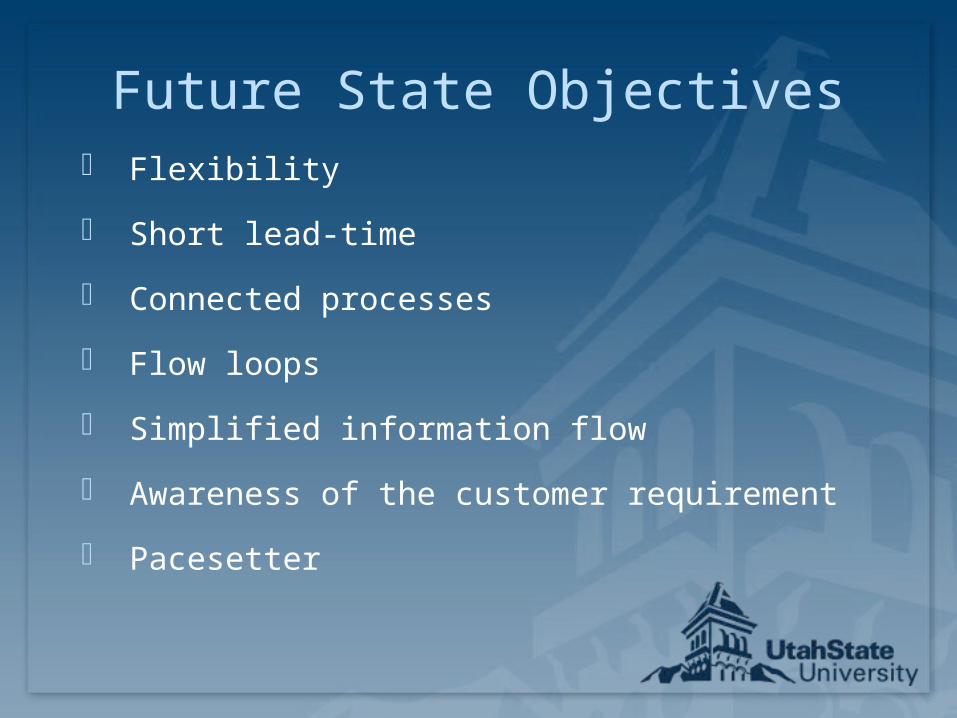
Future State Objectives Flexibility
Short lead-time
Connected processes
Flow loops
Simplified information flow
Awareness of the customer requirement
Pacesetter
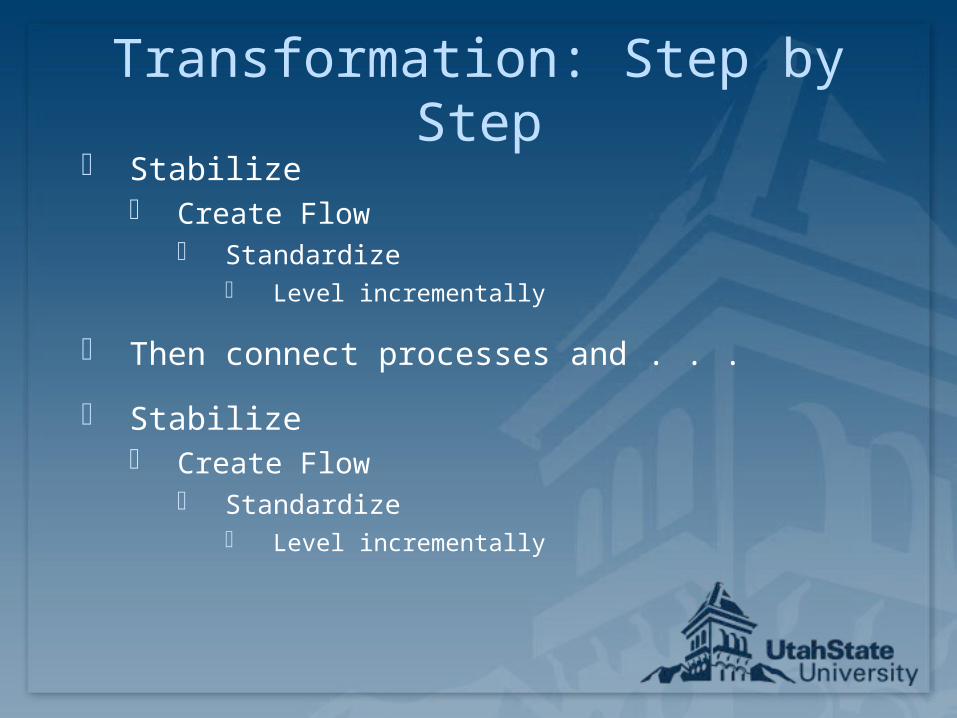
Transformation: Step by Step Stabilize
Create Flow Standardize
Level incrementally
Then connect processes and . . .
Stabilize Create Flow
Standardize Level incrementally
What’s Next? Creating Stability
Developing Flow
Standardize
Level Incrementally

9
Value Stream Mapping
10
Whenever there is a product for a customer, there is a
value stream. The challenge lies in seeing it
(from Learning to See)
11
Outlook
Introduction to Value-Stream Mapping
The Current-State Map
Future lessons: What Makes a Value Stream Lean The Future-State Map Achieving the Future State Map
12
Getting Started
What is Value-Stream Mapping?
Material and Information Flow
Selecting a Product Family
The Value-Stream Manager
Using the Mapping Tool
13
What is Value-Stream Mapping
Value stream: Actions required to bring a product through the main flows essential to every product: Production flow from raw material to customer
delivery Design flow from concept to launch
Different levels of value-stream mapping
14
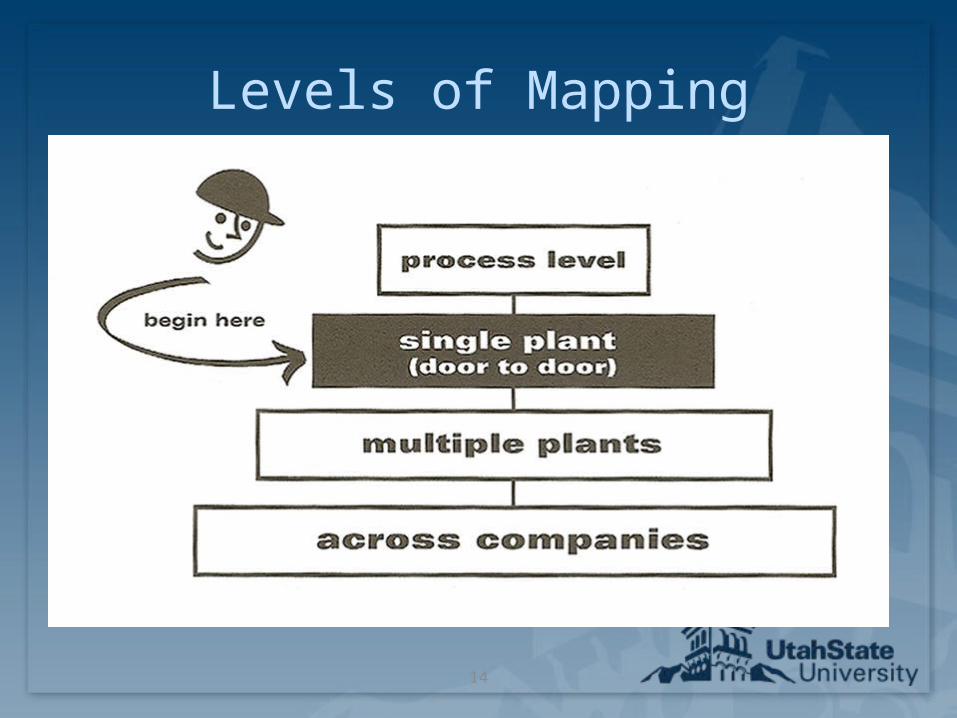
Levels of Mapping
15
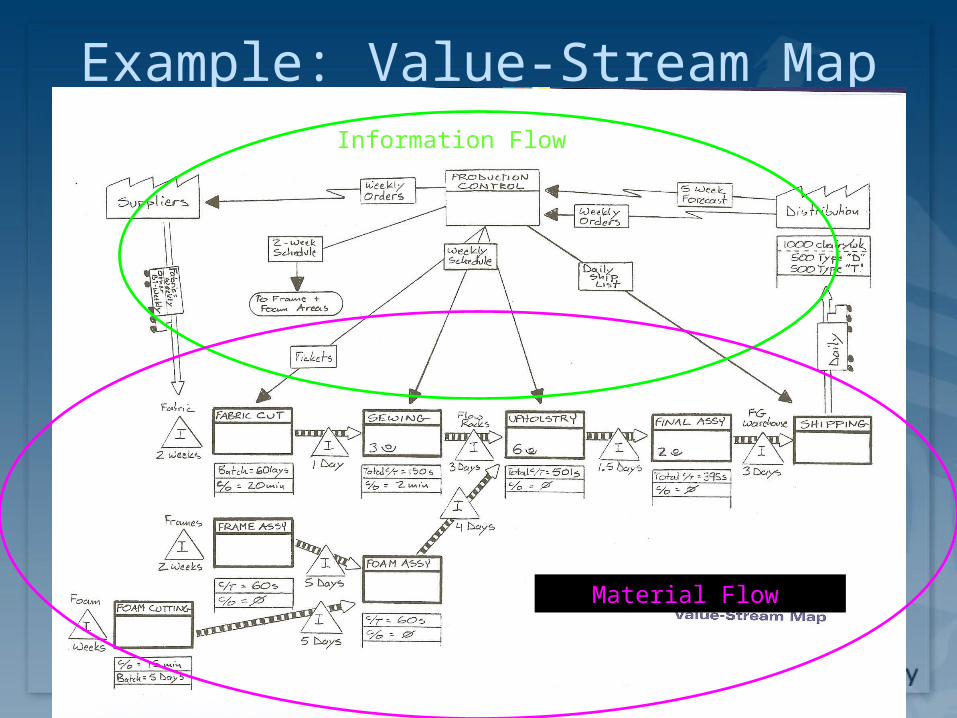
Example: Value-Stream MapInformation Flow
Material Flow
16
Why Value Stream Mapping?
Visualizes current flow
Shows waste
Communication tool
Provides basis for improvement
Shows linkage between information and material flow
Ultimate goal: Reduce lead time
17
Who is Responsible?
VSM crosses organizational boundaries
Need one person with lead responsibility for product family’s value stream
High level executive (often plant manager) or value-stream manager
18
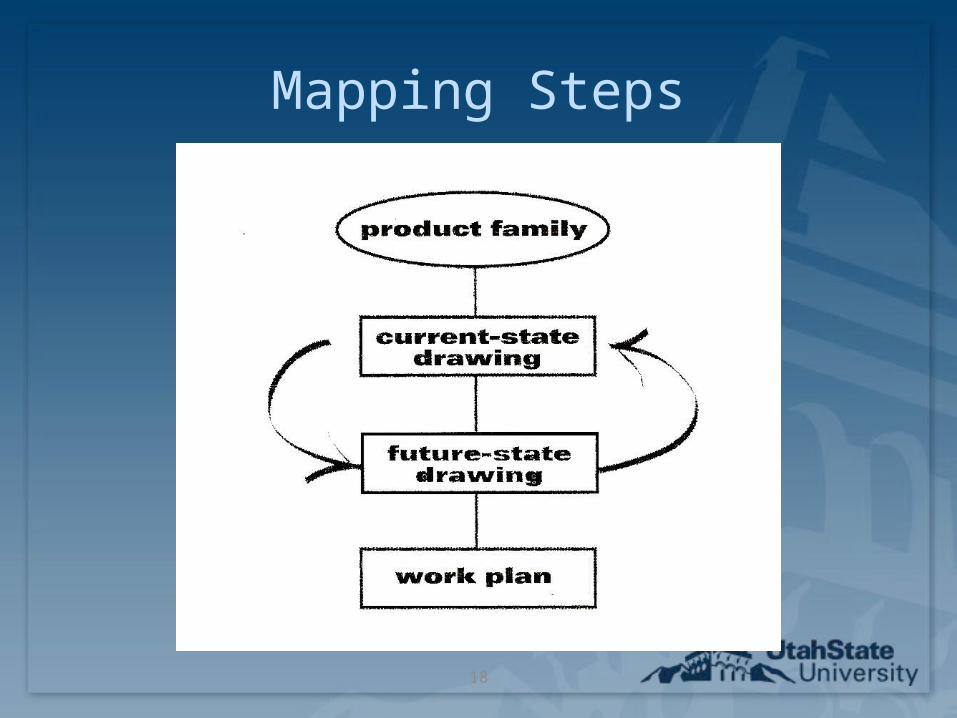
Mapping Steps
19
Summary – Getting Started
Select a product family
Have one person personally lead the mapping effort
Begin at the “door-to-door” level
Consider material and information flows
20
Current-State Map
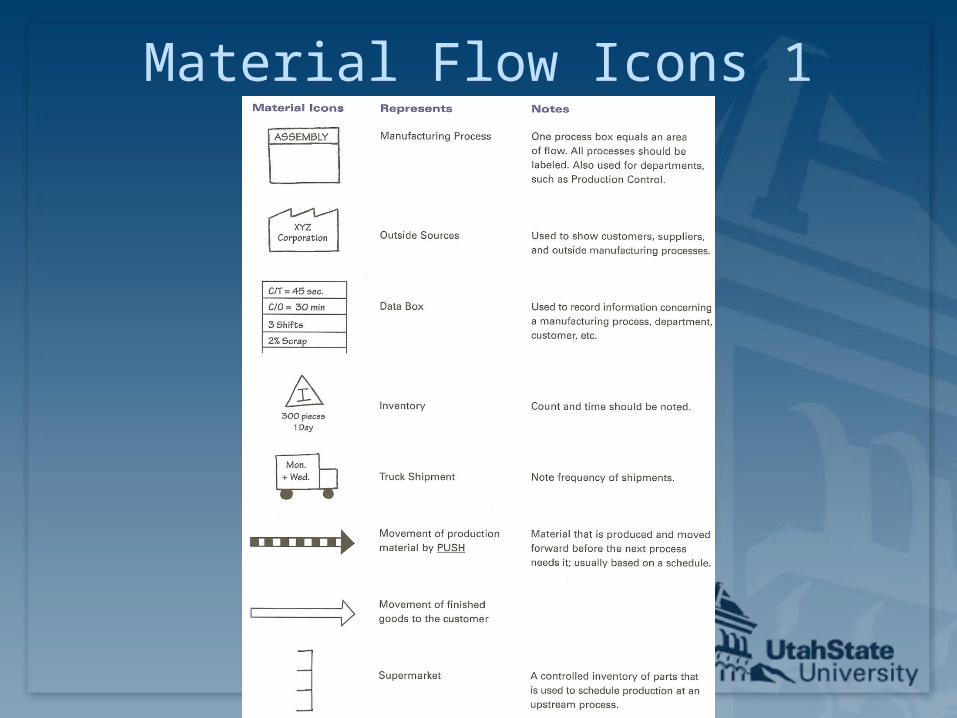
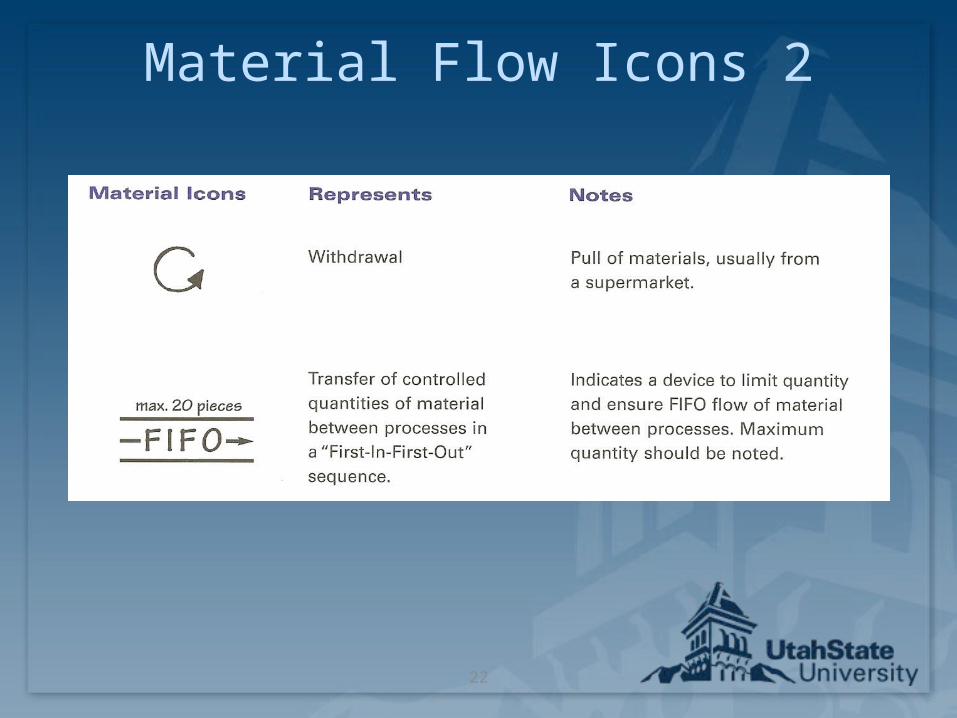
Material Flow Icons
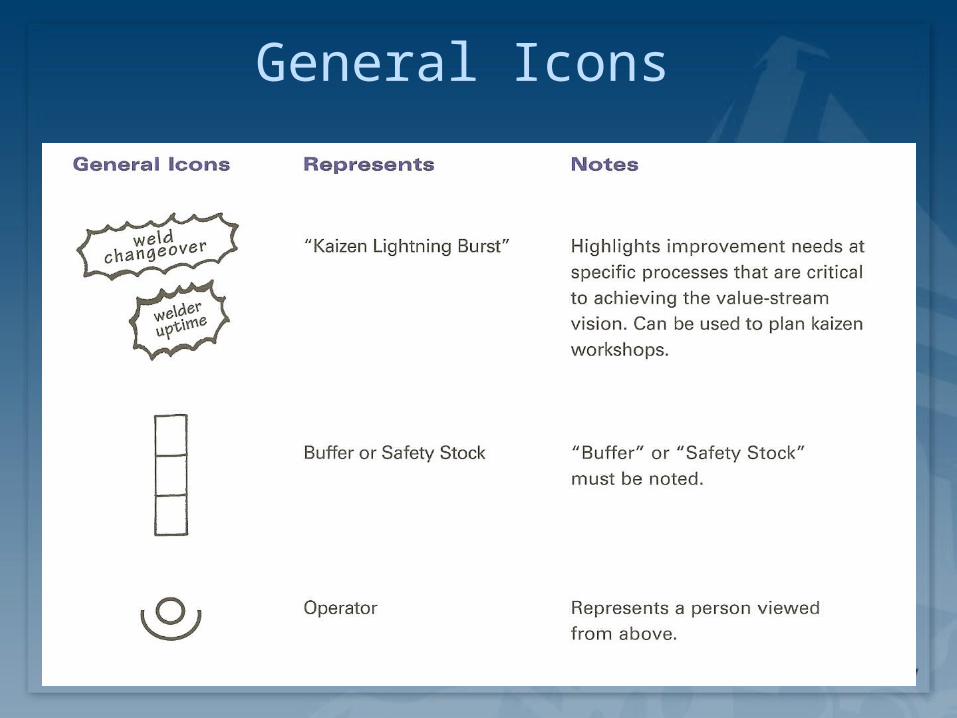
General Icons
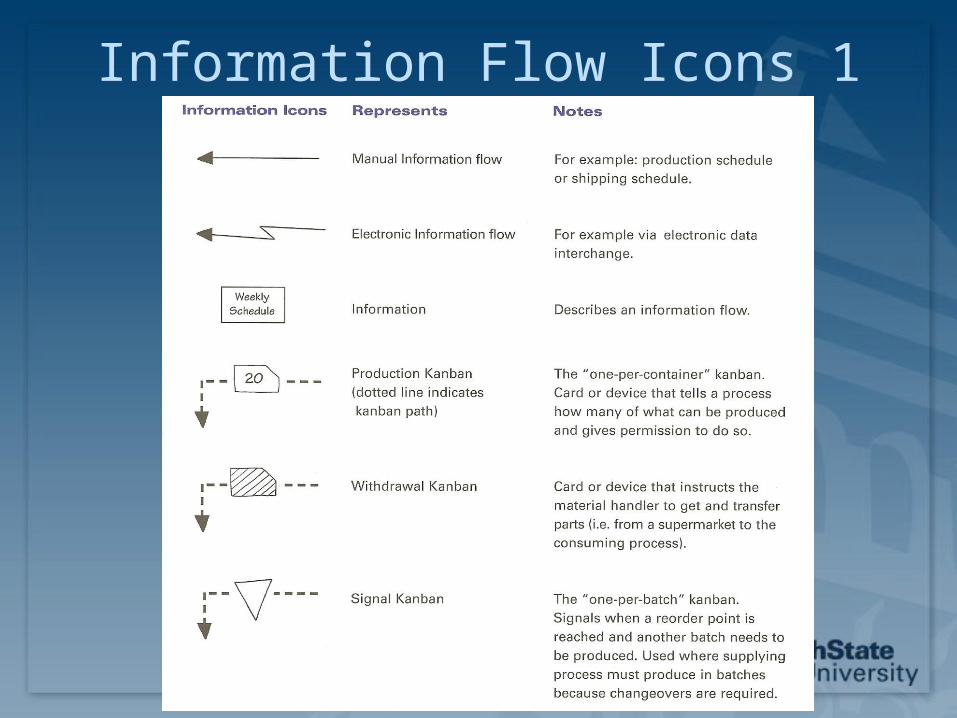
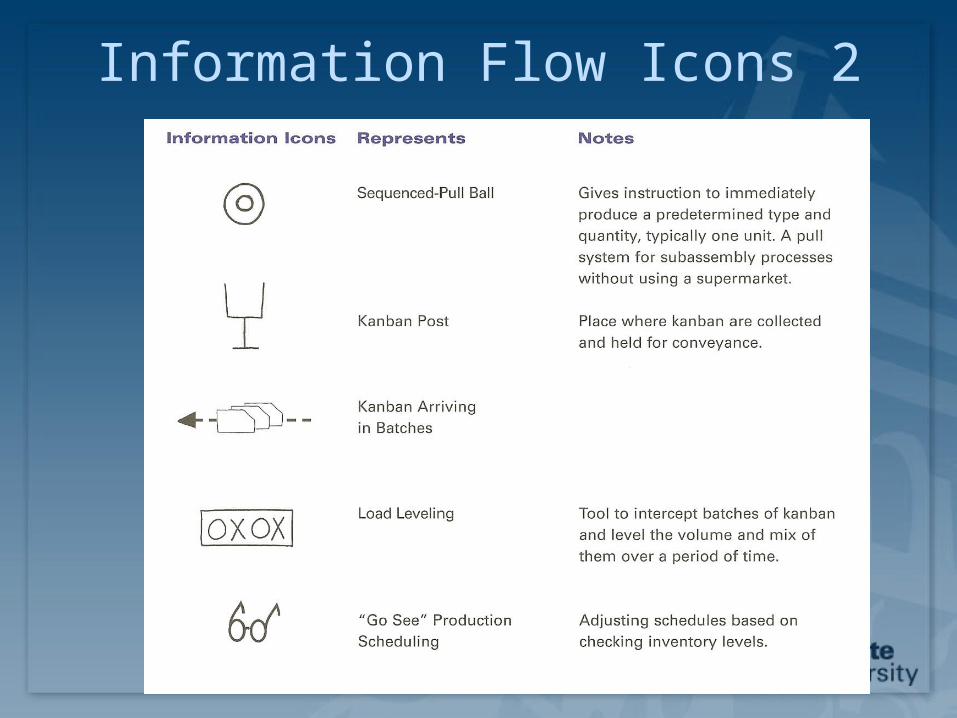
Information Flow Icons
21
Material Flow Icons 1
22
Material Flow Icons 2
23
Information Flow Icons 1
24
Information Flow Icons 2
25
General Icons
26
Mapping Tips
Always collect current-state information while walking along the actual pathways of material and information flows yourself
Begin with quick walk along the entire door-to-door value stream
Begin at shipping and work upstream
Bring your stopwatch and do not rely on standard times or information that you do not personally obtain
Map the whole value stream yourself
Always draw by hand in pencil
27
Draw by Hand in Pencil
No delay
You can do it yourself
Focus on understanding flow
Keep eraser handy
28
Steps in Drawing VSM
1. Customer
2. Processes, Data boxes and Inventory
3. Material Flow
4. Information Flow and Push Arrows
5. Timeline
29
Current-State Mapping Example
ACME Stamping Stamped-steel steering brackets
Hold the steering column to the body of a car Two versions: Left-hand side and right-hand-side
30
1. Mapping Customer Requirements
Customer: State Street Assembly
Two shifts
18,400 steering brackets per month 12,000 left-hand 6,400 right-hand
Palletized returnable tray packaging 20 brackets per tray Up to 10 trays per pallet Customer orders in multiples of trays
31
2. Basic Production Processes
1. Processes
2. Data Boxes
3. Inventory
32
2. 1. Processes ACME
Stamping
Spot-Welding Workstation 1
Spot-Welding Workstation 2
Assembly Workstation 1
Assembly Workstation 2
Shipping
33
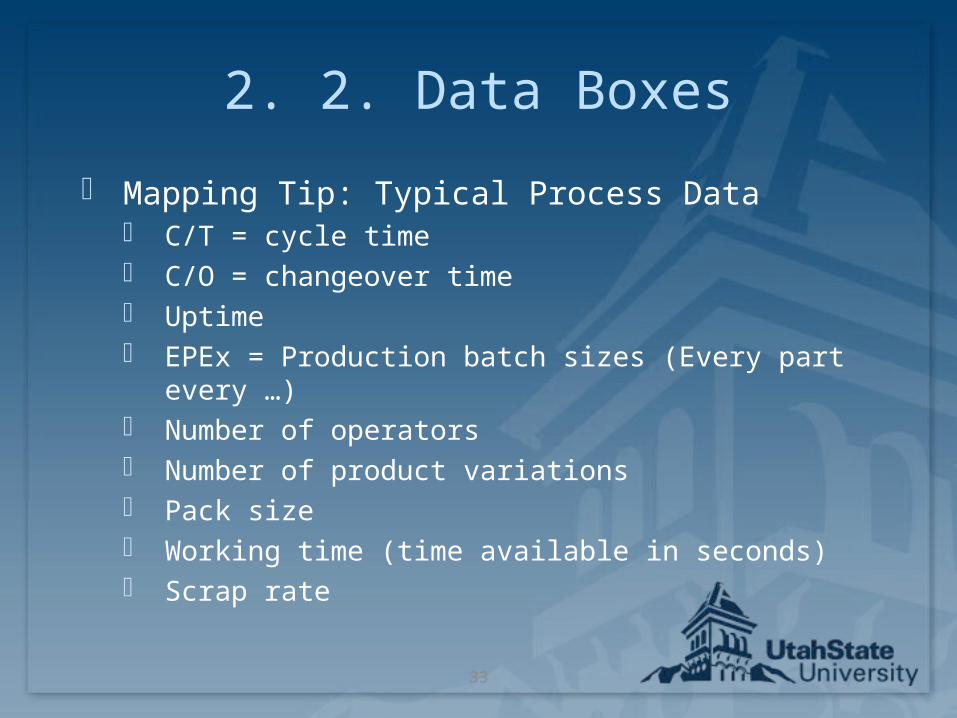
2. 2. Data Boxes
Mapping Tip: Typical Process Data C/T = cycle time C/O = changeover time Uptime EPEx = Production batch sizes (Every part every
…) Number of operators Number of product variations Pack size Working time (time available in seconds) Scrap rate
34
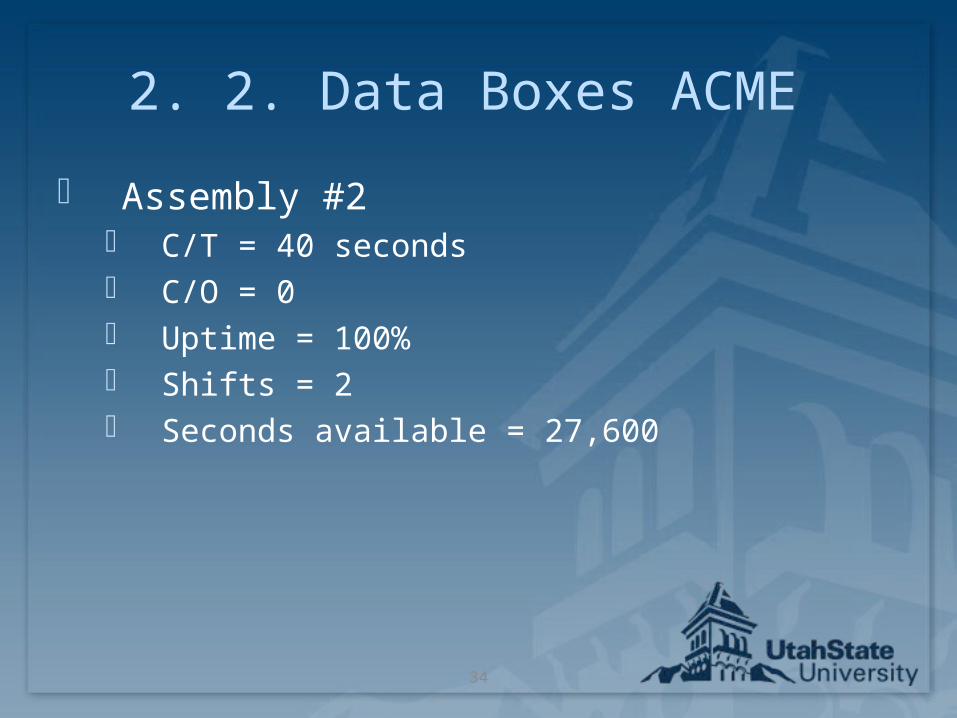
2. 2. Data Boxes ACME
Assembly #2 C/T = 40 seconds C/O = 0 Uptime = 100% Shifts = 2 Seconds available = 27,600
35
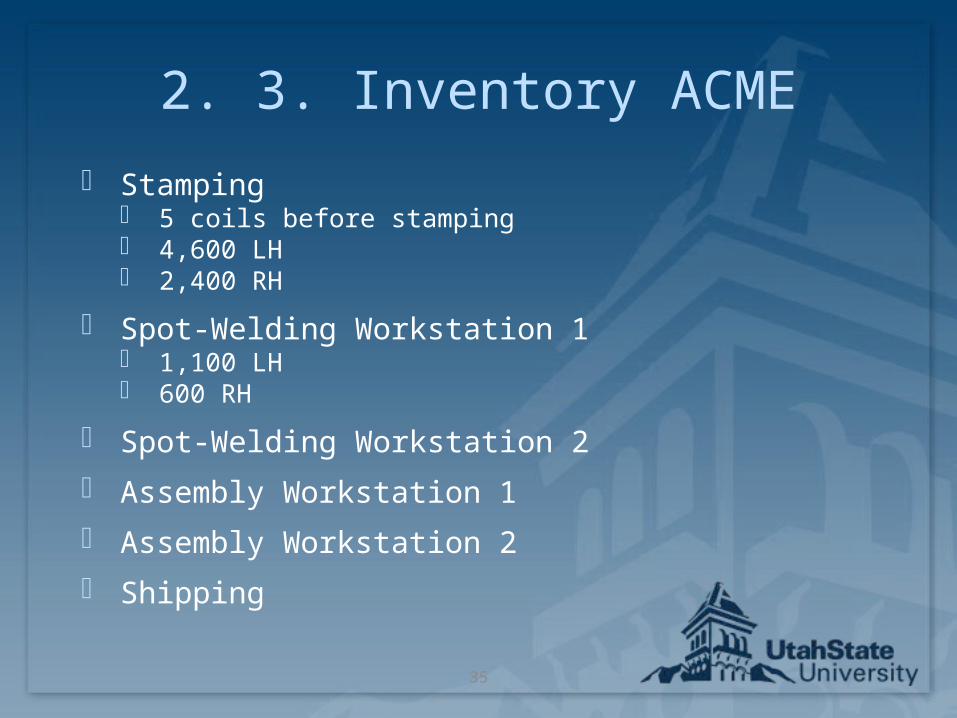
2. 3. Inventory ACME
Stamping 5 coils before stamping 4,600 LH 2,400 RH
Spot-Welding Workstation 1 1,100 LH 600 RH
Spot-Welding Workstation 2
Assembly Workstation 1
Assembly Workstation 2
Shipping
36
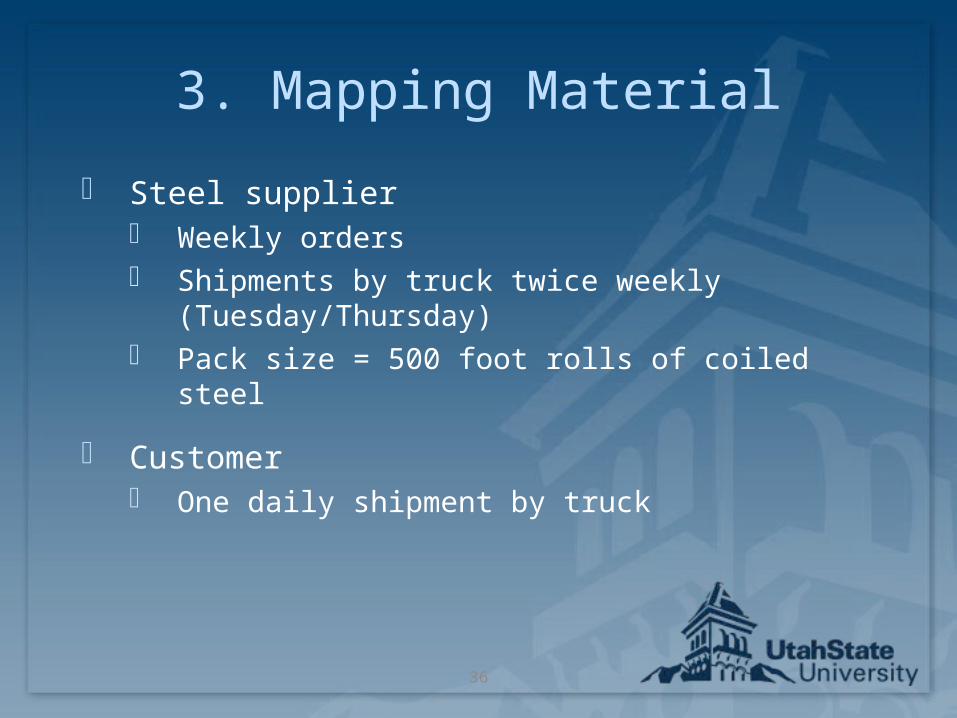
3. Mapping Material
Steel supplier Weekly orders Shipments by truck twice weekly
(Tuesday/Thursday) Pack size = 500 foot rolls of coiled steel
Customer One daily shipment by truck
37
4. Mapping the Information Flow
Right to left, top half of the map space
ACME: MRP system to schedule shop floor
“Go see” scheduling
38
5. Draw Time Ladder
Upper line = production lead time Calculation inventory lead time =
inventory quantity/daily customer requirements
Lower line = processing time
Summarizes current conditions of value-stream
Which time is value adding?
39
Problems
Production lead time > Processing time Financial Quality Flexibility
40
In-class exercise
Divide into teams from simulation exercise
Develop current-state map for simulation
41
Individual Homework 1 5%
Draw Current-State map for TWI Industries
Due Monday