Embed Size (px)
Citation preview
J U N E 2 0 1 3
Report prepared for theEducation Quality and Accountability Offi ce (EQAO) by
Ruth C. Calman, M.A.Patricia J. Crawford, Ed.D.
Starting Early: Teaching, Learning and AssessmentLinking early-childhood development with academic outcomes—a detailed look
Acknowledgement
EQAO worked in partnership with researchers from the Offord Centre for Child Studies, McMaster University. The authors would like to thank the following people for their assistance in the development of this paper.
EQAO
Michael Kozlow, Ph.D., Director, Data and Support ServicesEbby Madera, Ph.D., PsychometricianYunmei Xu, Ph.D., PsychometricianTim Steele, Data Analyst
Offord Centre for Child Studies, McMaster University
Magdalena Janus, Ph.D., Associate ProfessorScott Davies, Ontario Research Chair in Educational Achievement and At-Risk Students and Professor SociologyEric Duku, Senior Statistician
About the Education Quality and Accountability Office
The Education Quality and Accountability Office (EQAO) is an independent provincial agency funded by the Government of Ontario. EQAO’s mandate is to conduct province-wide tests at key points in every student’s primary, junior and secondary education and report the results to educators, parents and the public.
EQAO acts as a catalyst for increasing the success of Ontario students by measuring their achievement in reading, writing and mathematics in relation to Ontario Curriculum expectations. The resulting data provide a gauge of quality and accountability in the Ontario education system.
The objective and reliable assessment results are evidence that adds to current knowledge about student learning and serves as an important tool for improvement at all levels: for individual students, schools, boards and the province.
About EQAO Research
EQAO undertakes research for two main purposes:
• to maintain best-of-class practices and to ensure that the agency remains at the forefront of large-scale assessment and
• to promote the use of EQAO data for improved student achievement through the investigation of means to inform policy directions and decisions made by educators, parents and the government.
EQAO research projects delve into the factors that influence student achievement and education quality, and examine the statistical and psychometric processes that result in high-quality assessment data.
Education Quality and Accountability Office, 2 Carlton Street, Suite 1200, Toronto ON M5B 2M9, 1-888-327-7377, www.eqao.com
© 2013 Queen’s Printer for OntarioISBN: 978-1-4606-0417-5 (PDF)ISBN: 978-1-4606-0416-8 (Print)
The scientifi c evidence—ranging from
behavioral genetics and neuroscience
to policy analysis and intervention
research—on the signifi cant developmental
impacts of early experiences, caregiving
relationships, and environmental threats is
incontrovertible. Virtually every aspect of
early human development, from the brain’s
evolving circuitry to the child’s capacity for
empathy, is affected by the environments
and experiences that are encountered in a
cumulative fashion, beginning early in the
prenatal period and extending throughout
the early childhood years.
(Shonkoff and Phillips, 2000)
A child’s early development is sensitive to
socio-economic and environmental factors
that contribute to inequalities in health,
education and life. Comprehensive
population-based assessments combined
with other data can guide the creations
of responsive public policies.
(McCain, Mustard and Shanker, 2007)
Purpose
This report presents detailed information and insights obtained from a research study in which the Education
Quality and Accountability Offi ce (EQAO) linked students’ Early Development Instrument assessment results in
kindergarten (Janus et al., 2007) to their provincial reading, writing and mathematics assessment results in Grade 3.
An abbreviated version of this research can be found in the EQAO Research section at www.eqao.com.
1 Starting Early: Teaching, Learning and Assessment
Effective teaching ensures the steady
progress of all students, regardless of
their starting point. Information about the
early development of children who are
entering the school system can provide
important insights on how to structure
programs and supports that will give all
students the best possible start.
The substantive impact of early-life experiences on child development has been well documented in many studies over the years and across many different cultures and countries (Shonkoff and Phillips, 2000; OECD, 2006).
In Canada, two major studies (Early Years
Study: Reversing the Real Brain Drain,
1999 and Early Years Study 2: Putting Science
into Action, 2007) have served not only to
draw together research from many sources
documenting the life-long impact of early-
childhood experiences, but also to explain
from a biological perspective how and why
these early experiences shape the behaviour,
health and learning capacities of our youth.
The relatively new field of epigenetics1 has
revealed that our genetic makeup is subject
to modification based on experience and that
brain development, or the neural wiring that
takes place in the first few years of life, has
life-long consequences in terms of behaviour,
health and learning capacity. Science has
developed to the point that we not only know
that early-childhood stimulation is important,
particularly during sensitive periods in brain
development, but we can document precisely
how this early stimulation affects neural
pathways and, technically speaking, “genome
functioning,” sometimes thought of as control
switches that turn genes on or off. By providing
nurturing and stimulating early-childhood
experiences, we can significantly enhance
genome functioning, thereby optimizing
children’s learning capabilities.
Even more remarkable is the evidence that changes in genome function, affected by these early-life experiences, can be passed from one generation to the next. The old “nature-nurture” paradigm is now based on a new scientific understanding of the human genome. We are not simply the sums of the DNA that we inherit from our parents. Early-life experience impacts how our genome works. We can now measure these effects and we can modify them. (See McCain, Mustard and Shanker, 2007 for a more detailed review.)
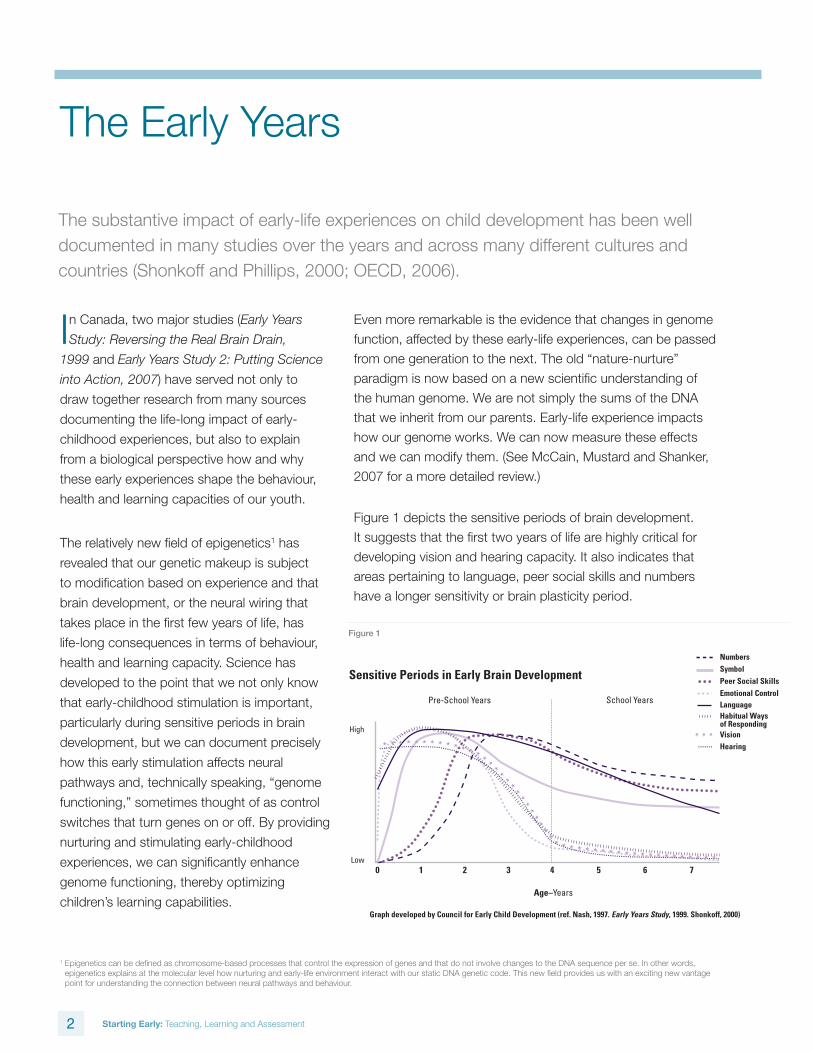
Figure 1 depicts the sensitive periods of brain development. It suggests that the first two years of life are highly critical for developing vision and hearing capacity. It also indicates that areas pertaining to language, peer social skills and numbers have a longer sensitivity or brain plasticity period.
The Early Years
Sensitive Periods in Early Brain Development
NumbersSymbolPeer Social SkillsEmotional ControlLanguageHabitual Waysof RespondingVisionHearing
0
School Years
1 2 3 4 5 6 7
Graph developed by Council for Early Child Development (ref. Nash, 1997. Early Years Study, 1999. Shonkoff, 2000)
Age–Years
2 Starting Early: Teaching, Learning and Assessment
1 Epigenetics can be defined as chromosome-based processes that control the expression of genes and that do not involve changes to the DNA sequence per se. In other words, epigenetics explains at the molecular level how nurturing and early-life environment interact with our static DNA genetic code. This new field provides us with an exciting new vantage point for understanding the connection between neural pathways and behaviour.
Figure 1
An understanding of the importance of
the early years has prompted a myriad
of studies evaluating the impact of early
interventions on child development, educational
attainment and other short- and long-term
outcomes of a social, economic and
educational nature. Of particular interest are
several longitudinal studies conducted over
the past 20 years that have documented the
positive effects of early-intervention programs
on later educational attainment. These have
included the Chicago Longitudinal Study of
children ages three to nine, which offered
child-parent centres in or near public
elementary schools, and the Perry Preschool
Project, which provided integrated preschool
programs for three- and four-year-old African-
American children born in poverty. Both studies
documented higher levels of educational
attainment for children who participated than
for those in comparison groups (McCain et
al., 2007).
In addition, the landmark Abecedarian Project
in North Carolina studied four cohorts of poor
children who were randomly assigned as
infants to an early-intervention educational
group or a control group. Children’s progress
was monitored over time with follow-up studies
conducted at ages 12, 15 and 21. Children
who participated in the early-intervention program had higher
cognitive test scores from the toddler years to age 21, attained
higher-level reading and math skills from the primary grades through
young adulthood, and completed more years of education. The
investigators also concluded that enhanced language development
among the early-intervention group was instrumental in raising
cognitive test scores (retrieved from: http://projects.fpg.unc.
edu/~abc/#home).
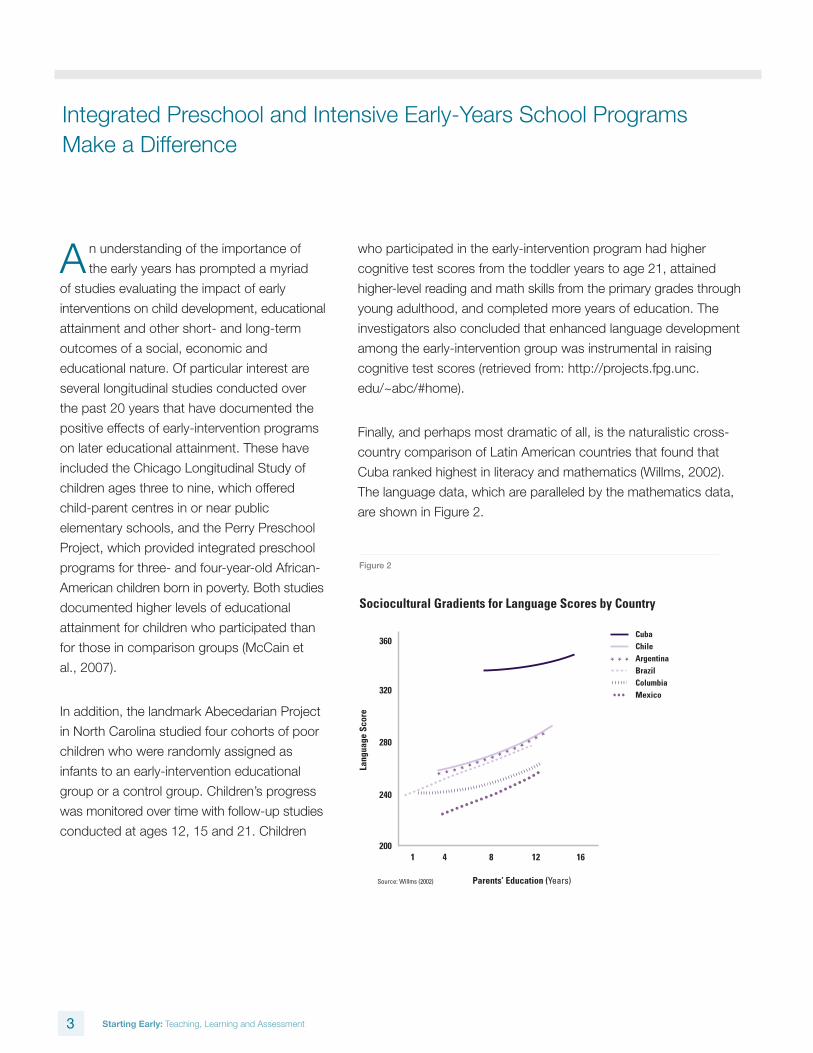
Finally, and perhaps most dramatic of all, is the naturalistic cross-
country comparison of Latin American countries that found that
Cuba ranked highest in literacy and mathematics (Willms, 2002).
The language data, which are paralleled by the mathematics data,
are shown in Figure 2.
Integrated Preschool and Intensive Early-Years School Programs Make a Difference
3 Starting Early: Teaching, Learning and Assessment
Sociocultural Gradients for Language Scores by Country
200
240
280
320
360
1 4 8 12 16
Parents’ Education (Years)
Lang
uage
Sco
re
Source: Willms (2002)
CubaChileArgentinaBrazilColumbiaMexico
Figure 2
McCain et. al. 2007 accounted for these
fi ndings by noting that:
. . . Cuba introduced health, nutrition, and
immunization programs for mothers and young
children more than 30 years ago and also . . . a
network of . . . child care centres for working
mothers based on extensive research . . . The
centres were so successful in promoting children’s
early language development and literacy that . . .
by the end of the century, 99% of young children
and their families were taking part. In contrast,
only 12% of Mexican children attend preschool.
(p. 44)
In keeping with the above, Willms (2002) noted
that Cuba’s Minister of Education attributed the
country’s remarkable success fi rst and foremost
to the country’s early-childhood care centres.
Shonkoff and Phillips (2000), in their extensive child development
literature review, acknowledged the remarkable importance of the
early years and the preschool period in particular. They also argued,
however, that while stimulating preschool experiences can have
a powerful impact, they do not guarantee later success nor
is there a sharp demarcation point as to when interventions can
successfully compensate for lack of early-childhood stimulation.
The early years of life are an important time of active development,
foundation building, and clear periods of reorganization. There is,
however, no sharp break at age 3 (or 5), and there is no scientifi c
reason to believe that the behavioral consequences of negative early
experiences cannot be ameliorated by interventions initiated in later
childhood, or that positive early experiences provide permanent
protection against later adversity.
(p. 412)
4 Starting Early: Teaching, Learning and Assessment
. . . Cuba introduced health, nutrition, and . . . Cuba introduced health, nutrition, and
The early years of life are an important time of active development,
The recognition of the importance of a
child’s early-life experiences has prompted
governments to reconsider the services being
offered to young children and their families.
Recently, in a report commissioned by the
Ontario government, Pascal (2009) cited the
following rather alarming statistic.
More than one in four children who enter Grade 1
are signifi cantly behind their peers. Many never
close the gap and go on to be disruptive in
school, fail to graduate, and are unable to fully
participate in and contribute to society. Ontario
cannot adequately address the challenges of the
new millennium while leaving a quarter of its
children behind. We need to start earlier and
do a better job of supporting children’s learning.
(Summary of the Report to the Premier by the
Special Advisor on Early Learning)
Following a comprehensive review of the
early-years literature and consultation with
a wide array of early-childhood stakeholders,
Pascal created a blueprint for addressing the
needs of young children in Ontario through
a series of 18 recommendations. The report,
With Our Best Future In Mind: Implementing
Early Learning in Ontario, 2009, and its
recommendations have been praised by both
early-childhood education experts, including Margaret McCain and
Fraser Mustard, authors of the early-years studies highlighted at the
beginning of this report, and by school-based practitioners.
The Ontario government also responded positively to the
recommendations and committed to improving the integration
and delivery of services offered through its Best Start Centres for
preschoolers and to implementing full-day kindergarten programs
for children aged four and fi ve. The government’s full-day kindergarten
implementation, begun in September 2010, included nearly 800
schools by September 2011. This program will be fully implemented
in all schools by September 2014.
Public Policy Response to Early-Years Research
5 Starting Early: Teaching, Learning and Assessment
More than one in four children who enter Grade 1
6 Starting Early: Teaching, Learning and Assessment
Ontario Early-Years Data: Collaborative Findings of EQAO and the Offord Centre, McMaster University
With more and more Ontario children
starting full-day kindergarten, it is useful
to consider what we know about children at
this age and what this information suggests
for school and teacher practice.
Since 2004, the Offord Centre for Child
Studies at McMaster University has been
measuring student readiness for school in
schools across Ontario. Kindergarten teachers
have completed the Early Development
Instrument (EDI) checklist to assess children
in five developmental domains: physical health
and well-being, social competence, emotional
maturity, language and cognitive development,
and communication and general knowledge.
Based on their EDI scores in each of the five
EDI domains, students are classified as being
on track or not on track. The on-track group
consists of those at the top of the readiness
continuum, or those who are considered
very ready, and those in the middle of the
continuum, considered ready. The not-on-
track group is divided into those considered
as at risk and, at the lowest end of the
continuum, vulnerable.2
Group-level results of the EDI assessments,
completed by teachers in senior kindergarten
classes in each school once every three years,
are provided to school boards and schools
in addition to being used to examine student
readiness within communities and at the provincial level. These
group-level data serve as a rich source of information for schools
and communities.
For the past two years, with a view toward providing schools with
information to assist in improvement-planning efforts, EQAO has been
working in partnership with researchers from the Offord Centre to
gain an enhanced understanding of the relationship between early-
childhood development and the consequent pathways involved in
student learning and achievement. Initial collaborative analyses have:
n provided a picture of the extent to which there are children who are
vulnerable or at risk upon entering kindergarten and the particular
areas of development that present the greatest challenges;
n demonstrated the importance of giving early and sustained
attention to children who are vulnerable or at risk upon school
entry, since the early school years provide the best opportunity
of altering the academic trajectory of these students; and
n given some indication of factors that influence the academic
achievement of primary school students.
The descriptive statistics that follow and that form the largest part
of this report are based on a matched sample of 72 903 students
aggregated over a four-year period to provide a provincial sample
with broad school and board representation. Details of the matching
process and variations in sampling procedures used by EQAO and the
Offord Centre are provided in Appendix A. All data referenced in this
report are derived from the matched sampling procedure described
in Appendix A. The data are presented in three main sections:
n EDI information about Ontario kindergarten students;
n Tracking Ontario student performance; and
n Pathways to Grade 3.
2 In establishing baseline data for the EDI, students who scored below the 10th percentile on a domain were assigned the designation vulnerable (not ready for school). Children between the 10th and 25th percentiles were considered at risk. Students scoring between the 25th and 75th percentiles were designated ready and those scoring beyond the 75th percentile were designated very ready.
7 Starting Early: Teaching, Learning and Assessment
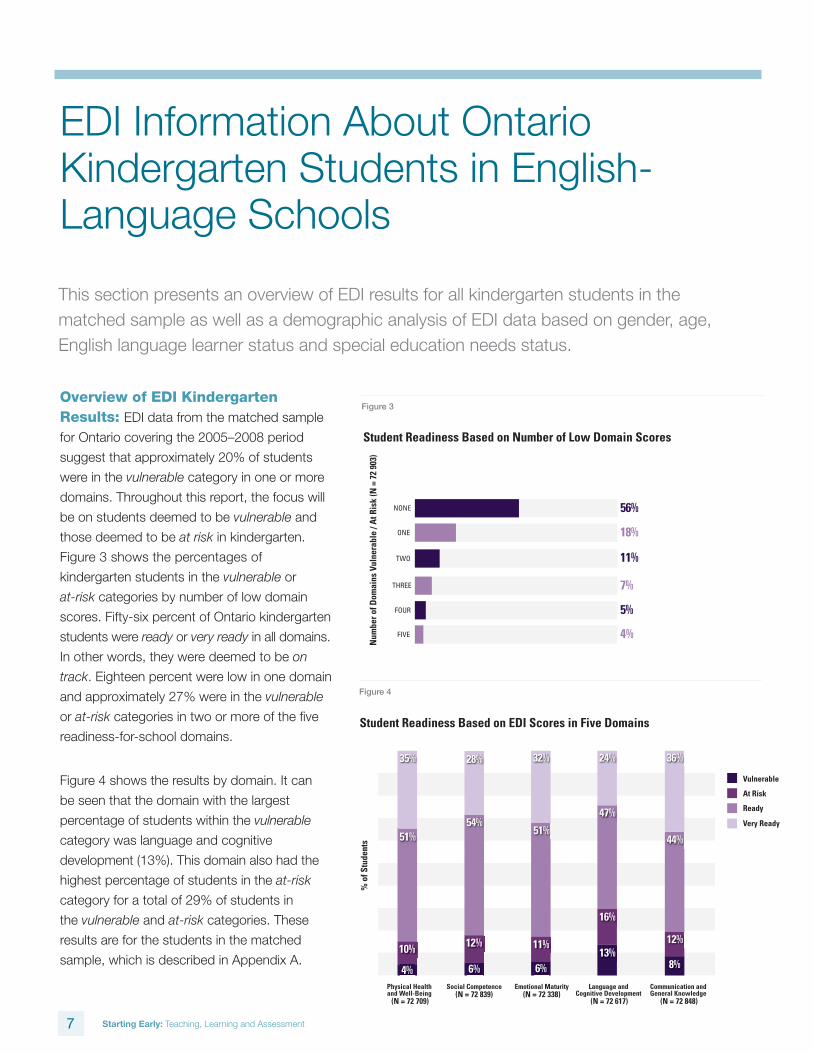
This section presents an overview of EDI results for all kindergarten students in the matched sample as well as a demographic analysis of EDI data based on gender, age, English language learner status and special education needs status.
Overview of EDI Kindergarten Results: EDI data from the matched sample
for Ontario covering the 2005–2008 period
suggest that approximately 20% of students
were in the vulnerable category in one or more
domains. Throughout this report, the focus will
be on students deemed to be vulnerable and
those deemed to be at risk in kindergarten.
Figure 3 shows the percentages of
kindergarten students in the vulnerable or
at-risk categories by number of low domain
scores. Fifty-six percent of Ontario kindergarten
students were ready or very ready in all domains.
In other words, they were deemed to be on
track. Eighteen percent were low in one domain
and approximately 27% were in the vulnerable
or at-risk categories in two or more of the fi ve
readiness-for-school domains.
Figure 4 shows the results by domain. It can
be seen that the domain with the largest
percentage of students within the vulnerable
category was language and cognitive
development (13%). This domain also had the
highest percentage of students in the at-risk
category for a total of 29% of students in
the vulnerable and at-risk categories. These
results are for the students in the matched
sample, which is described in Appendix A.
EDI Information About Ontario Kindergarten Students in English-Language Schools
Student Readiness Based on Number of Low Domain Scores
NONE
ONE
TWO
THREE
FOUR
FIVE
56%
18%
11%
7%
5%
4%
Num
ber o
f Dom
ains
Vul
nera
ble
/ At R
isk
(N =
72
903)
4 Figure 3
Figure 4
Physical Health and Well-Being
(N = 72 709)
Social Competence(N = 72 839)
Emotional Maturity(N = 72 338)
Language and Cognitive Development
(N = 72 617)
Communication and General Knowledge
(N = 72 848)
Student Readiness Based on EDI Scores in Five Domains
% o
f Stu
dent
s
3
Vulnerable
At Risk
Ready
Very Ready54%
28%
12%
6%
51%
35%
10%
4% 6%
11%
32%
51%
47%
24%
13%
16%
8%
36%
44%
12%
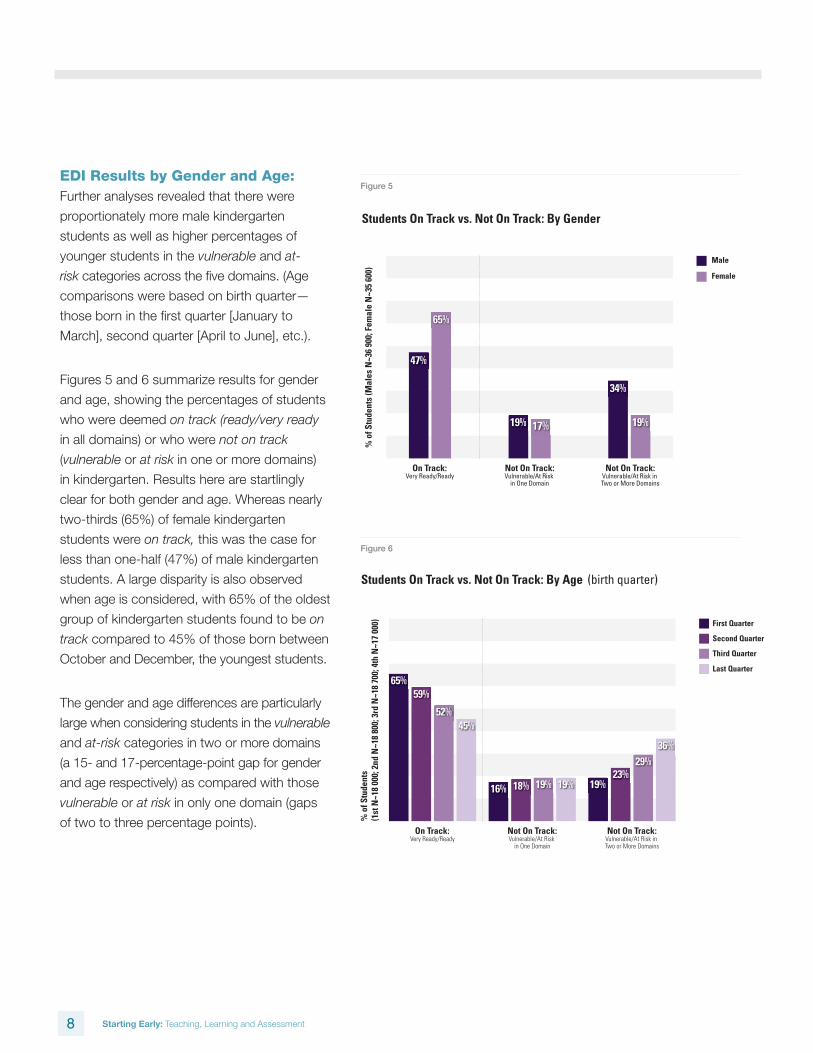
EDI Results by Gender and Age: Further analyses revealed that there were
proportionately more male kindergarten
students as well as higher percentages of
younger students in the vulnerable and at-
risk categories across the fi ve domains. (Age
comparisons were based on birth quarter—
those born in the fi rst quarter [January to
March], second quarter [April to June], etc.).
Figures 5 and 6 summarize results for gender
and age, showing the percentages of students
who were deemed on track (ready/very ready
in all domains) or who were not on track
(vulnerable or at risk in one or more domains)
in kindergarten. Results here are startlingly
clear for both gender and age. Whereas nearly
two-thirds (65%) of female kindergarten
students were on track, this was the case for
less than one-half (47%) of male kindergarten
students. A large disparity is also observed
when age is considered, with 65% of the oldest
group of kindergarten students found to be on
track compared to 45% of those born between
October and December, the youngest students.
The gender and age differences are particularly
large when considering students in the vulnerable
and at-risk categories in two or more domains
(a 15- and 17-percentage-point gap for gender
and age respectively) as compared with those
vulnerable or at risk in only one domain (gaps
of two to three percentage points).
8 Starting Early: Teaching, Learning and Assessment
Students On Track vs. Not On Track: By Gender
% o
f Stu
dent
s (M
ales
N~3
6 90
0; F
emal
e N
~35
600)
47%
65%
19% 17%
On Track:Very Ready/Ready
Not On Track:Vulnerable/At Risk
in One Domain
34%
19%
Not On Track:Vulnerable/At Risk in Two or More Domains
Male
Female
5
% o
f Stu
dent
s (1
st N
~18
000;
2nd
N~1
8 80
0; 3
rd N
~18
700;
4th
N~1
7 00
0)
65%59%
52%
16% 18% 19% 19%
45%
On Track:Very Ready/Ready
Not On Track:Vulnerable/At Risk
in One Domain
19%23%
29%
36%
Not On Track:Vulnerable/At Risk in Two or More Domains
First Quarter
Second Quarter
Third Quarter
Last Quarter
Students On Track vs. Not On Track: By Age (birth quarter)
6
Figure 5
Figure 6
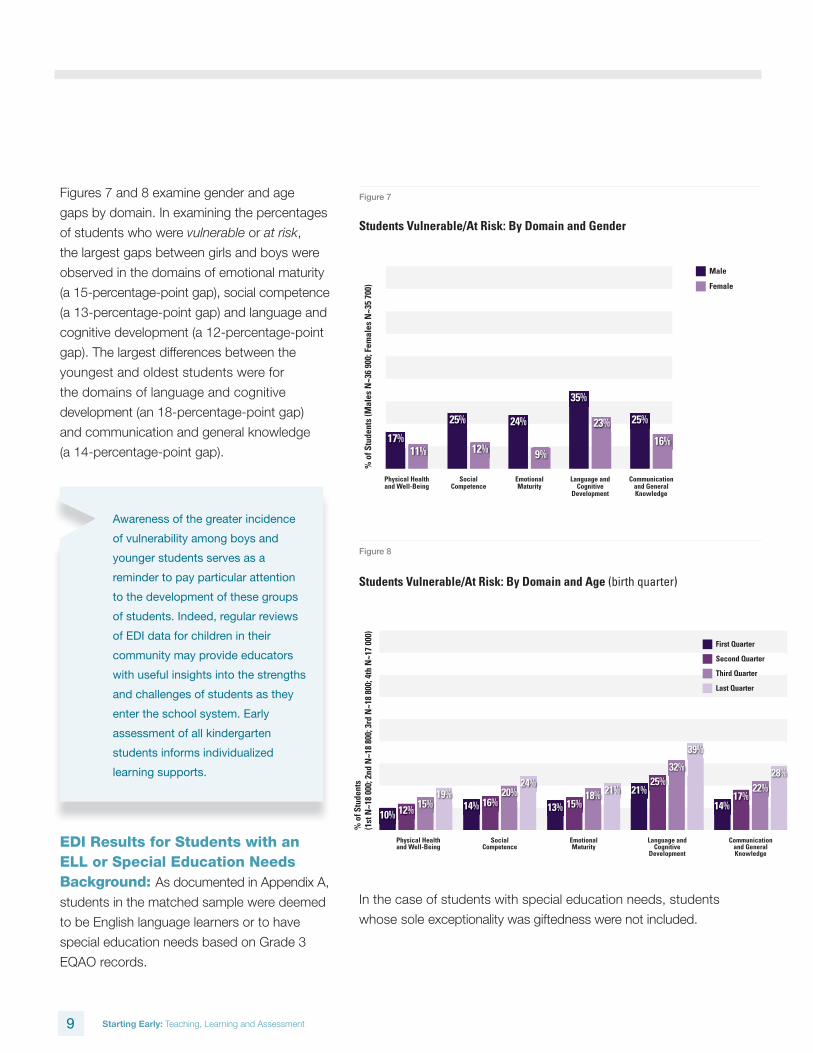
Figures 7 and 8 examine gender and age
gaps by domain. In examining the percentages
of students who were vulnerable or at risk,
the largest gaps between girls and boys were
observed in the domains of emotional maturity
(a 15-percentage-point gap), social competence
(a 13-percentage-point gap) and language and
cognitive development (a 12-percentage-point
gap). The largest differences between the
youngest and oldest students were for
the domains of language and cognitive
development (an 18-percentage-point gap)
and communication and general knowledge
(a 14-percentage-point gap).
EDI Results for Students with an ELL or Special Education Needs Background: As documented in Appendix A,
students in the matched sample were deemed
to be English language learners or to have
special education needs based on Grade 3
EQAO records.
9 Starting Early: Teaching, Learning and Assessment
% o
f Stu
dent
s (M
ales
N~3
6 90
0; F
emal
es N
~35
700)
17%11%
Physical Healthand Well-Being
25%
12%
SocialCompetence
24%
9%
EmotionalMaturity
35%
23%
Language andCognitive
Development
25%
16%
Communicationand GeneralKnowledge
Male
Female
Students Vulnerable/At Risk: By Domain and Gender
7
Students Vulnerable/At Risk: By Domain and Age (birth quarter)
% o
f Stu
dent
s (1
st N
~18
000;
2nd
N~1
8 80
0; 3
rd N
~18
800;
4th
N~1
7 00
0)
10% 12%15% 14% 16%
20%24%
19%13% 15%
18% 21% 21%25%
32%
39%
First Quarter
Second Quarter
Third Quarter
Last Quarter
Physical Healthand Well-Being
SocialCompetence
EmotionalMaturity
Language andCognitive
Development
Communicationand GeneralKnowledge
14%17%
22%
28%
8
Figure 7
Figure 8
Students Vulnerable/At Risk: By Domain and Age (birth quarter)
% o
f Stu
dent
s (1
st N
~18
000;
2nd
N~1
8 80
0; 3
rd N
~18
800;
4th
N~1
7 00
0)
10% 12%15% 14% 16%
20%24%
19%13% 15%
18% 21% 21%25%
32%
39%
First Quarter
Second Quarter
Third Quarter
Last Quarter
Physical Healthand Well-Being
SocialCompetence
EmotionalMaturity
Language andCognitive
Development
Communicationand GeneralKnowledge
14%17%
22%
28%
8
Awareness of the greater incidence
of vulnerability among boys and
younger students serves as a
reminder to pay particular attention
to the development of these groups
of students. Indeed, regular reviews
of EDI data for children in their
community may provide educators
with useful insights into the strengths
and challenges of students as they
enter the school system. Early
assessment of all kindergarten
students informs individualized
learning supports.
In the case of students with special education needs, students
whose sole exceptionality was giftedness were not included.
10 Starting Early: Teaching, Learning and Assessment
Also, by virtue of being in the matched sample
and having been assessed with the EDI, all
students within the matched sample had been in
an Ontario school since kindergarten. This is of
particular relevance for the ELL grouping, which
is comprised of English language learners
with at least three years of Ontario English
language schooling; students with an ELL
background but who arrived in Canada after
kindergarten are not represented in the sample.
Also excluded are students who were identifi ed
as ELLs in kindergarten but were no longer
deemed to be in the ELL category in Grade 3.
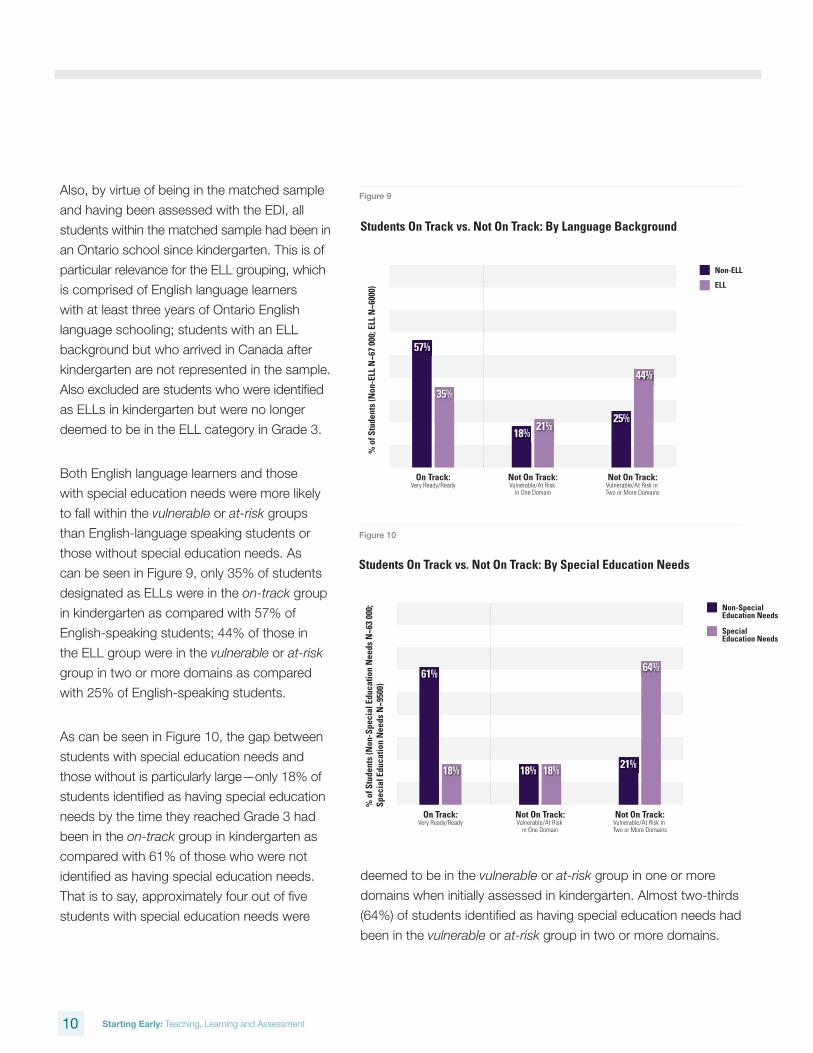
Both English language learners and those
with special education needs were more likely
to fall within the vulnerable or at-risk groups
than English-language speaking students or
those without special education needs. As
can be seen in Figure 9, only 35% of students
designated as ELLs were in the on-track group
in kindergarten as compared with 57% of
English-speaking students; 44% of those in
the ELL group were in the vulnerable or at-risk
group in two or more domains as compared
with 25% of English-speaking students.
As can be seen in Figure 10, the gap between
students with special education needs and
those without is particularly large—only 18% of
students identifi ed as having special education
needs by the time they reached Grade 3 had
been in the on-track group in kindergarten as
compared with 61% of those who were not
identifi ed as having special education needs.
That is to say, approximately four out of fi ve
students with special education needs were
Students On Track vs. Not On Track: By Language Background
% o
f Stu
dent
s (N
on-E
LL N
~67
000;
ELL
N~6
000)
57%
35%
18%21%
On Track:Very Ready/Ready
Not On Track:Vulnerable/At Risk
in One Domain
25%
44%
Not On Track:Vulnerable/At Risk in Two or More Domains
Non-ELL
ELL
9
Students On Track vs. Not On Track: By Special Education Needs
% o
f Stu
dent
s (N
on-S
peci
al E
duca
tion
Nee
ds N
~63
000;
Sp
ecia
l Edu
catio
n N
eeds
N~9
500)
61%
18% 18% 18%
On Track:Very Ready/Ready
Not On Track:Vulnerable/At Risk
in One Domain
21%
64%
Not On Track:Vulnerable/At Risk in Two or More Domains
Non-Special Education Needs
Special Education Needs
10
Figure 9
Figure 10
deemed to be in the vulnerable or at-risk group in one or more
domains when initially assessed in kindergarten. Almost two-thirds
(64%) of students identifi ed as having special education needs had
been in the vulnerable or at-risk group in two or more domains.
11 Starting Early: Teaching, Learning and Assessment
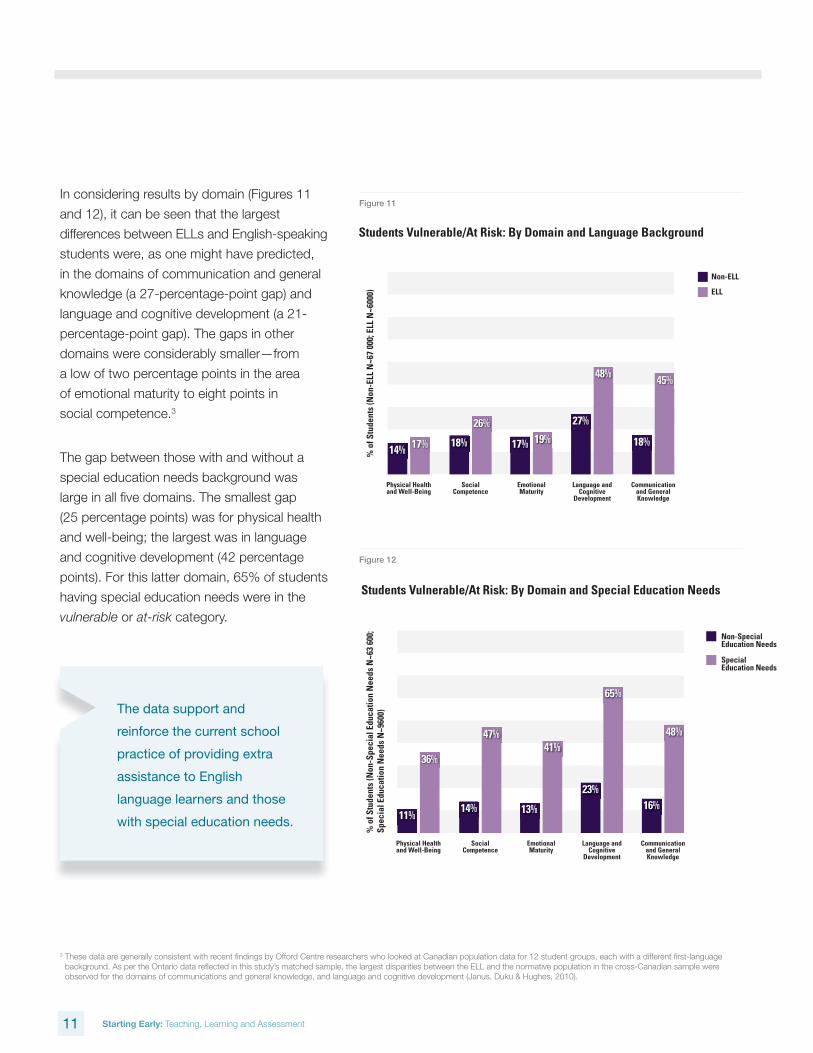
In considering results by domain (Figures 11
and 12), it can be seen that the largest
differences between ELLs and English-speaking
students were, as one might have predicted,
in the domains of communication and general
knowledge (a 27-percentage-point gap) and
language and cognitive development (a 21-
percentage-point gap). The gaps in other
domains were considerably smaller—from
a low of two percentage points in the area
of emotional maturity to eight points in
social competence.3
The gap between those with and without a
special education needs background was
large in all fi ve domains. The smallest gap
(25 percentage points) was for physical health
and well-being; the largest was in language
and cognitive development (42 percentage
points). For this latter domain, 65% of students
having special education needs were in the
vulnerable or at-risk category.
The data support and
reinforce the current school
practice of providing extra
assistance to English
language learners and those
with special education needs.
3 These data are generally consistent with recent fi ndings by Offord Centre researchers who looked at Canadian population data for 12 student groups, each with a different fi rst-language background. As per the Ontario data refl ected in this study’s matched sample, the largest disparities between the ELL and the normative population in the cross-Canadian sample were observed for the domains of communications and general knowledge, and language and cognitive development (Janus, Duku & Hughes, 2010).
% o
f Stu
dent
s (N
on-E
LL N
~67
000;
ELL
N~6
000)
14% 17%
Physical Healthand Well-Being
18%
26%
SocialCompetence
17% 19%
EmotionalMaturity
27%
48%
Language andCognitive
Development
18%
45%
Communicationand GeneralKnowledge
Non-ELL
ELL
Students Vulnerable/At Risk: By Domain and Language Background
11
% o
f Stu
dent
s (N
on-S
peci
al E
duca
tion
Nee
ds N
~63
600;
Sp
ecia
l Edu
catio
n N
eeds
N~9
600)
11%
36%
Physical Healthand Well-Being
14%
47%
SocialCompetence
13%
41%
EmotionalMaturity
23%
65%
Language andCognitive
Development
16%
48%
Communicationand GeneralKnowledge
Students Vulnerable/At Risk: By Domain and Special Education Needs
12
Non-Special Education Needs
Special Education Needs
Figure 11
Figure 12
12 Starting Early: Teaching, Learning and Assessment
Based on a wide-ranging literature review, Shonkoff and Phillips (2000) concluded the following:
This section examines the relationship between
EDI and EQAO assessment results4 and provides
a demographic analysis of fi ndings based on
gender, age, English language learner status and
students with special education need status.
Relationship between EDI and EQAO Results: Consistent with the foregoing
conclusions of Shonkoff and Phillips are the
EQAO/EDI research fi ndings pertaining to the
educational attainment of Grade 3 Ontario
students in relation to their assessed readiness in kindergarten.
Students with high EDI scores in kindergarten—those deemed to
be on track, or in the ready or very-ready categories—are much
more likely to achieve the provincial standard on Grade 3 EQAO
assessment than those students in the vulnerable or at-risk groups.
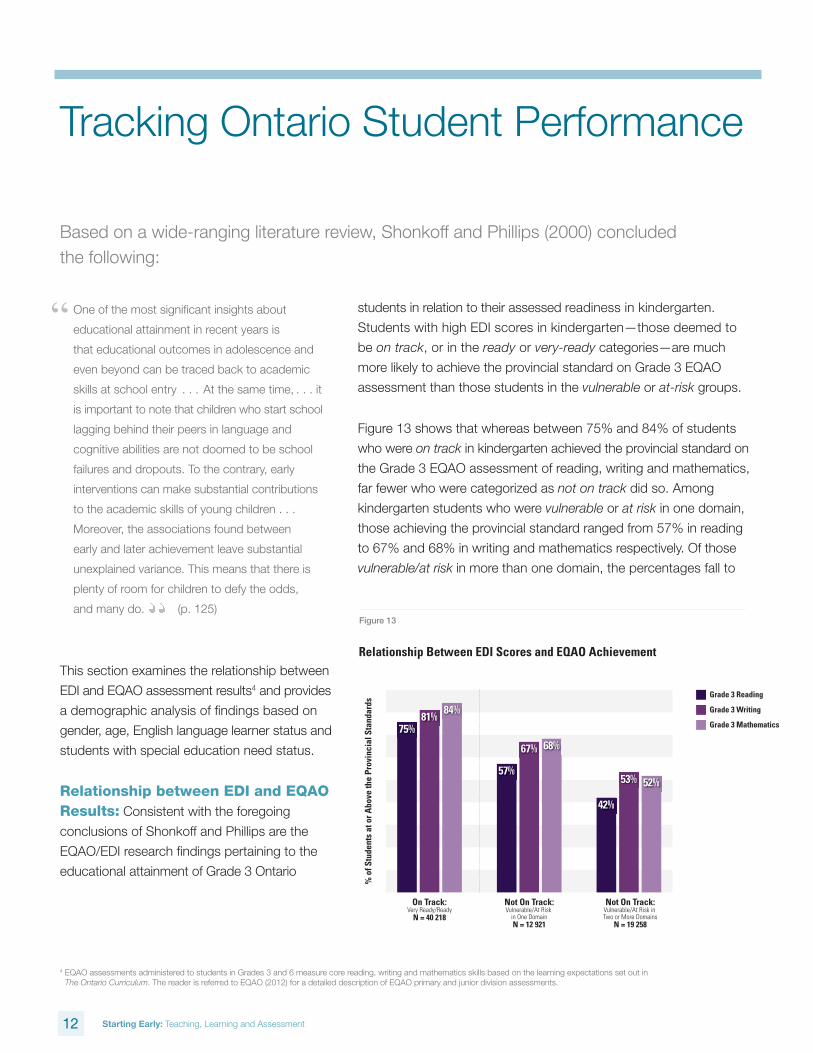
Figure 13 shows that whereas between 75% and 84% of students
who were on track in kindergarten achieved the provincial standard on
the Grade 3 EQAO assessment of reading, writing and mathematics,
far fewer who were categorized as not on track did so. Among
kindergarten students who were vulnerable or at risk in one domain,
those achieving the provincial standard ranged from 57% in reading
to 67% and 68% in writing and mathematics respectively. Of those
vulnerable/at risk in more than one domain, the percentages fall to
Tracking Ontario Student Performance
One of the most signifi cant insights about
educational attainment in recent years is
that educational outcomes in adolescence and
even beyond can be traced back to academic
skills at school entry . . . At the same time, . . . it
is important to note that children who start school
lagging behind their peers in language and
cognitive abilities are not doomed to be school
failures and dropouts. To the contrary, early
interventions can make substantial contributions
to the academic skills of young children . . .
Moreover, the associations found between
early and later achievement leave substantial
unexplained variance. This means that there is
plenty of room for children to defy the odds,
and many do. (p. 125)
4 EQAO assessments administered to students in Grades 3 and 6 measure core reading, writing and mathematics skills based on the learning expectations set out in The Ontario Curriculum. The reader is referred to EQAO (2012) for a detailed description of EQAO primary and junior division assessments.
and many do. (p. 125)
% o
f Stu
dent
s at
or A
bove
the
Prov
inci
al S
tand
ards
75%81%
84%
57%
67% 68%
On Track:Very Ready/Ready
N = 40 218
Not On Track:Vulnerable/At Risk
in One DomainN = 12 921
42%
53% 52%
Not On Track:Vulnerable/At Risk in Two or More Domains
N = 19 258
Grade 3 Reading
Grade 3 Writing
Grade 3 Mathematics
Relationship Between EDI Scores and EQAO Achievement
13 Figure 13
13 Starting Early: Teaching, Learning and Assessment
42% for reading, 53% for writing and 52%
for mathematics. These fi gures represent an
achievement gap of 14 to 18 percentage
points between those on track on the EDI and
those who were not on track in one domain;
there was an achievement gap of 28 to 33
percentage points between those on track and
those not on track on two or more domains.
At the same time, not all students who were on
track in kindergarten—ready or very ready in all
fi ve domains—achieved the Grade 3 provincial
standards. Sixteen percent of students in
this group did not achieve the mathematics
standard, 19% did not achieve the standard in
writing and 25% did not achieve it in reading.
It is also important to acknowledge that many
students who were not on track in kindergarten
nevertheless were able to reach the provincial
standards in Grade 3. Among students
deemed vulnerable/at risk in one domain,
57%–68% achieved the provincial standards
in Grade 3; 42%–53% of those considered
vulnerable/at risk in two or more domains also
achieved the standards. These data suggest
that appropriate supports and interventions
during the primary school years allowed many
children who were not on track in kindergarten
to address early challenges and proceed on a
positive academic trajectory.
In terms of the relationship between EDI domain scores and student
achievement on Grade 3 EQAO assessment, the pattern of results is
consistent with the foregoing observations based on the overall
results. Students with low EDI scores in a particular domain—those
in the vulnerable or at-risk groups—are much less likely to achieve
the provincial standard on all components of the Grade 3 EQAO
assessment than those who were deemed ready or very ready
in kindergarten.
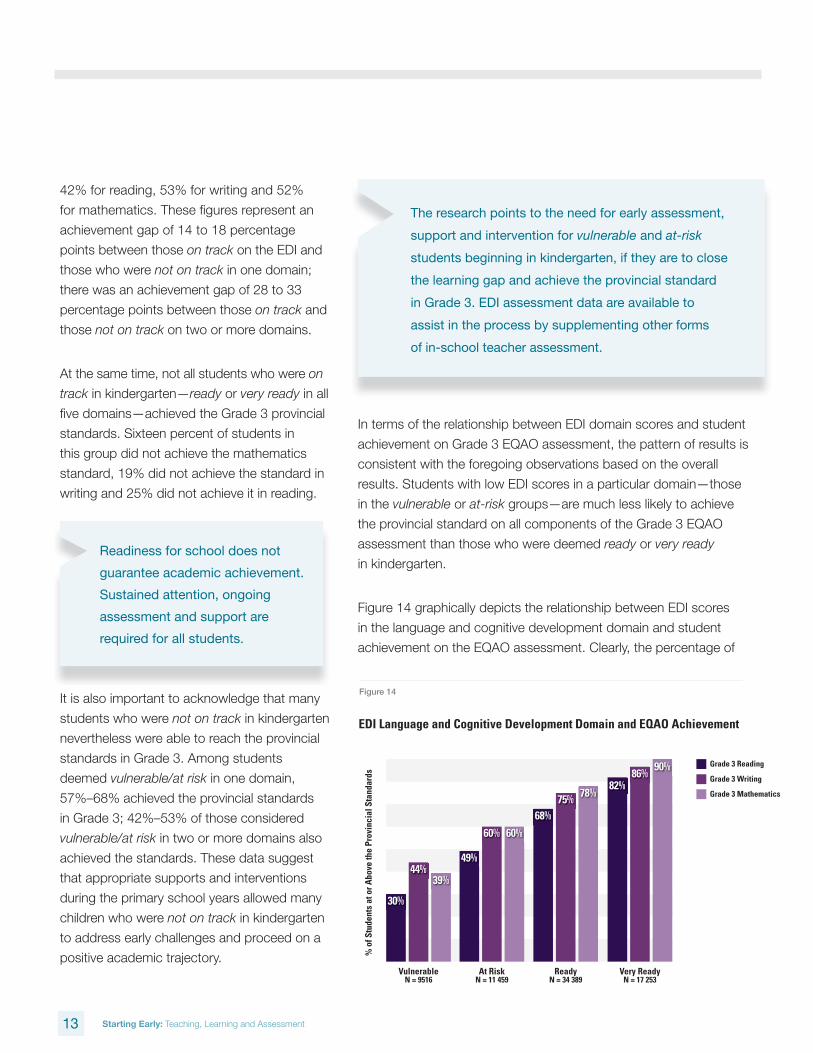
Figure 14 graphically depicts the relationship between EDI scores
in the language and cognitive development domain and student
achievement on the EQAO assessment. Clearly, the percentage of
% o
f Stu
dent
s at
or A
bove
the
Prov
inci
al S
tand
ards
30%
44%39%
VulnerableN = 9516
49%
60% 60%
At RiskN = 11 459
68%
75%78%
ReadyN = 34 389
82%86%
90%
Very ReadyN = 17 253
Grade 3 Reading
Grade 3 Writing
Grade 3 Mathematics
EDI Language and Cognitive Development Domain and EQAO Achievement
14Figure 14
Readiness for school does not
guarantee academic achievement.
Sustained attention, ongoing
assessment and support are
required for all students.
The research points to the need for early assessment,
support and intervention for vulnerable and at-risk
students beginning in kindergarten, if they are to close
the learning gap and achieve the provincial standard
in Grade 3. EDI assessment data are available to
assist in the process by supplementing other forms
of in-school teacher assessment.
14 Starting Early: Teaching, Learning and Assessment
students achieving the provincial standard
consistently increases across the four score
categories, from vulnerable to very ready.
Figure 14 also demonstrates that many
students in the vulnerable category for
language and cognitive development in
kindergarten “defy the odds” and are able to
reach the provincial standards in Grade 3—30%
achieved the standard in reading, 44% achieved
it in writing and 39% achieved it in mathematics.
An even higher proportion of those deemed
at risk in this category, 49%–60%, achieved
the provincial standards in Grade 3. (See
Appendix B for results for all domains.)
Examining the EDI-EQAO Relationship by Gender and Age: In an earlier section, it was shown that a greater
proportion of female than male students were
deemed to be on track in kindergarten based
on their EDI scores and, similarly, a greater
percentage of older students were on track
than younger students. It was further shown
that gender and age differences of those not
on track were particularly apparent when those
who were vulnerable or at risk in two or more
domains were examined.
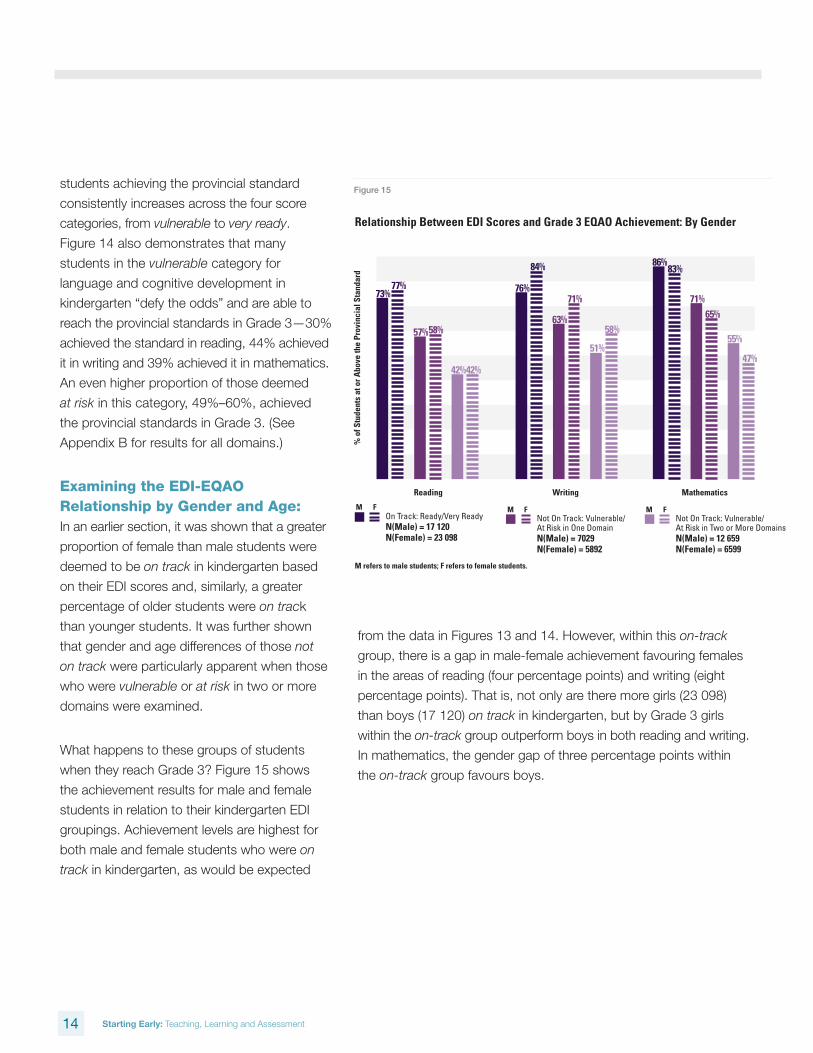
What happens to these groups of students
when they reach Grade 3? Figure 15 shows
the achievement results for male and female
students in relation to their kindergarten EDI
groupings. Achievement levels are highest for
both male and female students who were on
track in kindergarten, as would be expected
Figure 15
% o
f Stu
dent
s at
or A
bove
the
Prov
inci
al S
tand
ard
Reading Writing Mathematics
On Track: Ready/Very ReadyN(Male) = 17 120N(Female) = 23 098
Not On Track: Vulnerable/At Risk in One DomainN(Male) = 7029N(Female) = 5892
Not On Track: Vulnerable/At Risk in Two or More DomainsN(Male) = 12 659N(Female) = 6599
Relationship Between EDI Scores and Grade 3 EQAO Achievement: By Gender
73%77%
57%
42%42%
76%
86%83%
71%
65%
55%
47%
84%
63%
51%
58%
71%
58%
M F
M refers to male students; F refers to female students.
15
M F M F
from the data in Figures 13 and 14. However, within this on-track
group, there is a gap in male-female achievement favouring females
in the areas of reading (four percentage points) and writing (eight
percentage points). That is, not only are there more girls (23 098)
than boys (17 120) on track in kindergarten, but by Grade 3 girls
within the on-track group outperform boys in both reading and writing.
In mathematics, the gender gap of three percentage points within
the on-track group favours boys.
15 Starting Early: Teaching, Learning and Assessment
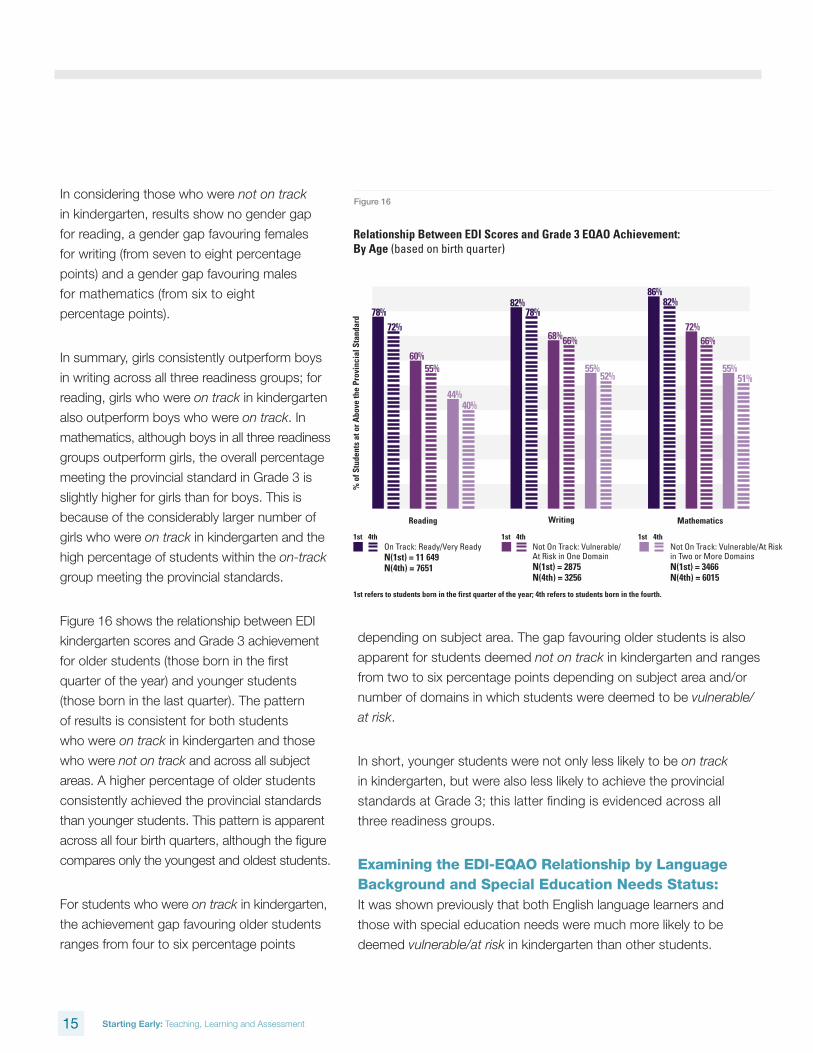
In considering those who were not on track
in kindergarten, results show no gender gap
for reading, a gender gap favouring females
for writing (from seven to eight percentage
points) and a gender gap favouring males
for mathematics (from six to eight
percentage points).
In summary, girls consistently outperform boys
in writing across all three readiness groups; for
reading, girls who were on track in kindergarten
also outperform boys who were on track. In
mathematics, although boys in all three readiness
groups outperform girls, the overall percentage
meeting the provincial standard in Grade 3 is
slightly higher for girls than for boys. This is
because of the considerably larger number of
girls who were on track in kindergarten and the
high percentage of students within the on-track
group meeting the provincial standards.
Figure 16 shows the relationship between EDI
kindergarten scores and Grade 3 achievement
for older students (those born in the first
quarter of the year) and younger students
(those born in the last quarter). The pattern
of results is consistent for both students
who were on track in kindergarten and those
who were not on track and across all subject
areas. A higher percentage of older students
consistently achieved the provincial standards
than younger students. This pattern is apparent
across all four birth quarters, although the figure
compares only the youngest and oldest students.
For students who were on track in kindergarten,
the achievement gap favouring older students
ranges from four to six percentage points
depending on subject area. The gap favouring older students is also
apparent for students deemed not on track in kindergarten and ranges
from two to six percentage points depending on subject area and/or
number of domains in which students were deemed to be vulnerable/
at risk.
In short, younger students were not only less likely to be on track
in kindergarten, but were also less likely to achieve the provincial
standards at Grade 3; this latter finding is evidenced across all
three readiness groups.
Examining the EDI-EQAO Relationship by Language Background and Special Education Needs Status: It was shown previously that both English language learners and
those with special education needs were much more likely to be
deemed vulnerable/at risk in kindergarten than other students.
78%
72%
60%
44%40%
86%82%
72%66%
55%51%
55%
82%78%
68%
55%52%
66%
Writing
% o
f Stu
dent
s at
or A
bove
the
Prov
inci
al S
tand
ard
Reading Mathematics
On Track: Ready/Very ReadyN(1st) = 11 649N(4th) = 7651
Not On Track: Vulnerable/At Risk in One DomainN(1st) = 2875N(4th) = 3256
Not On Track: Vulnerable/At Riskin Two or More DomainsN(1st) = 3466N(4th) = 6015
Relationship Between EDI Scores and Grade 3 EQAO Achievement: By Age (based on birth quarter)
1st 4th
1st refers to students born in the first quarter of the year; 4th refers to students born in the fourth.
16
1st 4th 1st 4th
Figure 16
16 Starting Early: Teaching, Learning and Assessment
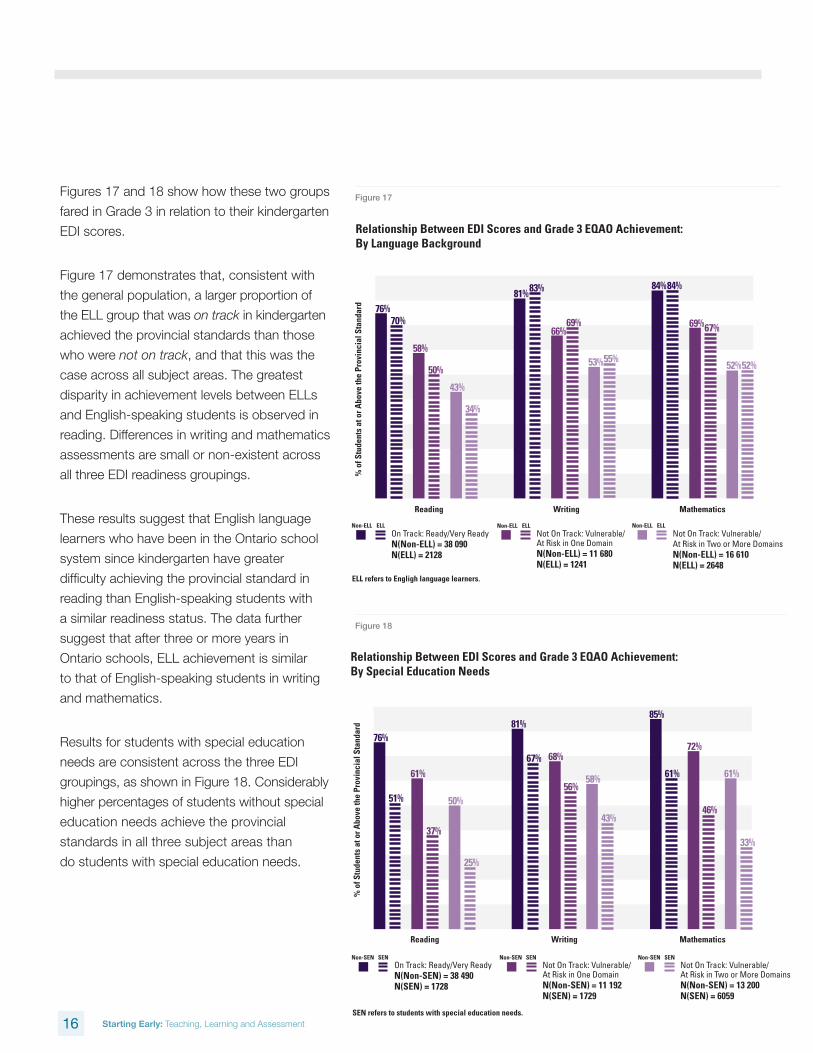
Figures 17 and 18 show how these two groups
fared in Grade 3 in relation to their kindergarten
EDI scores.
Figure 17 demonstrates that, consistent with
the general population, a larger proportion of
the ELL group that was on track in kindergarten
achieved the provincial standards than those
who were not on track, and that this was the
case across all subject areas. The greatest
disparity in achievement levels between ELLs
and English-speaking students is observed in
reading. Differences in writing and mathematics
assessments are small or non-existent across
all three EDI readiness groupings.
These results suggest that English language
learners who have been in the Ontario school
system since kindergarten have greater
difficulty achieving the provincial standard in
reading than English-speaking students with
a similar readiness status. The data further
suggest that after three or more years in
Ontario schools, ELL achievement is similar
to that of English-speaking students in writing
and mathematics.
Results for students with special education
needs are consistent across the three EDI
groupings, as shown in Figure 18. Considerably
higher percentages of students without special
education needs achieve the provincial
standards in all three subject areas than
do students with special education needs.
% o
f Stu
dent
s at
or A
bove
the
Prov
inci
al S
tand
ard
Reading Writing Mathematics
On Track: Ready/Very ReadyN(Non-ELL) = 38 090N(ELL) = 2128
Not On Track: Vulnerable/At Risk in One DomainN(Non-ELL) = 11 680N(ELL) = 1241
Not On Track: Vulnerable/At Risk in Two or More DomainsN(Non-ELL) = 16 610N(ELL) = 2648
Relationship Between EDI Scores and Grade 3 EQAO Achievement: By Language Background
Non-ELL ELL
17
76%70%
58%
43%
34%
84%84%
69%67%
52%52%50%
81%83%
66%
53%55%
69%
ELL refers to Engligh language learners.
Non-ELL ELL Non-ELL ELL
% o
f Stu
dent
s at
or A
bove
the
Prov
inci
al S
tand
ard
Reading Writing Mathematics
On Track: Ready/Very ReadyN(Non-SEN) = 38 490N(SEN) = 1728
Not On Track: Vulnerable/At Risk in One DomainN(Non-SEN) = 11 192N(SEN) = 1729
Not On Track: Vulnerable/At Risk in Two or More DomainsN(Non-SEN) = 13 200N(SEN) = 6059
Relationship Between EDI Scores and Grade 3 EQAO Achievement: By Special Education Needs
76%
51%
61%
50%
25%
85%
61%
72%
46%
61%
33%37%
81%
67% 68%
58%
43%
56%
Non-SEN SEN
SEN refers to students with special education needs.
18
Non-SEN SEN Non-SEN SEN
Figure 17
Figure 18
17 Starting Early: Teaching, Learning and Assessment
The gap between students with special
education needs and those without is
approximately 25 percentage points in
reading and mathematics. This is the case
when with both groups of students who were
deemed on track in kindergarten as well as
those not on track. For writing, the gap
between those with and without special
education needs ranges from 12 to 15
percentage points depending on readiness
status in kindergarten.
Understanding Student Achievement: Clearly, there are many different factors that
impact students’ academic performance.
These include readiness for school as well as
student experiences both in and out of school
during the primary years. Teachers, family and
peer support all play a part, as do health and
economic factors. While the Offord and EQAO
teams did not undertake a study to explain
primary school progress, some initial
investigative analyses by the two research
teams have provided useful insights.
Absenteeism. Considerable evidence points
to poor school attendance as being associated
with lower school achievement. Analysis of the
current data by the Offord Centre researchers
determined that a higher absenteeism rate in
kindergarten was associated with lower
achievement in Grade 3. On average, Grade 3
students who did not meet provincial standards
had missed about one more day of school
in kindergarten than those who met the
standards. While missing just one day of
kindergarten seems an unlikely cause of future
academic diffi culties, it is perhaps an early
indicator of a tendency toward increased
absenteeism—a hypothesis requiring further study. However,
establishing a pattern of regular attendance when students
start school is likely to be benefi cial.
Moving to a New School. The Offord Centre analysis also revealed
that students who changed schools between kindergarten and
Grade 3 were less likely to achieve the provincial standard on EQAO’s
primary-division assessment. While educators generally have little
infl uence on decisions by parents to move, knowing that moving to a
new school represents an area of potential vulnerability is valuable
information for educators. Principals and teachers will want to ensure
that special efforts are made to assist with the transition process when
new students arrive and that extra support is provided as needed.
Children who begin in a new school will benefi t from
transition plans to ensure that their progress is well
monitored and that support is provided as required.
The data confi rm the importance of communicating
to parents the need to ensure regular school
attendance, right from the beginning of kindergarten.
18 Starting Early: Teaching, Learning and Assessment
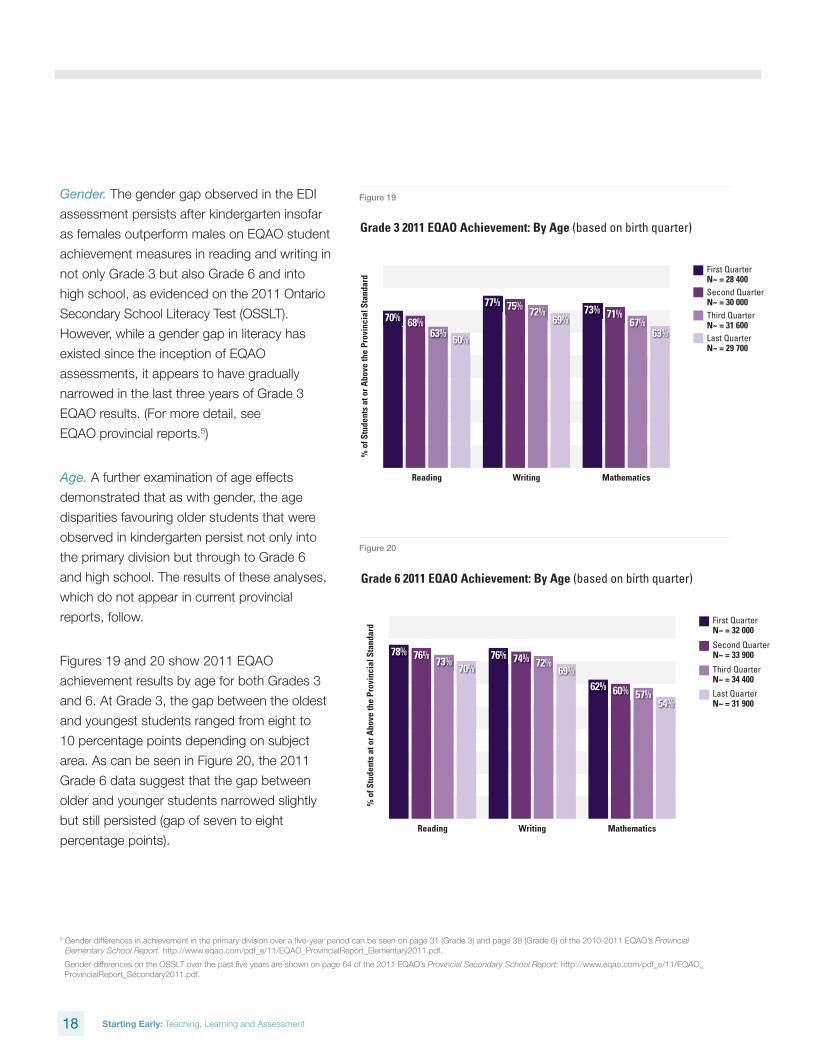
Gender. The gender gap observed in the EDI
assessment persists after kindergarten insofar
as females outperform males on EQAO student
achievement measures in reading and writing in
not only Grade 3 but also Grade 6 and into
high school, as evidenced on the 2011 Ontario
Secondary School Literacy Test (OSSLT).
However, while a gender gap in literacy has
existed since the inception of EQAO
assessments, it appears to have gradually
narrowed in the last three years of Grade 3
EQAO results. (For more detail, see
EQAO provincial reports.5)
Age. A further examination of age effects
demonstrated that as with gender, the age
disparities favouring older students that were
observed in kindergarten persist not only into
the primary division but through to Grade 6
and high school. The results of these analyses,
which do not appear in current provincial
reports, follow.
Figures 19 and 20 show 2011 EQAO
achievement results by age for both Grades 3
and 6. At Grade 3, the gap between the oldest
and youngest students ranged from eight to
10 percentage points depending on subject
area. As can be seen in Figure 20, the 2011
Grade 6 data suggest that the gap between
older and younger students narrowed slightly
but still persisted (gap of seven to eight
percentage points).
% o
f Stu
dent
s at
or A
bove
the
Prov
inci
al S
tand
ard
70% 68%63%
77% 75% 72%69%
60%
Reading Writing
73% 71%67%
63%
Mathematics
First QuarterN~ = 28 400Second QuarterN~ = 30 000Third QuarterN~ = 31 600Last QuarterN~ = 29 700
Grade 3 2011 EQAO Achievement: By Age (based on birth quarter)
19
% o
f Stu
dent
s at
or A
bove
the
Prov
inci
al S
tand
ard
78% 76% 73%76% 74% 72%
69%70%
Reading Writing
62% 60% 57%54%
Mathematics
First QuarterN~ = 32 000
Second QuarterN~ = 33 900
Third QuarterN~ = 34 400
Last QuarterN~ = 31 900
Grade 6 2011 EQAO Achievement: By Age (based on birth quarter)
20
Figure 19
Figure 20
5 Gender differences in achievement in the primary division over a fi ve-year period can be seen on page 31 (Grade 3) and page 38 (Grade 6) of the 2010-2011 EQAO’s Provincial Elementary School Report. http://www.eqao.com/pdf_e/11/EQAO_ProvincialReport_Elementary2011.pdf.
Gender differences on the OSSLT over the past fi ve years are shown on page 64 of the 2011 EQAO’s Provincial Secondary School Report: http://www.eqao.com/pdf_e/11/EQAO_ProvincialReport_Secondary2011.pdf.
19 Starting Early: Teaching, Learning and Assessment
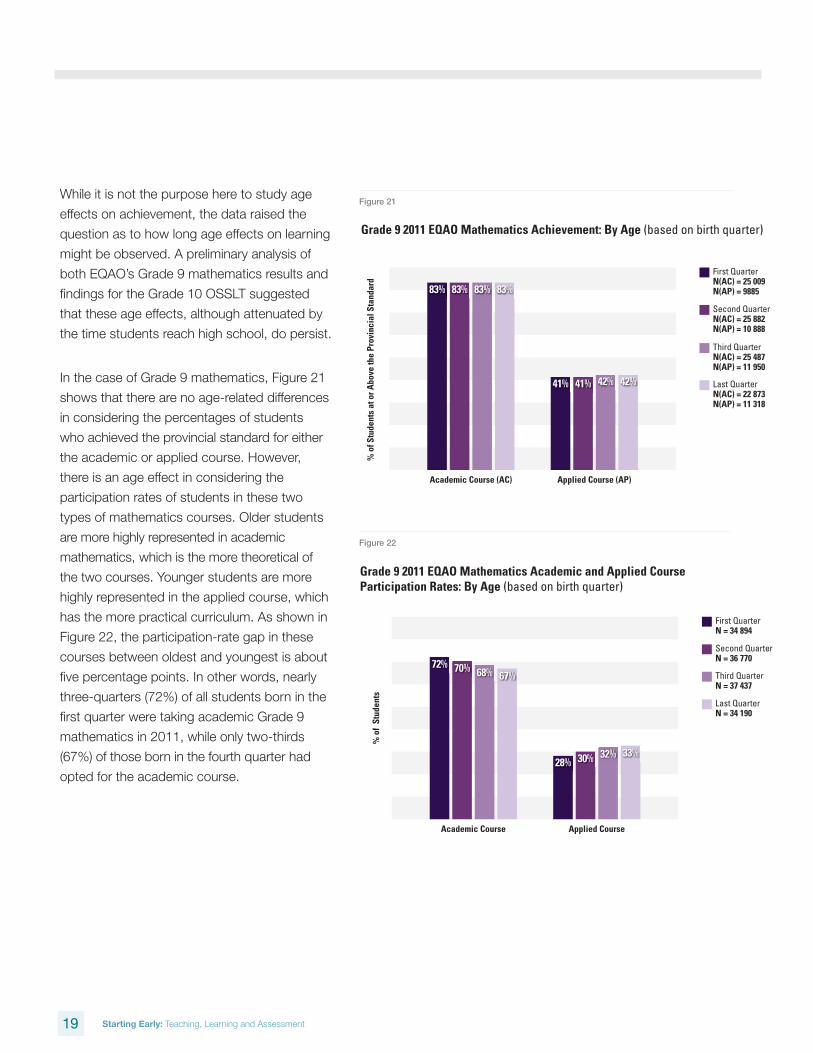
While it is not the purpose here to study age
effects on achievement, the data raised the
question as to how long age effects on learning
might be observed. A preliminary analysis of
both EQAO’s Grade 9 mathematics results and
fi ndings for the Grade 10 OSSLT suggested
that these age effects, although attenuated by
the time students reach high school, do persist.
In the case of Grade 9 mathematics, Figure 21
shows that there are no age-related differences
in considering the percentages of students
who achieved the provincial standard for either
the academic or applied course. However,
there is an age effect in considering the
participation rates of students in these two
types of mathematics courses. Older students
are more highly represented in academic
mathematics, which is the more theoretical of
the two courses. Younger students are more
highly represented in the applied course, which
has the more practical curriculum. As shown in
Figure 22, the participation-rate gap in these
courses between oldest and youngest is about
fi ve percentage points. In other words, nearly
three-quarters (72%) of all students born in the
fi rst quarter were taking academic Grade 9
mathematics in 2011, while only two-thirds
(67%) of those born in the fourth quarter had
opted for the academic course.
% o
f Stu
dent
s at
or A
bove
the
Prov
inci
al S
tand
ard
83% 83% 83%
41% 41% 42% 42%
83%
Academic Course (AC) Applied Course (AP)
First QuarterN(AC) = 25 009N(AP) = 9885
Second QuarterN(AC) = 25 882N(AP) = 10 888
Third QuarterN(AC) = 25 487N(AP) = 11 950
Last QuarterN(AC) = 22 873N(AP) = 11 318
Grade 9 2011 EQAO Mathematics Achievement: By Age (based on birth quarter)
21
72% 70% 68%
28% 30% 32% 33%
67%
Academic Course Applied Course
First QuarterN = 34 894
Second QuarterN = 36 770
Third QuarterN = 37 437
Last QuarterN = 34 190
Grade 9 2011 EQAO Mathematics Academic and Applied Course Participation Rates: By Age (based on birth quarter)
22
% o
f St
uden
ts
Figure 21
Figure 22
20 Starting Early: Teaching, Learning and Assessment
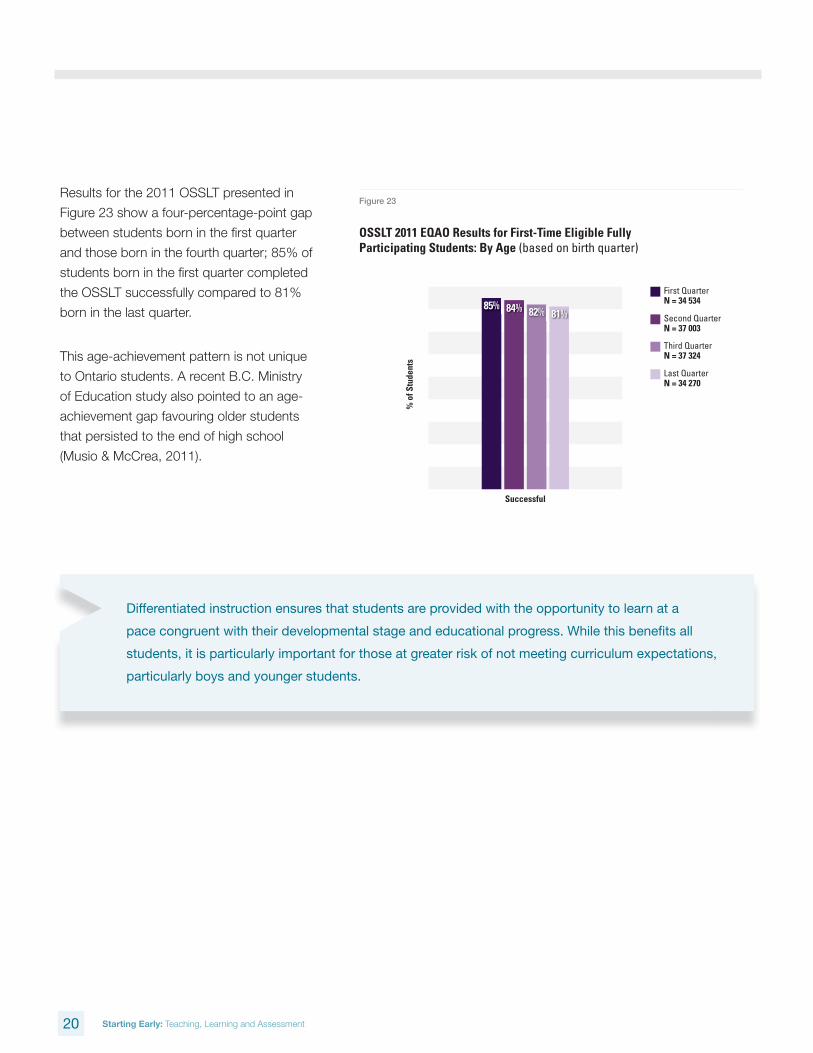
Results for the 2011 OSSLT presented in
Figure 23 show a four-percentage-point gap
between students born in the fi rst quarter
and those born in the fourth quarter; 85% of
students born in the fi rst quarter completed
the OSSLT successfully compared to 81%
born in the last quarter.
This age-achievement pattern is not unique
to Ontario students. A recent B.C. Ministry
of Education study also pointed to an age-
achievement gap favouring older students
that persisted to the end of high school
(Musio & McCrea, 2011).
Differentiated instruction ensures that students are provided with the opportunity to learn at a
pace congruent with their developmental stage and educational progress. While this benefi ts all
students, it is particularly important for those at greater risk of not meeting curriculum expectations,
particularly boys and younger students.
% o
f Stu
dent
s
85% 84% 82% 81%
Successful
First QuarterN = 34 534
Second QuarterN = 37 003
Third QuarterN = 37 324
Last QuarterN = 34 270
OSSLT 2011 EQAO Results for First-Time Eligible Fully Participating Students: By Age (based on birth quarter)
23Figure 23
% o
f Stu
dent
s
85% 84% 82% 81%
Successful
First QuarterN = 34 534
Second QuarterN = 37 003
Third QuarterN = 37 324
Last QuarterN = 34 270
OSSLT 2011 EQAO Results for First-Time Eligible Fully Participating Students: By Age (based on birth quarter)
23
21 Starting Early: Teaching, Learning and Assessment
Pathways to Grade 3
Another way of examining the data, as suggested by Offord Centre researchers, is to consider the four different pathways by which students can reach Grade 3.
The fi rst two groups highlighted below,
resilient and those continuing on track,
represent the pathways of those who
successfully achieved the provincial standards
in Grade 3; the second two groups, continuing
at risk and newly at risk, did not meet these
standards.
n Resilient: Students deemed not on track
in kindergarten (i.e., vulnerable or at risk in
one or more domains) but subsequently
achieved the provincial standards in Grade 3.
n Continuing on Track: Students deemed
on track in kindergarten (i.e., ready or very
ready in all fi ve domains) and achieved the
provincial standards in Grade 3.
n Continuing at Risk: Students deemed
not on track in kindergarten and did not
achieve the provincial standards in Grade 3.
n Newly at Risk: Students deemed on
track in kindergarten but did not achieve
the provincial standards in Grade 3.
In the following section, we examine
pathways for the total matched sample
and for the following six subgroups: male
students; female students; older students;
younger students; English language learners
and students with special education needs.
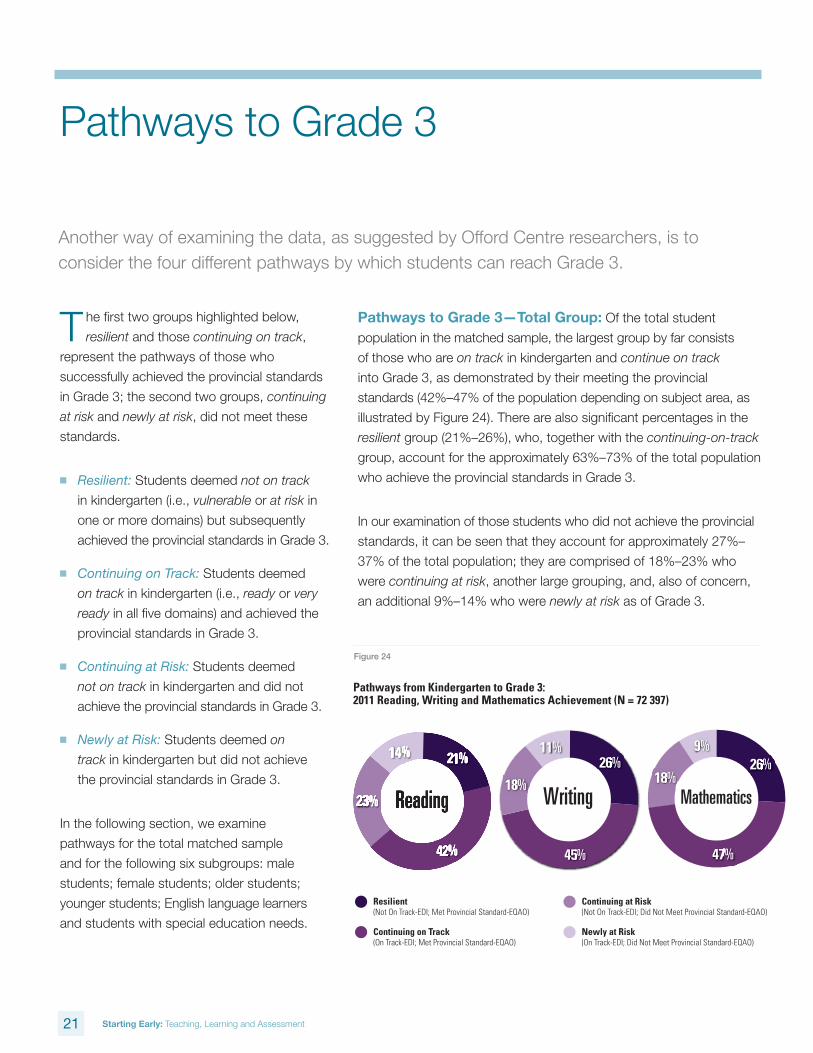
Pathways to Grade 3—Total Group: Of the total student
population in the matched sample, the largest group by far consists
of those who are on track in kindergarten and continue on track
into Grade 3, as demonstrated by their meeting the provincial
standards (42%–47% of the population depending on subject area, as
illustrated by Figure 24). There are also signifi cant percentages in the
resilient group (21%–26%), who, together with the continuing-on-track
group, account for the approximately 63%–73% of the total population
who achieve the provincial standards in Grade 3.
In our examination of those students who did not achieve the provincial
standards, it can be seen that they account for approximately 27%–
37% of the total population; they are comprised of 18%–23% who
were continuing at risk, another large grouping, and, also of concern,
an additional 9%–14% who were newly at risk as of Grade 3.
42%
21%14%
23% Reading
422%%
211%%144%%
233%% Reading
45%
26%
18%
11%
Writing Mathematics
47%
26%18%
9%
Pathways from Kindergarten to Grade 3: 2011 Reading, Writing and Mathematics Achievement (N = 72 397)
24
Resilient (Not On Track-EDI; Met Provincial Standard-EQAO)
Continuing on Track (On Track-EDI; Met Provincial Standard-EQAO)
Continuing at Risk (Not On Track-EDI; Did Not Meet Provincial Standard-EQAO)
Newly at Risk (On Track-EDI; Did Not Meet Provincial Standard-EQAO)
Figure 24
42%
21%14%
23% Reading
455%
266%
188%
11%
Writing Mathematics
47%
26%18%
9%
Pathways from Kindergarten to Grade 3: 2011 Reading, Writing and Mathematics Achievement (N = 72 397)
24
Resilient (Not On Track-EDI; Met Provincial Standard-EQAO)
Continuing on Track (On Track-EDI; Met Provincial Standard-EQAO)
Continuing at Risk (Not On Track-EDI; Did Not Meet Provincial Standard-EQAO)
Newly at Risk (On Track-EDI; Did Not Meet Provincial Standard-EQAO)
42%
21%14%
23% Reading
45%
26%
18%
11%
Writing Mathematics
477%
266%188%
99%
Pathways from Kindergarten to Grade 3: 2011 Reading, Writing and Mathematics Achievement (N = 72 397)
24
Resilient (Not On Track-EDI; Met Provincial Standard-EQAO)
Continuing on Track (On Track-EDI; Met Provincial Standard-EQAO)
Continuing at Risk (Not On Track-EDI; Did Not Meet Provincial Standard-EQAO)
Newly at Risk (On Track-EDI; Did Not Meet Provincial Standard-EQAO)
22 Starting Early: Teaching, Learning and Assessment
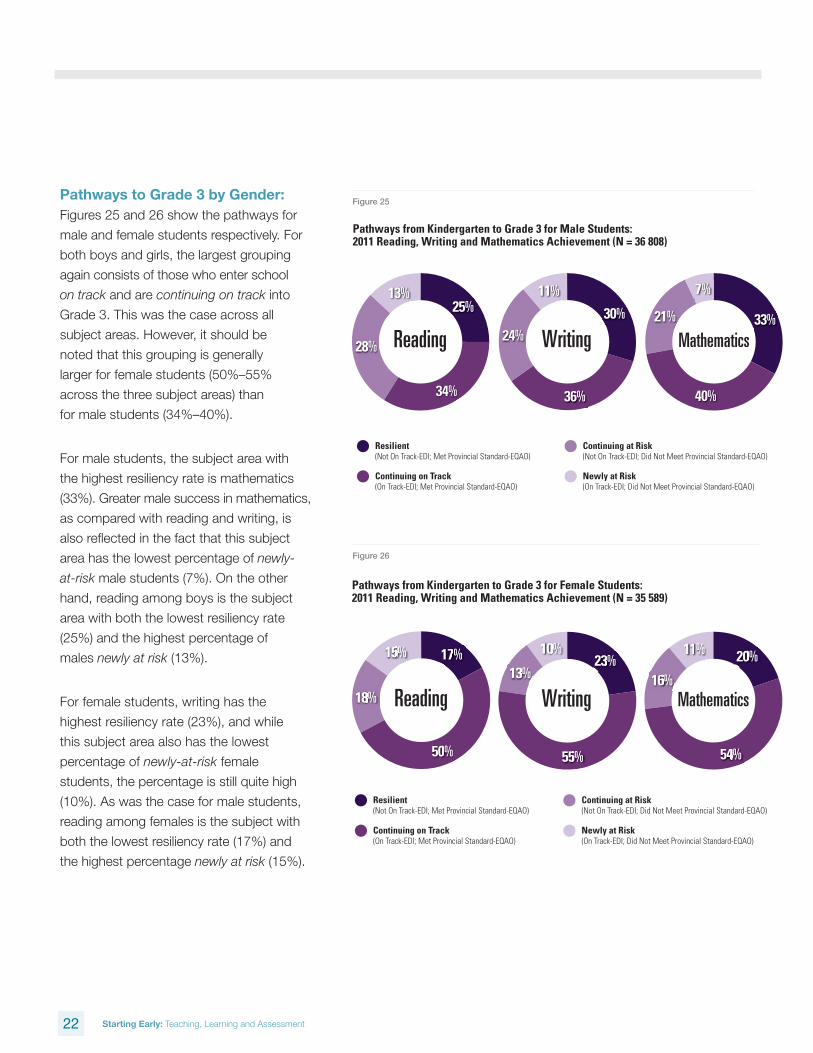
Pathways to Grade 3 by Gender: Figures 25 and 26 show the pathways for
male and female students respectively. For
both boys and girls, the largest grouping
again consists of those who enter school
on track and are continuing on track into
Grade 3. This was the case across all
subject areas. However, it should be
noted that this grouping is generally
larger for female students (50%–55%
across the three subject areas) than
for male students (34%–40%).
For male students, the subject area with
the highest resiliency rate is mathematics
(33%). Greater male success in mathematics,
as compared with reading and writing, is
also refl ected in the fact that this subject
area has the lowest percentage of newly-
at-risk male students (7%). On the other
hand, reading among boys is the subject
area with both the lowest resiliency rate
(25%) and the highest percentage of
males newly at risk (13%).
For female students, writing has the
highest resiliency rate (23%), and while
this subject area also has the lowest
percentage of newly-at-risk female
students, the percentage is still quite high
(10%). As was the case for male students,
reading among females is the subject with
both the lowest resiliency rate (17%) and
the highest percentage newly at risk (15%).
23% 26% 9%
Pathways from Kindergarten to Grade 3 for Male Students:2011 Reading, Writing and Mathematics Achievement (N = 36 808)
Resilient (Not On Track-EDI; Met Provincial Standard-EQAO)
Continuing on Track (On Track-EDI; Met Provincial Standard-EQAO)
Continuing at Risk (Not On Track-EDI; Did Not Meet Provincial Standard-EQAO)
Newly at Risk (On Track-EDI; Did Not Meet Provincial Standard-EQAO)
34%
28%
25%13%
Reading Writing
36%
30%
24%
11%
Mathematics
40%
33%21%
7%
25Figure 25
Pathways from Kindergarten to Grade 3 for Female Students: 2011 Reading, Writing and Mathematics Achievement (N = 35 589)
188%
177%155%
Reading
55%500%
23%13%
10%
Writing
54%
20%
16%
11%
Mathematics
26
Resilient (Not On Track-EDI; Met Provincial Standard-EQAO)
Continuing on Track (On Track-EDI; Met Provincial Standard-EQAO)
Continuing at Risk (Not On Track-EDI; Did Not Meet Provincial Standard-EQAO)
Newly at Risk (On Track-EDI; Did Not Meet Provincial Standard-EQAO)
Figure 26
Pathways from Kindergarten to Grade 3 for Female Students: 2011 Reading, Writing and Mathematics Achievement (N = 35 589)
18%
17%15%
Reading
555%50%
233%133%
100%
Writing
54%
20%
16%
11%
Mathematics
26
Resilient (Not On Track-EDI; Met Provincial Standard-EQAO)
Continuing on Track (On Track-EDI; Met Provincial Standard-EQAO)
Continuing at Risk (Not On Track-EDI; Did Not Meet Provincial Standard-EQAO)
Newly at Risk (On Track-EDI; Did Not Meet Provincial Standard-EQAO)
Pathways from Kindergarten to Grade 3 for Female Students: 2011 Reading, Writing and Mathematics Achievement (N = 35 589)
18%
17%15%
Reading
55%50%
23%13%
10%
Writing
544%
200%
166%
11%
Mathematics
26
Resilient (Not On Track-EDI; Met Provincial Standard-EQAO)
Continuing on Track (On Track-EDI; Met Provincial Standard-EQAO)
Continuing at Risk (Not On Track-EDI; Did Not Meet Provincial Standard-EQAO)
Newly at Risk (On Track-EDI; Did Not Meet Provincial Standard-EQAO)
23 Starting Early: Teaching, Learning and Assessment
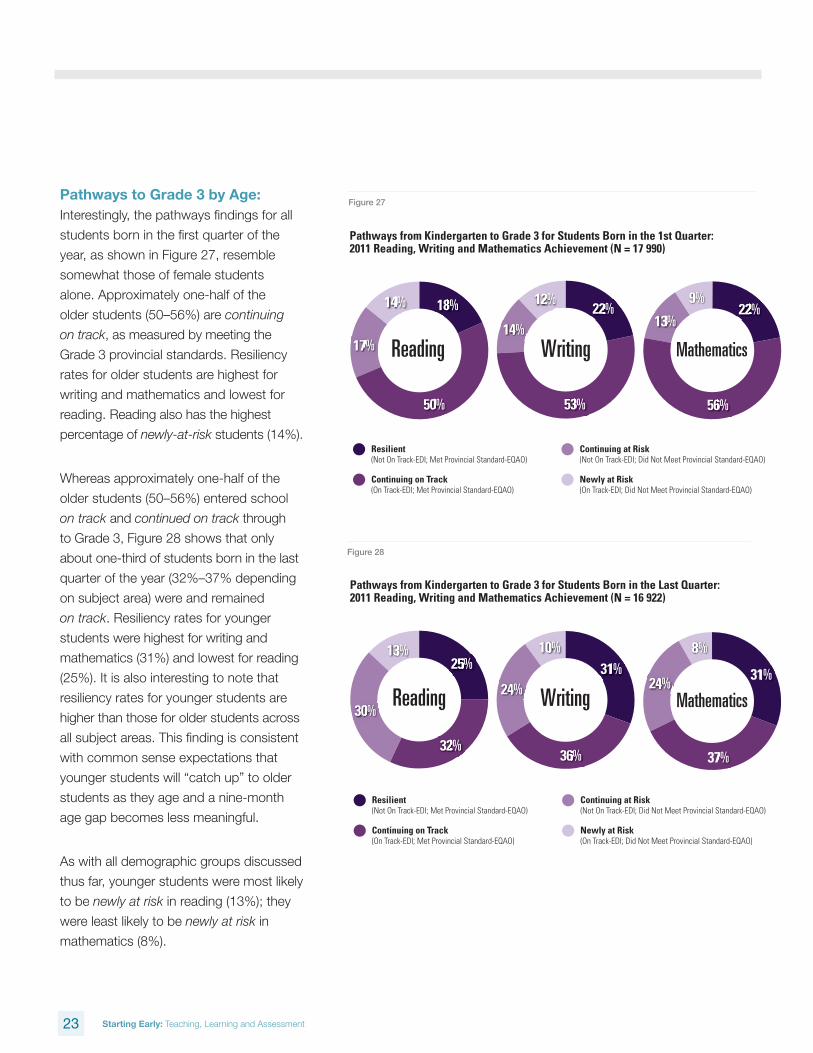
Pathways to Grade 3 by Age: Interestingly, the pathways fi ndings for all
students born in the fi rst quarter of the
year, as shown in Figure 27, resemble
somewhat those of female students
alone. Approximately one-half of the
older students (50–56%) are continuing
on track, as measured by meeting the
Grade 3 provincial standards. Resiliency
rates for older students are highest for
writing and mathematics and lowest for
reading. Reading also has the highest
percentage of newly-at-risk students (14%).
Whereas approximately one-half of the
older students (50–56%) entered school
on track and continued on track through
to Grade 3, Figure 28 shows that only
about one-third of students born in the last
quarter of the year (32%–37% depending
on subject area) were and remained
on track. Resiliency rates for younger
students were highest for writing and
mathematics (31%) and lowest for reading
(25%). It is also interesting to note that
resiliency rates for younger students are
higher than those for older students across
all subject areas. This fi nding is consistent
with common sense expectations that
younger students will “catch up” to older
students as they age and a nine-month
age gap becomes less meaningful.
As with all demographic groups discussed
thus far, younger students were most likely
to be newly at risk in reading (13%); they
were least likely to be newly at risk in
mathematics (8%).
Pathways from Kindergarten to Grade 3 for Students Born in the 1st Quarter: 2011 Reading, Writing and Mathematics Achievement (N = 17 990)
500%
188%
177%
144%
Reading
53%
22%12%
14%
Writing
56%
22%13%
9%
Mathematics
27
Resilient (Not On Track-EDI; Met Provincial Standard-EQAO)
Continuing on Track (On Track-EDI; Met Provincial Standard-EQAO)
Continuing at Risk (Not On Track-EDI; Did Not Meet Provincial Standard-EQAO)
Newly at Risk (On Track-EDI; Did Not Meet Provincial Standard-EQAO)
Figure 27
Pathways from Kindergarten to Grade 3 for Students Born in the Last Quarter:2011 Reading, Writing and Mathematics Achievement (N = 16 922)
322%
300%
255%133%
Reading
36%
31%24%
10%
Writing31%
37%
24%
8%
Mathematics
28
Resilient (Not On Track-EDI; Met Provincial Standard-EQAO)
Continuing on Track (On Track-EDI; Met Provincial Standard-EQAO)
Continuing at Risk (Not On Track-EDI; Did Not Meet Provincial Standard-EQAO)
Newly at Risk (On Track-EDI; Did Not Meet Provincial Standard-EQAO)
Figure 28
Pathways from Kindergarten to Grade 3 for Students Born in the 1st Quarter: 2011 Reading, Writing and Mathematics Achievement (N = 17 990)
50%
18%
17%
14%
Reading
533%
222%122%
144%
Writing
56%
22%13%
9%
Mathematics
27
Resilient (Not On Track-EDI; Met Provincial Standard-EQAO)
Continuing on Track (On Track-EDI; Met Provincial Standard-EQAO)
Continuing at Risk (Not On Track-EDI; Did Not Meet Provincial Standard-EQAO)
Newly at Risk (On Track-EDI; Did Not Meet Provincial Standard-EQAO)
Pathways from Kindergarten to Grade 3 for Students Born in the 1st Quarter: 2011 Reading, Writing and Mathematics Achievement (N = 17 990)
50%
18%
17%
14%
Reading
53%
22%12%
14%
Writing
566%
222%133%
99%
Mathematics
27
Resilient (Not On Track-EDI; Met Provincial Standard-EQAO)
Continuing on Track (On Track-EDI; Met Provincial Standard-EQAO)
Continuing at Risk (Not On Track-EDI; Did Not Meet Provincial Standard-EQAO)
Newly at Risk (On Track-EDI; Did Not Meet Provincial Standard-EQAO)
Pathways from Kindergarten to Grade 3 for Students Born in the Last Quarter:2011 Reading, Writing and Mathematics Achievement (N = 16 922)
32%
30%
25%13%
Reading
366%
311%244%
100%
Writing31%
37%
24%
8%
Mathematics
28
Resilient (Not On Track-EDI; Met Provincial Standard-EQAO)
Continuing on Track (On Track-EDI; Met Provincial Standard-EQAO)
Continuing at Risk (Not On Track-EDI; Did Not Meet Provincial Standard-EQAO)
Newly at Risk (On Track-EDI; Did Not Meet Provincial Standard-EQAO)
Pathways from Kindergarten to Grade 3 for Students Born in the Last Quarter:2011 Reading, Writing and Mathematics Achievement (N = 16 922)
32%
30%
25%13%
Reading
36%
31%24%
10%
Writing311%
377%
244%
88%
Mathematics
28
Resilient (Not On Track-EDI; Met Provincial Standard-EQAO)
Continuing on Track (On Track-EDI; Met Provincial Standard-EQAO)
Continuing at Risk (Not On Track-EDI; Did Not Meet Provincial Standard-EQAO)
Newly at Risk (On Track-EDI; Did Not Meet Provincial Standard-EQAO)
24 Starting Early: Teaching, Learning and Assessment
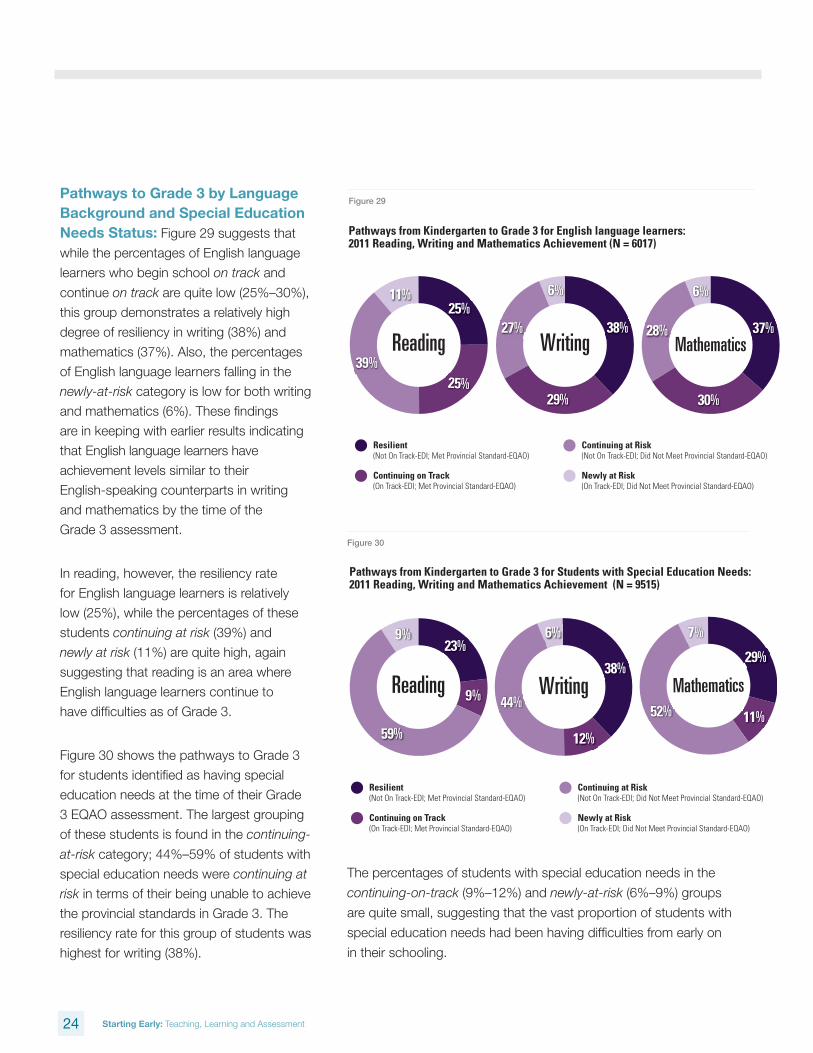
Pathways to Grade 3 by Language Background and Special Education Needs Status: Figure 29 suggests that
while the percentages of English language
learners who begin school on track and
continue on track are quite low (25%–30%),
this group demonstrates a relatively high
degree of resiliency in writing (38%) and
mathematics (37%). Also, the percentages
of English language learners falling in the
newly-at-risk category is low for both writing
and mathematics (6%). These fi ndings
are in keeping with earlier results indicating
that English language learners have
achievement levels similar to their
English-speaking counterparts in writing
and mathematics by the time of the
Grade 3 assessment.
In reading, however, the resiliency rate
for English language learners is relatively
low (25%), while the percentages of these
students continuing at risk (39%) and
newly at risk (11%) are quite high, again
suggesting that reading is an area where
English language learners continue to
have diffi culties as of Grade 3.
Figure 30 shows the pathways to Grade 3
for students identifi ed as having special
education needs at the time of their Grade
3 EQAO assessment. The largest grouping
of these students is found in the continuing-
at-risk category; 44%–59% of students with
special education needs were continuing at
risk in terms of their being unable to achieve
the provincial standards in Grade 3. The
resiliency rate for this group of students was
highest for writing (38%).
Pathways from Kindergarten to Grade 3 for English language learners:2011 Reading, Writing and Mathematics Achievement (N = 6017)
Resilient (Not On Track-EDI; Met Provincial Standard-EQAO)
Continuing on Track (On Track-EDI; Met Provincial Standard-EQAO)
Continuing at Risk (Not On Track-EDI; Did Not Meet Provincial Standard-EQAO)
Newly at Risk (On Track-EDI; Did Not Meet Provincial Standard-EQAO)
39%
25%
25%
11%
Reading38%
29%
27%
6%
Writing37%
30%
28%
6%
Mathematics
29Figure 29
Pathways from Kindergarten to Grade 3 for Students with Special Education Needs:2011 Reading, Writing and Mathematics Achievement (N = 9515)
Resilient (Not On Track-EDI; Met Provincial Standard-EQAO)
Continuing on Track (On Track-EDI; Met Provincial Standard-EQAO)
Continuing at Risk (Not On Track-EDI; Did Not Meet Provincial Standard-EQAO)
Newly at Risk (On Track-EDI; Did Not Meet Provincial Standard-EQAO)
18%23% 20%59%
9%
9%23%
Reading44%
38%
12%
6%
Writing52%
29%
11%
7%
Mathematics
30Figure 30
The percentages of students with special education needs in the
continuing-on-track (9%–12%) and newly-at-risk (6%–9%) groups
are quite small, suggesting that the vast proportion of students with
special education needs had been having diffi culties from early on
in their schooling.
25 Starting Early: Teaching, Learning and Assessment
Summary and Conclusions
The current research confirmed our thinking on a number of issues, provided new insights and raised questions for further study.
The data confirmed that there are a
substantial number of Ontario students
who are vulnerable or at risk in kindergarten
and that students’ readiness at this stage of
their schooling is related to their later school
achievement. However, the data also clearly
indicated that lack of readiness does not in and
of itself mean that students will not, or cannot,
succeed. Conversely, the study confirmed that
school readiness in kindergarten does not
guarantee subsequent academic success.
Nor was it surprising to learn that boys
and younger students are more likely to
be vulnerable or at risk in kindergarten than
girls and older students. There have been a
considerable number of recent studies looking
at the relationship between gender and
achievement in particular, and our research
confirmed that gender differences in terms
of school readiness begin in kindergarten.
Gender-achievement differences favouring
female students were also shown to persist
into the junior division and through into high
school in the area of literacy.
What was of some surprise was the finding
that differences in readiness between older
and younger students in kindergarten have
an achievement impact that persists not only into Grades 3 and 6 but
also to some extent right through to high school. Furthermore, while
lack of school readiness in kindergarten clearly is related to later
achievement, this lack of readiness on the part of younger students
only partly accounted for the differences in achievement observed
between older and younger Grade 3 students. The cohort-tracking
aspect of our research demonstrated that age effects can be observed
independent of school readiness status, at least up until the end of
Grade 3.
One obvious question that arises from the current findings of persistent
age effects is the following: To what extent are age effects absolute or
relative? That is to say, if the starting age for kindergarten were changed
so that the cut-off date was June 30 instead of December 31, would
age effects largely be eliminated since the cohort would now be
comprised of slightly older students with presumably correspondingly
higher levels of readiness for school as measured by the EDI?
We cannot conclusively answer this question for many reasons, and it
is a question that clearly warrants further study. However, we can say
that the current study’s data suggest that changing the cut-off date
would increase the proportion of students who are on track in
kindergarten, thereby likely increasing the chances of success for the
overall cohort. At the same time, the data suggest that relative age is
a factor that is independent of readiness status in kindergarten—the
youngest students would in all likelihood continue to evidence lower
levels of achievement as a group than older students.
In conclusion, please find a summary of our major findings on the
following pages.
26 Starting Early: Teaching, Learning and Assessment
n Approximately one in four kindergarten
students in Ontario are in the vulnerable or
at-risk categories in two or more of the five
EDI domains.
n The domain of language and cognitive
development had the largest percentage
of students in the vulnerable and at-risk
categories.
n There are proportionately more male
kindergarten students as well as younger
students in the vulnerable and at-risk
categories in kindergarten across the five
EDI domains.
n English language learners are more likely to
fall into the vulnerable or at-risk groups than
English-speaking students.
n Approximately four out of five students
designated as having special education
needs based on Grade 3 EQAO records
had been assessed in kindergarten as being
vulnerable or at risk in one or more of the
five domains; approximately two-thirds were
in the vulnerable or at-risk group in two or
more domains.
n Of the total student population included in the matched sample,
63%–73% achieved the provincial standards in the Grade 3 EQAO
assessment of reading, writing and mathematics. This group
included the 42%–47% who had been rated on track in
kindergarten and were continuing on track. The remaining 21%–
26% of students achieving the provincial standards comprised a
grouping considered resilient—while they were deemed vulnerable
or at risk in at least one domain in kindergarten, they had
overcome earlier challenges to achieve the provincial standards.
n Students with low EDI scores—those in the vulnerable or at-risk
groups—are much less likely to achieve the provincial standard
on the Grade 3 EQAO reading, writing and mathematics
assessment than those with high EDI scores— those students
deemed to be ready or very ready in kindergarten. This general
finding applied regardless of gender, age, language background or
special education needs status.
n Many students in the vulnerable and at-risk categories defy the
odds and are able to reach provincial standards in Grade 3.
n Of those students who were considered ready in kindergarten,
a large percentage did not meet the provincial standards on the
Grade 3 EQAO assessment (16% to 25%).
n Female students across all three readiness groups are more
likely to achieve the provincial standard in Grade 3 writing; male
students within each readiness group are more likely to achieve
the standard in Grade 3 mathematics, although, as noted earlier,
because there are more girls in the on-track group overall,
slightly more girls achieve the standard than boys.
Data Highlights
EDI Information About Ontario Kindergarten Students in English-Language Schools
Tracking Ontario Student Performance

27 Starting Early: Teaching, Learning and Assessment
n A gender gap is also observed in Grade 3
reading achievement favouring female
students who had been on track in
kindergarten. In contrast, both male and
female students with low EDI scores in
kindergarten had similar reading-
achievement levels in Grade 3.
n Older students have higher achievement
than younger students in all Grade 3 subject
areas. This is true when considering students
who were on track in kindergarten as well as
those who were not on track at school.
n English language learners have greater
difficulty achieving the provincial standard
in Grade 3 reading than English-speaking
students who have a similar readiness
status in kindergarten. However, this is
not the case for either Grade 3 writing or
mathematics; after three or more years in
Ontario schools, English language learners
attain a level of achievement in these two
subject areas that is similar to that of their
English-speaking counterparts.
n Considerably fewer students with special
education needs meet provincial standards
in Grade 3 than those without special
education needs. This is true for students
with special education needs who were
on track in kindergarten as well as for
those who were not on track. The
disparity is greatest in the areas of
reading and mathematics.
n Longitudinal analysis suggests that patterns of poor school
attendance, which are associated with poor school achievement,
begin as early as kindergarten.
n Students who switched schools between kindergarten and Grade 3
were less likely to achieve the provincial standards in EQAO’s
Grade 3 assessment.
n The gender gap observed in the EDI assessment persists insofar
as girls outperform boys on EQAO student-achievement measures
in reading and writing in Grades 3 and 6 and on the OSSLT in
high school.
n The age gap favouring older students in the same grade was also
shown to persist—the proportion of older students who achieved
the provincial standards was larger than that of younger students
in Grades 3 and 6. Other data suggest that age effects persist into
high school. Notably, older students were more likely to succeed
on the OSSLT than younger students. As well, older students
were more highly represented in the Grade 9 academic
mathematics program; younger students were more highly
represented in the Grade 9 applied mathematics program.
28 Starting Early: Teaching, Learning and Assessment
Pathways to Grade 3
n The largest proportion of students who
achieve the provincial standards in reading,
writing and mathematics in Grade 3 were
on track in kindergarten.
n Of concern were the 9%–14% of Grade 3
students who were newly at risk, having
been deemed ready in kindergarten, but
who were unable to achieve the provincial
standards in Grade 3, particularly in reading.
n Also of concern were the 18%–23% of
the population who were not on track in
kindergarten and continued at risk in Grade 3
(i.e., were unsuccessful in meeting the
Grade 3 provincial standards).
n Reading is the subject area with the lowest
rate of resiliency and highest percentage
of students in the newly and continuing-at-
risk categories.
n Resiliency rates and percentages of newly-
at-risk students suggest that mathematics is
the area where male students achieve best
during the primary division; female students
appear to do best in writing.
n While the pathways data confirm the persistence of the age gap
favouring older students over younger students, the results also
show a higher degree of resiliency among younger than older
students. These data suggest that many younger students who
were behind in kindergarten catch up to their older peers by the
time they reach Grade 3.
n Reading is the area where English language learners have
the greatest difficulties in the primary division.
n Approximately half of the students with special education needs
fall into the continuing-at-risk category; they were not on track in
kindergarten and did not meet the provincial standards in Grade 3.
They demonstrated the highest degree of resiliency in the area of
writing; reading is the subject that appears to present the most
challenge, as was the case for most other groups of students.
29 Starting Early: Teaching, Learning and Assessment
Primary school educators face both a considerable professional challenge as well as a remarkable opportunity to make a substantive difference in the lives of their young students.
Questions for Educators to Reflect On
In the foregoing, we have highlighted some
research and associated implications that
educators of young children may wish to reflect
on. Following are some questions to consider
in determining possible actions for a school or
for teaching practices.
1. What early-years programs and resources
are available in the community to support
learning for young children and their
parents?
2. How are students assessed in kindergarten?
What do the most recent assessments
reveal about the support children require in
this stage of their development? What areas
of their development display the greatest
need for focused support?
n Physical development?
n Social skills?
n Language development?
n Emotional maturity?
n Cognitive development?
3. Based on the results of a school’s last two EDI assessments,
are there particular groups of students who seem to require
intervention and support?
n Boys?
n Girls?
n Younger students?
n Students whose first language is other than English?
30 Starting Early: Teaching, Learning and Assessment
4. What intervention strategies are being
used to meet the needs of students in
the primary division? Are there particular
approaches to be considered for boys?
For girls? For younger students?
For English language learners? For
students with special education needs?
What insights does the kindergarten
curriculum provide about individualized,
developmentally appropriate teaching and
learning approaches for young students?
Links: Full-Day Early Learning Kindergarten for
Four- and Five-Year-Olds: A Reference Guide for
Educators
Both the program and reference guide for
educators can be found at:
www.edu.gov.on.ca/eng/curriculum/elementary/
kindergarten.html.
5. What support and guidance can be given to
parents of students who require additional
support? Has the school emphasized the
value of parent engagement and provided
opportunities for parents to become
involved in their children’s education? Has
it communicated clearly to parents the
importance of regular school attendance,
and does it consistently follow up with
students who are absent?
6. How can one share the following documents with parents?
n “Tips and Tools for Parents”
n “Parenting and Family Literacy Centres”
n Reading and Writing with Your Child
n Doing Mathematics with Your Child
These resources can be found at www.edu.gov.on.ca.
7. Are parents and educators aware of EQAO resources
available at www.eqao.com?
31 Starting Early: Teaching, Learning and Assessment
Calman, R. C. (2012). Starting early: Teaching, learning and assessment. Research Bulletin. Toronto, ON: Education Quality and Accountability Office.
Education Quality and Accountability Office. (2011). Ontario student achievement: EQAO’s provincial elementary school report—Results of the 2010–2011 Assessments of Reading, Writing and Mathematics, Primary Division (Grades 1–3) and Junior Division (Grades 4–6). Toronto, ON: Queen’s Printer for Ontario.
Education Quality and Accountability Office. (2011). Ontario Student Achievement: EQAO’s Provincial Secondary School Report: Results of the Grade 9 Assessment of Mathematics and the Ontario Secondary School Literacy Test, 2010–2011. Toronto, ON: Queen’s Printer for Ontario.
Education Quality and Accountability Office. (2012). EQAO’s technical report for the 2010–2011 assessments. Toronto, ON: Queen’s Printer for Ontario.
Janus, M., Duku, E., & Hughes, D. (2010). Patterns of school readiness among selected groups of Canadian children: Children with special needs and children with diverse language backgrounds. Ottawa, ON: Canadian Council for Learning. Retrieved from http://www.ccl-cca.ca/.
Janus, M., Brinkman, S., Duku, E., Hertzman, C., Santos, R., Sayers, M., & Schroeder, J. (2007). The early development instrument: A population-based measure for communities. A handbook on development, properties, and use. Hamilton, ON: Offord Centre for Child Studies. Retrieved from http://www.offordcentre.com/readiness/pubs/2007_12_FINAL.EDI.HANDBOOK.pdf
McCain, M. N., & Mustard, J. F. (1999). Reversing the real brain drain. Early years study. Toronto, ON: Ontario Children’s Secretariat.
McCain, M. N., Mustard J. F., & Shanker, S. (2007). Early years study 2: Putting science into action. Toronto, ON: Council for Early Childhood Development.
Ministry of Education, Ontario. (2007). English language learners: ESL and ELD programs and services: Policies and procedures for Ontario elementary and secondary schools, kindergarten to Grade 12. Toronto ON: Queen’s Printer for Ontario.
Musio, J., & McCrea, P. (2011). Birthdate and student achievement: The effects of school grouping practices in British Columbia. Victoria, BC: British Columbia Ministry of Education.
Organisation for Economic Co-Operation and Development. (2006). Starting Strong II: Early childhood education and care. Paris: Directorate for Education.
Pascal, C. E. (2009). With our best future in mind: Implementing early learning in Ontario. Summary of the Report to the Premier by the Special Advisor on Early Learning. Toronto, ON: Government of Ontario.
Shonkoff, J. P., & Phillips, D. (Eds.). (2000). From neurons to neighbourhoods: The science of early childhood development. Washington, DC: National Academy Press.
Willms, J. D. (2002). Standards of care: Investments to improve children’s educational outcomes in Latin America. In M. E. Young (Ed.), From early child development to human development (pp. 81–122). Washington, DC: The World Bank.
References
32 Starting Early: Teaching, Learning and Assessment
Appendix A: Details of Matching and Sampling Procedures
EDI and EQAO databases were matched over a period of three to four years in order to acquire a representative student sample from English-language schools across the province.
Work was begun in the late fall of 2010,
using the provincial EDI kindergarten
sample from 2004–05 to 2006–07. These records
were matched to Grade 3 EQAO provincial data
from 2008 to 2010. These three years were
selected, as they represented the most recent
three-year grouping for which Grade 3 data
were available and are referred to below as the
Year One Matched Sample. The following is a
description of the matching process.
Matching EDI and EQAO Results6
1. The set of student ID numbers, by board,
in the EDI data files were provided to EQAO.
These ID numbers had been submitted
by school boards for the collection of the
EDI data.
2. EQAO checked the ID numbers in the
Grade 3 EQAO data files (both Ontario
Education Number and school-board
assigned numbers) to determine which
matched the numbers in the EDI file. In
some cases, the school board had modified
the ID numbers provided for the EDI data
collection so that matches were not possible.
3. The EDI records were matched to EQAO records using student ID
numbers. Staff from the Offord Centre and EQAO met to conduct
the matching. Once the merged data file was created, the student
ID numbers were removed.
4. The following two merged data files were created:
n a file retaining school and board number, but with personal
information removed that might identify an individual student
(e.g., birth date and special education needs category).
n a file with school and board ID removed, but retaining all
information on individual students.
5. Some additional data checks were conducted on the merged
records for individual students (e.g., birth date data from EDI
and EQAO files), and students with mismatches were removed.
The Year One Matched Sample consisted of the following cohorts by
EDI year: N (2005) = 15 562; N (2006) = 32 604; N (2007) = 16 592
for a total of 64 758. Both the Offord Centre and EQAO researchers
independently analyzed the matched data sets. EQAO concentrated
on descriptive population statistics with a focus on demographic
analyses, while Offord researchers conducted statistical analyses to
investigate EDI’s predictive aspects.
6 The description of the matching sample was provided by Dr. Michael Kozlow, Director, Data and Support and Services, EQAO.
33 Starting Early: Teaching, Learning and Assessment
These two slightly different research tasks
resulted in slightly different databases being
used by EQAO and Offord Centre researchers.
The Offord researchers used a very stringent
selection procedure that involved dropping
cases with certain types of missing data to
ensure that statistics from different analysis
models could be compared directly and
excluding students with no school data and
those with a special education or inconsistent
gender designation. EQAO retained almost
the entire data set in conducting descriptive
statistics. Cases were dropped as required for
a particular analysis in instances of specific
missing data. Differences between the two
databases employed are highlighted below:
n EQAO retained all students in the database
and dropped cases on an analysis-by-
analysis basis if data were missing; Offord
excluded students for whom data were
missing on one or more variables used in
the analyses (n = 45 509).
n EQAO retained students with mismatched
gender data and used EQAO gender
information verified by principals; Offord
excluded students with different gender
designations between senior kindergarten
and Grade 3 along with students missing
gender at senior kindergarten (n = 1441).
n EQAO included students with special
education needs based on Grade 3 EQAO
records if required data elements were on
file; Offord excluded children with EDI
special education needs designations or in
cases where the special education needs
variable was missing (n = 2266).
n EQAO used students’ Grade 3 home school information as a
referent where required, but since school was not a variable in
the descriptive analyses, no cases were dropped for lack of
school data; Offord excluded children with no school data in
the 2006 school census data file (n = 3122).
Both EQAO and the Offord Centre researchers included only
students in publicly funded schools.
All analyses conducted by the Offord researchers and referenced
in this report are based on their final matched sample of 45 509
students from the Year One Matched Sample. EQAO’s first set of
detailed descriptive analyses, conducted in the winter and spring
of 2011, were also based on the Year One Matched Sample and
included 60 192 students. However, in January of 2012, with 2011
Grade 3 EQAO data available, EQAO added additional students to
the database in time for this report release.
The creation of the Year Two Matched Sample followed exactly the
same procedures as described above for the Year One Matched
Sample. The Year Two Matched Sample broadened the sample by
using data from a four- rather than a three-year period by adding
data from EDI 2007–2008 and EQAO 2010–2011. If a school board
was added that had been included previously based on an earlier
EDI/EQAO match, only the most recent data were used so that no
board was represented more than once.
All descriptive statistics are based on the Year Two Matched
Sample—the results obtained with the Year Two Matched Sample
mirrored very closely those in the Year One Matched Sample. The
Year Two Matched Sample comprised a total of 72 903 students
or 58% of the average EQAO provincial reporting population for
the years 2009–2011. A total of 2485 schools (or 74% of all
English-language schools) and 41 school boards (or 68% of all
English-language school boards) were represented in the Year
Two Matched Sample that was used for the vast majority of
analyses referenced in this report.
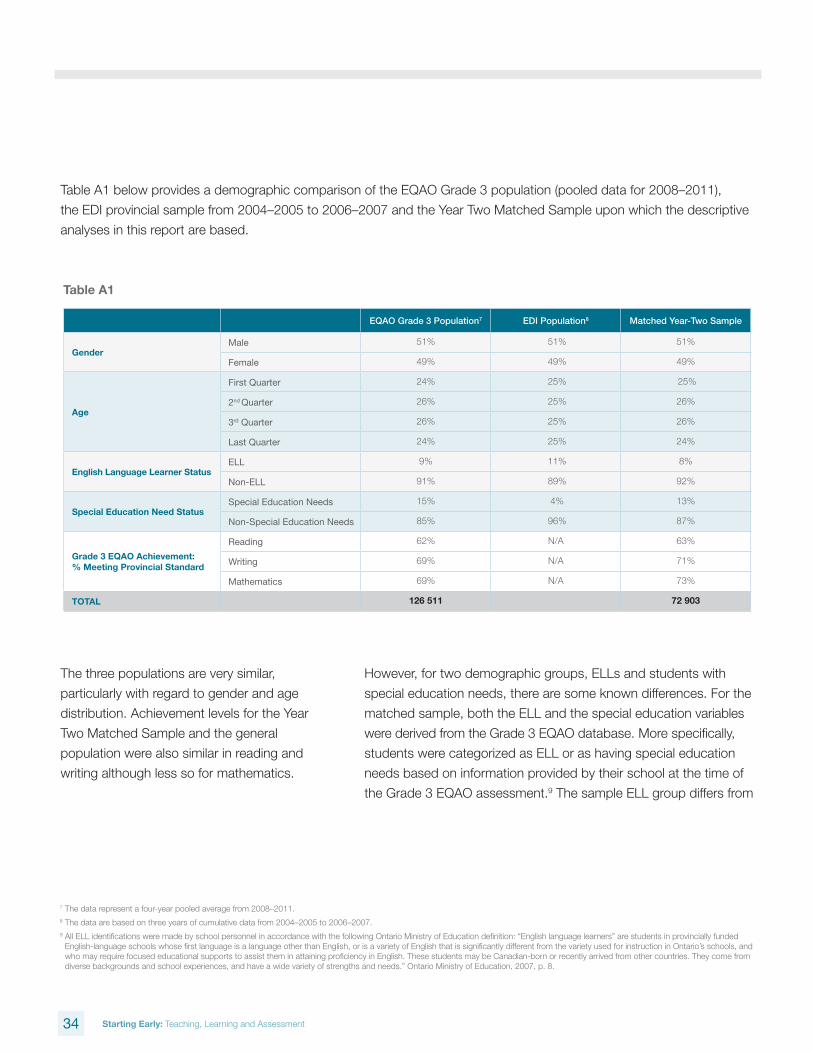
34 Starting Early: Teaching, Learning and Assessment
Table A1 below provides a demographic comparison of the EQAO Grade 3 population (pooled data for 2008–2011),
the EDI provincial sample from 2004–2005 to 2006–2007 and the Year Two Matched Sample upon which the descriptive
analyses in this report are based.
EQAO Grade 3 Population7 EDI Population8 Matched Year-Two Sample
GenderMale 51% 51% 51%
Female 49% 49% 49%
Age
First Quarter 24% 25% 25%
2nd Quarter 26% 25% 26%
3rd Quarter 26% 25% 26%
Last Quarter 24% 25% 24%
English Language Learner StatusELL 9% 11% 8%
Non-ELL 91% 89% 92%
Special Education Need StatusSpecial Education Needs 15% 4% 13%
Non-Special Education Needs 85% 96% 87%
Grade 3 EQAO Achievement: % Meeting Provincial Standard
Reading 62% N/A 63%
Writing 69% N/A 71%
Mathematics 69% N/A 73%
TOTAL 126 511 72 903
The three populations are very similar,
particularly with regard to gender and age
distribution. Achievement levels for the Year
Two Matched Sample and the general
population were also similar in reading and
writing although less so for mathematics.
However, for two demographic groups, ELLs and students with
special education needs, there are some known differences. For the
matched sample, both the ELL and the special education variables
were derived from the Grade 3 EQAO database. More specifically,
students were categorized as ELL or as having special education
needs based on information provided by their school at the time of
the Grade 3 EQAO assessment.9 The sample ELL group differs from
Table A1
7 The data represent a four-year pooled average from 2008–2011.8 The data are based on three years of cumulative data from 2004–2005 to 2006–2007.9 All ELL identifications were made by school personnel in accordance with the following Ontario Ministry of Education definition: “English language learners” are students in provincially funded
English-language schools whose first language is a language other than English, or is a variety of English that is significantly different from the variety used for instruction in Ontario’s schools, and who may require focused educational supports to assist them in attaining proficiency in English. These students may be Canadian-born or recently arrived from other countries. They come from diverse backgrounds and school experiences, and have a wide variety of strengths and needs.” Ontario Ministry of Education, 2007, p. 8.
35 Starting Early: Teaching, Learning and Assessment
the ELL population referenced in Grade 3
EQAO provincial reporting because, by virtue
of being in the matched sample and having
been assessed with the EDI, all students
within the matched sample had been in an
Ontario school since kindergarten. The ELL
grouping is comprised of English language
learners with at least three years of Ontario
English-language schooling. Students with an
ELL background who arrived in Canada after
kindergarten are not represented in the sample
but are included in the EQAO Grade 3
population database. The matched sample
ELL grouping referenced in this report also
may differ from the ELL grouping in EDI
files based on the timing of data collection.
A student deemed ELL in kindergarten may
not have been identified as ELL at Grade 3.
Similarly, students in the matched sample were
categorized as having special education needs
based on information provided by schools at
the time of the Grade 3 EQAO assessment. All
students with special education needs had been formally identified
by an Identification, Placement and Review Committee or had an
Individual Education Plan. Students whose sole exceptionality was
giftedness were not included. In contrast, EDI data pertaining to
students with special education needs likely includes only those
with very serious exceptionalities evidenced prior to school entry.
Therefore, it is not surprising to see in Table A1, that whereas only
4% of students were identified in EDI student records as having special
education needs, this figure rises to 15% in Grade 3 EQAO database
records. This is likely accounted for by the fact that while students
with severe exceptionalities may be identified immediately upon
school entry, identification of special education needs typically does
not take place until late in kindergarten or in Grade 1. Hence, data
in this report will vary from data in EDI reports pertaining to the
demographic special education needs variable.
While the matched sample is clearly not perfectly representative
of the total population, and an understanding of the definition of
the demographic subgroups is required to interpret results, given
the sample size and the understandings gleaned from the foregoing
analysis, it appears to be a reasonable approximation of the
total population.
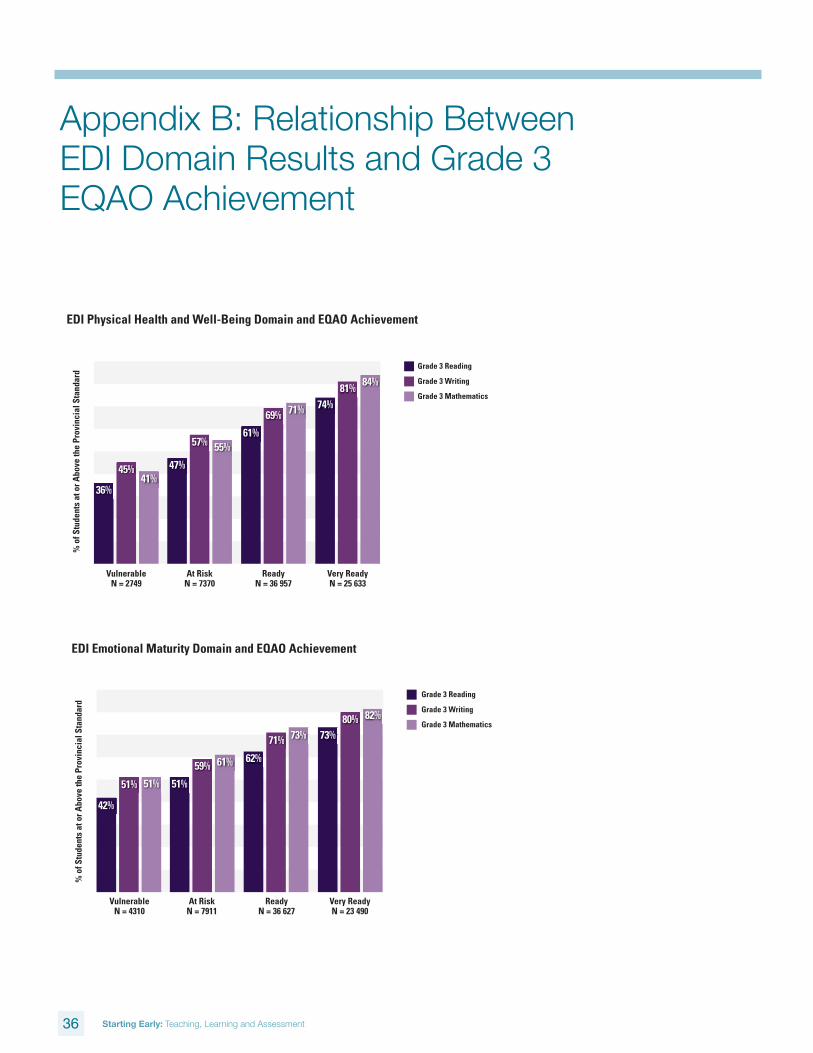
36 Starting Early: Teaching, Learning and Assessment
Appendix B: Relationship Between EDI Domain Results and Grade 3 EQAO Achievement
% o
f Stu
dent
s at
or A
bove
the
Prov
inci
al S
tand
ard
36%
45%41%
VulnerableN = 2749
47%
57% 55%
At RiskN = 7370
61%
69% 71%
ReadyN = 36 957
74%
81%84%
Very ReadyN = 25 633
Grade 3 Reading
Grade 3 Writing
Grade 3 Mathematics
EDI Physical Health and Well-Being Domain and EQAO Achievement
A-1
A-2
% o
f Stu
dent
s at
or A
bove
the
Prov
inci
al S
tand
ard
VulnerableN = 4310
At RiskN = 7911
ReadyN = 36 627
Very ReadyN = 23 490
EDI Emotional Maturity Domain and EQAO Achievement
Grade 3 Reading
Grade 3 Writing
Grade 3 Mathematics
42%
51% 51% 51%
59% 61% 62%
71% 73% 73%
80% 82%
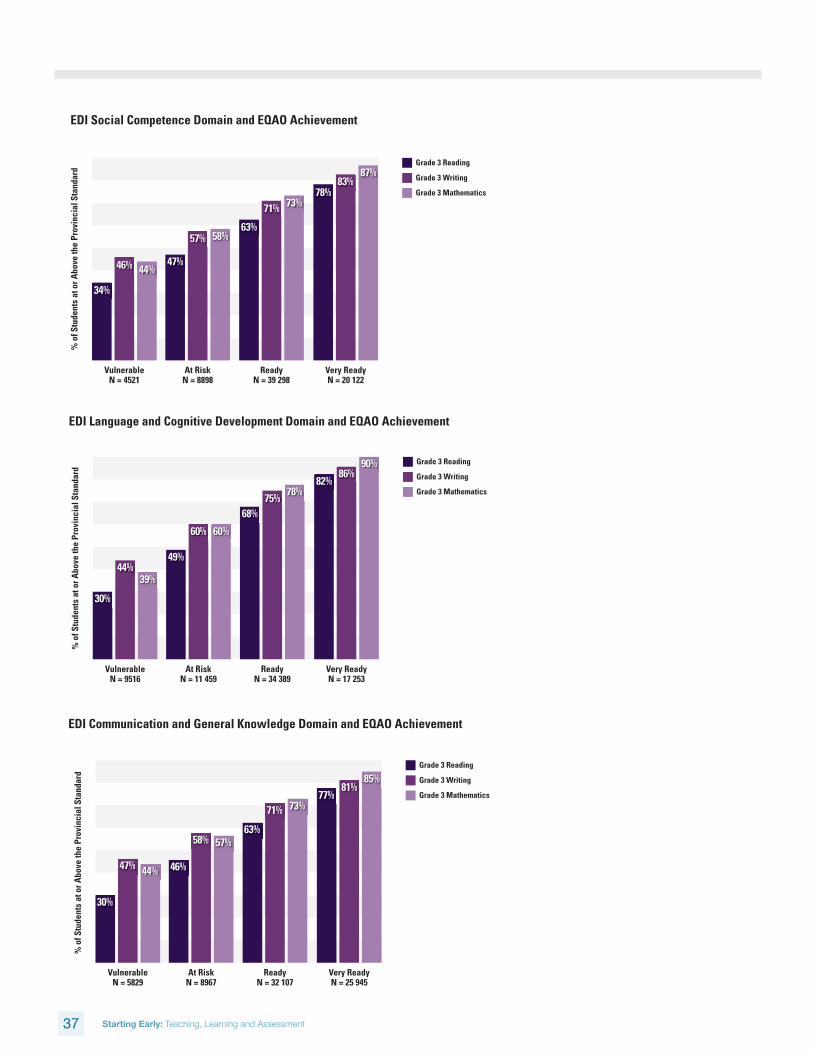
37 Starting Early: Teaching, Learning and Assessment
% o
f Stu
dent
s at
or A
bove
the
Prov
inci
al S
tand
ard
34%
46% 44%
VulnerableN = 4521
47%
57% 58%
At RiskN = 8898
63%
71% 73%
ReadyN = 39 298
78%83%
87%
Very ReadyN = 20 122
Grade 3 Reading
Grade 3 Writing
Grade 3 Mathematics
EDI Social Competence Domain and EQAO Achievement
A-3%
of S
tude
nts
at o
r Abo
ve th
e Pr
ovin
cial
Sta
ndar
d
30%
44%39%
VulnerableN = 9516
49%
60% 60%
At RiskN = 11 459
68%75%
78%
ReadyN = 34 389
82%86%
90%
Very ReadyN = 17 253
Grade 3 Reading
Grade 3 Writing
Grade 3 Mathematics
EDI Language and Cognitive Development Domain and EQAO Achievement
A-4
% o
f Stu
dent
s at
or A
bove
the
Prov
inci
al S
tand
ard
30%
47% 44%
VulnerableN = 5829
46%
58% 57%
At RiskN = 8967
63%
71% 73%
ReadyN = 32 107
77%81%
85%
Very ReadyN = 25 945
Grade 3 Reading
Grade 3 Writing
Grade 3 Mathematics
EDI Communication and General Knowledge Domain and EQAO Achievement
A-5
Education Quality and Accountability Office, 2 Carlton Street, Suite 1200, Toronto ON M5B 2M9, 1-888-327-7377, www.eqao.com
© 2013 Queen’s Printer for Ontario