Embed Size (px)
Citation preview

© 2
012
Car
negi
e Le
arni
ng
Chapter 8 Skills Practice 473
8Lesson 8.1 Skills Practice
Name Date
Start Your Day the Right WayGraphically Representing Data
Vocabulary
Choose the term that best completes each statement.
dot plot five number summary data distributionsymmetric discrete data skewed lefthistogram skewed right frequencybox-and-whisker plot bin continuous
1. A(n) is a graphical way to display quantitative data using vertical bars.
2. A data distribution is if the peak of the data is to the left side of the graph with only a few data points to the right side of the graph.
3. are data that have only a finite number of values or data that can be “counted.”
4. A(n) displays the data distribution based on a five number summary.
5. The overall shape of a graph which shows the way in which data are spread out or clustered together is called the .
6. are data which can take any numerical value within a range.
7. A data distribution is if the peak of the data is to the right side of the graph with only a few data points to the left side of the graph.
8. A(n) is a graph that shows how discrete data are distributed using a number line.
9. For a set of data, the consists of the minimum value, the first quartile, the median, the third quartile, and the maximum value.
10. A data distribution is if the peak of the data is in the middle of the graph. The left and right sides of the graph are nearly mirror images of each other.
11. The number of data values included in a given bin of a data set is called .
12. The bar width in a histogram that represents an interval of data is often referred to as a .
© 2
012
Car
negi
e Le
arni
ng
474 Chapter 8 Skills Practice
8 Lesson 8.1 Skills Practice page 2
Problem Set
Construct the graphical display for each given data set. Describe the distribution of the data.
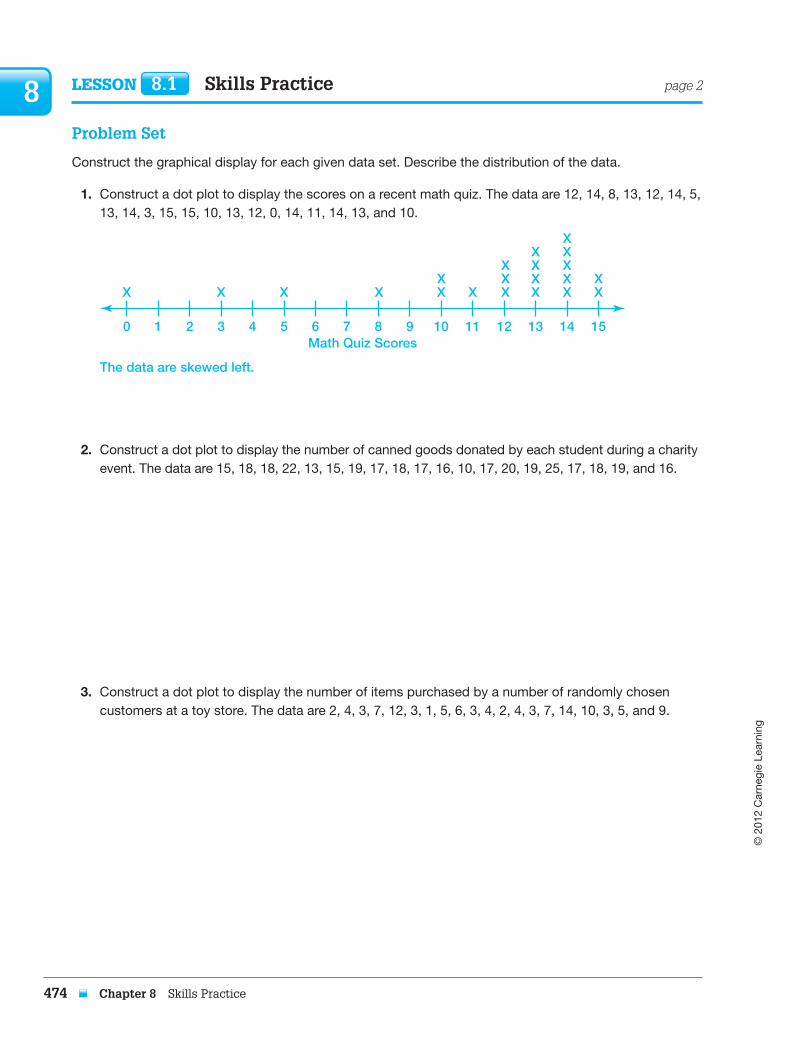
1. Construct a dot plot to display the scores on a recent math quiz. The data are 12, 14, 8, 13, 12, 14, 5, 13, 14, 3, 15, 15, 10, 13, 12, 0, 14, 11, 14, 13, and 10.
0 2 3 4 5 6 8 10 12 147 9 11 13
X
1
X X XX XX
XX
XXX
XXXX
XXXXX
Math Quiz Scores15
The data are skewed left.
2. Construct a dot plot to display the number of canned goods donated by each student during a charity event. The data are 15, 18, 18, 22, 13, 15, 19, 17, 18, 17, 16, 10, 17, 20, 19, 25, 17, 18, 19, and 16.
3. Construct a dot plot to display the number of items purchased by a number of randomly chosen customers at a toy store. The data are 2, 4, 3, 7, 12, 3, 1, 5, 6, 3, 4, 2, 4, 3, 7, 14, 10, 3, 5, and 9.
© 2
012
Car
negi
e Le
arni
ng
Chapter 8 Skills Practice 475
8Lesson 8.1 Skills Practice page 3
Name Date
4. Construct a box-and-whisker plot to display the number of pets owned by a number of randomly chosen students. The data are 2, 0, 5, 1, 2, 1, 0, 8, 4, 3, 9, 1, 2, 3, and 1.
5. Construct a box-and-whisker plot to display the scores on a recent science test. The data are 90, 95, 100, 70, 85, 65, 90, 80, 65, 70, 75, 80, 85, 80, 60, 80, 75, and 85.
6. Construct a box-and-whisker plot to display the number of miles from school that a number of randomly chosen students live. The data are 5, 10, 15, 12, 1, 14, 9, 15, 3, 10, 12, 15, 8, 14, 13, and 2.
© 2
012
Car
negi
e Le
arni
ng
476 Chapter 8 Skills Practice
8 Lesson 8.1 Skills Practice page 4
7. Construct a histogram to display the circumferences of the pumpkins in the Jeffiers’ family pumpkin crop. The data are 22.1, 35.6, 15.8, 36.9, 40.0, 28.5, 38.4, 20.4, 25.8, 34.1, 39.9, 42.2, 24.3, 22.7, 19.8, 27.9, 22.2, 34.3, 40.4, 20.6, 38.2, and 18.1. Use 10 # x , 20 as the first interval.
8. Construct a histogram to display the scores on a recent English quiz. The data are 18, 45, 20, 32, 9, 35, 49, 28, 25, 19, 5, 30, 22, 24, and 14. Use 0 # x , 10 as the first interval.
© 2
012
Car
negi
e Le
arni
ng
Chapter 8 Skills Practice 477
8Lesson 8.1 Skills Practice page 5
Name Date
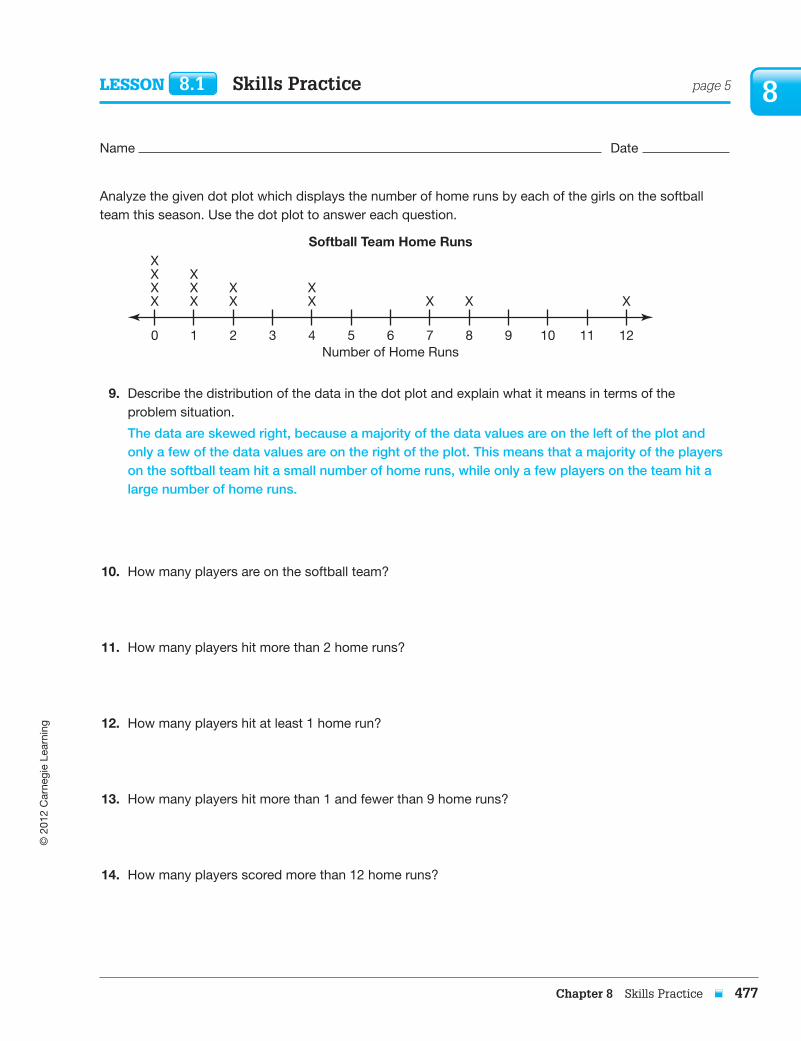
Analyze the given dot plot which displays the number of home runs by each of the girls on the softball team this season. Use the dot plot to answer each question.
0 1 2 3 4 5 7 9 116 8 10
XX
XX
XXXX
XXXX
X X
Number of Home Runs
Softball Team Home Runs
12
9. Describe the distribution of the data in the dot plot and explain what it means in terms of the problem situation.
The data are skewed right, because a majority of the data values are on the left of the plot and only a few of the data values are on the right of the plot. This means that a majority of the players on the softball team hit a small number of home runs, while only a few players on the team hit a large number of home runs.
10. How many players are on the softball team?
11. How many players hit more than 2 home runs?
12. How many players hit at least 1 home run?
13. How many players hit more than 1 and fewer than 9 home runs?
14. How many players scored more than 12 home runs?
© 2
012
Car
negi
e Le
arni
ng
478 Chapter 8 Skills Practice
8 Lesson 8.1 Skills Practice page 6
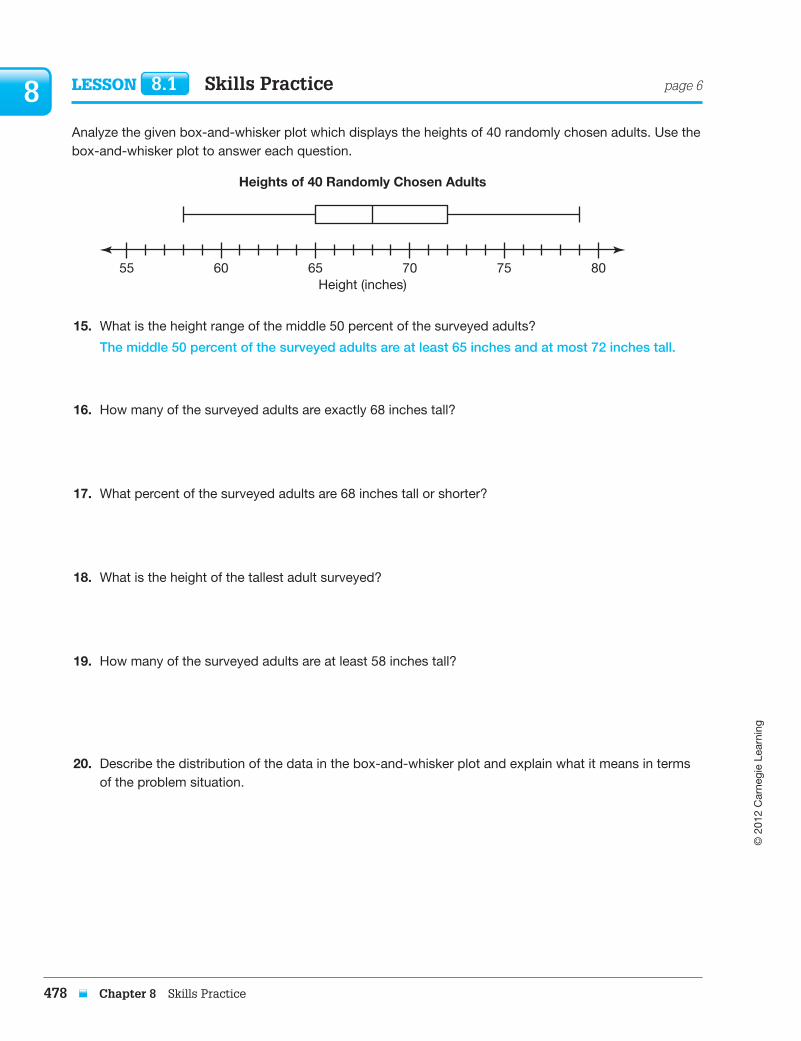
Analyze the given box-and-whisker plot which displays the heights of 40 randomly chosen adults. Use the box-and-whisker plot to answer each question.
55 60 65 70 75
Height (inches)
Heights of 40 Randomly Chosen Adults
80
15. What is the height range of the middle 50 percent of the surveyed adults?
The middle 50 percent of the surveyed adults are at least 65 inches and at most 72 inches tall.
16. How many of the surveyed adults are exactly 68 inches tall?
17. What percent of the surveyed adults are 68 inches tall or shorter?
18. What is the height of the tallest adult surveyed?
19. How many of the surveyed adults are at least 58 inches tall?
20. Describe the distribution of the data in the box-and-whisker plot and explain what it means in terms of the problem situation.
© 2
012
Car
negi
e Le
arni
ng
Chapter 8 Skills Practice 479
8Lesson 8.1 Skills Practice page 7
Name Date
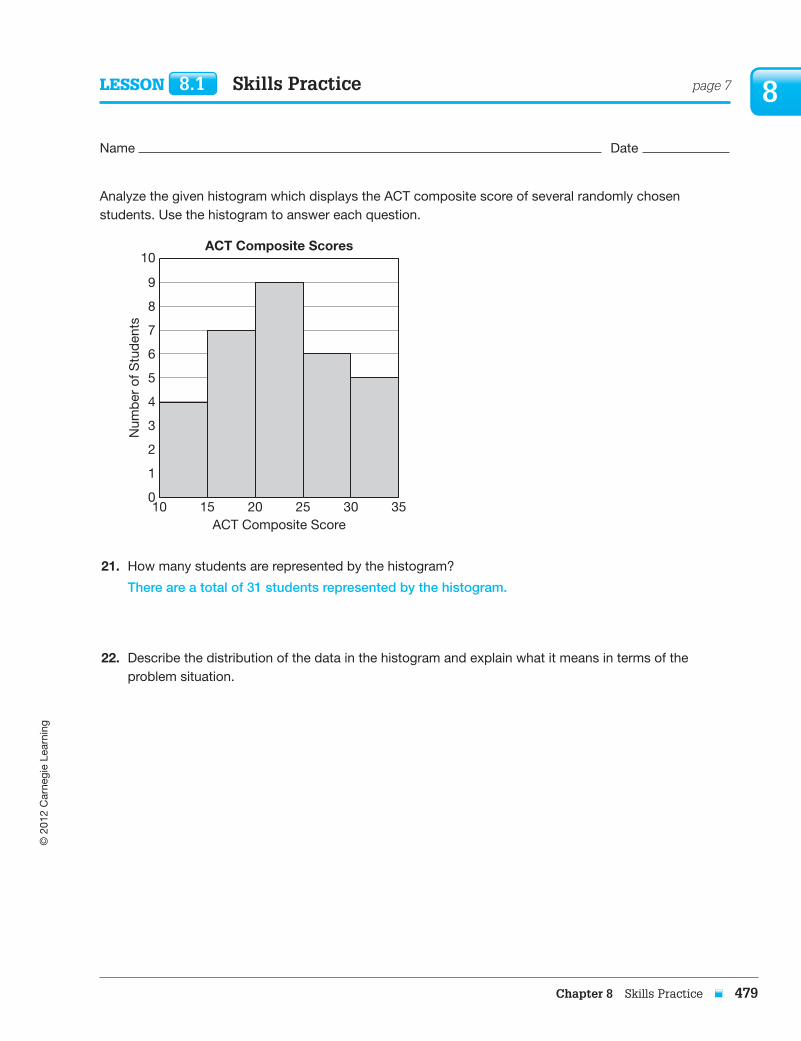
Analyze the given histogram which displays the ACT composite score of several randomly chosen students. Use the histogram to answer each question.
ACT Composite Score
ACT Composite Scores
Num
ber
of S
tud
ents
20 25 30 351510
1
0
2
3
4
5
6
7
8
9
10
21. How many students are represented by the histogram?
There are a total of 31 students represented by the histogram.
22. Describe the distribution of the data in the histogram and explain what it means in terms of the problem situation.

© 2
012
Car
negi
e Le
arni
ng
480 Chapter 8 Skills Practice
8 Lesson 8.1 Skills Practice page 8
23. How many of the students had an ACT composite score of exactly 25?
24. How many of the students had an ACT composite score of at least 20?
25. How many of the students had an ACT composite score less than 30?
26. How many more students had an ACT composite score between 15 and 20 than had a composite score between 30 and 35?
© 2
012
Car
negi
e Le
arni
ng
Chapter 8 Skills Practice 481
8Lesson 8.2 Skills Practice
Name Date
Which Measure Is Better?Determining the Best Measure of Center for a Data Set
Vocabulary
Define each term in your own words.
1. statistics
2. measure of central tendency
Problem Set
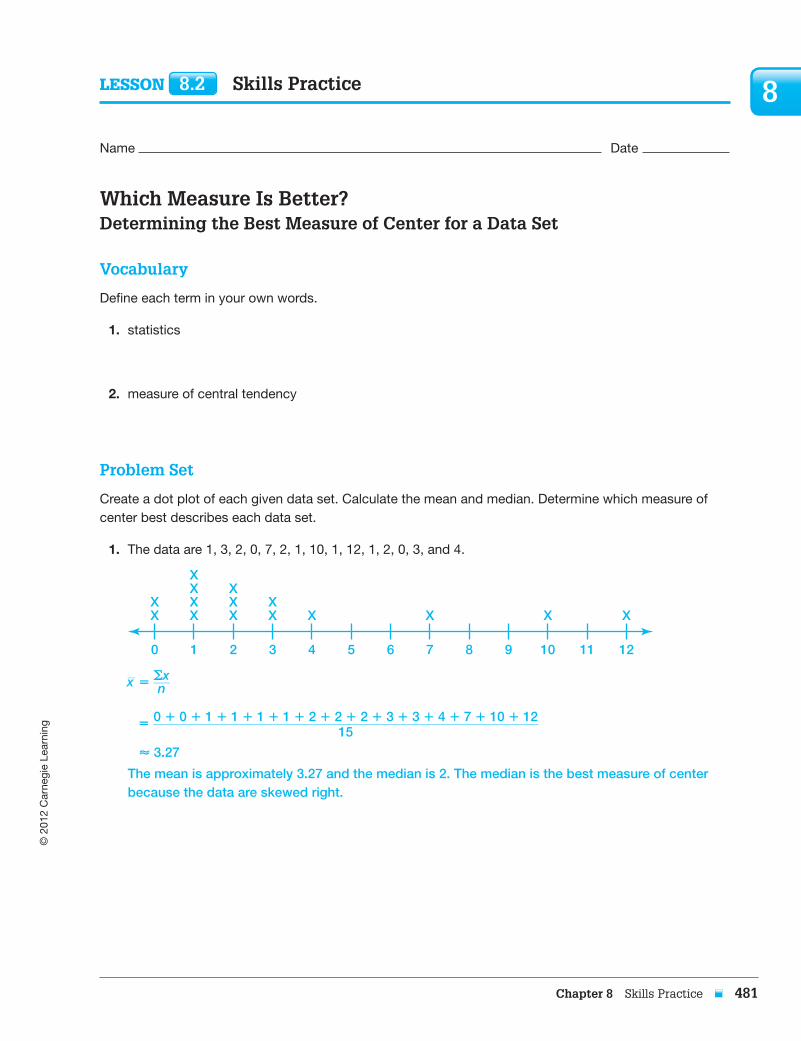
Create a dot plot of each given data set. Calculate the mean and median. Determine which measure of center best describes each data set.
1. The data are 1, 3, 2, 0, 7, 2, 1, 10, 1, 12, 1, 2, 0, 3, and 4.
0 1 2 3 4 5 7 9 116 8 10
XXX
XX
XXXX
XXXX
X X
12
__ x 5 ox ___ n
5 0 1 0 1 1 1 1 1 1 1 1 1 2 1 2 1 2 1 3 1 3 1 4 1 7 1 10 1 12 __________________________________________________________ 15
< 3.27
The mean is approximately 3.27 and the median is 2. The median is the best measure of center because the data are skewed right.
© 2
012
Car
negi
e Le
arni
ng
482 Chapter 8 Skills Practice
8 Lesson 8.2 Skills Practice page 2
2. The data are 7, 2, 9, 9, 10, 12, 17, 10, 6, 11, 9, 10, 8, 11, and 8.
3. The data are 4, 0, 13, 15, 14, 10, 13, 8, 13, 12, 11, 13, 14, 1, 15, 13, 14, 12, 10, and 7.
4. The data are 50, 50, 40, 70, 60, 50, 20, 50, 80, 40, 60, 40, and 50.
© 2
012
Car
negi
e Le
arni
ng
Chapter 8 Skills Practice 483
8Lesson 8.2 Skills Practice page 3
Name Date
5. The data are 40, 45, 48, 49, 50, 49, 47, 50, 49, 42, 49, 50, 48, 50, and 47.
6. The data are 13, 12, 12, 11, 17, 10, 11, 12, 14, 20, 15, 12, 18, 13, 12, 17, 14, and 11.
© 2
012
Car
negi
e Le
arni
ng
484 Chapter 8 Skills Practice
8 Lesson 8.2 Skills Practice page 4
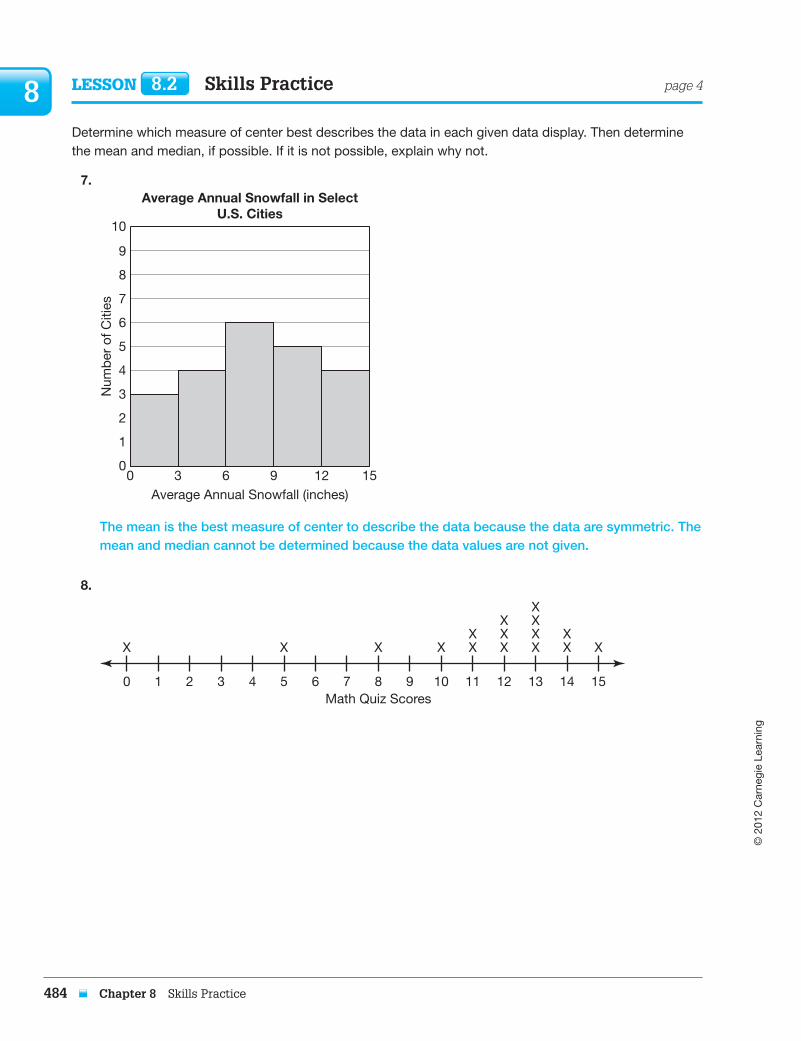
Determine which measure of center best describes the data in each given data display. Then determine the mean and median, if possible. If it is not possible, explain why not.
7.
Average Annual Snowfall (inches)
Average Annual Snowfall in SelectU.S. Cities
Num
ber
of C
ities
6 9 12 1530
1
0
2
3
4
5
6
7
8
9
10
The mean is the best measure of center to describe the data because the data are symmetric. The mean and median cannot be determined because the data values are not given.
8.
0 1 2 3 4 5 7 9 11 12 13 146 8Math Quiz Scores
10
XX X XX XX
XXXX
XX
XXX
15
© 2
012
Car
negi
e Le
arni
ng
Chapter 8 Skills Practice 485
8Lesson 8.2 Skills Practice page 5
Name Date
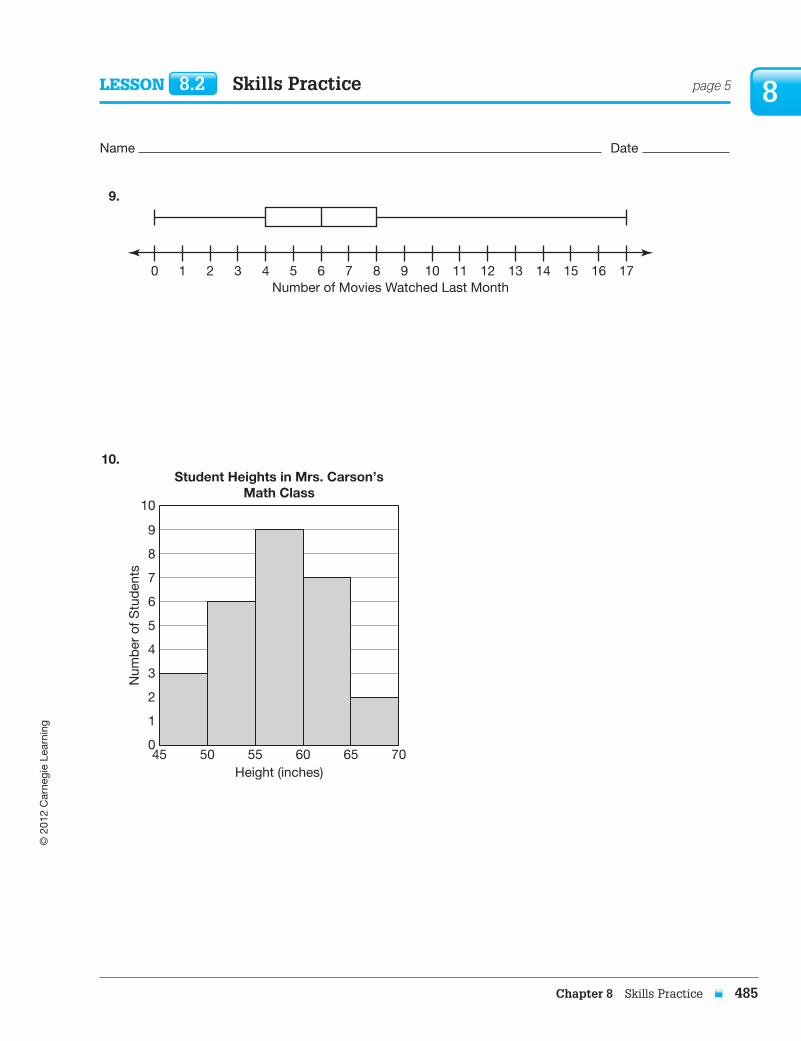
9.
0 1 2 3 4 5 7 8 9 10 11 12 13 14 15 166
Number of Movies Watched Last Month17
10.
Height (inches)
Student Heights in Mrs. Carson’sMath Class
Num
ber
of S
tud
ents
55 60 65 705045
1
0
2
3
4
5
6
7
8
9
10
© 2
012
Car
negi
e Le
arni
ng
486 Chapter 8 Skills Practice
8 Lesson 8.2 Skills Practice page 6
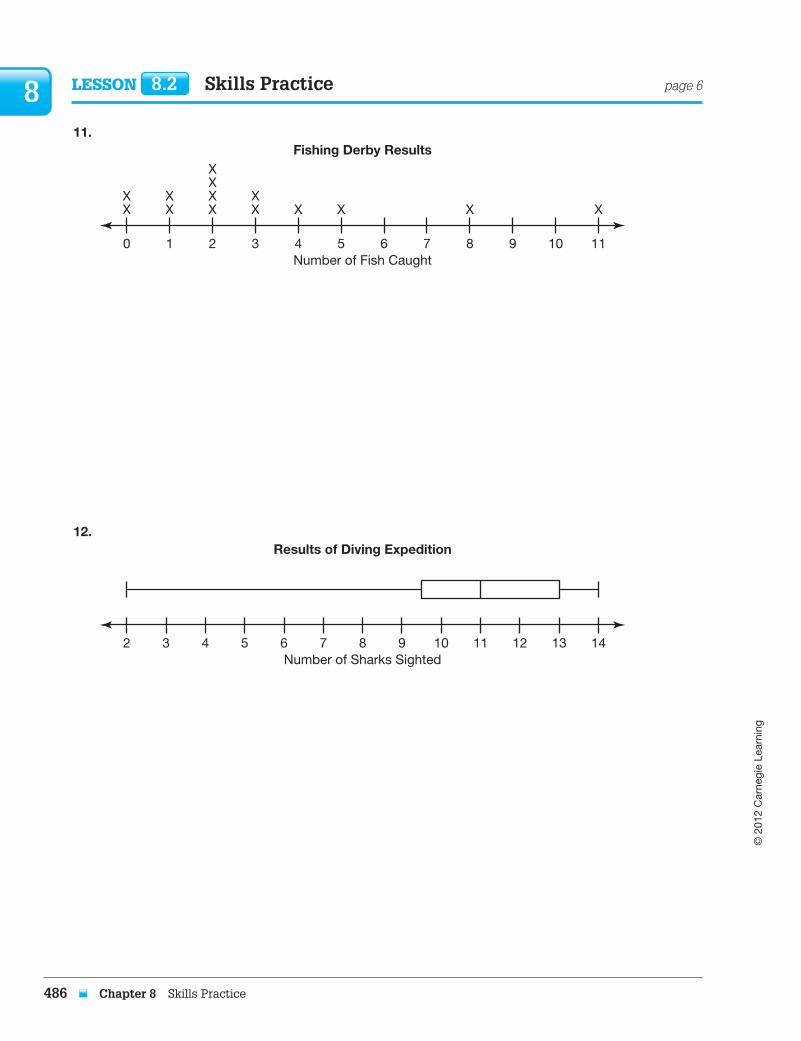
11.
0 1 2 3 4 5 7 96 8 10
XX
XX
XXX
XXXX
X X X
Number of Fish Caught
Fishing Derby Results
11
12.
2 3 4 5 6 7 9 118 10 12 13
Number of Sharks Sighted
Results of Diving Expedition
14

© 2
012
Car
negi
e Le
arni
ng
Chapter 8 Skills Practice 487
8Lesson 8.3 Skills Practice
Name Date
You Are Too Far Away!Calculating IQR and Identifying Outliers
Vocabulary
Match each definition to its corresponding term.
1. interquartile range (IQR) a. A value calculated using the formula Q1 2 (IQR ? 1.5).
2. outlier b. A value calculated by subtracting Q1 from Q3.
3. lower fence c. A value calculated using the formula Q3 1 (IQR ? 1.5).
4. upper fence d. A data value that is significantly greater than or less than the other values in a data set.

© 2
012
Car
negi
e Le
arni
ng
488 Chapter 8 Skills Practice
8 Lesson 8.3 Skills Practice page 2
Problem Set
Calculate the IQR of each given data set. Determine whether there are any outliers in each set and list them.
1. The data are 4, 4, 5, 5, 8, 9, 10, 10, 12, 12, 16, 20, and 30.
Q1 5 5, Q3 5 14
IQR 5 Q3 2 Q1
5 14 2 5
5 9
Lower Fence:
Q1 2 (IQR ? 1.5) 5 5 2 (9 ? 1.5)
5 5 2 13.5
5 2 8.5
Upper Fence:
Q3 1 (IQR ? 1.5) 5 14 1 (9 ? 1.5)
5 14 1 13.5
5 27.5
The value 30 is an outlier because it is greater than the upper fence.
2. The data are 0, 3, 10, 16, 16, 18, 20, 21, 22, 24, 25, 25, 27, 30, 35, and 41.
© 2
012
Car
negi
e Le
arni
ng
Chapter 8 Skills Practice 489
8Lesson 8.3 Skills Practice page 3
Name Date
3. The data are 9, 15, 26, 30, 32, 32, 35, 36, 38, 40, 40, 45, and 59.
4. The data are 18, 25, 30, 32, 33, 33, 35, 38, 39, 40, 42, 43, 44, 48, and 55.
© 2
012
Car
negi
e Le
arni
ng
490 Chapter 8 Skills Practice
8 Lesson 8.3 Skills Practice page 4
5. The data are 22, 19, 20, 20, 21, 25, 10, 8, 18, 28, 32, 24, and 25.
6. The data are 60, 55, 70, 80, 20, 60, 105, 65, 75, 100, 55, 15, 115, 65, 70, 45, and 60.
© 2
012
Car
negi
e Le
arni
ng
Chapter 8 Skills Practice 491
8Lesson 8.3 Skills Practice page 5
Name Date
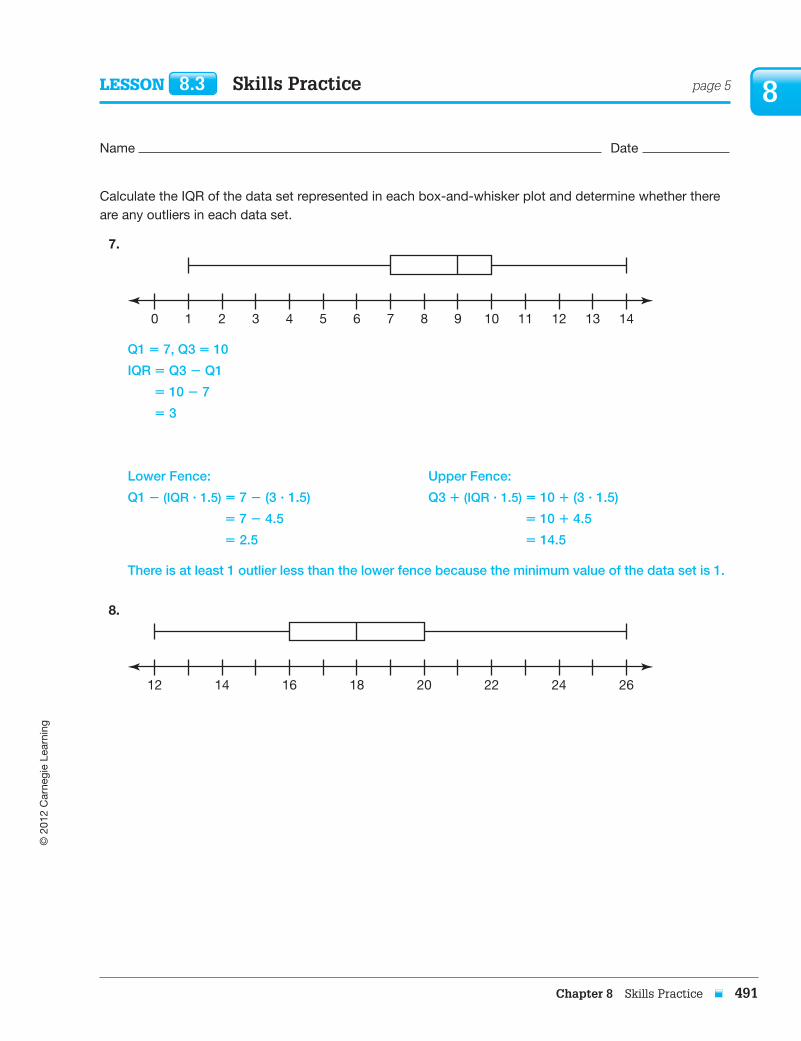
Calculate the IQR of the data set represented in each box-and-whisker plot and determine whether there are any outliers in each data set.
7.
210 3 4 5 6 7 9 118 10 12 13 14
Q1 5 7, Q3 5 10
IQR 5 Q3 2 Q1
5 10 2 7
5 3
Lower Fence:
Q1 2 (IQR ? 1.5) 5 7 2 (3 ? 1.5)
5 7 2 4.5
5 2.5
Upper Fence:
Q3 1 (IQR ? 1.5) 5 10 1 (3 ? 1.5)
5 10 1 4.5
5 14.5
There is at least 1 outlier less than the lower fence because the minimum value of the data set is 1.
8.
1412 16 18 20 22 24 26

© 2
012
Car
negi
e Le
arni
ng
492 Chapter 8 Skills Practice
8 Lesson 8.3 Skills Practice page 6
9.
2010 30 40 50 60 70 80 90
10.
65 87 9 10 11 12 13 14 15 16 17 18 19 20

© 2
012
Car
negi
e Le
arni
ng
Chapter 8 Skills Practice 493
8Lesson 8.3 Skills Practice page 7
Name Date
11.
100 200 300 400 500 600 7000 800
12.
0 1 2 3 4 5 6 7 8 9 10 11 12 13 14 15 16 17 18 19 20

© 2
012
Car
negi
e Le
arni
ng
494 Chapter 8 Skills Practice
8
© 2
012
Car
negi
e Le
arni
ng
Chapter 8 Skills Practice 495
8
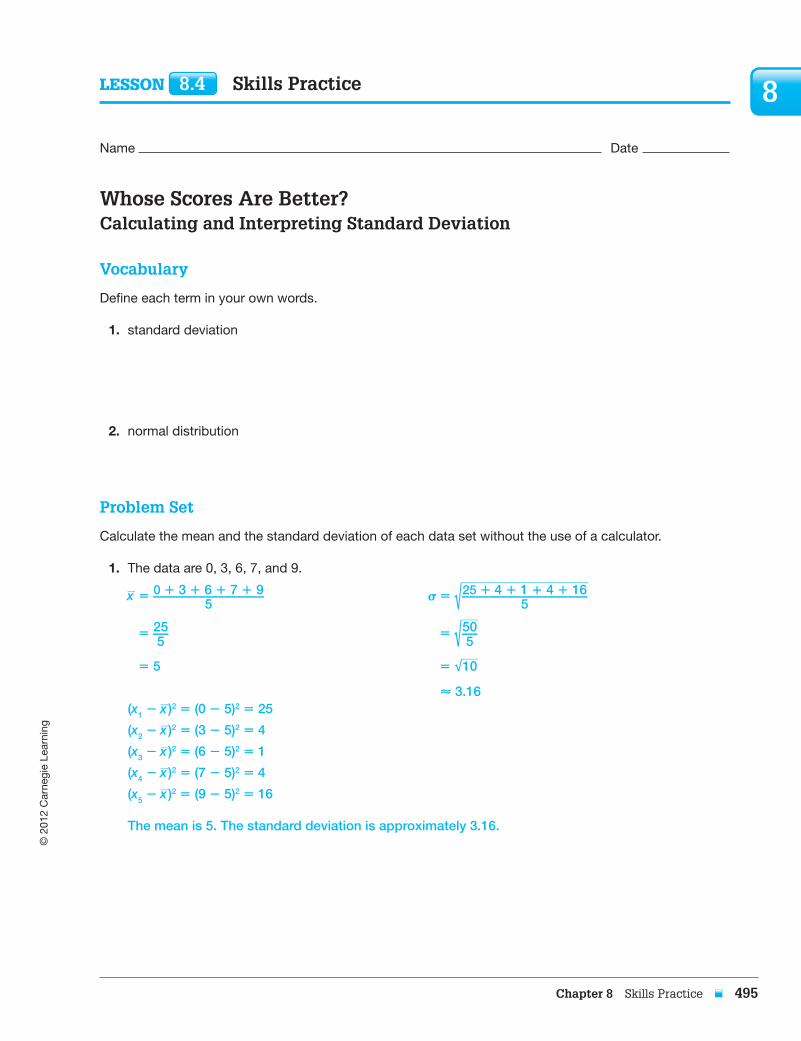
Whose Scores Are Better?Calculating and Interpreting Standard Deviation
Vocabulary
Define each term in your own words.
1. standard deviation
2. normal distribution
Problem Set
Calculate the mean and the standard deviation of each data set without the use of a calculator.
1. The data are 0, 3, 6, 7, and 9.
__ x 5 0 1 3 1 6 1 7 1 9 _________________
5
5 25 ___ 5
5 5
(x1 2 __ x )2 5 (0 2 5)2 5 25
(x2 2 __ x )2 5 (3 2 5)2 5 4
(x3 2 __ x )2 5 (6 2 5)2 5 1
(x4 2 __ x )2 5 (7 2 5)2 5 4
(x5 2 __ x )2 5 (9 2 5)2 5 16
s 5 √_____________________
25 1 4 1 1 1 4 1 16 ___________________ 5
5 √___
50 ___ 5
5 √___
10
< 3.16
The mean is 5. The standard deviation is approximately 3.16.
Lesson 8.4 Skills Practice
Name Date
© 2
012
Car
negi
e Le
arni
ng
496 Chapter 8 Skills Practice
8 Lesson 8.4 Skills Practice page 2
2. The data are 6, 8, 9, 10, 10, and 11.
3. The data are 1, 5, 10, 15, 16, 20, and 24.

© 2
012
Car
negi
e Le
arni
ng
Chapter 8 Skills Practice 497
8Lesson 8.4 Skills Practice page 3
Name Date
4. The data are 13, 14, 15, 15, 16, 16, 17, and 18.
5. The data are represented by a dot plot.
0 1 2 3 4 5 76
XX
XX
XXX
X X
8
© 2
012
Car
negi
e Le
arni
ng
498 Chapter 8 Skills Practice
8 Lesson 8.4 Skills Practice page 4
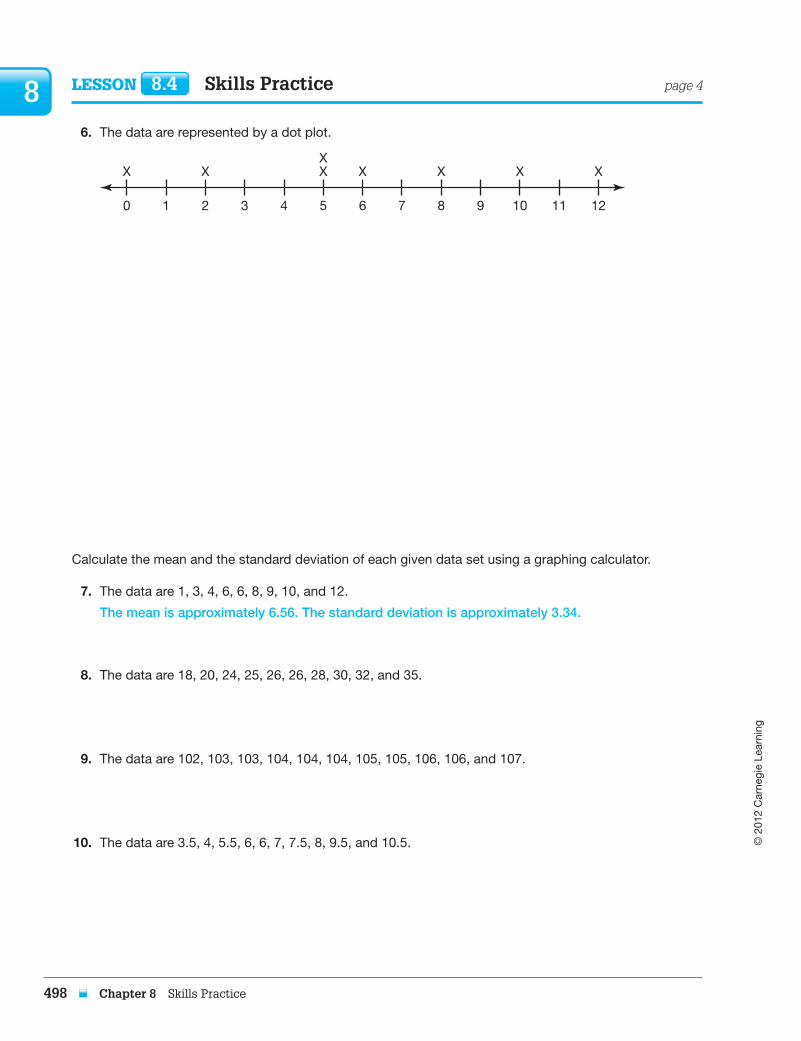
6. The data are represented by a dot plot.
0 1 2 3 4 5 7 8 9 10 116
XX
X X XX X X
12
Calculate the mean and the standard deviation of each given data set using a graphing calculator.
7. The data are 1, 3, 4, 6, 6, 8, 9, 10, and 12.
The mean is approximately 6.56. The standard deviation is approximately 3.34.
8. The data are 18, 20, 24, 25, 26, 26, 28, 30, 32, and 35.
9. The data are 102, 103, 103, 104, 104, 104, 105, 105, 106, 106, and 107.
10. The data are 3.5, 4, 5.5, 6, 6, 7, 7.5, 8, 9.5, and 10.5.

© 2
012
Car
negi
e Le
arni
ng
Chapter 8 Skills Practice 499
8Lesson 8.4 Skills Practice page 5
Name Date
11. The data are represented by a dot plot.
1 2 3 4 5 7 8 9 10 11 12 136
XX
XX
X X XX X X
14
12. The data are represented by a dot plot.
40 41 42 43 44 45
XXXX
XXX
XX
XX
X X X
46

© 2
012
Car
negi
e Le
arni
ng
500 Chapter 8 Skills Practice
8
© 2
012
Car
negi
e Le
arni
ng
Chapter 8 Skills Practice 501
8Lesson 8.5 Skills Practice
Name Date
Putting the Pieces TogetherAnalyzing and Interpreting Data
Vocabulary
For each problem situation, identify whether a stem-and-leaf plot or a side-by-side stem-and-leaf plot would be appropriate. Explain your choice for each.
1. For a history project, Roberto is comparing the ages of the U.S. Presidents at inauguration and at death.
2. During the Summer Olympic Games, Karen keeps track of the number of gold medals won by the various countries participating.
Problem Set
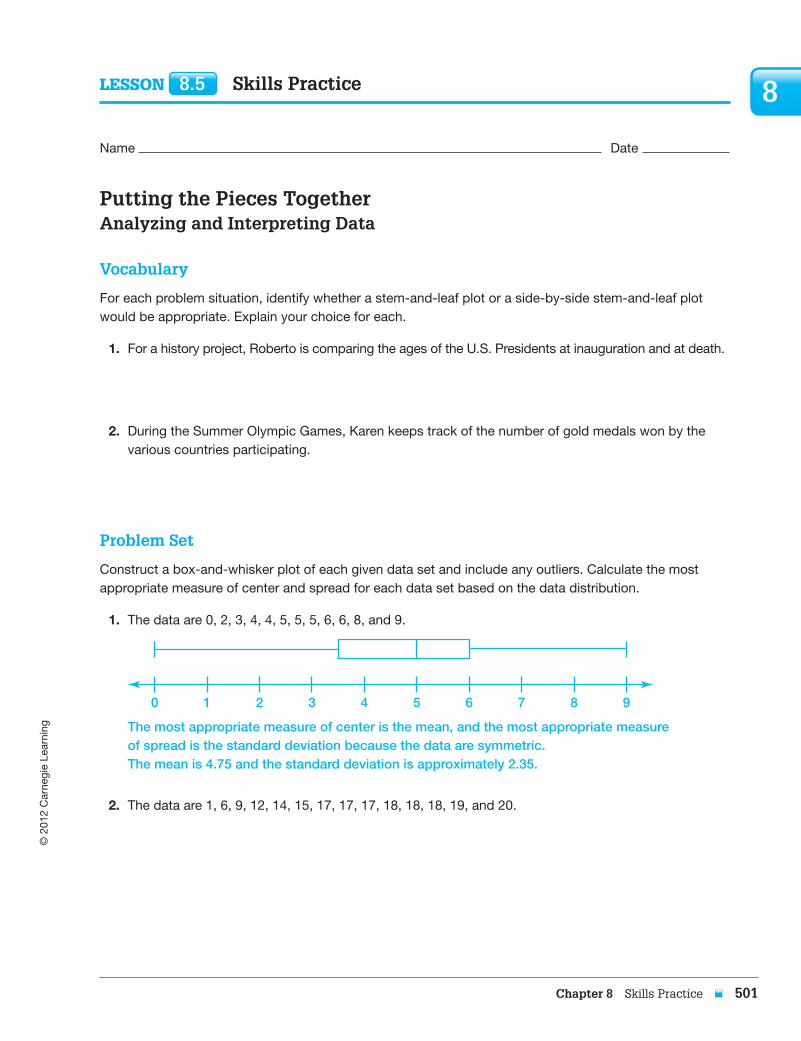
Construct a box-and-whisker plot of each given data set and include any outliers. Calculate the most appropriate measure of center and spread for each data set based on the data distribution.
1. The data are 0, 2, 3, 4, 4, 5, 5, 5, 6, 6, 8, and 9.
0 21 3 4 5 6 87 9
The most appropriate measure of center is the mean, and the most appropriate measure of spread is the standard deviation because the data are symmetric. The mean is 4.75 and the standard deviation is approximately 2.35.
2. The data are 1, 6, 9, 12, 14, 15, 17, 17, 17, 18, 18, 18, 19, and 20.
© 2
012
Car
negi
e Le
arni
ng
502 Chapter 8 Skills Practice
8 Lesson 8.5 Skills Practice page 2
3. The data are 50, 53, 57, 58, 58, 59, 59, 60, 60, 60, 61, 61, 62, 63, and 67.
4. The data are 20, 20, 20, 21, 21, 21, 22, 22, 23, 24, 25, 28, and 30.
5. The data are 80, 85, 90, 30, 70, 90, 95, 10, 100, 70, 80, 55, 50, 95, 65, and 90.
6. The data are 7, 11, 10, 13, 0, 3, 10, 9, 17, 11, 10, 20, 9, 8, and 12.
© 2
012
Car
negi
e Le
arni
ng
Chapter 8 Skills Practice 503
8Lesson 8.5 Skills Practice page 3
Name Date
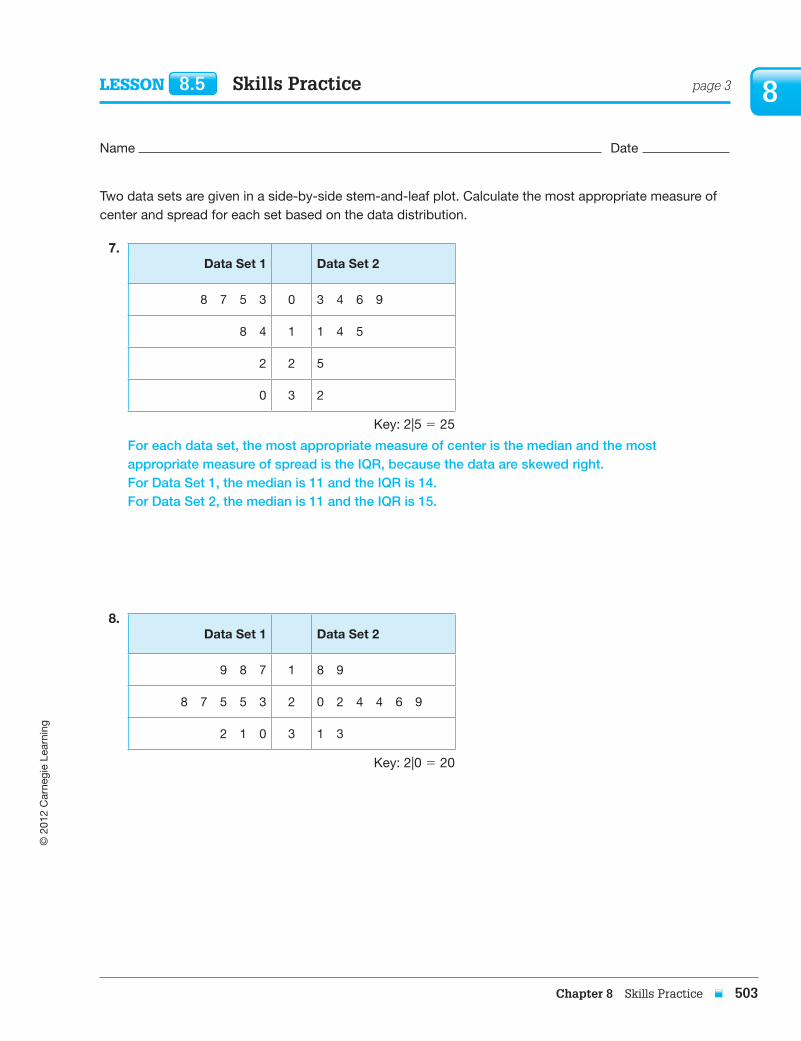
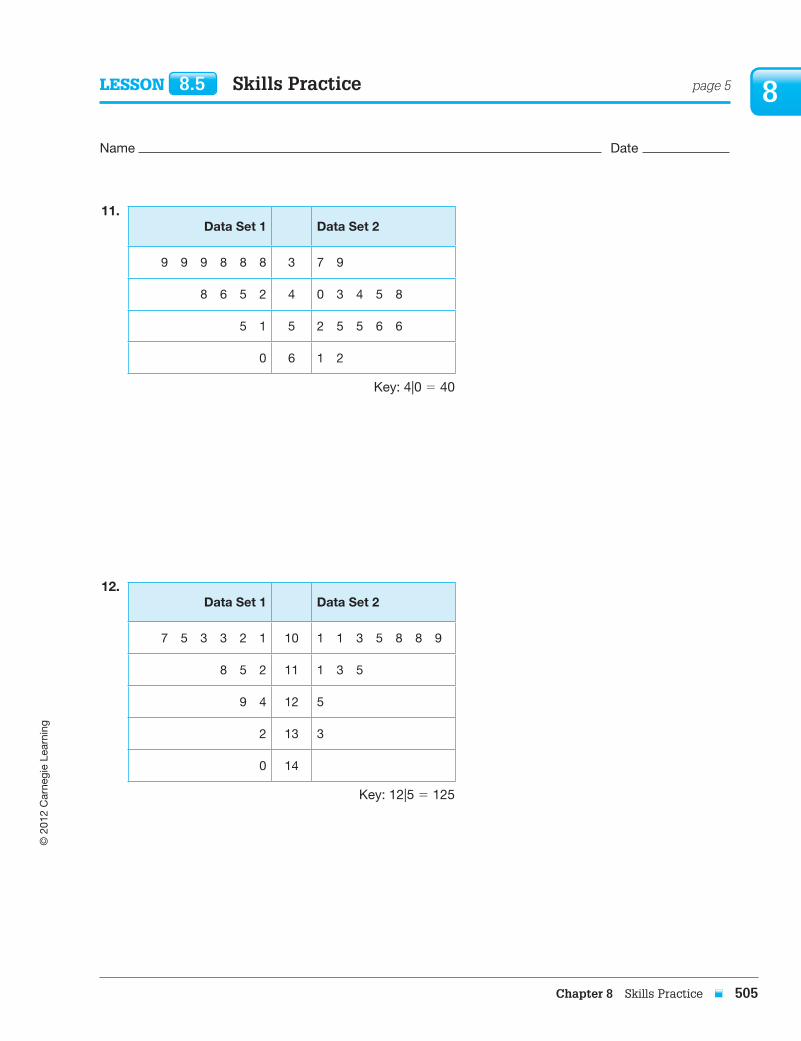
Two data sets are given in a side-by-side stem-and-leaf plot. Calculate the most appropriate measure of center and spread for each set based on the data distribution.
7.
Data Set 1 Data Set 2
8 7 5 3 0 3 4 6 9
8 4 1 1 4 5
2 2 5
0 3 2
Key: 2|5 5 25
For each data set, the most appropriate measure of center is the median and the most appropriate measure of spread is the IQR, because the data are skewed right. For Data Set 1, the median is 11 and the IQR is 14. For Data Set 2, the median is 11 and the IQR is 15.
8.
Data Set 1 Data Set 2
9 8 7 1 8 9
8 7 5 5 3 2 0 2 4 4 6 9
2 1 0 3 1 3
Key: 2|0 5 20

© 2
012
Car
negi
e Le
arni
ng
504 Chapter 8 Skills Practice
8 Lesson 8.5 Skills Practice page 4
9.
Data Set 1 Data Set 2
9 9 5 9
7 5 1 6 5 8
8 6 2 7 0 4
2 0 8 1 1 5 7
Key: 6|5 5 65
10.
Data Set 1 Data Set 2
0 9
9 1 4
8 3 2 2 5
9 5 1 3 3 6
5 5 4 3 2 0 4 0 0 1 1 1 2
Key: 1|4 5 14
© 2
012
Car
negi
e Le
arni
ng
Chapter 8 Skills Practice 505
8Lesson 8.5 Skills Practice page 5
Name Date
11.
Data Set 1 Data Set 2
9 9 9 8 8 8 3 7 9
8 6 5 2 4 0 3 4 5 8
5 1 5 2 5 5 6 6
0 6 1 2
Key: 4|0 5 40
12.
Data Set 1 Data Set 2
7 5 3 3 2 1 10 1 1 3 5 8 8 9
8 5 2 11 1 3 5
9 4 12 5
2 13 3
0 14
Key: 12|5 5 125
© 2
012
Car
negi
e Le
arni
ng
506 Chapter 8 Skills Practice
8