Embed Size (px)
Citation preview

Please cite this paper as:
Vale, S. (2006), “The International comparability ofBusiness Start-up Rates Final Report”, OECD StatisticsWorking Papers, 2006/04, OECD Publishing.http://dx.doi.org/10.1787/118741888521
OECD Statistics Working Papers2006/04
The Internationalcomparability of BusinessStart-up Rates Final Report
Steven Vale

Unclassified STD/DOC(2006)4 Organisation de Coopération et de Développement Economiques Organisation for Economic Co-operation and Development 14-Nov-2006 ___________________________________________________________________________________________
English - Or. English STATISTICS DIRECTORATE
OECD STATISTICS WORKING PAPER THE INTERNATIONAL COMPARABILITY OF BUSINESS START-UP RATES FINAL REPORT
Author: Steven Vale OECD Statistics Directorate / Office for National Statistics, UK
Please send any comments or questions to the author at: [email protected] Comments or questions to the OECD should be addressed to: Nadim Ahmad � [email protected] (Business demography) Tim Davis � [email protected] (Entrepreneurship indicators)
JT03217769
Document complet disponible sur OLIS dans son format d'origine Complete document available on OLIS in its original format
STD
/DO
C(2006)4
Unclassified
English - O
r. English

STD/DOC(2006)4
2
OECD STATISTICS WORKING PAPER SERIES
The OECD Statistics Working Paper Series - managed by the OECD Statistics Directorate is designed to make available in a timely fashion and to a wider readership selected studies prepared by staff in the Secretariat or by outside consultants working on OECD projects. The papers included are of a technical, methodological or statistical policy nature and relate to statistical work relevant to the organisation. The Working Papers are generally available only in their original language - English or French - with a summary in the other.
Comments on the papers are welcome and should be communicated to the authors or to the OECD Statistics Directorate, 2 rue André Pascal, 75775 Paris Cedex 16, France.
The opinions expressed in these papers are the sole responsibility of the authors and do not necessarily reflect those of the OECD or of the governments of its Member countries.
________________________________________
http://www.oecd.org/std/research
_______________________________________

STD/DOC(2006)4
3
ABSTRACT Growing political and academic interest in entrepreneurship and business demography, and particularly the role and value of new businesses in national economies, is prompting various research projects on these topics. One of the main issues faced by researchers and policy makers is the current lack of international comparability of data on business start-up rates, which are often seen as key indicators of entrepreneurship and economic dynamism. This paper investigates this issue and concludes that current estimates are not typically comparable, for a number of reasons, which are presented in the form of a typology. On a more positive note however the paper notes that the basic data sources required to improve comparability exist and that significant progress can be made in this area in the short to medium term by encouraging the harmonisation of concepts. L�intérêt politique et académique croissant porté à l�entreprenariat et à la démographie des entreprises, en particulier le rôle et la valeur des nouvelles entreprises dans les économies nationales, ont relancé les divers projets de recherche sur le sujet. L�un de problèmes majeurs rencontré par les chercheurs et les décideurs est le manque de comparabilité des données concernant les taux des entreprises qui démarrent, ce dernier étant souvent considéré comme un indicateur clé de l�entreprenariat et du dynamisme économique. Ce document enquête sur ce sujet et conclura que les estimations disponibles ne sont pas typiquement comparables, pour beaucoup de raisons, qui sont présentées sous la forme d�une typologie. Cependant, de manière plus positive, ce document révèle que les sources de données basiques nécessaires à améliorer la comparabilité existent, et que des progrès significants peuvent être faits en la matière, à court et moyen terme, en encourageant l�harmonisation des concepts.

STD/DOC(2006)4
4
TABLE OF CONTENTS
0. Executive Summary ................................................................................................................................ 5 1. Introduction ............................................................................................................................................. 7 2. Data Sources and Existing International Comparisons ........................................................................... 9 3. Factors Affecting Comparability........................................................................................................... 14 4. Methods to Improve Comparability ...................................................................................................... 30 5. A Harmonised Methodological Framework and Start-up Indicators?................................................... 39 6. Conclusions ........................................................................................................................................... 44 7. References ............................................................................................................................................. 46 Annex 1 � Glossary of Terms: Proposals for Harmonised Terminology.................................................. 49 Annex 2 - Inventory of Data on Business Start-ups by Country............................................................... 51 Annex 3 - Defining Business Populations: Comparing Point in Time and Live During Period Estimates90 Annex 4 � Business Start-up Data for Selected Countries: Comparisons of National Sources ................ 98 Annex 5 � Business Closures .................................................................................................................. 141

STD/DOC(2006)4
5
0. Executive Summary
Growing political and academic interest in entrepreneurship and business demography, and particularly the role and value of new businesses in national economies, is prompting various research projects on these topics. One of the main issues faced by researchers and policy makers is the current lack of international comparability of data on business start-up rates, which are often seen as key indicators of entrepreneurship and economic dynamism. The International Consortium for Dynamic Entrepreneurship Benchmarking, led by the Danish government agency FORA, has responded by providing funding for a five month consultancy at the OECD to study this topic. The consultant appointed for this task was Steven Vale, on secondment from the UK Office for National Statistics. The objectives of the project were:
• The compilation of existing evidence on comparative start-up rates; • The comparison of results and identification of reasons for differences in results, in particular
methodological and statistical differences; • Drawing up lessons for future studies to improve comparability and to ensure that results are
meaningful. The underlying question that this project has aimed to answer is; �How comparable are existing data on business start-up rates from different OECD countries?� The short answer is; �Not very�, so this report looks at the reasons why data are not comparable, and what can be done to improve comparability in the future. This report starts by examining the existing sources of business start-up data for different countries (an inventory of sources is included in Annex 2), and assessing previous international projects and papers that have aimed to produce comparable data for groups of countries. Where there are several data sources for a particular country, they have been studied to gain a better understanding why they often differ (see Annex 4). The conclusion from this work is that there are a number of factors that affect the comparability of business start-up data, some of which may have been overlooked in previous international comparisons, resulting in the true variability of data between countries being masked by methodological differences. Section 3 develops these ideas into a typology of the factors affecting international comparisons of business start-up rates, describing each factor, and its potential impact in detail. Start-up rates are based on two components, the numerator (new businesses), and the denominator (a population). Some factors affect just one of these, others affect both. In total, nine factors have been identified: Numerator factors:
• Purity � to what extent are �pure births� (i.e. new combinations of production factors) distinguished from reactivations and other creations?
• Timing � at what point in the creation process is a start-up measured? • Periodicity � over what period are start-ups measured, and how does this affect the measurement
of very short-lived businesses? Denominator factors:
• Type of Population � businesses or people? • Temporal basis � is the population measured at a specific point in time, or does it consist of all
units that were present at any time during a given period?

STD/DOC(2006)4
6
Factors affecting both: • Source � are the data taken from a register, a census or a survey? How reliable is the source? • Units � what is the entity about which the data are produced? • Coverage - to what extent are certain types of business included or excluded based on specific
attributes (e.g. economic activity or legal form)? • Thresholds � what explicit or implicit size thresholds apply to the source?
Section 4 looks at how these factors can affect data comparisons in practice. It shows that adjustments to compensate for differences in specific factors can sometimes help to improve comparability, but have to be made with care, based on a detailed understanding of the data sources and methods. In this sense, although not perfect, informed adjustments can at least give approximate results, and can warn against drawing false conclusions based on the raw data alone. The goal of more comparable data is the theme of Section 5, which links this project to wider OECD work to develop a methodological framework for business demography. This section also looks at the pros and cons of different types of business start-up indicators, and recommends focussing on one key indicator, supplemented by several secondary indicators. The conclusions of this report are that: • Simple comparisons of start-up rates from different sources are often misleading. • The availability of data on business start-up rates varies considerably between countries. • Where metadata exist, they are not always easy to find or understand. A harmonised terminology is
proposed in Annex 1, and a common metadata template is needed. • Some previous international comparisons do not fully recognise all comparability issues, but have
provided useful models for assembling data from different countries. • To assess the comparability of business start-up rates it is necessary to decompose them into numerator
and denominator components, and consider the factors that affect each. • The factors that have the most impact are usually the purity of the data in the numerator, the temporal
basis of the denominator, and the coverage of both. • The larger a �new� business is, the less likely it is to be a pure birth. Increasing purity leads to a
considerable reduction in the employment attributed to new businesses. • Analytical adjustments can help to compensate for differences in specific comparability factors, but
risk introducing noise into the data, so have to be made with care. • Statistical business registers are the best sources for business start-up data, as they are already subject
to a degree of harmonisation, particularly within Europe. • A clearly defined key indicator would improve data comparability. Secondary indicators could give
additional insights to more specialist data users. • Data producers are often more influenced by national data requirements than international
comparability. The OECD has a role to communicate international needs. • It is important to find out what data users really want, and what they use start-up data for. This
knowledge can then inform the future development of indicators. • The short term priority is the identification of �quick wins�, i.e. actions that increase the international
comparability of data from individual countries for minimal cost. • A step-by step approach may not result in fully comparable data as quickly as some users might want,
though alternative, more radical, approaches may take at least as long, as they would require considerable changes to methods and sources in many countries.
• The goal of internationally comparable business start-up rates is not an easy one, but is possible.

STD/DOC(2006)4
7
1. Introduction
There is growing international interest in the topics of business dynamics and entrepreneurship, particularly from policy makers and academic researchers. Business start-up rates are seen as providing key indicators for both purposes. They are also used as a measure of economic dynamism, and have been linked to improvements in productivity through the notion of creative destruction1. So far the focus has mainly been on producing national data to inform national policies and research, however, there is a growing interest in international comparisons, particularly for benchmarking purposes. To facilitate international comparisons, it is necessary to determine measures of business start-ups that will show the real differences between countries, and not just reflect differences in national methodologies, as has often been the case in the past. For this reason, the International Consortium for Dynamic Entrepreneurship Benchmarking, led by the Danish government agency FORA, has provided funding for a five month consultancy at the OECD to study the international comparability of business start-up data. The consultant appointed for this task was Steven Vale, on secondment from the UK Office for National Statistics. The objectives of the project were agreed at the outset as being: • The compilation of existing evidence on comparative start-up rates; • The comparison of results and identification of reasons for differences in results, in particular
methodological and statistical differences; • Drawing up lessons for future studies to improve comparability and to ensure that results are
meaningful. The underlying question that this project has aimed to answer is; �How comparable are data on business start-up rates from different OECD countries?� Figure 1.1 shows business start-up rate data for a number of countries, including two sources for the United States, as published by those countries or Eurostat. Is this chart a valid comparison of business start-up rates for these countries?
1 Although the focus of this report is on business start-ups, the comparability issues affecting the complimentary indicator of business closures are set out in Annex 5.

STD/DOC(2006)4
8
Figure 1.1 � Raw Business Start-up Rate Data for Selected Countries
0%
5%
10%
15%
20%
25%A
ustra
lia
Can
ada
Den
mar
k
Finl
and
Fran
ce
Ger
man
y
Italy
Latv
ia
Net
herla
nds
New
Zeal
and
Nor
way
Por
tuga
l
Slo
vaki
a
Spa
in
Sw
eden UK
US
(SU
SB
)
US
(BLS
)
2000 2001 2002
Sources: National statistical office and Eurostat publications and internet sites This report will show that the comparison in Figure 1.1 is not particularly valid, but that through an understanding of the data and metadata, meaningful comparisons are possible. To reach this conclusion, this report decomposes the questions above into a number of sub-questions, corresponding to the different sub-tasks undertaken within this project: • What data are available for each OECD country? - The project started by making an inventory of data
sources by country, initially through Internet searches, but also through discussions with contacts in different countries. A copy of this inventory is included as Annex 2.
• What metadata are available with these data? � The availability and quality of metadata for each data
source were assessed within the inventory. • What comparisons or compendiums of data from different countries exist? � A trawl was made of
databases, literature and other sources combining data on start-up rates from more than one country. Section 2 considers how others have tried to collect and compare data from different countries, with varying degrees of success.
• Do the data seem comparable? � The above steps gave an initial view as to the degree of data
comparability. The conclusion was that methodological differences frequently mask the real variations between countries.
• Do the metadata confirm comparability or explain the differences? � This initial view on the
comparability of data was tested using the available metadata, to determine how helpful these metadata are in highlighting and explaining methodological differences. Annex 4 includes short studies on the comparability of sources within selected countries, on the assumption that differences in data relating to the same country must be purely methodological. This work led to the development of the framework of factors affecting the comparability of start-up rates proposed in Section 3.
• Are there other explanations for differences in data? � The extent to which variations between
countries could be explained by political, social and cultural factors was briefly considered, though this question is not considered further in this report, as it is more appropriate to look at these issues when the data have been compiled or corrected to remove methodological differences.

STD/DOC(2006)4
9
• How can comparability be improved for existing data? � Methods to make adjustments to existing data
to improve comparability are considered in Section 4, where examples are used to illustrate how data can be adjusted, and some of the potential pitfalls.
• What is the scope for improving comparability at source? � Finally, Section 5 considers the extent to
which it is possible to recommend changes to the ways the source data are produced to improve comparability, and proposes a set of standard indicators, within a harmonised methodological framework.
There is a strong link between this project and other OECD work on business demography, where this report will feed into the development of a wider methodological framework including business survival, growth and closure. There are also links to OECD work on entrepreneurship where there are plans to develop a set of harmonised indicators, including business start-up rates. Outside the OECD there are links to Eurostat work on business demography and the factors of business success, as well as to various international groups concerned with business demography, entrepreneurship and statistical business registers.
2. Data Sources and Existing International Comparisons
Most OECD countries have produced indicators on business start-up rates, usually derived from data held in statistical business registers. However, the methodology used has often been driven by national considerations, rather than a desire for international comparability. A quote from a recent Australian paper on establishing a conceptual framework for business demography (ABS (2004)) illustrates this perfectly; �Whilst international comparability of the data is considered to be important, the overriding requirement is the provision of data in the Australian context�. This is not stated as clearly by other national data providers, but appears to be a widely held view2. Understanding the methodological differences between data from different countries is therefore a vital pre-condition to any meaningful comparisons. 2.1 An Inventory The first step in this project was the compilation of an inventory of the different sources of data on start-ups in the OECD member countries (see Annex 2 for a summary version). This inventory is based on searches of the internet during autumn 2005, and thus will miss any sources made available after that date, or sources that are only available in other formats. Linguistic limitations may also mean that some sources not available in English or French have been missed. The inventory includes information on metadata, where available, to try to gain a better understanding of how comparable the different data sets really are. The availability of metadata varies from source to source, from virtually none to detailed papers describing every aspect of the source, definitions and methodology. The lack of standards in the presentation of metadata, and the availability of more detailed information only in the national language often made the task of understanding the metadata more difficult, and may have contributed to any errors in interpretation. This highlights the need for the uniform application of metadata standards to help data users to better understand differences in data, particularly when making international comparisons. 2 For example, the conflicting requirements of national and international users of United Kingdom data are considered in detail in Vale and Powell (2003).
STD/DOC(2006)4
10
Whilst international comparisons can be problematic, some countries have several data-sets available, based on different sources, which often give rather different measures of business start-ups at the national level. The assumption in this project is that any variation between sources relating to the same country must be purely methodological, i.e. linked to differences in definitions, coverage, thresholds, or any of the other factors affecting comparability identified in Section 3. This assumption has been tested on data for several countries (see Annex 4), where it has proved generally possible to explain differences in data in terms of the methodology used to produce them. 2.2 Other International Comparisons Before starting to compare data for different countries, it is useful to see what can be learned from previous work in this area. There have been several attempts over recent years to provide internationally comparable business start-up data, either by international organisations with an interest in harmonised statistics, or by individual countries seeking to benchmark their data in a meaningful way. Some of the main work in this area is summarised below, with an assessment of the level of comparability achieved. • Demography of Small and Medium-sized Enterprises (DOSME) � Eurostat The DOSME project was funded by the European Union from the mid-1990s until 2003 to produce data on business demography and factors affecting business success in twelve central and eastern European countries3, as they made the transition to a market economy. The project was based on a series of surveys, which effectively created several panels of businesses over time, and allowed the study of start-up and exit rates, survival, and the characteristics of the entrepreneur. The result was a firm-level dataset that, subject to confidentiality constraints, provides a useful resource for research on the development of the business economy in these countries during this transition period. Full information about this project is contained on the DOSME web site - http://forum.europa.eu.int/irc/dsis/dosme/info/data/en/index.htm. In terms of producing comparable data on business start-ups, this project was quite successful in developing and applying standard methodologies. However, the survey-based approach, differences in the administrative sources used, as well as coverage and general data quality issues, do cause some problems. The final stage of the project included finding ways to overcome some of these issues analytically, based on the variables available in the dataset, and even managed a reasonably robust comparison of data with those from the more recent Eurostat business demography project. It must, however, be remembered that the DOSME project observed these countries during an atypical period in their economic development. • Firm-level Data Project � OECD / World Bank This project attempted to create harmonised firm-level databases in ten OECD member countries4, with the aim of using these to produce comparable data on business dynamics. Researchers in each country were responsible for running standard analyses of their micro-data, with the resulting aggregates being shared for further cross-country analyses. The project is described in detail, along with some of the resulting analyses, in various papers linked to the project home page within the OECD web site: http://www.oecd.org/document/4/0,2340,fr_2649_37451_1962948_1_1_1_37451,00.html.
3 Albania, Bulgaria, Czech Republic, Estonia, Former Yugoslav Republic of Macedonia (FYROM), Hungary, Latvia, Lithuania, Poland, Romania, Slovak Republic and Slovenia. 4 Canada, Denmark, Finland, France, Germany, Italy, the Netherlands, Portugal, United Kingdom and United States

STD/DOC(2006)4
11
The data cover different periods between 1978 and 1998 depending on what was available at the national level, with the widest coverage in the early 1990�s. They are based on a variety of sources, and not all countries were able to produce start-up rates in line with the project definitions, for example some countries were not able to use the standard threshold of one employee. Comparisons with more recent Eurostat data have highlighted these and other quality issues (e.g. Brandt (2004)), often linked to improvements to the coverage and maintenance procedures of statistical business registers during the 1990�s. The World Bank has recently funded work to extend this approach to cover a further fourteen, mostly developing, countries5. This is documented in two papers by Bartelsman, Haltiwanger and Scarpetta (Bartelsman et al (2004), and Bartelsman et al (2005)). Various threshold and coverage issues that might affect data comparability, particularly for business start-ups, are noted in those papers. It could be argued that the original OECD firm-level data project was a little too ahead of its time, and that the resulting data are subject to a number of comparability issues that could not realistically be resolved at the time; indeed some of these have only recently started to be resolved at the national level. Having said this, many of the analytical techniques used seem to have been robust enough to give plausible results despite the limitations of the basic data. Also, putting data issues to one side, the approach of distributed analyses of standardised micro-data seems worth pursuing in any future projects of this nature, as it avoids data confidentiality issues, and makes use of national knowledge about the data. • Business Environment and Firm Entry � NBER / World Bank This study (Klapper et al (2004)) is published as a Working Paper of the US National Bureau of Economic Research (NBER), acknowledging financial support from the World Bank. It is available on the NBER website at http://www.nber.org/papers/w10380. It compares business start up data for over twenty European countries using data, mainly on corporate businesses, from the Amadeus database compiled by the private sector business data provider, Bureau Van Dijk. The results are also compared to US data sourced from Dun and Bradstreet, though comparisons may be affected by differences in the way the sources are compiled. The results are broadly in line with other sources, though some results such as an average start-up rate of 3.46% for Italy compared to 11.13% for Finland seem to be at odds with Eurostat figures (8.35% and 7.48% respectively). This is almost certainly due to the restriction to corporate businesses, and raises additional comparability issues related to variations in the propensity of businesses to incorporate. This will differ between countries depending on the cost and complexity of registration procedures, tax incentives, reporting burdens and possibly even cultural factors. Variations in the extent of re-registration in national systems, for example when a business changes its name, may also affect comparability. • Eurostat Business Demography Project This project brings together data for European Union countries (plus Norway and Romania) on business start-ups (births) closures (deaths), survival and growth, produced by national statistical offices using a common methodology. So far it has been run on a voluntary basis, which has resulted in a lack of data for some of the larger countries, particularly Germany and France, though it will soon become a legal requirement through the forthcoming revision to the Structural Business Statistics Regulation. 5 Argentina, Brazil, Chile, Colombia, Estonia, Hungary, Indonesia, Latvia, Mexico, Romania, Slovenia, South Korea, Chinese Taipei and Venezuela

STD/DOC(2006)4
12
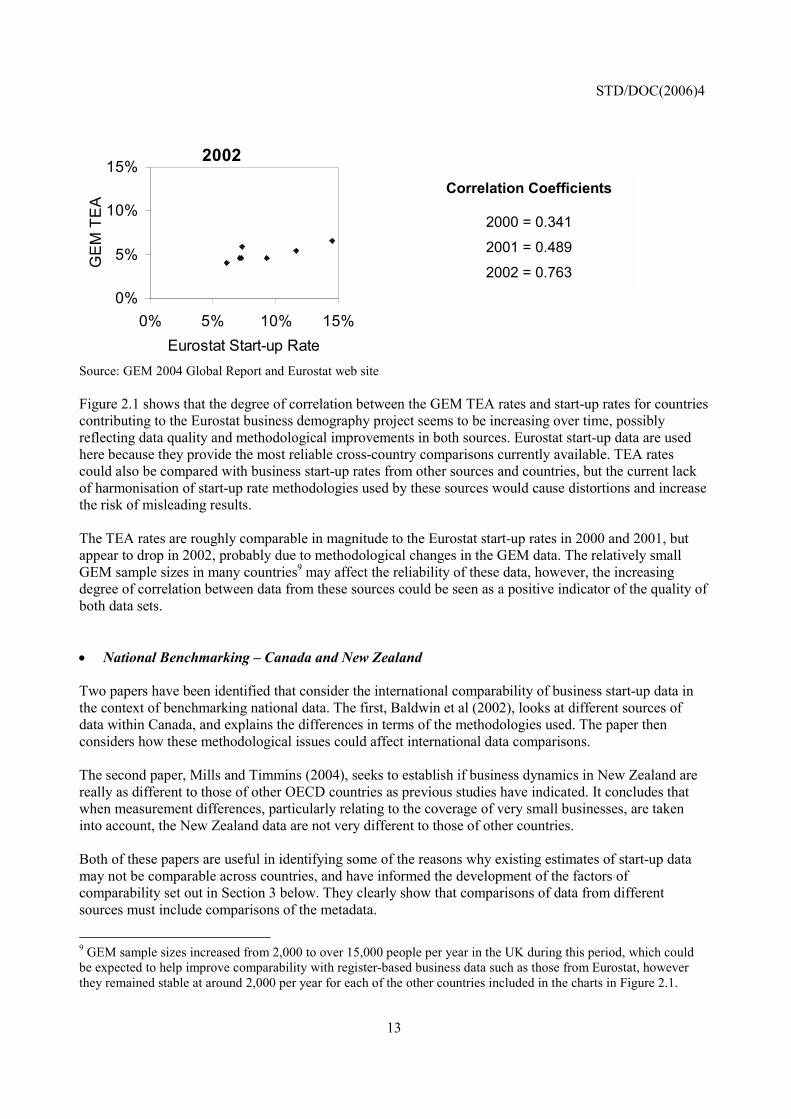
In terms of data comparability, this is probably the most successful international project to date, as the methodology to be followed at the national level is very detailed, and was tested and refined using pilot studies. The methodology is based on the use of business register data. The registers themselves are subject to a considerable degree of harmonisation due to the existence for over ten years of a European Union regulation on statistical business registers6, which requires minimum standards of contents and coverage. Unfortunately this does not mean that the data can be considered fully comparable yet, as different national thresholds affect the smallest size-classes, and matching procedures to separate pure births from other creations are affected by the availability and quality of key matching variables, as well as the use of different matching tools. Data and summary methodology resulting from this project are available via the Eurostat web site (http://epp.eurostat.cec.eu.int). A more detailed methodological manual has been produced, but not yet been published7. • Global Entrepreneurship Monitor The Global Entrepreneurship Monitor (GEM) project collects data on various aspects of entrepreneurship through a series of coordinated household surveys in a gradually increasing number of countries world-wide. More information on the project and participants can be found at; http://www.gemconsortium.org/. One of the key outputs of the GEM work is an indicator of �Total Entrepreneurial Activity� (TEA)8, which measures those respondents who have recently started a business, or have started taking steps towards setting up a new business. The TEA index is therefore not strictly a measure of business start-up rates, but should provide a reasonable indicator. Figure 2.1 - Comparing GEM TEA Rates and Eurostat Business Start-up Rates
2000
0%
5%
10%
15%
0% 5% 10% 15%Eurostat Start-up Rate
GE
M T
EA
2001
0%
5%
10%
15%
0% 5% 10% 15%Eurostat Start-up Rate
GEM
TE
A
6 Council Regulation (EEC) No 2186/93 of 22 July 1993 on Community co-ordination in drawing up business registers for statistical purposes - http://europa.eu.int/eur-lex/lex/LexUriServ/LexUriServ.do?uri=CELEX:31993R2186:EN:HTML 7 Business Demography Recommendations Manual, Eurostat, latest draft December 2004. 8 This is also referred to as the �Early Stage Prevalence Rate� in the 2005 GEM report.
STD/DOC(2006)4
13
2002
0%
5%
10%
15%
0% 5% 10% 15%Eurostat Start-up Rate
GE
M T
EA
Source: GEM 2004 Global Report and Eurostat web site Figure 2.1 shows that the degree of correlation between the GEM TEA rates and start-up rates for countries contributing to the Eurostat business demography project seems to be increasing over time, possibly reflecting data quality and methodological improvements in both sources. Eurostat start-up data are used here because they provide the most reliable cross-country comparisons currently available. TEA rates could also be compared with business start-up rates from other sources and countries, but the current lack of harmonisation of start-up rate methodologies used by these sources would cause distortions and increase the risk of misleading results. The TEA rates are roughly comparable in magnitude to the Eurostat start-up rates in 2000 and 2001, but appear to drop in 2002, probably due to methodological changes in the GEM data. The relatively small GEM sample sizes in many countries9 may affect the reliability of these data, however, the increasing degree of correlation between data from these sources could be seen as a positive indicator of the quality of both data sets. • National Benchmarking � Canada and New Zealand Two papers have been identified that consider the international comparability of business start-up data in the context of benchmarking national data. The first, Baldwin et al (2002), looks at different sources of data within Canada, and explains the differences in terms of the methodologies used. The paper then considers how these methodological issues could affect international data comparisons. The second paper, Mills and Timmins (2004), seeks to establish if business dynamics in New Zealand are really as different to those of other OECD countries as previous studies have indicated. It concludes that when measurement differences, particularly relating to the coverage of very small businesses, are taken into account, the New Zealand data are not very different to those of other countries. Both of these papers are useful in identifying some of the reasons why existing estimates of start-up data may not be comparable across countries, and have informed the development of the factors of comparability set out in Section 3 below. They clearly show that comparisons of data from different sources must include comparisons of the metadata.
9 GEM sample sizes increased from 2,000 to over 15,000 people per year in the UK during this period, which could be expected to help improve comparability with register-based business data such as those from Eurostat, however they remained stable at around 2,000 per year for each of the other countries included in the charts in Figure 2.1.
Correlation Coefficients
2000 = 0.341
2001 = 0.489
2002 = 0.763

STD/DOC(2006)4
14
3. Factors Affecting Comparability
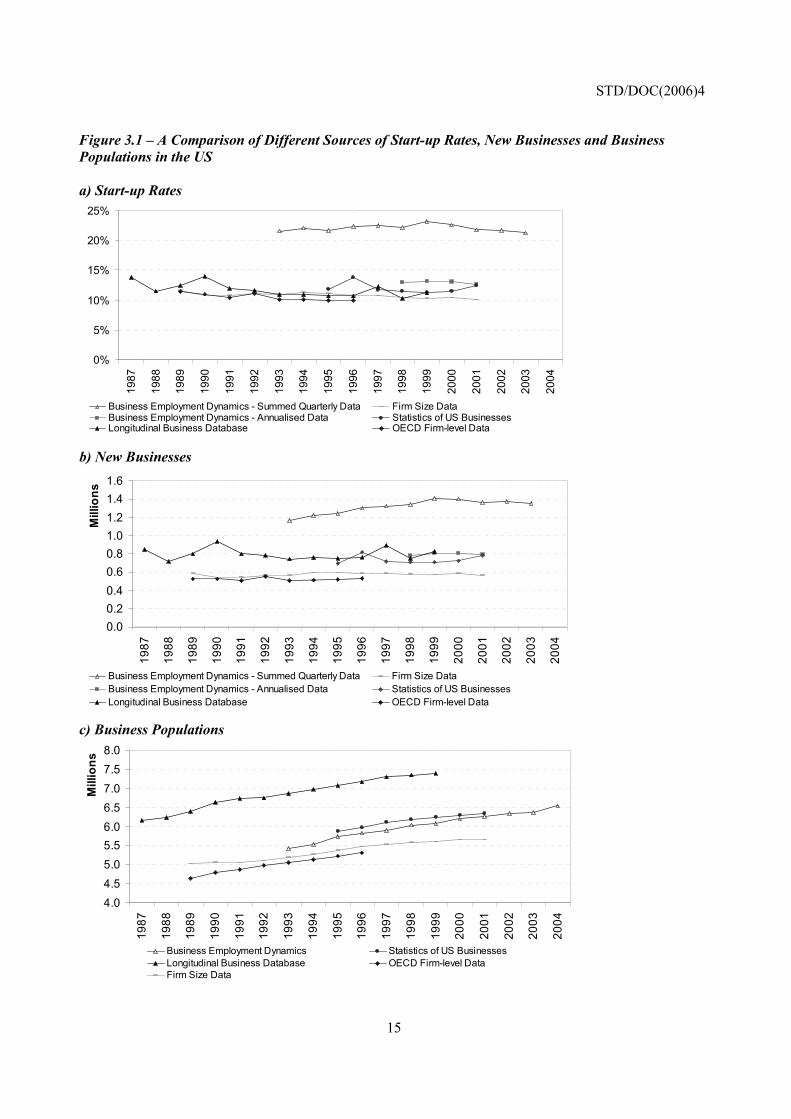
This section of the report aims to identify the different factors affecting the comparability of data on business start-ups, and to highlight the main issues involved. At first glance, the number and range of factors that affect comparability can make the task of compiling comparable data appear to be virtually impossible. The aim of this report is not to discourage the reader from trying to make comparisons, but to explore in detail the factors affecting comparability. If these are better understood, they may be more easily overcome, or it will at least be possible to make more informed decisions about which ones have little enough impact that they can safely be ignored. Just as comparability is often listed in typologies of the components of statistical data quality, so it is possible to develop a typology of the factors affecting comparability. Looking at this in another way, such a typology can also provide a list of the reasons why data may not be comparable. Focussing specifically on the area of the international comparability of business start-up rates, these factors can be defined either in terms of the numerator (the number of new businesses), the denominator (the population or stock), or both (assuming the denominator is based on businesses)10. The approach of separating numerator and denominator factors is based on the study of differences between data sources within countries (see Annex 4). This work clearly shows the range of factors that can affect data comparability between sources that are attempting to measure the same phenomenon for the same country. It also demonstrates that there is a complex interaction between these factors. The three charts in Figure 3.1 below are taken from Annex 4, where they, and similar charts for nine other countries, are discussed in detail, and the reasons for the differences are explained. They compare United States data from various sources, and demonstrate clearly how start-up rate indicators that appear to be similar are actually quite different when they are split into their components. The Business Employment Dynamics quarterly data set is a clear outlier in terms of start-up rates, though the annualised data from this source show that this is almost entirely due to periodicity and data purity issues. The remaining data sources appear to give fairly comparable measures of start-up rates, typically between 10% and 13%, though these mask the differences in the populations of new and existing businesses used to derive these rates.
10 Business start-ups can also be measured in terms of employment creation rather than numbers of new businesses (see Baldwin et al (2002)). This measure is less sensitive to the inclusion or exclusion of very small units, but is more sensitive to the type of unit used (new establishments of existing enterprises can be very large), and the inclusion of events other than pure births (which tend to involve larger businesses). This approach is not considered further in this section for the purely pragmatic reasons that more data are available on counts of businesses than on employment, and that employment of new businesses can be rather difficult to measure accurately. It is, however, revisited in Section 5 of this report, which considers possible supplementary indicators.
STD/DOC(2006)4
15
Figure 3.1 � A Comparison of Different Sources of Start-up Rates, New Businesses and Business Populations in the US a) Start-up Rates
0%
5%
10%
15%
20%
25%
1987
1988
1989
1990
1991
1992
1993
1994
1995
1996
1997
1998
1999
2000
2001
2002
2003
2004
Business Employment Dynamics - Summed Quarterly Data Firm Size DataBusiness Employment Dynamics - Annualised Data Statistics of US BusinessesLongitudinal Business Database OECD Firm-level Data
b) New Businesses
0.00.20.40.60.81.01.21.41.6
1987
1988
1989
1990
1991
1992
1993
1994
1995
1996
1997
1998
1999
2000
2001
2002
2003
2004
Mill
ions
Business Employment Dynamics - Summed Quarterly Data Firm Size DataBusiness Employment Dynamics - Annualised Data Statistics of US BusinessesLongitudinal Business Database OECD Firm-level Data
c) Business Populations
4.04.55.05.56.06.57.07.58.0
1987
1988
1989
1990
1991
1992
1993
1994
1995
1996
1997
1998
1999
2000
2001
2002
2003
2004
Mill
ions
Business Employment Dynamics Statistics of US BusinessesLongitudinal Business Database OECD Firm-level DataFirm Size Data

STD/DOC(2006)4
16
The typology approach has been followed below, resulting in a set of nine factors affecting the comparability of business start-up rates, each of which is considered in more detail in Sections 3.1 to 3.9. This typology has been developed based on reactions to earlier drafts proposed in Vale (2005(a)), and Ahmad and Vale (2005). Numerator factors:
• Purity � to what extent are �pure births� distinguished from reactivations and other creations? • Timing � at what point in the creation process is a start-up measured? • Periodicity � over what period are start-ups measured, and how does this affect the measurement
of very short-lived businesses? Denominator factors:
• Type of Population � businesses or people? • Temporal basis � is the population measured at a specific point in time, or does it consist of all
units that were present at any time during a given period? Factors affecting both:
• Source � are the data taken from a register, a census or a survey? How reliable is the source? • Units � what is the entity about which the data are produced? • Coverage - to what extent are certain types of business included or excluded based on specific
attributes (e.g. economic activity or legal form)? • Thresholds � what explicit or implicit size thresholds apply to the source?
Various other factors can be identified as affecting comparability of start-up data, such as the size of national economies, demand and supply constraints, the impact of tax, subsidy and other policies, the nature of the political system, and a wide range of other economic, political, social and cultural factors. None of these factors relate to the data production methodology, and many of them account for the sort of variation in data that users are really interested in. Indeed if they were all eliminated, the data would be identical for each country, and of no real use to anyone. For this reason, this report only focuses on the nine methodological factors of comparability listed above. If these can be understood, and their impact reduced, data users have a much better chance to observe the non-methodological factors in a less biased way. 3.1 Purity It is often relatively easy to measure business entries, i.e. those businesses that are present in a given period but were not present in the previous period. It is rather more difficult to separate out pure births (sometimes referred to as creations ex nihilo) from entries due to re-registrations, reactivations, take-overs and other demographic events11, i.e. those entries that are either the continuation of an activity previously carried out under a different unit, or a reactivation of a business that has been active in the recent past, but was dormant (or not recorded) in the previous period. The term �purity� is therefore used to refer to the extent to which business start-ups have been split into pure births and other entries.
11 For a typology of demographic events affecting businesses see Eurostat (2003).
STD/DOC(2006)4
17
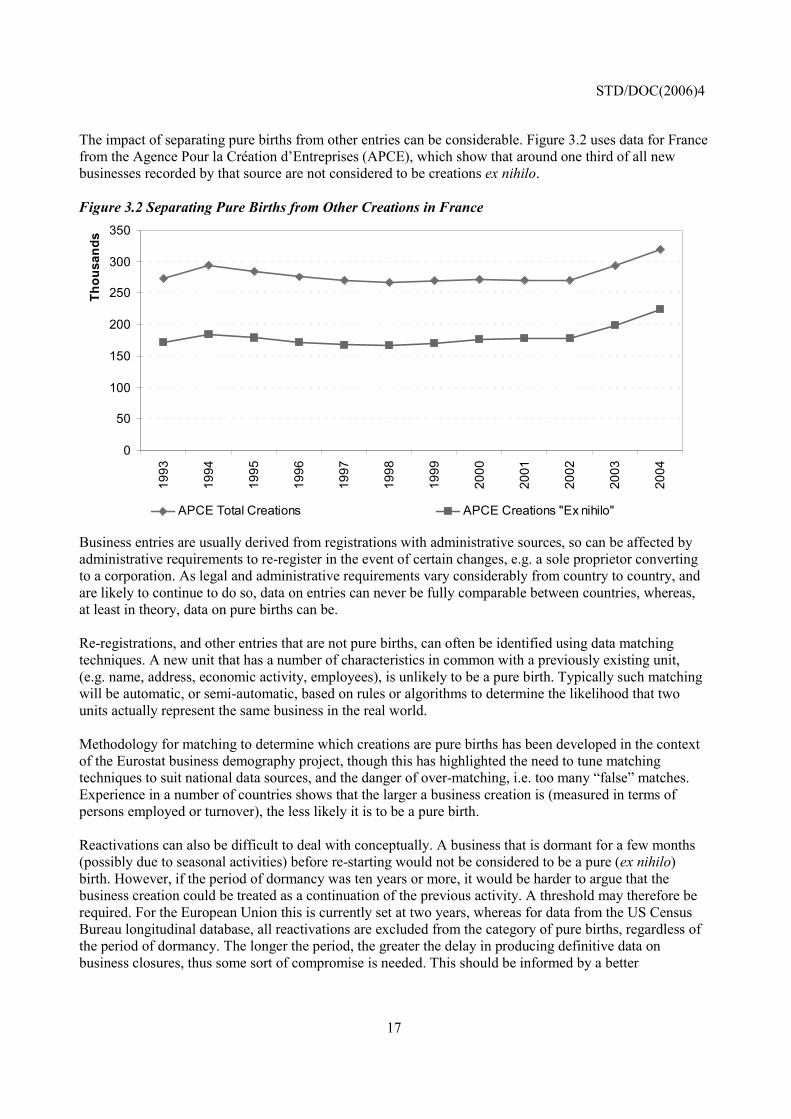
The impact of separating pure births from other entries can be considerable. Figure 3.2 uses data for France from the Agence Pour la Création d�Entreprises (APCE), which show that around one third of all new businesses recorded by that source are not considered to be creations ex nihilo. Figure 3.2 Separating Pure Births from Other Creations in France
0
50
100
150
200
250
300
350
1993
1994
1995
1996
1997
1998
1999
2000
2001
2002
2003
2004
Thou
sand
s
APCE Total Creations APCE Creations "Ex nihilo"
Business entries are usually derived from registrations with administrative sources, so can be affected by administrative requirements to re-register in the event of certain changes, e.g. a sole proprietor converting to a corporation. As legal and administrative requirements vary considerably from country to country, and are likely to continue to do so, data on entries can never be fully comparable between countries, whereas, at least in theory, data on pure births can be. Re-registrations, and other entries that are not pure births, can often be identified using data matching techniques. A new unit that has a number of characteristics in common with a previously existing unit, (e.g. name, address, economic activity, employees), is unlikely to be a pure birth. Typically such matching will be automatic, or semi-automatic, based on rules or algorithms to determine the likelihood that two units actually represent the same business in the real world. Methodology for matching to determine which creations are pure births has been developed in the context of the Eurostat business demography project, though this has highlighted the need to tune matching techniques to suit national data sources, and the danger of over-matching, i.e. too many �false� matches. Experience in a number of countries shows that the larger a business creation is (measured in terms of persons employed or turnover), the less likely it is to be a pure birth. Reactivations can also be difficult to deal with conceptually. A business that is dormant for a few months (possibly due to seasonal activities) before re-starting would not be considered to be a pure (ex nihilo) birth. However, if the period of dormancy was ten years or more, it would be harder to argue that the business creation could be treated as a continuation of the previous activity. A threshold may therefore be required. For the European Union this is currently set at two years, whereas for data from the US Census Bureau longitudinal database, all reactivations are excluded from the category of pure births, regardless of the period of dormancy. The longer the period, the greater the delay in producing definitive data on business closures, thus some sort of compromise is needed. This should be informed by a better

STD/DOC(2006)4
18
understanding of the reasons for dormancy, and the possibilities of adjusting for reactivations using modelling based on historic data. In countries where it is possible to link employers and employees over time, these links can be used to help determine pure births. This method has been tested in New Zealand, where, if at least 70% of employees appear to move from an old registration to a new one, it is assumed that the new business is not a pure birth. Taken together with work to identify when sites are transferred between businesses, this has resulted in around 20% of entries now being confirmed not to be pure births. These businesses tend to be the larger entries, accounting for around 60% of the employment attributed to entries (Mead (2005)). Similar work in Canada is reported in Baldwin et al (2002), which also showed that using linked employer-employee data from the Longitudinal Employment Analysis Program (LEAP) file can reduce business start-up rates from an annual average of 18.5% to around 14.5%. The fall was considerably more pronounced in terms of the employment attributed to start-ups, which dropped from an annual average of 11.8% to just 4% (or 2.5% depending on how and when employment was measured). These results are complemented in that paper by survey data showing that firms entering the manufacturing sector by acquiring an existing plant accounted for only 0.8% of plants, but 3.2% of employment, whereas those firms entering manufacturing with a new plant accounted for 7% of plants, but only 2.1% of employment. Both studies appear to call into question the importance of business start-ups in terms of job creation, demonstrating that where more advanced linkage techniques are used, the employment that can be attributed to pure births is rather lower than previously thought. This is backed up by findings in several countries participating in the Eurostat business demography project, e.g. Cella and Viviano (2004). Pure births with more than 20 employees seem to be quite rare in most countries, and tend to be limited to cases of inward investment, a few labour intensive service activities, or manufacturing activities that have traditionally been associated with high entry thresholds. The figures from France, Canada and New Zealand clearly illustrate that any work to distinguish pure births from other entries will result in lower start-up rates, therefore the amount of such work undertaken should be considered when comparing data from different sources. The potential impact on trends is less obvious. Total entries may well show similar trends to pure births in the short term, but are more likely to be affected when administrative sources and systems change. 3.2 Timing This issue concerns differences in the point at which data sources record a business start-up. This can vary from the time a person starts thinking about creating a new business to the time a new business makes its first sales, reaches a certain financial or employment threshold, or survives for a certain period. For some new businesses the time intervals between these events is very short, for others it can be measured in years, whereas a third category do not meet all the criteria, so could be measured as a start-up by one source, but not by another. This third category demonstrate that sources that record start-ups at an early point in the process tend to show higher start-up rates, particularly for very small businesses. These are, of course, accompanied by higher exit rates. Typically, the point at which a start-up is recorded is determined by the nature of the data source. Surveys of people or households can measure intentions, administrative sources are linked to more concrete legal or fiscal obligations, and surveys of businesses are typically directed at those that have at least a certain level of economic activity.

STD/DOC(2006)4
19
There is a clear link here with the discussion on thresholds below, as sources with higher thresholds are likely to record businesses at a later point in the start-up process than sources with lower thresholds. For example, a business will only register with an administration responsible for taxation of employee earnings when it takes on its first paid employee. This could be some time after it has registered to pay sales or value-added tax. It is also important to know whether certain sources allow pre-registration, i.e. where a business can be registered in advance of actually starting activity. This is typically more common for regulatory sources than taxation sources, but can happen for both. Ideally both a registration and a start date are needed, but in practice it is usually necessary to use other indicators of whether a business has really started such as tax returns, sales or employment. A related issue concerns lags, i.e. the time difference between events taking place in the real world, and being recorded in the data source. For statistical business registers the lags in recording business start-ups depend on the source of the information, typically administrative or tax registers. Figure 3.3 shows an analysis of business start-up lags for the British statistical business register resulting from the use of value added tax (VAT) registration data. Figure 3.3 � VAT Registration Lags Affecting the British Statistical Business Register
0%
5%
10%
15%
20%
25%
30%
-50 0 50 100
150
200
250
300
350
400
450
500
550
600
Lag in Days
This chart shows that almost 80% of start-ups are notified within 100 days, and that very few have a lag of more than a year12. Lags will obviously vary considerably depending on the nature of the source and the frequency of updates. If the source records only the date of notification, and start-up rates and lags are stable over time the impact will be negligible. If the source attempts to record the actual start-up date, it will be necessary to either wait until the impact of the remaining lags is insignificant before producing start-up data for a given period, or to make adjustments based on the estimated effect of lags. Thus the main impact on comparability due to lags will be in the most recent periods. 12 One reason for lags of more than a year is retrospective registration of businesses found not to have declared their revenue to the tax authorities.

STD/DOC(2006)4
20
3.3 Periodicity This issue concerns whether the data are sub-annual, annual, or less frequent. The majority of the sources identified in Annex 2 concern annual data, though quarterly and monthly data sets are available for some countries. In a few cases, data availability is linked to economic censuses at intervals of five years. For data with a periodicity of greater than one year it is difficult to construct start-up rates that can be compared to annual data, as the proportion of short-lived firms that will be missed increases considerably. In Japan, annualised average rates are calculated for the years between censuses (Takahashi (2000)), but these mask the natural year on year variability usually observed in start-up data. If sub-annual data include counts of start-ups, they can simply be added to produce annual totals, though these totals will be higher than those based on annual snap-shots due to better coverage of businesses that survive for less than one year. If sub-annual start-up data are only available in the form of birth rates, it is clearly more difficult to estimate the annual rate without further information about the net change in the population. Work to convert quarterly establishment start-up data from the Business Employment Dynamics series produced by the US Bureau of Labor Statistics to an annual basis has resulted in differences of over 40% between annualised start-ups and the sum of start-ups for the four separate quarters. This is a result of both the removal of short-lived businesses, and improvements to the purity of the start-up estimates by better linkage of establishments over time, and is documented in Pinkston and Spletzer (2004). This leads towards questions about the value of data for very short-lived businesses. Is a business that only lasts for a month or two, perhaps with no employees, and possibly even no sales, of any real interest? Would it be more meaningful to only consider start-ups that remain active for at least a year, or some longer period? In terms of current data availability, often based on annual snap-shots of the population of businesses, this becomes a rather difficult question. Many of the businesses that are live for less than a year will be excluded altogether, but those that, by chance, are live on the day the snap-shot is taken, will be included. This could cause certain biases, for example a common reference date in a number of data sets is 31 December / 1 January. Short-lived businesses with activities related to the Christmas period are likely to be included, but, for the northern hemisphere, short-lived businesses with certain tourism or agriculture-related activities could be under-represented. Possible solutions include the recording of start-up and closure dates to allow a more accurate measure of the period of survival, or only counting business start-ups that are present in at least two consecutive periods. The use of dates is the more attractive and flexible option, but it relies on the availability of accurate information. Linking the timing of the start-up to an administrative event, such as coming into scope of an administrative source might help, as the source is likely to record that date. Given the lack of harmonisation of sales related taxation systems, administrative sources that record when a business takes on its first paid employee are likely to be most appropriate in terms of international comparability. Annual data may not be fully comparable if they refer to different periods. Typically the period is the calendar year, but other periods such as March to March (United States) and July to July (Australia) are also used. For strict comparisons on a calendar year basis, such data sets would need to be apportioned between years, though in practice this may not be necessary if start-up rates are fairly stable over time. Finally, where data are annual, they may not reflect an exact calendar year. If the observations are not taken on exactly the same day each year, there will be an impact on data comparability both between countries and over time.

STD/DOC(2006)4
21
3.4 Type of Population Two basic types of population can be used as the denominator for calculating business start-up rates. The population of businesses is the most frequently used, however for some countries and sources, particularly where household surveys are used to measure business start-ups and entrepreneurship, the denominator can also be based on the human population. Business populations can vary considerably in the way they are defined. Most of the issues are covered in the sections on coverage and thresholds below, but one specific point to note here is the extent to which the population includes non-active units. The requirement in the Eurostat business demography methodology for population units to be active in terms of having turnover and/or employment at some point during the reference period is rather more restrictive than taking, for example, a count of all current registrations. Both types of population raise potential issues for international comparability, particularly where there are large differences in the structure of the population between countries. For example, using the total human population of a country as a denominator is likely to give higher start-up rates for countries with a higher proportion of the population considered to be of working age, than those with higher proportions of children or retired people. It may also be necessary to have some knowledge about under-coverage due to factors such as illegal immigration and undeclared workers to either make informed adjustments to the population, or to be able to safely assume that the impact of under-coverage on comparability is negligible. The issue of undeclared workers is closely related to underground businesses, that is, those businesses that are active but which are not registered to avoid tax payments or compliance with labour laws for example, an issue that affects both the numerator and denominator. Another approach is to use the population of working age, or of those people considered to be economically active, if these populations can be defined consistently across countries. However, even if a consistent definition is used, structural differences in national economies, political or cultural differences (e.g. the rate of participation of women in economic activity, or the ease with which a new business can be established13), can affect comparability. In such cases however it might be preferable not to try to correct for such differences, as they, arguably, form part of the phenomena to be observed, nevertheless, it is always helpful to be aware of their potential impact when trying to interpret data from different countries. For some specific purposes other sub-sets of the human population may be used, an example of this is the use of the population of unemployed persons for analyses designed to illustrate the extent to which unemployment encourages entrepreneurship. Great care is needed to accurately interpret data using such sub-populations, as, in practice, only a proportion of new businesses are actually started by people who were previously unemployed.
13 The World Bank and the International Finance Corporation, have financed work on an indicator ranking countries on this topic, see: http://www.doingbusiness.org/EconomyRankings/Default.aspx?direction=asc&sort=2

STD/DOC(2006)4
22
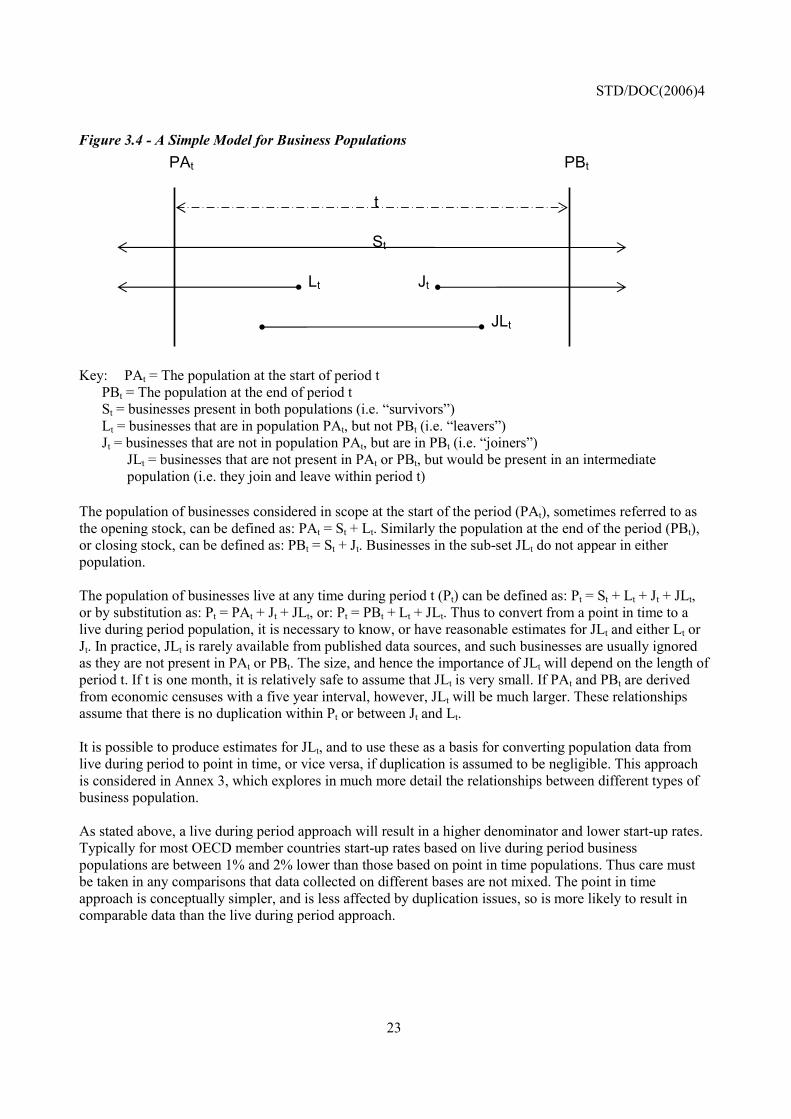
3.5 Temporal Basis If the denominator is based on the human population, point in time estimates are generally used, i.e. the number of people on a specific date. Where it is based on a business population, two variants have developed. The traditional approach, followed in most of the data sets studied, is to use point in time business population data. This is consistent with human demography, and allows a �stocks and flows� approach to business demography. An alternative approach is to use the population of businesses that were considered to be in scope at any point during a given reference period. This approach is favoured by Eurostat in their business demography data collections, partly because it ties in with the approach used to collect financial variables (e.g. turnover for a given period), and partly because it was thought at one time to be easier for countries that did not have accurate birth dates for units in their business registers. It is clear that a live during period population will be larger than one on a point in time basis. The extent of the difference will depend on various factors, but mainly on the length of the period, and the degree of churn (i.e. entries plus exits) in the business population. As a result, data compiled using a point in time population will not be directly comparable with those based on a live during period approach. One further comparability issue with the live during period approach is that a proportion of business entries will be due to new businesses taking over the activities from businesses recorded as exits14. Technically, many of these cases should be considered as the continuity of a previous business, and should not be recorded as entries and exits. However, as most data sources are based either directly or indirectly on registrations and de-registrations with administrative or tax sources, it is unlikely that all such take-over cases are recorded as business continuity, particularly for small businesses. This will inevitably result in a certain amount of duplication in live during period populations, as such businesses will appear in them at least twice. The extent of duplication will vary from country to country and between sources, depending on the nature of the source and register maintenance procedures. This, in turn, will affect the comparability of indicators based on live during period populations. There is, however, also a danger with the point in time approach, in that those short-lived businesses discussed in the section on periodicity above, that enter and exit in the period between two reference points may not be included in counts of start-ups, or the associated business populations. This risk is theoretically removed using the live during period approach, but in practice is only really solved for either approach by holding accurate birth and death dates, the recording of some measure of activity (e.g. turnover), or frequent observations of the whole population. It is often possible to estimate a live during period population by adding the total number of business entries during a period to the point in time estimate for the start of that period. Similarly a point in time population can be estimated from live during period data, though movements into and out of scope, and the degree of duplication in live during period populations, can affect such estimates. To illustrate this, point in time and live during period populations of businesses can be broken down into a number of components, which can then be re-aggregated in different ways to give different types of population estimates. The basic components are shown in Figure 3.4 below.
14 Around 15% in the French data shown in Figure 3.2.
STD/DOC(2006)4
23
Figure 3.4 - A Simple Model for Business Populations
Key: PAt = The population at the start of period t PBt = The population at the end of period t St = businesses present in both populations (i.e. �survivors�) Lt = businesses that are in population PAt, but not PBt (i.e. �leavers�) Jt = businesses that are not in population PAt, but are in PBt (i.e. �joiners�)
JLt = businesses that are not present in PAt or PBt, but would be present in an intermediate population (i.e. they join and leave within period t)
The population of businesses considered in scope at the start of the period (PAt), sometimes referred to as the opening stock, can be defined as: PAt = St + Lt. Similarly the population at the end of the period (PBt), or closing stock, can be defined as: PBt = St + Jt. Businesses in the sub-set JLt do not appear in either population. The population of businesses live at any time during period t (Pt) can be defined as: Pt = St + Lt + Jt + JLt, or by substitution as: Pt = PAt + Jt + JLt, or: Pt = PBt + Lt + JLt. Thus to convert from a point in time to a live during period population, it is necessary to know, or have reasonable estimates for JLt and either Lt or Jt. In practice, JLt is rarely available from published data sources, and such businesses are usually ignored as they are not present in PAt or PBt. The size, and hence the importance of JLt will depend on the length of period t. If t is one month, it is relatively safe to assume that JLt is very small. If PAt and PBt are derived from economic censuses with a five year interval, however, JLt will be much larger. These relationships assume that there is no duplication within Pt or between Jt and Lt. It is possible to produce estimates for JLt, and to use these as a basis for converting population data from live during period to point in time, or vice versa, if duplication is assumed to be negligible. This approach is considered in Annex 3, which explores in much more detail the relationships between different types of business population. As stated above, a live during period approach will result in a higher denominator and lower start-up rates. Typically for most OECD member countries start-up rates based on live during period business populations are between 1% and 2% lower than those based on point in time populations. Thus care must be taken in any comparisons that data collected on different bases are not mixed. The point in time approach is conceptually simpler, and is less affected by duplication issues, so is more likely to result in comparable data than the live during period approach.
t
St
Lt Jt
JLt
PAt PBt

STD/DOC(2006)4
24
3.6 Source The main source for publicly available data on business start-ups is usually some sort of register, either an administrative register maintained by a tax or regulatory agency, or a statistical business register maintained by a national statistical institute. The main advantage of this sort of source is usually comprehensive coverage of the population of interest, though systematic biases may also be present due to the sort of coverage and threshold issues identified below. In theory, census data can be at least as good, and sometimes better, if they have less scope restrictions, but the cost of running a census of businesses every year makes this approach unrealistic for most countries. Data from less frequent censuses may still be of interest, but as discussed in the section on periodicity above, they raise major comparability issues. Survey data have also been used by some countries, most notably in the DOSME15 project for countries of Central and Eastern Europe. This approach can be useful when registers are not sufficiently developed, and has the advantage of being able to collect more information on entrepreneurship than is available from other sources, but it also suffers from the usual constraints of survey errors and sample size limitations when detailed data breakdowns are required. The reliability of the source needs to be taken into account. This takes us back to the components of the quality of statistical data, which have been well documented elsewhere16, but it is clear that data from a comprehensive, frequently updated statistical business register are likely to be more reliable than those from a small scale survey or study. The quality of the data in the source clearly has an impact on most of the other factors of comparability identified here, for example poor quality information on economic activity will have an impact on the comparability of coverage. It is also often the case that data from an official source (e.g. a national statistical institute) are at least perceived to be more reliable than those from a commercial organisation. However, this sort of generalisation is not always helpful, and a detailed understanding of the respective methods used is necessary to make an informed judgement. 3.7 Units The notion of a �business� is rather vague. Statistical institutes around the world have historically tried to define the units for business statistics based on the sources of administrative data available to them. The starting points are typically the unit that has some sort of legal or tax obligation, often referred to as a �legal unit�, and the unit that corresponds to a physical location from which a business operates, often referred to as a �local unit� or an �establishment�. Over time there have been attempts at the international standardisation of these units, particularly in the European Union, where a regulation on statistical units17 has gone part of the way towards harmonising the units used, and, has at least succeeded in harmonising the terminology. Thus data from European Union
15 Demography Of Small and Medium-sized Enterprises � see: http://forum.europa.eu.int/irc/dsis/dosme/info/data/en/index.htm 16 For example: http://forum.europa.eu.int/Public/irc/dsis/qis/library?l=/public&vm=detailed&sb=Title 17 Council Regulation (EEC) No 696/93 of 15 March 1993 on the statistical units for the observation and analysis of the production system in the Community (Official Journal of the European Communities No L 076, 30/03/1993, p. 1), http://europa.eu.int/eur-lex/lex/LexUriServ/LexUriServ.do?uri=CELEX:31993R0696:EN:HTML

STD/DOC(2006)4
25
countries will refer to enterprises, local units or enterprise groups in a basically consistent way. There have been proposals to study the demography of local units and enterprise groups, but, at least for now, business start-up data for these countries are usually at the enterprise level18. The enterprise is defined for European Union countries in the statistical units regulation as �the smallest combination of legal units that is an organisational unit producing goods or services, which benefits from a certain degree of autonomy in decision-making, especially for the allocation of its current resources. An enterprise carries out one or more activities at one or more locations. An enterprise may be a sole legal unit.� Unfortunately it has been demonstrated that this definition is not always applied consistently (e.g. in Herczog et al (1998)), particularly for more complex enterprises (e.g. those with more than one legal unit) so it can not be assumed that data on units labelled as enterprises are fully comparable in practice. This is largely due to differences in the legal, administrative and tax frameworks across countries. A business that is organised as a single legal unit in one country might prefer to organise itself into several legal units in another country to optimise the way it interacts with government, employees and the market. For statistical purposes it is necessary to recognise both as the same sort of entity, though creating the necessary statistical structures through business profiling is a task that is difficult to automate, so is therefore very expensive. Outside the European Union there is a much greater freedom in terms of the choice (and terminology) of units. In the United States, the establishment, which is closer to the European local unit, is the main unit used for business statistics purposes. The term �firm� is used for an aggregation of establishments under common control in a given geographic area, or sharing a particular economic activity. Enterprises are defined as �business organizations consisting of one or more domestic establishments that were specified under common ownership or control�19, thus making them closer to the European concept of the enterprise group. Similar terminology and definitions are used in Canada, though the term �business� is sometimes used instead of �firm�. It is noted in Baldwin et al (2002), that �international studies must recognize that the level at which a �firm� is defined varies across countries�. The term enterprise is also used in most other OECD member countries, with slight variations in the definition. It is defined in the System of National Accounts20, the key international methodological framework for economic statistics, as �an institutional unit in its capacity as a producer of goods and services; an enterprise may be a corporation, a quasi-corporation, a non-profit institution, or an unincorporated enterprise.� In practice, the unit referred to as the enterprise is often equivalent to, or very closely linked to, the national definition of the legal unit. For a more detailed study of the different types and definitions of units used, see Choi and Ward (2004). Despite all of the above differences, it is likely that the vast majority (often at least 95%) of business start-ups have a very simple structure, with just one site. This means that, in most cases, all of the units above have a one to one relationship, and are in fact different views of the same entity. Unfortunately, it is not quite as simple as might appear from the above paragraph to compare start-up rates for enterprises and establishments. There are two main complicating factors. The first is that the total
18 Several countries are, however considering the potential of local unit / establishment data to help determine enterprise continuity. 19 US Census Bureau - http://www.census.gov/csd/susb/defterm.html 20 The System of National Accounts (1993) is promoted by the United Nations Statistics Division, and is available via their web site: http://unstats.un.org/unsd/sna1993/introduction.asp
STD/DOC(2006)4
26
population of active enterprises will typically have higher proportions of multi-site and complex businesses than the population of enterprise start-ups, thus if enterprise data are to be converted to an establishment basis, the denominator needs to be increased to take account of this. How much of an increase is likely to depend on a number of factors including fiscal policy and the economic size and geography of the country. For the United Kingdom this would reduce start-up rates by up to 2%. The second factor works in the opposite direction, because a proportion of establishment start-ups will be new sites of existing enterprises21. These would need to be added to the numerator, increasing the start-up rate by up to 3%. The net result is therefore likely to be that establishment start-up rates are slightly higher than those for enterprises. 3.8 Coverage The coverage of data on new businesses and the business population depends heavily on the source. In most cases this is a national statistical business register. If this register does not include all legal forms or all economic activities, it logically follows that the data on new businesses will have at least the same restrictions. Sometimes, even if the register does include certain categories, there may be reasons for excluding them from counts of new businesses. These reasons may be linked to quality concerns, the policy of the statistical institute, customer requirements, or just tradition. Categories most frequently considered to be out of scope in terms of economic activity are agriculture, forestry, fishing and public administration. Units with the legal forms of central or local government are also often excluded. The existence of a number of different classifications of economic activity and legal form further complicates matters, as specific categories of units may be treated differently according to the classification system used. Fortunately the examples of frequently excluded categories above are also areas where international classification systems are relatively well harmonised. The treatment of businesses that move into and out of scope needs to be determined and specified. The Eurostat approach attempts to exclude entries due solely to changes in economic activity or other characteristics from data on pure births, whereas this distinction is not necessarily made in other data sets. The comprehensiveness of the source obviously has a major bearing on the ease of identifying such cases. As is the case for units, the greatest degree of harmonisation in coverage, at least in theory, exists between the Member States of the European Union, mainly due to the minimum requirements set out in a regulation on statistical business registers22, which is currently being revised with the aim of extending and further harmonising the scope of these registers. Despite this, the data on business demography currently published by Eurostat has one of the most restricted scopes of the data sets studied. Economic activities such as health, education and personal services, and all non-market legal forms are excluded from most analyses. These exclusions are largely driven by data quality concerns, which suggest that the actual level of harmonisation of business registers is still somewhat below that required by the regulation. There is a tendency when comparing data that differ in scope to look for the lowest common denominator, i.e. the core set of data that are available for all sources. This can, however, be problematic in some cases. For example, data from the United States typically exclude railway operators, a category that is not always readily and separately identifiable in data from other countries. In cases like this, alternative approaches 21 Between 19% and 28% depending on the year based on comparisons of data on births at original locations (new firms), and secondary locations (new sites of existing firms) from the US Small Business Administration - See http://www.sba.gov/advo/research/data_uspdf.xls, worksheets dyn_00 to dyn_02. 22 Council Regulation (EEC) No 2186/93 of 22 July 1993 on Community co-ordination in drawing up business registers for statistical purposes - http://forum.europa.eu.int/irc/dsis/bmethods/info/data/new/2186-93en.htm

STD/DOC(2006)4
27
could include modelling for the missing categories, or simply ignoring minor scope exclusions in some sources if their impact is considered to be trivial. Where a population of businesses is used as the denominator for start-up rates, it is obviously better to try to define this in as close a way as possible to that used for new businesses, i.e. the coverage should be the same for both in terms of economic activity, legal form and other criteria. Any differences will increase the possibility of other changes having an impact on the birth rate23. By definition, administrative and statistical registers, in all countries, will exclude businesses operating exclusively in the non-observed or informal economy. They will also understate size variables for businesses operating partially in this way. For developed countries, the economic importance of such businesses is generally not thought to be significant, particularly in terms of total economic activity. These businesses may, however, be of interest in the context of measuring entrepreneurship or determining small and medium-sized enterprise (SME) policy. It is therefore useful to have reasonably reliable estimates of the impact of such businesses, perhaps from comparing labour force and business employment survey statistics or consumer expenditure and declared business income. Variations in geographical coverage may also affect within country comparability. This is most likely to be a problem when there are autonomous or detached territories that may be included in one source but not another, or when there has been a boundary change. The most notable examples found in the course of this project are German data that exclude the former East Germany, and United Kingdom data that exclude Scotland and Northern Ireland. In both cases, start up rates for the included areas are, according to other sources, different to those for the excluded areas. Thus these sources are not strictly comparable with other national sources, and are not really suitable for international comparisons, as they are not fully representative of the national situation. 3.9 Thresholds There are no clearly defined, internationally agreed minimum size criteria for business activity. Most data from the United States include only businesses with employees, whereas certain Japanese data, and some international comparisons,24 include only corporate businesses. These sources therefore contain only a limited proportion of smaller businesses. The European Union requires that all businesses with a labour input of at least one person half-time are included in statistical business registers, and recommends covering smaller businesses if possible. Some countries require all businesses to be registered regardless of size, but even these are unlikely to record very low levels of business activity such as individuals who occasionally sell second-hand or surplus goods to neighbours, via markets, or through internet auction sites. Some of the smallest �businesses�, particularly those with a labour input of less than one person half-time, may be registered, but of little interest statistically. Hobby businesses operated for reasons other than profit maximisation, and the provision of goods or services for a few hours per week to supplement a main income are examples of this. In Volfinger (2004) the statistical relevance of Hungarian enterprises with a
23 For example, if the population used for the denominator includes all legal forms, but the data on new businesses used for the numerator exclude central and local government units. A re-organisation of local government that creates many new units in that sector would have the effect of increasing the denominator but not the numerator, thus artificially reducing the birth rate. 24 E.g. Klapper et al, (2004)

STD/DOC(2006)4
28
turnover of less than one thousand Euros is questioned. These accounted for 9% of active enterprises in 2002. Thresholds can be helpful in terms of excluding such types of businesses, if they can be applied uniformly across countries. An alternative can be to ensure that data have a strong size dimension with classes based on quality and comparability criteria, so that certain classes can be flagged as less comparable than others. Similarly, thresholds can provide a route to exclude �pseudo-enterprises�, sometimes also referred to as �false self-employed� where a person acts as an employee of an enterprise, in that they effectively work for that enterprise every day over a long period of time, but for legal or tax purposes he or she is technically self-employed. These issues are considered in more detail in Vale and Powell (2002) and Vale (2005(b)), and their impact on European Union data in Brandt (2004). In practice, thresholds are likely to be determined by the administrative sources that supply data to statistical business registers. In many cases, data from sales or value added tax registrations are used, with thresholds varying from zero up to GBP 60,000 in the case of the United Kingdom. Where higher thresholds exist, data are often supplemented from other sources to mitigate the impact, so it is often impossible to define the actual threshold applying to a particular data set in terms of a single variable. Particular care should be taken with thresholds related to sales or value added, as it is quite possible in certain economic activities, e.g. software development, for a business to have employees but no sales for a year or more, while it is developing products. An additional complication is that monetary based thresholds are affected by differences in inflation and fiscal policy at the national level, both of which can be expected to affect comparisons of birth rates across countries and over time. Thresholds relating to labour input are often more appropriate, but again it is important to know how it is measured, e.g. in terms of wage-related costs, head counts of employees, or full-time equivalents, as this could also have an impact, albeit probably small, on comparability. The quality of size variables can have a considerable impact on comparability when thresholds are used. Unfortunately the quality of data is often lowest for relatively small and new businesses, the categories that are often of the most interest. The methods of allocating size (and other) variables in statistical systems, in the absence of full information on certain businesses, can vary considerably. Some attempts to standardise these processes have been introduced in the Eurostat methodology, including the use of turnover per head ratios to estimate missing size variables. The impact of thresholds varies depending on the use of data, and is usually much lower when measuring economic or financial variables than for those based on counts of businesses. It may also be the case that data subject to different thresholds can display the same trends, even if those trends are less marked and the levels are different. This is illustrated by the graph in Figure 3.5, showing two sources of data on business start-up rates for the United Kingdom.

STD/DOC(2006)4
29
Figure 3.5 � UK Business Birth Rates � A Comparison of Data Sources
0%
2%
4%
6%
8%
10%
12%
14%
16%
18%
20%
1995 1996 1997 1998 1999 2000 2001 2002 2003
Value-added tax registrations - Source: Small Business ServiceNew Businesses - Source: Barclays
In Figure 3.5, the source with the lower threshold, Barclays, shows a higher level and greater volatility, as might be expected given the typically more dynamic nature of the smallest size classes. The Small Business Service data are based on value-added tax registrations with a threshold that has remained more or less constant in real terms at around GBP 60,000 in 2005 prices over this period. They clearly resemble a smoothed version of the Barclays data series, albeit at a lower level. It would therefore appear to be possible to model one series from the other. Whilst the birth rates themselves are not directly comparable, the underlying data might be considered sufficiently comparable for some purposes. Also, the fact that both sources show similar trends over time helps to validate the quality of the data sets.

STD/DOC(2006)4
30
4. Methods to Improve Comparability
This section is concerned with the extent to which existing data can be made more comparable by performing various transformations. It follows three worked examples, the first comparing data from the United States and Eurostat, the second comparing the Eurostat data with experimental estimates from Australia, and the third comparing national data from France and Germany with Eurostat data for other European countries. The transformations are made on the basis of information available in the existing metadata, in some cases this has been supplemented through contacts with those responsible for the source. The approach of transforming existing data sets to try to improve comparability is not ideal, and is unlikely to result in perfectly comparable data. These examples show that it can, however, lead to some improvements in comparability. It should be seen as a short-term measure, whilst waiting for the results of longer-term improvements such as the international implementation of methodological standards. 4.1 Example 1 � United States and Europe An obvious first step when looking at data from different countries, each with several sources, is to use the comparability factors in Section 3 above to determine which sources give the best trade-off in terms of the level of comparability already present and data quality. Thus, for the first example, a comparison of data from the United States and Europe, it would seem logical to use the Firm Size dataset from the US Small Business Administration, and the data from the Eurostat business demography project. These sources use a similar unit, and both define populations on a �live during period� basis. Figure 4.1 shows a basic comparison of the raw data. Figure 4.1 � A Comparison of US and Eurostat Business Start-up Rates
0%
2%
4%
6%
8%
10%
12%
14%
16%
Uni
ted
Sta
tes
EU
Mea
n
Den
mar
k
Spa
in
Italy
Luxe
mbo
urg
Net
herla
nds
Por
tuga
l
Finl
and
Sw
eden
Uni
ted
Kin
gdom
Nor
way
1998199920002001
Sources: United States � Firm Size Data � Small Business Administration EU Mean � Mean start-up rate for the European countries shown Other countries � Eurostat (The full Eurostat data set includes several other countries, but only those for
which data are available for at least three of the above years are shown)

STD/DOC(2006)4
31
The data seem to indicate very little difference between start-up rates in the United States and the European countries shown. However, there remain several methodological differences between the US and European data. Perhaps the most important is that the US data only include employer firms, i.e. businesses with at least one employee. The Eurostat database includes a breakdown by size class, with a category for zero employee enterprises. Subtracting this category from both the births and the population of active enterprises therefore gives an estimate of start-up rates for employer businesses, as shown in Figure 4.2. The data in Figure 4.2 show considerably more variation within Europe, and result in much lower EU mean rates. Unfortunately, this comparison represents a backwards step in comparability compared to Figure 4.1 for most of the countries shown. This is because, in trying to correct for thresholds, new problems of coverage have been introduced. The start-up rates for the European countries now only include those businesses that have employees from the start. They do not include businesses that start with no employees, and then take on employees as they expand. These businesses are, however, captured in the US data. This also explains some of the increased variability in the European data, as, for example, coverage of non-employer enterprises is much higher in Italy than in the United Kingdom or Luxembourg, due to higher size-thresholds in the data sources for the latter two countries. This makes it more likely that new enterprises will be identified before they take on employees in Italy, and will thus be missing from the start-up rates shown in Figure 4.2. Figure 4.2 � Start-up Rates for Employer Businesses � A Backwards Step?
0%
2%
4%
6%
8%
10%
12%
14%
Uni
ted
Sta
tes
EU
Mea
n
Den
mar
k
Spa
in
Italy
Luxe
mbo
urg
Net
herla
nds
Por
tuga
l
Finl
and
Sw
eden
Uni
ted
Kin
gdom
Nor
way
1998199920002001
Sources � as for Figure 4.1 above Thus, the conclusion from Figure 4.2 is that merely removing the non-employer business births from the Eurostat data causes extra distortions, and certainly does not improve comparability. This clearly shows the danger of attempting to improve comparability of existing data analytically without a proper understanding of the complex interactions of comparability factors. However, in the context of this worked example, it is still possible to see the adjustment made in Figure 4.2 as a step towards more comparable data, because, even though it reduces comparability, it also opens up several possibilities to improve comparability above the initial level in Figure 4.1.

STD/DOC(2006)4
32
One such possibility to improve comparability would be to determine the proportion of start-ups in the US that previously existed as non-employer businesses, and remove them from the US start-up rates. Data are not currently available to make this adjustment, but may result from preliminary work to link employer and non-employer universes reported in Davis et al (2005). Alternatively, and perhaps as an interim measure, a study of cohorts of non-employer births could be carried out in several European countries, to see how many subsequently became employers, and how long it was before they made this transition. The results could then be used to model the missing data, raise the European estimates, and hence to improve comparability with the US data. The proportion of businesses making the transition, and the timing, are likely to vary between countries and over time, so this approach is probably most suitable for countries that want to make one-off comparisons with the US, rather than for wider cross-country comparisons over time. A better solution, however, given the considerable variability of European data in Figure 4.2, would be to define the business population for those countries so that it only included employers, and measure entries into that population (as recommended in the OECD Business Demography Framework). The Eurostat data do not currently support this approach, but it would be relatively easy to adapt the current Eurostat methodology to produce the necessary figures. It may still be necessary to interpret any resulting figures with care, as they could be affected by variations in the propensity to incorporate between countries. Most new businesses start as either a corporation or a sole-proprietorship. In the case of a corporation, the entrepreneur is normally considered to be an employee, whereas in the later, he or she is not. Thus the choice of legal form, which could be affected by national fiscal and administrative burden considerations, can determine whether a start-up is included in the population of employers or not. There are very few data on this subject at present, though the overall impact on start-up rates is thought to be quite small. The methodologically purest long-term solution, therefore, would be to define a lower threshold in terms of total labour input (e.g. 0.5 person), which would be independent of issues of legal form. Unfortunately this is not really feasible for the main indicator on business start-up rates, as it would require major (and hence expensive) changes in several countries, particularly the United States. Another methodological difference between the US and European data is purity. The Eurostat methodology requires extensive matching to determine which start-ups are pure births, whereas the metadata for this US source (Armington (1998)) make clear that no attempts are made to track the survival of individual firms. The US data will therefore include an unknown proportion of start-ups that are not pure births in the European sense. The proportion of start-ups that are not pure births varies from source to source, as the propensity to re-register will be determined by legal or other requirements that are usually source specific. In Europe this proportion is usually around 20%, though French national data suggest figures of between 30 and 40%25. This proportion typically increases for larger businesses. Applying this to the US data in Figure 4.2 would reduce start-up rates to around 6-8%, well below those of the United Kingdom and Luxembourg, the countries for which the difference in thresholds compared to the US data is likely to be least significant.
25 See Figure 3.2 in Section 3.1 above.

STD/DOC(2006)4
33
4.2 Example 2 � Australia and Europe The second example considers the comparability of data from Australia and Eurostat. In this case, the Australian approach is very similar to the Eurostat methodology in terms of thresholds and some elements of purity. Figure 4.3 shows a basic comparison of the raw data. Figure 4.3 � A Comparison of Australian and Eurostat Business Start-up Rates
0%
2%
4%
6%
8%
10%
12%
14%
16%
Aus
tralia
EU
Mea
n
Spa
in
Italy
Lith
uani
a
Luxe
mbo
urg
Hun
gary
Slo
vaki
a
Finl
and
Sw
eden
Uni
ted
Kin
gdom
20012002
Sources: Australia � Experimental Estimates, Entries and Exits of Business Entities � Australian Bureau of
Statistics. EU Mean � Mean start-up rate for the European countries shown. Other countries � Eurostat (The full Eurostat data set includes several other countries, but only those
with data available for both years, and no known coverage issues, are shown). Figure 4.3 appears to show that Australian start-up rates are almost 1% above the mean for the European countries shown. However, for a true comparison, it is necessary to make adjustments to compensate for several methodological differences. The main difference is that the Australian population data used as the denominator for these start-up rates are on a point in time basis, whereas those from Eurostat are �live during period�. The Australian point in time population is defined as the population from the previous observation, adjusted for reactivations, plus entries in the previous period, minus exits in the previous period. This relationship is shown in Figure 4.4, taken from the Australian publication. Figure 4.4 - The Relationship between Populations, Entries and Exits in the Australian Data
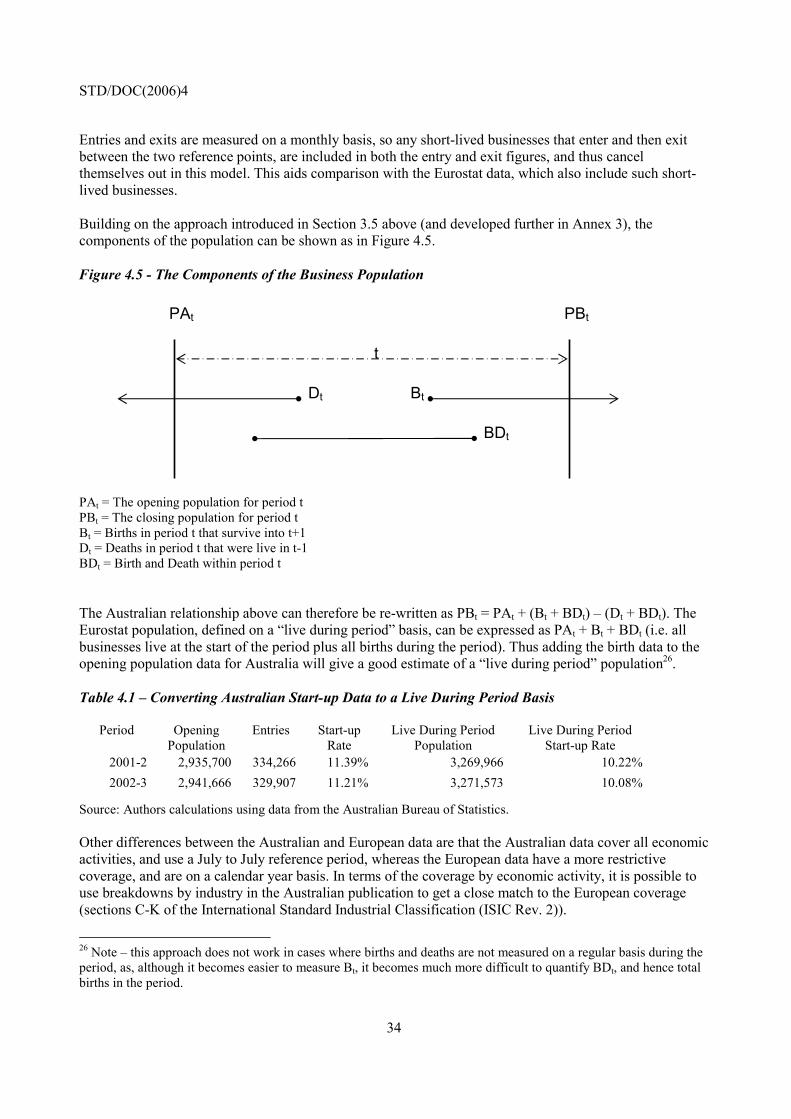
STD/DOC(2006)4
34
Entries and exits are measured on a monthly basis, so any short-lived businesses that enter and then exit between the two reference points, are included in both the entry and exit figures, and thus cancel themselves out in this model. This aids comparison with the Eurostat data, which also include such short-lived businesses. Building on the approach introduced in Section 3.5 above (and developed further in Annex 3), the components of the population can be shown as in Figure 4.5. Figure 4.5 - The Components of the Business Population
PAt = The opening population for period t PBt = The closing population for period t Bt = Births in period t that survive into t+1 Dt = Deaths in period t that were live in t-1 BDt = Birth and Death within period t The Australian relationship above can therefore be re-written as PBt = PAt + (Bt + BDt) � (Dt + BDt). The Eurostat population, defined on a �live during period� basis, can be expressed as PAt + Bt + BDt (i.e. all businesses live at the start of the period plus all births during the period). Thus adding the birth data to the opening population data for Australia will give a good estimate of a �live during period� population26. Table 4.1 � Converting Australian Start-up Data to a Live During Period Basis
Period Opening Population
Entries Start-up Rate
Live During Period Population
Live During Period Start-up Rate
2001-2 2,935,700 334,266 11.39% 3,269,966 10.22% 2002-3 2,941,666 329,907 11.21% 3,271,573 10.08%
Source: Authors calculations using data from the Australian Bureau of Statistics. Other differences between the Australian and European data are that the Australian data cover all economic activities, and use a July to July reference period, whereas the European data have a more restrictive coverage, and are on a calendar year basis. In terms of the coverage by economic activity, it is possible to use breakdowns by industry in the Australian publication to get a close match to the European coverage (sections C-K of the International Standard Industrial Classification (ISIC Rev. 2)).
26 Note � this approach does not work in cases where births and deaths are not measured on a regular basis during the period, as, although it becomes easier to measure Bt, it becomes much more difficult to quantify BDt, and hence total births in the period.
t
Dt Bt
BDt
PAt PBt
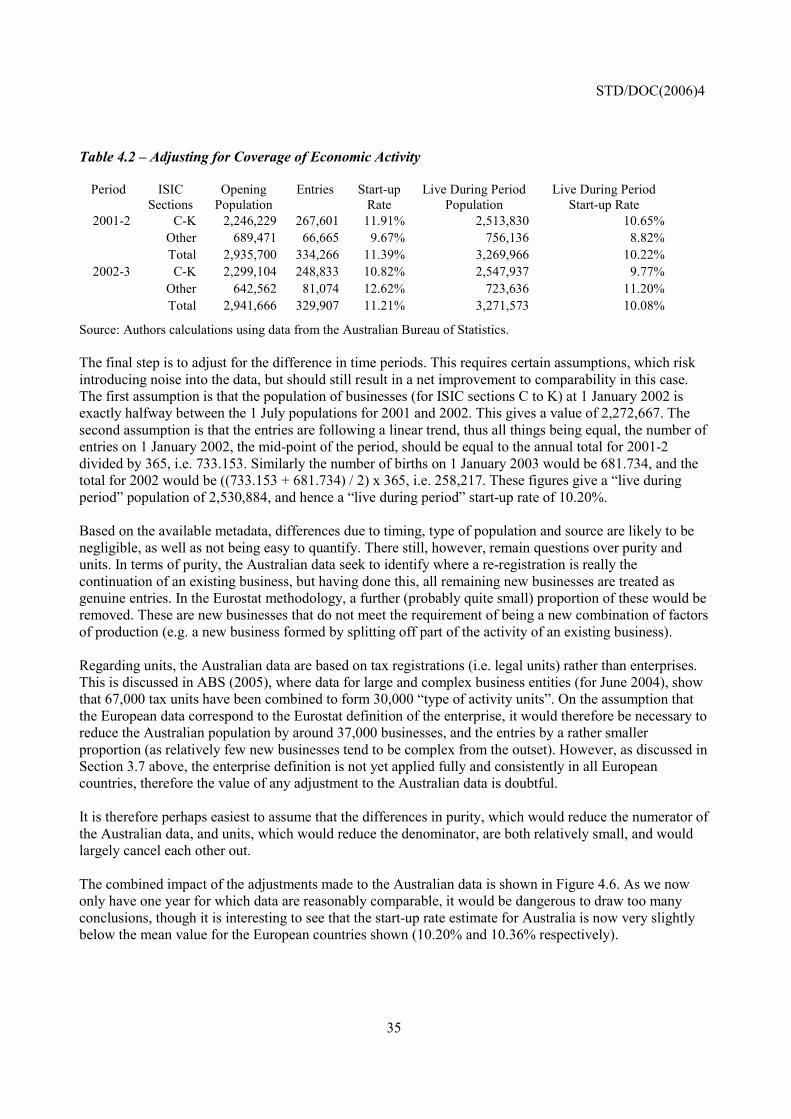
STD/DOC(2006)4
35
Table 4.2 � Adjusting for Coverage of Economic Activity
Period ISIC Sections
Opening Population
Entries Start-up Rate
Live During Period Population
Live During Period Start-up Rate
2001-2 C-K 2,246,229 267,601 11.91% 2,513,830 10.65% Other 689,471 66,665 9.67% 756,136 8.82% Total 2,935,700 334,266 11.39% 3,269,966 10.22%
2002-3 C-K 2,299,104 248,833 10.82% 2,547,937 9.77% Other 642,562 81,074 12.62% 723,636 11.20% Total 2,941,666 329,907 11.21% 3,271,573 10.08%
Source: Authors calculations using data from the Australian Bureau of Statistics. The final step is to adjust for the difference in time periods. This requires certain assumptions, which risk introducing noise into the data, but should still result in a net improvement to comparability in this case. The first assumption is that the population of businesses (for ISIC sections C to K) at 1 January 2002 is exactly halfway between the 1 July populations for 2001 and 2002. This gives a value of 2,272,667. The second assumption is that the entries are following a linear trend, thus all things being equal, the number of entries on 1 January 2002, the mid-point of the period, should be equal to the annual total for 2001-2 divided by 365, i.e. 733.153. Similarly the number of births on 1 January 2003 would be 681.734, and the total for 2002 would be ((733.153 + 681.734) / 2) x 365, i.e. 258,217. These figures give a �live during period� population of 2,530,884, and hence a �live during period� start-up rate of 10.20%. Based on the available metadata, differences due to timing, type of population and source are likely to be negligible, as well as not being easy to quantify. There still, however, remain questions over purity and units. In terms of purity, the Australian data seek to identify where a re-registration is really the continuation of an existing business, but having done this, all remaining new businesses are treated as genuine entries. In the Eurostat methodology, a further (probably quite small) proportion of these would be removed. These are new businesses that do not meet the requirement of being a new combination of factors of production (e.g. a new business formed by splitting off part of the activity of an existing business). Regarding units, the Australian data are based on tax registrations (i.e. legal units) rather than enterprises. This is discussed in ABS (2005), where data for large and complex business entities (for June 2004), show that 67,000 tax units have been combined to form 30,000 �type of activity units�. On the assumption that the European data correspond to the Eurostat definition of the enterprise, it would therefore be necessary to reduce the Australian population by around 37,000 businesses, and the entries by a rather smaller proportion (as relatively few new businesses tend to be complex from the outset). However, as discussed in Section 3.7 above, the enterprise definition is not yet applied fully and consistently in all European countries, therefore the value of any adjustment to the Australian data is doubtful. It is therefore perhaps easiest to assume that the differences in purity, which would reduce the numerator of the Australian data, and units, which would reduce the denominator, are both relatively small, and would largely cancel each other out. The combined impact of the adjustments made to the Australian data is shown in Figure 4.6. As we now only have one year for which data are reasonably comparable, it would be dangerous to draw too many conclusions, though it is interesting to see that the start-up rate estimate for Australia is now very slightly below the mean value for the European countries shown (10.20% and 10.36% respectively).
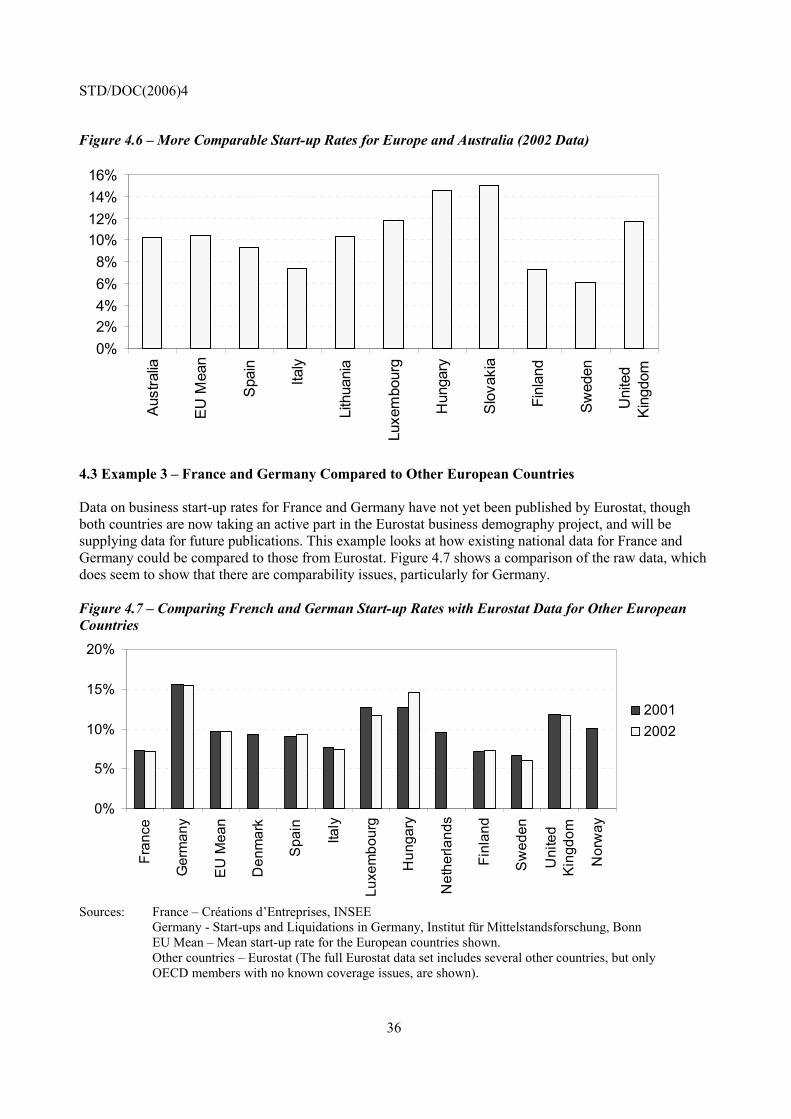
STD/DOC(2006)4
36
Figure 4.6 � More Comparable Start-up Rates for Europe and Australia (2002 Data)
0%2%4%6%8%
10%12%14%16%
Aust
ralia
EU M
ean
Spa
in
Italy
Lith
uani
a
Luxe
mbo
urg
Hun
gary
Slo
vaki
a
Finl
and
Swed
en
Uni
ted
Kin
gdom
4.3 Example 3 � France and Germany Compared to Other European Countries Data on business start-up rates for France and Germany have not yet been published by Eurostat, though both countries are now taking an active part in the Eurostat business demography project, and will be supplying data for future publications. This example looks at how existing national data for France and Germany could be compared to those from Eurostat. Figure 4.7 shows a comparison of the raw data, which does seem to show that there are comparability issues, particularly for Germany. Figure 4.7 � Comparing French and German Start-up Rates with Eurostat Data for Other European Countries
0%
5%
10%
15%
20%
Fran
ce
Ger
man
y
EU
Mea
n
Den
mar
k
Spa
in
Italy
Luxe
mbo
urg
Hun
gary
Net
herla
nds
Finl
and
Sw
eden
Uni
ted
Kin
gdom
Nor
way
20012002
Sources: France � Créations d�Entreprises, INSEE
Germany - Start-ups and Liquidations in Germany, Institut für Mittelstandsforschung, Bonn EU Mean � Mean start-up rate for the European countries shown. Other countries � Eurostat (The full Eurostat data set includes several other countries, but only
OECD members with no known coverage issues, are shown).
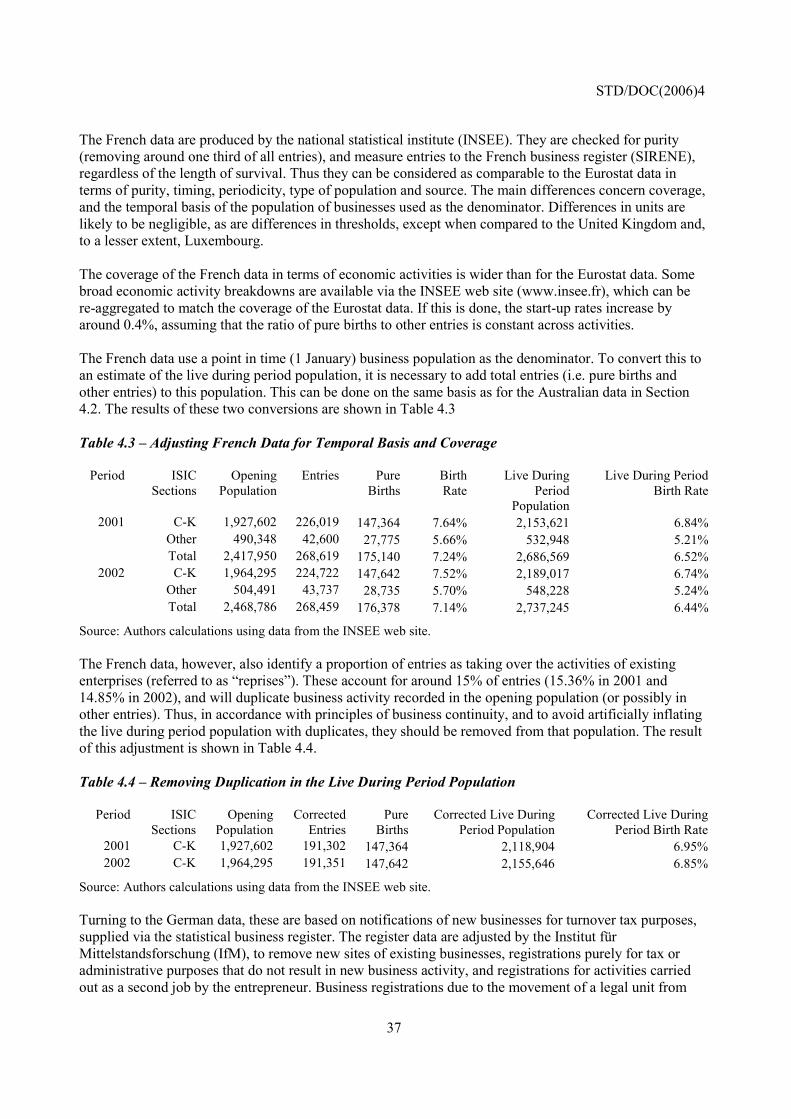
STD/DOC(2006)4
37
The French data are produced by the national statistical institute (INSEE). They are checked for purity (removing around one third of all entries), and measure entries to the French business register (SIRENE), regardless of the length of survival. Thus they can be considered as comparable to the Eurostat data in terms of purity, timing, periodicity, type of population and source. The main differences concern coverage, and the temporal basis of the population of businesses used as the denominator. Differences in units are likely to be negligible, as are differences in thresholds, except when compared to the United Kingdom and, to a lesser extent, Luxembourg. The coverage of the French data in terms of economic activities is wider than for the Eurostat data. Some broad economic activity breakdowns are available via the INSEE web site (www.insee.fr), which can be re-aggregated to match the coverage of the Eurostat data. If this is done, the start-up rates increase by around 0.4%, assuming that the ratio of pure births to other entries is constant across activities. The French data use a point in time (1 January) business population as the denominator. To convert this to an estimate of the live during period population, it is necessary to add total entries (i.e. pure births and other entries) to this population. This can be done on the same basis as for the Australian data in Section 4.2. The results of these two conversions are shown in Table 4.3 Table 4.3 � Adjusting French Data for Temporal Basis and Coverage
Period ISIC Sections
Opening Population
Entries Pure Births
Birth Rate
Live During Period
Population
Live During Period Birth Rate
2001 C-K 1,927,602 226,019 147,364 7.64% 2,153,621 6.84% Other 490,348 42,600 27,775 5.66% 532,948 5.21% Total 2,417,950 268,619 175,140 7.24% 2,686,569 6.52%
2002 C-K 1,964,295 224,722 147,642 7.52% 2,189,017 6.74% Other 504,491 43,737 28,735 5.70% 548,228 5.24% Total 2,468,786 268,459 176,378 7.14% 2,737,245 6.44%
Source: Authors calculations using data from the INSEE web site. The French data, however, also identify a proportion of entries as taking over the activities of existing enterprises (referred to as �reprises�). These account for around 15% of entries (15.36% in 2001 and 14.85% in 2002), and will duplicate business activity recorded in the opening population (or possibly in other entries). Thus, in accordance with principles of business continuity, and to avoid artificially inflating the live during period population with duplicates, they should be removed from that population. The result of this adjustment is shown in Table 4.4. Table 4.4 � Removing Duplication in the Live During Period Population
Period ISIC Sections
Opening Population
Corrected Entries
Pure Births
Corrected Live During Period Population
Corrected Live During Period Birth Rate
2001 C-K 1,927,602 191,302 147,364 2,118,904 6.95% 2002 C-K 1,964,295 191,351 147,642 2,155,646 6.85%
Source: Authors calculations using data from the INSEE web site. Turning to the German data, these are based on notifications of new businesses for turnover tax purposes, supplied via the statistical business register. The register data are adjusted by the Institut für Mittelstandsforschung (IfM), to remove new sites of existing businesses, registrations purely for tax or administrative purposes that do not result in new business activity, and registrations for activities carried out as a second job by the entrepreneur. Business registrations due to the movement of a legal unit from

STD/DOC(2006)4
38
one district to another or a change in ownership or legal form are also removed. These adjustments result in approximately 62% of notifications being considered as real births (compared to the French figure of around 65%). Thus the data can be considered to have been corrected for purity. In terms of timing, periodicity, type of population and source, the German data can be considered as comparable to those from Eurostat. The German data use a point in time population, which can be converted to a live during period basis in a similar way to the French data above. However, the German data do not separately identify the different categories of entries that are not real births, thus the data in Table 4.5 below add all registrations to the opening population, which may overstate the population, and slightly under-estimate the live during period birth rate. Table 4.5 � Adjusting German Data for Temporal Basis
Period Opening Population
Entries Pure Births
Birth Rate
Live During Period Population
Live During Period Birth Rate
2001 2,920,293 728,978 454,700 15.57% 3,649,271 12.46% 2002 2,926,570 723,333 451,800 15.44% 3,649,903 12.38%
Source: Authors calculations using data from IfM and the German Federal Statistical Office. The units used are effectively the sub-set of legal units that are considered to be economically relevant. This is unlikely to have any real impact on the number of entries, but may mean that the population of businesses is slightly overstated, again leading to a very slight under-estimation of start-up rates. The data cover all economic activities except the �liberal professions�27, most health services and some insurance services that are not subject to turnover tax. This is still a slightly wider coverage than the Eurostat data. Detailed breakdowns of economic activity that would allow more exact comparisons are not currently available, though based on the evidence for France above, the impact is likely to be small. The population of businesses is subject to a threshold (16,617 Euros during this period), which means that some smaller businesses are excluded. Smaller businesses typically have higher entry and exit rates, thus the impact of this threshold is likely to be a slight under-estimation of start-up rates when compared to all other European countries except the United Kingdom (where the threshold was around 90,000 Euros). Although it is not possible to quantify the impact of these factors accurately, it is clear that the net effect will be a slight under-estimation of business start-up rates. The rates calculated in Table 4.5 should therefore be seen as minimum estimates, but it is unlikely that the real values are more than 0.5% higher. The revised estimates of business start-up rates for France and Germany are shown in Figure 4.8. These can now be seen as rather more comparable with the Eurostat data. The German rates are still above the mean of the Eurostat rates, but are no longer the highest. This could be expected, as the German data include the former East Germany, which may have an upward influence on the national rate, as start-up rates published by Eurostat for the former communist countries of Eastern and Central Europe (e.g. Hungary) are generally higher than those for Western European countries. The adjusted data for France are slightly lower than the raw data, but still not the lowest for the countries present.
27 The liberal professions can generally be defined as occupations requiring special training in the arts or sciences. These include lawyers, notaries, accountants, architects, engineers and pharmacists.

STD/DOC(2006)4
39
Figure 4.8 � More Comparable Start-up Rates for European Countries
0%
5%
10%
15%
20%
Fran
ce
Ger
man
y
EU M
ean
Den
mar
k
Spai
n
Italy
Luxe
mbo
urg
Hun
gary
Net
herla
nds
Finl
and
Swed
en
Uni
ted
King
dom
Nor
way
20012002
4.4 Summary The three examples above show that although it is not always possible to be precise, it is clear that adjustments to compensate for differences in specific factors can sometimes help to improve comparability. It is also clear that in compensating for one factor, it is possible to affect others, and to introduce noise into the data, thus adjustments have to be made with care, based on a detailed understanding of the data sources and methods. Having said that, adjustments based on estimates of the impact of a specific factor of comparability can still help to determine whether differences in start-up rates are likely to be significant or not. This is no substitute for having real, comparable data, but, in the first example above, at least it should caution an analyst against making statements that US start-up rates are definitely higher than those in the European Union.
5. A Harmonised Methodological Framework and Start-up Indicators?
The discussions on factors of comparability in Section 3, and possible ways to improve the comparability of existing data in Section 4, lead to the conclusion that the best way to get really comparable data across countries is to harmonise as far as possible the underlying methodology. Thus what is needed is a standard methodological framework that can be applied in all countries, and which leads to a set of indicators of business start-ups that can be used with confidence for cross-country comparisons. This section discusses how this might be achieved. 5.1 Towards a Harmonised Methodological Framework The idea of developing a harmonised methodological framework for indicators of business demography and dynamics is not new. It has been attempted with varying degrees of success in some of the projects outlined in Section 2, though often either the focus has been on a limited group of countries that already share certain characteristics (as in the DOSME project), or a common legal framework for statistics (as in the Eurostat project), or the methodology was not detailed enough to generate real comparability.

STD/DOC(2006)4
40
The OECD is in the process of developing a new framework, taking into account what has worked and not worked in the past, as well as a more detailed knowledge and understanding of the methodological issues than in many previous projects. As business start-up rates are an important component of business dynamics, this report will also feed into the new OECD framework. The approach of using factors of comparability introduced in this report is being broadened to cover business demography as a whole, and to inform the decisions on the preferred methodology. 5.2 Different Types of Indicators Within this harmonised methodological framework it would be possible to envisage several different types of business start-up indicators. The traditional version, showing the number of new businesses as a percentage of the population of businesses, is clearly the key indicator for business start-ups, but, as this report shows, it is also not a particularly easy indicator to define in a way that results in fully comparable data across countries. A range of other indicators have been proposed over the years, each of these has certain merits, but none seem to offer a full solution to the problem of international comparability. Several studies have argued that it is better to measure start-ups by only including those businesses that survive for a certain length of time. For the OECD Firm-level Data project, that period was at least one year, whereas the authors of Baldwin et al (2002) recommend using periods of up to five years. They show that start-up rates from different sources in Canada vary more in the short-run than in the long-run, and hence recommend that a longer-run view should be used for international comparisons. The Eurostat business demography project goes somewhat in the opposite direction, and seeks to include all start-ups, no matter how short-lived they are, and attempts to tackle comparability issues through the harmonisation of sources and methods. Despite this, there is some evidence from the limited Eurostat data currently available that would seem to support the view of Baldwin and colleagues. If birth rates are plotted against two-year survival rates for the European countries for which data are available, there appears to be a fairly weak negative correlation, indicating a limited increase in convergence over time. Figure 5.1 shows data for births in 2000, where the correlation coefficient is -0.47. Figure 5.1 � Birth Rate v. 2 Year Survival Rate for Births in 2000
50%
55%
60%
65%
70%
75%
80%
85%
90%
95%
4% 6% 8% 10% 12% 14% 16% 18%Birth Rate
2 Y
ear S
urvi
val R
ate
Source: Constructed from Eurostat data

STD/DOC(2006)4
41
There are, however, a few problems with using long-run entry rates. The first is that few policy makers would be prepared to wait for five years for data. The second is that in countries with genuinely dynamic business populations perhaps fuelled by very low entry and exit costs and a strong entrepreneurial culture, it is to be expected that short-run start-up rates would be higher and survival rates lower, reflecting an increased degree of experimentation on the part of entrepreneurs. Long-run entry rates are less useful for identifying the extent to which this particularly interesting phenomenon varies between countries. The real challenge is to separate this sort of genuine variation between countries from the noise in the data due to methodological differences. The third problem with using long-run entry rates is that they do not affect all of the factors of comparability equally. They should resolve most timing issues and can help to smooth the effects of differences in periodicity, thresholds, and possibly units, though it is difficult to see how they will have much impact on the other factors. There is even a risk that they could actually aggravate the impact of different temporal bases for the population in that data compiled on a live during period basis are likely to have lower birth rates (due to the higher population), and lower survival rates (due to the inclusion of more short-lived units) than data compiled on a point in time basis, thus the long-run birth rates could potentially be more divergent than those for the short-run. Despite these potential problems, there is still a role for long-run entry rates in conjunction with short-run data. If they are sufficiently comparable between countries, they can give another view on business dynamics, thus helping to give a better overall picture of the real differences between countries. A different approach to business start-up indicators is to consider the impact of new businesses in terms of employment creation. This is of great interest to policy makers and researchers concerned with the impact of encouraging entrepreneurship. As noted in Baldwin et al (2002), employment based measures are less influenced by differences in thresholds, but much more sensitive to purity. This is because thresholds tend to affect the smallest businesses, excluding those with no or very few paid employees, whereas new businesses that are not pure births tend to have more employees. A new business created by the merger of two large corporations, bringing together thousands of employees, could swamp data on employment creation. Given the interest in employment creation, however, it is still useful to have a measure of the impact of business start-ups, as long as this measure is sufficiently reliable and comparable. Thus the Eurostat approach of trying first to obtain harmonised data on births, then complementing these with data on employment creation, seems worth pursuing. In a few cases, business start-up rates have been calculated using a human population as the denominator. This approach relies on a suitably harmonised definition of the population used, and can be affected by various social and cultural factors as discussed in Section 3.4 above, but produces an indicator that is perhaps better focussed on entrepreneurship propensity. Most of the data sets studied in this report are at the level of the business, firm or enterprise, which despite their definitional differences can generally be seen as the same unit as far as business start-ups are concerned, given that the overwhelming majority of these have very simple structures. The exceptions are the establishment level data available for the United States, Japan and a few other countries. Although establishment level data cause comparability problems, they also have clear benefits in terms of studying business dynamics at the local or regional level, a topic which is generating interest in various countries, notably the United States and the United Kingdom. Thus indicators at the level of the establishment (or local unit in Europe) are worth consideration, particularly if it is possible to determine

STD/DOC(2006)4
42
whether new establishments are due to pure enterprise births, other enterprise creations, or the opening of a new site by an existing enterprise; although measures based on establishments do provide other complications28. 5.3 Proposed Indicators Based on the findings of this report, it is clear that a single indicator of business start-up rates is unlikely to meet all requirements, therefore a system based on a key indicator, supported by a range of complementary indicators is proposed. • The Key Start-up Indicator The key indicator of business start-up rates should try to meet potentially conflicting requirements. Firstly it should be meaningful and easy to interpret for non-specialists, thus it should be based on concepts and methodologies that are as simple as possible. Secondly it should be designed to maximise international comparability. This second requirement could lead to a purist view that the indicator should be designed without any reference to existing data sources, or a pragmatic view that it should be built around the data that are currently available. The purist view is likely to delay the availability of comparable data, whereas the pragmatic view would not necessarily lead to optimal methodological solutions. Thus the challenge is to try to find an acceptable compromise between all of the different requirements and views. The best option for the numerator therefore seems to be a count of new businesses, and for the denominator, the population of active businesses. New businesses should be split into pure births and other creations, along the lines of the Eurostat definition as the rate of other creations will vary between countries depending on national registration systems and practices, whereas pure births are much more suitable for international comparability purposes. As purity has a major impact on comparability, the key indicator should focus on pure births, though information on other creations may have some value in terms of quality assurance, and comparing the impact of national systems on the business community. The method to determine pure births proposed by Eurostat, based on automatic matching and limited clerical checking of large units seems suitable, and has the advantage of already being in place in around half of the OECD member countries. In terms of timing and thresholds, the point at which a new business takes on its first paid employee seems to be the easiest to measure in a consistent way across countries. This does not mean that non-employer businesses are of no interest, just that they should be considered in a secondary indicator. This means that births are defined as entries into the population of employers, regardless of whether the business previously existed with no employees or not. An important issue to resolve concerns businesses that fluctuate between having employees or not, either on a seasonal basis, or in response to market conditions. The simplest approach is to consider a business that leaves and re-enters the population of employers within a given period as being a reactivation, and therefore not a pure birth. Eurostat currently recommend a two year threshold for reactivations, which has the advantages of being relatively easy to implement, and that it provides definitive data on pure deaths more quickly than if a longer period (or no threshold) is used. In terms of periodicity and temporal basis, annual data seem most appropriate, based as closely as possible on the calendar year. A comparison of point in time populations at the start and the end of the year to determine entries and exits is the easiest approach to implement. This allows the construction of a simple equation as used in Australia (see Section 4.2), whereby the population at a particular point in time is defined as the population from the previous observation, plus entries in the previous period, minus exits in 28 For more detail see the OECD Business Demography Framework

STD/DOC(2006)4
43
the previous period. This sort of stock and flow approach is analogous to that used for human demography, and is easy for non-specialists to understand. The potential duplication issue raised in Section 3.5 is also reduced, thus improving data comparability, if a point in time population is used. The remaining question in terms of periodicity is the treatment of short-lived enterprises. It is methodologically preferable to include all of these. This would require the use of dates to denote when a start-up occurred, or regular (at least monthly) observations of the population. The best source for business start-up indicators seems to be national statistical business registers. The units and coverage of these registers are gradually becoming more harmonised, particularly in Europe. The unit of interest is usually the �business�, but this concept is not really defined in its own right, hence the use of the enterprise, as defined in the System of National Accounts seems most appropriate29. For the purposes of this indicator, the definitions of the enterprise in the International Standard Industrial Classification (ISIC), and the European Union regulation on statistical units, should be regarded as sufficiently similar. Coverage should be defined as all �market� enterprises operating in the national economy. The term �market� should be considered as excluding the government sector and non-profit institutions serving households. In terms of economic activity, the best solution seems to be to request a breakdown to at least the section-level of the ISIC. This indicator should not necessarily be seen as permanent. It is designed more from the pragmatic than the purist point of view, based on data that are currently available. The reason for this is to try to get a comparable dataset as quickly as possible. This sort of relatively simple indicator may well prove to be the best approach in the longer term, but it may also be possible to improve it based on feedback from data users and the experiences of data providers.
• Complementary Indicators As the key start-up indicator proposed above is unlikely to be ideal for all purposes, a number of complementary indicators could be envisaged (see also the OECD Business Demography Framework). These complementary indicators are presented in approximate order of priority:
o An indicator of business start-ups using the working-age population of the country as the denominator. A consistent definition of this population would need to be applied, but this may be a useful secondary indicator, particularly for studying entrepreneurship. It is also, perhaps, more relevant for economies in transition, where the population of businesses starts low, but grows rapidly. In these circumstances, start-up rates based on the business population could give a false impression of the volume of start-ups.
o An indicator of the start-up rate for non-employer businesses: This indicator would be rather problematic, as it would currently be heavily affected by the wide range of thresholds used in national sources. More methodological work would be needed to ensure real comparability, mainly to define a suitable threshold based on some notion of labour-input that could be applied in all countries. The interest in this type of business is, however, probably sufficient to justify this work. In the short term, however, the development of indicators based on information sourced from business registers, even without threshold adjustments, should be encouraged.
29 This definition is given in Section 3.7 above.

STD/DOC(2006)4
44
o An indicator of start-ups in terms of employment created: This could be developed alongside the key indicator proposed above, but would need to be tested for robustness, as it could be heavily influenced by relatively small differences in purity.
o An indicator of start-ups in terms of businesses that survive for a minimum period: Whereas the key indicator would aim to include all start-ups, no matter how short-lived, a comparative measure of their durability would be useful. Thus start-up rates defined in terms of businesses that survive for at least two years, or at least five years, could be envisaged.
o An indicator of start-ups at the site level: Establishments from North America are probably sufficiently similar to local units in Europe to consider the possibility of a site-level start-up indicator. Ideally this would have two components, new sites due to pure enterprise births, and new sites created by existing enterprises. Both are of interest for studying employment dynamics and the impact of entrepreneurship at the regional and local levels.
o An indicator of the start-up rate of non-market businesses: Non-profit institutions serving households are a recognised category of institutional units in national accounts. They have a clear role in society, and their activities have been referred to as �social entrepreneurship�, thus measures of their dynamics could be of interest for socio-economic policy making.
6. Conclusions
The basic question underlying this project, as stated in the introduction to this report, was; �How comparable are data on business start-up rates from different OECD countries?� The short answer, based on the factors of comparability above is: �Not very�. This is because the comparability factors show that simple comparisons of start-up rates from the different countries and sources listed in Annex 2 would be misleading and of little value. The longer answer is, however, rather more positive. Even though data are not currently very comparable, it seems relatively easy to make a number of improvements to comparability in the short-term, both analytically and at source. A number of more detailed conclusions can also be drawn from this report: • The availability of data on business start-up rates varies considerably between countries. Some have
several sources and long time series that continue up to the present, whereas others have limited sources, data for only a few years or data series that are not being continued. For a few OECD member countries, no data sources have been found, and the availability of data is also very limited for non-OECD countries.
• The availability of metadata is even more variable. Even where metadata exist, they are not always
easy to find or understand, even for specialists. A common metadata template, based on the factors of comparability above, would make a significant contribution to the understanding of the data and the reliability of international comparisons. As a first step towards this, Annex 1 includes proposals for harmonised terminology.
• Some previous international comparisons have suffered from a lack of detailed understanding of
comparability issues. Having said that, they have, however, provided some useful models for assembling comparable data. The distributed data analysis models introduced in the OECD Firm-level data study, and, more recently, the Eurostat business demography project, seem to provide the best route to obtaining harmonised analyses whilst retaining the detailed knowledge of the source that is necessary for accurate interpretations of the data.

STD/DOC(2006)4
45
• To assess comparability of business start-up rates it is necessary to decompose them into numerator and denominator components, and consider the factors that affect each of these. Start-up rates that might appear comparable at first glance may be much less so when they are decomposed in this way.
• A total of nine factors affecting the comparability of business start-up rates have been identified. Some
of these are specific to the numerator or denominator, whereas the others affect both. The factors that have the most impact are usually the purity of the data in the numerator, the temporal basis of the denominator, and the coverage of both, though this varies considerably depending on the data sources being compared.
• The larger a new business is, the less likely it is to be a pure birth in the sense of being a genuinely new
combination of production factors. There is thus a direct relationship between the amount of work done to improve purity, and the resulting observed impact of new businesses in terms of employment creation.
• It is possible to make certain analytical adjustments to start-up data to compensate for differences in
specific comparability factors. Unfortunately when compensating for one factor, it is possible to affect others, and to introduce noise into the data, thus adjustments have to be made with care, based on a detailed understanding of the data sources and methods. However, adjustments based on estimates of the impact of a specific factor of comparability can still help to determine whether differences in start-up rates are likely to be significant or not.
• It would be preferable for any adjustments to be made at source, or through discussion with those who
have a detailed understanding of the data, to reduce the risk of these adjustments having a negative impact on comparability.
• The degree of harmonisation of data sources has a considerable impact on the comparability of the
resulting data. In this respect, statistical business registers are perhaps the best sources for business start-up data, as they are already subject to a degree of harmonisation, of methods, coverage and contents, particularly within Europe.
• A basic key indicator, well defined and relatively easy to implement in all countries, is necessary to
improve data comparability. This approach is in line with the forthcoming OECD methodological framework for business demography. The key indicator should be supplemented by a number of complementary indicators that give additional insights to more specialist data users.
• International organisations such as the OECD need to try to influence the mind-set of those producing
national data. These data producers are often more aware of, and influenced by national data requirements than they are of the needs for international comparability.
It is clear that fully comparable data sets can not be produced for all OECD member countries without more work to develop a suitable methodological framework, and considerable efforts on the part of those countries. As discussed in Section 5, the former is already in the course of development at the OECD, but the latter is something that would be rather unrealistic to expect, at least in the short-term. The focus should therefore be on incremental development towards more harmonised indicators, whilst promoting longer term convergence within an agreed methodological framework. The immediate priority is therefore the identification of �quick wins�, i.e. actions that could increase the international comparability of data from individual countries for minimal cost. This could include exploring the potential for countries to supply certain additional data that could be used to make more informed adjustments to their start-up rates.

STD/DOC(2006)4
46
At the same time, it is important to increase our understanding of what the users of the data really want, and what they will use the data for. This knowledge can then inform the future development of indicators, ensuring that they are as relevant as possible. This sort of step-by step approach towards a clear goal through incremental improvements may not result in fully comparable data as quickly as some users might want, but is likely to be more acceptable to OECD member countries, and perhaps more timely than any more radical approach. For this reason, it is likely to provide the quickest route to more comparable data on business start-ups. Thus in summary, although data on business start ups are not currently very comparable between countries, there are a number of relatively quick and easy steps that could be taken to improve their comparability. Clear and comprehensive metadata are vital, as is a detailed methodological framework that balances user needs and the pragmatic concerns of data producers. The goal of internationally comparable business start-up rates is not an easy one, but is possible.
7. References
The references below are to papers cited in the main body of this report. References to data sources are included in Annexes 2 and 4. ABS (2005), �A Statistical View of Counts of Businesses in Australia�, information paper published by the Australian Bureau of Statistics, October 2005. http://www.abs.gov.au/Ausstats/[email protected]/0/97e9b20f99363f92ca2570920075085a?OpenDocument ABS (2004), �Business Entries and Exits, A Conceptual Framework�, paper produced by the Australian Bureau of Statistics, October 2004. Ahmad, Nadim, �A Proposed Framework for Business Demography Statistics�, OECD Statistics Directorate Working Paper STD/DOC(2006)3. Ahmad, Nadim and Steven Vale (2005), �Moving Towards Comparable Business Demography Statistics�, paper presented at the OECD Structural Business Statistics Expert Meeting, Paris, November 2005. http://www.oecd.org/dataoecd/54/13/35563231.pdf Armington, Catherine (1998), �Statistics of US Businesses � Microdata and Tables�, paper prepared for the US Small Business Administration. http://www.sba.gov/advo/research/rs190tot.pdf Baldwin, John R., Desmond Beckstead and Andrée Girard (2002), �The Importance of Entry to Canadian Manufacturing with an Appendix on Measurement Issues�, Statistics Canada research paper. http://www.statcan.ca/english/research/11F0019MIE/11F0019MIE2002189.pdf Bartelsman, Eric, John Haltiwanger and Stefano Scarpetta (2005), �Measuring and Analyzing Cross-country Differences in Firm Dynamics�, paper presented to the 2nd EUKLEMS Consortium Meeting, Helsinki, June 2005. http://www.euklems.net/meetings/CM_Helsinki/Bartelsman,_Haltiwanger_&_Scarpetta_(2005).pdf Bartelsman, Eric, John Haltiwanger and Stefano Scarpetta (2004), �Microeconomic Evidence of Creative Destruction in Industrial and Developing Countries�, World Bank Policy Research Working Paper. http://siteresources.worldbank.org/INTWDR2005/Resources/creative_destruction.pdf

STD/DOC(2006)4
47
Brandt, Nicola (2004), �Business Dynamics in Europe�, OECD Science, Technology and Industry Working Paper. http://www.olis.oecd.org/olis/2004doc.nsf/43bb6130e5e86e5fc12569fa005d004c/d7330a807018cccbc1256e55005051c7/$FILE/JT00159809.DOC Cella, Patrizia and Caterina Viviano (2004), �Register Entries / Exits and Demographic Flows: Some Comparisons for Statistical Aggregates�, paper presented to the 18th International Roundtable on Business Survey Frames, Beijing, October 2004. http://forum.europa.eu.int/irc/DownLoad/kfecA5J-mpGIXl0SR1OAauLw2xPI-SvMwc82kKbj0B2SBp2UxVqIlDcEc04rLSm9uxKFCBTAaIZ3lqM0jNc9dF5L_IbkP/S8-2%20-%20Register%20entries-exits%20and%20demographic%20flows%20-%20some%20comparisons%20for%20statistical%20aggregates.doc Choi, Bongho and Denis Ward (2004), �Analysis of Statistical Units Delineated by OECD Member Countries�, paper presented to the 18th International Roundtable on Business Survey Frames, Beijing, October 2004. http://forum.europa.eu.int/irc/DownLoad/kYedA1JSm_GMsYREH2D5UbAjBu320H8WVHgZtFcfKeSCBQKuSxDZA0zr4s3K81qMzfT5uGS67YAxCZLHjBgRxd9Rm0df4e1D/S3-1%20-%20ANALYSIS%20OF%20STATISTICAL%20UNITS%20DELINEATED%20BY%20OECD%20MEMBER%20COUNTRIES.doc Davis, Steven J., John Haltiwanger, Ron Jarmin, C. J. Krizan, Javier Miranda, Alfred Nucci and Kristin Sandusky (2005), �Measuring the Dynamics of Young and Small Businesses: Integrating the Employer and Nonemployer Universes�, preliminary paper presented to the US National Bureau of Economic Research Conference on Research in Income and Wealth, Bethesda, April 2005. http://www.nber.org/confer/2005/CRIWs05/haltiwanger.pdf Eurostat (2003), Eurostat Manual of Recommendations for Business Registers, Chapter 13. http://forum.europa.eu.int/irc/dsis/bmethods/info/data/new/embs/registers/chapter13.doc GEM (2004), Global Entrepreneurship Monitor 2004 Global Report http://www.gemconsortium.org/document.asp?id=364 Herczog, Aimée, Hans van Hooff and Ad Willeboordse (1998), �The Impact of Diverging Interpretations of the Enterprise Concept�, prepared for Eurostat by Statistics Netherlands. http://forum.europa.eu.int/irc/dsis/bmethods/info/data/new/embs/ent_concept/section1.html Klapper, Leora, Luc Laeven and Raghuram Rajan (2004), �Business Environment and Firm Entry: Evidence from International Data�, US National Bureau of Economic Research Working Paper. http://www.nber.org/papers/w10380 Mead, Geoff (2005), �Statistics New Zealand Business Frame Strategy and Developments Related to Statistics on SMEs and the Support of Longitudinal Business Statistics�, paper presented at the OECD Structural Business Statistics Expert Meeting, Paris, November 2005. http://www.oecd.org/dataoecd/9/44/35485064.pdf Mills, Duncan and Jason Timmins (2004), �Firm Dynamics in New Zealand: Comparative Analysis with OECD Countries�, paper presented to the 2004 conference of the New Zealand Association of Economists. http://www.nzae.org.nz/conferences/2004/88-Mills-Timmins.pdf

STD/DOC(2006)4
48
Pinkston, Joshua C., and James R. Spletzer (2004), �Annual Measures of Gross Job Gains and Gross Job Losses�, US Bureau of Labor Statistics Monthly Labor Review, November 2004. http://www.bls.gov/opub/mlr/2004/11/art1full.pdf Takahashi, Masao (2000), �Business Demography and the Japanese Business Survey Frame�, paper presented to the 14th International Roundtable on Business Survey Frames Auckland, November 2000. http://forum.europa.eu.int/irc/DownLoad/kveFAjJZmSGspYM195H5EFCl6eTNvOz6Vt5McKbYN63r0IIuHVQp4CmHyIxc1GjlFVXmUpoo2tSfBIMGtOpIxcLHbI/Paper%20Japan%20-%20session7.pdf Vale, Steven (2005(a)), �International Data on Business Start-ups: Factors Affecting Comparability�, paper presented to the 19th International Roundtable on Business Survey Frames, Cardiff, October 2005. http://forum.europa.eu.int/irc/DownLoad/kXeeAJJAmjGIcxMS0S9p_GZ2GvLRcOhH4rLSm9uxKEH2EUGq8jov3OoGlUXySA_6pkAUF-S0DF-9gqmf-Hj0fcg/Comparability%20RT%20Paper.doc Vale, Steven (2005(b)), �The Coverage of Micro-Enterprises in Business Registers�, paper presented at the OECD Structural Business Statistics Expert Meeting, Paris, November 2005. http://www.oecd.org/dataoecd/32/46/35506105.pdf Vale, Steven and Claire Powell (2003), �Developments in Business Demography - Reconciling Conflicting Demands�, paper presented to the Comparative Analysis of Enterprise (micro) Data Conference, London, September 2003. http://www.statistics.gov.uk/events/CAED/abstracts/downloads/vale.pdf Vale, Steven and Claire Powell (2002), �Estimating Under-coverage of Very Small Enterprises�, paper presented to the 16th International Roundtable on Business Survey Frames, Lisbon, October 2002. http://forum.europa.eu.int/irc/DownLoad/kgecA1JSmRGTex2OFEBEGfEvoFle1HrMxrNLRFurO5CG0NNpCl6eTNvOz64c5SN2VkAUF-0RCF-9gqmf-H/ses3_UK_Paper.pdf Volfinger, Zsolt (2004), �Coverage of the Hungarian Business Register�, paper presented to the 18th International Roundtable on Business Survey Frames, Beijing, October 2004. http://forum.europa.eu.int/irc/DownLoad/kjecAJJUmfG1uvhdvqlF0uAePVRfj3jMhqKGf0phOGF-HOBF7z6zLRjGpRmu-AZ-um3THrGuypb4pqOIjE5Tzc1L/S5-3%20-%20Coverage%20of%20the%20Hungarian%20Business%20Register.doc

STD/DOC(2006)4
49
Annex 1 � Glossary of Terms: Proposals for Harmonised Terminology
This report notes that comparability of data on business start-ups, and business demography more generally, is hampered by inconsistent presentation of metadata. To reduce this problem, the creation of a standard metadata template is proposed. As a first step towards this, a harmonised terminology is needed. This Annex proposes standard terms and definitions, using a notation which relates events to a particular time period, t. These terms and definitions have been used throughout this report, so this Annex also acts as a glossary. • Births (Bt) � A birth is the creation of a combination of production factors with the restriction that no
other national businesses are involved in the event. Births do not include entries into the population due to reactivations, mergers, break-ups, split-offs or other restructuring of a group of businesses linked by ownership or control. Births also exclude entries into a population resulting from changes to characteristics of existing businesses. (Note � this is largely based on, and fully consistent with the Eurostat definition for enterprise births).
• Churn � Total churn is defined as the sum of businesses joining and leaving the population during a
given period, i.e. entries plus exits (Et + Xt). Pure churn excludes entries and exits that are due to events other than births and deaths (i.e. Bt + Dt).
• Closing Stock (PBt) � The population at the end point of the period. This is usually equivalent to the
population at the start point for the following period (PAt+1). • Deaths (Dt) - A death is the dissolution of a combination of production factors with the restriction that
no other domestic businesses are involved in the event. Deaths do not include exits from the population due to temporary inactivity, mergers, take-overs, break-ups or other restructuring of a group of businesses linked by ownership or control. Deaths also exclude exits from a population resulting from changes to characteristics of businesses which remain active. (Note � this is largely based on, and fully consistent with the Eurostat definition for enterprise deaths).
• Entries (Et) � All businesses that join the population during the period, regardless of whether they are
still present at the end of the period. • Exits (Xt) � All businesses that leave the population during the period, regardless of whether they were
present at the start of the period. • Joiners (Jt) � Businesses that are present in the population at the end of the period, but were not present
at the start of the period. • Joiners and leavers within period (JLt) � Businesses that are not present in the population at the start or
the end of the period, but are present in at least one observation of the population between these two points (or would be if such observations were made).
• Leavers (Lt) � Businesses that are present in the population at the start of the period, but are not present
at the end of the period.

STD/DOC(2006)4
50
• Opening Stock (PAt) � The population at the start point of the period. This is usually equivalent to the population at the end point for the previous period (PBt-1).
• Other Entries (OEt) � All entries that are not births • Other Exits (OXt) � All exits that are not deaths • Population � All businesses that meet certain predefined criteria.
o Live during Period (Pt) - All businesses that meet certain predefined criteria at any time during a specified time period.
o Point in Time � All businesses that meet certain predefined criteria at a specific temporal reference point.
• Purity � The degree to which pure births and deaths are distinguished from other demographic events. • Survivors (St) All businesses that are in the population at both the start and the end of the period

STD/DOC(2006)4
51
Annex 2 - Inventory of Data on Business Start-ups by Country
Introduction This Annex provides an inventory of the available data and metadata found for each OECD country. It also includes information from other countries for which data have been found in the course of this work. In some cases, data are also available for groups of countries (e.g. the members of the European Union), via international agencies. The information contained in this Annex has been compiled based on searches of the Internet in Autumn 2005, and the author�s knowledge of sources. The focus is on official data sources, usually from National Statistical Institutes, though other sources are considered for some countries. The following pages list the sources found for each country, using a standard template for each source. They include links to the data where possible, but do not attempt to explicitly assess the comparability or any of the other dimensions of the quality of the data. Summary metadata, including coverage and definitions, are included, as well as information on the availability of more detailed metadata. Several countries have participated in the Eurostat business demography data collections, the DOSME (Demography of Small and Medium-sized Enterprises) project, and/or the OECD firm-level data project, so data are available via those routes. These sources are included for each country if appropriate, but to avoid repetition, information on the coverage and definitions used are provided separately at the end. 1. Australia One data source available Title � Web publication �Experimental Estimates, Entries and Exits of Business Entities� Source � Australian Bureau of Statistics, 2005 Internet address � http://www.ausstats.abs.gov.au/Ausstats/subscriber.nsf/Lookup/2EB3AE08FFBC9AD4CA2570280078B69E/$File/8160055001_2001-02,%202002-03%20and%202003-04.pdf Contents � Register-based population, entry, survival and exit estimates. Breakdowns � The data are broken down by economic activity, size, geography and �type of business entity� (legal form). Size breakdowns are not given for survival data. Metadata � Some metadata are included in the publication, further information is contained in an additional paper, �Business Entries and Exits � A Conceptual Framework�, available from the Australian Bureau of Statistics on request. See also the paper �Development of Statistics on Business Demography and Continuity in Australia� - http://forum.europa.eu.int/irc/DownLoad/kxeFAAJUmZGMYjKH--EUNFa3pFKPjEWCqF4EiCwmAUM8GSHYRf6dTHzryIxJ9UZ-bYR3R1H-BbbkSskDDjYv4G8BZM/ses3_Australia_Paper1.pdf

STD/DOC(2006)4
52
Period covered � The population estimates are as at 1 July for 2001 to 2003. Entries and exits are available for the periods 1 July to 30 June 2001/2 to 2003/4. One and two year survival rates are available for entries in 2001/2 and one year survival rates for entries in 2002/3. Coverage � ANZSIC division M (government) and non-market government entities are excluded. The threshold for registration is generally 50,000 Australian Dollars (approx. �31,000), with some exceptions, and some voluntary registrations. Definitions
• The population estimates are on a point in time basis. • The unit used is the legal unit, i.e. entities registered for an Australian Business number (ABN). • Entries are defined as the allocation of a tax role within the Australian Business Register (ABR).
This excludes inactive businesses, changes in legal form, and reactivations. A check is also made for newly created businesses that take over the activity of one or more existing businesses. These are excluded where identified.
• Exits are defined as the cancellation of all tax roles within the ABR, with similar inclusions and exclusions to those for entries.
2. Austria One data source available Title � Unternehmensneugründungen in Österreich 1993-2004 Source � Wirtschaftskammern Österreich (WKO) Internet address � http://portal.wko.at/wk/dok_detail_file.wk?AngID=1&DocID=344536&DstID=1721&StID=178712 Contents � Start year stock and new registrations for 1993 to 2004 Breakdowns � New registrations are broken down by economic activity, legal form, geography and (for natural persons) sex and age of the entrepreneur. Metadata � There are some descriptive metadata in the introduction to the publication. Period covered � 1993 to 2004 Coverage � Registrations with the WKO Definitions
• The population estimates are on a point in time basis (start of the year), and consist of active WKO registrations. The population data are not subject to the same adjustments as those for new registrations.
• The basic unit is the registration at the WKO, which can be considered as a legal unit. However, the corrections made bring the unit used for analysis much closer to the enterprise.
• New registrations are adjusted to remove re-registrations, dormant units, and multiple registrations for the same enterprise. Adjustments are also made for registration lags.

STD/DOC(2006)4
53
3. Belgium Two data sources available a) Title � Démographie des entreprises (1998-2004) Source � Statistics Belgium Internet address � http://statbel.fgov.be/figures/d422_fr.asp Contents � Value-added tax (VAT) stock, new registrations, de-registrations and liquidations Breakdowns � The data are broken down by legal form, economic activity and geography. Metadata � Limited to table headings and notes. More detailed metadata exist in the publication �Démographie des entreprises 2002�, which also contains more comprehensive data breakdowns, but just for 2002. Period covered � The population estimates are as at 31 December for 1998 to 2003. Registrations and de-registrations are available for the years 1998 to 2003. Liquidations are available for the years 1998 to 2004. Coverage � Some specific legal, medical, financial, social and personal services are exempt from value-added tax. There is no VAT registration threshold. Public sector entities are included if they are registered for VAT. Definitions
• The stock data are on a point in time basis, and include those VAT registrations marked as active at the end of the year.
• The unit used is the VAT registration, which is broadly equivalent to the legal unit. • Entries are defined as VAT registrations whose year of creation is the reference year, including
those that have been removed from the VAT register before the end of that year. • Exits are defined as VAT registrations whose year of removal from the VAT register is the
reference year. b) Title � Business demography indicators Source � Eurostat Internet address � http://epp.eurostat.cec.eu.int/portal/page?_pageid=0,1136195,0_45572097&_dad=portal&_schema=PORTAL Contents � Population of active enterprises, births, deaths, survival and growth Breakdowns � The data are broken down by country, economic activity, size and legal form Metadata � A methodological manual exists, but is not yet published.

STD/DOC(2006)4
54
Period covered � Data for the population of active enterprises exist for 1997 to 2000. Data for births exist for 1998 and 2000 (not 1999), and data for deaths exist for 1998 and 1999. Coverage and definitions � See information on Eurostat standard coverage and definitions at the end of this Annex. 4. Canada Three data sources available a) Title � Business Dynamics in Canada, 2001 (supplemented for 2002 by data prepared for FORA). Source � Statistics Canada � Longitudinal Employment Analysis Program (LEAP) Database. Internet address � http://www.statcan.ca:8096/bsolc/english/bsolc?catno=61-534-X (note: $25 charge) Contents � This publication includes data on business populations, birth and death rates, and survival. Breakdowns � Business populations, births and deaths are broken down by size and economic activity categories based on knowledge intensity. Business populations are also broken down by geography. Metadata � The publication contains a chapter on methodology. Period covered � The population estimates are available for 1991 to 2001, births are available from 1992 to 2001, and deaths from 1991 to 2000. Additional data on population and births for 2002, and deaths for 2001 is taken from a short report prepared by Statistics Canada for FORA. Coverage � All employers in Canada, public and private (i.e. data do not include businesses with no employees). Non employing businesses are included in the report prepared for FORA, but only for three years, and have considerable variation in the rates, which could call into question the validity of these data. Definitions
• The unit used is the firm, which, at the national level is equivalent to the legal unit. • Births are defined as firms that are not present on the LEAP database in year t, but are present in
year t+1. The birth rate is the number of new enterprises in t+1 divided by the total number of firms observed in year t+1.
• Deaths are defined as firms that are present on the LEAP database in year t, but are not present in year t+1. The death rate is the number of enterprises operating in t, but not in t+1, divided by the total number of firms observed in year t+1. Note this is different to the rates calculated in many other countries where the population in year t is the denominator.
b) Title � Self-Employment Entry and Exit Flows Source � Statistics Canada � Paper by Zhengxi Lin, Garnett Picot and Janice Yates Internet address � http://www.statcan.ca/english/research/11F0019MIE/11F0019MIE1999134.pdf Contents � This paper contains a table with counts of self-employed persons, and rates for entry and exit, as well as other related data and analyses.

STD/DOC(2006)4
55
Breakdowns � No breakdowns of the entry and exit data are given in the paper. Metadata � The paper contains descriptive metadata on sources and definitions. Period covered � The population estimates are available for 1981 to 1995, entries are available from 1982 to 1995, and exits from 1981 to 1994. Coverage � All persons declaring income from self employment in their annual tax returns to revenue Canada. Definitions
• The unit used is the person completing a tax return. • Self-employment entries are income-tax filers who report earnings from self-employment in one
year but not the previous year • Self-employment exits are income-tax filers who report earnings from self-employment in one
year but not the next. c) Title � OECD Firm-Level Data Project Source � OECD Internet address � http://www.oecd.org/document/4/0,2340,fr_2649_37451_1962948_1_1_1_37451,00.html Contents � This source contains count and employment data for continuing businesses, entries, exits and �one year� businesses Breakdowns � Data are broken down by economic activity (ISIC 2-digit level). Metadata � The website contains links to various papers containing descriptive metadata on sources, methods and definitions. Period covered � Data for Canada are available from 1984 to 1997. Coverage and Definitions � See the general information on the OECD firm-level data project at the end of this Annex. 5. Czech Republic Two data sources available a) Title � Demography of Small and Medium-sized Enterprises (DOSME) Study Source � Eurostat Internet address � http://forum.europa.eu.int/irc/dsis/dosme/info/data/en/pages/publications/DOSME%20Extension%20Final

STD/DOC(2006)4
56
%20Report.doc For more information about the DOSME project, see also - http://forum.europa.eu.int/irc/dsis/dosme/info/data/en/index.htm Contents � Data on enterprise populations, births, deaths, survival and factors of success. Breakdowns � The data are broken down by country, economic activity, size, legal form and characteristics of the entrepreneur. Metadata � The final report describes the methodology used to produce the data it contains. Other descriptive metadata is available on the project web site. Period covered � Data are available for births and deaths from 1994 to 2001 Coverage and Definitions � See information on DOSME standard coverage and definitions at the end of this Annex. b) Title � Business demography indicators Source � Eurostat Internet address � http://epp.eurostat.cec.eu.int/portal/page?_pageid=0,1136195,0_45572097&_dad=portal&_schema=PORTAL Contents � Population of active enterprises, births, deaths, survival and growth Breakdowns � The data are broken down by country, economic activity, size and legal form Metadata � A methodological manual exists, but is not yet published. Period covered � Data for the population of active enterprises exist for 2000 to 2002. Data for births exist for 2001 and 2002, and data for deaths exist for 2000 and 2001. Coverage and definitions � See information on Eurostat standard coverage and definitions at the end of this Annex. 6. Denmark Three data sources available a) Title � Statistical Yearbook Source � Statistics Denmark Internet address 2005 (data for 2001) - http://www.dst.dk/HomeUK/Statistics/ofs/Publications/Yearbook/2005.aspx 2003 (data for 2000) - http://www.dst.dk/HomeUK/Statistics/ofs/Publications/Yearbook/2003.aspx 2001 (data for 1999) - http://www.dst.dk/HomeUK/Statistics/ofs/Publications/Yearbook/2001.aspx 2000 (data for 1998) - http://www.dst.dk/HomeUK/Statistics/ofs/Publications/Yearbook/2000.aspx

STD/DOC(2006)4
57
Contents � Counts of new enterprises Breakdowns � Data are broken down by economic activity Metadata � Very limited Period covered � Birth counts are available for 1998 to 2001 Coverage � Data exclude agriculture and public administration Definitions
• The unit used is the enterprise b) Title � Business demography indicators Source � Eurostat Internet address � http://epp.eurostat.cec.eu.int/portal/page?_pageid=0,1136195,0_45572097&_dad=portal&_schema=PORTAL Contents � Population of active enterprises, births, deaths, survival and growth Breakdowns � The data are broken down by country, economic activity, size and legal form Metadata � A methodological manual exists, but is not yet published. Period covered � Data for the population of active enterprises exist for 1997 to 2001. Data for births exist for 1998 to 2001, and data for deaths exist for 1997 to 2000. Coverage and definitions � See information on Eurostat standard coverage and definitions at the end of this Annex. c) Title � OECD Firm-Level Data Project Source � OECD Internet address � http://www.oecd.org/document/4/0,2340,fr_2649_37451_1962948_1_1_1_37451,00.html Contents � This source contains count and employment data for continuing businesses, entries, exits and �one year� businesses Breakdowns � Data are broken down by economic activity (ISIC 2-digit level). Metadata � The website contains links to various papers containing descriptive metadata on sources, methods and definitions.

STD/DOC(2006)4
58
Period covered � Data for Denmark are available from 1981 to 1994. Coverage and Definitions � See the general information on the OECD firm-level data project at the end of this Annex. 7. Finland Three data sources available a) Title � Enterprise openings and closures Source � Statistics Finland Internet address � http://www.stat.fi/til/aly/index_en.html Data only accessible via Finnish version - http://www.stat.fi/til/aly/index.html Contents � Counts of enterprise openings and closures. Stock figures are available separately from the StatFin database, but may not have the same coverage. Breakdowns � Data are broken down by economic activity, legal form and geography. Metadata � Mostly in Finnish Period covered � Data are available from 1999 to 2004 Coverage � The openings and closures data are derived from Statistics Finland�s business register. They only cover those enterprises engaged in business activity that are liable to pay value-added tax or act as employers. Foundations, housing companies, voluntary associations, public authorities and religious communities are excluded. The data cover state-owned enterprises, but not those owned by municipalities. Definitions
• The unit used is the enterprise b) Title � Business demography indicators Source � Eurostat Internet address � http://epp.eurostat.cec.eu.int/portal/page?_pageid=0,1136195,0_45572097&_dad=portal&_schema=PORTAL Contents � Population of active enterprises, births, deaths, survival and growth Breakdowns � The data are broken down by country, economic activity, size and legal form Metadata � A methodological manual exists, but is not yet published. Period covered � Data for the population of active enterprises exist for 1997 to 2002. Data for births exist for 1998 to 2002, and data for deaths exist for 1997 to 2001.

STD/DOC(2006)4
59
Coverage and definitions � See information on Eurostat standard coverage and definitions at the end of this Annex. c) Title � OECD Firm-Level Data Project Source � OECD Internet address � http://www.oecd.org/document/4/0,2340,fr_2649_37451_1962948_1_1_1_37451,00.html Contents � This source contains count and employment data for continuing businesses, entries, exits and �one year� businesses Breakdowns � Data are broken down by economic activity (ISIC 2-digit level). Metadata � The website contains links to various papers containing descriptive metadata on sources, methods and definitions. Period covered � Data for Finland are available from 1989 to 1997. Coverage and Definitions � See the general information on the OECD firm-level data project at the end of this Annex. 8. France Three data sources available a) Title � Créations d'entreprises Source � INSEE Internet address � http://www.insee.fr/fr/ffc/chifcle_liste.asp?theme=9&soustheme=1&souspop= Contents � Counts of enterprise creations, split into new creations, resumptions and re-activations Breakdowns � Breakdowns by economic activity, size and legal form are available. Metadata � Limited, e.g. some key definitions. Period covered � Data are available from 1993 to 2004 Coverage � The data cover all of France, including the overseas départements. Definitions
• The unit is assumed to be the enterprise. • Three categories of enterprise creation are identified:
o Pure creations (creations �ex nihilo�) where the new enterprise does not take over the activities of a previously existing enterprise.

STD/DOC(2006)4
60
o Reactivations, where a person who has previously been self-employed re-starts a self-employed activity.
o Resumptions, where a new business takes over an activity previously carried out by another enterprise.
b) Title � La Création en Chiffres Source � Agence Pour la Création d�Entreprises (APCE) Internet address � http://www.apce.com/index.php?rubrique_id=261&type_page=I Contents � Counts of enterprise creations, split into new creations (�ex nihilo�), resumptions and re-activations Breakdowns � None Metadata � Very limited Period covered � Data are available from 1993 to 2004 Coverage � No information Definitions � None given � the data are very similar to, but not the same as, those from INSEE. c) Title � OECD Firm-Level Data Project Source � OECD Internet address � http://www.oecd.org/document/4/0,2340,fr_2649_37451_1962948_1_1_1_37451,00.html Contents � This source contains count and employment data for continuing businesses, entries, exits and �one year� businesses Breakdowns � Data are broken down by economic activity (ISIC 2-digit level). Metadata � The website contains links to various papers containing descriptive metadata on sources, methods and definitions. Period covered � Data for France are available from 1990 to 1996. Coverage and Definitions � See the general information on the OECD firm-level data project at the end of this Annex.

STD/DOC(2006)4
61
9. Germany Three data sources available a) Title � Business Notifications Source � Federal Statistics Office, Germany Internet address � http://www.destatis.de/themen/e/thm_unternehmen.htm Contents � Business registrations, modifications and de-registrations, and counts of businesses liable to pay turnover tax. Breakdowns � The data are broken down by economic activity. Metadata � Descriptive metadata are available via the website Period covered � Registration and de-registration data are available for 2001 to 2003. Data on the population of businesses liable for tax are available for 2002 and 2003. Coverage � The registration and de-registration data are assumed to cover the whole economy. The population of businesses liable to pay turnover tax covers businesses with a turnover of at least �16,620 per year. It covers most economic activities, with exceptions for certain health, public administration, insurance and agricultural activities. Definitions
• The unit for registrations and de-registrations is effectively the local unit as �the obligation to report business registrations and de-registrations applies to enterprises, branch offices and dependent sub-offices�.
• Registration is required when a new activity is started or a business is taken over, be it through purchase or succession, a partner entering the business, a change in legal form, or a relocation of the business to a different registration district.
• De-registration is required when a business is shut down completely or in part, or is sold, a partner withdraws from the business, the legal form is changed, or the business is relocated to a different registration district.
b) Title � Start-ups and Liquidations in Germany 1991 - 2004 Source � Institut für Mittelstandsforschung Bonn Internet address � http://www.ifm-bonn.org/dienste/gruendungen-engl.htm Contents � Counts of business start-ups and liquidations. Some enterprise population totals in Table 1 of: http://www.ifm-bonn.org/dienste/kap-2.pdf Breakdowns � The start-up and liquidation data are broken down into the former East and West Germany. Metadata � Limited metadata available via the web site.

STD/DOC(2006)4
62
Period covered � Start-up and liquidation data are available for 1991 to 2004. Data on the population of businesses are available for 1994 and 1996 to 1999 (IfM have provided estimates for the missing years). Coverage � The population of businesses is subject to a threshold (�17,500 since 2003), and covers all economic activities except the �liberal professions�, most health services and some insurance services that are not subject to value added tax. Definitions
• The units used are effectively the sub-set of legal units that are considered to be economically relevant.
c) Title � OECD Firm-Level Data Project Source � OECD Internet address � http://www.oecd.org/document/4/0,2340,fr_2649_37451_1962948_1_1_1_37451,00.html Contents � This source contains count and employment data for continuing businesses, entries, exits and �one year� businesses Breakdowns � Data are broken down by economic activity (ISIC 2-digit level). Metadata � The website contains links to various papers containing descriptive metadata on sources, methods and definitions. Period covered � Data for Germany are available from 1978 to 1998. Coverage and Definitions � See the general information on the OECD firm-level data project at the end of this Annex. Note � data for Germany only cover the former West Germany. 10. Greece No data sources found 11. Hungary Three data sources are available a) Title � Enterprises and Non-profit organisations Source � Hungarian Central Statistical Office Internet address � http://portal.ksh.hu/portal/page?_pageid=38,341368&_dad=portal&_schema=PORTAL Contents � Annual counts of registered economic corporations and unincorporated enterprises, as well as quarterly counts of new registrations

STD/DOC(2006)4
63
Breakdowns � Both are broken down by legal form, the population data are also broken down by economic activity. Metadata � Information on definitions and sources is available on the web site. See also the paper �Coverage of the Hungarian Business Register� at: http://forum.europa.eu.int/irc/DownLoad/kjecAJJUmfG1uvhdvqlF0uAePVRfj3jMhqKGf0phOGF-HOBF7z6zLRjGpRmu-AZ-um3THrGuypb4pqOIjE5Tzc1L/S5-3%20-%20Coverage%20of%20the%20Hungarian%20Business%20Register.doc Period covered � Population are available from 1994 to 2004. Annual data on new registrations can be constructed by adding the four quarterly totals for 2001 to 2004. Coverage � The data cover all businesses that hold an active registration and tax number in the administrative register, including most government bodies. There is no registration threshold in Hungary, so part-time businesses are included. Approximately 75% of registrations are considered to be economically active by the Hungarian statistical office. All economic activities are covered, though NACE division L (public administration) is excluded from the counts broken down by activity. Definitions
• The unit is referred to as the enterprise, but the definition is closer to that of a legal unit. • The population data are point in time estimates for the end of the year.
b) Title � Demography of Small and Medium-sized Enterprises (DOSME) Study Source � Eurostat Internet address � http://forum.europa.eu.int/irc/dsis/dosme/info/data/en/pages/publications/DOSME%20Extension%20Final%20Report.doc For more information about the DOSME project, see also - http://forum.europa.eu.int/irc/dsis/dosme/info/data/en/index.htm Contents � Data on enterprise populations, births, deaths, survival and factors of success. Breakdowns � The data are broken down by country, economic activity, size, legal form and characteristics of the entrepreneur. Metadata � The final report describes the methodology used to produce the data it contains. Other descriptive metadata is available on the project web site. Period covered � Data are available for births and deaths from 1994 to 2001 Coverage and Definitions � See information on DOSME standard coverage and definitions at the end of this Annex. c) Title � Business demography indicators Source � Eurostat

STD/DOC(2006)4
64
Internet address � http://epp.eurostat.cec.eu.int/portal/page?_pageid=0,1136195,0_45572097&_dad=portal&_schema=PORTAL Contents � Population of active enterprises, births, deaths, survival and growth Breakdowns � The data are broken down by country, economic activity, size and legal form Metadata � A methodological manual exists, but is not yet published. Period covered � Data for the population of active enterprises exist for 2000 to 2002. Data for births exist for 2000 to 2002, and data for deaths exist for 1999 to 2001. Coverage and definitions � See information on Eurostat standard coverage and definitions at the end of this Annex. 12. Iceland Two data sources available a) Title � Registered Enterprises and Organisations 1995-2001 Source � Statistics Iceland Internet address � http://www.statice.is/?pageid=1198&src=/temp_en/fyrirtaeki/fyrirtaeki.asp Contents � Counts of registered enterprises, new registrations and �new depreciation� Breakdowns � The data are broken down by legal form. Metadata � Only brief footnotes are available. Period covered � The data are available for 1995 to 2001. Coverage � The data seem to cover all legal forms. Definitions
• The population figures appear to be point in time estimates, as at the end of the year. • The unit used appears to be the legal unit.
b) Title � Enterprises / New Registrations by Economic Activity Source � Statistics Iceland Internet address � http://www.statice.is/?pageid=1198&src=/temp_en/fyrirtaeki/fyrirtaeki.asp Contents � Counts of enterprises and new registrations Breakdowns � The data are broken down by economic activity (NACE section).

STD/DOC(2006)4
65
Metadata � Only brief footnotes are available. Period covered � The enterprise population data are available for 1999 to 2004, the new registrations data are available from 1995 to 2004. Coverage � The data seem to cover all economic activities. Definitions
• Non available 13. Ireland No data sources found, though Ireland are starting to supply data for the Eurostat business demography project 14. Italy Three data sources available a) Title � Movimprese Source � InfoCamere Internet address � http://www.infocamere.it/movi_search.htm Contents � Counts of total registrations and active registrations, new registrations, cessations and changed registrations at the Italian chamber of commerce. Breakdowns � The data are broken down by economic activity and geography. Metadata � A glossary and other metadata are available on the web site (in Italian) Period covered � The data are available for 1995 to 2004. Coverage � The data do not cover NACE section L (public administration), and presumably do not cover government units. Definitions
• The unit used is the legal unit • The population data are point in time, and appear to relate to the end of the year
b) Title � Business demography indicators Source � Eurostat

STD/DOC(2006)4
66
Internet address � http://epp.eurostat.cec.eu.int/portal/page?_pageid=0,1136195,0_45572097&_dad=portal&_schema=PORTAL Contents � Population of active enterprises, births, deaths, survival and growth Breakdowns � The data are broken down by country, economic activity, size and legal form Metadata � A methodological manual exists, but is not yet published. Period covered � Data for the population of active enterprises exist for 1997 to 2002. Data for births exist for 1998 to 2002, and data for deaths exist for 1997 to 2001. Coverage and definitions � See information on Eurostat standard coverage and definitions at the end of this Annex. c) Title � OECD Firm-Level Data Project Source � OECD Internet address � http://www.oecd.org/document/4/0,2340,fr_2649_37451_1962948_1_1_1_37451,00.html Contents � This source contains count and employment data for continuing businesses, entries, exits and �one year� businesses Breakdowns � Data are broken down by economic activity (ISIC 2-digit level). Metadata � The website contains links to various papers containing descriptive metadata on sources, methods and definitions. Period covered � Data for Italy are available from 1987 to 1993. Coverage and Definitions � See the general information on the OECD firm-level data project at the end of this Annex. 15. Japan One data source found Title � Establishment and Enterprise Census Source � Statistics bureau of Japan Internet address � http://forum.europa.eu.int/irc/DownLoad/kveFAjJZmSGspYM195H5EFCl6eTNvOz6Vt5McKbYN63r0IIuHVQp4CmHyIxc1GjlFVXmUpoo2tSfBIMGtOpIxcLHbI/Paper%20Japan%20-%20session7.pdf There are also some data on establishment and enterprise populations at http://www.stat.go.jp/english/data/jigyou/kekka.htm.

STD/DOC(2006)4
67
Contents � Table 3 of the paper at the first address above includes counts of existing establishments (i.e. survivors), �newly-organised establishments� and �abolished establishments� based on data from the 1989, 1994 and 1999 establishment and enterprise censuses. Breakdowns � The data for 1999 are broken down by economic activity and employment size band. Metadata � The paper contains definitions and descriptive metadata. Period covered � The data are available for 1989, 1994 and 1999. Annualised �opening� and �abolishment� rates are also given for the periods between censuses. Coverage � The data do not cover sole-proprietor businesses in agriculture, forestry and fishing activities, or any businesses classified to domestic services, foreign governments or international agencies. Several other specific exclusions are listed in the paper. Definitions
• The unit used is the establishment • The population data are on a point in time basis • A newly-organized establishment is defined as an establishment that had been newly-organized or
had moved into the present place since the date of the preceding census. • An abolished establishment is defined as an establishment that had moved to a different place or
had been closed since the date of the preceding census. 16. Korea No data sources found, though there are some counts of establishments at: http://kosis.nso.go.kr/cgi-bin/SWS_1021.cgi?KorEng=2&A_UNFOLD=1&TableID=MT_ETITLE&TitleID=HA&FPub=4&UserID= 17. Luxembourg Two data sources available a) Title � Démographie des Entreprises Source � STATEC Internet addresses � http://www.statistiques.public.lu/stat/TableViewer/tableView.aspx?ReportId=258 http://www.statistiques.public.lu/stat/TableViewer/tableView.aspx?ReportId=259 http://www.statistiques.public.lu/stat/tableviewer/document.aspx?FileId=209 Contents � Counts of the stock of enterprises at the start of the year, new enterprises created during the year in the framework of the policy of economic diversification, and requests for authorisation for establishments. Note � from the numbers given, the new enterprise data would only seem to account for a small proportion of all enterprise births.

STD/DOC(2006)4
68
Breakdowns � The stock and new enterprise data are broken down by very broad categories of economic activity. The requests for authorisation for establishments are broken down by nationality of the requestor (Luxembourgish or foreign). Metadata � Some metadata are available by following the information links within the tables on the web site. Period covered � Data on the stock of enterprises are available for 2002 to 2004. Data on new enterprises are available for 1990, and 2000 to 2004. Data on requests for authorisation for establishments are available for 1990 and 1995 to 2004. Coverage � There is no specific information on coverage. Definitions
• The data on the stock of enterprises are on a point in time basis (1 January of the reference year). • The unit used is assumed to be the enterprise for the stock and new enterprise data, and the local
unit for the data on requests for authorisation for establishments. b) Title � Business demography indicators Source � Eurostat Internet address � http://epp.eurostat.cec.eu.int/portal/page?_pageid=0,1136195,0_45572097&_dad=portal&_schema=PORTAL Contents � Population of active enterprises, births, deaths, survival and growth Breakdowns � The data are broken down by country, economic activity, size and legal form Metadata � A methodological manual exists, but is not yet published. Period covered � Data for the population of active enterprises exist for 1997 to 2002. Data for births exist for 1998 to 2002, and data for deaths exist for 1997 to 2001. Coverage and definitions � See information on Eurostat standard coverage and definitions at the end of this Annex. 18. Mexico No data sources found 19. Netherlands Three data sources available a) Title � Establishment and Closure of Businesses

STD/DOC(2006)4
69
Source � Statistics Netherlands Internet address � http://statline.cbs.nl/StatWeb/table.asp?PA=07223eng&D1=a&D2=0&D3=(l-11)-l&DM=SLEN&LA=en&TT=2 Contents � Counts (and employment) of the stock of businesses (as at 1 January), businesses opening, and businesses closing. Breakdowns � The data are available broken down by economic activity. Metadata � Metadata are available by clicking on the table headings on the web site. Period covered � The data are available from 1993 to 2002 (closures only to 1996). Coverage � The data exclude certain NACE categories (Sections A, B, E, L, M and N, and divisions 70, 73, 91 and 92). On this basis it is assumed that most government activity is also excluded. Definitions
• The stock of businesses is a point in time estimate • The unit used is the �business� which is assumed to be close to the enterprise, as the terms are both
used in the metadata. • Establishment of a business is the formation of a new enterprise. This implies that the statistical
criteria for enterprises (autonomy, description and external orientation) have to be met. Moreover, the enterprise has to be economically active, i.e. at least one person works in the enterprise for at least 15 hours a week. The enterprise has to be a new one, i.e. not the continuation of one or more existing enterprises.
• Closure of enterprises implies discontinuation of all activities, hence no continuation of activities by other enterprises.
b) Title � Business demography indicators Source � Eurostat Internet address � http://epp.eurostat.cec.eu.int/portal/page?_pageid=0,1136195,0_45572097&_dad=portal&_schema=PORTAL Contents � Population of active enterprises, births, deaths, survival and growth Breakdowns � The data are broken down by country, economic activity, size and legal form Metadata � A methodological manual exists, but is not yet published. Period covered � Data for the population of active enterprises exist for 1999 to 2001. Data for births exist for 1998 to 2002, and data for deaths exist for 1998 to 2000. Coverage and definitions � See information on Eurostat standard coverage and definitions at the end of this Annex.

STD/DOC(2006)4
70
c) Title � OECD Firm-Level Data Project Source � OECD Internet address � http://www.oecd.org/document/4/0,2340,fr_2649_37451_1962948_1_1_1_37451,00.html Contents � This source contains count and employment data for continuing businesses, entries, exits and �one year� businesses Breakdowns � Data are broken down by economic activity (ISIC 2-digit level). Metadata � The website contains links to various papers containing descriptive metadata on sources, methods and definitions. Period covered � Data for the Netherlands are available from 1987 to 1997. Coverage and Definitions � See the general information on the OECD firm-level data project at the end of this Annex. 20. New Zealand One data source available Title � SMEs in New Zealand: Structure and Dynamics - 2005 Source � New Zealand Ministry of Economic Development Internet address � http://www.med.govt.nz/irdev/ind_dev/smes/2005/index.html Contents � Counts of the stock of enterprises in February of each year (Figure 1 of the publications for 2001 to 2005), and enterprise births and deaths during the year (table underlying Figure 15 of the 2005 publication). Breakdowns � Stock data are broken down by employee size band. There are no breakdowns of the birth and death data. Metadata � The 2005 publication contains extensive metadata, including a glossary. Period covered � The stock data are available for 2000 to 2004. The data on births and deaths are available for 1998 to 2004. Coverage � The data exclude agriculture production (ANZSIC subdivision A01). They also exclude businesses of �little economic significance�, i.e. those that fail to meet at least one of the following criteria:
• greater than $30,000 (approx �17,500) annual taxable expenses or sales • rolling mean employee count of greater than three • in a tax-exempt industry (except for residential property leasing and rental) • part of a group of enterprises • registered for tax and involved in agriculture or forestry.

STD/DOC(2006)4
71
Definitions • The stock data are on a point in time basis, with a February reference date. • The unit used appears to be the legal unit, though the term �enterprise� is used. • Data on the entry and exit of firms include administrative changes such as restructuring and
changes of ownership, as well as genuine business start-ups and closures. 21. Norway Two data sources available a) Title � Statbank Norway / Enterprises Source � Statistics Norway Internet address � http://statbank.ssb.no/statistikkbanken/default_fr.asp?PLanguage=1 Contents � Count and employment data on the population of enterprises, new enterprises and enterprise �drop-outs�. (Limited data on survival are also available at - http://www.ssb.no/english/subjects/10/01/fordem_en/tab-2004-12-01-01-en.html). Breakdowns � The data are broken down by geography, economic activity, legal form and size band. Metadata � Detailed methodological notes and definitions are available at http://www.ssb.no/vis/foretak_en/about.html Period covered � The data on the population of enterprises are available for 2001 to 2005. The data on new enterprises and enterprise drop-outs are available for 2001 to 2004. Coverage � Enterprises classified to public administration, agriculture, forestry and fishing are excluded, as are central and local government units. Definitions
• A new enterprise in a given period is an enterprise registered with dates that indicate start-up in this period.
• The number of new established enterprises is the number of a new enterprises corrected for the change of ownership. That is - new enterprises that take over existing activity are not counted as new established enterprise, but only as a new enterprise.
• A discontinuance of an activity is counted as a drop-out. If all of the establishment is closed down, and is not taken over by another enterprise, the drop-out is also classified as a closure.
• The population of enterprises is a point in time estimate as of 1st January. • The unit used is the enterprise
b) Title � Business demography indicators Source � Eurostat

STD/DOC(2006)4
72
Internet address � http://epp.eurostat.cec.eu.int/portal/page?_pageid=0,1136195,0_45572097&_dad=portal&_schema=PORTAL Contents � Population of active enterprises, births, deaths, survival and growth Breakdowns � The data are broken down by country, economic activity, size and legal form Metadata � A methodological manual exists, but is not yet published. Period covered � Data for the population of active enterprises exist for 1997 to 2001. Data for births exist for 1998 to 2001, and data for deaths exist for 1999 and 2000. Coverage and definitions � See information on Eurostat standard coverage and definitions at the end of this Annex. 22. Poland Two data sources available a) Title � Demography of Small and Medium-sized Enterprises (DOSME) Study Source � Eurostat Internet address � http://forum.europa.eu.int/irc/dsis/dosme/info/data/en/pages/publications/DOSME%20Extension%20Final%20Report.doc For more information about the DOSME project, see also - http://forum.europa.eu.int/irc/dsis/dosme/info/data/en/index.htm Contents � Data on enterprise populations, births, deaths, survival and factors of success. Breakdowns � The data are broken down by country, economic activity, size, legal form and characteristics of the entrepreneur. Metadata � The final report describes the methodology used to produce the data it contains. Other descriptive metadata is available on the project web site. Period covered � Data are available for births and deaths from 1994 to 2001 Coverage and Definitions � See information on DOSME standard coverage and definitions at the end of this Annex. b) Title � Entry and Exit Rates in the Polish manufacturing Source � National Bank of Poland Internet address � http://www.fcee.urv.es/departaments/economia/recerca/grit/Catala/web/papers/Rogowski-Socha.pdf

STD/DOC(2006)4
73
Contents � This paper compares data from several national sources on business entry and exit. Most sources concentrate only on manufacturing, but whole economy entry and exit rates from the REGON register are included in Table 10. Breakdowns � The data are broken down by broad economic activity. Metadata � The paper contains some limited metadata, mainly describing the source. Period covered � Entry and exit rates are available for 1998 to 2003 Coverage � The data are claimed to cover the whole economy, but the breakdown by broad economic activity does not include data for agriculture, business services, public administration, health, education or personal services, so these activities may be excluded. A warning is given that around a half of the businesses included in REGON were inactive in 1999, dropping to 30-40% in 2003. This could imply that entry rates as a proportion of active businesses should be much higher, but it is likely that a proportion of entries are themselves inactive. Definitions
• The data appear to use a point in time population. • The unit used is referred to as the enterprise, but is not defined.
23. Portugal Two data sources available Title � Business demography indicators Source � Eurostat Internet address � http://epp.eurostat.cec.eu.int/portal/page?_pageid=0,1136195,0_45572097&_dad=portal&_schema=PORTAL Contents � Population of active enterprises, births, deaths, survival and growth Breakdowns � The data are broken down by country, economic activity, size and legal form Metadata � A methodological manual exists, but is not yet published. Period covered � Data for the population of active enterprises exist for 1997 to 2002. Data for births exist for 1998 to 2002, and data for deaths exist for 1997 to 2001. Coverage and definitions � See information on Eurostat standard coverage and definitions at the end of this Annex. b) Title � OECD Firm-Level Data Project Source � OECD

STD/DOC(2006)4
74
Internet address � http://www.oecd.org/document/4/0,2340,fr_2649_37451_1962948_1_1_1_37451,00.html Contents � This source contains count and employment data for continuing businesses, entries, exits and �one year� businesses Breakdowns � Data are broken down by economic activity (ISIC 2-digit level). Metadata � The website contains links to various papers containing descriptive metadata on sources, methods and definitions. Period covered � Data for Portugal are available from 1983 to 1997. Coverage and Definitions � See the general information on the OECD firm-level data project at the end of this Annex. 24. Slovakia Two data sources available a) Title � Demography of Small and Medium-sized Enterprises (DOSME) Study Source � Eurostat Internet address � http://forum.europa.eu.int/irc/dsis/dosme/info/data/en/pages/publications/DOSME%20Extension%20Final%20Report.doc For more information about the DOSME project, see also - http://forum.europa.eu.int/irc/dsis/dosme/info/data/en/index.htm Contents � Data on enterprise populations, births, deaths, survival and factors of success. Breakdowns � The data are broken down by country, economic activity, size, legal form and characteristics of the entrepreneur. Metadata � The final report describes the methodology used to produce the data it contains. Other descriptive metadata is available on the project web site. Period covered � Data are available for births and deaths from 1994 to 2001 Coverage and Definitions � See information on DOSME standard coverage and definitions at the end of this Annex. b) Title � Business demography indicators Source � Eurostat Internet address � http://epp.eurostat.cec.eu.int/portal/page?_pageid=0,1136195,0_45572097&_dad=portal&_schema=PORTAL

STD/DOC(2006)4
75
Contents � Population of active enterprises, births, deaths, survival and growth Breakdowns � The data are broken down by country, economic activity, size and legal form Metadata � A methodological manual exists, but is not yet published. Period covered � Data for the population of active enterprises exist for 2000 to 2002. Data for births exist for 2000 to 2002, and data for deaths exist for 2000 and 2001. Coverage and definitions � See information on Eurostat standard coverage and definitions at the end of this Annex. 25. Spain Two data sources available a) Title � Demografía de las Empresas Source � Instituto Nacional de Estadística Internet address � http://www.ine.es/inebase/cgi/um?M=%2Ft37%2Fp201&O=inebase&N=&L=0 Contents � Counts of enterprises, creations (split between pure births and reactivations), and cessations. Breakdowns � The population, creation and cessation counts are broken down by economic activity, legal form and size. The INEbase data warehouse allows more detailed breakdowns of total creations and cessations by the same variables. Metadata � Some descriptive metadata are available via the web site above. Period covered � The population counts are available for 1999 to 2005. Data on creations and cessations are available for 1998 to 2004, but the split of creations into pure births and reactivations is only present for 2001 to 2004. Coverage � The data appear to exclude agriculture, forestry, fishing and public administration activities, as well as central and local government units. Definitions
• The population counts are on a point in time basis (1 January). • The unit used is the enterprise. • Creations (altas) are defined as new registrations in DIRCE (the statistical business register) that
start their activities in the reference year. • Cessations (bajas) are defined as units that cease activity in DIRCE in the reference year.
b) Title � Business demography indicators Source � Eurostat

STD/DOC(2006)4
76
Internet address � http://epp.eurostat.cec.eu.int/portal/page?_pageid=0,1136195,0_45572097&_dad=portal&_schema=PORTAL Contents � Population of active enterprises, births, deaths, survival and growth Breakdowns � The data are broken down by country, economic activity, size and legal form Metadata � A methodological manual exists, but is not yet published. Period covered � Data for the population of active enterprises exist for 2000 to 2002. Data for births exist for 2000 to 2002, and data for deaths exist for 2000 and 2001. Coverage and definitions � See information on Eurostat standard coverage and definitions at the end of this Annex. 26. Sweden Two data sources available a) Title � Nystartade företag (New enterprise starts) Source � Statistics Sweden Internet address � http://www.scb.se/templates/tableOrChart____27185.asp http://www.scb.se/templates/Standard____36176.asp Contents � Counts of new enterprises, and the stock of enterprises (and local units) at 1 January each year. Breakdowns � The data on new enterprises are broken down by broad economic activity categories. The series on the stock of enterprises is not broken down, though annual publications provide detailed breakdowns by size (employment and turnover), legal form, economic activity and geography for individual years. Metadata � Descriptive metadata about the Swedish statistical business register are available at http://www.scb.se/templates/Listning2____31034.asp , including some definitions. Period covered � The data on new enterprises are available for 1996 to 2004. The data on the stock of enterprises are available for 1971 to 2004, though include some discontinuities (e.g. in 1996) due to changes in the scope of the administrative sources used for the statistical business register. Coverage � The data on the stock of enterprises cover all economic activities and legal forms. It is not clear whether the data on new enterprises have the same coverage. Definitions
• The stock of enterprises is on a point in time basis (1 January). • The unit used is the enterprise, though enterprises are defined as active legal units.
b) Title � Business demography indicators

STD/DOC(2006)4
77
Source � Eurostat Internet address � http://epp.eurostat.cec.eu.int/portal/page?_pageid=0,1136195,0_45572097&_dad=portal&_schema=PORTAL Contents � Population of active enterprises, births, deaths, survival and growth Breakdowns � The data are broken down by country, economic activity, size and legal form Metadata � A methodological manual exists, but is not yet published. Period covered � Data for the population of active enterprises exist for 1997 to 2002. Data for births exist for 1998 to 2002, and data for deaths exist for 1997 to 2002. Coverage and definitions � See information on Eurostat standard coverage and definitions at the end of this Annex. 27. Switzerland One data source available Title � Démographie des entreprises Source � Office Fédéral de la Statistique, Switzerland Internet address � http://www.bfs.admin.ch/bfs/portal/fr/index/themen/industrie_und_dienstleistungen/unternehmen/blank/medienmitteilungen.html http://www.bfs.admin.ch/bfs/portal/fr/index/themen/industrie_und_dienstleistungen/uebersicht/blank/publikationen.html?publicationID=853 Contents � Count and employment data for new enterprises. The second internet address above gives counts of the stock of enterprises for years in which a census of enterprises has been carried out. Breakdowns � The data on new enterprises are broken down by economic activity. There are various breakdowns available for data from censuses of enterprises. Metadata � Methodological notes are included in the press release on new enterprises. Period covered � Counts of new enterprises are available for 1999 to 2003. Data on the stock of enterprises are available for 1985, 1995, 1998 and 2001. Coverage � Economic activities in agriculture, forestry, fishing and public administration (NACE sections A, B and L) are not covered. National and local government units are also excluded. Definitions
• The stock data are on a point in time basis • The unit used is the enterprise

STD/DOC(2006)4
78
• New enterprises are defined as �ex nihilo� creations, i.e. pure births, with reactivations and take-overs excluded.
28. Turkey One data source available Title � Newly Established and Liquidated Companies and Firms Source � State Institute of Statistics Internet address � http://www.die.gov.tr/english/SONIST/SIRKET/sirket.html, or http://www.die.gov.tr/TURKISH/SONIST/SIRKET/sirket.html (Turkish version) Contents � Counts of newly established companies and co-operatives and newly established firms, as well as liquidations of both. Breakdowns � Some breakdowns by economic activity and geography are available for more recent data. Metadata � Some definitions are available in the SIS Data Dictionary (http://www.die.gov.tr/TURKISH/SOZLUK/dataa.html). Period covered � Data are available for 1995, and 1997 to 2004. Coverage � All economic activities seem to be covered, though the counts for agriculture look rather low. Central and local government units do not seem to be covered. Definitions
• Firms are defined as �business establishments excluding companies and cooperatives.� • Companies are defined as �a number of persons forming an establishment for commercial purposes
as a result of economic and social joining.� • Co-operatives are defined as �legal entity operating without fixed capital that may be established
by public institutions, provincial special administrations, municipalities, associations or societies, whose aim is to provide certain economic benefits to shareholders, especially in relation to their occupation and livelihood through aid and solidarity.�
• Newly established companies and co-operatives, and liquidations, are those announced in the Turkish Trade Register Gazette.
29. United Kingdom Four data sources available a) Title � Value-Added Tax Registrations and De-registrations Source � Department for Trade and Industry � Small Business Service Internet address � http://www.sbs.gov.uk/sbsgov/action/layer?r.l2=7000000243&r.l1=7000000229&r.s=tl&topicId=7000011757

STD/DOC(2006)4
79
Contents � Counts of the stock of value-added tax (VAT) registered businesses, new registrations and de-registrations. Breakdowns � Data are broken down by economic activity and geography. Metadata � A paper on the methodology used is available via the web site. Period covered � The data are available for 1994 to 2003. A previous series from 1980 to 1993 is also available, but the data are not directly comparable due to large changes in the VAT threshold. Coverage � The data cover all economic activities and legal forms, though coverage is limited for certain activities that are exempt from VAT, particularly in the education and health sectors. Definitions
• The stock data are on a point in time basis (1 January). • The unit used is the VAT registration, which approximates to the legal unit.
b) Title � Barclays Small Business Surveys Source � Barclays Internet address � http://www.business.barclays.co.uk/BRC1/jsp/brccontrol?task=articleFWgroup&value=6502&target=_self&site=bbb Contents � Data on business start-ups and closures, as well as the total population of businesses are contained in a series of quarterly reports. Breakdowns � The data are broken down in different ways each year, including by geography, economic activity, and sex of the entrepreneur. Metadata � Limited metadata are available within the reports. Period covered � Data are available from 1995 to 2004, though for latter years they are increasingly broadly rounded estimates. Coverage � The data only cover England and Wales. They are based on business current account openings and closures at Barclays, multiplied by estimates of their share of the business banking market. This makes it unlikely that central and local government activities will be included. Businesses that do not operate via business current accounts are also excluded. Definitions
• The unit used is the business account, which will be close to the definition of the enterprise. • The population data are on a point in time basis.
c) Title � Business demography indicators Source � Eurostat

STD/DOC(2006)4
80
Internet address � http://epp.eurostat.cec.eu.int/portal/page?_pageid=0,1136195,0_45572097&_dad=portal&_schema=PORTAL Contents � Population of active enterprises, births, deaths, survival and growth Breakdowns � The data are broken down by country, economic activity, size and legal form Metadata � A methodological manual exists, but is not yet published. Period covered � Data for the population of active enterprises exist for 1997 to 2003. Data for births exist for 1998 to 2003, and data for deaths exist for 1997 to 2003. Coverage and definitions � See information on Eurostat standard coverage and definitions at the end of this Annex. d) Title � OECD Firm-Level Data Project Source � OECD Internet address � http://www.oecd.org/document/4/0,2340,fr_2649_37451_1962948_1_1_1_37451,00.html Contents � This source contains count and employment data for continuing businesses, entries, exits and �one year� businesses Breakdowns � Data are broken down by economic activity (ISIC 2-digit level). Metadata � The website contains links to various papers containing descriptive metadata on sources, methods and definitions. Period covered � Data for the United Kingdom are available from 1986 to 1997, except 1992. Coverage and Definitions � See the general information on the OECD firm-level data project at the end of this Annex. 30. United States Six data sources available a) Title � Statistics of US Businesses / Dynamic Data Source � US Census Bureau Internet address � http://www.census.gov/csd/susb/susbdyn.htm Contents � Counts of establishment stock, births, deaths, expansions and contractions, and associated employment changes.

STD/DOC(2006)4
81
Breakdowns � The data are broken down by economic activity, size band (based on employment) and geography. Metadata � Papers with descriptive metadata and definitions are available via the web site. Period covered � Data are available for 1995 to 2001. Coverage � Businesses without employees are excluded. All economic activities are covered except crop and animal production (NAICS 111,112), rail transportation (NAICS 482), National Postal Service (NAICS 491), pension, health, welfare, and vacation funds (NAICS 525110, 525120, 525190), trusts, estates, and agency accounts (NAICS 525920), private households (NAICS 814), and public administration (NAICS 92). Governmental establishments are excluded except for wholesale liquor establishments (NAICS 4228), retail liquor stores (NAICS 44531), Federally-chartered savings institutions (NAICS 522120), Federally-chartered credit unions (NAICS 522130), and hospitals (NAICS 622). Definitions
• The stock data are on a point in time basis (first quarter). • The unit used is the establishment, defined as �a single physical location where business is
conducted or where services or industrial operations are performed.� This is broadly equivalent to the local unit.
• Other units referred to are: o Enterprise - A business organization consisting of one or more domestic establishments
that were specified under common ownership or control. The enterprise and the establishment are the same for single-establishment firms.
o Firm - A business organization consisting of one or more domestic establishments in the same state and industry that were specified under common ownership or control. The firm and the establishment are the same for single-establishment firms. For each multi-establishment firm, establishments in the same industry within a state will be counted as one firm.
• Establishment births are establishments that have zero employment in the first quarter of the initial year and positive employment in the first quarter of the subsequent year.
• Establishment deaths are establishments that have positive employment in the first quarter of the initial year and zero employment in the first quarter of the subsequent year.
b) Title � Firm Size Data Source � US Small Business Administration Internet address � http://www.sba.gov/advo/research/data.html Contents � Counts of the population of firms, births and deaths. Employment data are also available. Breakdowns � Data on the population of firms are broken down by size band (employment) and economic activity. There are no breakdowns of the data on firm births and deaths. Metadata � Extensive metadata are available in the paper �Statistics of U.S. Businesses � Microdata and Tables�, available on the website.

STD/DOC(2006)4
82
Period covered � Data on the population or firms are available for 1988 to 2002. Data on births and deaths are available for 1989 to 2001. Coverage � The coverage is as for source 1 above, as the firm level data are derived from the US Census Bureau establishment-level Statistics of US Businesses. Definitions
• The population counts cover all businesses that had an active payroll at any point during the year, so can be considered as �live during period� data.
• The unit used is the firm, which is defined as �the largest aggregation of business legal entities under common ownership or control�, so corresponds most closely to the European definition of the Enterprise Group (truncated or all-residential rather than global).
• Firm birth and death definitions correspond to those for establishments in source 1 above. c) Title � Business Employment Dynamics, Quarterly Data Source � Bureau of Labor Statistics Internet address � http://www.bls.gov/bdm/home.htm Contents � Counts and rates for establishment openings and closures each quarter. Breakdowns � The data can be broken down by economic activity Metadata � Descriptive metadata and definitions are available via the web site. Period covered � Data are currently available from quarter 3 of 1992 to quarter 4 of 2004 inclusive. Coverage � The data exclude business with no employees, central and local government units, and some non-profit organizations. Certain economic activities are also excluded (religious organizations, some small farms, the Armed Forces and railways). Definitions
• No stock data are given, but these can be estimated from birth counts and rates (or death counts and rates) for the same quarter. These can then be used to calculate annual birth and death rates. Note; Birth and death data give slightly different stock figures, but these are all within the margins of error associated with the use of rounded data, and are unlikely to affect the annual birth and death rate estimates by more than 0.2%.
• The unit used is the establishment, which is broadly equivalent to the local unit. • Openings are either establishments with positive third month employment for the first time in the
current quarter, with no links to the prior quarter, or with positive third month employment in the current quarter following zero employment in the previous quarter.
• Closings are either establishments with positive third month employment in the previous quarter, with no positive employment reported in the current quarter, or with positive third month employment in the previous quarter followed by zero employment in the current quarter.
d) Title � Business Employment Dynamics, Annualised Data Source � Bureau of Labor Statistics

STD/DOC(2006)4
83
Internet address � http://www.bls.gov/opub/mlr/2004/11/art1full.pdf Contents � This paper gives annualised versions of the data in source c) above, by removing businesses that enter and exit within the year, and those entries that are really the continuation of a previous registration. Breakdowns � The data are not broken down in any way. Metadata � The metadata for source c) mostly apply. The paper contains information on the method for annualising the data. Period covered � Data are available for 1998 to 2001 inclusive. Coverage and Definitions � As for source c). e) Title � Longitudinal Business Database Source � US Census Bureau Internet address � http://www.ces.census.gov/ces.php/abstract?paper=101647 Contents � The database contains linked records of establishments and firms over time. It can be used to produce data on business dynamics. The internet address above is that of a paper describing the database, which includes data on births and deaths. A second paper is available with more detailed analyses for the retail sector � see: http://www.ces.census.gov/ces.php/abstract?paper=101704 Breakdowns � The data in the paper are not broken down in any way, but the database would allow a range of detailed breakdowns. Metadata � The paper contains descriptive metadata. Period covered � The paper presents stock, birth and death data for 1976 to 1999. Coverage � The source data cover establishments with paid employees. Economic activity coverage is the same as for source number 1 above. Definitions
• The stock data are on a point in time basis • The unit used is the establishment • Births are records that were active in one year, but not the previous year, adjusted for reactivations • Deaths are records that were active in one year, but not the next, adjusted for reactivations
f) Title � OECD Firm-Level Data Project Source � OECD Internet address � http://www.oecd.org/document/4/0,2340,fr_2649_37451_1962948_1_1_1_37451,00.html

STD/DOC(2006)4
84
Contents � This source contains count and employment data for continuing businesses, entries, exits and �one year� businesses Breakdowns � Data are broken down by economic activity (ISIC 2-digit level). Metadata � The website contains links to various papers containing descriptive metadata on sources, methods and definitions. Period covered � Data for the United States are available from 1989 to 1996. Coverage and Definitions � See the general information on the OECD firm-level data project at the end of this Annex. 31. Brazil One data source available Title � Estatísticas do Cadastro Central de Empresas - 2001 Source � Instituto Brasileiro de Geografia e Estatística (IBGE) Internet address � http://www.ibge.gov.br/home/estatistica/economia/cadastroempresa/2000/Publicacao_completa.pdf http://www.ibge.gov.br/home/estatistica/economia/cadastroempresa/2001/cempre2001.pdf http://www.ibge.gov.br/home/estatistica/economia/cadastroempresa/2002/cempre2002.pdf Contents � Counts of enterprises and local units. The 2001 and 2002 publications also contain data on births and deaths in specific sections on business demography. Breakdowns � Data are broken down by economic activity, size and geography. Metadata � Some descriptive metadata are available within the publications (in Portuguese). See also the paper �Brazilian Enterprise Birth and Death rates by economic activity from 1997 to 2001� at: http://forum.europa.eu.int/Public/irc/dsis/businessurvey/library?l=/2003_rome/sessions7simprovingsbrsc&vm=detailed&sb=Title Period covered � Data on the stock of enterprises are available for 1999 to 2002. Data on births and deaths are available from 1997 to 2002. Coverage � All economic activities and legal forms (including public administration) are covered in the stock figures. The births and deaths for 1997 to 2001 cover �manufacturing� (ISIC sections C + D), �trade� (ISIC section G), and services (ISIC sections H + I + J). Birth and death data for 2002 also include a category of �others� (ISIC sections A + B + E + Q) Definitions
• The stock of enterprises is a point in time estimate at 31 December. • The unit used is referred to as the enterprise, though is equivalent to the legal unit • A birth in a given year is defined by the existence of an enterprise identification number in the
Business Register that was not found in the preceding year

STD/DOC(2006)4
85
• A death is the absence of an enterprise identification number that was found in the previous year • Birth and death rates were calculated dividing the number of births and deaths in each year by the
population of enterprises of the previous year. • The birth and death study has not considered mergers and acquisitions as separate demographic
events. Also, as the business register is mainly based on administrative records, if an enterprise fails to submit an administrative form in a certain year, this can result in a false death followed by a false birth.
32. China Data are being prepared from the 2004 economic census. Start-up rates are provisionally estimated to be between 20% and 30% Some data for corporate registrations in Hong Kong are available at http://www.info.gov.hk/cr/key/index.htm Eurostat Business Demography Indicators Introduction Eurostat have started a project to collect harmonised data on business demography from the Member States of the European Union (EU). Romania and Norway have also participated on a voluntary basis. The first data collections were in 2001, initially on a pilot basis. Data are now available from 1997 to 2003, though not all EU countries have participated, and those that have, have not provided data for all periods. Current data availability is shown in the table below:
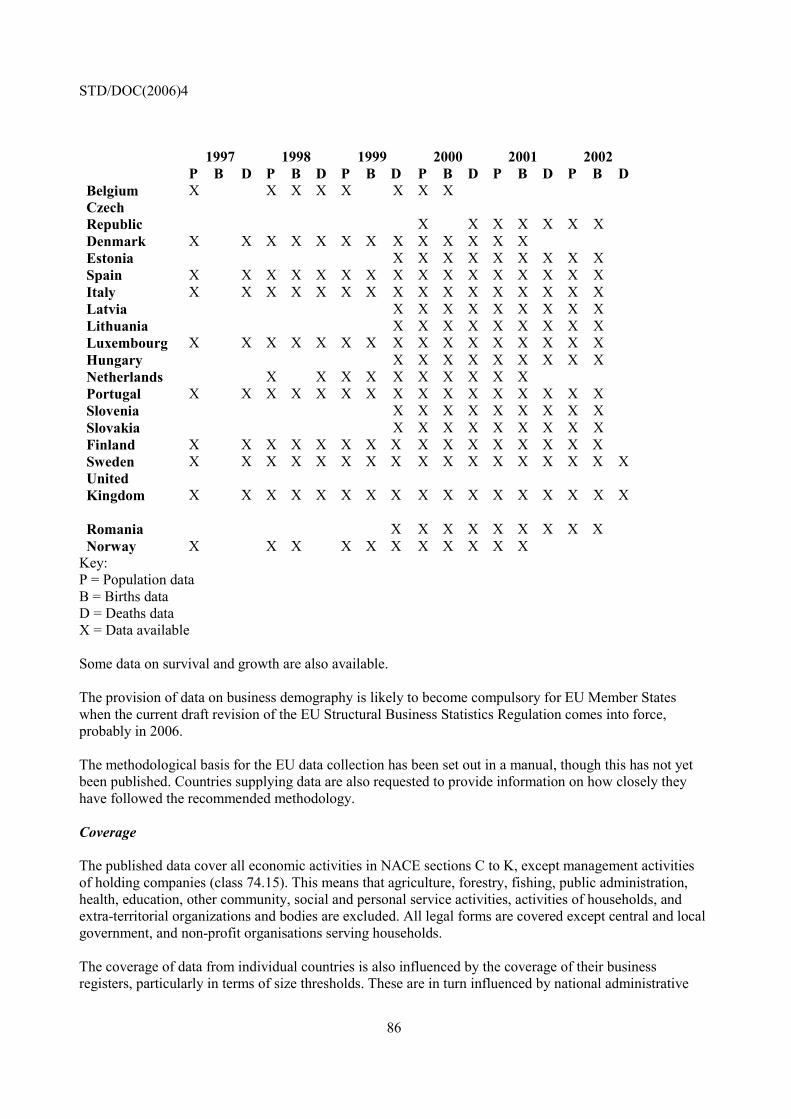
STD/DOC(2006)4
86
1997 1998 1999 2000 2001 2002 P B D P B D P B D P B D P B D P B D Belgium X X X X X X X X Czech Republic X X X X X X X Denmark X X X X X X X X X X X X X Estonia X X X X X X X X X Spain X X X X X X X X X X X X X X X X Italy X X X X X X X X X X X X X X X X Latvia X X X X X X X X X Lithuania X X X X X X X X X Luxembourg X X X X X X X X X X X X X X X X Hungary X X X X X X X X X Netherlands X X X X X X X X X X Portugal X X X X X X X X X X X X X X X X Slovenia X X X X X X X X X Slovakia X X X X X X X X X Finland X X X X X X X X X X X X X X X X Sweden X X X X X X X X X X X X X X X X X United Kingdom X X X X X X X X X X X X X X X X X Romania X X X X X X X X X Norway X X X X X X X X X X X
Key: P = Population data B = Births data D = Deaths data X = Data available Some data on survival and growth are also available. The provision of data on business demography is likely to become compulsory for EU Member States when the current draft revision of the EU Structural Business Statistics Regulation comes into force, probably in 2006. The methodological basis for the EU data collection has been set out in a manual, though this has not yet been published. Countries supplying data are also requested to provide information on how closely they have followed the recommended methodology. Coverage The published data cover all economic activities in NACE sections C to K, except management activities of holding companies (class 74.15). This means that agriculture, forestry, fishing, public administration, health, education, other community, social and personal service activities, activities of households, and extra-territorial organizations and bodies are excluded. All legal forms are covered except central and local government, and non-profit organisations serving households. The coverage of data from individual countries is also influenced by the coverage of their business registers, particularly in terms of size thresholds. These are in turn influenced by national administrative

STD/DOC(2006)4
87
sources, which vary considerably from country to country. For example, the current value-added tax threshold in the United Kingdom is around �85,000, whereas it is zero, or close to zero in most other countries. These differences can be partly offset (as in the UK) by using a range of sources to improve coverage, but they still lead to noticeable differences in data for the smallest size classes. Definitions
• The statistical unit is the enterprise, however, the methodology used recognises that some countries only hold data at the level of the legal unit, and attempts to compensate for this through matching routines.
• The population of active enterprises consists of all enterprises that had either turnover or employment at any time during the reference period, i.e. it is on a �live during period� basis.
• Enterprise births are defined as the creation of a combination of production factors with the restriction that no other enterprises are involved in the event. They include enterprises started by a person who previously performed the same activity, but as an employee, and newly born national or foreign subsidiaries that are real enterprises (legal units rather than just local units or branches) with autonomy of decision making, where new production factors are created, rather than transferred from another unit. The following categories are excluded:
o Enterprises that are created by merging production factors or by splitting them into two (or more) enterprises (break-ups, mergers, split-offs, restructuring)
o Newly created enterprises that simply take over the activity of a previously created enterprise (take-over)
o Any creations of additional legal units/enterprises solely for the purpose of providing a single production factor (e.g. the real estate or personnel) or an ancillary activity (see note below) for an existing enterprise.
o An enterprise that is registered when an existing enterprise changes legal form. E.g. a successful sole proprietor moves operations from his home to another location and at the same time changes the legal form of the enterprise to a limited liability company.
o Reactivated enterprises if they restart activity within 2 calendar years. o Temporary associations and joint ventures that do not involve the creation of new factors
of production. • Enterprise deaths are defined as the dissolution of a combination of production factors with the
restriction that no other enterprises are involved in the event. Events leading to the closure of an enterprise that are not considered to be deaths are:
o Enterprises that close down due to merging or breaking-up of production factors (break-ups, mergers, restructuring)
o Enterprises whose activity is taken over by another enterprise (take-over) o Enterprises that are deleted due to a change of legal form, e.g. a successful sole proprietor
moving operations from his home to another location and at the same time changing the legal form of the enterprise to a limited liability company is a case that should be excluded.
o Reactivated enterprises if they restart activity within 2 calendar years. The DOSME Project Introduction DOSME (Demography of Small and Medium-sized Enterprises) was the name given to a series of projects to develop statistical business registers and data on business demography and factors of success in a group of Central and Eastern European countries. The DOSME projects were financed by the European Union,

STD/DOC(2006)4
88
through Eurostat. Data were collected from samples of new and existing enterprises between 1994 and 2000, and have been consolidated into a single database held by Eurostat. Details of the data collections, methodology and publications from this series of projects are all available on the DOSME web site30. Some of the countries involved have continued the data collections since the end of the project, but most have now started to participate in the Eurostat Business Demography Project. Data are available for Bulgaria, Czech Republic, Estonia, Hungary, Latvia, Lithuania, Poland, Romania, Slovakia and Slovenia for 1995 to 2000. Some data are also available for Albania and Macedonia for earlier periods. Coverage � NACE Rev. 1 sections A, B and L (agriculture, forestry, fishing and public administration) are excluded, as are central and local government units. The data are based on survey results weighted using business register counts to give whole population estimates. This limits the coverage of the final data sets in terms of the availability and quality of detailed breakdowns. Definitions
• The stock data used are point in time estimates, though approximations to �live during period� populations have been possible by adding births during a particular year to the stock at the start of that year.
• The unit used is theoretically the enterprise, but in practice it is usually the legal unit. As the surveys focussed mainly on small units, the impact of this is probably negligible.
• Births and deaths are defined as registrations and de-registrations with the relevant administrative sources. It is recognised that these may be subject to lags, and that some types of businesses were not required to register in certain countries.
The OECD Firm-Level Data Project Introduction The OECD firm-level project involved bringing together data from ten OECD countries (United States, Germany, France, Italy, United Kingdom, Canada, Denmark, Finland, the Netherlands and Portugal). It aimed to use on a common analytical framework, including the harmonisation, to the extent possible, of key concepts (e.g. entry, exit, or the definition of the unit of measurement) as well as the definition of common methodologies for studying firm-level data. The data were used to analyse firm demographics, resulting in a number of papers available via the project web site: http://www.oecd.org/document/4/0,2340,fr_2649_37451_1962948_1_1_1_37451,00.html The data were derived from business registers (Canada, Denmark, France, Finland, Netherlands, United Kingdom and United States) or social security databases (Germany and Italy). Data for Portugal were drawn from an employment-based register containing information on both establishments and firms. These databases allow firms to be tracked through time because addition or removal of firms from the registers (at least in principle) reflects the actual entry and exit of firms.
30 http://forum.europa.eu.int/irc/dsis/dosme/info/data/en/index.htm

STD/DOC(2006)4
89
Coverage While some data sources included even single-person businesses, others omitted firms smaller than a certain size, usually in terms of the number of employees, but sometimes in terms of other measures such as sales (as is the case in the data for France and Italy). Analyses based on the data from this project typically exclude single-person businesses. However, because smaller firms tend to have more volatile firm dynamics, remaining differences in the threshold across different country datasets should be taken into account in the international comparison. The data were compiled on an annual basis, covering varying time spans. The German, Danish and Finnish register data cover the longest time periods, while data for the other countries are available for shorter periods of time or, although available for longer periods, include significant breaks in definitions or coverage. Special efforts were made to organise the data along a common industry classification (ISIC Rev.3). In countries where the data collection by the statistical agency varied across major sector (e.g., construction, industry, services), a firm that switched between major sectors could not be tracked as a continuing firm but ended up creating an exit in one sector and an entry in another. Most countries have been able to provide firm demographic data across most sectors of the economy, with the exception that public services are often not included (the United Kingdom is a special case where data only refer only to manufacturing). Definitions
• Unit of observation: Data used in the study refer to the firm as the unit of reference, with the exception of Germany where data are only available with reference to establishments, and Finland where data are reported with reference to both firms and establishments.
• Firm entry: The number of firms entering a given industry in a given year. It comprises firms observed as (out, in, in) the register in time (t � 1, t, t + 1).
• Firm exit: The number of firms that leave the register. It comprises firms observed as (in, in, out) the register in time (t � 1, t, t + 1).
• Continuing firms: The number of firms that were in the register in a given year, as well as in the previous and subsequent year. It comprises firms observed as (in, in, in) the register in time (t � 1, t, t + 1).
• One-year firms: The number of firms that were present in the register for only one year. It comprises firms observed as (out, in, out) the register in time (t � 1, t, t + 1).

STD/DOC(2006)4
90
Annex 3 - Defining Business Populations: Comparing Point in Time and Live During Period Estimates
1. Introduction The definition of a population of businesses can have a significant impact on any data derived from it. This Annex looks at different ways in which business populations have been defined in terms of the time dimension. It focuses specifically on the role of populations in business start-up rates, but obviously has the potential for wider application. It concludes by proposing a model to help improve the international comparability of business data. The terminology used in this Annex is consistent with that proposed in Annex 1. There are two main approaches to defining business populations with respect to time. A �point in time� population is a relatively simple concept, and consists of all businesses deemed to be in scope at a given point in time, usually on a specific reference day. A �live during period� population, however, consists of all businesses that were in scope at any point during a given reference period. This Annex aims to explain the nature of the differences between these two approaches and look at ways to estimate the impact of using different populations. The focus is on deriving methods to convert data compiled on one basis to provide more comparable estimates. It is clear that a live during period population will be larger than one constructed on a point in time basis. The extent of the difference will depend on various factors, but mainly on the length of the period, and the degree of churn (i.e. joiners and leavers) in the business population. As a result, business start-up data compiled using a point in time population are not likely to be comparable with those based on a live during period approach. Differences in populations compiled using the two approaches are typically in the range of 10% to 15% for annual data. The choice of population can therefore affect start-up rates by up to 2%, with the impact highest when start-up rates themselves are high. This issue is of particular relevance for international comparability purposes, as business demography data from Eurostat are compiled using live during period populations, whereas almost all other sources favour the point in time approach. 2. Components of the population Point in time and live during period populations of businesses can be broken down into a number of components, which can then be re-aggregated in different ways to give different types of population estimates. The basic components are shown in Figure 1 below.

STD/DOC(2006)4
91
Figure 1: A Simple Model for Business Populations
In this model: • PAt = The population at the start of period t • PBt = The population at the end of period t • St = businesses present in both populations (i.e. �survivors�) • Lt = businesses that are in population PAt, but not PBt (i.e. �leavers�) • Jt = businesses that are not in population PAt, but are in Bt (i.e. �joiners�) • JLt = businesses that are not present in PAt or PBt, but would be present in an intermediate population
(i.e. they join and leave within period t) The population of businesses considered in scope at the start of the period (PAt), sometimes referred to as the opening stock, can be defined as: PAt = St + Lt. Similarly the population at the end of the period (PBt), or closing stock, can be defined as: PBt = St + Jt. As PBt = PAt+1, it follows that: PAt = St-1 + Jt-1, PBt = St+1 + Lt+1, and that PBt = PAt + Jt � Lt. Businesses in the sub-set JLt do not appear in either population. Total entries to the population are defined as Et = Jt + JLt, and total exits as Xt = Lt + JLt, so Pt = PAt + Et = PBt + Xt. Thus to convert from a point in time to a live during period population, it is necessary to know, or have reasonable estimates for Et or Xt, or JLt and one of Lt or Jt. In practice, JLt is rarely available from published data sources, and such businesses are usually ignored as they are not present in PAt or PBt, thus there is a risk that Pt could be underestimated. If they are included, data usually take the form of Et and / or Xt so they appear in both, rather than as a separate group. The latter is usually the case in data sets based on population observations at a series of intermediate points between PAt and PBt. The size, and hence the importance of JLt will depend on the length of period t. If t is one month, it is relatively safe to assume that JLt is very small. If PAt and PBt are derived from economic censuses with a five year interval, however, JLt will be much larger. Eurostat �live during period� enterprise survival data covering 48 observations for 18 countries over 4 years show that on average 87.23% of births in a given year are also active in the following year. This indicates that the size of JLt is typically 14.64% of that of Jt, where t is one year. Thus for annual estimates, where data on Jt are available, but data on JLt are not, it would be reasonable to define entries as Et = Jt (1 + 0.1464) and estimate Pt or PAt using: Pt = PAt + Jt (1 + 0.1464). The value of 0.1464 is the best current estimate of the ratio of JLt to Jt, for European Union countries, and will obviously vary over time and space, so this value is replaced by c in the remainder of this Annex.
t
St
Lt Jt
JLt
PAt PBt

STD/DOC(2006)4
92
3. Other Models 3.1 OECD Firm-level Data Project Figure 2: The OECD Firm-level Data project Model
Note � different notation is used in this model: St = Survivors for year t (defined as in / in / in, for t-1 / t / t+1) Xt = Exits for year t (defined as in / in / out, for t-1 / t / t+1) Et = Entries for year t (defined as out / in / in, for t-1 / t / t+1) Ot = One year firms (defined as out / in / out, for t-1 / t / t+1) A point in time approach was used for this data collection project. Firms that entered and exited between observations are not recorded, and �one year firms� are also excluded from most analyses due to data quality concerns. This effectively defines firm entries and exits only in terms of firms that existed for at least one year. This project also took the relatively unusual approach of identifying entries for period t as firms that appeared during the period t-1 to t, whereas exits are defined as those that disappeared between t and t+1.
t -1 t +1 t
St
Ot
Xt-1
Et
Xt
Ot-1
Et+1
Ot+1

STD/DOC(2006)4
93
3.2 Eurostat Business Demography Figure 3: The Eurostat Business Demography Model
Notation: t = Reference year Nt = Population of enterprises active at any point during t Rt = Real births in t Xt = Other entries in t Dt = Real deaths in t Yt = Other exits in t The Eurostat model in Figure 3 is based on the �live during period approach�. This project is ongoing, and will be extended to all European Union (EU) countries following a revision to the EU Structural Business Statistics Regulation. The definitions of the various populations do not take into account the length of survival. A business can be a birth and a death in the same period, and will also be counted in the population of active enterprises for that period. A methodology based on checking for reactivations (within two years), then matching, then manual inspection of large units, is used to separate �real� (i.e. pure) births and deaths from other entries and exits. 3.3 National Data Models A wide variety exists in the models used to define the populations used for national business demography data. Some of the differences are purely down to terminology or notation, and most models can be seen as derivatives of one or more of those presented above. For example, most sources in the United States use models similar to that shown in Figure 1, whereas the Australian model mixes elements from Figure 1 and Figure 3. 4. Purity of Entries and Exits A complicating factor for many population models is that for business demography purposes, it is often of interest to split total entries (Et) and exits (Xt) into a number of sub-components linked to different types of demographic events. A basic distinction for many data users, as seen in the Eurostat model, is to split
t
Nt
Dt
Xt
Rt
Yt
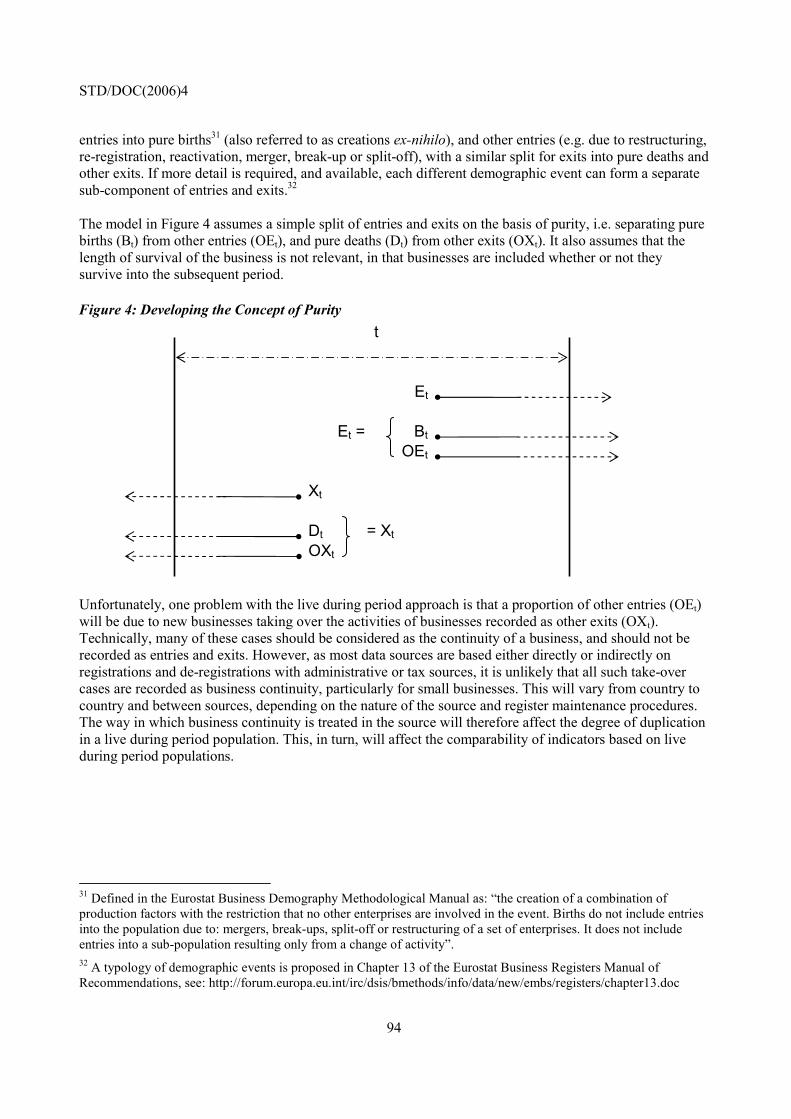
STD/DOC(2006)4
94
entries into pure births31 (also referred to as creations ex-nihilo), and other entries (e.g. due to restructuring, re-registration, reactivation, merger, break-up or split-off), with a similar split for exits into pure deaths and other exits. If more detail is required, and available, each different demographic event can form a separate sub-component of entries and exits.32 The model in Figure 4 assumes a simple split of entries and exits on the basis of purity, i.e. separating pure births (Bt) from other entries (OEt), and pure deaths (Dt) from other exits (OXt). It also assumes that the length of survival of the business is not relevant, in that businesses are included whether or not they survive into the subsequent period. Figure 4: Developing the Concept of Purity
Unfortunately, one problem with the live during period approach is that a proportion of other entries (OEt) will be due to new businesses taking over the activities of businesses recorded as other exits (OXt). Technically, many of these cases should be considered as the continuity of a business, and should not be recorded as entries and exits. However, as most data sources are based either directly or indirectly on registrations and de-registrations with administrative or tax sources, it is unlikely that all such take-over cases are recorded as business continuity, particularly for small businesses. This will vary from country to country and between sources, depending on the nature of the source and register maintenance procedures. The way in which business continuity is treated in the source will therefore affect the degree of duplication in a live during period population. This, in turn, will affect the comparability of indicators based on live during period populations.
31 Defined in the Eurostat Business Demography Methodological Manual as: �the creation of a combination of production factors with the restriction that no other enterprises are involved in the event. Births do not include entries into the population due to: mergers, break-ups, split-off or restructuring of a set of enterprises. It does not include entries into a sub-population resulting only from a change of activity�. 32 A typology of demographic events is proposed in Chapter 13 of the Eurostat Business Registers Manual of Recommendations, see: http://forum.europa.eu.int/irc/dsis/bmethods/info/data/new/embs/registers/chapter13.doc
t
Et
OXt
OEt
Bt
Dt
Xt
= Xt
Et =
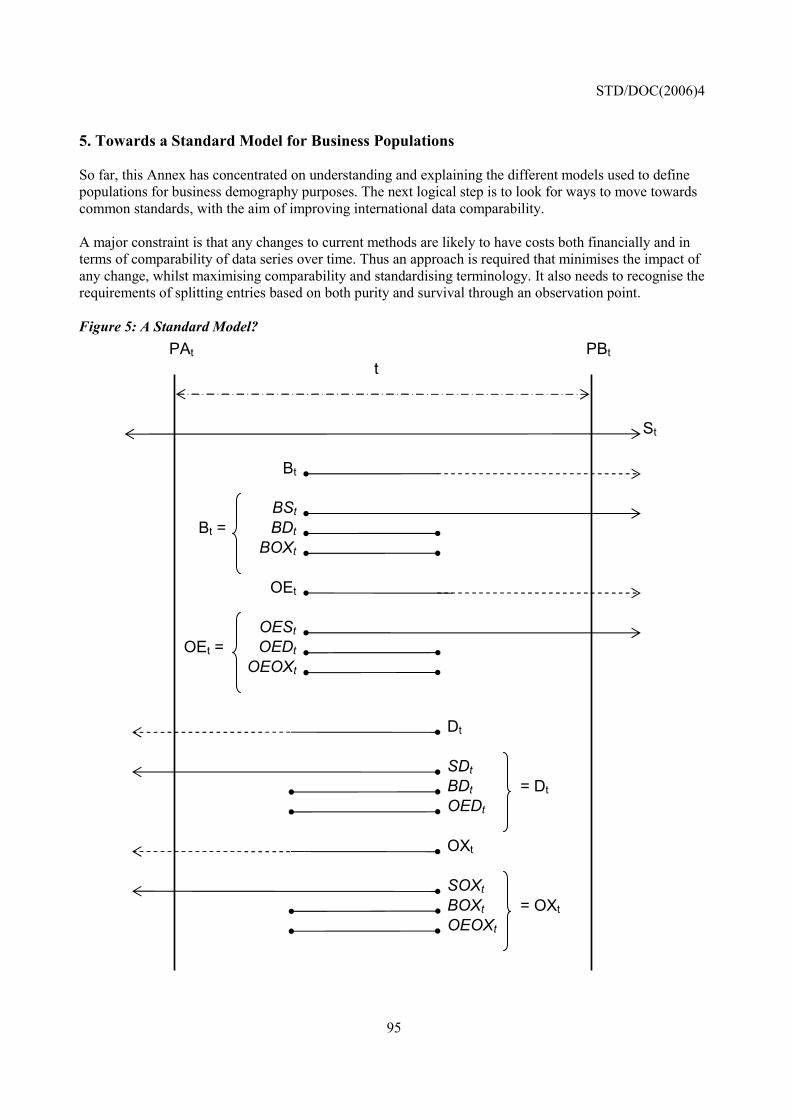
STD/DOC(2006)4
95
5. Towards a Standard Model for Business Populations So far, this Annex has concentrated on understanding and explaining the different models used to define populations for business demography purposes. The next logical step is to look for ways to move towards common standards, with the aim of improving international data comparability. A major constraint is that any changes to current methods are likely to have costs both financially and in terms of comparability of data series over time. Thus an approach is required that minimises the impact of any change, whilst maximising comparability and standardising terminology. It also needs to recognise the requirements of splitting entries based on both purity and survival through an observation point. Figure 5: A Standard Model?
t
St
Dt
OEt
BSt
OXt
PAt PBt
BDt BOXt
OEDt OEOXt
Bt
OESt
SDt
SOXt
Bt =
OEt =
OEDt
BDt = Dt
BOXt
OEOXt = OXt

STD/DOC(2006)4
96
The point in time population at the start of period t (PAt) can be defined by rearranging the equation Pt = PAt + Et from Section 2, to give PAt = Pt � Et. The live during period population (Pt) is defined in the same way as in the Eurostat model (referred to there as Nt). Et gives the total number of new businesses in period t, and is equivalent to Bt + OEt (pure births plus other entries) in Figure 4. Therefore PAt can be defined as PAt = Pt � (Bt + OEt), or using the Eurostat notation, PAt = Nt � (Rt + Xt).33 Eurostat do not currently publish data on Xt, but as this is a by-product of the data production process it is relatively easy to obtain. In this way, consistent measures of PAt can be defined based on data from a wide range of models. PAt can also be defined as the survivors throughout period t plus the leavers in period t that were live in the previous period. From Figure 1; PAt = St + Lt, however, in Figure 5, Lt is split into SDt (survivors from the previous period that were pure deaths in t) and SOXt (survivors from the previous period that were other exits in t), so in terms of Figure 5, PAt = St + SDt + SOXt. Either Pt or PAt can be used as the basis for business demography statistics. The point in time approach (PAt) is currently the more popular of the two, and has the advantages of being a relatively simple concept to explain, and being analogous to the population basis used for human demography statistics. It also largely avoids the potential duplication issues that can affect the comparability of Pt (see Section 4 of this Annex). For these reasons, the use of PAt is recommended, though it should be remembered that it is relatively simple to substitute Pt if required. Having defined a stock population, the next step is to determine the dynamic populations of entries and exits. In Figure 1, the sum of the entries in period t is defined as Jt + JLt (or Jt(1+c)). The total number of entries in period t from Figure 5 is Bt + OEt, which is equivalent to Rt + Xt in the Eurostat notation (Figure 3). Thus a standard measure of entries (Et) can be calculated reasonably easily from all sources. Unfortunately, national factors (e.g. units, sources, coverage, definitions, thresholds etc.), and other movements into and out of scope, can influence total entries, reducing the value of this variable for international comparison purposes. A more comparable variable should be the number of pure births, but this assumes perfect knowledge to separate pure births from other entries. Much progress in developing a standard methodology for this process has been made through the Eurostat business demography project, such that reasonable estimates of Bt, and OEt are now possible for a number of European countries. Figure 5 breaks down Bt and OEt (and the corresponding variables for leavers, Dt and OXt) into three components. Bt can be seen as consisting of businesses that survive into t+1 (BSt), and those that do not. The latter category can be broken down into pure deaths (BDt) and other exits (BOXt). If similar components are derived for OEt, Dt and OXt (note: some components are shared), these components can be re-grouped to form populations Jt (= BSt + OESt), Lt (= SDt + SOXt), and JLt (= BDt + BOXt + OEDt + OEOXt). Similar issues apply to the way the population of leavers is defined. Dt offers purity, and the potential for greater comparability, whereas Lt may be easier to measure in practice. To facilitate data conversion, it will also be necessary to calculate an equivalent to the value c to express JLt as a proportion of Lt. One issue not covered so far is how to deal with reactivations, i.e. businesses that leave a population (by closing temporarily) then re-join it. Recording these as a death followed by a birth does not fit well with the purity approach, particularly if the period of closure is short. For Eurostat business demography
33 The robustness of the relationship described by these equations depends on the extent of duplication in Pt (see the last paragraph of Section 4). The higher the degree of duplication, the less robust the relationships.

STD/DOC(2006)4
97
purposes, a two year threshold is applied, so that periods of closure of less than two years do not result in deaths and births. If the period of temporary closure does not include a point at which the population is observed, i.e. the temporary closure starts and ends between the dates of PAt and PBt, it may not be recorded. This means that, if t is one year, in theory a business can be inactive for over 11 months, yet still be recorded as having survived throughout the period, whereas a business that closes for a few days either side of the PBt reference date would be recorded as a leaver in t, and a joiner in t+1. To improve consistency, a rule that a business has to be out of the population for at least two consecutive observations to be considered a pure death and birth seems reasonable where t is one year. Thus a reactivation that was out of the population for just one period (e.g. PAt) would be included in the populations for other events (SOXt-1, and OESt) rather than those for pure births and deaths. The only real problem with this approach is that it introduces a lag for data on deaths, though this can be at least partially overcome by estimation. For completeness, in addition to the total population, entries and exits, it is useful to determine the population of businesses that survive throughout the period (or are at least present at the start and the end of the period), St. St can be defined simply (from Figure 1) as PBt � Jt. To relate this to the Eurostat populations in Figure 3, it is necessary to refer to PBt as PAt+1, which has been shown above to correspond to Nt+1 � (Rt+1 + Xt+1). Jt has been shown to equal to (Rt + Xt) / (1+c). Thus, by substitution, St = Nt+1 � (Rt+1 + Xt+1) � ((Rt + Xt) / (1+c)). Having derived the various populations of interest, it is useful to note certain logical relationships based on a stock and flow basis, which can be used as a quality check, or to derive a missing population. The basic equation is that opening stock, plus entries, minus exits should equal closing stock: PAt + Et � Xt = PBt (it also follows that PAt + Jt � Lt = PBt). In terms of Figure 5, this equation can also be expressed as PAt + (BSt + OESt) � (SDt + SOXt) = PBt. Having defined the populations referred to above, it is then relatively straightforward to apply them to study business survival and growth rates, though this is beyond the scope of this Annex. The proposed standard model also implies the introduction of harmonised terminology, the various elements of which are defined in Annex 1. 6. Conclusions It seems feasible to apply a standard model for defining business populations that can accept data from a variety of sources using different methodologies. As a result, it should be possible to improve the international comparability of data on business populations, business demography, and small and medium�sized enterprises (SMEs), whilst not imposing significant additional burdens on data suppliers in national statistical institutes. This approach will remove, or at least reduce the impact of a number of the different factors affecting comparability identified in this report. The next logical step is therefore to test the proposed model, and refine it where necessary, using data from as many countries as possible.

STD/DOC(2006)4
98
Annex 4 � Business Start-up Data for Selected Countries: Comparisons of National Sources
Introduction This Annex looks at intra-country comparability of business start-up data for 10 countries for which three or more sources allowing the construction of start-up rates have been identified in the inventory in Annex 2. The purpose of this exercise is to try to explain the differences between sources in terms of the factors of comparability identified in the main body of this report. This work is based on the assumption that any differences in data relating to the same country and the same time period must be purely methodological in nature. To facilitate comparability the data shown have been summarised, and converted to a standard format. This has, in some cases, included the calculation of birth and death rates. 1. Canada Three sources of data on business start-ups have been identified for Canada. a) Business Dynamics in Canada Statistics Canada � Longitudinal Employment Analysis Program (LEAP) Database (supplemented for 2002 by data prepared for FORA). http://www.statcan.ca:8096/bsolc/english/bsolc?catno=61-534-X This publication includes data on business populations, birth and death rates, and survival. It also contains a chapter on methodology. Business populations, births and deaths are broken down by size and economic activity categories based on knowledge intensity. Business populations are also broken down by geography. Population estimates are available for 1991 to 2001 and counts of births are available from 1992 to 2001. Additional data on population and births for 2002, and deaths for 2001 is taken from a short report prepared by Statistics Canada for FORA. The data cover all employers in Canada, public and private (i.e. data do not include businesses with no employees). The unit used is the firm, which, at the national level is equivalent to the legal unit. Births are defined as firms that are not present on the LEAP database in year t-1, but are present in year t. The birth rate is the number of new enterprises in t divided by the total number of firms observed in year t. The data in the publication are protected by copyright, so are not reproduced here. b) Self-Employment Entry and Exit Flows Statistics Canada � Paper by Zhengxi Lin, Garnett Picot and Janice Yates http://www.statcan.ca/english/research/11F0019MIE/11F0019MIE1999134.pdf

STD/DOC(2006)4
99
This paper contains a table with counts of self-employed persons, and rates for entry and exit, as well as other related data, analyses, and descriptive metadata on sources and definitions. No breakdowns of the entry data are given in the paper. The population estimates are available for 1981 to 1995, and entries are available from 1982 to 1995. The data cover all persons whose self-employment earnings are the dominant source of earnings in the year according to their annual tax returns to revenue Canada, but are based on a 10% sample. The unit is therefore the person completing the tax return. Self-employment entries are income-tax filers who report earnings from self-employment in one year but not the previous year.
Population Entries Birth Rate 1981 915,140 1982 931,240 194,750 20.91% 1983 953,350 197,700 20.74% 1984 988,590 208,030 21.04% 1985 990,980 197,280 19.91% 1986 1,019,390 221,760 21.75% 1987 1,069,690 248,630 23.24% 1988 1,099,470 248,370 22.59% 1989 1,125,410 253,710 22.54% 1990 1,159,370 269,500 23.25% 1991 1,191,930 273,190 22.92% 1992 1,253,290 293,330 23.40% 1993 1,334,050 312,620 23.43% 1994 1,400,760 330,810 23.62% 1995 1,471,800 355,940 24.18%
c) OECD Firm-level Data Project http://www.oecd.org/document/4/0,2340,fr_2649_37451_1962948_1_1_1_37451,00.html This project brought together data from ten OECD member countries, using a common analytical framework, based on the harmonisation, as far as possible, of key concepts (e.g. entry, exit, or the definition of the unit of measurement) and methodology. Data for Canada are available for 1984 to 1997. Annual point in time populations were used, based on the Canadian statistical business register. New businesses had to be present in both the reference year and the following year to be counted as a birth in published analyses of the data. �One-year� businesses were identified separately, but have been included as births in the table below to try to improve comparability with other sources. Businesses without employees were excluded

STD/DOC(2006)4
100
Year Population Total Entries Start-up Rate 1984 701,115 128,837 18.38% 1985 729,929 119,424 16.36% 1986 757,980 117,843 15.55% 1987 779,956 116,916 14.99% 1988 781,594 103,998 13.31% 1989 783,415 103,096 13.16% 1990 798,855 121,773 15.24% 1991 796,223 115,662 14.53% 1992 798,215 113,740 14.25% 1993 801,127 114,308 14.27% 1994 808,849 117,512 14.53% 1995 810,336 88,301 14.46% 1996 806,777 92,570 14.72% 1997 825,389 92,686 15.07%
Graphical Comparisons a) Birth Rates
0%
5%
10%
15%
20%
25%
30%
1982
1983
1984
1985
1986
1987
1988
1989
1990
1991
1992
1993
1994
1995
1996
1997
1998
1999
2000
2001
2002
Self-employment Business Dynamics in Canada OECD Firm-level Data Project
The chart shows an apparently high degree of convergence for data from the OECD Firm-level project and Business Dynamics in Canada for the years where the data overlap. As would be expected, birth rates are much higher for self-employment businesses. Data before 1990 show rather more variability, which may be genuine, or may indicate that these data are less reliable.

STD/DOC(2006)4
101
b) New Businesses
0
50
100
150
200
250
300
350
40019
82
1983
1984
1985
1986
1987
1988
1989
1990
1991
1992
1993
1994
1995
1996
1997
1998
1999
2000
2001
2002
Thou
sand
s
Self-employment Business Dynamics in Canada OECD Firm-level Data Project
This chart shows that whilst start-up rates were more or less equivalent for data from the OECD firm-level project, and Business Dynamics in Canada, the levels of new businesses are not so close, though both follow a similar, rather stable trend during the period of overlap. There is no readily apparent explanation for the difference between these sources in the metadata, though it is almost certainly due to different coverage, possibly of the public sector. The number of new self-employed businesses shows a rapid growth during the 1990�s, suggesting that self-employed businesses are becoming increasingly important in Canada. c) Business Populations
0.0
0.2
0.4
0.6
0.8
1.0
1.2
1.4
1.6
1982
1983
1984
1985
1986
1987
1988
1989
1990
1991
1992
1993
1994
1995
1996
1997
1998
1999
2000
2001
2002
Mill
ions
Self-employment Business Dynamics in Canada OECD Firm-level Data Project
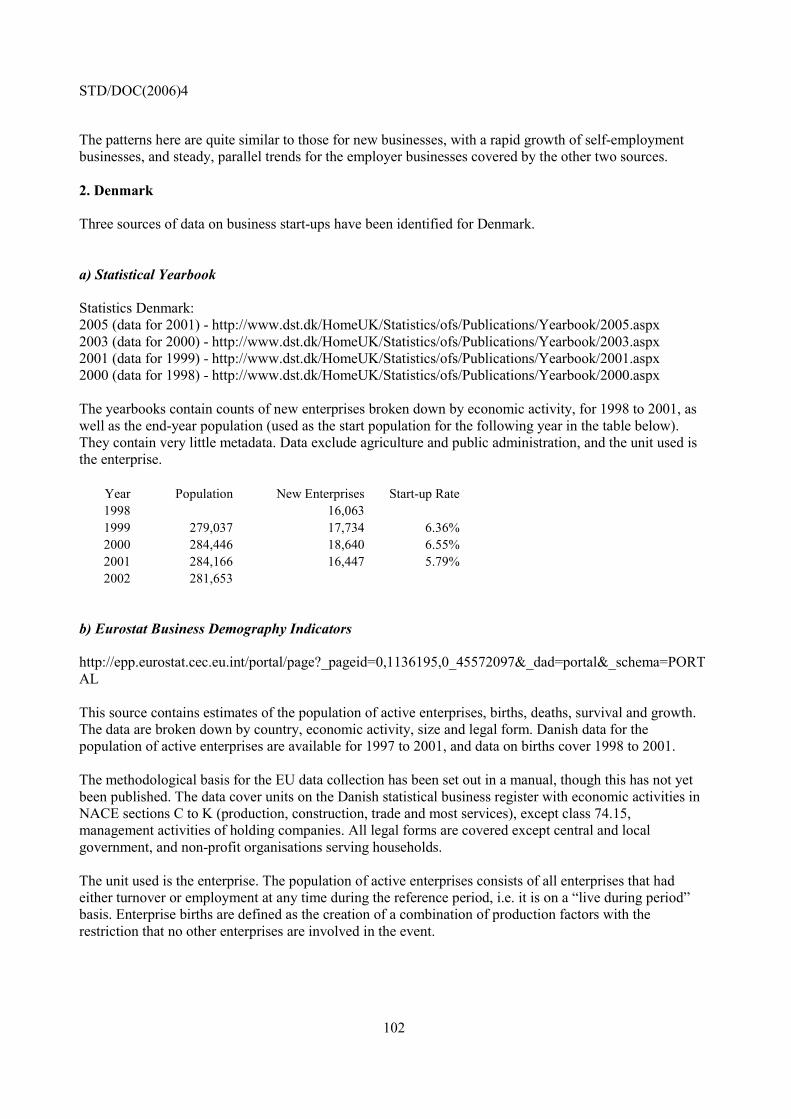
STD/DOC(2006)4
102
The patterns here are quite similar to those for new businesses, with a rapid growth of self-employment businesses, and steady, parallel trends for the employer businesses covered by the other two sources. 2. Denmark Three sources of data on business start-ups have been identified for Denmark. a) Statistical Yearbook Statistics Denmark: 2005 (data for 2001) - http://www.dst.dk/HomeUK/Statistics/ofs/Publications/Yearbook/2005.aspx 2003 (data for 2000) - http://www.dst.dk/HomeUK/Statistics/ofs/Publications/Yearbook/2003.aspx 2001 (data for 1999) - http://www.dst.dk/HomeUK/Statistics/ofs/Publications/Yearbook/2001.aspx 2000 (data for 1998) - http://www.dst.dk/HomeUK/Statistics/ofs/Publications/Yearbook/2000.aspx The yearbooks contain counts of new enterprises broken down by economic activity, for 1998 to 2001, as well as the end-year population (used as the start population for the following year in the table below). They contain very little metadata. Data exclude agriculture and public administration, and the unit used is the enterprise.
Year Population New Enterprises Start-up Rate 1998 16,063 1999 279,037 17,734 6.36% 2000 284,446 18,640 6.55% 2001 284,166 16,447 5.79% 2002 281,653
b) Eurostat Business Demography Indicators http://epp.eurostat.cec.eu.int/portal/page?_pageid=0,1136195,0_45572097&_dad=portal&_schema=PORTAL This source contains estimates of the population of active enterprises, births, deaths, survival and growth. The data are broken down by country, economic activity, size and legal form. Danish data for the population of active enterprises are available for 1997 to 2001, and data on births cover 1998 to 2001. The methodological basis for the EU data collection has been set out in a manual, though this has not yet been published. The data cover units on the Danish statistical business register with economic activities in NACE sections C to K (production, construction, trade and most services), except class 74.15, management activities of holding companies. All legal forms are covered except central and local government, and non-profit organisations serving households. The unit used is the enterprise. The population of active enterprises consists of all enterprises that had either turnover or employment at any time during the reference period, i.e. it is on a �live during period� basis. Enterprise births are defined as the creation of a combination of production factors with the restriction that no other enterprises are involved in the event.

STD/DOC(2006)4
103
Year Population Births Birth Rate 1997 243,946 1998 245,762 24,755 10.07% 1999 253,887 27,562 10.86% 2000 261,911 26,137 9.98% 2001 261,926 24,275 9.27%
c) OECD Firm-Level Data Project http://www.oecd.org/document/4/0,2340,fr_2649_37451_1962948_1_1_1_37451,00.html This project brought together data from ten OECD member countries, using a common analytical framework, based on the harmonisation, as far as possible, of key concepts (e.g. entry, exit, or the definition of the unit of measurement) and methodology. Data for Denmark are available for 1981 to 1994. Annual point in time populations were used, taken at the end of November each year from the Danish pay and performance database. New businesses had to be present in both the reference year and the following year to be counted as a birth in published analyses of the data. �One-year� businesses were identified separately, but have been included as births in the table below to try to improve comparability with other sources. Businesses without employees were excluded
Year Population Total Entries Start-up Rate 1981 136512 21334 15.63% 1982 136373 18148 13.31% 1983 137585 18162 13.20% 1984 139760 18414 13.18% 1985 140914 17961 12.75% 1986 138496 13609 9.83% 1987 140826 16054 11.40% 1988 138772 15491 11.16% 1989 136380 14099 10.34% 1990 135448 14857 10.97% 1991 133565 15420 11.54% 1992 132187 14778 11.18% 1993 126070 13282 10.54% 1994 126113 12567 9.96%

STD/DOC(2006)4
104
Graphical Comparisons a) Birth Rates
0%
2%
4%
6%
8%
10%
12%
14%
16%
18%
1981
1982
1983
1984
1985
1986
1987
1988
1989
1990
1991
1992
1993
1994
1995
1996
1997
1998
1999
2000
2001
OECD Firm-level Data Statistical Yearbook Eurostat Business Demography
All sources seem to indicate a downwards trend in birth rates over time. The difference between the data from the Statistical Yearbook and those from Eurostat is not easy to explain based on the available metadata, but may be related to coverage. b) New Businesses
0
5
10
15
20
25
30
1981
1982
1983
1984
1985
1986
1987
1988
1989
1990
1991
1992
1993
1994
1995
1996
1997
1998
1999
2000
2001
Thou
sand
s
OECD Firm-level Data Statistical Yearbook Eurostat Business Demography
The number of new businesses in the OECD firm-level data set is generally lower than the other sources due to the exclusion of non-employer businesses, and of new businesses that did not survive for at least a year. Again the data from Eurostat are higher than those from the statistical Yearbook, which is not easy to

STD/DOC(2006)4
105
explain given the greater restrictions of the Eurostat data in terms of coverage of economic activity, as well as the requirements for a relatively high level of purity in this source. c) Business Populations
0
50
100
150
200
250
300
1981
1982
1983
1984
1985
1986
1987
1988
1989
1990
1991
1992
1993
1994
1995
1996
1997
1998
1999
2000
2001
2002
Thou
sand
s
OECD Firm-level Data Statistical Yearbook Eurostat Business Demography
The one employee threshold used for the OECD firm-level data clearly has an impact on the population, appearing to remove around half of the units included in the other sources. Interestingly, the Statistical Yearbook data show higher population levels than those from Eurostat. This appears to be rather counter-intuitive compared to the number of new businesses. The Eurostat population would normally be expected to be larger as it is on a live during period basis, but the impact of this seems to be outweighed by the relatively limited coverage of economic activities. 3. Finland Three sources of data on business start-ups have been identified for Finland. a) Enterprise Openings and Closures Statistics Finland � http://www.stat.fi/til/aly/index_en.html, Data only accessible via Finnish version - http://www.stat.fi/til/aly/index.html This source contains counts of enterprise openings and closures. Stock figures are available separately from the StatFin database, but may not have the same coverage. The data are broken down by economic activity, legal form and geography, and are available for 1999 to 2004. Some metadata are available, mostly in Finnish. The openings data are derived from Statistics Finland�s business register. They only cover those enterprises engaged in business activity that are liable to pay value-added tax or act as employers. Foundations, housing companies, voluntary associations, public authorities and religious communities are excluded. The data cover state-owned enterprises, but not those owned by municipalities. The unit used is the enterprise

STD/DOC(2006)4
106
Year Stock Openings Birth Rate 1999 219,516 21,460 9.78% 2000 222,817 22,361 10.04% 2001 224,847 21,942 9.76% 2002 226,593 22,190 9.79% 2003 228,422 23,886 10.46% 2004 253,617 24,756 9.76%
b) Eurostat Business Demography Indicators http://epp.eurostat.cec.eu.int/portal/page?_pageid=0,1136195,0_45572097&_dad=portal&_schema=PORTAL This source contains estimates of the population of active enterprises, births, deaths, survival and growth. The data are broken down by country, economic activity, size and legal form. Finnish data for the population of active enterprises exist for 1997 to 2002 and data on births cover 1998 to 2002. The methodological basis for the EU data collection has been set out in a manual, though this has not yet been published. The data cover units on the Finnish statistical business register with economic activities in NACE sections C to K (production, construction, trade and most services), except class 74.15, management activities of holding companies. All legal forms are covered except central and local government, and non-profit organisations serving households. The unit used is the enterprise. The population of active enterprises consists of all enterprises that had either turnover or employment at any time during the reference period, i.e. it is on a �live during period� basis. Enterprise births are defined as the creation of a combination of production factors with the restriction that no other enterprises are involved in the event.
Year Population Births Birth Rate 1997 229,786 1998 234,521 19,659 8.38% 1999 233,380 17,581 7.53% 2000 233,451 16,614 7.12% 2001 235,746 16,841 7.14% 2002 237,065 17,174 7.24%
c) OECD Firm-Level Data Project http://www.oecd.org/document/4/0,2340,fr_2649_37451_1962948_1_1_1_37451,00.html This project brought together data from ten OECD member countries, using a common analytical framework, based on the harmonisation, as far as possible, of key concepts (e.g. entry, exit, or the definition of the unit of measurement) and methodology. Data for Finland are available for 1989 to 1997. Annual point in time populations were used, taken from the Finnish statistical business register. The coverage of the register improved in 1994 for smaller enterprises, which may account for at least part of the peak in birth rates in 1994/5. New businesses had to be present in both the reference year and the following year to be counted as a birth in published analyses of the data. �One-year� businesses were

STD/DOC(2006)4
107
identified separately, but have been included as births in the table below to try to improve comparability with other sources. Businesses without employees were excluded.
Year Population Total Entry Start-up Rate 1989 231,311 46,791 20.23% 1990 252,426 30,207 11.97% 1991 210,501 17,271 8.20% 1992 209,982 25,745 12.26% 1993 179,549 17,961 10.00% 1994 176,804 21,830 12.35% 1995 194,092 25,018 12.89% 1996 202,085 18,883 9.34% 1997 207,008 14,991 7.24%
Graphical Comparisons a) Birth Rates
0%
5%
10%
15%
20%
25%
1989
1990
1991
1992
1993
1994
1995
1996
1997
1998
1999
2000
2001
2002
2003
2004
Eurostat Business Demography Enterprise Openings and Closures OECD Firm-level Data
The Enterprise Openings and Closures data show a fairly similar trend to those from Eurostat during the period of overlap. The higher levels of the former are likely to be due mainly to the use of a point in time population, and the greater purity of the Eurostat data. The fluctuations in the OECD firm-level data look odd compared to the relative smoothness of the other two series. This may be partly due to the turbulence in the Finnish economy in the early 1990�s, but it also seems likely that there is rather a lot of �noise� in the data.
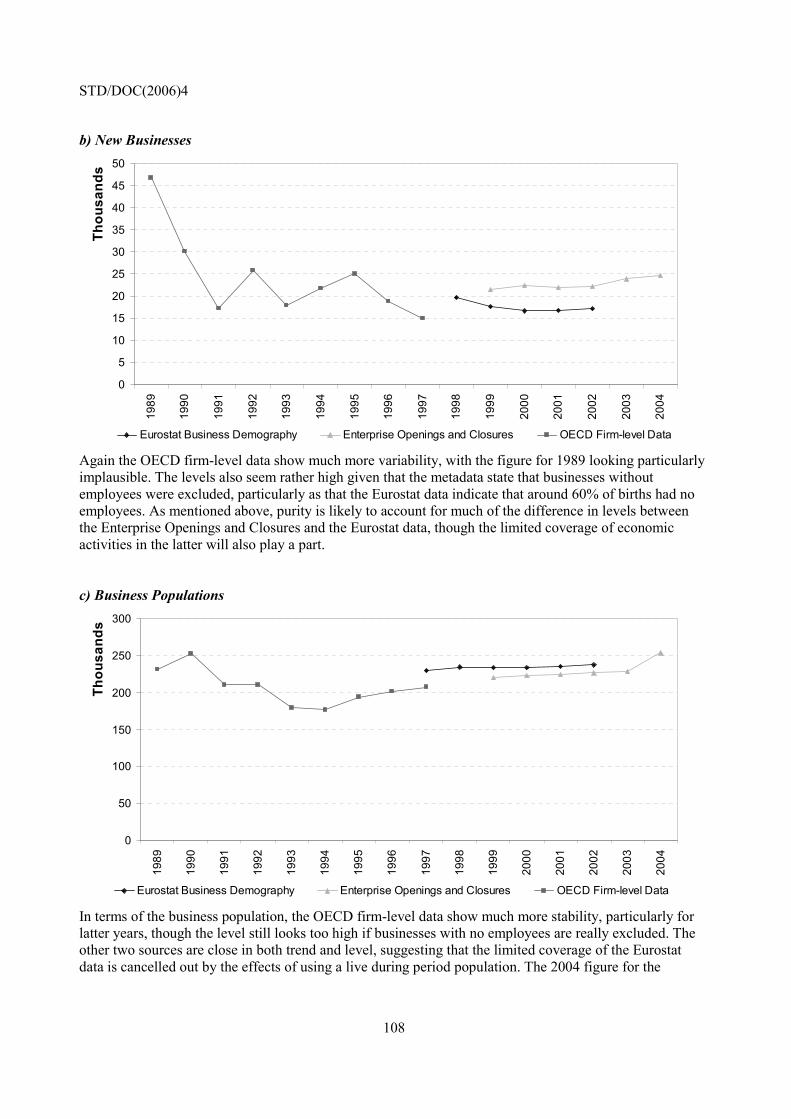
STD/DOC(2006)4
108
b) New Businesses
0
5
10
15
20
25
30
35
40
45
5019
89
1990
1991
1992
1993
1994
1995
1996
1997
1998
1999
2000
2001
2002
2003
2004
Thou
sand
s
Eurostat Business Demography Enterprise Openings and Closures OECD Firm-level Data
Again the OECD firm-level data show much more variability, with the figure for 1989 looking particularly implausible. The levels also seem rather high given that the metadata state that businesses without employees were excluded, particularly as that the Eurostat data indicate that around 60% of births had no employees. As mentioned above, purity is likely to account for much of the difference in levels between the Enterprise Openings and Closures and the Eurostat data, though the limited coverage of economic activities in the latter will also play a part. c) Business Populations
0
50
100
150
200
250
300
1989
1990
1991
1992
1993
1994
1995
1996
1997
1998
1999
2000
2001
2002
2003
2004
Thou
sand
s
Eurostat Business Demography Enterprise Openings and Closures OECD Firm-level Data
In terms of the business population, the OECD firm-level data show much more stability, particularly for latter years, though the level still looks too high if businesses with no employees are really excluded. The other two sources are close in both trend and level, suggesting that the limited coverage of the Eurostat data is cancelled out by the effects of using a live during period population. The 2004 figure for the

STD/DOC(2006)4
109
Enterprise Openings and Closures data looks rather high, and represents a significant deviation from the trend. Unfortunately it is too early to tell whether or not it will be confirmed by the Eurostat data. 4. France Three sources of data on business start-ups have been identified for France a) Créations d'entreprises INSEE: http://www.insee.fr/fr/ffc/chifcle_liste.asp?theme=9&soustheme=1&souspop= This source contains counts of enterprise creations, split into new creations, resumptions and re-activations, as well as some population data. Data are broken down by economic activity, size and legal form. Some metadata are available, for example key definitions. Data are available from 1993 to 2004, and cover all of France, including the overseas départements. Three categories of enterprise creation are identified:
• Pure creations (creations �ex nihilo�) where the new enterprise does not take over the activities of a previously existing enterprise.
• Reactivations, where a person who has previously been self-employed re-starts a self-employed activity.
• Resumptions, where a new business takes over an activity previously carried out by another enterprise.
Year Stock Creations Creation Rate Pure Creations Pure Creation Rate 1993 2,307,638 272,264 11.80% 169,620 7.35% 1994 292,847 1995 283,608 1996 273,811 170,233 1997 269,430 165,277 1998 264,601 1999 266,919 2000 270,043 174,718 2001 2,417,950 268,619 11.11% 175,140 7.24% 2002 2,468,786 268,459 10.87% 176,378 7.14% 2003 2,498,082 291,986 11.69% 197,675 7.91% 2004 2,568,647 318,757 12.41% 222,747 8.67%
b) La Création en Chiffres Agence Pour la Création d�Entreprises (APCE): http://www.apce.com/index.php?rubrique_id=261&type_page=I This source contains counts of enterprise creations, split into new creations (�ex nihilo�), resumptions and re-activations. No breakdowns are given, and metadata are very limited. Data are available from 1993 to 2004, and are very similar to, but slightly higher than those from INSEE, perhaps suggesting a slight timing or coverage difference.

STD/DOC(2006)4
110
Year Total Creations Creations Ex Nihilo 1993 273,462 170,919 1994 294,131 183,764 1995 284,853 178,923 1996 275,275 171,628 1997 271,088 166,850 1998 266,446 166,190 1999 268,919 169,674 2000 272,072 176,754 2001 270,564 177,015 2002 270,206 178,008 2003 293,840 199,399 2004 320,265 223,995
c) OECD Firm-Level Data Project http://www.oecd.org/document/4/0,2340,fr_2649_37451_1962948_1_1_1_37451,00.html This project brought together data from ten OECD member countries, using a common analytical framework, based on the harmonisation, as far as possible, of key concepts (e.g. entry, exit, or the definition of the unit of measurement) and methodology. Data for France are available for 1990 to 1996. Annual point in time populations were used, taken at the end of the year from a fiscal database and an enterprise survey. New businesses had to be present in both the reference year and the following year to be counted as a birth in published analyses of the data. �One-year� businesses were identified separately, but have been included as births in the table below to try to improve comparability with other sources. Manufacturing businesses with an annual turnover of less than 3.8 million French Francs, and service businesses with a turnover of less than 1.1 million French Francs are excluded.
Year Population Total Entry Start-up Rate 1990 474,118 100,596 21.22% 1991 477,666 66,814 13.99% 1992 505,580 77,098 15.25% 1993 488,757 68,424 14.00% 1994 516,730 90,544 17.52% 1995 505,871 58,727 11.61% 1996 493,432 50,560 10.25%

STD/DOC(2006)4
111
Graphical Comparisons a) Birth Rates
0%
5%
10%
15%
20%
25%
1990
1991
1992
1993
1994
1995
1996
1997
1998
1999
2000
2001
2002
2003
2004
OECD Firm-level Data SIRENE Creations SIRENE Pure Creations The SIRENE data clearly show the impact of correcting for purity when the other comparability factors are held constant. The pure creation rate is consistently almost 4% lower than the total creation rate. As with other countries there is considerable variability in the start-up rate from the OECD firm-level data, and for the one year of overlap, 1993, the rate is higher than that for the SIRENE data. This could be a result of the high turnover threshold used for French data in this source. b) New Businesses
0
50
100
150
200
250
300
350
1990
1991
1992
1993
1994
1995
1996
1997
1998
1999
2000
2001
2002
2003
2004
Thou
sand
s
OECD Firm-level Data SIRENE Creations SIRENE Pure CreationsAPCE Creations APCE Creations "ex nihilo"

STD/DOC(2006)4
112
For this chart, it is possible to add the APCE Creations data. As can be seen, the APCE data very closely follow those from SIRENE, such that the APCE creations �ex nihilo� seems to be a good indicator for the missing variables in the SIRENE pure creations series. For the four years of overlap, the trend followed by the OECD firm-level data seems reasonably correlated to those of the other sources, with the difference in levels clearly attributable to the threshold in the OECD data. c) Business Populations
0.0
0.5
1.0
1.5
2.0
2.5
3.0
1990
1991
1992
1993
1994
1995
1996
1997
1998
1999
2000
2001
2002
2003
2004
Mill
ions
OECD Firm-level Data SIRENE This chart is less interesting given the lack of overlap. Both sources follow a stable to slightly rising trend, and the clear impact of the threshold in the OECD data is again visible. 5. Germany Three sources of data on business start-ups have been identified for Germany a) Business Notifications Federal Statistics Office, Germany: http://www.destatis.de/themen/e/thm_unternehmen.htm This source contains data on business registrations, modifications and de-registrations, as well as counts of the stock of businesses liable to pay turnover tax. Registration data are available for 2001 to 2003. Data on the population of businesses liable for tax are available for 2002 and 2003. The data are broken down by economic activity. Some descriptive metadata are available via the website. The data on new registrations are assumed to cover the whole economy. The population of businesses liable to pay turnover tax covers businesses with a

STD/DOC(2006)4
113
turnover of at least �16,620 per year. Most economic activities are covered, with the exception of certain health, public administration, insurance, and agricultural activities. The unit for registrations and de-registrations is effectively the local unit as �the obligation to report business registrations and de-registrations applies to enterprises, branch offices and dependent sub-offices�. Registration is required when a new activity is started or a business is taken over, be it through purchase or succession, a partner entering the business, a change in legal form, or a relocation of the business to a different registration district. Thus quite a high proportion of registrations will not be pure births.
Year Population Business Registrations Birth Rate 2001 728,978 2002 2,926,570 723,333 24.72% 2003 2,915,482 810,706 27.81%
b) Start-ups and Liquidations in Germany Institut für Mittelstandsforschung (IfM), Bonn: http://www.ifm-bonn.org/dienste/gruendungen-engl.htm This source contains counts of business start-ups and liquidations based on notifications of new businesses. The data are adjusted to remove new sites of existing businesses, registrations purely for tax or administrative purposes that do not result in new business activity, and registrations for activities carried out as a second job by the entrepreneur. Enterprise population totals for some years are available in Table 1 of: http://www.ifm-bonn.org/dienste/kap-2.pdf. These do not provide a full series, but IfM have been able to provide additional data (1992, 2000 � 2003) or suggest appropriate approximations (1991, 1993 and 1995) to fill the gaps. The start-up data are broken down into the former East and West Germany, and are available for 1991 to 2004. The population of businesses is subject to a threshold (�17,500 since 2003), and covers all economic activities except the �liberal professions�34, most health services and some insurance services that are not subject to VAT. The units used are effectively the sub-set of legal unit that are considered to be economically relevant.
34 The liberal professions can generally be defined as occupations requiring special training in the arts or sciences. These include lawyers, notaries, accountants, architects, engineers and pharmacists.

STD/DOC(2006)4
114
Year Population Start-ups Birth Rate 1991 2,572,202 531,000 20.64% 1992 2,631,812 494,000 18.77% 1993 2,709,443 486,000 17.94% 1994 2,787,074 493,000 17.69% 1995 2,775,000 528,000 19.03% 1996 2,762,925 507,000 18.35% 1997 2,797,759 507,100 18.13% 1998 2,859,983 512,800 17.93% 1999 2,886,268 493,100 17.08% 2000 2,909,150 471,700 16.21% 2001 2,920,293 454,700 15.57% 2002 2,926,570 451,800 15.44%
2003 2,915,482 507,900 15.54% 2004 572,600
c) OECD Firm-Level Data Project http://www.oecd.org/document/4/0,2340,fr_2649_37451_1962948_1_1_1_37451,00.html This project brought together data from ten OECD member countries, using a common analytical framework, based on the harmonisation, as far as possible, of key concepts (e.g. entry, exit, or the definition of the unit of measurement) and methodology. Data, which cover only the former West Germany, are available for 1978 to 1998, though data on entries for 1978 are clearly incomplete. Annual point in time populations were used, taken from a social security database. The unit used is referred to as the �plant�, thus is likely to be closer to the definition of the local unit than to that of the enterprise. Only businesses with one or more employees are included, and certain public sector units are considered out of scope. New businesses had to be present in both the reference year and the following year to be counted as a birth in published analyses of the data. �One-year� businesses were identified separately, but have been included within �Total Entry� in the table below to try to improve comparability with other sources.
Year Population Total Entry Start-up
Rate Year Population Total Entry Start-up
Rate 1978 1,320,297 2,292 0.17% 1989 1,503,586 172,989 11.51% 1979 1,339,660 160,550 11.98% 1990 1,503,757 162,153 10.78% 1980 1,369,687 161,363 11.78% 1991 1,539,597 183,197 11.90% 1981 1,384,396 159,594 11.53% 1992 1,572,557 183,180 11.65% 1982 1,399,054 162,219 11.59% 1993 1,589,724 180,054 11.33% 1983 1,405,631 165,856 11.80% 1994 1,602,366 174,098 10.87% 1984 1,418,422 153,286 10.81% 1995 1,618,343 175,963 10.87% 1985 1,436,305 168,097 11.70% 1996 1,626,563 172,455 10.60% 1986 1,448,569 166,603 11.50% 1997 1,632,956 175,693 10.76% 1987 1,449,059 169,702 11.71% 1998 1,638,470 182,290 11.13% 1988 1,470,122 177,681 12.09%

STD/DOC(2006)4
115
Graphical Comparisons a) Birth Rates
0%
5%
10%
15%
20%
25%
30%
1978
1979
1980
1981
1982
1983
1984
1985
1986
1987
1988
1989
1990
1991
1992
1993
1994
1995
1996
1997
1998
1999
2000
2001
2002
2003
2004
OECD Firm-level Data Start-ups and Liquidations in Germany Business Notifications
There is clearly a problem with the OECD Firm-level Data for 1978, otherwise this series seems quite stable over time. The IfM Start-ups and Liquidations data show consistently higher start-up rates. This is to be expected as they include non-employer businesses (subject to a turnover threshold), which generally have higher entry and exit rates than employer businesses. It is also possible that the coverage of the former East Germany in the IfM data may also contribute to higher start-up rates, as it has been observed in the Eurostat business demography project that start-up rates are slightly higher in the former communist countries of Eastern and Central Europe than they are in Western Europe. The Business Notifications data have even higher rates. The reasons for this are likely to be due to the units used (local units rather than enterprises), and that many of the apparent start-ups are really re-registrations of existing business activities. b) New Businesses
0
100
200
300
400
500
600
700
800
900
1978
1979
1980
1981
1982
1983
1984
1985
1986
1987
1988
1989
1990
1991
1992
1993
1994
1995
1996
1997
1998
1999
2000
2001
2002
2003
2004
Thou
sand
s
OECD Firm-level Data Start-ups and Liquidations in Germany Business Notifications

STD/DOC(2006)4
116
The exclusion of non-employer businesses, and businesses in the former East Germany, is clearly apparent in the OECD Firm-level data in this chart. The IfM data show a little more variability over time. This could be due to non-employer business patterns showing a greater responsiveness to the economic cycle, though there is no hard evidence for this theory. Again the Business Notifications data show the highest levels reflecting the units used and the inclusion of many re-registrations. c) Business Populations
0.0
0.5
1.0
1.5
2.0
2.5
3.0
3.5
1978
1979
1980
1981
1982
1983
1984
1985
1986
1987
1988
1989
1990
1991
1992
1993
1994
1995
1996
1997
1998
1999
2000
2001
2002
2003
2004
Mill
ions
OECD Firm-level Data Start-ups and Liquidations in Germany Business Notifications
The OECD Firm-level and IfM data sets show a very consistent and slowly rising trend, though the level of the former is low due to the coverage and threshold limitations. Unfortunately the shortness of the Business Notifications series limits the conclusions that can be drawn about this source, though the population estimates are the same as those provided by IfM for the two years available. 6. Hungary Three sources of data on business start-ups have been identified for Hungary. a) Enterprises and Non-profit Organisations Hungarian Central Statistical Office: http://portal.ksh.hu/portal/page?_pageid=38,341368&_dad=portal&_schema=PORTAL This source contains annual point in time (end year) counts of registered economic corporations and unincorporated enterprises, as well as quarterly counts of new registrations. Both are broken down by legal form, the population data are also broken down by economic activity. Data on new registrations are available from 2001 to 2004. The data cover all businesses that hold an active registration and tax number in the administrative register, including most government bodies. There is no registration threshold in Hungary, so part-time businesses are included. Approximately 75% of registrations are considered to be economically active by the Hungarian statistical office. All economic activities are covered, though NACE division L (public administration) is excluded from the counts broken down by activity. The unit is referred to as the enterprise, but the definition is currently closer to that of a legal unit.
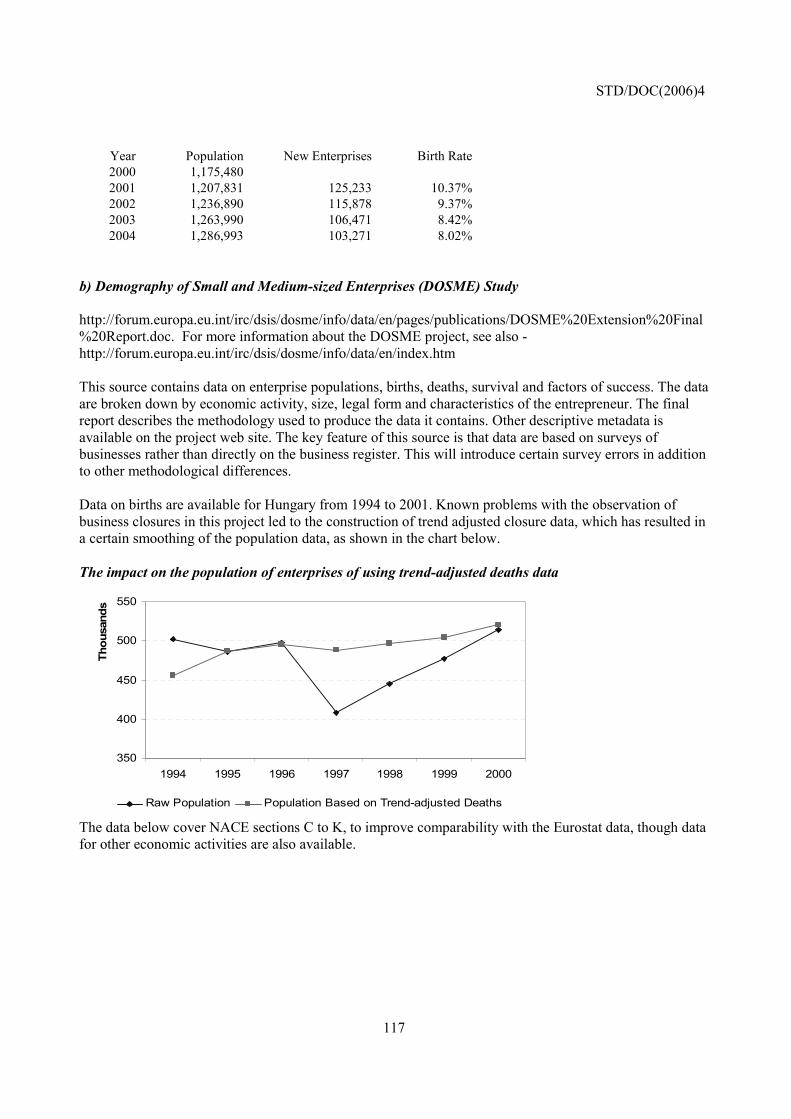
STD/DOC(2006)4
117
Year Population New Enterprises Birth Rate 2000 1,175,480 2001 1,207,831 125,233 10.37% 2002 1,236,890 115,878 9.37% 2003 1,263,990 106,471 8.42% 2004 1,286,993 103,271 8.02%
b) Demography of Small and Medium-sized Enterprises (DOSME) Study http://forum.europa.eu.int/irc/dsis/dosme/info/data/en/pages/publications/DOSME%20Extension%20Final%20Report.doc. For more information about the DOSME project, see also - http://forum.europa.eu.int/irc/dsis/dosme/info/data/en/index.htm This source contains data on enterprise populations, births, deaths, survival and factors of success. The data are broken down by economic activity, size, legal form and characteristics of the entrepreneur. The final report describes the methodology used to produce the data it contains. Other descriptive metadata is available on the project web site. The key feature of this source is that data are based on surveys of businesses rather than directly on the business register. This will introduce certain survey errors in addition to other methodological differences. Data on births are available for Hungary from 1994 to 2001. Known problems with the observation of business closures in this project led to the construction of trend adjusted closure data, which has resulted in a certain smoothing of the population data, as shown in the chart below. The impact on the population of enterprises of using trend-adjusted deaths data
350
400
450
500
550
1994 1995 1996 1997 1998 1999 2000
Thou
sand
s
Raw Population Population Based on Trend-adjusted Deaths
The data below cover NACE sections C to K, to improve comparability with the Eurostat data, though data for other economic activities are also available.
STD/DOC(2006)4
118
Year Population Births Birth Rate 1994 456,376 96,654 21.18% 1995 486,975 87,193 17.91% 1996 495,722 63,805 12.87% 1997 488,747 46,993 9.61% 1998 497,401 61,777 12.42% 1999 504,922 59,953 11.87% 2000 520,505 67,432 12.96%
c) Eurostat Business Demography Indicators http://epp.eurostat.cec.eu.int/portal/page?_pageid=0,1136195,0_45572097&_dad=portal&_schema=PORTAL This source contains estimates of the population of active enterprises, births, deaths, survival and growth. The data are broken down by country, economic activity, size and legal form. Hungarian data are available for 2000 to 2002. The methodological basis for the EU data collection has been set out in a manual, though this has not yet been published. The data cover units on the Hungarian statistical business register with economic activities in NACE sections C to K (production, construction, trade and most services), except class 74.15, management activities of holding companies. All legal forms are covered except central and local government, and non-profit organisations serving households. The unit used is the enterprise. The population of active enterprises consists of all enterprises that had either turnover or employment at any time during the reference period, i.e. it is on a �live during period� basis. Enterprise births are defined as the creation of a combination of production factors with the restriction that no other enterprises are involved in the event.
Year Population Births Birth Rate 2000 526,553 71,395 13.56% 2001 542,288 68,963 12.72% 2002 576,609 83,817 14.54%

STD/DOC(2006)4
119
Graphical Comparisons a) Birth Rates
0%
5%
10%
15%
20%
25%
1994
1995
1996
1997
1998
1999
2000
2001
2002
2003
2004
DOSME Eurostat Business Demography Central Statistical Office (KSH)
The data on birth rates seem to show an overall downward trend from the immediate post-communist period in the mid-1990�s. This is fairly typical of other European countries making the transition to market economies at this time. The trough in 1997 in the DOSME data may well be genuine, but there is a risk that it may also be partially due to survey errors, or over-smoothing of the population for inconsistencies in closure data. It is interesting to note, however, that the Eurostat data series appears to take over where the DOSME data ended. The divergence between the Eurostat and KSH data between 2001 and 2002 looks suspicious, but could be due to differences in coverage and purity. b) New businesses
0
20
40
60
80
100
120
140
1994
1995
1996
1997
1998
1999
2000
2001
2002
2003
2004
Thou
sand
s
DOSME Eurostat Business Demography Central Statistical Office (KSH)
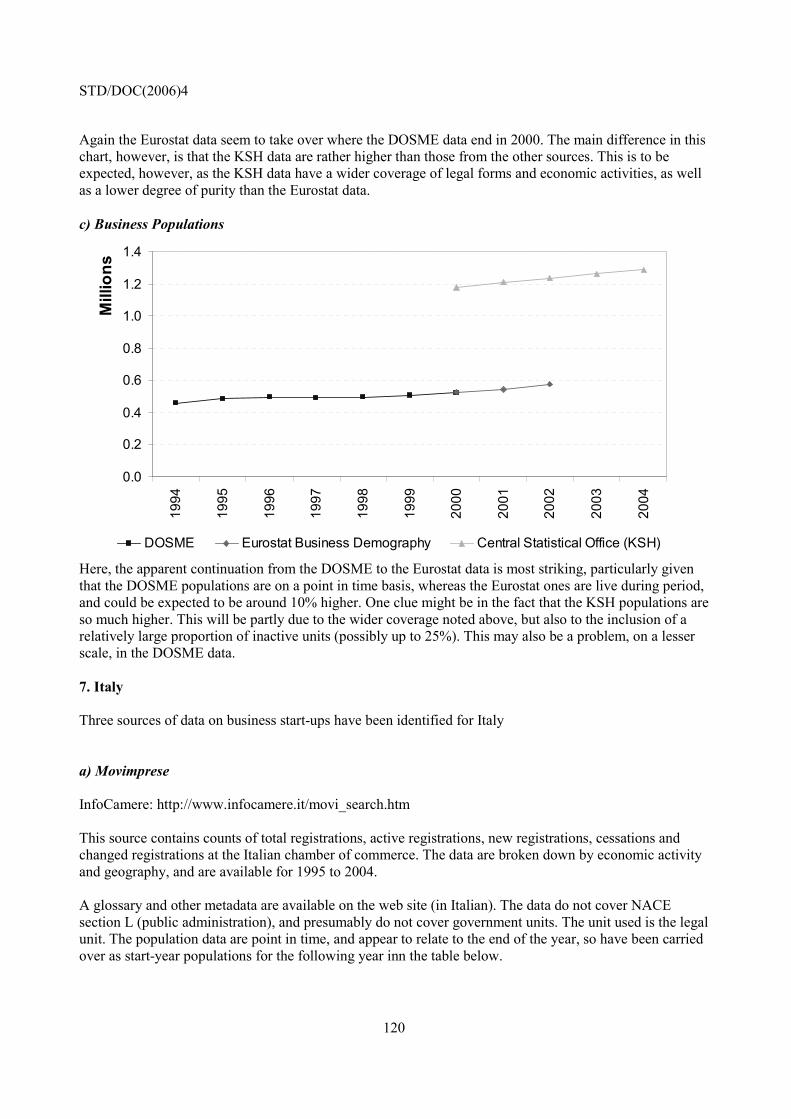
STD/DOC(2006)4
120
Again the Eurostat data seem to take over where the DOSME data end in 2000. The main difference in this chart, however, is that the KSH data are rather higher than those from the other sources. This is to be expected, however, as the KSH data have a wider coverage of legal forms and economic activities, as well as a lower degree of purity than the Eurostat data. c) Business Populations
0.0
0.2
0.4
0.6
0.8
1.0
1.2
1.4
1994
1995
1996
1997
1998
1999
2000
2001
2002
2003
2004
Mill
ions
DOSME Eurostat Business Demography Central Statistical Office (KSH)
Here, the apparent continuation from the DOSME to the Eurostat data is most striking, particularly given that the DOSME populations are on a point in time basis, whereas the Eurostat ones are live during period, and could be expected to be around 10% higher. One clue might be in the fact that the KSH populations are so much higher. This will be partly due to the wider coverage noted above, but also to the inclusion of a relatively large proportion of inactive units (possibly up to 25%). This may also be a problem, on a lesser scale, in the DOSME data. 7. Italy Three sources of data on business start-ups have been identified for Italy a) Movimprese InfoCamere: http://www.infocamere.it/movi_search.htm This source contains counts of total registrations, active registrations, new registrations, cessations and changed registrations at the Italian chamber of commerce. The data are broken down by economic activity and geography, and are available for 1995 to 2004. A glossary and other metadata are available on the web site (in Italian). The data do not cover NACE section L (public administration), and presumably do not cover government units. The unit used is the legal unit. The population data are point in time, and appear to relate to the end of the year, so have been carried over as start-year populations for the following year inn the table below.
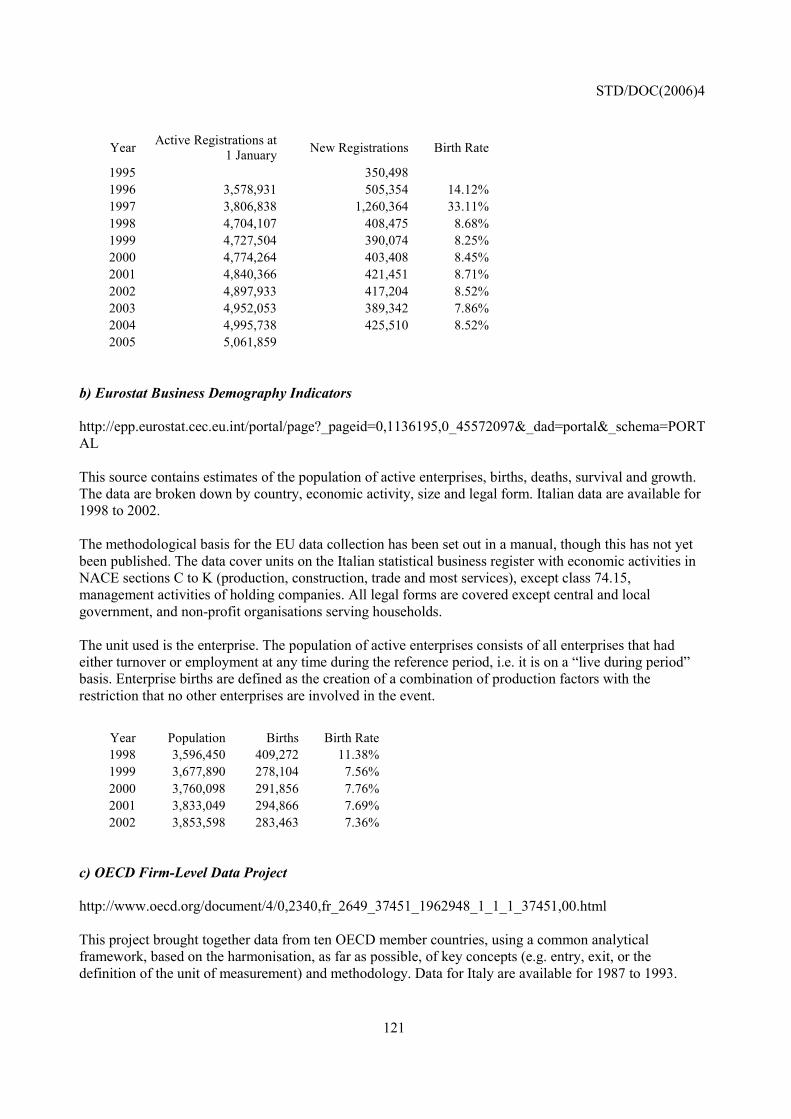
STD/DOC(2006)4
121
Year Active Registrations at 1 January New Registrations Birth Rate
1995 350,498 1996 3,578,931 505,354 14.12% 1997 3,806,838 1,260,364 33.11% 1998 4,704,107 408,475 8.68% 1999 4,727,504 390,074 8.25% 2000 4,774,264 403,408 8.45% 2001 4,840,366 421,451 8.71% 2002 4,897,933 417,204 8.52% 2003 4,952,053 389,342 7.86% 2004 4,995,738 425,510 8.52% 2005 5,061,859
b) Eurostat Business Demography Indicators http://epp.eurostat.cec.eu.int/portal/page?_pageid=0,1136195,0_45572097&_dad=portal&_schema=PORTAL This source contains estimates of the population of active enterprises, births, deaths, survival and growth. The data are broken down by country, economic activity, size and legal form. Italian data are available for 1998 to 2002. The methodological basis for the EU data collection has been set out in a manual, though this has not yet been published. The data cover units on the Italian statistical business register with economic activities in NACE sections C to K (production, construction, trade and most services), except class 74.15, management activities of holding companies. All legal forms are covered except central and local government, and non-profit organisations serving households. The unit used is the enterprise. The population of active enterprises consists of all enterprises that had either turnover or employment at any time during the reference period, i.e. it is on a �live during period� basis. Enterprise births are defined as the creation of a combination of production factors with the restriction that no other enterprises are involved in the event.
Year Population Births Birth Rate 1998 3,596,450 409,272 11.38% 1999 3,677,890 278,104 7.56% 2000 3,760,098 291,856 7.76% 2001 3,833,049 294,866 7.69% 2002 3,853,598 283,463 7.36%
c) OECD Firm-Level Data Project http://www.oecd.org/document/4/0,2340,fr_2649_37451_1962948_1_1_1_37451,00.html This project brought together data from ten OECD member countries, using a common analytical framework, based on the harmonisation, as far as possible, of key concepts (e.g. entry, exit, or the definition of the unit of measurement) and methodology. Data for Italy are available for 1987 to 1993.
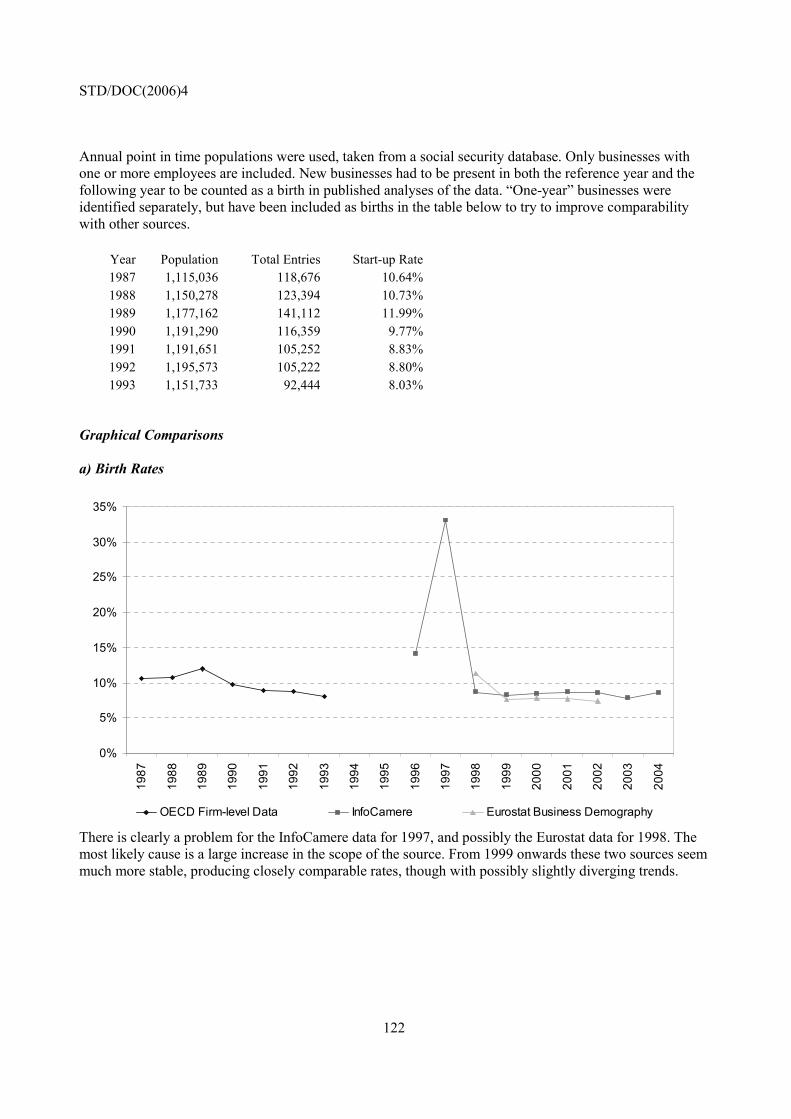
STD/DOC(2006)4
122
Annual point in time populations were used, taken from a social security database. Only businesses with one or more employees are included. New businesses had to be present in both the reference year and the following year to be counted as a birth in published analyses of the data. �One-year� businesses were identified separately, but have been included as births in the table below to try to improve comparability with other sources.
Year Population Total Entries Start-up Rate 1987 1,115,036 118,676 10.64% 1988 1,150,278 123,394 10.73% 1989 1,177,162 141,112 11.99% 1990 1,191,290 116,359 9.77% 1991 1,191,651 105,252 8.83% 1992 1,195,573 105,222 8.80% 1993 1,151,733 92,444 8.03%
Graphical Comparisons a) Birth Rates
0%
5%
10%
15%
20%
25%
30%
35%
1987
1988
1989
1990
1991
1992
1993
1994
1995
1996
1997
1998
1999
2000
2001
2002
2003
2004
OECD Firm-level Data InfoCamere Eurostat Business Demography
There is clearly a problem for the InfoCamere data for 1997, and possibly the Eurostat data for 1998. The most likely cause is a large increase in the scope of the source. From 1999 onwards these two sources seem much more stable, producing closely comparable rates, though with possibly slightly diverging trends.
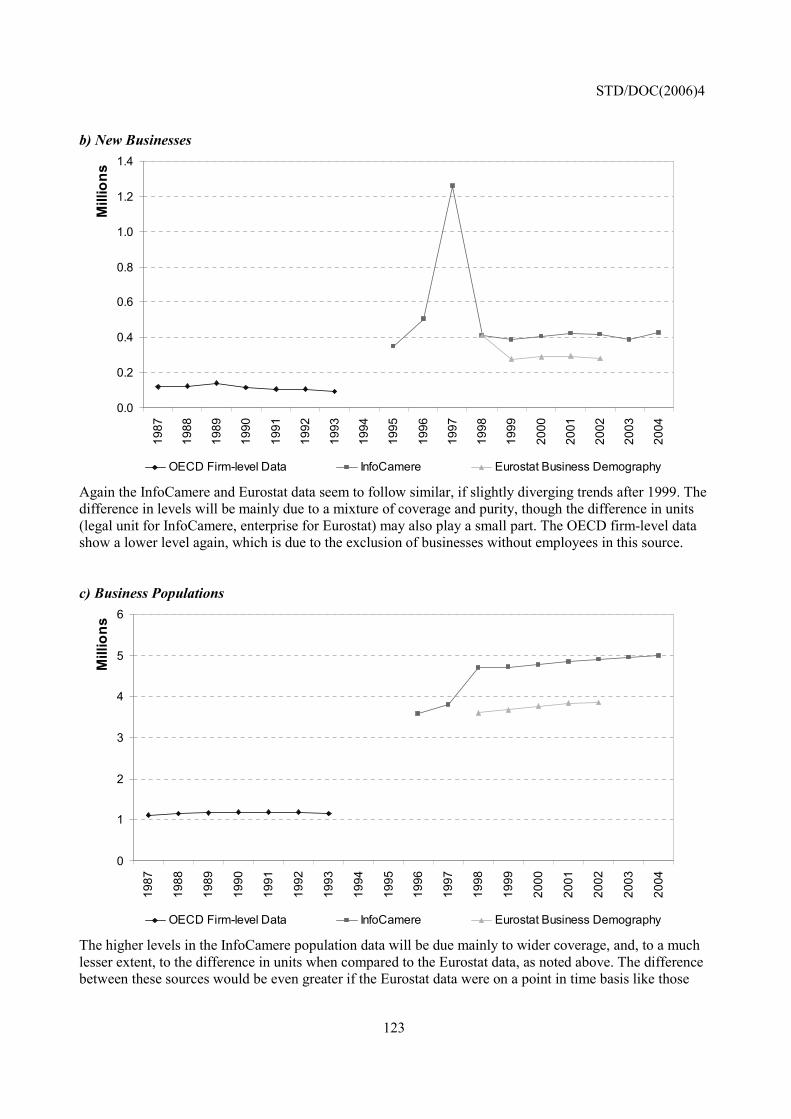
STD/DOC(2006)4
123
b) New Businesses
0.0
0.2
0.4
0.6
0.8
1.0
1.2
1.419
87
1988
1989
1990
1991
1992
1993
1994
1995
1996
1997
1998
1999
2000
2001
2002
2003
2004
Mill
ions
OECD Firm-level Data InfoCamere Eurostat Business Demography
Again the InfoCamere and Eurostat data seem to follow similar, if slightly diverging trends after 1999. The difference in levels will be mainly due to a mixture of coverage and purity, though the difference in units (legal unit for InfoCamere, enterprise for Eurostat) may also play a small part. The OECD firm-level data show a lower level again, which is due to the exclusion of businesses without employees in this source. c) Business Populations
0
1
2
3
4
5
6
1987
1988
1989
1990
1991
1992
1993
1994
1995
1996
1997
1998
1999
2000
2001
2002
2003
2004
Mill
ions
OECD Firm-level Data InfoCamere Eurostat Business Demography
The higher levels in the InfoCamere population data will be due mainly to wider coverage, and, to a much lesser extent, to the difference in units when compared to the Eurostat data, as noted above. The difference between these sources would be even greater if the Eurostat data were on a point in time basis like those
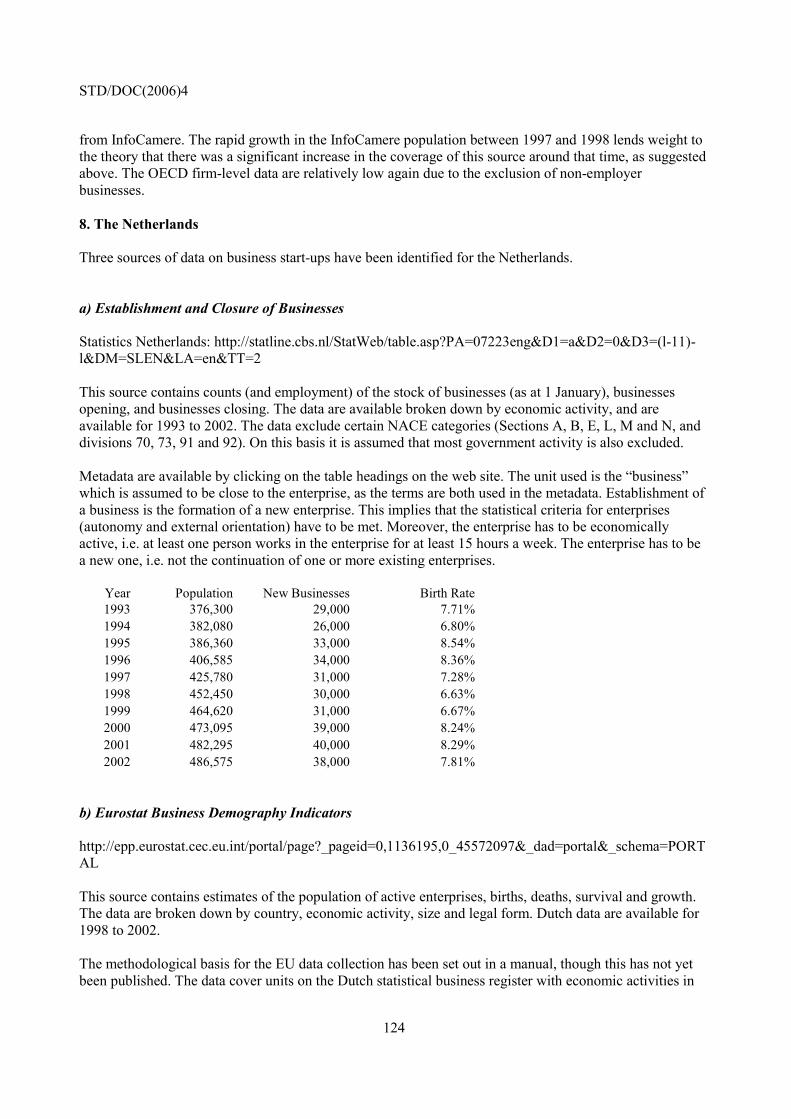
STD/DOC(2006)4
124
from InfoCamere. The rapid growth in the InfoCamere population between 1997 and 1998 lends weight to the theory that there was a significant increase in the coverage of this source around that time, as suggested above. The OECD firm-level data are relatively low again due to the exclusion of non-employer businesses. 8. The Netherlands Three sources of data on business start-ups have been identified for the Netherlands. a) Establishment and Closure of Businesses Statistics Netherlands: http://statline.cbs.nl/StatWeb/table.asp?PA=07223eng&D1=a&D2=0&D3=(l-11)-l&DM=SLEN&LA=en&TT=2 This source contains counts (and employment) of the stock of businesses (as at 1 January), businesses opening, and businesses closing. The data are available broken down by economic activity, and are available for 1993 to 2002. The data exclude certain NACE categories (Sections A, B, E, L, M and N, and divisions 70, 73, 91 and 92). On this basis it is assumed that most government activity is also excluded. Metadata are available by clicking on the table headings on the web site. The unit used is the �business� which is assumed to be close to the enterprise, as the terms are both used in the metadata. Establishment of a business is the formation of a new enterprise. This implies that the statistical criteria for enterprises (autonomy and external orientation) have to be met. Moreover, the enterprise has to be economically active, i.e. at least one person works in the enterprise for at least 15 hours a week. The enterprise has to be a new one, i.e. not the continuation of one or more existing enterprises.
Year Population New Businesses Birth Rate 1993 376,300 29,000 7.71% 1994 382,080 26,000 6.80% 1995 386,360 33,000 8.54% 1996 406,585 34,000 8.36% 1997 425,780 31,000 7.28% 1998 452,450 30,000 6.63% 1999 464,620 31,000 6.67% 2000 473,095 39,000 8.24% 2001 482,295 40,000 8.29% 2002 486,575 38,000 7.81%
b) Eurostat Business Demography Indicators http://epp.eurostat.cec.eu.int/portal/page?_pageid=0,1136195,0_45572097&_dad=portal&_schema=PORTAL This source contains estimates of the population of active enterprises, births, deaths, survival and growth. The data are broken down by country, economic activity, size and legal form. Dutch data are available for 1998 to 2002. The methodological basis for the EU data collection has been set out in a manual, though this has not yet been published. The data cover units on the Dutch statistical business register with economic activities in
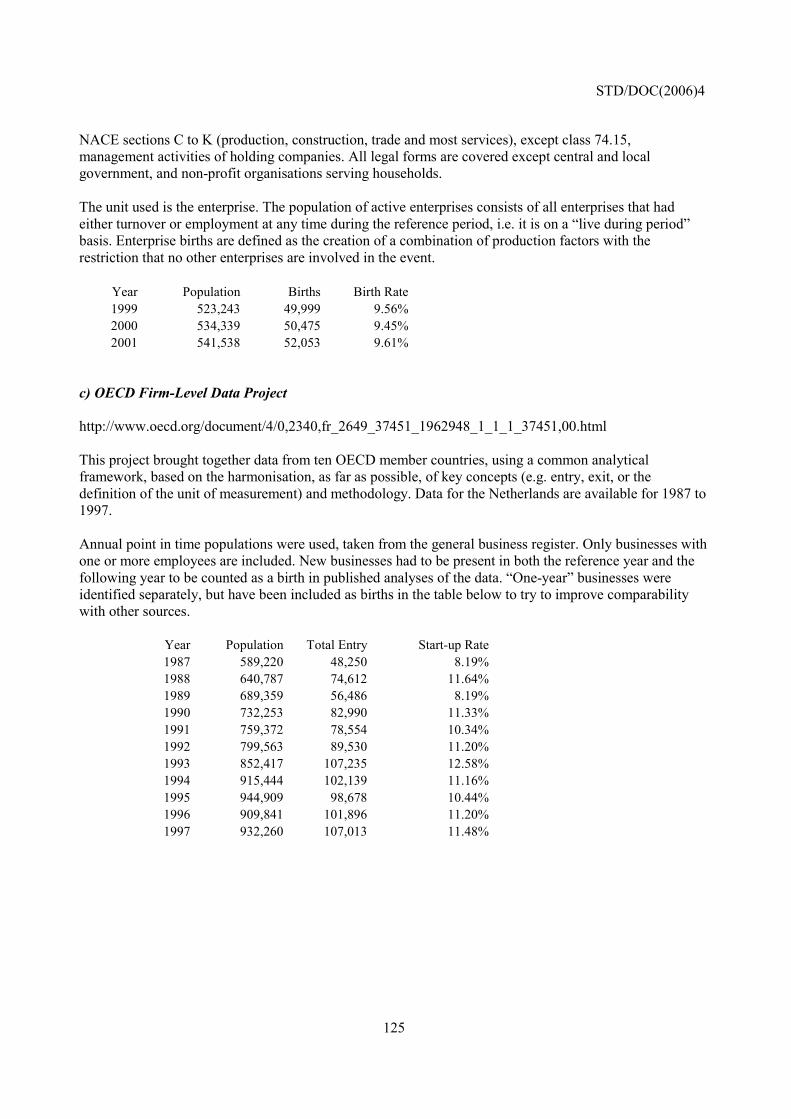
STD/DOC(2006)4
125
NACE sections C to K (production, construction, trade and most services), except class 74.15, management activities of holding companies. All legal forms are covered except central and local government, and non-profit organisations serving households. The unit used is the enterprise. The population of active enterprises consists of all enterprises that had either turnover or employment at any time during the reference period, i.e. it is on a �live during period� basis. Enterprise births are defined as the creation of a combination of production factors with the restriction that no other enterprises are involved in the event.
Year Population Births Birth Rate 1999 523,243 49,999 9.56% 2000 534,339 50,475 9.45% 2001 541,538 52,053 9.61%
c) OECD Firm-Level Data Project http://www.oecd.org/document/4/0,2340,fr_2649_37451_1962948_1_1_1_37451,00.html This project brought together data from ten OECD member countries, using a common analytical framework, based on the harmonisation, as far as possible, of key concepts (e.g. entry, exit, or the definition of the unit of measurement) and methodology. Data for the Netherlands are available for 1987 to 1997. Annual point in time populations were used, taken from the general business register. Only businesses with one or more employees are included. New businesses had to be present in both the reference year and the following year to be counted as a birth in published analyses of the data. �One-year� businesses were identified separately, but have been included as births in the table below to try to improve comparability with other sources.
Year Population Total Entry Start-up Rate 1987 589,220 48,250 8.19% 1988 640,787 74,612 11.64% 1989 689,359 56,486 8.19% 1990 732,253 82,990 11.33% 1991 759,372 78,554 10.34% 1992 799,563 89,530 11.20% 1993 852,417 107,235 12.58% 1994 915,444 102,139 11.16% 1995 944,909 98,678 10.44% 1996 909,841 101,896 11.20% 1997 932,260 107,013 11.48%

STD/DOC(2006)4
126
Graphical Comparisons a) Birth Rates
0%
2%
4%
6%
8%
10%
12%
14%
1987
1988
1989
1990
1991
1992
1993
1994
1995
1996
1997
1998
1999
2000
2001
2002
OECD Firm-level Data Establishment and Closure of Businesses Eurostat Business Demography
The OECD firm-level data show rather a lot of variation, particularly in the earlier years, but tend to stabilise at around 11% towards the end of the series. This rate is slightly higher than that from the Eurostat data, due to the interaction of greater purity and the use of a live during period population reducing the Eurostat rates, whilst the threshold of one employee would be expected to reduce the firm-level rates. The data from the Establishment and Closure of Business source seem to exhibit a cyclical pattern, which interestingly shows a strong negative correlation to the real GDP growth rate data for the Netherlands (sourced from Eurostat). This may be coincidence, but could be worth further investigation. b) New Businesses
0
20
40
60
80
100
120
1987
1988
1989
1990
1991
1992
1993
1994
1995
1996
1997
1998
1999
2000
2001
2002
Thou
sand
s
OECD Firm-level Data Establishment and Closure of Businesses Eurostat Business Demography
0%2%4%6%8%
10%
1993
1994
1995
1996
1997
1998
1999
2000
2001
2002
2003
2004
GDP Growth Start-up Rate

STD/DOC(2006)4
127
The number of new businesses in the OECD firm-level data set is surprisingly high compared to the other sources, particularly as the metadata state that only businesses with employees are included. The coverage in terms of economic activity of this source is higher, but it is likely that purity and the unit of observation are more important factor in explaining the difference. The other two sources seem more comparable, with the differences probably due to the more restricted coverage and the threshold of 15 hours labour input per week in the Establishment and Closure of Businesses source. The apparent cyclical pattern in the data from this source is once again evident in this chart. c) Business Populations
0.0
0.1
0.2
0.3
0.4
0.5
0.6
0.7
0.8
0.9
1.0
1987
1988
1989
1990
1991
1992
1993
1994
1995
1996
1997
1998
1999
2000
2001
2002
Mill
ions
OECD Firm-level Data Establishment and Closure of Businesses Eurostat Business Demography
As for new businesses, the population data from the OECD firm-level project is rather high, again casting doubt on the statement in the metadata that non-employer businesses are excluded. Units and coverage, particularly the inclusion of non-active units, are likely to account for a significant part of the difference. The Eurostat population at least 10% higher than that from the Establishment and Closure of Businesses source due mainly to it being on a live during period basis. Relatively small differences in coverage and threshold will also play a minor role. 9. United Kingdom Four sources of data on business start-ups have been identified for the United Kingdom. a) Value-Added Tax Registrations and De-registrations UK Department for Trade and Industry � Small Business Service http://www.sbs.gov.uk/sbsgov/action/layer?r.l2=7000000243&r.l1=7000000229&r.s=tl&topicId=7000011757 This source contains counts of the stock of businesses registered for value-added tax (VAT), as well as new registrations and de-registrations. The data are broken down by economic activity and geography, and are available on a calendar year basis for 1994 to 2003. A previous series from 1980 to 1993 is also available, but the data are not directly comparable due to large changes in the VAT threshold.
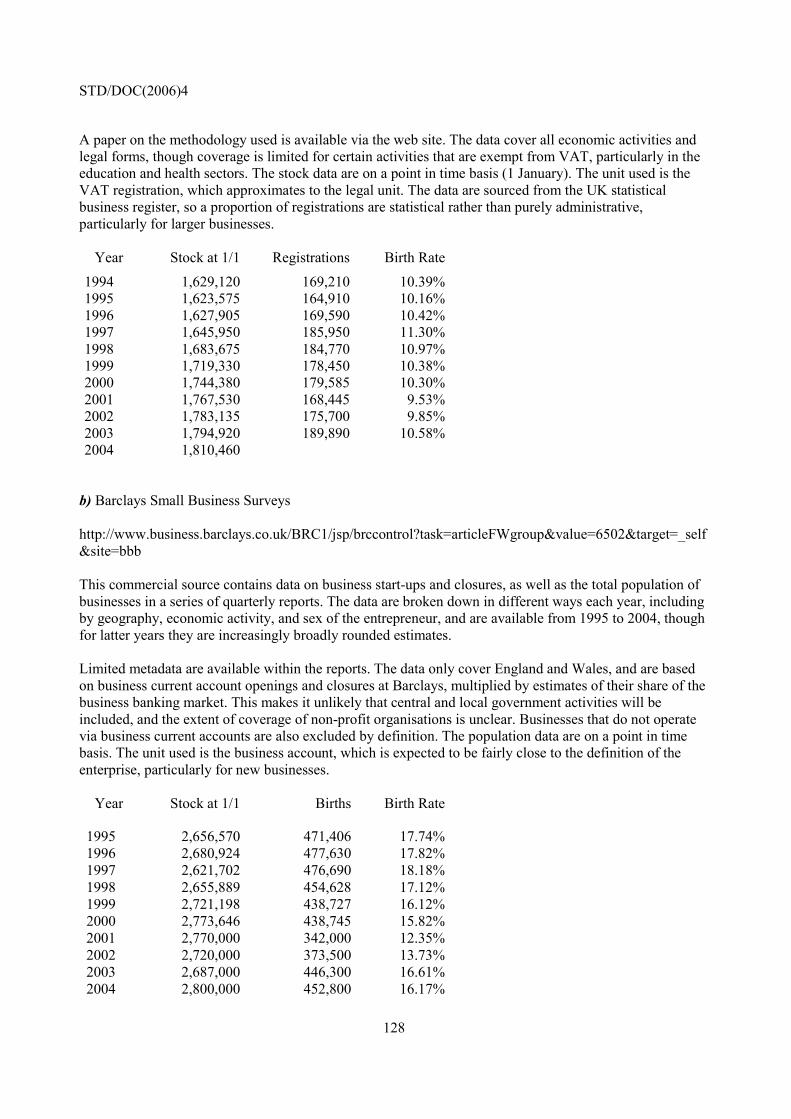
STD/DOC(2006)4
128
A paper on the methodology used is available via the web site. The data cover all economic activities and legal forms, though coverage is limited for certain activities that are exempt from VAT, particularly in the education and health sectors. The stock data are on a point in time basis (1 January). The unit used is the VAT registration, which approximates to the legal unit. The data are sourced from the UK statistical business register, so a proportion of registrations are statistical rather than purely administrative, particularly for larger businesses.
Year Stock at 1/1 Registrations Birth Rate
1994 1,629,120 169,210 10.39% 1995 1,623,575 164,910 10.16% 1996 1,627,905 169,590 10.42% 1997 1,645,950 185,950 11.30% 1998 1,683,675 184,770 10.97% 1999 1,719,330 178,450 10.38% 2000 1,744,380 179,585 10.30% 2001 1,767,530 168,445 9.53% 2002 1,783,135 175,700 9.85% 2003 1,794,920 189,890 10.58% 2004 1,810,460
b) Barclays Small Business Surveys http://www.business.barclays.co.uk/BRC1/jsp/brccontrol?task=articleFWgroup&value=6502&target=_self&site=bbb This commercial source contains data on business start-ups and closures, as well as the total population of businesses in a series of quarterly reports. The data are broken down in different ways each year, including by geography, economic activity, and sex of the entrepreneur, and are available from 1995 to 2004, though for latter years they are increasingly broadly rounded estimates. Limited metadata are available within the reports. The data only cover England and Wales, and are based on business current account openings and closures at Barclays, multiplied by estimates of their share of the business banking market. This makes it unlikely that central and local government activities will be included, and the extent of coverage of non-profit organisations is unclear. Businesses that do not operate via business current accounts are also excluded by definition. The population data are on a point in time basis. The unit used is the business account, which is expected to be fairly close to the definition of the enterprise, particularly for new businesses.
Year Stock at 1/1 Births Birth Rate
1995 2,656,570 471,406 17.74% 1996 2,680,924 477,630 17.82% 1997 2,621,702 476,690 18.18% 1998 2,655,889 454,628 17.12% 1999 2,721,198 438,727 16.12% 2000 2,773,646 438,745 15.82% 2001 2,770,000 342,000 12.35% 2002 2,720,000 373,500 13.73% 2003 2,687,000 446,300 16.61% 2004 2,800,000 452,800 16.17%
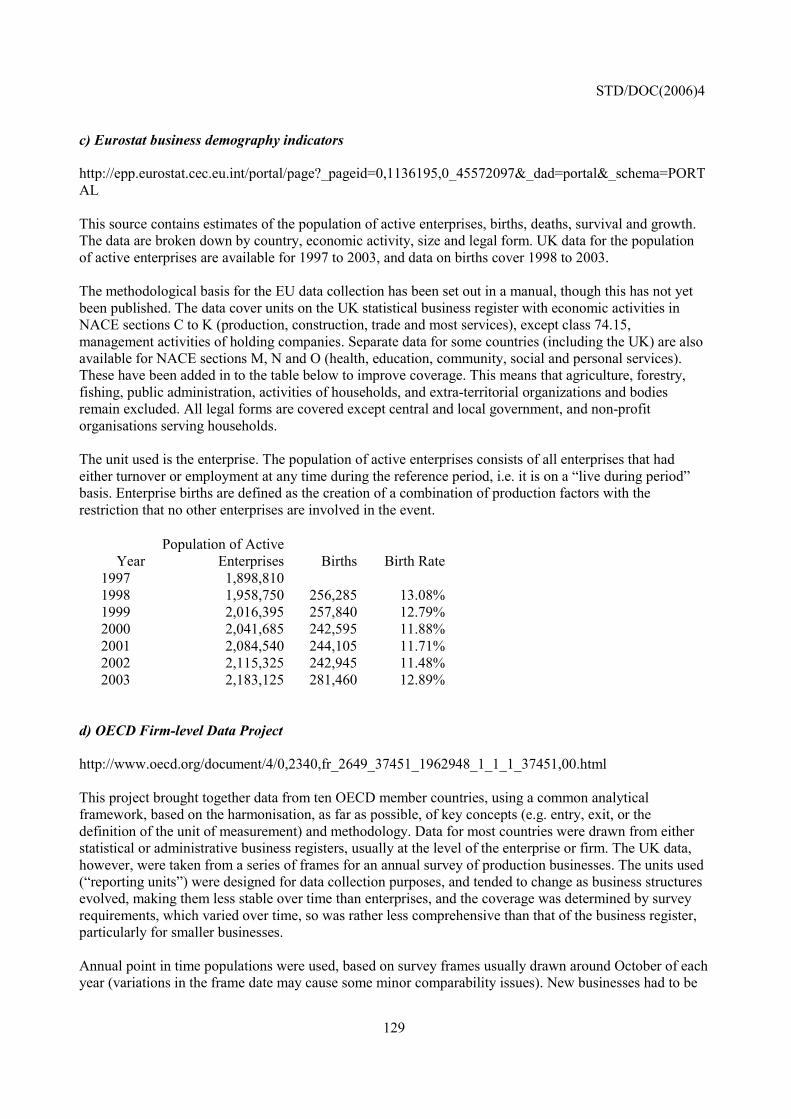
STD/DOC(2006)4
129
c) Eurostat business demography indicators http://epp.eurostat.cec.eu.int/portal/page?_pageid=0,1136195,0_45572097&_dad=portal&_schema=PORTAL This source contains estimates of the population of active enterprises, births, deaths, survival and growth. The data are broken down by country, economic activity, size and legal form. UK data for the population of active enterprises are available for 1997 to 2003, and data on births cover 1998 to 2003. The methodological basis for the EU data collection has been set out in a manual, though this has not yet been published. The data cover units on the UK statistical business register with economic activities in NACE sections C to K (production, construction, trade and most services), except class 74.15, management activities of holding companies. Separate data for some countries (including the UK) are also available for NACE sections M, N and O (health, education, community, social and personal services). These have been added in to the table below to improve coverage. This means that agriculture, forestry, fishing, public administration, activities of households, and extra-territorial organizations and bodies remain excluded. All legal forms are covered except central and local government, and non-profit organisations serving households. The unit used is the enterprise. The population of active enterprises consists of all enterprises that had either turnover or employment at any time during the reference period, i.e. it is on a �live during period� basis. Enterprise births are defined as the creation of a combination of production factors with the restriction that no other enterprises are involved in the event.
Year Population of Active
Enterprises Births Birth Rate 1997 1,898,810 1998 1,958,750 256,285 13.08% 1999 2,016,395 257,840 12.79% 2000 2,041,685 242,595 11.88% 2001 2,084,540 244,105 11.71% 2002 2,115,325 242,945 11.48% 2003 2,183,125 281,460 12.89%
d) OECD Firm-level Data Project http://www.oecd.org/document/4/0,2340,fr_2649_37451_1962948_1_1_1_37451,00.html This project brought together data from ten OECD member countries, using a common analytical framework, based on the harmonisation, as far as possible, of key concepts (e.g. entry, exit, or the definition of the unit of measurement) and methodology. Data for most countries were drawn from either statistical or administrative business registers, usually at the level of the enterprise or firm. The UK data, however, were taken from a series of frames for an annual survey of production businesses. The units used (�reporting units�) were designed for data collection purposes, and tended to change as business structures evolved, making them less stable over time than enterprises, and the coverage was determined by survey requirements, which varied over time, so was rather less comprehensive than that of the business register, particularly for smaller businesses. Annual point in time populations were used, based on survey frames usually drawn around October of each year (variations in the frame date may cause some minor comparability issues). New businesses had to be

STD/DOC(2006)4
130
present in both the reference year and the following year to be counted as a birth in published analyses of the data. �One-year� businesses were identified separately, but have been included as births in the table below to try to improve comparability with other sources.
Year Stock Entries During Year Entry Rate 1986 148741 23872 16.05% 1987 150778 24114 15.99% 1988 154956 27315 17.63% 1989 158131 38646 24.44% 1990 151945 20775 13.67% 1991 147984 14952 10.10% 1992 x x x 1993 148057 50897 34.38% 1994 157975 31526 19.96% 1995 174825 47639 27.25% 1996 166981 21316 12.77% 1997 169826 21218 12.49%
Note: Data for 1992 are missing, but it looks likely that births for this year are included in 1993 figures. Graphical Comparisons a) Birth Rates
0%
5%
10%
15%
20%
25%
30%
35%
1986
1987
1988
1989
1990
1991
1992
1993
1994
1995
1996
1997
1998
1999
2000
2001
2002
2003
2004
VAT Registrations Barclays Eurostat OECD Firm-level Data
The OECD Firm-level data show considerably more variability than those from the other sources. This is likely to be due to changes in coverage between years, as well as the instability over time of the unit used (the reporting unit). The break in 1992 is likely to be linked to the introduction of a new statistical business register around this time, which led to a new definition and numbering system for reporting units. The data only really seem to show plausible rates at the start and the end of the period covered. The Barclays data also show more variability than the remaining two sources. This could reflect the greater coverage of very small businesses, which are known to be more volatile than their larger counterparts. The pronounced trough in 2001 could be at least partly due to the �foot and mouth disease� epidemic amongst farm animals in the UK in that year. This had a particularly strong effect on rural businesses.

STD/DOC(2006)4
131
VAT Registration data show a much more stable trend, but interestingly do seem to follow a similar pattern to the Barclays data, looking rather like a smoothed version, albeit at a lower absolute level. This could be taken as a positive indication of the quality of the two data sets. Start-up rates for the Eurostat data again follow similar trends, with the increased coverage of small businesses more than compensating for the use of live during period population figures when compared to the VAT Registrations series. b) New Businesses
0
100
200
300
400
500
600
1986
1987
1988
1989
1990
1991
1992
1993
1994
1995
1996
1997
1998
1999
2000
2001
2002
2003
2004
Thou
sand
s
VAT Registrations Barclays Eurostat OECD Firm-level Data
The OECD Firm-level data show much lower levels because they only include manufacturers, and exclude many smaller businesses. The other sources have a much more complete coverage of economic activities. Both the Barclays, and to a lesser extent, the Eurostat sources, have a higher coverage of small businesses than the VAT registrations data, due to the high VAT registration threshold in the UK. As is the case for birth rates, the Barclays, Eurostat and VAT registrations data show similar patterns, though the fluctuations in the Barclays data are much more exaggerated.

STD/DOC(2006)4
132
c) Business Populations
0.0
0.5
1.0
1.5
2.0
2.5
3.019
86
1987
1988
1989
1990
1991
1992
1993
1994
1995
1996
1997
1998
1999
2000
2001
2002
2003
2004
Mill
ions
VAT Registrations Barclays Eurostat OECD Firm-level Data
Barclays data show the highest population, despite only covering England and Wales. The data from this source would be around 11 - 12% higher if they covered all of the UK (i.e. including Scotland and Northern Ireland). The higher population is due to a much greater coverage of very small businesses (low turnover, no employees) than the other sources, and no restrictions in terms of economic activities. VAT Registrations data are lower than those from Eurostat, despite originating from the same business register, due to the interaction of three coverage related issues, and one basic difference in methodology. VAT registrations data have more comprehensive coverage in terms of economic activities (particularly agriculture) and legal forms (non-profit institutions), but this is more than compensated for by a lower coverage of very small businesses, and the fact that the Eurostat population data are on a �live during period� basis, whereas the VAT registrations population includes only those registrations live on a specific date (1 January). 10. United States Five sources of data on business start-ups have been identified for the United States. a) Statistics of US Businesses / Dynamic Data US Census Bureau - http://www.census.gov/csd/susb/susbdyn.htm This source contains counts of the stock of establishments, births, deaths, expansions and contractions, and associated employment changes. The data are broken down by economic activity, size band (based on employment) and state, and are available for 1995 to 2001. Papers with descriptive metadata and definitions are available via the web site. Businesses without employees are excluded. All economic activities are covered except crop and animal production (NAICS 111,112), rail transportation (NAICS 482), National Postal Service (NAICS 491), pension, health, welfare, and vacation funds (NAICS 525110, 525120, 525190), trusts, estates, and agency accounts (NAICS 525920), private households (NAICS 814), and public administration (NAICS 92). Governmental
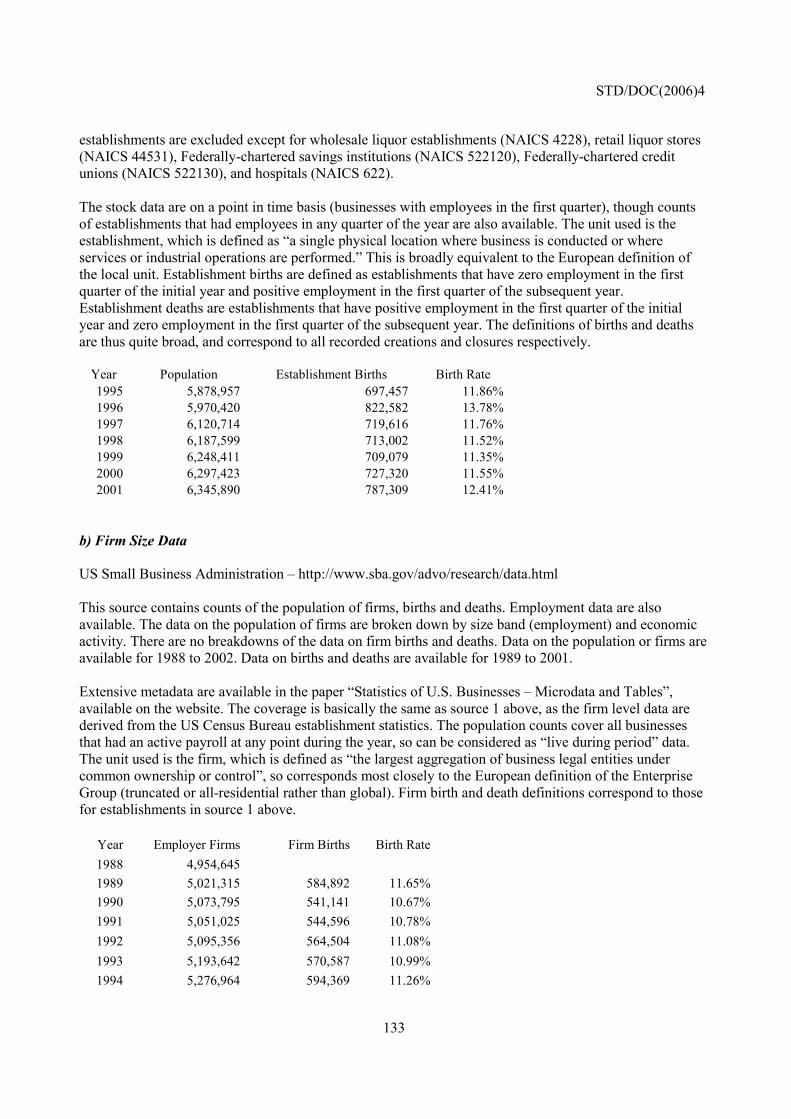
STD/DOC(2006)4
133
establishments are excluded except for wholesale liquor establishments (NAICS 4228), retail liquor stores (NAICS 44531), Federally-chartered savings institutions (NAICS 522120), Federally-chartered credit unions (NAICS 522130), and hospitals (NAICS 622). The stock data are on a point in time basis (businesses with employees in the first quarter), though counts of establishments that had employees in any quarter of the year are also available. The unit used is the establishment, which is defined as �a single physical location where business is conducted or where services or industrial operations are performed.� This is broadly equivalent to the European definition of the local unit. Establishment births are defined as establishments that have zero employment in the first quarter of the initial year and positive employment in the first quarter of the subsequent year. Establishment deaths are establishments that have positive employment in the first quarter of the initial year and zero employment in the first quarter of the subsequent year. The definitions of births and deaths are thus quite broad, and correspond to all recorded creations and closures respectively.
Year Population Establishment Births Birth Rate 1995 5,878,957 697,457 11.86% 1996 5,970,420 822,582 13.78% 1997 6,120,714 719,616 11.76% 1998 6,187,599 713,002 11.52% 1999 6,248,411 709,079 11.35% 2000 6,297,423 727,320 11.55% 2001 6,345,890 787,309 12.41%
b) Firm Size Data US Small Business Administration � http://www.sba.gov/advo/research/data.html This source contains counts of the population of firms, births and deaths. Employment data are also available. The data on the population of firms are broken down by size band (employment) and economic activity. There are no breakdowns of the data on firm births and deaths. Data on the population or firms are available for 1988 to 2002. Data on births and deaths are available for 1989 to 2001. Extensive metadata are available in the paper �Statistics of U.S. Businesses � Microdata and Tables�, available on the website. The coverage is basically the same as source 1 above, as the firm level data are derived from the US Census Bureau establishment statistics. The population counts cover all businesses that had an active payroll at any point during the year, so can be considered as �live during period� data. The unit used is the firm, which is defined as �the largest aggregation of business legal entities under common ownership or control�, so corresponds most closely to the European definition of the Enterprise Group (truncated or all-residential rather than global). Firm birth and death definitions correspond to those for establishments in source 1 above.
Year Employer Firms Firm Births Birth Rate 1988 4,954,645 1989 5,021,315 584,892 11.65% 1990 5,073,795 541,141 10.67% 1991 5,051,025 544,596 10.78% 1992 5,095,356 564,504 11.08% 1993 5,193,642 570,587 10.99% 1994 5,276,964 594,369 11.26%

STD/DOC(2006)4
134
1995 5,369,068 597,792 11.13% 1996 5,478,047 590,644 10.78% 1997 5,541,918 589,982 10.65% 1998 5,579,177 579,609 10.39% 1999 5,607,743 574,300 10.24% 2000 5,652,544 585,140 10.35% 2001 5,657,774 569,750 10.07% 2002 5,697,759
Note: The population data have been taken from a different table to the data on births and deaths. The assumption (in the absence of any evidence to the contrary) is that they are on a comparable basis. c) Business Employment Dynamics Bureau of Labor Statistics � http://www.bls.gov/bdm/home.htm, and Pinkston and Spletzer (2004) - http://www.bls.gov/opub/mlr/2004/11/art1full.pdf This source contains counts and rates for establishment openings and closures each quarter. The data can be broken down by economic activity, and are currently available from quarter 3 of 1992 to quarter 4 of 2004 inclusive. Descriptive metadata and definitions are available via the web site. The data exclude business with no employees, central and local government units, and some non-profit organizations. Certain economic activities are also excluded (religious organizations, some small farms, the Armed Forces and railways). The unit used is the establishment, which is broadly equivalent to the European definition of the local unit. Openings are either establishments with positive third month employment for the first time in the current quarter, with no links to the prior quarter, or with positive third month employment in the current quarter following zero employment in the previous quarter. Closings are either establishments with positive third month employment in the previous quarter, with no positive employment reported in the current quarter, or with positive third month employment in the previous quarter followed by zero employment in the current quarter. No stock data are given, but they can be estimated from openings counts and rates (or closures counts and rates) on a quarterly basis. These can then be used to calculate annual birth and death rates. The data on openings and closures give slightly different stock figures. This is due to rounding of the counts of openings and closures (to the nearest thousand), and the rates (to one decimal place). The derived stock figures based on openings and closures for each year are within the margins of error associated this level of rounding. The impact on the annual opening and closure rate estimates is less than 0.2%. The paper by Pinkston and Spletzer explores the impact of short-lived businesses on the data, and gives annualised data for 1998 to 2001. Their method removes very short-lived businesses, and false start-ups due to businesses that have previously been in the population of employers, but were temporarily absent. The effect on start-up rates is dramatic.

STD/DOC(2006)4
135
Year Population Births Birth Rate Annualised Births Annualised Birth Rate 1993 5,419,807 1,171,000 21.61% 1994 5,544,268 1,223,000 22.06% 1995 5,738,196 1,242,000 21.64% 1996 5,828,816 1,306,000 22.41% 1997 5,902,142 1,326,000 22.47% 1998 6,045,896 1,344,000 22.23% 778,826 12.99% 1999 6,096,898 1,409,000 23.11% 804,022 13.19% 2000 6,200,692 1,405,000 22.66% 809,301 13.09% 2001 6,268,227 1,363,000 21.74% 790,237 12.67% 2002 6,344,799 1,374,000 21.66% 2003 6,378,568 1,355,000 21.24% 2004 6,535,698
Note: The population is calculated as the median value of the intersection between the ranges of possible values based on the births and deaths data for the second quarter of each year (i.e. it is the estimated population as at 1 April). Births and deaths are for the period 1 April year t to 31 March year t+1. 1 April is used as a reference date in an attempt to improve comparability with source 1, which is calculated on a March to March basis. d) Longitudinal Business Database US Census Bureau - http://www.ces.census.gov/ces.php/abstract?paper=101647 This database contains linked records of establishments and firms over time. It can be used to produce data on business dynamics. The internet address above is that of a paper describing the database, which includes data on births and deaths. A second paper is available with more detailed analyses for the retail sector � see: http://www.ces.census.gov/ces.php/abstract?paper=101704 The data in the paper are not broken down in any way, but the database would allow a range of detailed breakdowns. The paper presents stock, birth and death data for 1976 to 1999. The paper contains descriptive metadata. The source data cover establishments with paid employees. Economic activity coverage is the same as for source 1 above. The stock data are on a point in time basis, and the unit used is the establishment. Births are records that were active in one year, but not the previous year, adjusted for reactivations. Deaths are records that were active in one year, but not the next, adjusted for reactivations.

STD/DOC(2006)4
136
Year Population Births Birth Rate 1976 4,945,528 824,563 16.67% 1977 5,125,942 844,422 16.47% 1978 5,152,243 683,598 13.27% 1979 5,330,266 681,813 12.79% 1980 5,283,897 610,991 11.56% 1981 5,244,139 649,292 12.38% 1982 5,294,765 702,036 13.26% 1983 5,586,606 755,528 13.52% 1984 5,833,945 779,039 13.35% 1985 5,981,692 771,830 12.90% 1986 6,098,536 763,103 12.51% 1987 6,174,220 851,033 13.78% 1988 6,228,218 717,030 11.51% 1989 6,388,877 797,117 12.48% 1990 6,645,560 933,622 14.05% 1991 6,729,082 799,454 11.88% 1992 6,759,906 787,850 11.65% 1993 6,860,000 746,635 10.88% 1994 6,973,457 760,594 10.91% 1995 7,077,456 754,795 10.66% 1996 7,167,943 766,265 10.69% 1997 7,305,127 894,978 12.25% 1998 7,351,196 754,708 10.27% 1999 7,405,245 828,164 11.18%
Note: The population data are those establishments considered to be active in the longitudinal database. Births and deaths have been adjusted to remove all reactivations. e) OECD Firm-level Data Project http://www.oecd.org/document/4/0,2340,fr_2649_37451_1962948_1_1_1_37451,00.html This project brought together data from ten OECD member countries, using a common analytical framework, based on the harmonisation, as far as possible, of key concepts (e.g. entry, exit, or the definition of the unit of measurement) and methodology. Data for the United States are available for 1989 to 1996. Annual point in time populations were used, taken from the prototype longitudinal business database. Only businesses with one or more employees are included. New businesses had to be present in both the reference year and the following year to be counted as a birth in published analyses of the data. �One-year� businesses were identified separately, but have been included as births in the table below to try to improve comparability with other sources.
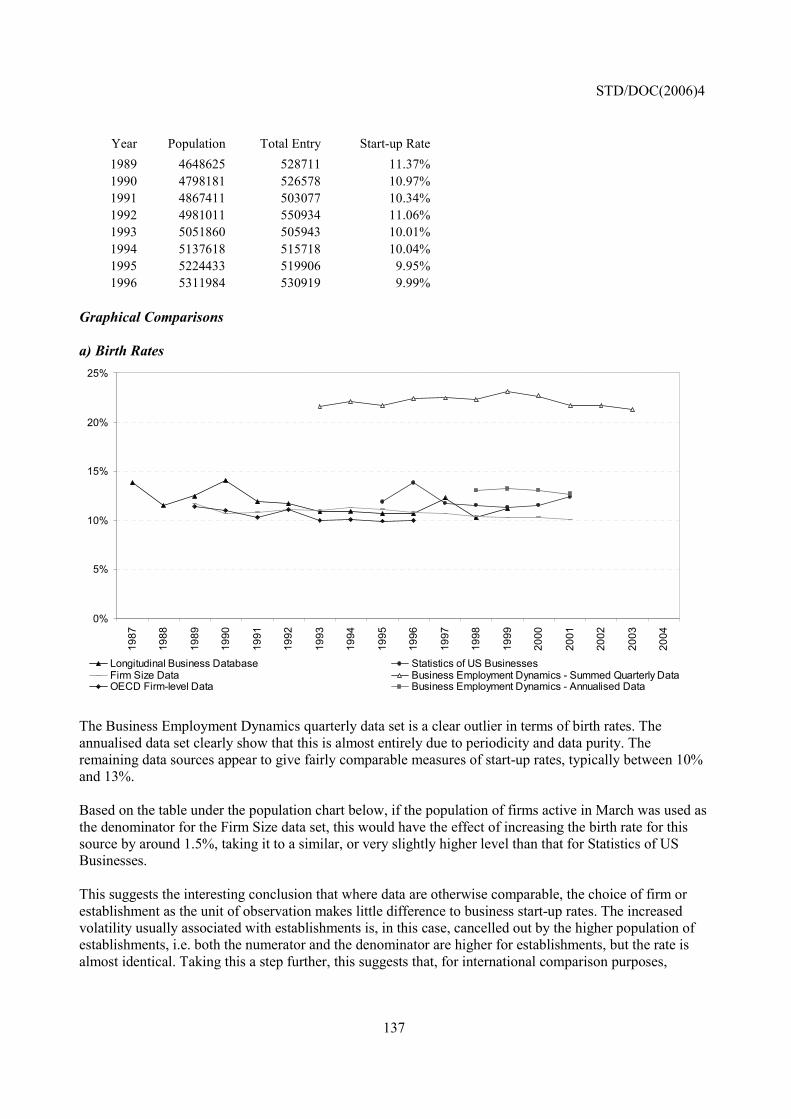
STD/DOC(2006)4
137
Year Population Total Entry Start-up Rate 1989 4648625 528711 11.37% 1990 4798181 526578 10.97% 1991 4867411 503077 10.34% 1992 4981011 550934 11.06% 1993 5051860 505943 10.01% 1994 5137618 515718 10.04% 1995 5224433 519906 9.95% 1996 5311984 530919 9.99%
Graphical Comparisons a) Birth Rates
0%
5%
10%
15%
20%
25%
1987
1988
1989
1990
1991
1992
1993
1994
1995
1996
1997
1998
1999
2000
2001
2002
2003
2004
Longitudinal Business Database Statistics of US BusinessesFirm Size Data Business Employment Dynamics - Summed Quarterly DataOECD Firm-level Data Business Employment Dynamics - Annualised Data
The Business Employment Dynamics quarterly data set is a clear outlier in terms of birth rates. The annualised data set clearly show that this is almost entirely due to periodicity and data purity. The remaining data sources appear to give fairly comparable measures of start-up rates, typically between 10% and 13%. Based on the table under the population chart below, if the population of firms active in March was used as the denominator for the Firm Size data set, this would have the effect of increasing the birth rate for this source by around 1.5%, taking it to a similar, or very slightly higher level than that for Statistics of US Businesses. This suggests the interesting conclusion that where data are otherwise comparable, the choice of firm or establishment as the unit of observation makes little difference to business start-up rates. The increased volatility usually associated with establishments is, in this case, cancelled out by the higher population of establishments, i.e. both the numerator and the denominator are higher for establishments, but the rate is almost identical. Taking this a step further, this suggests that, for international comparison purposes,

STD/DOC(2006)4
138
differences in units may not be a major obstacle. Unfortunately these conclusions are only based on data for one country for a limited period of time, so it remains to be seen how safe they are in a wider context. b) New Businesses
0.0
0.2
0.4
0.6
0.8
1.0
1.2
1.4
1.6
1987
1988
1989
1990
1991
1992
1993
1994
1995
1996
1997
1998
1999
2000
2001
2002
2003
2004
Mill
ions
Longitudinal Business Database Statistics of US BusinessesFirm Size Data Business Employment Dynamics - Summed Quarterly DataOECD Firm-level Data Business Employment Dynamics - Annualised Data
For births, the clear outlier is again the Business Employment Dynamics quarterly data. This is due to issues of purity (i.e. including virtually all establishment creations), and a much greater chance of including short-lived businesses. The number of births from the Longitudinal Business Database seems close to those from Statistics of US Businesses, but this masks two differences between the data that seem to largely cancel each other out. All things being equal, the number of births from the Longitudinal Business Database should be higher, simply because the population for that source is more comprehensive, however, this seems to be balanced by the greater extent of data matching within this source, to remove all reactivations and other �false� births. The spike in the Longitudinal Business Database series in 1997 is acknowledged as suspicious, and could perhaps be linked to the very similar spike in the data from Statistics of US Businesses the year before. If this is the case, it could indicate the presence of a lag between these two sources. The gap between the Statistics of US Businesses series and that from the Firm Size Data source indicates the proportion of new establishments created by existing firms, assuming that very few new firms have more than one site when they are created. It is interesting to note that the spike in the Statistics of US Businesses data for 1996 is not present in the Firm Size Data series. This might indicate that it was more of a source processing issue than a real increase. Similarly the increasing divergence between these sources for 2001, combined with the fact that Statistics of US Businesses is the only source to show an increase between 2000 and 2001, might suggest similar processing issues. The data for the OECD Firm-level series are taken from a prototype of the Longitudinal Business Database, which explains the similar trends, however there is clearly a difference in coverage.
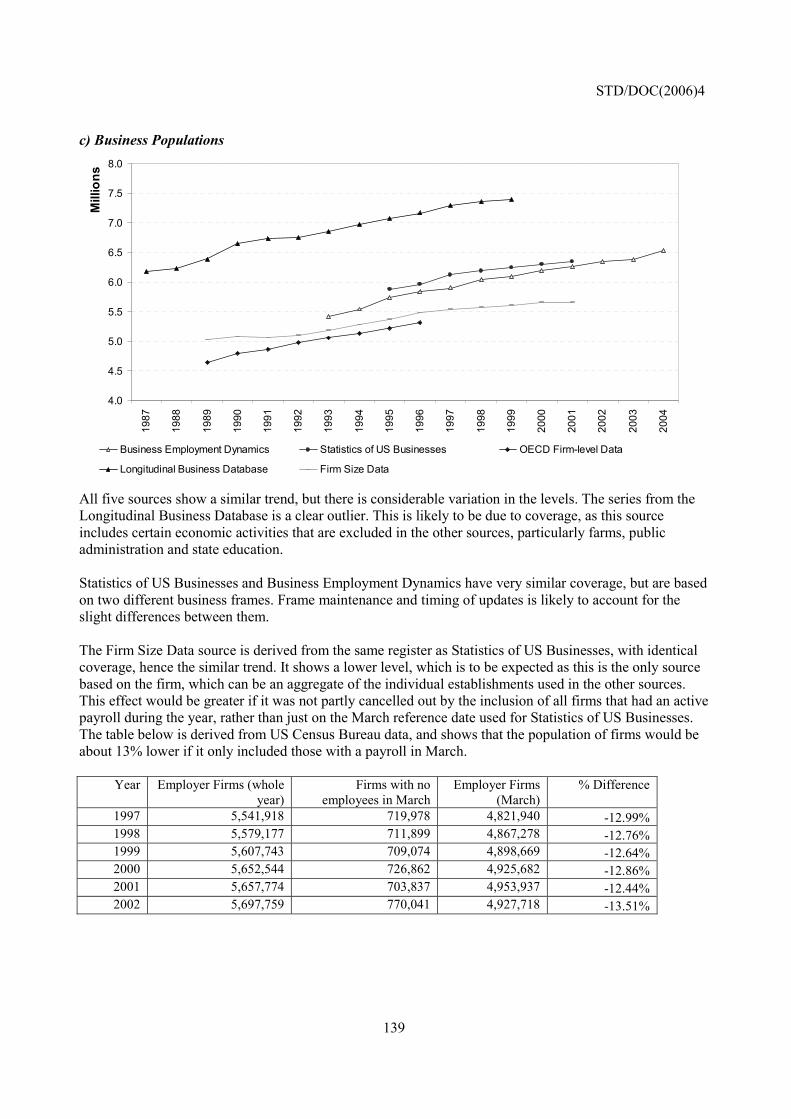
STD/DOC(2006)4
139
c) Business Populations
4.0
4.5
5.0
5.5
6.0
6.5
7.0
7.5
8.0
1987
1988
1989
1990
1991
1992
1993
1994
1995
1996
1997
1998
1999
2000
2001
2002
2003
2004
Mill
ions
Business Employment Dynamics Statistics of US Businesses OECD Firm-level Data
Longitudinal Business Database Firm Size Data
All five sources show a similar trend, but there is considerable variation in the levels. The series from the Longitudinal Business Database is a clear outlier. This is likely to be due to coverage, as this source includes certain economic activities that are excluded in the other sources, particularly farms, public administration and state education. Statistics of US Businesses and Business Employment Dynamics have very similar coverage, but are based on two different business frames. Frame maintenance and timing of updates is likely to account for the slight differences between them. The Firm Size Data source is derived from the same register as Statistics of US Businesses, with identical coverage, hence the similar trend. It shows a lower level, which is to be expected as this is the only source based on the firm, which can be an aggregate of the individual establishments used in the other sources. This effect would be greater if it was not partly cancelled out by the inclusion of all firms that had an active payroll during the year, rather than just on the March reference date used for Statistics of US Businesses. The table below is derived from US Census Bureau data, and shows that the population of firms would be about 13% lower if it only included those with a payroll in March.
Year Employer Firms (whole year)
Firms with no employees in March
Employer Firms (March)
% Difference
1997 5,541,918 719,978 4,821,940 -12.99% 1998 5,579,177 711,899 4,867,278 -12.76% 1999 5,607,743 709,074 4,898,669 -12.64% 2000 5,652,544 726,862 4,925,682 -12.86% 2001 5,657,774 703,837 4,953,937 -12.44% 2002 5,697,759 770,041 4,927,718 -13.51%

STD/DOC(2006)4
140
Conclusions In one sense it is easier to compare different data sources from one country, than data from different countries, as, at least in theory, they should give the same answer when all of the differences in methodology have been removed. However, this exercise proves the benefit of highlighting those differences in methodology which might otherwise have been put down to genuine variations if data from different countries were being compared. This, in turn, gives a better understanding of the factors affecting comparability, which can then be used to improve international comparisons of data by separating out genuine variations from those caused by methodological differences. It is possible to explain most of the apparent discrepancies between the data from the different sources considered for each country above by a close study of the metadata available for each source, and by making assumptions (of varying degrees of robustness) of the impact of the main differences in methodology. The lack of standardisation of metadata, in terms of content, terminology and presentation, sometimes combined with a certain lack of clarity, particularly for non-specialists, makes this task rather more difficult than it should be. For several of the countries above the explanations and assumptions have been verified by, those responsible for the source, or are partly based on additional information from national experts. This shows that the metadata necessary for better informed international comparisons could be made available relatively easily.

STD/DOC(2006)4
141
Annex 5 � Business Closures
Introduction The focus of this report has been on the comparability of data on business start-up rates, as this is perhaps the key indicator for studies of business demography, and one of the most important for entrepreneurship. Business start-ups, however, only give part of the picture. To properly understand and interpret the data, it is necessary to know the extent to which new businesses are adding to economic activity or replacing businesses that have closed. Measures of business closure rates are therefore a very useful complement to start-up indicators. This interdependency between start-up and closure rate data has been recognised in the Eurostat business demography project, where there has been a specific effort to develop methodologies for these indicators that closely mirror each other. This approach seems both logical and successful, and implies that the factors of comparability affecting business start-up rates proposed in the main body of this report are also likely to be relevant for closure rates. This Annex explores this hypothesis further, looking at similarities and differences in the ways the factors can be applied. The chart below shows business closure rate data for a number of countries, including two sources for the United States, as published by those countries or Eurostat (for more information on the sources, see Annex 2). It complements that on start-up rates in the introduction to the main body of this report (Figure 1.1). It shows a similar degree of variability, though there are also more gaps in the data. Business Closure Rate Data for Selected Countries
0%
5%
10%
15%
20%
25%
Aus
tralia
Can
ada
Den
mar
k
Finl
and
Ger
man
y
Italy
Latv
ia
Net
herla
nds
New
Zeal
and
Nor
way
Por
tuga
l
Slo
vaki
a
Spa
in
Sw
eden UK
US
(SU
SB
)
US
(BLS
)
2000 2001 2002 Sources: National statistical office and Eurostat publications and internet sites As is the case for Figure 1.1, the chart above is not a particularly meaningful or valid comparison, as the variability shown is due rather more to methodological differences than to real variations between countries.

STD/DOC(2006)4
142
Factors Affecting the Comparability of Business Closure Rates This section considers how far the factors of comparability for business start-up rates identified in Section 3 of this report can be applied to business closure rate data. • Purity It is clear from the discussions on the purity of start-up data that the separation of �pure deaths� from other exits will have a significant impact on data from many sources. It is logically easier to consider purity of start-ups and closures together rather than separately, because in many cases, apparent closures and start-ups can be linked, proving that these businesses have in fact continued to operate, despite appearances to the contrary. There is thus likely to be a strong correlation between the ratios of pure births to total entries, and pure deaths to total exits, for any given source. As with start-ups, reactivations can be difficult to deal with conceptually. A business that is dormant for a few months before re-starting would not normally be considered to be a pure death, however longer periods are not so easy to deal with. If a threshold is applied for start-ups, it is logical that the same threshold should be applied for closures, otherwise businesses will not be treated in a consistent way in the two data sets. There is a specific problem for closures, however, in that the longer the period of time allowed for potential reactivations, the greater the lag in the production of definitive closure rate data. Eurostat apply the same two-year reactivation threshold for closures as they do for start-ups, so the lag for definitive closure data is two years longer than for start-up data relating to the same period. This is partly resolved by the release of provisional estimates until the definitive closure rates can be calculated. • Timing This issue is often more significant for business closures than for start-ups, as the closure process can take many years in some cases, and reporting of closures to administrative and fiscal bodies tends to be rather slower than for start-ups. An entrepreneur might consider a business to be closed from the day he or she stops taking on new work or ceases trading. For accounting purposes there is likely to be a further period during which payments are sought from debtors and made to creditors, until the business accounts can be finalised. There may then be a further period for administrative or fiscal purposes during which any outstanding obligations are either fulfilled or written-off. Finally there may also be some sort of legal procedure, which may take place before, during or after the above. The point at which a closure is recorded will therefore be determined by the nature of the data source. As for start-ups, a closely related issue is that of lags, the different events above may not be notified immediately. Work on lags in the value-added tax data used for the British statistical business register, described in Section 3.2 of this report, revealed whilst registration lags had a median value close to forty days, that for de-registrations was nearly seventy days. • Periodicity The issues affecting closure rate data are similar to those described for start-up data.

STD/DOC(2006)4
143
• Type of Population Virtually all business closure rate data currently available use businesses rather than people as the population, so this factor is unlikely to be important for the comparability of existing closure rate data. • Temporal Basis The differences between point in time and live during period populations are described in Section 3.5 of this report, and, in more detail, in Annex 3. The use of a live during period population will result in a higher denominator and lower closure rates. The issues affecting closure rates are the same as those affecting start-up rates. • Source Where the source of closure data is a statistical or administrative business register, the issues are largely the same as for start-up data, however it is important to know how closures are defined in these sources, at what point in the process closures are identified, and with what lags (see the comments on timing above). This is often more complicated for statistical business registers, as these tend to be updated from a number of statistical and administrative sources, all of which may have different definitions and lags for closures. There is a fundamental problem with survey data on closures, in that if a business has closed, it is often difficult to make contact to confirm this, so it can be difficult to differentiate between closures, businesses that choose not to respond, and those that can not be contacted because they have moved to an unknown address. The wider coverage of a census can help to reduce this problem, but is unlikely to eliminate it. • Units The issues affecting closure rates are similar to those affecting start-up rates. It should be noted that establishment or legal unit closures do not necessarily equate to enterprise closures. • Coverage In some cases, closures may be indicated when a business is still active, but has moved out of scope of the source. Sometimes this may be entirely due to a change in the source rather than any change on the part of the business. It is also possible that businesses that do not respond to, or comply with the requirements of a particular source, may be treated as closed by that source, usually after a certain number of periods of non-compliance or non-response. • Thresholds Similarly, a business can appear to close if it moves out of scope of a particular source by dropping below a certain threshold. Such businesses, however, often continue to operate, albeit at a lower level. An example may be an artisan who reaches retirement age and stops full-time activities, but continues his or her business on a part-time basis, perhaps just for a limited range of customers. Businesses that operate close to the threshold used for a particular source, e.g. sole proprietors that take on employees only when market conditions allow, are likely to move in and out of scope of that source, possibly quite frequently. They would normally be considered to be reactivations, as discussed in the section on purity above, rather than pure deaths followed by pure births. As for start-ups, the international application of a standard threshold would considerably improve the comparability of business closure rates.

STD/DOC(2006)4
144
• Other Factors As with business start-ups, various other factors can affect the international comparability of closure rates, including the complexity of administrative procedures, the impact of tax, subsidy and other policies, the nature of the political system, and a wide range of other economic, political, social and cultural factors. These factors relate more the sort of variation in data that users are really interested in, than to data production methodology. Thus, as for start-ups, this Annex only focuses on methodological factors of comparability. If these can be better understood, and eliminated where possible, data users have a much better chance to observe the non-methodological factors in a less biased way. Conclusion This annex demonstrates that the factors of comparability derived for business start-up rates in the main body of this report, can also be applied relatively easily to data on business closures. There are some differences in terms of the relative importance of the different factors, for example identifying a business closure, and attributing it to a specific point in time is often more of a problem than identifying when start-ups occur. However, these differences are relatively minor, so it is recommended to treat closures as complementary to start-ups in terms of developing data collection and comparison methodology.