Embed Size (px)
Citation preview

HOULIHAN LOKEY HOWARD & ZUKINFJNAN~|AL AoVISORS
ww~" ¯ . hlhz.com
November 1, 2002
The Board of DirectorsmyCFO’, Inc.2025 Garcia AveMountain View, CA94043-1139
Dear Directors:
We understand that myCFO Incorporated ("myCFO" or the "Company")is considering entering into transaction whereby myCFO will sell or transfer (the "Sale" or the "Transaction" hereinafter) the majorityof its assets to a subsidiary of Bank of Montreal (collectively, such subsidiary with its affiliates, the"Purchaser" hereinafter) for approximately $36.4 million in cash and the assumption of certain liabilitiesof the Company (collectively, the "Consideration"). We further understand that payment of theConsideration will consist of: (i) a cash payment of $23.6 million due at closing of the Transaction: (ii) conditional cash payment of $7.5 million to be held in escrow and to be made four years after theconsummation of the Transaction; (iii) a cash payment of approximately $3.8 million for net assets; and(iv) a cash payment of approximately $1.5 million in myCFO’s share of merger related expenses. TheCompany would retain its Strategic Advisory Services business ("STARS"), solely for the purpose winding down its current operations in that area in the ordinary course, along with any other liabilities notexpressly assumed by the purchaser.
You have requested our written opinion (the "Opinion") as to the matters set forth herein. This Opinionvalues the assets of myCFO as a going-concern (including goodwill). For purposes of this Opinion,"reasonably equivalent value" shall be defined as the price at which an asset would change hands betweena willing buyer and a willing seller, each having reasonable knowledge of the relevant facts, neither beingunder any compulsion to act, with equity to both.
It is Houlihan Lo~nderstanding that the Company’s Board of Directors and any other recipl~,t ofthe Opinion will consult with and rely solely upon their own legal counsel with respect to said definitions.No representation is made herein, directly Or indirectly, as to any legal matter or as to the sufficiency ofsaid definitions for any purpose other than conducting a trmancial valuation.
San Francisco ¯ CitiCorp Center * One Sansoma Street, 01700 * San Francisco, California galOa.4a32 ¯ tel.415.974.5888 * ~at.4tS.974.sgGg
LOS Angeles New York Chicago Minneapolis Washington, D,C. Dallas Atlanta Toronto Hong Kong
Investment advisory tJrvices through Houlihan Lokey Howard & Zukin Financial Advisors.
STARS0026395

The Board of DirectorsmyCFO, Inc.November I, 2002 Page 3
We have not independently verified the accuracy and completeness of the information supplied to us withrespect to theCompanY and do not assume any responsibility with respect to it. We have not made anyphysical inspection or independent appraisal of any of the properties or assets of the Company. Ouropinion is necessarily based on business, economic, market and other conditions as they exist and canbeevaluated by us at the date of this letter.
Based upon the foregoing, and in reliance thereon, it is our opinion as of the date of this letter that theConsideration to be received by the Company in connection with the Transaction constitutes reasonablyequivalent value, from a financial point of view.
This Opinion is furnished solely for your benefit and may not be relied upon by any other person withoutour express, prior written consent; provided, however, that the Opinion, any summary thereof or referencethereto,, may be disclosed to (i) the professional advisors of the Company who are informed of theconfidential nature thereof and have agreed to treat such information confidentially and (ii) the Purchaser,provided that the Purchaser executes and delivers to Houlihan Lokey a non-reliance letter. This Opinionis delivered to each recipient subject to the conditions, scope of engagement, limitations andunderstandings set forth in this Opinion and our engagement letter dated September 23, 2002, and subjectto the understanding that the obligations of Houlihan Lokey in the Transaction are solely corporateobligations, and no officer, director, employee, agent, shareholder or controlling person of HoulihanLokey shall be subjected to any personal liability whatsoever tO any person, nor will any such claim beasserted by or on behalf of you or your affiliates.
HOULIHAN LOKEY HOWARD & ZUKIN FINANCIAL ADVISORS, INC.
Attachmentsclient 25886/13634
"... -"
STARS0026396

OCTOBER 2002
Valuation Report:myCFO, Inc.
f
Confidential
Houhhan Lokey Howard & ZukmFinancial AdwsorsCil~Corp CenterOne Sansome Street #1700San Francisco. California 94104-2909415-974-5888www.hlhz.com
San Francisco Los Angeles New York Chicago Washington D.C. MHlneapohs Dallas Allanla London
STARS0026397

Table of Contents
O Houlihan Lokey Howard & Zukin
myCFO
Brief Introduction to Houlihan Lokey ............................................................................................... 1
Executive Sunlmary .................................... ¯ ....................................................................................... 5
History of the Transaction ................................................................................................................ I 0
Company Overview ........................................................................................................................... 15
Valuation ........................................................................................................................................... 20
Conclusion ......................................................................................................................................... 24
" Valuation Exhibits ............................................................................................... : ............................. 26FOS Comparables ........................................................................................................................ 29IAS Comparables ......................................................................................................................... 36Transaction Approach .................................................................................................................. 43Other Valuation Exhibits ............................................................................................................. 48
Description of Comparable Companies ............................................................................................. 55Professional Services Tier ............................................................................................................ 56Assets Management Tier .............................................................................................................. 64
1" i
STARS0026398
Brief Introduction to Houlihan Lokey
Draft/Confidential
STARS0026399

Brief Introduction to Houlihan Lokey
O Houlihan Lt,~ey Howard & Zukin
myCFO
BACKGROUND
4,
. ..-.
o..
Founded in 1970, Houlihan Lokey Howard &. Zukin was formed initially to providebusiness and securities valuations.
The firm’s reputation in quantitative and analytical analysis served as a platform for
providing Financial Advisory Services (i.e., strategic advisory, ESOP feasibility, solvencyopinions, litigation support, etc.)
Tile firm began providing corporate finance services in 1987, and today l-louliha,~ Lokey
is recognized as one of the leading middle-market investment banks.
Houlihan Lokey expanded into merchant banking in the late 1990s as the firm began toleverage its thriving advisory/agency businless into principal opportunities.
Headquartered in Los Angeles, l-loulihan Lokey today has over 500 employees in nineoffices in North America and Europe.
r,.
2002Expansion into Europe
1999Century Park Capital Partners
1997Sunrise Capital Partners
1996Information Services (Mergerstat)
1988Financial Restructuring Services
1987Investment Banking Services
1976Financial Advisory Services
1970Business Appraisal Services
Draft/Confidential f 1
STARS0026400

Brief Introduction to Houlihan Lokey
O Houlihan Lo~ey Howard & Zukin
myCFO
RECENT HIGHLIGHTS AND ACCOMPLISHMENTS
¯ :" Houlihan Lokey has established itself as one of the preeminent middle-marketinvestment banks. The firm’s credentials include:
Ranked Among Top 20 M&A Advisors For Tenth Straight Year
Ranked #1 Advisor tot Transactions Under $200 million and#2 Advisor for All Transactions for the 1~’ half of 2002
Co,npleted 148 M&A Transactions Totaling Over $13.7 billion
Placed over $2.3 Billion of Financings
The Leader in Financial Restructurings -- Over 150 Engagements
Ranked # 1 Provider of Fairness Opinions in the United States
Served Over 1,000 Clients
Currently Retained on Approximately 70 M&.A Transactions
Currcntly Retained on Financings Totaling Over $1.7 hillion
Over the Last Ten Years, Advised on Over $20 hillion of ESOP buyouts
r,.;
First tlalf 2002 M,6tA Advis.ry RankingsU.S Deals Under $200 Million
First Ilalf 2002 M/~t.+A Advisory Ranking5All U.S. AJ~nounccd lleals
.......................................Nulll~’l ~.t kl.
R4Itk I’llldllt I’l Advl*llf I~[ I~’M* ~lldl~"I (’lldll SlllS.t I11+i lh,.l,,. Ills | 22 ll~bdltlar+ L~Key Huw+nl & Zukil+ 74 :/ J
II’ M,,I~..~ I’I 1 5$ (,,,hhn.,,~ ~,.h. ~ (’,, 47 1 4I, Lllt% W~tl~l,rg I I I7" ,’.~,’rlLIIL~I,,I~ t’,, hl~ 42 I I~" t ’.+~,,*.i~.,h.l,,., ~+lult~ l~.,rn, ~’ ~ -+ I ’!’+ l~u~, ,,I ^m,’+l,..+ ~,,,..+, ~ I LI 17 I IIII l.hm,,l+ lh,,lh,’r. "I’~ I II1" I ~.~11,, hi. Ihllk At. 2t, IllsI I o I h t’llh,+It,ll fln.lll, i d ( ’,.tl’ ~l, 11 I<I t Lit,lid ~ 4 ii }"14 | llIl~XV,,lhl ,%hlkct+ Iii. ~41 411,I~* Hilt: I ,iiiii,ii ~111 ~i i. I*~ I111I 5" ~,lllt’l lXl~I IS HII.. I ’l II l,17 l~l’X 4..III~’P~I, I ).,ll..l,l Ii,.,., nl,,ll,. I. llllIt< t I~, It ,.,..,+i, 17 o’~I+ II,,1’~ , l..~t , h,, 11. ii/l
211 I+’¢,,, hl++l + I "lI’ I I II I
O mt) 11 +,
tl 1,lli.
(I l,O,,
I~5
11%
+I++
ll-I
11411+
Draft/Confidential f" 2
STARS0026401

Brief Introduction to Houlihan Lokey
O Houlihan LC,,’,ey Howard & Zukln
myCFO 1
ORGANIZATIONAL STRUCTURE
-- Mergers and Acquisitions
:̄" Sellside "l’ransact.nls
+ Buyside Transactions
:̄- Levcraged Transactions
-- Private Finance
¯ ;" Private Debt and Equityl’laccmc,~ts
:̄" IPO Advisory
-- Corporate Alliances
¯ :" Joint Ventures
¯ :" Minority EquityWrallSactiuliS
¯ :" Cross EquityTr;.IIIMICI IOll~
¯ :" Fairness Opilfions
+ Solvency Opinions
¯ :- Business and SecuritiesValuations
¯ 1" Goodwill Inq)airmcnt
¯ :" Intangible AssetValuat ions
¯ :" Dispute Analysis andLitigation Support
¯ :- Str.’itcgic AhcrnativesASSCSSIllL’II [ S
¯ :- Imtcpcndcnt TransactionAssessments
¯ :- Century Park Capit:dPartners. L.P. ($100Mtlhon Cotttr()l :rod Non-Control Equity Fund)
¯ :" Sunrise Capital Partners.L.P. ($200 Mdlionl)isircsscd Equity Fund)
Pv
¯ :" Chapter I I l’lanning
¯ :° Rt’SiltlC’ttlrillg l)cbi :illdEquity
¯ :- I)cbt tlr-in.lJosscs~ilnl("1)11 v’) Fhlalit’lilg
"~" Exch,ingc Ofl’cr~
"-" ill;ill. ’, of Rcilt-galUZaliOli
¯ :" l)istrc~.~cd /X’lClgt’rs alidmt’q tii$i t IOli.~
Draft/Confidential f 3
STARS0026402
Brief Introduction to Houlihan Lokey
O Houlihari Lukey Howard & Zukin
myCFO
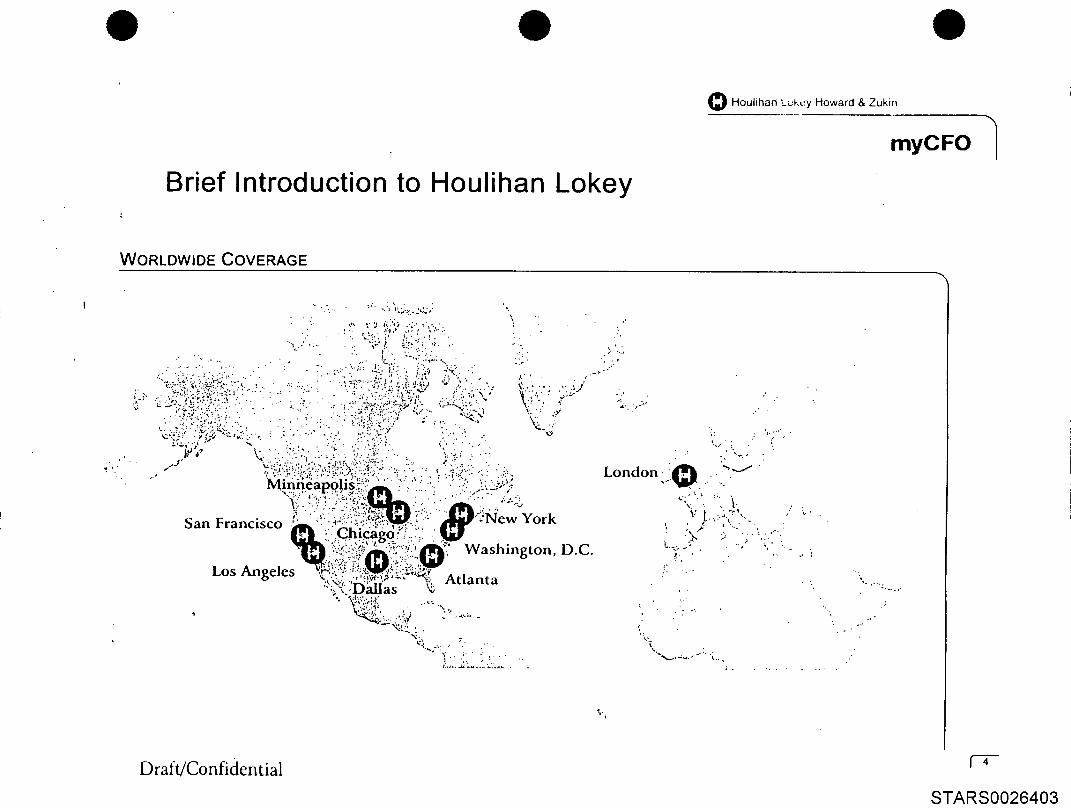
WORLDWIDE COVERAGE
. .-,.:
". ¯ *."
..,’.. :. ¯ ... . ,
.~t... --. 2,. ..... :..". ....
Draft/Confidential
STARS0026403

Executive Summary
Draft/Confidential
STARS0026404

Executive Summary
O Houlihan l.okey Howard & Zuk~n
myCFO 1
PURPOSE
myCFO, Inc. ("myCFO" or the "Company") is selling (the "Transaction") the majority of its assets to a subsidiary of of Montreal (collectively, such subsidiary with its affiliates, the "l~urchaser’’ hereinafter) for approximately $39 million in"cash and the assumption of certain liabilities of the Company (collectively, the "Consideration"). The Company wouldretain its Strategic Advisory Services business ("STARS"), solely for the purpose of winding down its current operations that area in the ordinary course, along with any other liabilities not expressly assumed by the purchaser.
The Board of l)ircctors (the "Board") of myCFO has requested that Houlihan Lokcy render an opinion (the "Opinion") to whether the Consideration to be received by the Company in connection with the Transaction represents rc,tsonablyequivalent value for the assets purchased and liabilities assumed by the Purchaser (the "Assets"). The Opinion does n(;taddress the Company’s underlying business decision to effect the Transaction. We have not been engaged to initiate anydiscussions with third panics with respect to a possible acquisition of the Company.
Draft/Confidential 1" 6
STARS0026405

Executive Summary
O Houlihart ,_..~,ey Howard & Zuk.:~
SUMMARY OF DUE DILIGENCE PERFORMED
.. , , .
In order to reach our findings we have among other things:
¯ :" l-tcld discussions with the following individuals:¯ Art Shaw: Chicf Executive Officer and President, myCFO¯ Stcvc Dcbcnham: Senior Vice l’resident, General Counsel, Corporate Development
Sccretary, myCFO¯ Bill Lapworth: Co.ntrollcr, myCFO¯ Harvey Armstrong: co-Founder and Managing Director, myCFO¯ lcrrcl limcrson: Senior Vice President of Technology Products and Services, myCFO
¯ :" Rcvicwcd the following documents:¯ Executed Asset Purchase Agreement, exhibits and appendiccs, dated September 26, 2002¯ Amended and Restated Certificatc of Incorporation of myCFO, Inc.¯ "Perspectives on Wcahh, myCFO Technology" presentation, datcd August 2002¯ Unauditcd Financial Statements, datcd August 2002¯ myCFO Financial Analysis and Projections Breakdown¯ Monthly revenues, lanuary through August 2002¯ Unauditcd financial statements as of September 31, 2002¯ Top 10 client revenues, Scptembcr 2001 through August 2002¯ Balancc Shcet Detail, August 31, 2002¯ Audited financial statements for the fiscal ycars ending l)ecember 3 1, i 999 through 2001¯ Presentation to Potential Acquirors prepared by Goldman Sachs
Officer
Projections dated Decembcr 2000, prepared in connection with thc Company’s last equity financi~lgAmendment No 1 to Asset Purchase Agreement
and Corporatc
Draft/Confidential 1" 7
STARS0026406

Executive Summary
O Houhhan Lokey Howard & Zukm
SUMMARY OF DUE DILIGENCE PERFORMED (CONTINUED)
:̄" Reviewed publicly available information on the industry, myCFO, and comparable companies and transactions;
:̄" Conducted such other studies, analyses and inquiries as wc have deemed appropriate.
In all cases we have assumed, without verification, that the financial forecasts and projections provided to us have beenreasonably prepared and are accurate in all material rcspccts.
Draft/Confidential
STARS0026407

Executive Summary
SUMMARY CONCLUSIONS
O Houlihan Lokey Howard & Zuk~n
myCFO
We have concluded that the Consideration to be received by the Company in connection with the Traiasaction representsreasonably equivalent value for the Assets.
Draft/Confidential [" 9
STARS0026408

History of the Transaction
Draft/Confidential
STARS0026409

History of the Transaction
Houlihan ’._okey Howard & Zukin
myCFO
myCFO was founded at the peak time of wealth creation in Silicon Valley. However, tile downturn in the teclmolot,9, andinternet industries that began in 2000 led to a decline in the number of eligible existing clients ai-ld potenti;l] new clicntsfor myCFO. Investors in myCFO had wanted the Company to go public, but by late 2001 it became clear that was notlikely.
In late 2001, myCFO was approaclled by Dct,tsche l~ank ("Deutsche") about a possible transaction. Deutsche andmyCFO had a pre-existing relationship in which Deutsche provided loans to myCFO clients in conjunction with largetransactions, such as major asset purchases.
In February 2001 the Company began an i,dor,nal informatio,i exchange with Deutsche and soon lifter informed the.Board about these discussions. The Board engaged Goldman Sachs in April 2001 to represent m),CFO in talks withDeutsche.
During the early stages, myCFO and Deutsche discussed a valuation range of $200 to $300 millio,i tot the Co,upany.This valuation was based on the following factors: (l) a March 2001 financil~g round of $45 million at ,i p,’c-mo,leyvaluation of $250 million; (2) projected 2002 revenues that ranged from $80 to $100 million; (3) a tr,uasactio,~ multipleof 2.0 to 3.0 times revenues; and (4) incremental revenue potential from Dcutsche’s ability to sell services into myCFO’sclient base.
Draft/Confidential
STARS0026410

History of the Transaction
O Houhhan LoKey Howard & Zukin
myCFO ]
Goldman Sachs believed that other parties in addition to Deutsche may be interested in acquiring myCFO. During thefirst half of 2002, Goldman Sachs and myCFO contacted approximately 30 institutions, met with approxinmtely 20companies about a possible transaction with myCFO and entered into confidentiality agreements with 10 parties.Meanwhile, the financing markets were becoming increasingly difficuh and the Company’s $2.5 millio,i per month cashburn rate sent (’ash levels running low. myCFO was able to continue financing operations thr,)ugh bridge loans frominvestors that reached $10.5 million by September 2002, and a $8.9 million line of credit through Silicon Valley B;mkthat was guaranteed by Company investors. The Board quickly became anxious to find a buyer.
Between May and July 2002, the Company created and met with a "short list" of players based on expressed interest inmyCFO: Charles Schwab & Co. ("Schwab"), I.P. Morgan Chase & Co. ("Morgan"), Mellon Bank, Merrill Lynch,Deutsche and Bank of Montreal.
Morgan had indicated interest in purchasing pieces of myCFO at a wduation of approximately $30 million. Thesediscussions did not proceed to a formal offer.
In July 2002, Deutsche ceased negotiations with myCFO. Internal instability and profitability issues had led Deutsche toannounce that it would not enter into any transactions that were dilutivc to Deutsche. Furthermore, IDcutsche hadindicated concern about possible IRS scrutiny of the tax minimization transactions implemented by STARS during earlydiscussions with the Company. Increased publicity surrounding possible IRS scrutiny of creative tax strategies ledDeutsche to become more wary of the STARS business line and eventually withdraw from talks with myCFO altogether.
Schwab had expressed interest in purchasing pieces of the Colnpany at a preliminary valuation of $50 million (prior todue diligence), myCFO approached Schwab again as talks with IDcutschc fizzled, but Schwab was unwilling to undergo :lcompetitive bidding process. Upon learning of myCFO’s unwillingness to negotiate only with Schwab, Schwal) ceaseddiscussions with the Company by August 2002.
Draft/C0nfidential
STARS0026411

History of the Transaction
O Houlihan Lu~-’..’y Howard & Zuktr,
myCFO
... , .
myCFO began formal talks with Bank of Montreal ("Purcl~aser") ill June 2002. On July 1, 2002, the Purch:,scr sub,nittcda non-binding proposal for $80 to $100 million in cash with possible earnouts of $25 to $60 million in exchange for100% of the Company. The Purchaser conducted due diligence on the Company in July and At,gust of 2002.Meanwhile, financial results from the second quarter were finalized and were disappointing relative to managementprojections. Furthermore, Bank of Montreal became increasingly concerned .d~out the STARS busi,less, as STARS hadgenerated little revenue for the year to date (versus 47% of revenues in 2001) and publicity surrounding potential IRSscrutiny of similar types of operations had increased substantially. On August 5, 2002, the Purchaser submitted asuperceding bid of $60 million in cash and a possible earnout of $() to $40 million for all of the assets a,~d cert:finliabilities (totaling approximately $70 million) of myCFO. This deal v:due was contingent o,1 STARS achieving certainrevenue targets.
On September 13, the day of the meeting ill which the Bank of Montreal board would vote o,1 approvi,~g a transactionwith myCFO, an article appeared in the New York Times indicating that the IRS intended to crack down on certain taxstrategy loopholes. At that point, Bank of Montreal decided that any deal with myCFO would not i,lch,dc STARS. AsBank of Montreal hesitated, the Board became increasingly concerned about liquidity of the Co,npa,~y. The Board :dsoconsidered several alternatives relating to tile wind-down of the Company in the event that a deal was not secured.
Bank of Montreal decided to move forward with a transaction that excluded STARS and suhmittcda proposal for $39million for the purchase of the Assets of the Company. The Board felt that the Consideration, at a multiple ofapproximately 1.0 to 1.5 .times expected non-STARS revenues of $30 million, was a fair offer for a financi:d servicescompany and opted to accept the offer.
Draft/C0nfidential 1F35-
STARS0026412

History of the Transaction
Houlihan Lokey Howard & Zuk~n
myCFO
In exchange for the Consideration, Purchaser will receive from tile (]ompany :ill operating assets of the current co,lq3any,excluding any STARS-related assets and certain other assets. The Consideration consists of the following:
:̄" Approximately $23.6 million in cash:̄" $7.5 million held in an escrow account+ approximately $6.1 million for net fixed assets:̄" approximately $1.5 million in myCFO’s share of merger rclatcd cxpenscs
Thc Consideration may be subject to the following adjustments:
¯ :" Changes to the book value of the Assets on the closing balance sheet+ myCFO must dcliver at least 80% of currcnt clients (by rcvenues, excluding STARS) or the Consideration will
reduced by $400,000 for each percentage point bclow 80 pcrccnt for a nlaxinlum reduction of $ i 2.0 million
Furthermore, as a condition of closing the Transaction, the Company must deliver to Purchaser at the close, :lmo,lg otheritcms, assignment of all agreements, contracts, conm~itments, leases, and permits of the Company. The Trans,tction isexpected to close on November 1,2002.
tl,I
Draft/Confidential ~" 14
STARS0026413

Company Overview
Draft/Confidential
STARS0026414

Company Overview
Houlihan Lokey Howard & Zukin
myCFO
OVERVIEW OF MYCFO
myCFO is a provider of wealth-advisory professional services that utilize internet technology for individuals with a networth of at least $10.0 million. The Company provides "big picture" advice and strategies that allow wcalthy individt,alsto maintain control of all aspects of their finances while reducing tile amount of time an individual spends on financialmanagement. Tile Company works with all of the client’s existing financial advisors to derive an overview of theindividual’s financial situation, then creates a plan for financial management that will encompass all of his or her financialgoals, including tax planning and preparation, expense management, investment strategies, philanthropic giving and assetacquisition, myCFO does not sell products and therctorc remains an unbiased party. Tile client (and any partiesauthorized by the client) can access real-time information about the individual via an easy-to-use internet interface.
The Company has received three rounds of financing
Pre-Money ValuationRound l)ate Amount (millions) (millions)
Series A August 1999 $20.0 $20.0Series B June 2000 $25.0 $200.0Series C March 2001 $45.0 $250.0
Draft/Confidential f" 16
STARS0026415

Company Overview
O Houlihan Lokey Howard & Zukin
myCFO
OVERVIEW OF MYCFO (CONTINUED)
myCFO is engaged in three lines of business:
¯ :" Family Office Services ("FOS")¯ Provides services to wealthy individuals and their families including tax strategy and compliance, expense
management, risk management and insurance, and philanthropyFOS is priced on a fixed-fee retainer basis based on tile complexity of services and the net worth of the client; extraservices are billed as time and materialsFOS revenues comprised approximately 57.8 percent of year-to-date revenues as of August 31, 2002 and 39.6percent of revenues for the fiscal year ending December 31,2001
.;, ,". ":" Investment Advisory Services ("IAS"): ¯ Services include asset allocation, manager selection, asset placement and capital markets
¯ IAS services are priced as a percentage of assets under management¯ Nearly all revenues derived from direct management fees¯ IAS revenues comprised approximately 25.8 percent of ycar-to-date rcvcnues as of August 31, 2002 and 13.2
percent of revcnues for the fiscal year ending December 31,2001
¯ :- Strategic Advisory Services ("STARS")¯ Highly customized, advanced tax planning strategies¯ STARS services are priced on a pcr-projcct basis¯ STARS revcnues compriscd approximately 16.4 percent of ycar-to-datc rcvenucs as of August 31, 2002 and 47.3
percent of revenues for the fiscal year ending Decembcr 3 I, 2001¯ Historically, the majority of STARS revenucs were generated in the fourth quartcr
Draft/Confidential l" 17
STARS0026416

¯ Company Overview
O Houlihan L~key Howard & Zukin
myCFO
SWOT ANALYSIS
STRENGTHS¯ Strong existing client base¯ Experienced management team in tune with clients’ needs¯ Proprietary technology platforn~ that provides a one-stop-shop for all financial information ,rod reporting for both
clients and the Company’s representatives¯ High historical revenue and client base growth¯ Strong tradename¯ Ranked as the nuinber one wealth management company by Bloomberg¯ Has historically relied on clients with new wealth rather than trying to compete for existing market shares, limiting
marketing expenses¯ One third of new clients have been referred by existing clients
WEAKNESSES¯ Ciicnt base growth has stagnated¯ Half of historical business has been generated from STARs, a business line that has recently been criticized by the
Treasury Department¯ Risk of losing clients if employees leave the Company¯ Unprofitable¯ Need additional financing to reach profitability; low current cash balance¯ Has not been able to leverage the technology platform into the larger pool of individuals with assets in the $1 to $10
million range¯ Book value of clients have dropped drastically due to deterioration of the stock market lowering assets under
management¯ Missed financial forecasts for the last thrce quartcrs¯ Over thc course of 18 months, 2002 projections wc,~t f,-om $140 million to $25 million
Draft/ConfidentialSTARS0026417
Company Overview
O Houlihan L okey Howard & Zukin
myCFO 1
SWOT ANALYSIS (CONTINUED)
,0
OPPOi/,TUNITIES¯ Target wealth group in $1 to $10 million, in order to leverage the technology platform* Cross sell services to the existing client base* Add complementary services
THREATS* Current market conditions have cut the Company’s traditional source of new clients¯ Will have to start advertising to attract new clients which will put further pressure on losses in the short-tcrnl¯ Many of the Company’s existing clients have lost large portions of their wealth and may not need the Company’s
services¯ The potential market is shrinking resulting in increased competition, which may have a negative impact on growth
and profitability
Draft/ConfidentialSTARS0026418

Valuation
Draft/ConfidentialSTARS0026419

Valuation
O Houlihan Lokey Howard & Zukin
myCFO
VALUATION APPROACH
We applied the public market approach and transaction approach to determine the value for myCFO.
In the market approach, revenue capitalization multiples were derived from two tiers of publicly traded companics,professional services companies and asset management companies. In general, the public comparable companies are muchlarger, better-capitalized entities that have a stronger presence and a larger customer base. To properly capture theCompany’s business mix, we capitalized the revenues for FOS and [AS separately.
FOS:
We relied on the professional services tier to select muhiples for FOS. All the comparable companies were substantiallylarger and more profitable than the Company, and most of the comparable companies were projected to have muchhigher growth. Therefore, the FOS business should be valued at the lower-end of the tier. The most comparablecompany in this tier is Century Business Services (0.5x 2002 revenue), which provides financial services, such as taxplanning and preparation and financial planning services, to small companies and high net worth individuals. CenturyBusiness Services has not been able to meet projections over the past few quarters. Therefore, the FOS business shouldbe valued similarly to Century and at the lower-end of the comparable companies range. We selected a muhiple rangebetween 0.4x and 0.6x projected 2002 revenues.
[AS:
In order to select multiples for [AS we considered the asset management tier. We were not able to identify anypublicly traded companies that derive a majority of its revenue from investment advisory services to individuals. Theselected comparable companies provide guidance regarding the multiples, but should be wdued at a premium to theCompany because:
Draft/Confidential (’21
STARS0026420

Valuation
Houlihan Lor, ey Howard & Zukin
rnyCFO
VALUATION APPROACH (CONTINUED)
* In general the comparable companies have significantly larger amounts of assets under management* The comparable companies charge higher management fees as a percentage of assets under management (generally
between 1% to 2%)¯ All the comparable companies were significantly more profitable than the Company* Most of the comparable companies offer mutual funds and provide brokerage services¯ Along with these services, some of the comparable companies provide similar services to myCFO, thus outdoing
myCFO with respect to a one-stop-shop.
Asset management and investment advisory services are highly competitive and the ability to charge a premium overand above the standard fees is not likely, myCFO is primarily operating as an advisor to assist its clients to build aninvestment strategy and introduce them to investment brokers or asset management firms that are able to provide theexecution of the plan. In order for the Company to cam a fee the clients will have to pay more than what is required toinvest their assets. The Company charges an advisory fee (ranging 0.2% to 0.5% of assets under management) that substantially lower than what asset management companies charge on average. Therefore, the IAS business should bevalued at a lower muhiple than the comparable companies, and we selected .a muhiple range between l.Sx and 2.0xprojected 2002 revenues.
The market approach indicated a value range from $24.0 million to $34.0 million on a controlling basis, based on a26% control premium. We analyzed the control premiums of 26 transactions involving assets management andfinancial advisory companies (see page 45). The control premium was selected based on the median control premium the study. This conclusion implies a range of multiples for the Assets of 0.8 to 1.1 times 2002 forecasted revenue of$25 million on a minority basis and 1.0 to 1.4 on a controlling basis.
Draft/Confidential
STARS0026421

Valuation
O Houlihan Lokey Howard & Zukin
myCFO
VALUATION APPROACH (CONTINUED)
Transaction Approach:
FOS:
The most comparable transactions-for the FOS business were the sale of Canadian First Financial Group in May of2002 for $6.8 million and the sale of I-ID Vest in March of 2001 for $114.1 million. Both companies offered similarservices to the Company in that they provide financial advisory services primarily to individuals. 13oth of thesetransactions were valued at 0.6X revenue.
IAS:
The comparable transactions for I.AS involved mostly companies that directly managed assets for clients or pcrtormcdadvisory services to funds. Most of the comparable transactions involved larger companies with more assets undermanagement and these companies should be valued at a premiuin to the Company. We based the selected muhiplerange on the median multiple of the tier.
The indicated value range based on the transaction approach was between $25.5 million and $34.0 million. Ourconcluded value range is between $25.0 million and $34.0 million.
Draft/Confidential ~" 23
STARS0026422

Conclusion
Draft/Confidential
STARS0026423

Conclusion
O Houlihan Lokey Howard & Zuklll
myCFO
We have concluded that the Consideration to be received by the Company in connection with the Transaction representsreasonably equivalent value for the Assets.
OTHER FACTORS SUPPORTING REASONABLE EQUIVALENCY
1) The Company and its advisors went through an exhaustive sale process
2) Bankruptcy is the only apparent alternative to a sale to Bank of Montreal
3) The Company has little cash on hand; operations are funded as needed by the largest shareholders through theissuance of notes
4) Between the last round of financing and now, projected revenue for 2002 fell 82 percent. The valuation fellsimilarly implying a similar multiple even though the Company’s overall condition has worsened (sec page 51 ).
Draft/Confidential
STARS0026424

Valuation Exhibits
Draft/ConfidentialSTARS0026425

Valuation Exhibits
VALUATION SUMMARY
(figures in millions)
Consideration Received
Cash for certain operating assets (net liabilities)
Reimbursed merger related fees (I)
Additional Consideration
$6.10
$1.50
$31.10
[Total Consideration $38.70
Value of Assets Sold and IJabilities Assumed
Indicated Value Range - Market Approach
Indicated Value Range - Transaction Approach
$24.00
$25.50
$25.00[Concluded Value Range
Draft/Confidential
O Houlihan L....~ey Howard & Zukln
myCFO
$34.00
$34.00
$34.00 [
f 27
STARS0026426

Valuation Exhibits
VALUATION SUMMARY - MARKET APPROACH
Valuation Methodologies
I__CY 2002 Revenue (I)
Fo..~s
CY 2002 Revenue (2)
O Houlihan Lokey Howard & Zukin
myCFO
iAs
CY 2002 Revenue (2)
RepresentativeLevel
$25.00
ImpliedMultiple Range
0.Sx I. Ix
Indication ofEnterprise Value
$19.35 $’26.90
RepresentativeLevel
$16.50
SelectedMultiple Ranl~e
0.4x O.6x
Indication ofEnterprise Value
$6.60 $9.90
RepresentativeLevel
$8.50
SelectedMultiple Range
1.5x 2.0x
Indication ofEnterprise Value
$12.75 $17.00
Indkcated Value Range (minority basis)
Add: Control Premium at 26.0%
Indicated Value Range (controlling basis)
]Concluded Value Range
$19.35 $26.90
$5.03 $6 99
$24.38 $33.89
$24.00 $34.00 I
( I ) Aggregate calendar year 2002 revenue provtded by management and based t)n Company’s current run-rate.’(2) Calendar yea/2002 revenue breakout for FOS and IAS based on projected Q3 2002 rc’,cnuc split.
Draft/Confidential
STARS0026427
Valuation Exhibits
FOS ComparablesIAS ComparablesTransaction ApproachOther Valuation Exhibits
Draft/Confidential
STARS0026428
FOS Comparables
O Houlihan I ..;~,ey Howard & Zukm
myCFO
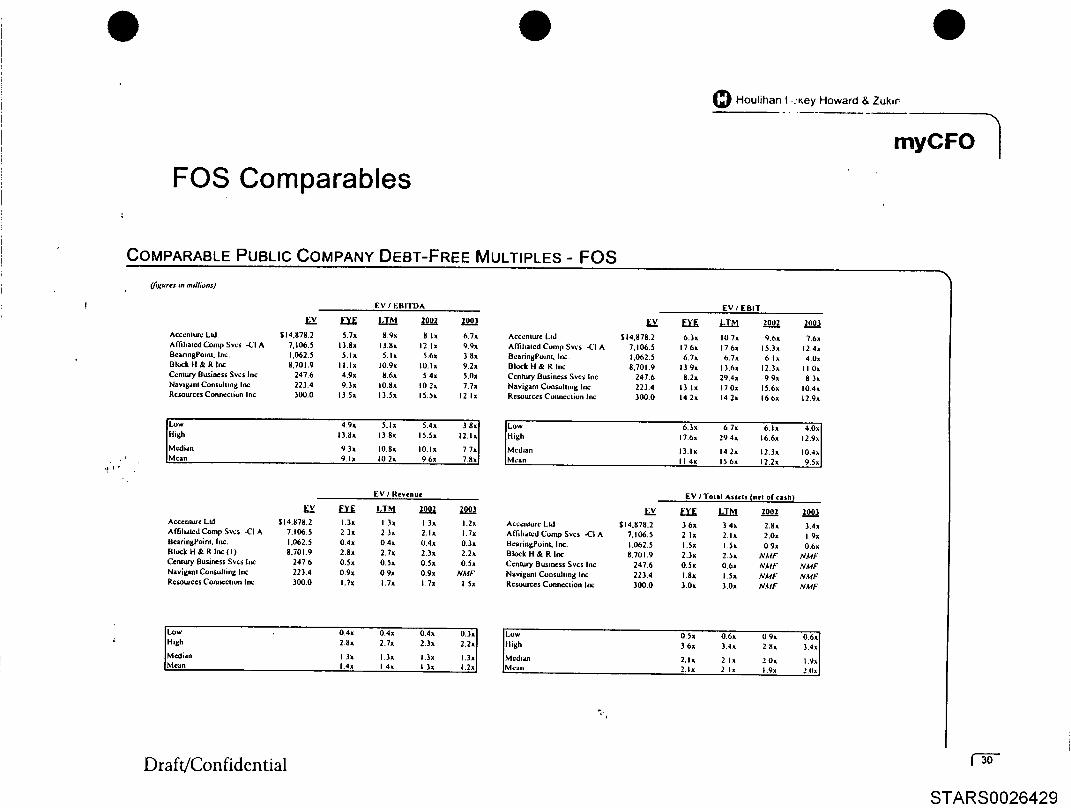
COMPARABLE PUBLIC COMPANY DEBT-FREE MULTIPLES - FOS
EV / EBITDA EV /EBIT
Ev ~ ~ zooz zoo] zv ~ ~ zoo._.3.zAcccnlur¢ Lid $14.878.2 5.7x 8.9x 8 Ix 6.7x AcccnluJre Lid $14,g78.2 6.3x I0 7x 9.6x 7.6xAmhalcdComp Svcs -CIA 7,106..S 13.8x 13.gx 12.Ix 9.9x AmhatcdCump Svcs -CIA 7,106.5 17.6x 176x 15.3x 12.4xBcanngPoml, Inc. 1,062.5 5. Ix 5. I x 5.6x 3 8x BcaringPomt, Inc. 1,062.5 6.7x 6.7x 6 I x 4.0xBlock H x, R Inc 8,701.9 I I.Ix 10.gx 10. Ix 9.2x Block H & R Inc 8,701.9 13 9x 13.6x 12.3x I I.OxCcnlu~ Business Svcs Inc 247.6 4.9x 8.6x 5.4x 5.0x Ccnlxu’y Business Svcs Inc 247.6 8.2x 29.4x 9 9x 8 3xNavlgdnt Consulting Inc 223.4 9.3x 10.Sx 10 2x 7.7x Navigant Consulting Inc 223.4 13 Ix l ?.0x 15.6x 10.4xRcsuurccs Comlccliun Inc 300.0 13.5x 13.5x 15.5x 12 Ix R ¢su= c.cs Cum-,cclion I nc 300.0 142x 14.2x 166x 12.9x
fLow 4.9x 5Ix s.4x ] 8x] JLow 63x 6 7x 6,Ix 4.0xlHigh 13.8x 13 8x 15.5x
12.1x] IHigh 17.6x 294x 16.6x 12.9x
IMedian 9.3x 10.gx 10.ix 7 7~| ]Median 13.1x 14 2x 12.3x 10.4xMean 9. Ix I0 2, 9 6x 7.gxl IMcan I I 4x 15 6x 12.2x 9.5x
EV I Revenue EV I ToIII AIS¢II (net of elsh,)
w ~ ~ zooz ~ t, Lv. E.X.t;. TI=E.Et zoo..._Zzzoo~Accenm.rc Lid $14,g78.2 1.3x 1.3x I 3x 1.2x Acccnturc Lid $14,878.2 3 6x 3 4x 2.8x 3.4xAffihalcd Comp Svcs -CI A 7.106.5 2 3x 2 3x 2.Ix I.Tx Affshatcd Comp Svcs -CI A 7,106.5 2 Ix 2.Ix 2,0x I 9xBcaringPoim. Inc. 1,062.5 0.4x 0.4x 0.4x 0.3x BcaringPoim, Inc. 1,062.5 1.5x I.Sx 0 9x 0.6xBlock H & R In*: (1) 8.701.9 2.8x 2.7x 2.3x 2.2x Block H & R Ioc 8.701.9 2.3x 2.5x HAlF NMFCentury Business Svcs In: 247 6 0.Sx 0.Sx 0.Sx 0.Sx Ccnlxxr), Bu.smcss Svcs Inc 247.6 0.Sx 0.6x NMF NMF"Navlgant Consulting Inc 223.4 0.gx 0 9x 0.9x NA, fF" Navigam Consulhng Inc 223.4 I .gx I .Sx NMI-" NMFReSOClZC¢$ ConxK:Ctlun Inc 300.0 I.Tx 1.7x 1.7x I 5x RcsuuJrccs Conocction In: 300.0 3.0x 3.0x IVMF NMF
JLow 0.4x 0.4x 0.4x
0.3,,J
Low O.S* 0.6,, 0 9x0.6,1
High 2.8x 2.7x 2.3x 2.2x Iligh 3 6x 3.4x 2 8x 3.4xMedian I 3x 1.3x 1,3x 1.3x IMcd~=n 2.Ix 2 Ix 20x I.gx[Mean 1.4x I 4x 1.3x 1.2x ]ML’an 2.Ix 2 Ix 1.9x 2.0xJ
Draft/Confidential
STARS0026429

FOS Comparables
O Houlihan L9key Howard & Zukm
COMPARABLE PUBLIC COMPANY LEVERAGED MULTIPLES -- FOS(figures An ,mllsonz)
Price / EtrninK=
EyE, ~ 2ooz zoo]Acccnture Lid $15.317.1 8.3J, 13 7x lb.Ox 13.5,tAffihated Comp $vcs -C] A 6.430.8 27.2x 27.2x 22.7x 19.0xHcaringPoint. Inc. 1.264.2 18.gx I IS.Sx 15.7x 10.2xEllock H & R/nc g,01~.4 I8.Sx 172Jt ISgx 14.5xCentury Business Sv¢~ Inc 273 4 19.SJt NMF I I~.OJt |4.3xNavigant Consulting ln¢ 239.9 23.5~, 3 I.gx 27 9x 18.bxRcsout’ccs Conncction Inc 331 8 24.g~, 24.t1~. 29.0~ 22.4~
Low 8 3J, 13.7x 15.7,.t 10 2xIHigh 27.2x 31.8=, 29.0a 22.4x
Median 19.SJt 21.8x 180x 14.5.,Mean 20. Ix 22.3x 20.7.,. 16. Ix]
¯ "1,,
Draft/Confidential
STARS0026430

FOS Comparables
O Houlihan Lokey Howard & Zukin
myCFO
RISK ANALYSIS RANKINGS - FOS
Size(Rc~cnu©, mdhons)
Acccnlur¢ Lid $ I 1.660 0Ulock H & R IrK 3.179.7AEdmlcd Comp Svcs -CI A ].062.9Bc+nnsPolm. In¢ 2.367,6Ccnlur/Bu,lncsi Sv¢~ In¢ $O4,6Nmvi41m Con~lhn4 In+: 236 9K~uurces CormrCllOn Inc I+11 1Llrlmlb ...... ,,111
Size(l:nlcl~ns¢ YilU¢l mlil~otL$)
AccenluR Lid S14J71 2Block H & K Inc 11.701.9Al~l.aled CumpSvcs ..CIA 7.106 $I}¢.rinl(Pu,nl, IrK. I.(}¢2 K~rces Cunn¢climl hie 3O0,0Crnmry Buim~s SvcL In¢ 247 6Navllean! Con~Ll.nl~ IlK 223.4
I|||¢orkml Crowlh(2-Y©ar Revenue)
Amhsled Cocnp Svcl~ -CI A 24.9%Rc~ouzccs COml~¢liocb Inc 19 4%Hicxk H& R Inc 14.1%Acccnrurc Lid 9 5%Nivl4um Cunsuhm~ IrK },6%UeiHn~Puml. [no O 0%Cenlurj Bu~ness Sv~ Inc -I.4%
Hl$1orlcml Cl’o~b(I-Year Revenue)
Amlialcd Comp Svcs ..CI AA,:ccnlur¢ Lidk~kJcL H & R b~c
Nlv~&anl Consulhn4 Ir~cRc+ourccl Com~¢l~n Inc
Century Uu~ineu Svcs IrK
BcarinllPom,. Inc
II:L
4S.4%173%15 2;;-3 7%-5 I%-7 2%
-17 I%
ProJcclrd Crowlb( I-Ycal Rcvcnuci
Bh.~k H & R incB¢anniPom|. Inc.Al~liltcd Cutup Svcl .4+’1ANlvl~lnl CunsU~lln~ lncAc+.cnlulc I.idReboulc¢~ Curmecllon IncCennlrv Ousln~.. S,c~ Ira"
Ls~
22.3%14.5%12 6%9.9*,;I 2%
-0 I%-52%
[lT, II
Hblorleml Crowlb(2-Yc~r EBITDA)
All~hlled Cutup Svcs .4{:1 A 32 3’4N|vq[|n! Cml~uhln4 In< 26 0%Hlock H & R Inc 22 5%R~oun:~ Co~n¢clmm Inc I 0 8%AcccnluR Lid 4 4%B clrmsPuml. Inc. -9, 1%(’rnlur~ Ilu~lne~ SVL> Ii1( -2+1 ]%
llblorlcll Crowlb(1-Yc#~ I" BrTDA)
^ffih.l¢d Comp Svcs -CI A 51.11%C¢-nmry Uulinc~l Svcl lit< 37 6%Bk~’k II & R In~ 21.9/.Accenlur= Lid 12 6%N~4unl eoe~JII;n4 IrK -4 Ig.-
Beunn4Polm. Inc -9 AP.;,Restricts Co,~r~chL~ h,c -2~ I%
J
Pro|¢cled GrowlbI I -Year EBITDA)
All-d~ilcd Cornp Svc~ -Cl ̂ 14.7"/+Block H & g Ira. I0 5%I:l¢|HnlPoml. IrK -8.2%Navql.nl Co~ullm4 ]nc -q 0%Ccnmzy I:lusm~ Svc~ ln~ -9.7%ReM.~rc~ Cunn¢ct.~ lnc -I 3,2%^cr~nlur,~ I.Id -10 2%
&ll~llu,..,, ¯
IProjccled Growlb(5-year EPS)
ReIC’UICeS Col~tlCCllOn IncAITIhIlilJ Co11~o 5~¢| -el AIJc.nn4Polnl, Inc.Bh>ck H & R IncA~c~ntu~ LidC~luP/Bu~ll~c-~ Svc~ II1<N+v+ .m (’~Olhn Inc
238%20.1%I 6 O%154%154%150"4120%
|
Prolllmbilil~(EBIT Io Rcvrnu¢l
Bk~k H & R IncArCh*led Cutup Svcs -CI AAc ¢cntur¢ LidR~ourc¢$ Come.lion IncUeannl;Pulnl. In<Nixie+hi C~n~ulhn4 In¢
20 I%IJ 2%I 1.9~,’,I 1.6%6.7%55%I 7%
-.IL
ProllllblUly(EBITDA Io R©venuc)
Bk..ck H & R Inc 25 0%AIT, Imlcd Comp Svci -CI A 16 i%Accenlur¢ Lid 14 4%R~,oulcr~ Cord, cot.on [nc 12 }%N.vi41nt Consullinl lnc 4 8%Bc.nn4Poml, In<, 4 7"].(’~lurv Hu.,~ 5v~ Jl~ 5.7"/.
R¢lallve l)rpre~lillon(l:)q)rminliO~ Io EBITDA)
Cemury Bu*inc~ Svcl lnc 70 $%NaviKinl C.On~llllni~ III¢ }b 6%HeuvlnsPolnl. Inc. 2~,4%AIEImtcd Cutup $v¢~ -CI A 2 I~%I~k H & K Lnc 19.7%^cC~nlur¢ Lid 17 6%
Lll~m=lmui, emL -
lalcrDiI Iov¢ilm~ll(Capilal Exp~dhums to Revenue)
A~hlled Co,~ Svcl -CI A 4 7%Blo~k H & K Inc 3.6%Nmv14anl Consuhln4 hlC ).J%C~nrurv Elu~inc~s Sves am: .~ t)%
Acccnl~e Lld 2 0%Re~<~rc¢~ Co~¢cli~i ~c 1.1%~lcinnj~Poinl. IrK. 1.0%
Rc*ourc~ C~]ll¢cl;on IncBem,nl[Puml. In<.Nlvl41nl COtllUlllnl[ In~Ccalury Uu~ln~-~ Svc! In<AIl~l;amJ Comp Sv¢~ -CI AA~CclllUlr LidI~klek It & R 1no
Leverage([3~b, I~ EV)
3.72.3.~01914I}12
II
Nl+ll[lnl t-u(l+ullln4 IncR¢.~ourc~ Clxmccllun In¢UclnnKPulnt. Inc.Ac~rntulr LidAfhh.lcd C~p Sv~s -.CIAHl~.’k H & R b.cCenlU~ I:lu~ll,~ Svc~ IrK
0 0%0 0%0 2%0 7%
I 0 0%12 5%14 O%
I~’--~Tm
(I) Financials based on FYE 2001 figures.
Draft/Confidential
STARS0026431

FOS Comparables
O Houlihan t .:~,ey Howard & Zukin
myCFO
OPERATING PERFORMANCE PARAMETERS - FOS
(/J~llr~ in mi/liu.s)
Revenue
LTM Operating IndicationsAdjusted Adjusted
Gross Adjusted Adjusted Cash NetProfit EBITDA EBIT Flow Income
Acccnturc Ltd $11,660.0 $4,703.0 $1,681.1 $1,385 5 $1,411.9 $1,116.3
Affiliated Comp Svcs -CI A 3,062.9 1,602.4 513.3 402.8 347. I 236.6
BcaringPomt, lnc 2,367.6 600.9 206.9 157.6 116.7 67 4
Block IIl R Inc 3,179.7 1,369.9 795.2 638.8 622.8 466.4
Ccntury Business Svcs Inc 504.6 15.4 28.8 8.4 23. I 2.7
Navigant Consulhn8 Inc 236.9 70 I 20.7 I 3. I 15. I 7.5
Resources Connection Inc 181.7 71,8 22.3 2 I. I 14.5 13.4
LTM Margins 2-Year Compound Annual Growth RatesAdjusted Adjusted Adjusted
Gross Adjusted Adjusted Cash Net Adjusted Adjusted NetProfit EBITDA EBIT Flow Income Revenue EBITDA EBIT Income
40.3% 14.4% I 1.9% 12. I% 9.6% 9.5% 8.4% 8 3% -3 4%
52.3% 16.8% 13.2% I 1.3% 7 7% 24.9% 32 3% 32.1% 42.7%
25.4% 8 7% 6.7% 4.9% 2.8,% 0.0=/0 -9.1% -I 5.6% -I 5.9%
43.1% 25 0% 20.1% 19.6% 14.7% 18.1% 22.5% 22 2% 24 7%
3. I% 5.7% 1.7% 4.6% 0.5% - 1.8% -28.3% -4 1.2% --43.8%
29.6% 8.8% 55% 6.4% 32% 3.6% 26.0% 213.4% 213.4%
39.5% 12.3% I I 6% 80% 7.4% 19,4% 10,8% 8.7% 30.2%
Low $181.7 $15.4 $20.7 $8.4 $14.5 $2 7 3.1% 5.7% 1.7% 4 6% 0.5% -I.8% -28.3% .41 2% .43 80/~Iligh $ I 1,660.0 $4,703.0 $1,681.1 $1,385.5 $1,411.9 $1,1163 523% 25.0*/0 20.1% 19.6% 14.7% 24.9% 32.3% 213.4% 213 4"/1
Mcdian $2,367.6 $600.9 $206.9 $157.6 $116.7 $67 4 39.5% 12.3% I I 6% 8.0?/0 7.4% 9.5% IO.8% 8.7% 24.7%IMcan $3t027.6 $11204.8 $466.9 $375.3 $364.5 $2729 33.3% 13.1% 10.1% 96% 66% 10.5"/o 8.9% 326% 35 4=/J
* Excludcd from the Range.Source: Compustal.NA - Nol Availablc.NMF - Not Mcaninglul Figure.i_TM - I.alcsl Twclvc Monlhs.EUIT - Eaining= [3c1"olc |nlcrcsl and Taxc=,.FIIIT[)A - Earmng~, Bclbrc Intcrc:,t. Taxc~,, Dcprcciat,on and A.nmrl=zatit.’=
Draft/Confidential
STARS0026432

FOS Comparables
BALANCE SHEET STATISTICS- FOS(figures in milhon~)
Acccniurc Ltd
Allihated Comp Svcs -CI A
BcaringPoint, Inc.
Block H & R Inc
Ccnlury Business Svcs Inc
Navtgan[ Consulting ]nc
’ ’ " . Resources Con~3cclion the
Total Net Income Net Income Current QuickAssets ROA ROE Ratio Ratio
NetMR A/P Working
D=y, c__~ti,.l$5,434 961 19.4% -53.3% 1.3 I.I 74.5 13.6 $23.308
3,403.6 8.9% 15.4% 1.8 1.6 72.0 14. I 356. I
895.1 7.1% 8.6% 2.3 1.6 48.1 13.4 162.2
3,925.7 I 1.7% 37.7% 1.2 0.9 141.5 237.8 151 2
444.4 0.5% -4.4% 1.9 1.7 99.2 2 I. I 33.3
166.6 4.6% 4.9% 2.0 1.7 94 4 37 9 26.2
131.5 I 1.3% 13.3% 3.7 3.2 44.1 8.1 I 1.4
L~verageOther Debt/ Debt/ Debt/ Interest
LT Liab/EV EBITDA MVE i~ EV Cov~
8.9% 0. l x 0.7% 0.0 x 4,161.1 x
1.6% 1.4 x 11.0% 0.1 x 16.8 x
0.9=/* 0.0 x O. I */o 0.0 x N MF
1.3% 1.4 x 13.5% 0. l x NAIl"
0.3% 1.2 x 12.6% 0.1 x 7.4 x
0.0% 0 0 x 0.0% 0.0 x NMF
0.6°/* 0.0 x 0.0% 0.0 x NMF
Low $131.477 0.5% -53.3% 1.2 0.9 44.1 8.1 $11.390 0.0% O.Ox 0.0% O.0x 7.4xII’hgh $5,434.961 19.4% 37.7% 3.7 3.2 141.5 237 8 $356.092 8.9*/, 1.4 x 13.5% 0.1 x 4,161.1
]Median $895.131 8.9% 8.6*/’0 1.9 1.6 74.5 14.1 $33.306 0.9% 0.1 x 0.7% O.Ox 16.8[Mean $2T057 406 9.1% 3.2*/0 2.0’ 1.7 82.0 49 5 $109.100 1.9./o 0.6 X 5.4% 0.1 X Ir395.1
Footnolcs." Excluded from the Range.Source: Compustat.NA - Not Available.NMF - Not Meaningful F=gurc.EV - Enterprise Value.MVE - Market Value of Equity.EBIT - Earnings Before Interest and Taxes.EBITDA - Earnings Before Inlerest. Taxes, Dcprecialion and Amortization.ROA - Return on Assets.ROE - Return on Equity.A/R - Accounts Receivable.A/P - Accounls Payable.( I ) Repte’:,cnt:, ToLd InlcrcsI-Bearmg Debt to Markcl Value of Equtty.(2) Repte~cnls EBITDA to NCl Inlcrcst Expense.
Draft/Confidential
fl.I
1"34
STARS0026433

FOS Comparables
O Houlihar~ [ ~.ey Howard & Zukln
myCFO 1
COMPARABLE COMPANY MARKET ANALYSIS - FOS
,+ ,+
(Jigure-t in mllhon.L rJ(’~’pt per sh.r¢" redoes)
(;¢neral P, lark¢l Informalion
Accenlurel.ld
Affilialed Cutup BearingPoinl, Ceneury Business Navigan| ResourcesSvcs -CI A Inc, Block II & R Inc Svcs Inc Cunsullmg Inc Cunnec¢iun Inc
TKkcr Symbol ACN ACS KCIN IIRIJ (’1:1 IZ N("I RI’CNE~,changc NYSE NYSE NASI)AQ NYSE NASI)AQ NYS/~ NASDAL)Fl~:al Ycax End 0812001 O6/OI/O2 00/OI/02 04/2002 12/2OOI 12/2OOI 05/2002l~Icst Financial Inlonna¢ion 05/2002 06/01102 00/OI/O2 07/2002 0612002 O¢J2OO2 05/21R12
Closing Price asof Valualwn Dale $14.90 $44 56 $6.60 $43.00 $2 78 $5.57 $14 2520-Day Avcragc Sl~a:k Pncc $15 33 $43 90 $8.62 $48.19 $2.58 $5 70 $16.U452 Wcck Pnt’¢ Range
H,gh $30.50 $57.05 $21.49 !;53.50 $4.07 $7.OO $3O. 15Low $12 12 $34.84 $5.35 $32 35 $1.50 $3.00 $10.42
52 Wcck Return 17.3% I 1.9% --10.5=/ 7.5% 17.8°,~, 56 5% -2U 6%
Markel Valualion ~nformaliopFully Dilulcd Shares 1,027.991 144.317Closing Price aS Of Valualion Dale $14.90 $44 .56
191,553 180 474 98.333 43.07(, 23 283$6.60 $43.00 $2 78 $5.57 $14.25
Market Value of Equily (MVE) $15.317.O65 $6.430.783 $1.26.4 248 $;,I.018.368 $273 366 $239.933 $331 789phls: Tolal Dcbl (book) IO0. IOO 709.563 1.846 1.085.987 34 547 0 (X)O O.~tOh.ss: Convened Debt 0.000 O.OOO 0.OOO 0.0OO O.OOO O.OOO O.oooplus. Prcfcn’cd Stock R’cdcmpfion/MarkclJLiq. Value 0 O00 O.0OO O.OOO O.OOO O.OOO O.(XIO 11.1)OOless: Convened Pro fcrrcd 0.OOO OOOO O.0OO 0.OOO OOO0 O.OOo o.oO0less" Cash & Cash Equwalcnls (book) I.I 13 496 33.814 203 597 402 499 ¢*O 3 IO I¢, 5t~l 31 745plus. Minority Interest in Subsidlarius 574 549 0.OOO 0 OOO O.0OO O O(X) t) (Jot) t) ooo
Ent.:’rptisc Value $14.878.218 $7,106.532 $1.062 497 $g.701 856 $.’~47.603 $223 372 $3tx) 044
Draft/Confidential
STARS0026434
Valuation Exhibits
FOS ComparablesIAS ComparablesTransaction ApproachOther Valuation Exhibits
Draft/Confidential
STARS0026435

IAS Comparables
O Houlihan ~ ~. ’.ey Howard & Zukin
COMPARABLE PUBLIC COMPANY DEBT-FREE MULTIPLES- IAS
EV I EBITDA EV I EBIT
Affiliated Managers Grp |no $I.441 I 7.]x 6.5x 6, Ix ,S6x Alfihatcd Mal~gcts Grp Inc $1,441.1 9.Ux BOx 6.hx 6IxAmves~ap PIc -Sign Adr 4.975.6 5 4x 6.3x 7.2x 7 2x Amvescap PIc -Spon Adl 4.975.6 6.Ix 7.2x ~.~x 8.7~Blackrock Inc 2,529.4 12.9x 11.Sx 9.bx 8.2.,, Hlackeock Inc 2,529.4 14.9x 13.5x I I ~x ~ q,.Federated Investors Inc 3.265 9 K 6x 8 5x 9 2x X. Ix Fedcf,itcd Inv¢,,,tols Inc 3,265.9 IO.5x 9 9x 9.h:,, 8 5xFrankhn R¢~,ources Inc 8,066.0 I0 8x I O.Sx I 1.2x 1(}.2x Franklin Resource:, Inc 8.1)66.O 15.5.,. 15 3x I 3 ~x 12.7).Slewarl (W P) & Co Lid 808.9 8.9x IO. ix 7.8x 77x Sl¢wall (W P) & Co I.Id 808.9 9.7x II.lx ~4x 83xSlilw¢ll Finl Inc 3,798 I 4.5x ~,.4~, h.gx 7.6x Shlw¢ll Fml Inc 3,798. I 5 4x 6 5x 9.9x I I 7xNeubc=ger Bennan Inc 4,060 3 19.Ox 18.7x 18 7x 17.5x Neubcfgcr Lterman Inc 4,O6~).3 20.8x 20.Ox 20 I x 114.7x
t~,w 45,, s4x 6.1x 56x II.ow 54,, 6.5x ,6x 6.1xl[’hgh 19.6x 1~.Tx 18.7x
17"5xl Ithgh 20 8x 20.0,. 20 Ix 18.7~,.
IMedian 8.7x 9 3x 8.5x 7.9xIMedlan I0. I x IO Sx ’9 ~x V..1 ~.
Mean 9.7x 9.7x 9.6x 9Ox [Mean II 5x 11.4x I1.1, IOt~
EV / Revenue EV / Tutti A~,sets (net of c=’,h,)
Affihalcd Managers Grp Inc $1,441.1 3.5~ 3.2x 3.0x 2.qx Al’fihatcd Managers Grp Inc $1,441.1 1.3x I..IxAmvcscap PIc .Spun Adr 4,975.6 2.0x 2 Ix 2 3~ 2.4x Amvescap PIc -Spun Adr 4,975.O 0 8x O.SxBlackrock Inc 2,529 4 4.7x 4.5x 4.2x 3 7x Blackrock Inc 2,529.4 5 I ¯ 4.5~Fcd~alcd Invcslors Inc 3,265.9 4.6x 4.5x 4 5x 3 8x Fedcraled Investors Inc 3,265 9 9.2x ~.6xFlanklin Rcsomccs Inc 8.066.0 3.4x 3.2~ 3.2x 2 8x Frankhn Rc::,ou.rces Inc ~l.ub6.O I 4x 1.5,,Slcwatl (W P) & (’o 80~.9 5.2x 5.bx 5.6x 5.2x Sit:wan (W P) & Co Lid 808.9 IO.Ox 8.2~,Slilw¢ll Finl Inc 3.798.1 2.4x 2.8x 3.3x 3 8x Setlwell Fml Inc 3.79H.I I 2x 1.21,,Neubcrger Btrman Inc 4,060.3 7.0x 6.8x 6.7x 6.4x Neubcrgcr Bemoan Inc 4,060.3 I.or, I. I x
2.4xIi O.~x O~Low 2 Ox 2.1~. 2.3~, ILuwIligh 7 Ox 6.8x 6.7x
b.4~.l[ Ihoh
IO I)x 8 ~Median 4 0x 3 8x 3 7x 3.7x IMedi,m I 4~. I 4xMean 4.Ix 4 Ix 4.Ix 39xI IMca. ] sx .~4,, :
el.,
Draft/Confidential
STARS0026436

IAS Comparables.
Houlihan ~ ,..;.ey Howard & Zukin
myCFO 1
COMPARABLE PUBLIC COMPANY LEVERAGED MULTIPLES - IAS
M vE FY._~E L’rM 200__ZZZ00.__33 M V EA ffdlalcd M ana~crs (’;=p Inc $1.05b.3 21.Ix 21 Sx 17.4x 14.5;), Alfihalcd Manascrs (~rp Inc $1.050.3Amvc~cap PIc -Spon Adt 4,162,8 14.4x 22 Ix 12.3x l0 5x Am’.’cscap PIc -%port Adr 4,1¢)2 t~I~lackrock Inc 2.698.9 25.1x 22.4x 20 2x 17 2x ltlackm, k Inc 2,69K.’)Fcdcralcd [nvcs(of:, inc 3,280.5 19 0x 17 Ix 15.bx 13 7x Federated Invc:,lors Inc 3,2~0.5Franklin Resource, Inc 8,379.7 17. Ix 19.0x 17.4~ 16.2x Frankhn Resource= Inc 8,379 7Slcwart (W P) & Co I.Id 831.5 104~ 120x 14. Ix 13.8x Slc,,*arl (W P) & (’o {.Id 831 5Shlwcll F’ml Inc 2.939.1 8.8x 10.9x 12 Ix 12.Ix Siilw¢ll Finl lnc 2.q39.1Ncuhcrgcr Elcrman Inc 1.980 4 14.9x 15.Ix 15.6x 14.5x Ncut~:rgcr I}crman Inc 1.980.4
P,1V E] AIJM
LTI~___.!
I 33","1.14%I 08%I 77%3 10%
10.02%2.11%3.37%
Hrvvnue J
I.T~,__I
O 59%0.62%0.23%0.39%0.94%I t)4 =/=0 75%0.99=,,
Low 8.8x 10.9x 12 Ix 10.Sx Low25. I x 22 4x 20.2x IhghIhgh 17.2xI
Median Ib.Ox 18.Ix 15.6x 14 2x MedianMean 16 3x 17 5x 15.~,), 14. x Mean
1.08%I0 02%
1.94%2 99%
0.23%I, O4;~I
0.69;10.77%]
Draft/ConfidentialSTARS0026437

IAS Comparables
Houlihan Lol,.ey Howard & Zukin
myCFO 7
¯ RISK ANALYSIS RANKINGS- IAS
(Revenue. mllll~.) (Erllcr~n+¢ V+l~. mlll.m+)
Franklin RC~C~ h’~ 12,~14 1 fllA~llo tllmll II~ SJl,lJ6b o
~l,i. ~II l,nl In. I, i 14 4 N¢.b<ria l~a Lr~ ~,~U J
Ns’~b.:l~r ltcnnln In~ $¥7 7 FCd~tal~4 In~¢~ In~ 1.2~ 9(il~kr~i+ I~ $67 u ltl~kl~k I~ i,$2¥ ¢^rSh+l~J ~4~ivr~ G,p I~ ~6 o’ ^ flih.~+d 1,4.m.i~. t;rp In+ 1.441 1~1¢~ .n ( W Pi a ( ,, l~a I +I~ S~--.. ~n (w P) & Co Lid col
HIHelkll (.. r+. Ih
Ill l~ill111 ml
Bl.*+llz~k L~ II 3%
Fl.nkl.n R~,~ In, .+ ~.~*.n(W P)~ ~u Lla .V .+’+.^ nil..k~J M~c:. ( ;r~ In¢ - I I I’.~
II ~lsr l<ll GI lwlk( I .’i’¢.i Xcvcnu¢)
i~illl. .1 i Il+l~kz~k I~ I I X%
Fr.nkhn Rc~ h,c u h%Nc.t~r ~ l+cn~ in. U 4~*
^1111..~ M.n.~¢r, <,+p I~ i I ,~*S,~.~(~ PI~ (uLld .+I .+’+’.Sul~cll Fl.i I~ t+i a;~
l’rejecsrd (.;rlwlhil ~l’c~ I(¢v~nuc)
^ ITlh+i4 M.~I(Cl+ (+;p t~ 16 m..IIL..Lmi I~ II 4"*
~1.1.,11 F, ai I.L. ~1, ?%
il*:lutl~=l (;r.*lb Hl~lerlcll Grewlh fru|eivd G,o*tb Pr eJ~lcd (;faith rrlfil|b*lll)12.YCa~ I.Hfl I)A) ( I -Y¢~ I:.’ HITLIk I I.Y(J+ I’lJ[I I)^l C$ YC~ UPSI I I:HI I i. X¢~mu¢)
NL’ubcl|¢, [knn.n Int IJll’~’* AIIIb.kd M~.~,. (;IT) In* 2u ~P’/.^ ffll~l~J M.n.l~l, (,q, I~ I~ ?%
^.D*c~,p PiL ~p.~* ̂d+ 2Z "% S~.~ (w P)a ~uLId 11~% Fc.,~,=.~.d l..c~., h~ I~ 6".;^l~l,.*~J M.~lc+. t.rp I~’ I+ ~-.
^m*~+p rio -sport Adl 7 I% F+~kl., ~c~,. c+ J~ I i 4.~.Fr~khn R+~l, cb I~ I ~*~*L~ (W P) i t u LIJ 6 I~* S~..n (W P)a CoLsd .le ~’.’. ~.l~+ll f.nl i~ I.¯ ~ ^,,,~c~.p Pk ~.,. ^~ :~ i+.^It+I.,ICJM,n.L,,’~<,r h.,...... Zll I J F
,11 ~*,~ S.,I.cli F.ni I~ ~1 ~;’. ~l,i~cll F,nl I+,, .14 I~. ¯ :,. ~I Cw Pi ~ l’,,t ,J ill,r*. Fr+,,Li,n X<.~.e. I:k :,: .+%I~rll~... 1 ill~lzl~l,, 11
rr vl*ll lbllil~ lldllivl l)Itrl¢lllill Iollrnll I0~¢ ilmml I.kliidili L ¢+,r,1¢(I~Ulfl)A lu Re+end) (1)¢p~:c,.t..m k, b~rrD^) t( ~I l(+li+) ilia-hi k, I ~*’i
+*c*.n (w Pi I (’0 Lid J6 0% Frll~hn R~r~c+ I~ 29 I++~ I]Ii bill ~n+ v 6% ltl~Llml Im ii ? Bt+. L~i I.~ O U*,~l,l*c[I Fml I~ ~J 0% ^,nv~.,,p pl~ Si-m ̂U, .+ X~o sly+In (w Pl i, U+LW v,+ F+’~’l.l+"J In.~.~+ In. I +’.
Sl+lwcll Fml I~ 17 1% F,.nil,n Rc~,.c. I~ 5 IFcd,+rll*:d In~c~l,~ Inc It Z*.’; ~ nil+.l~J M.n~,. t .ep i,L .’ Fr.n~l,n RL~C. In. # ;%
~UI.<II F,nl 6. .+~ io.Ncul~llcr U~.n I~ J6 I~ ^mw..,.~ Pk .~,l’~e ̂ ,.k I .+ ^*n.¢..p l’~- ~r-~ ̂ & -’~ ~’.
’,lC.~ (w PI l (’o Lid 9 7% P+..h<~l.~ llcrl~. I~ I Irr..Li,.. ~c~f,L, I.x .+~ ~% ~+,i. ~ll t,+,l h. ,I
Llnll.m.. |7 ~u=[mm. ,.,,~’"’’’mll I
I ldllll r’/ MICHel ladtlstr) MIUI¢IA+l~s Url,~l Manal[¢m¢nl (Shill MVIY AUM
^m++.,p Pi Spun ̂ m iJ~l imu o Sic*In (w P) ̄ Cu 1.11,1 I0 u%Fr.~lhu RC~,L~. I~ .~TU.~m U
Fr.l~l,n Itc~l.c~ I~ i I%Fc~.lml I~c+l~. In. I I~.ut~ u $I.I.¢ii F~nl i~ ++ i~.
^II’I’.IL~ ea ~.i.n I ;rp In, ~V.4L~ U ^nlh.l~d M~.icr. t,rp I.. I i~; (i J F.~,,. ul. h...J ix, l’~l i. _~,N~I rlb.u,.. ~’~. i^m.¢~.p PI. ~Imm ^~i I I’. i:lMyt F, IMVIJ ̂iJ~l,,,.,j,. h.~u,.,,,i,...~+.~, .,.~i~.~w i r.,,l~l.Li+,.i I+~ i I%
i~nll=lm r~arl~ L-,,,.,. LI rill =lll~ml.. ,~
Draft/Confidential I" 39
STARS0026438

IAS Comparables
D’~ ~y ~,’-o:
OPERATING PERFORMANCE PARAMETERS- IAS
(figures in million:;)
I.I"M Operaling Indicalions LTM P,|arKins Z-Year Compound Annual C, ro~lh HalesAdj usled Adjutled Adju~¢¢d Adjuitcd Adjusled
Gross Adjusled Adjusled Cash Net Cross Adjusted Adjusced Cash Net Adjusled Adjuslcd NetRevenue Profit [BITDA EBIT Flow Income Profit EBITI)A EBIT Flow Iocome Rcve,ue EBI’I’DA EBIT Income
Aft’dialed Managers Grp Inc $450.0 $184 4 $222 9 $179.3 $92.6
Amves.cap Plc -Spon Adr 2,374.6 379 5 795 9 694.9 289.4
Blackrock Inc 567 0 190 2 214.0 187.6 146.8
Fedcratcd Investors Inc
Fran~.hn Resources lnc
Slewan (W P) & Co lad
,, . . SdiwcllFinllnc
Ncubcrger Bcrman Inc’;
733.6 333.2 386.1 331 3 2464
2,514.1 538.6 746.8 526.0 661.3
143.7 72.7 80 5 72.7 77. I
1,334 4 464.9 706.9 581.3 395 3
597.7 202 I 217.1 202.7 145.2
$49.1 40.4% 48.9% 39.3% 20.3% 10.8% -I 1.3% -I I 6% -16 2% -16.K%
188.4 16.0% 33.5% 29.3% 12.2% 7.9% 22.9% 22 8% 21 8% 12.5%
1204 33 5% 37 8% 33.1% 25 9% 21 2% 18 3% 25.7% 26.7% 37.9%
191.7 45 4% 52.6% 45 2% 33.6% 26.1% 9. I% I 1.9% 14.4% 18.0%
440.5 21.4% 29 7% 20 9°/:. 20.3% 17.5% 2.0% -3.5% -6 7% 2 9%
69.3 50 6% 56 0% 50.6% 53.7% 48.2% -9 2% -6 3% -8 5% -7.9%
269.7 34.8% 53.0% 43 6% 29.6% 20 2% 13.3% 15 6% 9.4% 3 4%
130.8 33.8% 30.3% 33.9% 24.3% 21.9% 2.9% 38 8% 41.8% -0.9%
I.owlJigh
McdlanMean
$143.7 $72.7 $80.5 $72.7 $77.1 $49.1 16.0% 297% 209% 12.2% 7.9% -11.3% -I 1.6% -16.2% .16.80/.I$2.514. I $538.6 $795.9 $694.9 $661.3 $440 5 50.6% 50.0% 50 6% 53.7% 48.2% 22.9% 3~.K% 41 ~e,,..,
37.9%l$665.6 $267.6 $304.5 $267.0 $196.6 $159.6 34.3% 43.3% 30.6% 26.1% 207% 6.0% 13.~;% 11.9% 3 2%
$1.090 I $295 7 $421.3 $347.0 $256.8 $182 5 34.5% 43.5% 37.0% 28.2% 21.7% b.O% 11.7°/;, 10 3% 6 %
Foolno~" Excludcd from Ihe Range.Source’ CompuslaLNA - Nol Avadablc
NMF - Nol Meanlnglu] ]"igurc
[.TM - [.alesl rwclvc M.mh~.I:BIT ¯ Eamnngs i]elk~rc Interest mid l axes
1 BI’I’L)A ¯ I’arnnngs |lclhrc ]811crcM, "taxes. l)cprccnalion and Amorllzallon
Draft/Confidentialf 40
STARS0026439

IAS Comparables
O Houhhan L,.,..cy Howard & Zukr,
BALANCE SHEET STATISTICS -- IAS
Total Net Income Nel Income CurrenlAssets ROA ROE Ratio
Affilialcd Managers Grp Inc $1.240.3 4 5% 10 0% 2.7
Amve;,cap I’lL" -Spun Adr 6.930.0 3.0% 0.0% 1.2
Blackluck Inc, 734.3 18.4% 24 6% I 1.7
Federalcd Inve~lor~ Inc 457.9 32 9% 75.3% I 4
Frankhn Resources Inc 6,448.8 7. 1% I 0 9% 5 3
Slcwar! (W P) & Cu Lid 139 3 51.5% 66.6% 9.9
Shlw¢ll finl Inc 3.347.4 9.l% 19 4% 0.9
’ , Neubcrgcl BefTaan Inc 3.837.] 3.4% 34.7% I.I
Quick AIRRatio I)avs
2.6 46.2
0.7 54.3
7 4 60.1
12 172
2.5 43 2
9.9 13.6
0.6 38.4
0 9 1.804 I
AJP
87.3
34 I
39. I
26.3
212
186
10.4
1.120.3
NetWorkingCapital
($3.4)
78.5
235.2
(38 4)
1,164.2
0 8
37.6
2.278.5
Other Debt/ Debt/I;1" I.iab/EV EBITDA MVE (I)
5 9% 2.2 x 45.8%
6.4% I 8 x 34 I%
5.4% 0.0 x 0 0%
0.6% 0.2 x 1.9%
I 3 4% 0 8 x 7.0%
0.7% 0.2 x 2. 1%
18o% 1.3~ 31.2%
0.9% 10.9x 119.1%
Debt/ InterestEV
03x 10.2x
03x II~
00 x ,VAI/-
O.Ox 17.4x
0. I x N,~II’"
0 0 x N,’,IF"
0.2 x 13.0 x
0 6 x NMF"
Low $139.3 3.0% 0,0% 0.9 0.6 13.6lligh $6,930.0 51.5% 75.3% II 7 9.9 1,804 I
Median $2,293 8 8. 1% 22 0% 2.0 1.9 44.7Mean $2.891.9 16.2% 30.2% 4 3 3.2 259 6
104 ($38.4) 0.6% 0.0x 0.0% O.0x 1o.2 ,I1.120.3 $2.278.5 186% 109x 119 I% 0.6x 174
30 2 $58 0 5.0% 1.0 x 19. I% 0 2 x 12.4169.6 $469 I 6.5% 2.2 x 30.1% 0.2 x I 3.1
Fo~)|noleS:
¯ Excluded 6-ore ;he RangeSource: Compublal.NA - Not Avadable.NMF - Nol Meaninglhl FigureEV - Enlcrpfise Value.MVE - Market Value uf Eqmly.I’UIT - Earnings Before Intcrcsl and Taxe:,.[’ItlTDA ¯ Earning:, Before Inlcresl, Taxes, Depreciati.n and AmorlizalwnROA - Return un Abs¢I~=.ROb - Return on [(qmlyA/R - Accounl~ RcccavablcA/P - Accounl= Payable.( I ) Repros, thiS Tulal Inlcrcsl-l]carhlg I)cbt hJ Market Value of I=.quily(2) Rcpre~cnls EBITDA k, N¢I Inlcrcsl l’xj’~cnsc
Draft/Confidential [’41
STARS0026440

IAS Comparables
Houllhan ’,’.,, _y Howa.’d & Zukw:
COMPARABLE COMPANY MARKET ANALYSIS -- IAS
~gures in millions, except pet" share values)
General Market InflJrnlation
Affiliated Amvescap Federated FranklinManagers PIc -Spon Blackrock Investors Resources
(;rp Inc Adr Inc Inc Inc
Stewart (W P) Stilwell Finl Neuberger
& Co IJd Inc Berman Inc
Ticker Symbol AMG AVZ BLK FII BEN WPL SV NEUExchange NYSE NYSE NYSE NYSE NYSE NYSE NYSF. NYSEFiscal Year End 12/2001 12/2001 12/2001 12/2001 09/2001 12/2001 12/2001 12/2001Latest Financial Inl’ormat=on 06/2002 06/2002 06/2002 06/2002 06/2002 06/01/02 06/2002 06/2002
Closing Price as of Valuation Date $4685 $10.10 $41.28 $27.50 $32.10 $1785 $12.90 $27.9420-Day Average Stock Price $47.92 $11.24 $42.75 $28.08 $33.01 $19 09 $13.84 $29.3152 Week Price Range
High $74.50 $31.80 $47.60 $36.18 $44.48 $31.73 $29 24 $48.67Low $39.30 $9.08 $37.46 $24.45 $29.52 $14.35 $11.51 $25.25
52 Week Return -17.5% -51.8% 2.8% -5.3% -5.0% -7.8% -30.5% -16.2%
Market Valuation Information22 546 412.162 65.380 119 290 261.O50$46.85 $10.10 $41.28 $27.50 $32.10
Fully Diluted SharesClosing Price as of Valuation Date
MarketValueofEquity(MVE) $1,056.260 $4,162.831 $2,698.904 $3,280.474 $8,379.711plus." Total Debt (book) 483.461 1,420.496 O.000 61.620 584.119less. Converted Debt 0.000 0.000 0.000 0.000 0.O00plus. Preferred Stock Redemption/Markel/Liq. Value 0.000 0.000 0.000 0.000 0.000less. Converted Preferred O.000 0.000 0.000 0.000 O.000less Cash & Cash Equivalents (book) 127 914 607.695 169.533 76 479 897.814plus: Minority Interest in Subsidiaries 29 256 0.000 0.O00 O 307 0.000
Enterprise Value $1,441.063 $4,975.633 $2,529 371 $3,265.922 $8,O66.O16
46.581 227.840 70.881$17.85 $12.90 $27.94
$831.462 $2,939.141 $1,980.41017.810 917.000 2.358.5800.000 0.000 0.0000.000 0 000 0.0000.000 0.000 0.000
40.447 69.5i)0 278.6550.109 I I 500 0.000
$808.934 $3,798 141 $4.060.335
Draft/Confidential l" 42
STARS0026441
Valuation Exhibits
FOS ComparablesIAS ComparablesTransaction ApproachOther Valuation Exhibits
Draft/Confidential
STARS0026442

Transaction Approach
Houlihan L.~,r, ey Howard & Zuklr:
VALUATION SUMMARY - TRANSACTION APPROACH
(figures m millions)
FO.....~S RcprcscntahveLevel
CY 2002 Revenue $16.50
SelectedMuhipIc Range
0.5x 0.7x
Indicalion ofI-ntcrprisc Value
$8 25 $11.55
IAS RcprcscnlaliveLcvcl
CY 2002 Rcvcnuc $8.50
SeLected
Mulltple Range
3.0x 4.0x
Indicalion ofEnterprise Value
$25.50 $34.00
[Concluded Value Range $25.50 $34.00 I
Draft/Confidential
STARS0026443

Transaction Approach
O Houlihan i_ .,key Howard & Zuk,p
rnyCFO
SELECTED M&A TRANSACTIONS SUMMARY
EVl EVI Size/Date Target Buyer Deal Size EV Rev EBITDA AUM Target Business Description:
(.’vmoarable Transactions - IAS
$/29/02 Old Mutual PI.C (NWQlnvcslmcm Management Co)
Nuv¢cn (John) $140.0 $1590 5.]x Jl 5~, 2 0% Provides a~scls mdfldgcrncnl S~rvlciS tar prlv,ll¢ cllcnls, unluns and ten,panics
5/26102 Tccls Holding Ag AWD Holding AG 347.0 328 g 4 Us 29 8x NA Provides financiJI s,Jrvlc~Cs including asset managen~onl services, lund ol luadsinvcsllng, non-lilt insurance advisory and brogcnng scr’,’iccs
4122/02 Gruntal & Co LLC (GMS Group Ryan Beck & (’o 13.0 2g S 0.1 x O.6x NA Prov=dcs brokerage k’r~lccs, research, invcstn~cnt banking advice, mutual tunds,LLC (The) msu,anc¢ and cash managcn~nl ,~¢zvl¢c$ tO indwzduals and inslilutlons
3/26/02 Trilon Financial Corp Briscan (.’orp 495.6 1,513.1 ~i.4a 9 2~ NA Provides a range of llnancla[ advisory and nlanagentcnt sirvlccs, including mIrihambanging, as~Cl$ managcn~:nt, invIsm~:nt banging and brokering sop, ices
The Invcsln~nt Counsel (’o Imrcpid Capflal C~rp 3.9 3.9 1.7~ 43 8x NA P,ovtdes advisory and invcsmlenl scrvlccs, ’.. , I/4/O2
ti/29101 Fricss Assoclalcs Inc Allillalcd Managers 24 I.O 471.4 5.2~ NA 3.8% |’tovldcs invcslmcnl managcn~:nl and advisory services Io mutual lhnd~ and scparal¢Group Inc accounts Ibr I’~gmddtlons. corporaTiOnS and high n¢l ~onh indl’,lduals
611W0l Ban’,, [no (Synkohony A~,:~¢I Nuvce.n (John) 222.0 205 8 3.3x 5.4x 5 6% Provides asSCl managim,Cnl and i¢latid financial scPciccs to pcnsmn thnds, indlvldu,d=Managcmcm LLC) and mulual land distnbuto*s
1/29/01 Mackenzie Financ,al (’orp Invcslors Group Inc 2.383 6 2.124. I 3.4x 5.0~, b.4% Provides invcslnlcnt advisory scrvlccs with one mutual lund and invcSlnbJl|lIT~rzagcntcnl and mdvlsory services to ot, cr |00 muTUal lunds and ~’grcgalcd lund~,
IAS Mean $479.8 $604.J 3.6x ig.0xNl~edJan ~mllv5 ~67.3 3.7~ 9.21
~ble rEansactiu¢l~ - FOS
5/15/02 Canadian First Fmanc,al Grtmp Inc Dundee Wealth 6.8 b ] 0.6~ 90.1xManagcmcnl Inc
4.S%4.7%
0.1% I’ro~idcs adv.:c to individuals rcgardlng nLUluJI lunds. RRSPs. hfi: m=;ulurlcc pi~luct=,and morlgagc prL~Juci~, and >crviccs
3/23/01 Vesl (FID) Inc Wills Fargo & Co I 14.1 109.4 0.hA I ].2x
FUS Mran $60.4 S57.8 O.6z SI.7zMedian ~60.4 [;57.1~ 0.On ,~!.7,
AEgrezal¢ ~lligh $2~83.6 $2,124.1 5.4z 9O. lz
ILow $3.9 $3.9 0.1a 0.6aMran $395.9 $495.0 3.(t~ Z5.5~
0 7% I’rovidcs Ilnal~glal plalmhlg ~.’r’,icc$. Including S¢CUIIIJCs. InSufdnc¢. ntonIym.mJgcn~nT, and hus,n¢~s advice through linanclal and tax ad~l~t~ Io indi~ldual~ Jndsnail businesses
0.4"/.0.4%
0"4%Io 1%r,..
3.1¶~
Draft/Confidential f 45
STARS0026444

Transaction Approach
ADDITIONAL M&A TRANSACTIONS
EVI EVI Size/:}ate Target Buyer Dear Size EV Rev EBITDA AUM Target Business Desert 3lion:
6/I 2/02 ComJncr~bank AG (Colmncrzbank AMP l.td $I~.? $18 ? NAAsset Manascmcnt Italia)
NA I 7% Pro~ldc~ asset manascnlcnt ~,crvlces
5/14/02 San Pao[o IMI SpA (Banca Banca Fidcufam 554.4 - $54.4 NA NA NA Opcralc=i as an assc| managcn~m companySanpaolu Invest SpA)
5110102Morgan Stanley & Co In¢ (Self Bank ol’Mumrcal IO6.o I(~, NA NA 1:5% Provides on-hn*: Ixokcragc wrvlccsDircclcd Onhnc Busm¢$~)
4/2.3/O2 N M Rothschild & Sons Wcslpac Banl~m8 172.3 172 3 NA HA 2.7"4 Provides asf,¢’l manascltlClll ~:r’.’lc¢~;(Rothschild Australia Asset COl~OFallOnManagcnlcn! Ltd)
2./6/02 Northwestern Trust & Invc~ms Bank of Montreal NA NA NA NA NA Provides linanc,al Jnvcstn~n| adviceAdvisory Co
118102 Skandla AB (Skaltdii A$$¢| Den Nor~kc Bank ASA 305 5 305 5 NA NA I. I% Provldc$ as~ct managemcn! s¢lv,ccsManigcmenl)
12119101 Bay Isle Financial Corp Stilwell Financial lnc NA NA NA NA NA Provides asset rn;magctncnl services
I ]12x/OI (.~tcdlt Sulssc First Boston / Cr*.’dlt Bank ol- Monucal ~2(} 520.4 NA NA NA Plovldes online brokerage service=Suissc Group (CSFBdlrccl Inc)
I O/2)JOl Oscar Capital Managt:nTcnt LL.C Ncul~rgcr Bcnl~.ln In~ NA NA NA NA NA Provides invcSln~nl advisory ~crvicl.::=
lOJIg/OI BeaumonlCapllllManagcmcmLtdSehrodcrsplc 496 49.6 NA NA NA Provldesab~ohll,:ti:luma~:,,¢tnlan.~gcnt~:nll, cr~,.leeSfocu>lngonhll:hn,Jl~orthind*viduals, f~mdy Ol’fiCc~ nod wol~:~,$tULial
6/20/01 Royal B=tk of Canada (RT Capital UBS AG 227.b 227 6 NA HA 1.1% Provlde$ asset nlanal~cn~nt ~crvk’e=Manlg¢lncm Inc)
Draft/Confidentialf 46
STARS0026445

Transaction Approach
O Houlihan Lokey Howard & Zukir.
ADDITIONAL M&A TRANSACTIONS
EVI EVI Size/)ate Tarqel Buyer Deal Size EV Rev EBITDA AUM Tare et Business Description:
6/4/01 Libcny Fin,mciul Cos Inc (A~I FlcciBo~.lon Financial $900.0 $1.010.0 NAMunagcmcnl Hu:.incs~) Corp
NA 1.9% Provldc~, ~1 ntaruJgcrncnt ~cl’v~c¢>
.S.q0/0l Peiv,.c CaplLal Manugcmcnl LP L¢8~ M4~,on Inc 682.0 682.0 NA NA I~ .5% Prov,dcs ¢qudy management ~,e~’iccs
5115/01 Guardidm CapilAI Group Lid Bank of Momrcal 132.9 I ~2.9 NA NA 6 6% Provld¢~. in’,’c~,lln, cnl advi~ry and mana~c.-mem service:,(Guard.m Group orFund~ Lid)
]~1/01 Owcm,-Ilfinols In(: (ll,~rbor Cdpdal R.,bob,m.k Ncdcrland 490.0 490.0 NA NA NA Provldm, as>c| nMnal~cmcnt and invc.tmcnt ~cP~1¢¢~Ad~i~or~ Inc) Nv
2116/01 |nvcn;ion¢:l y E.ludms Fln~nclcro, Bipop C,u’irc Spa 202 7 253.3 NA NA NA AS~.:I n~(MgcmcnLSA
Iligb $900.0 $1,010.0 NA NA 8.5%ILow SI8.7 $18.7 NA NA 1.1%IMean $335.5 $347.9 N,~ N,~. 3.2%~’led an $227.6 $2.~3.3 NA NA .8%
Draft/Confidential r 47
STARS0026446

Valuation Exhibits
FOS ComparablesIAS ComparablesTransaction ApproachOther Valuation Exhibits
Draft/Confidential
STARS0026447

Other Valuation Exhibits
O Houlihan t c)~.,~y Howard & Zukm
myCFO ’]
CONTROL PREMIUM ANALYSIS
Targ¢lAnnounce Business Day
lale Tarllel Act uirnr Dcscri )linn Prcmiun
8/29/02 Mackenzie Investment Maoagemeot Wuddell & Reed Financial
811/02 Omega Worldwide Four Seasons Ilealth Care
5/26/02 Tecls I lolding AWD Holding
5/15/02 Canadian First Financial Group Dundee Wealth Management
3/26/02 Trdon Financial Brascan
3/6/02 Drug Royally Corp Inwest Investments
7/10/01 Tremont Advisers Massachusetts Mutual Life htsurance
3/23101 FID Vest Wells Fargo & Co
10/25100 Fiduciary Trust Co Intemalional Franklin Resources
9/28/00 Dain Rauscher Royal Bank of Canada
9/13/00 CPR Caisse Nationale De Credit Agncole
8/30100 Montrusco Bollon First International Asset Management
7126/00 Bissett&Associates Investment Frankhn ResourcesMiami
7124100 Phoenix Invesunent Partners Phoenix l{ome Life Mutual Insurance
6/16/00 Nvest Calsse des Depot.,/et Cons=gnatious
5/15/00 Pioneer Group UuiCred,o Italiano
Maaages mutual funds
Provides assc! managemenl and management advisoryto the health care industry
Prov=des financial services wilh a focus on financmlplanning for mid-income householdsProvides iovestmcnl advisory services
Provides a range of linancml advisory andmanagement servicesProvides fioancial solutions Io hcallh-rclalcdoragmtzahons worldwide in return for royaltiesProvides investment advisory services
Provides mvesUnent plamung, mutual funds, insuranceand money maImgemen¢ products and services
Provides mveslmenl management, custodial, and
related services for individuals, institutions, and
Provides investment consulting services
Provides asset nkanagement and specialized finanoal
services
Provides Investment inaoagelncnl services
Provides illvcstlllCnl advisory services
Provides financial advisory services to iustitutmnalinvestors, corporalioos, and individuals
Provides lUVeSllnen[ advisory services
Provides lus’er~llllleol advlSOD/ services
15 7%
50.9%
8.6%
26.6%
4.0%
6.1%
- 1.4% °
200.4% ¯
65.0%
18.9%
23.4%
¯ 17% "
L3.7%
44.0%
100.0% °
40 3%
Draft/ConfidentialSTARS0026448

Other Valuation Exhibits
0 Houlihat" i ~,key Howard & ZuKi,1
CONTROL PREMIUM ANALYSIS
3/10/00 Stratcglc Value Nova Bancorp Group
I/I 8/00 Conning Metropolitan Life Insurance
1/13/00 US Trust C harlus Schwab
I I/I/99 Pimeo Advisors Iloldings Allianz AG tloldmg
10/18/99 Johnson Fry Iloldings Legg Mason
7/22/99 Pilgrim Capital ReliaSlar Financial
4/21/99 Consolidated TechnoloGy Group Technology Acquisitions
I I/3/98 PMC International Zicgler Cos
6/19/98 Global Equ,y PICO Holdings
Provides investment managemcnl sol-vices 58.9%
Provides asset nmnagemcnl services to Insurarlce 30.8o,/0conipanles and institutional inveslorsProvides management, fiduciary, and private banking 84. I%services through subsidiariesProvldus invcstnlcnt nlanagemefll products and I 1.7°/oservicesProvides various linanclal planning services 14.6%
Provides mvestnlent advisory, distribution, and 25.6%administrative services Ibr closed-.end and open-codMakes investments or advanccs funds Io companies m 78 6%exchange I’or equity posmonProvides investment management and cuosuhmg -30 2% ̄servicesProvides investment banking services 59..5%
Mean 34.0%Median 26. 1%
* Excluded from range
Draft/Confidential/" 50
STARS0026449
Other Valuation Exhibits
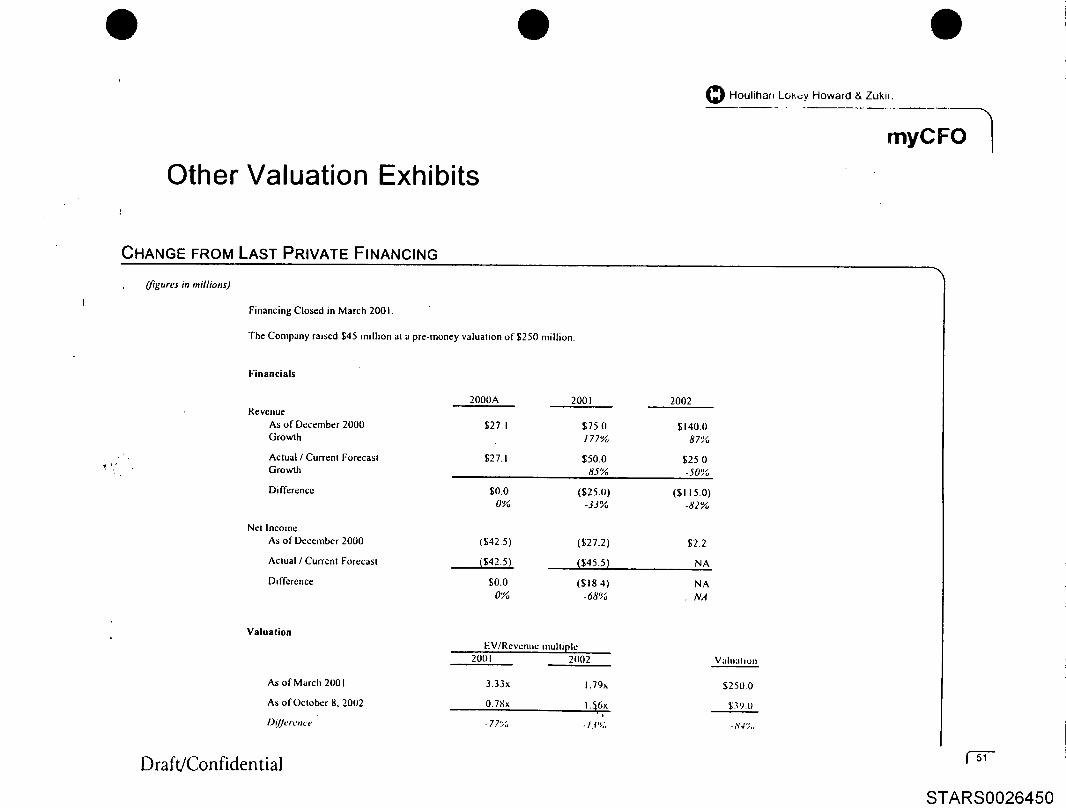
CHANGE FROM LAST PRIVATE FINANCING
(figures in millions)
Financing Closed in March 2001.
The Company raised $45 milhon at a pre-money valuation of $250 million.
Financials
2000A 2001 2002Revenue
As of December 2000 $27. I $75.0 $140.0Growth 177% 87"/0
Actual / Current Forecast $27.1 $50.0 $25 0Growth 85% -50%
Difference $0.0 ($25.0) ($115.0)0% -33% -82%
Net lncolne
As of December 2000 ($42.5) ($27.2) $2.2
Actual / Current Forecast ~$42.5) t$45.51) NA
Difference $0.0 ($18 4) NA0% -68% NA
Valuation
As of March 200 I
As of October 8. 2002
D(IJercm’e
EV/Revenu¢ muhiple2001 2002
3.33x 1.79x
0.78x I.~6x’l
- 77(~ - 13%
Draft/Confidential
O Houlihat~ Lo~,~y Howard & Zuki~.
myCFO
Vahlaltoll
$250.0
$39.O
-~4~,,
~" 51
STARS0026450

Other Valuation Exhibits
COMPARABLE COMPANY PRICE INDEX
,m F
180
160
140
120
100
80
60
40
20
0
....." .......
_m . - _ . ~’
Asset Managemcmt ~ Professional Servlccs ~ S&P 500 ..... NASDAQ
.~’,,tllt L" I’,tl I~L’I
Draft/Confidentialf 52
STARS0026451

Other Valuation Exhibits
O Houlihan L,,,,ey HOwdrd 8, Zuka-
COMPARATIVE SUMMARY INCOME STATEMENT
(audited." figures in millions)
Revenues, Net
Cost of Sales (Goods Sold)
Gross Profit
Operating Expenses:Research and DevelopmentSales and MarketingGeneral and AdmifiistranvcNon-Recurring Items
Total Operating Exl:xtnscs
Operating Income
Interest Expense
Inlerest (Income)
Other Expenses (Income)
Nonrecurring Loss (Gab0
Preta.x Income (Loss)
Income Taxes (Credit)
Minority Interest
Net Income (Loss), Continuing Opcrattuns
Exl[aordinary Gains (Loss)
Net Income (Loss)
Dep~ ecialion/AmollizahonCapital ExpendituresAcquisition Capital ExpenditurcsPreferred Dwadends
Fiscal Year Ended December 31~ Projected1998 1999 2000 2001 2002
$0.000 $1 815 $27 080 $50.042 $25.000
0.0Oo 1.928 33.037 49.616
0.~)0 ~0.I131 {5.957) 0426
0.000 3.433 17.664 23 4740.000 0.324 3.31)3 2.18 t0.157 2.732 15.350 10.4020.000 0.000 0,O00 9,953
0.157 6.489 36.317 46.010
(0.157) (6.602) (42.274) (45,584)
0.000 0.000 0.000 0.000
0.000 0 000 0 000 0.000
0.001 (0.187) 0.250 (0.037)0.000 0.000 0.000 0.000
(0.157) (6.415) (42..524) (45..547)
0.00O 0 000 0 00O 0.000
O.0O0 0 000 0.000 0.oO0(0 157) (6 415) (42 .524) (45.5471
0.o00 0 000 o 0Oo 9.953
($0. 157) ($6.415) ($42.524) ($35.594)
$0003 $0193 $3.737 $5.598$0.070 $3.587 $8.823 $1.236$O.OOU $0.000 $0.168 $O.UO0$0 O00 $0.(~t) $O.t)~) $0.000
EBITDA (Sit 154) ($6.408) ($38 537) ($39 9;~o1
EBIT ($0. 157) ($6.{~12) 0542 274) ($45.584)
NOLO. ]iBrl" and I’[IITL)A do not include iL’curring other Income / (¢H)cn~c). Scc RcrJlcsenlallV¢ [.cvcl~ p,lgc.
Draft/Confidential
STARS0026452

Other Valuation Exhibits
Houlihan t.okey Hov, ard & Zukc:
,=uyCFO
COMPARATIVE SUMMARY BALANCE SHEET
(uudltt’di figurc~ in m,lliun~)
Cunenl Asset-’,:Cash & EquivalentsAccounts ReceivableOther Current Assets
Total Current Assets
Net Fixed Assets
Intangible Assets
Rcslriclcd CashNotes Rcccwablc from EmployeesOlhcr AssetsTotal As~ls
I.izbilities & Stockholders’ EquilyCuncm LiabilhJcs:
Accounts PayableCurrent MaturitiesAccracd LiabilitiesD¢ fencd Revenue
Advancc on A~sct~ PurchaseTotal Current Liabditics
Long-Term DebtOther LiabilitiesDe fencd RentTotal Liabihucs
Minority lnlcrcst
Stockholders’ Equity:Prcl~ncd StockConwflon StockPaid-in CapitalRetained EarningsLess: Treasury Stock
Net SIogkholdgts’ Equ.y
Total Lmbiht=cs & Stockholders’ Equ=ly
Working CapitalNelTotal
Draft/Confidential
AS of December 31r1998 1999 2000 2001 09130102
$0.191 $9.195 $3.050 $10.465 $0 1790.000 I. 147 5.969 4 219 3.30 I0.000 0.313 1.727 0 716 0.6860.191 10.655 10.746 15 400 4 166
0.067 3.971 I I 336 9.059 5 813
0.000 0.285 2.441 0.000 0.0000 000 0.658 2.183 2.345 1.9880.000 2.500 3.125 3.220 3 1250 000 0.000 0.879 0 959 0.961
$0.259 $18.069 $30.710 $30.983 $16 052
$0.000 $1.292 $1.077 $0.749 52.1420 000 0 267 13.610 2.938 19.9860 0OO 1.892 9.094 14.948 7.6140.000 0.278 6 342 8.581 4.3550 000 0.000 0.000 0 000 0.30110.006 3.729 30.123 27.216 34.397
$0.410 $0.243 $0.790 $1.218 $0.3550.000 0.000 0.000 2.451 1.6140.000 0.030 0.323 0.731 0.9130.416 4.002 31.236 31.616 37.279
0 000 0.000 0.000 0.000 0000
$0.000 $0.152 $0.280 $0.490 NA0.000 0 317 0.403 0.403 N A0.000 21 377 50 155 96.028 94 393
(0.157) (7.780) 151.3641 (97.254) ( I 15 620)0 000 0.0t10 0 000 0.30O 0 ot)O
~0.157) 14 0o7 ~(I 526) (0 o331 ~21 227)
$0 259 $1x.1169 $341.710 $30983 $1h 052
($0 006) ($2 002) ($8.,~17) ($19.3431 ($10 4241$0 lifo $o.q2o ($19 3771 ($11.3101 1530 231)
STARS0026453

Description of Comparable Companies
Draft/Confidential
STARS0026454

Description of Comparable Companies
Professional Services TierAssets Management Tier
Draft/Confidential
STARS0026455

Professional Services Tier
Houlihan Lc,~ey Howard & Zukin
myCFO "~
ACCENTURE LTD
Accenture Ltd is a management and technology consulting organization with morethan 75,000 employees based in more than 110 offices in 47 countries deliveringa wide range of consulting, technology and outsourcing services. The Companyprovides management and technology consuhing services and solutions to thecommunications, high technology, and media and entertainment industries. TheCompany offers services that help its clients stay ahead of major technology andindustry trends, including the proliferation of wireless devices, next-generationnetworks, digital content services, Web-eqabled platforms and the industryrestructuring brought about by the convergence of these technologies. TheCompany works with clients of all sizes and has extensive relationships withcompanies and governments around the world.
The Company operates through the following industry groups: Communications,Electronics & High Tech, Media & Entertainment, Financial Services, Banking,Insurance, Health Services, Pharmaceuticals & Medical Products, Automotive,Industrial Equipment, Consumer Goods & Services, Retail, Transportation &Travel Services, Chemicals, Energy, Forest Products, Metals & Mining, Utilitiesand Government.
tI.
A,~I~¢ 1.14. (p,c "P.)
._f~4 "z,
m. ~\~h~ ~.-~ ,.,.
.............................................. ¯ lz
Draft/ConfidentialUg-f-
STARS0026456

Professional Services Tier
AFFILIATED COMPUTER SERVICES
’6 I
Affiliated Computer Services Inc. (ACS), formed in 1988, is a global Fortune1000 company delivering comprehensive business process outsourcing andinformation technology outsourcing solutions, as well as system integrationservices, to both commercial and federal government clients. In June 2002, tileCompan y acquired AFSA Data Corporation, a diversified financial servicescompany that was a wholly owned subsidiary of FieetBoston FinancialCorporation.
In the commercial sector, the Company provides its clients with business processoutsourcing, systems integration services and technology outsourcing. Business
.process outsourcing is defined as the delegation of one or more inIbrmationtechnology-intensive business processes to an external provider that owns andmanages the selected processes based on measurable performance metrics. Clientsoutsource business processes to gain efficiencies, increase productivity and lowercosts. More and more companies are concluding that it is more efficient to focuson their core competencies and to outsource their non-core but mission-criticalbusiness processes. The Company developed its business process outsourcingservices to capitalize on a growing trend by business to outsource entire processes,including the technology requirements of the business function.
Within the federal government sector, ACS provides business process outsourcingand systems integration services. The Company’s civilian agency clients accountfor about half of its federal government revenues and Department of Defenseagencies account for the remaining half.
Draft/Confidential
"
f 58
STARS0026457

Professional Services Tier
O Houlihan t ..K~y Howard & Zukm
mMCFO
BLOCK H & R
.0 i ’
H&R Block, Inc. is a diversified company with subsidiaries providing tax servicesand financial advice, investment and mortgage products and services and businessand consulting services. In the fiscal year ended April 30, 2002 (fiscal 2002), theCompany’s tax subsidiaries and their franchisees served 19.4 million taxpayersthrough its nearly 10,400 offices located in the United States, Canada, Australiaand the United Kingdom. Another 3.4 million clients utilized the tax softwareprogram, TaxCut from H&R Block, and the online tax preparation service.Investment services and securities products are offered through L I&R BlockFinancial Advisors, Inc. (HRBFA). H&R Block Mortgage Corporation and OptionOne Mortgage Corporation (Option One) offcr a full range of home mortgage
¯ products and services. RSM McGladrey, Inc. (RSM) is a national accounting, taxand consuhing firm primarily serving mid-sized businesses.
The Company is the parent corporation in a two-tier holding company structurewith H&_R Block Group, Inc. as the second-tier holding company and the direct orindirect owner of the operating subsidiaries that provide tax and financialproducts and services to the general public principally in the United States, butalso in Canada, Australia and the United Kingdom. Approximately 58% of thetotal revenues of the Company in fiscal 2002 were generated by subsidiariesinvolved in tax return preparation, electronic filing of income tax returns andother tax-related services. The Company’s subsidiaries also originate, service andsell mortgages, offer investment advice, brokerage services and investmentplanning, offer personal productivity software, participate in refund anticipationloan products offered by a third-party lending institution, and offcr accounting,tax and consulting services to business clients. :.,
ii
¯ i1
.v
Draft/Confidential ~" 59
STARS0026458

Professional Services Tier
O Houlihan L..4..ey Howard & Zukl~
CENTURY BUSINESS SERVICES
Century Business Services, Inc. is a diversified services company that, actingthrough its subsidiaries, provides professional outsourced business servicesprimarily to small and medium-sized businesses, as well as individuals,govermnental entities and not-for-profit enteq)rises throughout the United Statesand in Toronto, Canada. CBIZ delivers integrated services through three divisions:Business Solutions, Benefits and Insurance Services, and National Practices.
The business units that comprise CBIZ’s Business Solutions division offer servicesin a variety of areas. They include tax planning and preparation; cash flowmanagement; strategic planning; consulting; record- keeping; tax return
.’. preparation; tax planning based on financial and investment alternatives; taxstructuring of business transactions such as mergers and acquisitions; quarterlyand year-end payroll tax reporting; outsourced chief financial officer services andother financial staff services; financial investment analysis, succession, andretirement and estate planning.
The business units that comprise the Company’s Benefits and Insurance divisionoffer services in employee benefits, insurance brokerage, consulting andadministration, including the design, implementation and administration ofqualified plans such as 401(k) plans, profit-sharing plans, defined benefit plansand money purchase plans; actuarial services; health and welfare benefitsconsulting.
The business units that comprise CBIZ’s National Practices division offer servicesin payroll processing and administration; valuations of commercial, tangible andintangible assets and financial securities; mergers and acquisitions ao,d capitaladvisory services.
Draft/Confidential
STARS0026459

Professional Services Tier
O Houlihan Lokey Howard & Zukh~
myCFO
BEARINGPOINT
BearingPoint, Inc., formerly K.PMG Consulting, Inc., is a consulting firm servingover 2,500 clicnts, including global 2000 and Fortune 1000 companies, small andmedium-sized businesses, government agencies and other organizations. TheCompany provides its clients with a range of service offerings that combineindustry-specific husiness services, including business and technology strategy,systems design and architecture, applications implementation, networkinfrastructure and managed services.
Public services group assists public services clients in process improvement,enterprise resource planning and lnternct integration servicc offerings. This groupis also a provider of financial and economic advisory services to governmcnts,corporations and financial institutions around the world. The financial servicesgroup focuses on delivering strategic, operational and technology services,including new, component-based business and technical architectures thatleverage existing application systems and e-business strategies developmentdelivered through consumer and wholesale lincs of business. The communicationsand content provides services that support broadband access, value-added services,content management, network management and transaction-based commerce. Thehigh tech delivers e-business integration service offerings in the global arena andfast growing e-business companics that increasingly require the Company’sinfrastructure development tools. The company’s consumer and industrial marketsgroup advises clients on capturing and assessing customer needs and buyingpattern data to improve onc-to-one marketing and capture additional marketshare. Finally, the heahh hare provides e-business and healthcarc businessexpertise and experience to enable healthcare organizations to ca~!talizc oncnterprisc-resourcc planning and lnternct ol)portunitics. The company pr’ovidcs itshcalthcarc clients with Sl)ccialists in the provider, payor and life sciences segments
Draft/Confidential
Uf|tinl! I’ainl IID¢.(~1 I. 2tlbl I~1 Ih~tl ~ t,J.
t,I
i,:
i: - 4
1
1~,i I+~ l.k I. Ic I,.4. r~p+ M, l~ I.i ^~ ~,.
STARS0026460

Professional Services Tier
NAVIGANT CONSULTING
Navigant Consulting, Inc. is a management consulting firm to Fortune 500 andother companies, government agencies, law finns, financial institutions andregulated, industries. The Company’s business structure consists of two business
segments. The Financial &. Claims Consulting business segment providesconsulting services such as data management, quality control, business and
property valuation, research and analysis, litigation support and expert testimony,bankruptcy and solvency management, outsourcing and claims management. TheEnergy & Water Consulting business segment provides consulting and transactionsupport services to the energy, network-based and regulatory industries. These
services include, among others, the areas of production, generation, transmission,distribution and retail supply. This business segment also provides planning andengineering services to the water industry.
The Financial & Claims Consulting business segment is comprised of advisors andconsultants who specialize in assisting clients with the financial, economic,
accounting and information aspects of its engagements.
The Energy & Water Consulting business segment is comprised of advisors and
consultants who provide services to all areas of the energy industry. The businesssegment provides consulting and transaction support services to the energy,network based and regulatory industries. These services include, among others,
the areas of production, generation, transmission, distribution and retail supply.This business segment also provides planning and engineering services to thewater industry.
Draft/Confidential
O Houlihan ,.~;;,ey Howard & Zukln
myCFO
b
c~I ~ c~ i~ i~ M., ~ ~.~, 1~ ~ A.. I ~.p
r 62
STARS0026461

Professional Services Tier
Houlihan L ..~ey Howard & ZuKir,
myCFO
RESOURCES CONNECTION
Resources Connection, lnc, is an international professional services firm thatprovides experienced accounting and finance, human resources management, riskmanagement and information technology (IT) professionals to clients on a projectbasis. The Company assists its clients with discrete projects requiring specializedprofessional expertise in accounting and finance, such as mergers and acquisitionsdue diligence, financial analyses, corporate reorganizations and tax-relatedprojects. In addition, Resources provides human resources management services,such as compensation program design and implementation, IT services, such astransitions of management information systems, and internal audit services. TheCompany also assists its clients with periodic needs, such as budgeting andforecasting, audit preparation and public reporting.
The Company provides its services to a diverse client base in a broad range ofindustries. In fiscal 2002, Resources served over 1,400 clients. These includeAllied Waste, Laidlaw Education Services, Bluc Shield of California, PepsiCo Inc.,CB Richard Ellis, Pharmacia Corporation, Credit Suisse First Boston Corporation,Siemens Corporation, El Paso Corporation, Southwest Airlines, ExelonCorporation, Toshiba America Electronic Components, Inc, Great West Life andAnnuity Life Insurance Company and Toyota Motor Sales, USA, Inc.
os i~,,.r t~ lu.l~i~ 14z}u
,..-_,_.~..~ .,,.t.,~__ ~ .~.__ ~ .~ _,_ _ ~
~b¯ z,
i*
lu
z~ls
-i.s
Draft/ConfidentialSTARS0026462

Description of Comparable Companies
Professional Services TierAssets Management Tier
Draft/Confidential
STARS0026463

Assets Management Tier
Houlihan ... ~:ey Howard & ZukllJ
AFFILIATED MANAGERS GROUP
Affiliated Managers Group, Inc. is an asset management company with equityinvestments in a diverse group of mid-sized investment management firms (theAffiliates). In its investments in the Affiliates, the Company typically holds majority equity interest in each firm, with the remaining equity interests retainedby the management of the Affiliate. As of December 31, 2001, the Affiliatesmanaged approximately $81.0 billion in assets across a broad range of investmentstyles and in three principal distribution channels (High Net Worth, Mutual Fundand Institutional). Through these distribution channels, the Affiliates offer morethan 150 products.
.’ .Affiliate clients in the High Net Worth distribution channel include wealthy’ .. individuals, family trusts and managed accounts at brokerage firms that are
attributable to individuals. Through the Affiliates, the Company providescustomized investment management services for high-net-worth individuals andfamilies through direct relationships, as well as through more than 90 managedaccount programs.
Through the Affiliates, the Company provides advisory or sub-advisory services to27 mutual funds.. The Affiliates also offers investment products across 16different investment styles in the Institutional distribution channel, includingsmall, small/mid, mid and large capitalization wdue and growth equity. Throughthis distribution channel, the Company manages assets for foundations andendowments, defined benefit and defined contribution plans for corporations andmunicipalities and Taft-Hartley plans.
AJl~t¢ Mmq~n G~p I~. ~AMG)
LmS U~ L~ b~ ~
Draft/Confidential [" 65
STARS0026464

Assets Management Tier
O Houlihan L ,.,. ey Howard & Zukii~
AMVESCAP
AMVESCAP PLC is an independent investment management group that providesits clients with a broad array of domestic, foreign and global investment products,focused primarily on investment management. The Company has a significantpresence in the institutional and retail segments of thc investment managementindustry in North America, Europe and Asia. The Company operates throughvarious subsidiaries and divisions throughout the world. AMVESCAP managesassets regionally, and has a team of approximately 900 investment professionalslocated around the world. In addition, the Company offers multiple investmentstyles for the various investment objectives and asset classes of the products itoffers. AMVESCAP’s products include equity, balanced, fixed income, moneymarket and real estate investment portfolios.
AMVESCAP uses several methods to distribute its products to retail andinstitutional clients in each of its markets. In North A~nerica, the Company offersload and no-load mutual funds, separate account management and wrap accounts.Wrap accounts offer individuals and smaller institutions comprehensiveinvestment management services under a single-fee structure coveringsubstantially all charges, including investment management, brokerage, custody,record keeping and reporting. Outside of North America, the Company offers unittrusts and other European and Asian mutual funds, as well as private accountmanagement for retail and institutional investors. AMVESCAP’s retail andinstitutional clients are located in more than 100 countries..
Draft/Confidential
~,ln~l) YL£ Lp, V L)
,
ii
STARS0026465

Assets Management Tier
O Houlihan L,. ,ey Howard & Zukip
myCFO
BLACKROCK
BlackRock, Inc., is an investment management firm in the United States. TheCompany’s products span a broad spectrum of fixed income, liquidity and equityseparate accounts and mutual funds, including its BlackRock Funds andBlackRock Provident Institutional Funds (BPIF) families. BlackRock "also offersrisk management and investment technology services to institutional investorsthrough its BlackRock Solutions product line. The Company operates fivebusiness segments: Fixed Income, which offers fixed income separate accounts andmutual funds; Liquidity, which offers institutional money market fund managerservices; Equity, which offers asset and portfolio management services; AlternativeInvestment Products, which offers collateralized bond obligations (CBO) and realestate finance portfolios, and Risk Management and Investment Systems, whichenhance the clients’ ability to assess risk at the security, portfolio and enterpriselevel.
B=cMr=k ~ iIItJ~l
6=41
a~
*==Z*=
I=17
Draft/Confidential1" 67
STARS0026466

Assets Management Tier
O Houlihan l_,;,..~.y Howard & Zuknn
myCFO
FEDERATEDINVESTORS
i"
Federated Investors, Inc. and its consolidated subsidiaries provide investmentmanagement and related financial services. Federated sponsors, markets andprovides investment advisory, distribution and administrative services primarily tomutual funds in both domestic and international markets. Total assets undermanagement, as of December 31, 2001, were $179.7 billion, primarily in fundsmanaged, distributed and administered by Federated and in o ther non-fundproducts (Managed Assets), of which $6.4 billion were in separately managedaccounts. Managed Assets, as of December 31,2001, increased $40.1 billion overthe prior year.
The Company provided investment advisory services to 139 funds, as ofDecember 31, 2001. The funds sponsored by Federated are domiciled in theUnited States, with the exception of Federated International Funds PIc andFederated Unit Trust, which are domiciled in Dublin, Ireland. Of these 139 funds,Federated’s investment advisory subsidiaries managed 52 money market funds(and cash equivalents) totaling $135.1 billion in assets, 47 fixed-income fundswith $17.4 billion in assets and 40 equity funds with $20.8 billion in assets.Federated also serves as investment adviser to pension and other employee benefitplans, corporations, trusts, foundations, endowments, mutual funds sponsored bythird parties and other investors. These separate accounts totaled $6.4 billion inassets under management, as of December 31,2001.
I+141"m14 1 nVl:l,l m I~. IF III
IJ s lJ,.l~
~++7’
lhlll I+ I 1,0t.,,.+ I+ IS,,+
i
~ l°
Draft/Confidential
STARS0026467
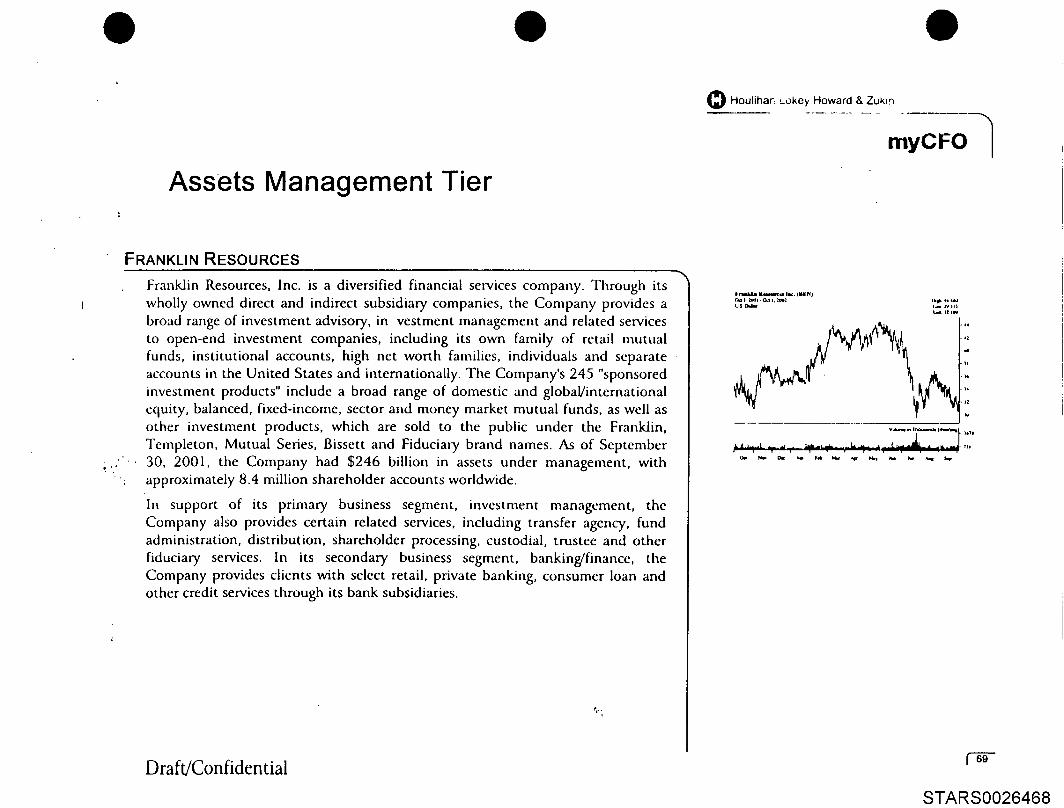
Assets Management Tier
O Houlihar: Lokey Howard & Zuk~n
myCFO ]
FRANKLIN RESOURCES
Franklin Resources, Inc. is a diversified financial services company. Through itswholly owned direct and indirect subsidiary companies, the Company provides abroad range of investment advisory, in vestment management and related servicesto open-end investment companies, including its own family of retail mutualfunds, institutional accounts, high net worth families, individuals and separateaccounts in the United States and internationally. The Company’s 245 "sponsoredinvestment products" include a broad range of domestic and global/internationalequity, balanced, fixed-income, sector and money market mutual funds, as well asother investment products, which are sold to the public under the Franklin,Templeton, Mutual Series, Bissett and Fiduciary brand names. As of September30, 2001, the Company had $246 billion in assets under management, withapproximately 8.4 million shareholder accounts worldwide.
In support of its primary business segment, investment management, theCompany also provides certain related services, including transfer agency, fundadministration, distribution, shareholder processing, custodial, trustee and otherfiduciary services. In its secondary business segment, banking/finance, theCompany provides clients with select retail, private banking, consumer loan andother credit services through its bank subsidiaries.
I. nId,.g.i II I IIl.lgfi tc~,t nml .~l. llml Ibll, ~4~U.S lkaw ,~ /"* SIS
,4’
41
’l
II
I*
’l
lU
l=TI
Draft/Confidential f 69
STARS0026468

Assets Management Tier
Houlihan ’~,- ey Howard & Zukin
myCFO
W.P. STEWART & Co.
W.P. Stewart & Co., Ltd., is an asset management company that providesresearch-intensive equity investment management services to clients throughoutthe world. The Company operates a group of companies, including W.P. Stewart& Co. Inc., an investment adviser; W.P. Stewart Securities Limited, a broker-dealer; W.P. Stewart & Co. (Europe), Ltd., is an authorized and regulated by thefinancial services authority (FSA), previously regulated by the InvestmentManagement Regulatory Organization Limited (IMRO), and W.P. Stewart FundManagement Limited, a fund management company that is regulated by theCentral Bank of Ireland (collectively, the Stewart Group).
The Stewart Group offers research-intensive equity investment managementservices worldwide. Central to the Company’s success are three interdependentcompetitive strengths: culture, in which it places great emphasis on teamwork andclient service; investment methodology, in which it focuses on providing itsadvisory clients with above-average investment returns over long periods of time,while accepting a below-average risk, and performance record, in which itrepeatedly examines and analyzes its level of performance, as compared toprevious years.
While investment performance is the Company’s primary focus, asset gathering isalso important to its business. W.P. Stewart & Co. has developed mutuallybeneficial relationships with select institutions and individuals to accumulate newassets and have internalized relationships with its strongest partners. W.P.Stewart & Co. will continue to cultivate long-term relationships with its networkof marketers and to establish relationships with additional marketers for
additional asset gathering. ,,..
us (ivua t~ io i~,lt~ ill,a
- 11/J
1+t.’
.IR¯ ii
Draft/Confidential
STARS0026469

Assets Management Tier
Houlihar ,, ,’,ey Howard & Zukln
...............
STILWELL FINANCIAL
Stilwell Financial Inc., s a diversified, global financial services company withoperations through its subsidiaries and affiliates in North America, Europe andAsia. Stilwell’s subsidiaries and affiliates are engaged in a variety of assetmanagement and related financial services to registered investment companies,retail investors, institutions and individuals. The primary entities comprisingStilweil, as of December 31, 2001, were Janus Capital Corporation (lanus), approximate 98%-owned subsidiary (prior to the conversion of Janus to a limitedliability company); Stiiwell Management, Inc. (SMI), a wholly owned subsidiaryof Stilwell; Berger Financial Group LLC (Berger), of which SMI owns 100% of theBerger preferred limited liability company interests and approximately 87% of theBerger regular limited liability company interests; Nelson Money Managers Pie(Nelson), an 81%-owned subsidiary, and DST Systems, Inc. (DST), approximate 33% equity investment owned by SMI.
Janus is the principal business comprising Stilwell, representing 95% of assetsunder management at December 31,2001, and 95% of revenues and 91% of netincome for the year ended December 31,2001. During the year ended December31, 2001, Stilwell and lanus completed several acquisitions of Janus commonstock that increased Stilwell’s ownership interest in Janus from 82.5% toapproximately 98%.
o, ll ~l -t~.l i. Jwzos L~I~- ii 51u
i i i
Draft/ConfidentialSTARS0026470

Assets Management Tier
O HoulihaP Lokey Howard & Zukur~
myCFO
NEUBERGER BERMAN
Neuberger Berman Inc., operates through its subsidiaries as an investmentadvisory firm. The Company provides clients with a wide array of investmentproducts, services and strategies. Neuberger’s business is conducted primarilythrough its subsidiaries, Neuberger Berman, LLC and Neuberger BermanManagement Inc., both of which are registered investment advisers and broker-dealers, and Neuberger Berman Trust Company, N.A. The Company’s clientsinclude individuals, institutions, corporations, pension funds, foundations andendowments. Neuberger’s principal businesses include Private Asset Management,Mutual Fund and Institutional and Professional Securities Services.
Neuberger’s Private Asset Management segment provides customizeddiscretionary investment management services for high-net-worth individuals,families and smaller institutions. Private Asset Management has threecomponents: Money Management, Advisory Services and Trust Services. TheMutual Fund and Institutional segment includes the Company’s family of mutualfunds, institutional separate account products and wrap products sponsored bythird-party brokerage firms and banks, which it offers to a wide array of clients,from the smallest individual investors to the largest institutions. The company’sProfessional Securities Services has four components: Professional InvestorClearing Services, Wealth Management Services, Research Sales and OherActivities..
NwJ~Ml’llwr ~ Ira, (NILU)(,k.I I. ~1. Ocn I. ~2 IkF 11 i~UI I),anlm t.~ It |~
t,.im. /’l ~
7~
12
Draft/Confidentiali’ 72
STARS0026471