Embed Size (px)
Citation preview
Vol. 10, No. 7/July 1993/J. Opt. Soc. Am. B 1149
Stark effect in dye-doped polymers studied byphotochemically accumulated photon echo
Hansruedi Gygax, Alexander Rebane, and Urs P. Wild
Physical Chemistry Laboratory, Swiss Federal Institute of Technology, ETH-Zentrum, CH-8092 Zurich, Switzerland
Received October 6, 1992; revised manuscript received January 21, 1993
We study theoretically and experimentally the influence of a homogeneous static electric field on a photochemi-cally accumulated stimulated photon echo in dye-doped polymers. The dependence of the time profile of theecho signal on the strength of the electric field is evaluated in the case of a linear Stark effect. Experimentsusing polymers doped with organic dye molecules are carried out at low temperature, and our new technique isapplied to determine the difference of the permanent dipole moment in the ground and the first excited singletelectronic state of the impurity molecules.
INTRODUCTION
Narrow zero-phonon lines"2 (ZPL's) are sensitive probesfor studying the effect of external and internal electricfields on impurity molecules in solids. With organic im-purity molecules doped into polymers, one can produce, bymoderate applied field strengths, Stark shifts that areorders of magnitude larger than the homogeneous widthof ZPL's at liquid-helium temperatures (hom 10-2-10- cm'1). On the other hand, the inhomogeneous broad-ening of ZPL's in organic polymers is remarkably large(AVjnhom - 102 cm'1), so that the Stark shifts of ZPL's arecompletely obscured by inhomogeneous broadening of thespectra. Several methods based on persistent spectralhole burning', 4 (PSHB) and the application of narrowbandtunable lasers for excitation,5 7 as well as using the tech-nique of holographic detection of narrow spectral holes,8 9
have been developed to avoid the inhomogeneous broaden-ing of spectra and to study the Stark effect in polymers.
An alternative approach to eliminating the inhomoge-neous broadening of ZPL's is by time-domain coherent op-tical phenomena such as photon echo'0 and, especially inPSHB media, the method of photochemically accumulatedstimulated photon echo (PASPE)."" l2 PASPE results fromscattering (diffraction) of a probe pulse from a frequency-domain grating that has previously been written in theinhomogeneous frequency distribution of the ZPL's by illu-mination with sequences of coherent pulses.""3 The ori-gin of PASPE is similar to the phenomena of stimulatedphoton echoes'4 "5 and to the photon echoes observed fromtransient spectral gratings because of population accumu-lation in the triplet bottleneck.'6 The distinctive featureof PASPE is a practically infinite lifetime of the bottle-neck state, actually given by the very long lifetime (hours,days) of the photoproduct state. The amplitude of PASPEis given by the Fourier transform of the shape of the grat-ing in the frequency domain (at least so long as the scat-tering process is treated in linear terms'7 ) and relates tothe homogeneous line shape.
It is apparent that, if the Stark effect shifts the fre-quency of ZPL's, then it should also influence the coherenttime-domain response of the media and facilitate, as a
consequence, the determination of the Stark effect pa-rameters of the impurity center. In addition, because thePASPE technique has several potential applications intime-domain holographic processing of ultrashort opticalsignals, 8 9 the effect of an external field on time-domainholograms must be investigated.
We have previously reported2 0 that an external electricfield alters the intensity of PASPE. At liquid-heliumtemperature, PASPE signals were accumulated in apolyvinylbutyral (PVB) film doped with chlorin molecules,and during the readout an electric field was applied.When we increased the voltage applied across the sample,the intensity of the echo signal first decreased from itsinitial absolute maximum value to zero and then increasedagain when the voltage was further increased. The sensi-tivity of the echo signal to the applied Stark field was de-pendent on the time delay between the picosecond pulsesused to write the frequency-domain grating, and the echosignal did not vanish only if the delay was made equal tozero. Reference 20 gives a qualitative explanation of theobserved phenomena in terms of a set of spectral holesthat constitute the grating: if the spectral profile of onenarrow hole splits and broadens in the Stark field, then ata certain value of the splitting the contrast in the spectraldomain vanishes, and so also does the intensity of the echosignal. When the Stark splitting of the holes is furtherincreased, the contrast in the spectral domain increasesagain and the PASPE signal reappears. The lack of sensi-tivity to the electric field at zero delay is due simply to theabsence of a frequency-domain grating: only a spatialgrating exists.
To evaluate the behavior of the PASPE signal in an ex-ternal field on a quantitative level, we need to considerhow the Stark effect alters the resonance frequencies ofZPL's within the inhomogeneously broadened band. Thetime profile of the coherent response is then given by theFourier transform of the altered ZPL frequency distribu-tion function.
Recently a modulation of the photon-echo intensity as afunction of an applied electric field was observed also in acrystalline system of Eu3̀ in YAlO3.2 22 On a qualitativelevel, the explanation of this phenomenon is similar to that
0740-3224/93/071149-10$06.00 © 1993 Optical Society of America
Gygax et al.
1150 J. Opt. Soc. Am. B/Vol. 10, No. 7/July 1993
nate successively a thin polymer film of thickness L dopedwith dye molecules that are subject to PSHB [seeFig. 1(a)]. The film is positioned at plane z = 0 of thecoordinate system, the illuminating pulses propagate to-ward the PSHB recording medium in the positive z-axisdirection at angles 0, and 02 in the (x, y) plane, which areclose to the normal incidence of the film. The polariza-tion of the pulses is assumed to be linear; the electric com-ponent points in the direction of the y axis. Theoscillating electric field incident upon the polymer film isgiven by
A(tr) = n s, t- cr)exp[i2irvo(t - )
+ S2t q2- - exp[i27rvo(t - -2 -
(1)
where q = (sin )0,0,cos El) and q2 = (-sin 02,0,cos 02), T is the time delay between the pulses at the pointof the origin (r = 0), n is the unit polarization vector, andc is the speed of light. We present the amplitude of thepulses by their Fourier transforms,
s(t) = F'(g(W)) = I ()exp(it)do,(b)
Fig. 1. (a) Geometry of the writing procedure. The PSHB plateis positioned in the plane z = 0. Propagation vectors of the writ-ing beams q, and q2 are in the (x, z) plane. The polarizationvectors are parallel to the y axis. The value of the applied elec-tric field is zero. (b) Geometry of the read procedure. Theprobe beam propagates in the direction of the z axis and is polar-ized parallel to they axis. The external electric field E is appliedperpendicular to the plane of the PSHB plate parallel to the z axis.
given above. The differences between the two experi-ments come from much larger inhomogeneous and homo-geneous linewidths of polymeric systems compared withthose of crystals and from the random orientation ofthe dye molecules in polymeric matrices versus the orien-tational order of the impurity centers in a crystallineenvironment.
In this paper we derive general formulas that describethe dependence of the time profile of an arbitrary PASPEsignal on the external electric field. Numerical resultsare presented for the case of linear Stark effect for impu-rity molecules with intrinsic- and matrix-induced perma-nent dipole moments. We also carry out experimentswith PVB film doped with molecules of chlorin and oc-taethylporphyrin and compare the results of our modelcalculations with the experimental data.
THEORY
In this section we evaluate the general formulas thatdescribe the dependence of the amplitude of PASPE onthe homogeneous external electric field applied during thereadout of the spectral grating. During the writing stageof the PSHB spectral grating the external electric fieldis zero.
Consider two plane-wave laser pulses of complex en-velopes sl(t) and s2(t) with the spectrum centered aroundthe optical carrier frequency vo. Let the pulses illumi-
and express the intensity of light absorbed by themolecules of certain ZPL frequency at coordinate xthrough the absolute square of the sum of the Fourieramplitudes:
I(co,x) = ,(wo - 2-vo) 12
+ 1s2 (C - 2vo)I 2
+ S2(O - 2 1rvo)*(w - 2'rvo)
x exp[ic(oT + x in )] + g (w - 2'ino)
X 2*(O - 2rvo)exp [iQ x- i )] ' (3)
where sin FD = sin 01 + sin 02 and where * denotes thecomplex conjugate.
The inhomogeneous distribution function, N(c, Q),gives the number of impurity molecules per unit volume,per frequency interval Aw, per unit solid angle, that havethe ZPL in the frequency interval (co, co + Awc) and are ori-ented with the transition dipole moment vector, d, point-ing along unit vector fQ.
Here we assume a one-photon PSHB process in whichthe photoproduct does not absorb at the wavelength of theoriginal inhomogeneous absorption band. If the ampli-tude of the incident light is sufficiently low'7 and satisfiesthe condition
AWt1 << hFhomIAdtli (4)
where h is Planck's constant, then the number of burned-out molecules is linearly proportional to the number of ab-sorbed photons. To achieve an appreciable contrast of thespectral grating under the weak excitation condition (4),we assume that the illumination is repeated (accumulated)many times while the interval between the illuminationcycles are kept longer than the relaxation time of the
x
(a)
(2)
Gygax et al.
Vol. 10, No. 7/July 1993/J. Opt. Soc. Am. B 1151
impurity excited electronic state (typically 10- s). Thevariation of the inhomogeneous distribution functioncaused by the illumination is
AN(w, x, Q) = ( N(w, x, Q)[I(w, x) 0 F(w)], (5)
where N' is the chromophore concentration before illumi-nation, (w)) is the homogeneous ZPL line-shape function,and C) denotes integral operation of a convolution. Theconstant qr is proportional to the quantum yield of thePSHB process, to the absorption cross-section of theZPL's, and to the number of the accumulated pulse pairs.Here we assume that the summary illumination dose issmall so that the number of the remaining inpuritymolecules is much larger than the number of bleached outmolecules.
In a nonilluminated sample the transition dipolemoments of the impurity molecules are isotropically ori-ented. We assume that before illumination the frequen-cies of ZPL's are statistically independent from the
perposition of the molecular oscillator responses to theprobe pulse. The amplitude of the induced oscillations ofa molecular dipole depends on the detuning between thefrequency of the driving optical field and the ZPL reso-nance frequency. The ZPL resonance frequency experi-ences a shift in an external electric field, and the newvalue of the frequency detuning is
d = 27rvo -[27rvzpL + F(E, a)], (7)
where the Stark shift F depends on the orientation of theimpurity molecule with respect to the vector of the ap-plied static field. (We assume that the external field doesnot change the orientation of the dye molecules.)
We consider the probe beam to be linearly polarizedalong the y axis and to propagate perpendicular to thePSHB film in the direction of the z axis [Fig. 1(b)]. Theamplitude polarized along the y axis immediately behindthe PSHB film is expressed by summing the responses ofthe impurity molecules with different resonance frequen-cies and orientations 7
18' 2324:
A( x{ E) --(2)2vL( (dn)N'W f, x).N~t xE) F 93(coexp hc i[w' - &O + F(E, fi] + lTrhom/J
,ri- (d )2= F exp -ao(
LiCO - co + F(E, f)] + hm
orientation of the molecules and that the concentration ofthe impurity molecules is spatially homogeneous. Forsimplicity we assume also that the spectral width of thepulses is much less than the width of the inhomogeneousabsorption band. The inhomogeneous distribution func-tion after the illumination is then
N'(o, x, ) = N + AN(w,x,a),
) (0))s ( 1 + o (dn)[I(' ,X) 0 r(')] s3(CO) 1 + \ i[' - Co + F(E,Q)] + 7rFhom/J
(8)
where a0 = (27r)2vo-qLN(hc)-' and the angle brackets de-note integration over the ZPL resonance frequencies CO' aswell as over the orientations of the molecules, a. We haveassumed here a Lorentzian line shape,
IT.homF(W) = co2 + (hom) 2 (9)
(6)
where N° is constant.After the PSHB procedure is completed, we illuminate
the sample with another pulse (probe pulse) of amplitudes3(t), while, at the same time, we apply a homogeneouselectric field E. The intensity of the probe pulse is takenlow enough that it has a negligible effect on the inhomoge-neous distribution function. The impurity moleculesscatter the probe light resonantly, and because of the grat-ing in the spatial and frequency distribution of the ZPL's,a fraction of the probe amplitude is diffracted in a direc-
and have neglected the phonon side band. In Eq. (8) thescattered amplitude is written as a separate term corre-sponding to the inhomogeneous distribution unaffected bythe PSHB process in order to distinguish it from the timeresponse that occurs from the bleached out spectral andspatial grating. The time response is expanded intoTaylor series of which only the first two terms (the termsinside the braces) are kept. The exponential factor on theleft-hand side of Eq. (8) is later omitted. The next step isto substitute Eqs. (3), (5), and (6) into Eq. (8) to get
, ,E S3(0i))1 + aO (Wi(i(w' - 2rvo)l2 + 12(O - 2 o)I2 )A'(t, x, E) = SCO \ i[' - w + F(E, n)] + 27rrhom
(dnl)4%*(d - 2vo)9 2(C' - 2rvo)exp[-id'(
i[o' - o + F(E,Q)] + 2 ff1ho.
(dn)4f2*(cOI - 2rvo),(do' - 2rvo)exp[i' (T
x sin )\T - II~c
~~~I]x sin cI31\
)'
i[co' - o + F(E, Q)] + 2rhom(10)
tion different from the direction of the probe beam. Thediffracted beam (PASPE) originates from the coherent su-
+ aoF-"s3(CO)(
+ aoF-' (MO)K-
Gygax et al.
The first term on the right-hand side of Eq. (10) corre-sponds to the light beam that passes through the film
1152 J. Opt. Soc. Am. B/Vol. 10, No. 7/July 1993
without diffraction, and the second and the third termscorrespond to the PASPE signal. After integrating overthe variable w' and evaluating the inverse Fourier trans-form, we get, for the amplitudes of the echo signals,A,1'(t, x, E)
rt- s3(t')G(t - t',E)exp[2'7r(ivo - Fhom)(t - t')]
X sin (D~x f S*(t")S2 t + t' - t - + x dt'dt"
C/_,0~~~ sic(
x exp[i2irvo(-T + )] (la)
A-,'(t, x, E)
rt= f:s3(t')G(t - t',E)exp[2nr(ivo - Fhom)(t - t')]
x sin ( x in I0'X Is*t)lt + t' - t - + Jdt'dt"o_x /X< exp[i2 7rvo(r - -snc)],X (lib)
where we have introduced the function
G(t, E) = f (dn) 4 exp[- iF(E, fl)t]dfl. (12)
Equation (la) describes the PASPE propagating in the di-rection q+,l = (-sin , 0,cos 1D), which corresponds tothe first positive diffraction order. Equation (lib) de-scribes the echo signal diffracted in the direction q_' =(sin (I, 0, cos cD) and corresponds to the first negative dif-fraction order. We see that the echo amplitudes are ex-pressed as a convolution of the readout pulse amplitudewith the time-domain amplitude response of the hologram.The time response function is, in turn, proportional to thefunction G multiplied by the cross-correlation function ofthe two writing pulses.
Let us assume now that s,(t) and s3(t) (reference pulses)are both much shorter than s2(t) (object pulse). [Equiva-lently, we may assume that the cross-correlation functionof sl(t) and s3(t) is zero, with the exception of a sharp peakat time t = 0.] In other words, we assume the spectra ofthe pulses s, and S3 to be much broader than the one fromS2, and we can approximate the amplitudes of the refer-ence pulses with 8 functions. Then Eqs. (11) reduce to
A+'= S2(t - T + x sin )G(tE)
X exp[i27rvo(t - + s ex p (- 2r.Fhmt),
(13a)
x sin D
C X exp [i27rvo(t + T -- ) ]ex)p]xij2-ij'iomt).
(13b)
We see from these equations that in both diffraction or-ders the time amplitude of the echo signal is multiplied bythe same function G. This function fully characterizesthe average Stark shifts of the ZPL's and is universal inthe sense that it depends on the electric properties of the
impurity centers and does not depend on the particulartime profile (and spectrum) of the excitation pulses or onthe width (and shape) of the homogeneous spectral line.Also, it follows from Eqs. (13) that the external field doesnot change the causality-related property of the diffrac-tion direction24 25 : If the delay between the writingpulses is positive over the cross section of the sample, >
IXmaxC'1 sin F, then the echo signal in the -1 order is zero,and light is diffracted only into the +1 direction. In theopposite case (negative time delay), the diffraction takesplace only in the negative order, and the reconstructed ob-ject pulse is inverted in time.
Equations (11)-(13) reflect the fact that Stark effectcan manifest itself as a modulation of the time profile ofPASPE. On the other hand, if the time profile of the ob-ject pulse is also a 8 function, then the echo amplitude issimply
'= G(± x sin E)exP[-2rhom(T x sin (1 )
(14)
In particular, it follows from Eq. (14) that the PASPE am-plitude may be nonuniform over the cross section of thebeam if the delay between the pulses differs much alongthe x axis.
Now we turn to the investigation of the first-orderStark effect. The frequency shift depends linearly on theprojection of the electric field vector on the direction ofthe vector difference between the static dipole moment inthe ground and the excited electronic states and the Starkshifts is
(15)F(E,Q) = -I E AIAmoIcos /S,h
where G is the above-named angle. In our notation thevalue of the electric field includes the Lorentz-Lorenzcorrection factor for local field strength in an isotropic di-electric medium. Below we will assume that the anglebetween the writing beams is sufficiently small to mini-mize the spatial nonuniformity of the echo. Let the elec-tric field be applied perpendicular to the (x, y) plane, i.e.,perpendicular to the polarization vector of light. First weconsider impurity molecules with only an intrinsic dipolemoment. In this case the function G can be evaluatedanalytically:
G(t, E) = f (dn)4 exp[iF(E, II)t]dfl
Q~~~~2r 2r , r
= j doj d(pj (sin 13)d/3(dn)'
27r
= f[A() + B(O)(cos 2 3) + C(O)(cos4 /3)]
x cos 2 tJEI(JA/t.moicos 13)1(sin /3)d/3
= {2D[B(O)D2 - 2C(O)(6 - D2)](cos D)D
+ [A(O)D4 - B(O)D(2 - D2)
+ C(O)(24 - 12D2 + D4)](sin D)}, (16)
Gygax et al.
Vol. 10, No. 7/July 1993/J. Opt. Soc. Am. B 1153
0.0
A%+~~~~~~~~~~~~~~~~~~~~~1
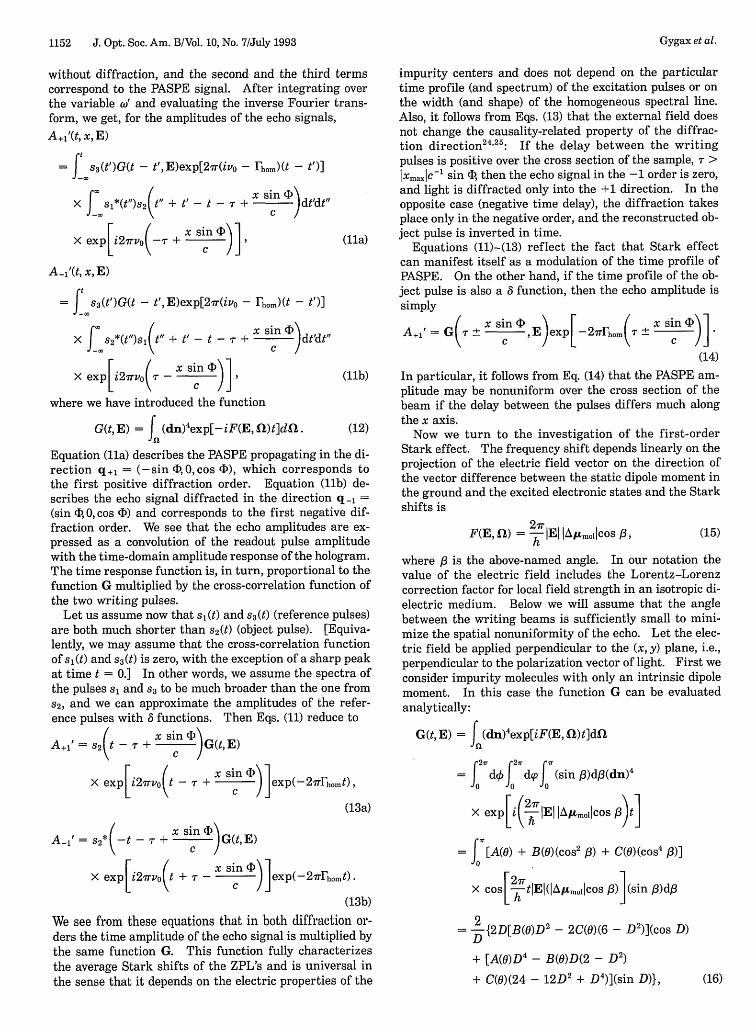
Fig. 2. G calculated (maximum normalized to unity) in the caseof linear Stark effect and zero induced dipole moment (/Amol =
1.0 D) for different angles between the vectors of the transitiondipole moment and the difference of permanent dipole moments(0 < 0 < 180°), plotted as a function of the parameter tE. Thegraph at the top shows the contour of G = 0.
10
ma'
0.0
Fig. 3. G calculated as a function of tE depending on Ajxm1 forthe case of linear Stark effect and zero induced dipole moment.The angle between the vectors of the transition dipole momentand the permanent dipole moment difference is 0 = 90°.
where is the angle between the vectors d and AimoI andD = (2ir/h)tIE AV,,moi. The explicit forms of A(O), B(6),and C() are listed in Appendix A. We see that G is afunction of a parameter given as tE. The amplitude ofEq. (14) varies with the electric field for all delay timesqualitatively in the same way if the voltage is scaled ac-cording to U' = (t/t')U. We can also say that the depen-dence of the PASPE with a fixed time delay between thewriting pulses on the applied voltage is given by the samefunction, as in the case of a fixed voltage and a variabletime delay.
Figure 2 shows the function G depending on tEj, calcu-lated according to Eq. (16), for different values of 0 (Atmolis taken equal to 1 D). The absolute maximum of G is attjE = 0. This function has an oscillating character withseveral local maxima as well as intervals where thefunction turns negative. The oscillations are most pro-nounced if the angle 0 is close to 900. Changing the signof G means switching the phase of the echo amplitude byv. At certain values of tE the function G is equal tozero, i.e., the intensity of the PASPE signal [Eq. (14)] isalso zero. Such behavior can be interpreted if we consid-
der that in our case Stark shifts occur both in increasingand in decreasing frequency direction (pseudo-Stark split-ting). When the absolute frequency shift equals half thegrating period, then the two oppositely shifted structurescancel each other, and the grating vanishes. If the Starkshift increases further, then the contrast of the frequency-domain grating is established again but with the phaseshifted by half the period.
Figure 3 illustrates how G varies with the magnitude ofthe permanent dipole moment difference. Here the valueof 0 is set to 900. The position of the points where thePASPE signal is zero can serve as an indicator of the mag-nitude of A/u.mo11.
In the following calculation, we also take into accountthe induced dipole moment. This additional dipole mo-ment is caused by the surrounding matrix and is con-nected to the electric polarizability of the dye molecule.5
The static dipole moment difference is given now by thesum of the vectors, Aieff = ALmol + ALind, where Akind isthe difference of the induced dipole moment in the groundand the excited electronic states. We discuss here onlymolecules with a planar structure, in which case all threevectors A/ind, A/Amol, and d are in the principal plane ofthe molecule. We modify Eq. (16) by averaging over thestatistical distribution of AIiidl, (around a mean value of((Auindl)), and average also over the direction of VL"ind.
The final expression is
G(tE) = f dyf d(Aindj)f (sin j3)d,3P(/3,',IAindI,/3)
X cs[2ir/h)t E} jIAIeff(cosj /)] . (17)
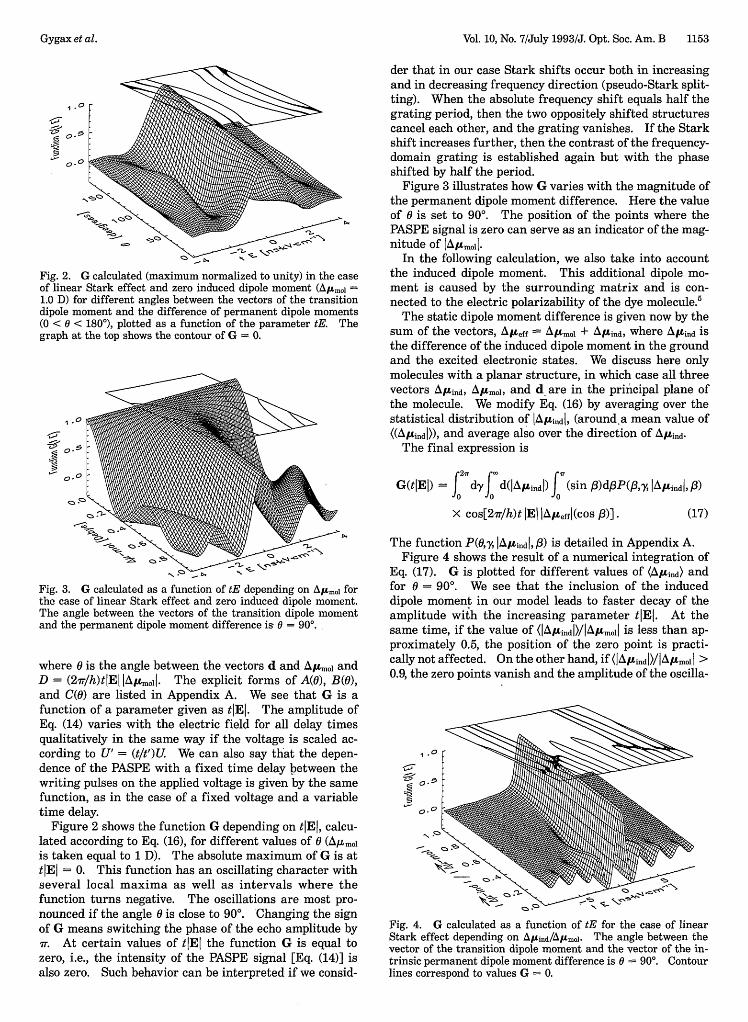
The function P(AY, APuindl, /3) is detailed in Appendix A.Figure 4 shows the result of a numerical integration of
Eq. (17). G is plotted for different values of (ind) andfor = 90°. We see that the inclusion of the induceddipole moment in our model leads to faster decay of theamplitude with the increasing parameter tIE. At thesame time, if the value of (A\,indI)/IAP'moI1 is less than ap-proximately 0.5, the position of the zero point is practi-cally not affected. On the other hand, if (Aindj)/Aimoj >0.9, the zero points vanish and the amplitude of the oscilla-
Fig. 4. G calculated as a function of tE for the case of linearStark effect depending on Ajitnd/A/Amol. The angle between thevector of the transition dipole moment and the vector of the in-trinsic permanent dipole moment difference is 0 = 90°. Contourlines correspond to values G = 0.
Gygax et al.
1154 J. Opt. Soc. Am. B/Vol. 10, No. 7/July 1993
beam-splitter
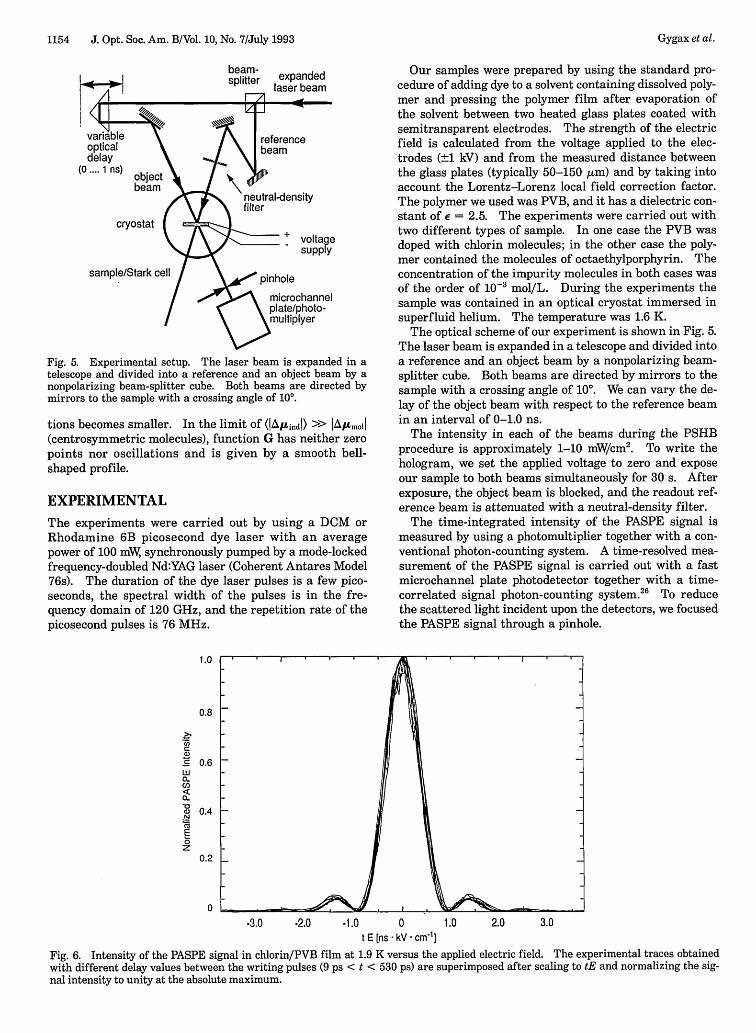
Fig. 5. Experimental setup. The laser beam is expanded in atelescope and divided into a reference and an object beam by anonpolarizing beam-splitter cube. Both beams are directed bymirrors to the sample with a crossing angle of 100.
tions becomes smaller. In the limit of (IA/uiid) >> A/Amoll(centrosymmetric molecules), function G has neither zeropoints nor oscillations and is given by a smooth bell-shaped profile.
EXPERIMENTAL
The experiments were carried out by using a DCM orRhodamine 6B picosecond dye laser with an averagepower of 100 mW, synchronously pumped by a mode-lockedfrequency-doubled Nd:YAG laser (Coherent Antares Model76s). The duration of the dye laser pulses is a few pico-seconds, the spectral width of the pulses is in the fre-quency domain of 120 GHz, and the repetition rate of thepicosecond pulses is 76 MHz.
Our samples were prepared by using the standard pro-cedure of adding dye to a solvent containing dissolved poly-mer and pressing the polymer film after evaporation ofthe solvent between two heated glass plates coated withsemitransparent electrodes. The strength of the electricfield is calculated from the voltage applied to the elec-trodes (±1 kV) and from the measured distance betweenthe glass plates (typically 50-150 pum) and by taking intoaccount the Lorentz-Lorenz local field correction factor.The polymer we used was PVB, and it has a dielectric con-stant of e = 2.5. The experiments were carried out withtwo different types of sample. In one case the PVB wasdoped with chlorin molecules; in the other case the poly-mer contained the molecules of octaethylporphyrin. Theconcentration of the impurity molecules in both cases wasof the order of 10' mol/L. During the experiments thesample was contained in an optical cryostat immersed insuperfluid helium. The temperature was 1.6 K.
The optical scheme of our experiment is shown in Fig. 5.The laser beam is expanded in a telescope and divided intoa reference and an object beam by a nonpolarizing beam-splitter cube. Both beams are directed by mirrors to thesample with a crossing angle of 100. We can vary the de-lay of the object beam with respect to the reference beamin an interval of 0-1.0 ns.
The intensity in each of the beams during the PSHBprocedure is approximately 1-10 mW/cm2. To write thehologram, we set the applied voltage to zero and exposeour sample to both beams simultaneously for 30 s. Afterexposure, the object beam is blocked, and the readout ref-erence beam is attenuated with a neutral-density filter.
The time-integrated intensity of the PASPE signal ismeasured by using a photomultiplier together with a con-ventional photon-counting system. A time-resolved mea-surement of the PASPE signal is carried out with a fastmicrochannel plate photodetector together with a time-correlated signal photon-counting system.26 To reducethe scattered light incident upon the detectors, we focusedthe PASPE signal through a pinhole.
1.0
0.8
0-
0
N
0Z
0.6
0.4
0.20 1 N"9 . I .we' -3.0 -2.0 -1.0 0 1.0 2.0 3.0
tE [ns - kV . cm'1]
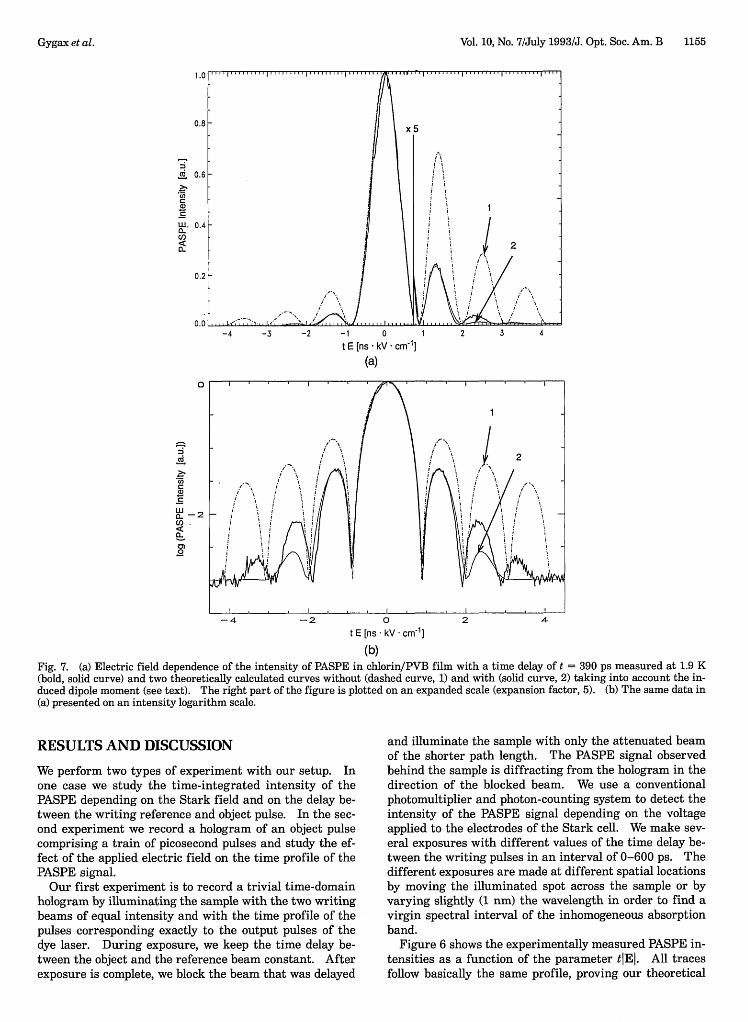
Fig. 6. Intensity of the PASPE signal in chlorin/PVB film at 1.9 K versus the applied electric field. The experimental traces obtainedwith different delay values between the writing pulses (9 ps < t < 530 ps) are superimposed after scaling to tE and normalizing the sig-nal intensity to unity at the absolute maximum.
Gygax et al.
Vol. 10, No. 7/July 1993/J. Opt. Soc. Am. B 1155
Ad 0.6-
C
W. 0.4a.
~~0.2 -3 -2 ~tE[nskV cm1] 1 2 /0.0 -
I , , I . . . . . . I . .
-4 33 2 -0240
2~~~~~~/1
-4 -2 0 2 4t E [ns kV cm-']
(b)Fig. 7. (a) Electric field dependence of the intensity of PASPE in chlorin/PVB film with a time delay of t =390 ps measured at 1.9 K(bold, solid curve) and two theoretically calculated curves without (dashed curve, 1) and with (solid curve, 2) taking into account the in-duced dipole moment (see text). The right part of the figure is plotted on an expanded scale (expansion factor, 5). (b) The same data in(a) presented on an intensity logarithm scale.
RESULTS AND DISCUSSION
We perform two types of experiment with our setup. Inone case we study the time-integrated intensity of thePASPE depending on the Stark field and on the delay be-tween the writing reference and object pulse. In the sec-ond experiment we record a hologram of an object pulsecomprising a train of picosecond pulses and study the ef-fect of the applied electric field on the time profile of thePASPE signal.
Our first experiment is to record a trivial time-domainhologram by illuminating the sample with the two writingbeams of equal intensity and with the time profile of thepulses corresponding exactly to the output pulses of thedye laser. During exposure, we keep the time delay be-tween the object and the reference beam constant. Afterexposure is complete, we block the beam that was delayed
and illuminate the sample with only the attenuated beamof the shorter path length. The PASPE signal observedbehind the sample is diffracting from the hologram in thedirection of the blocked beam. We use a conventionalphotomultiplier and photon-counting system to detect theintensity of the PASPE signal depending on the voltageapplied to the electrodes of the Stark cell. We make sev-eral exposures with different values of the time delay be-tween the writing pulses in an interval of 0-600 ps. Thedifferent exposures are made at different spatial locationsby moving the illuminated spot across the sample or byvarying slightly (1 nm) the wavelength in order to find avirgin spectral interval of the inhomogeneous absorptionband.
Figure 6 shows the experimentally measured PASPE in-tensities as a function of the parameter tIEI. All tracesfollow basically the same profile, proving our theoretical
Gygax et al.
1156 J. Opt. Soc. Am. B/Vol. 10, No. 7/July 1993
conclusion that in the case of a linear Stark effect the in-fluences of time delay and the electric field strength arereciprocal to each other.
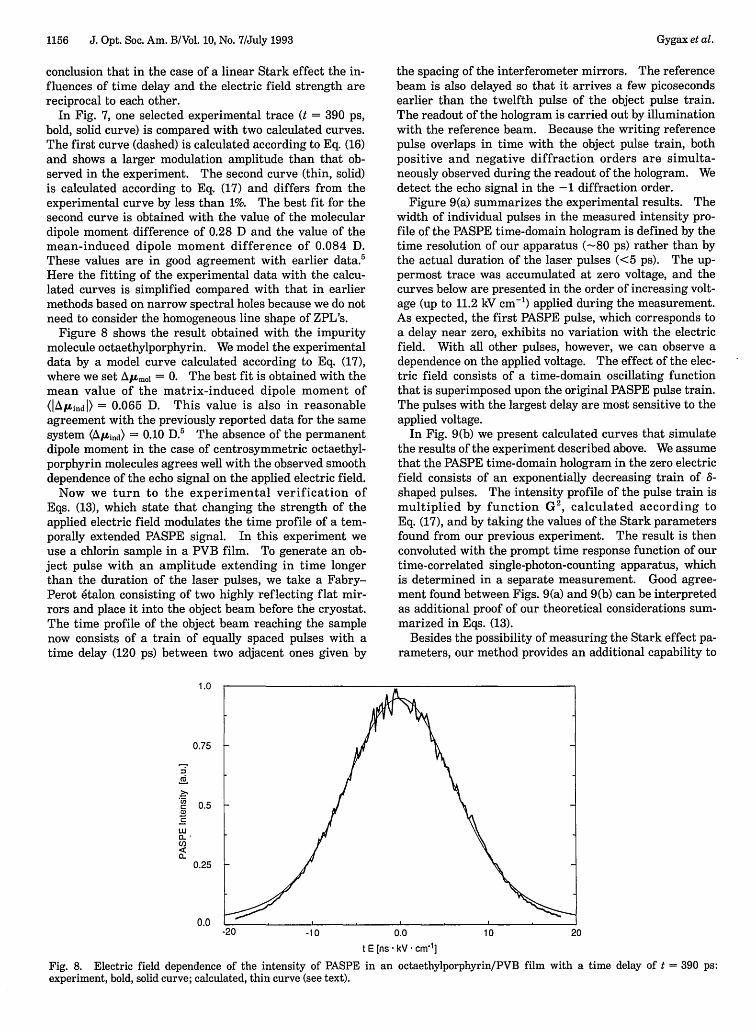
In Fig. 7, one selected experimental trace (t = 390 ps,bold, solid curve) is compared with two calculated curves.The first curve (dashed) is calculated according to Eq. (16)and shows a larger modulation amplitude than that ob-served in the experiment. The second curve (thin, solid)is calculated according to Eq. (17) and differs from theexperimental curve by less than 1%. The best fit for thesecond curve is obtained with the value of the moleculardipole moment difference of 0.28 D and the value of themean-induced dipole moment difference of 0.084 D.These values are in good agreement with earlier data.5
Here the fitting of the experimental data with the calcu-lated curves is simplified compared with that in earliermethods based on narrow spectral holes because we do notneed to consider the homogeneous line shape of ZPL's.
Figure 8 shows the result obtained with the impuritymolecule octaethylporphyrin. We model the experimentaldata by a model curve calculated according to Eq. (17),where we set AILmol = 0. The best fit is obtained with themean value of the matrix-induced dipole moment of(IA/Lindl) = 0.065 D. This value is also in reasonableagreement with the previously reported data for the samesystem (lind) = 0.10 D.5 The absence of the permanentdipole moment in the case of centrosymmetric octaethyl-porphyrin molecules agrees well with the observed smoothdependence of the echo signal on the applied electric field.
Now we turn to the experimental verification ofEqs. (13), which state that changing the strength of theapplied electric field modulates the time profile of a tem-porally extended PASPE signal. In this experiment weuse a chlorin sample in a PVB film. To generate an ob-ject pulse with an amplitude extending in time longerthan the duration of the laser pulses, we take a Fabry-Perot talon consisting of two highly reflecting flat mir-rors and place it into the object beam before the cryostat.The time profile of the object beam reaching the samplenow consists of a train of equally spaced pulses with atime delay (120 ps) between two adjacent ones given by
the spacing of the interferometer mirrors. The referencebeam is also delayed so that it arrives a few picosecondsearlier than the twelfth pulse of the object pulse train.The readout of the hologram is carried out by illuminationwith the reference beam. Because the writing referencepulse overlaps in time with the object pulse train, bothpositive and negative diffraction orders are simulta-neously observed during the readout of the hologram. Wedetect the echo signal in the -1 diffraction order.
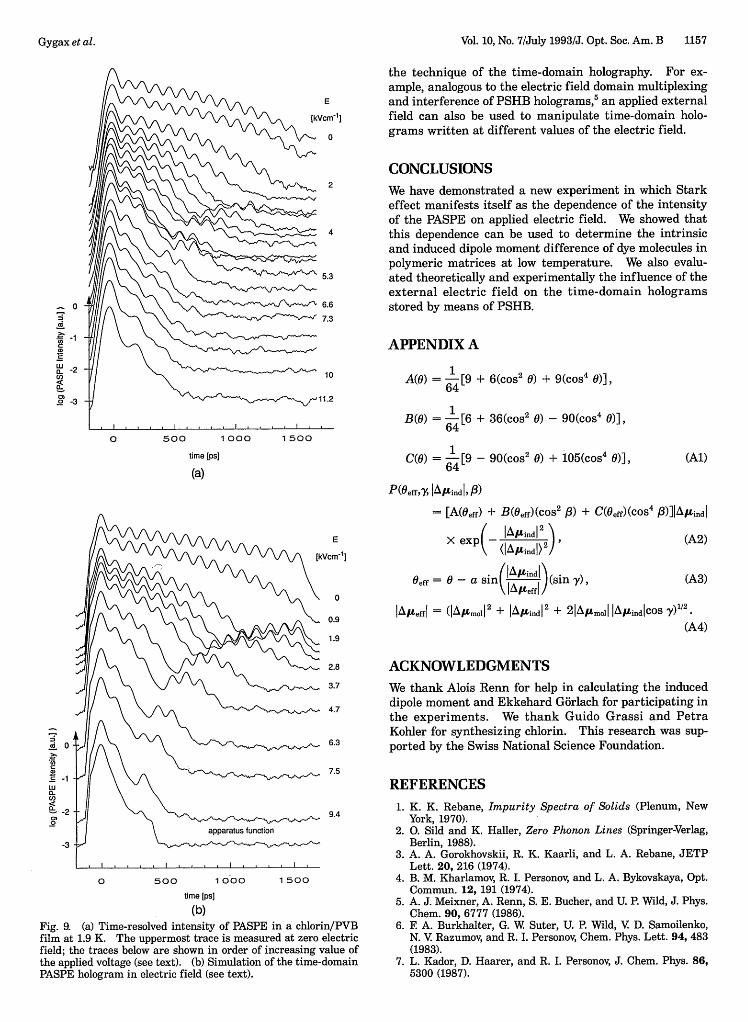
Figure 9(a) summarizes the experimental results. Thewidth of individual pulses in the measured intensity pro-file of the PASPE time-domain hologram is defined by thetime resolution of our apparatus (80 ps) rather than bythe actual duration of the laser pulses (<5 ps). The up-permost trace was accumulated at zero voltage, and thecurves below are presented in the order of increasing volt-age (up to 11.2 kV cm-') applied during the measurement.As expected, the first PASPE pulse, which corresponds toa delay near zero, exhibits no variation with the electricfield. With all other pulses, however, we can observe adependence on the applied voltage. The effect of the elec-tric field consists of a time-domain oscillating functionthat is superimposed upon the original PASPE pulse train.The pulses with the largest delay are most sensitive to theapplied voltage.
In Fig. 9(b) we present calculated curves that simulatethe results of the experiment described above. We assumethat the PASPE time-domain hologram in the zero electricfield consists of an exponentially decreasing train of 6-shaped pulses. The intensity profile of the pulse train ismultiplied by function G2, calculated according toEq. (17), and by taking the values of the Stark parametersfound from our previous experiment. The result is thenconvoluted with the prompt time response function of ourtime-correlated single-photon-counting apparatus, whichis determined in a separate measurement. Good agree-ment found between Figs. 9(a) and 9(b) can be interpretedas additional proof of our theoretical considerations sum-marized in Eqs. (13).
Besides the possibility of measuring the Stark effect pa-rameters, our method provides an additional capability to
1.0
0.75
.F_c
C
C
wa-
ILa-
0.5
0.25
0.0-20 -10 0.0 10 20
t E [ns kV cm-]
Fig. 8. Electric field dependence of the intensity of PASPE in an octaethylporphyrin/PVB film with a time delay of t = 390 ps:experiment, bold, solid curve; calculated, thin curve (see text).
Gygax et al.
Vol. 10, No. 7/July 1993/J. Opt. Soc. Am. B 1157
- ~0
-1
L -2U,
a.
o -3
0 500 1000 1500time [ps]
(a)
the technique of the time-domain holography. For ex-ample, analogous to the electric field domain multiplexingand interference of PSHB holograms,5 an applied externalfield can also be used to manipulate time-domain holo-grams written at different values of the electric field.
CONCLUSIONS
We have demonstrated a new experiment in which Starkeffect manifests itself as the dependence of the intensityof the PASPE on applied electric field. We showed thatthis dependence can be used to determine the intrinsicand induced dipole moment difference of dye molecules inpolymeric matrices at low temperature. We also evalu-ated theoretically and experimentally the influence of theexternal electric field on the time-domain hologramsstored by means of PSHB.
APPENDIX A
1A() = -[9 + 6(cos2 0) + 9(cos4 0)],
64
B(O) = - [6 + 36(cos' 6) - 90(cos' 6)],64
C(o) = -[9 - 90(cos2 ) + 105(cos4 0)],64
P(OeffY, IA/Lindl, ,)
(Al)
= [A(Oeff) + B(Oeff)(c05 2 13) + C(Oeff)(cos 4 P)]IA/,indl
(A2)E
[kVcm']X ex -s(I1 Ai)(si y)X
0'ff = 0 -a sinl ,A Aind(sin ), (A3)
IAILeffI = (IAmoI 2 + JAJtind1 + 2IAmoll IA/LindCos Y) /2 .
(A4)
2.8 ACKNOWLEDGMENTS
3.7 We thank Alois Renn for help in calculating the induced4.7 dipole moment and Ekkehard Gorlach for participating in
the experiments. We thank Guido Grassi and PetraKohler for synthesizing chlorin. This research was sup-
6.3 ported by the Swiss National Science Foundation.
7.5
REFERENCES
9.4
time [ps]
(b)Fig. 9. (a) Time-resolved intensity of PASPE in a chlorin/PVBfilm at 1.9 K. The uppermost trace is measured at zero electricfield; the traces below are shown in order of increasing value ofthe applied voltage (see text). (b) Simulation of the time-domainPASPE hologram in electric field (see text).
1. K. K. Rebane, Impurity Spectra of Solids (Plenum, NewYork, 1970).
2. 0. Sild and K. Haller, Zero Phonon Lines (Springer-Verlag,Berlin, 1988).
3. A. A. Gorokhovskii, R. K. Kaarli, and L. A. Rebane, JETPLett. 20, 216 (1974).
4. B. M. Kharlamov, R. I. Personov, and L. A. Bykovskaya, Opt.Commun. 12,191 (1974).
5. A. J. Meixner, A. Renn, S. E. Bucher, and U. P. Wild, J. Phys.Chem. 90, 6777 (1986).
6. F. A. Burkhalter, G. W Suter, U. P. Wild, V D. Samoilenko,N. V Razumov, and R. I. Personov, Chem. Phys. Lett. 94, 483(1983).
7. L. Kador, D. Haarer, and R. I. Personov, J. Chem. Phys. 86,5300 (1987).
0
0.9
1.9
Ca O,.Id05
.- 1al
.S -1
U)
. -2i2
-3
0 500 1000 1 500
Gygax et al.
1158 J. Opt. Soc. Am. B/Vol. 10, No. 7/July 1993
8. A. Renn, A. J. Meixner, U. P. Wild, and F A. Burkhalter,Chem. Phys. 93, 157 (1985).
9. A. J. Meixner, A. Renn, and U. P. Wild, J. Chem. Phys. 93,6728 (1989).
10. D. A. Wiersma, in Advances in Chemical Physics XLVII,J. Jortner, R. D. Levine, and S. A. Rice, eds. (Wiley, NewYork, 1981), p. 421.
11. A. Rebane, R. Kaarli, P. Saari, A. Anijalg, and K.Timpmann, Opt. Commun. 47, 173 (1983).
12. A. Rebane and D. Haarer, Opt. Commun. 70, 478 (1989).13. A. K. Rebane, R. K. Kaarli, and P. M. Saari, Opt. Spectrosc.
(USSR) 55, 238 (1983).14. V V Samartsev and R. G. Usmanov, Phys. Stat. Solidi 49, 789
(1978).15. T. W Mossberg, R. Kachru, S. R. Hartmann, and A. M.
Flusberg, Phys. Rev. A 20, 1976 (1979).16. W Hesselink and D. A. Weirsma, J. Chem. Phys. 75, 4192
(1981).
17. M. D. Crisp, Phys. Rev. A 1, 1604 (1970).18. P. Saari, R. Kaarli, and A. Rebane, J. Opt. Soc. Am. B 3, 527
(1986).19. A. Rebane and 0. Ollikainen, Opt. Commun. 83, 246 (1991).20. H. Gygax, E. Gbrlach, A. Rebane, and U. P. Wild, J. Lumin.
53, 59 (1992).21. Y P. Wang and R. S. Meltzer, Phys. Rev. B 45, 10119 (1992).22. A. J. Meixner, C. M. Jefferson, and R. M. Macfarlane, Phys.
Rev. B 46, 5912 (1992).23. J. H. Eberly, S. R. Hartmann, and A. Szabo, Phys. Rev. A 23,
2502 (1981).24. P. Saari and A. Rebane, Proc. Estonian Acad. Sci. Phys.
Math. 31, 32 (1984).25. A. Rebane, S. Bernet, A. Renn, and U. P. Wild, Opt. Commun.
86, 7 (1991).26. U. P. Wild, A. R. Holzwarth, and H. P. Good, Rev. Sci. In-
strum. 48, 1621 (1977).
Gygax et al.


![Dye-doped cholesteric-liquid-crystal room-temperature ...stroud/publications/lukishova041.pdf · terrylene absorber to the next [40]. Pumped by periodic short-pulse laser radia-tion](https://img.pdfslide.us/doc/110x75/5e9c003eb00e062f5b743272/dye-doped-cholesteric-liquid-crystal-room-temperature-stroudpublicationslukishova041pdf.jpg)