Embed Size (px)
Citation preview
© Starcomms Ltd., 2006
Case Study - launching EVDO in Emerging Markets
Presented by : Paul Edwards Chairman Starcomms Nigeria
March, 2008
© Starcomms Ltd., 2006 Slide 2, Hong Kong 2006, Paul Edwards
Introduction
• Starcomms started with a 10 year Private Telecom Operator (“PTO”) license in 1996, operating a small CDMA IS95 network with 10,000 sub capacity in Lagos
• In 2002, it launched a CDMA2000 1X network (1900MHz) in Lagos and expanded into Kano and Maiduguri in 2003 providing fixed wireless services
• In 2005 2 large international private equity concerns, Actis and EMP, acquired a 50% stake in Starcomms
• In October 2005 it launched a mobile service with in-state roaming capability
© Starcomms Ltd., 2006 Slide 3, Hong Kong 2006, Paul Edwards
Introduction
• In 2006, Starcomms was awarded a 10 year national Unified License, removing any constraints on the type of services provided (fixed or mobile, CDMA or GSM)
• Starcomms is now the 4th largest, full service national telecom operator with service in 11 states/12 cities, with plans to expand to a further 18 states/31 cities by the end of the year
• It offers local, long-distance and international voice telephony services, mobile and internet access services, on a national or local basis
• It recently surpassed the 1million gross subscribers mark, having grown by over 137% over the past year, and has recorded EBITDA growth of over 175% compounded over the past 3 years
© Starcomms Ltd., 2006 Slide 4, Hong Kong 2006, Paul Edwards
Roll-out Plan
Eket &Ikotekpene
Maiduguri
Satellite Link
Fiber Optic
MicrowaveOwerri
Existing Network
2006
2007
2008
Switch
Calabar
Benin
Zaria
Kaduna
Port Harcourt
Warri
Ondo
Uyo
Rano
Ogbomosho
Ijebu-odeShagamu
Lagos
Abeokuta
Ibadan
Minna
Aba
Orlu &Okigwe
Umuahia
Nnewi Abakaliki
DamaturuWudil
Illorin
Oyo
Jos
Bauchi
Sapeli
Bonny &Oyigbo
Kuje
Ife
AwkaAsaba &Onitsha
Oshogbo
Akure
Oji
Enugu
Keffi,Nasarawa
& Lafia
Kano
Gwagwalada
Abuja
Kabba
Lokoja
Katsina
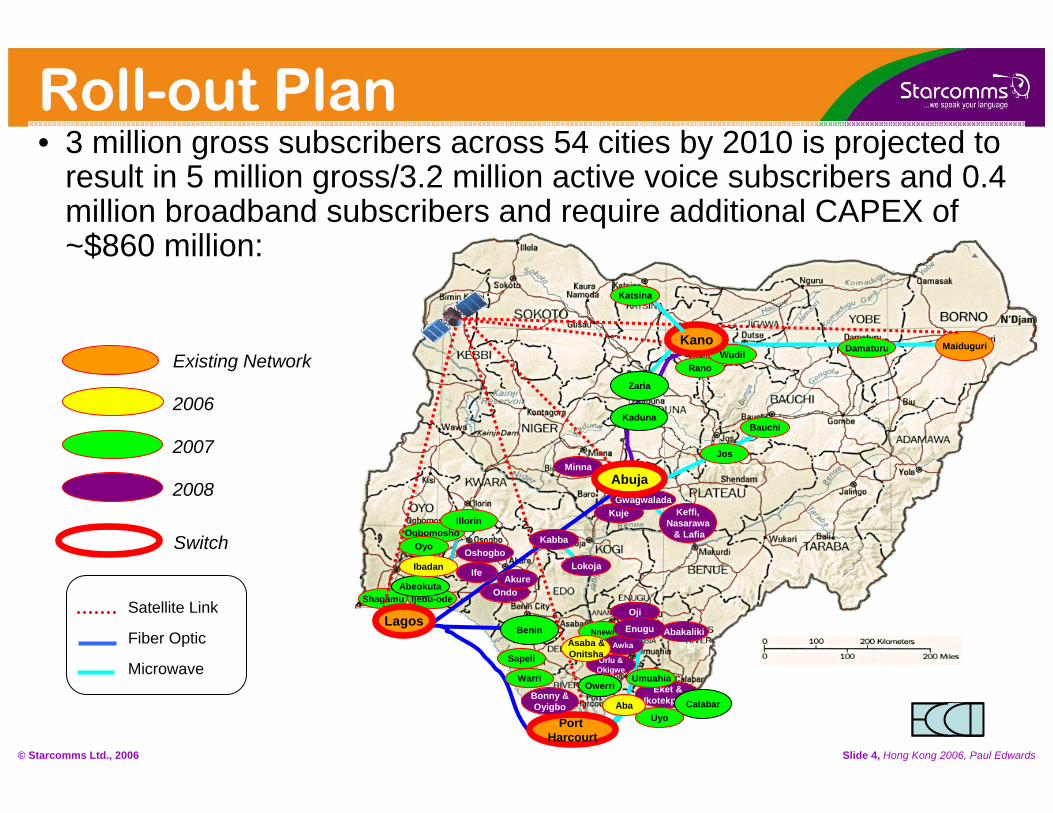
• 3 million gross subscribers across 54 cities by 2010 is projected to result in 5 million gross/3.2 million active voice subscribers and 0.4 million broadband subscribers and require additional CAPEX of ~$860 million:
© Starcomms Ltd., 2006 Slide 5, Hong Kong 2006, Paul Edwards
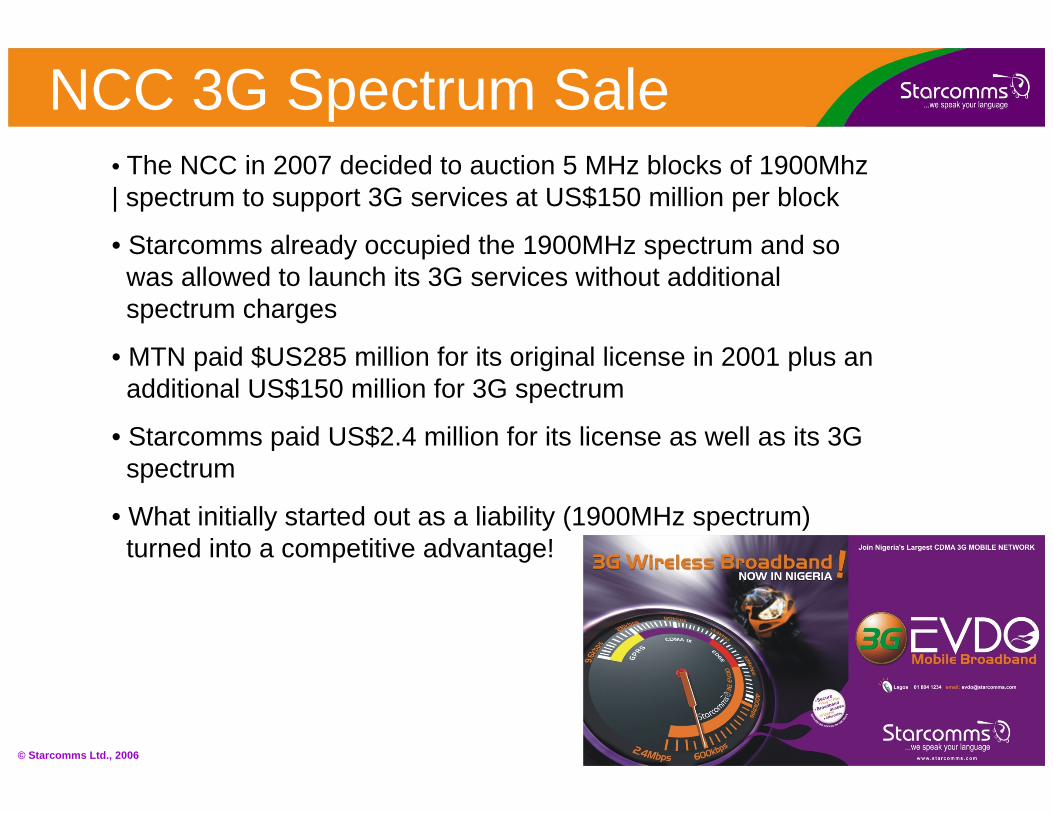
NCC 3G Spectrum Sale• The NCC in 2007 decided to auction 5 MHz blocks of 1900Mhz | spectrum to support 3G services at US$150 million per block
• Starcomms already occupied the 1900MHz spectrum and sowas allowed to launch its 3G services without additional spectrum charges
• MTN paid $US285 million for its original license in 2001 plus anadditional US$150 million for 3G spectrum
• Starcomms paid US$2.4 million for its license as well as its 3Gspectrum
• What initially started out as a liability (1900MHz spectrum)turned into a competitive advantage!
© Starcomms Ltd., 2006 Slide 6, Hong Kong 2006, Paul Edwards
Leading in 3G Broadband
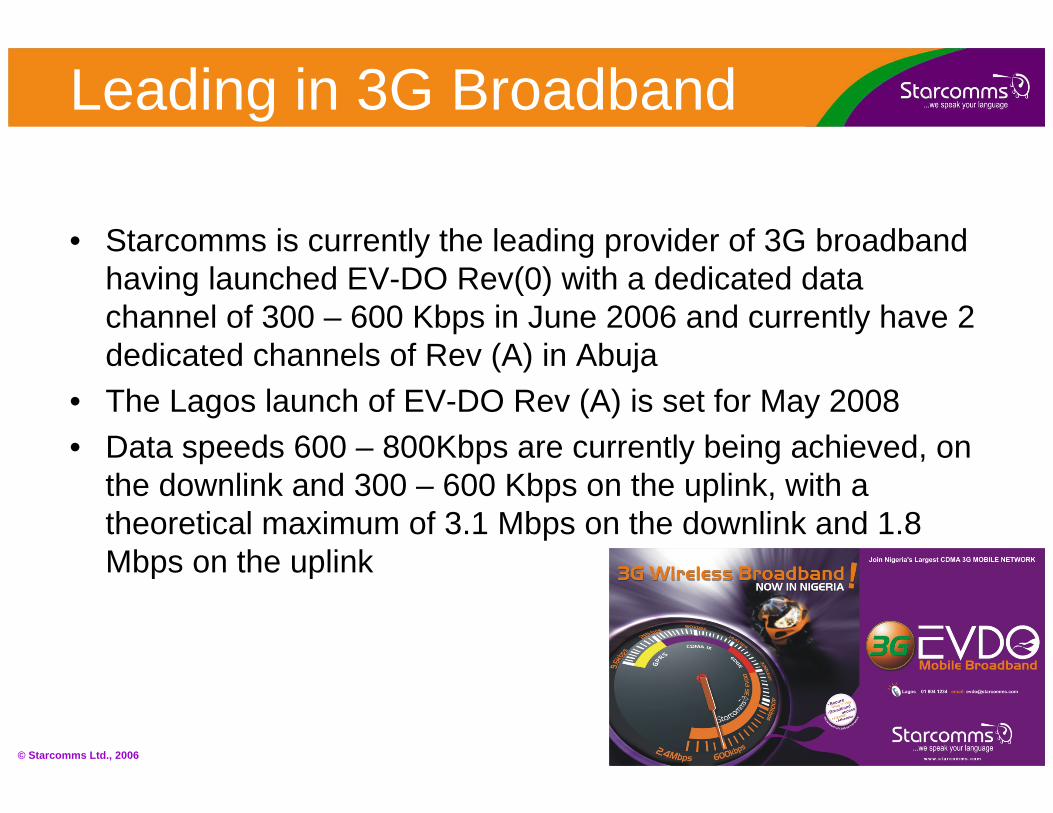
• Starcomms is currently the leading provider of 3G broadband having launched EV-DO Rev(0) with a dedicated data channel of 300 – 600 Kbps in June 2006 and currently have 2 dedicated channels of Rev (A) in Abuja
• The Lagos launch of EV-DO Rev (A) is set for May 2008• Data speeds 600 – 800Kbps are currently being achieved, on
the downlink and 300 – 600 Kbps on the uplink, with a theoretical maximum of 3.1 Mbps on the downlink and 1.8 Mbps on the uplink
© Starcomms Ltd., 2006 Slide 7, Hong Kong 2006, Paul Edwards
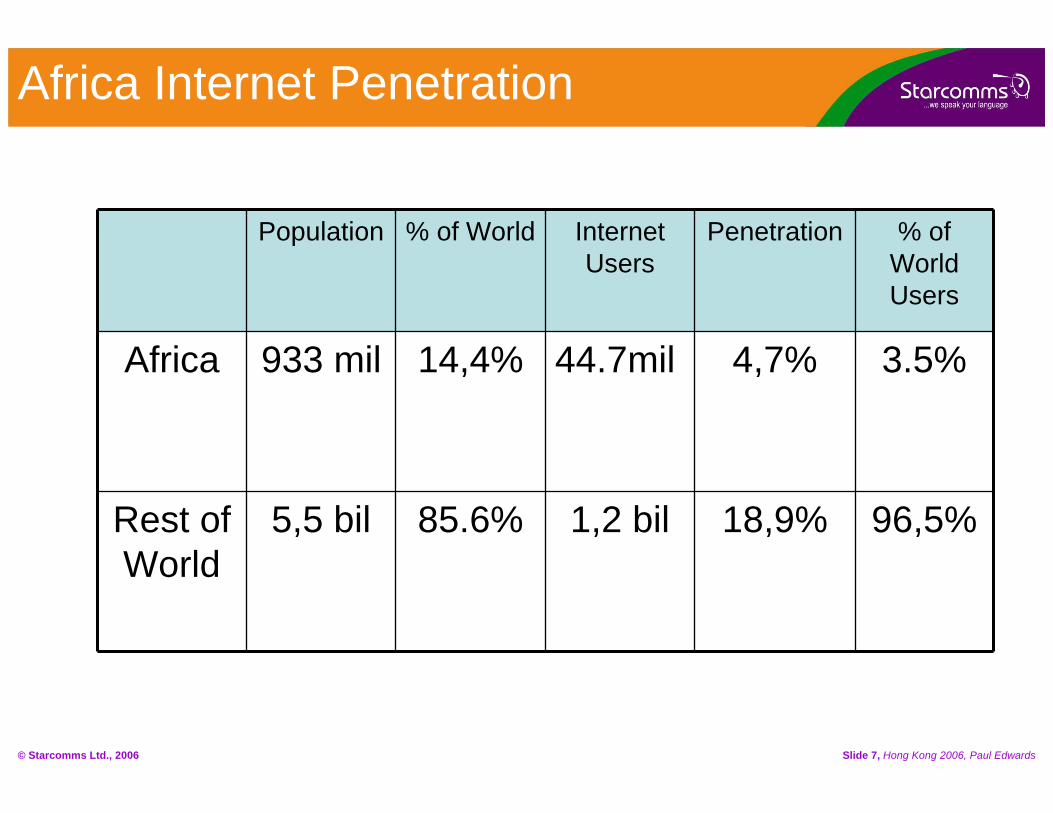
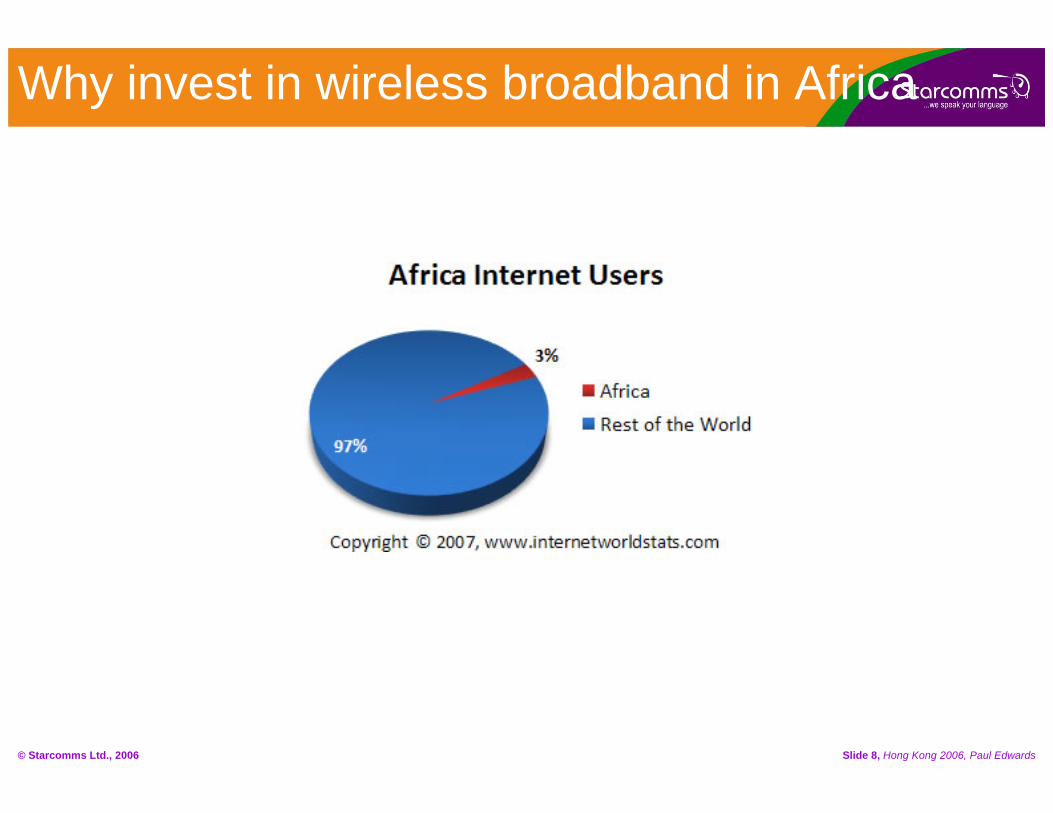
Population % of World Internet Users
Penetration % of World Users
Africa 933 mil 14,4% 44.7mil 4,7% 3.5%
Rest of World
5,5 bil 85.6% 1,2 bil 18,9% 96,5%
Africa Internet Penetration
© Starcomms Ltd., 2006 Slide 8, Hong Kong 2006, Paul Edwards
Why invest in wireless broadband in Africa
© Starcomms Ltd., 2006 Slide 9, Hong Kong 2006, Paul Edwards
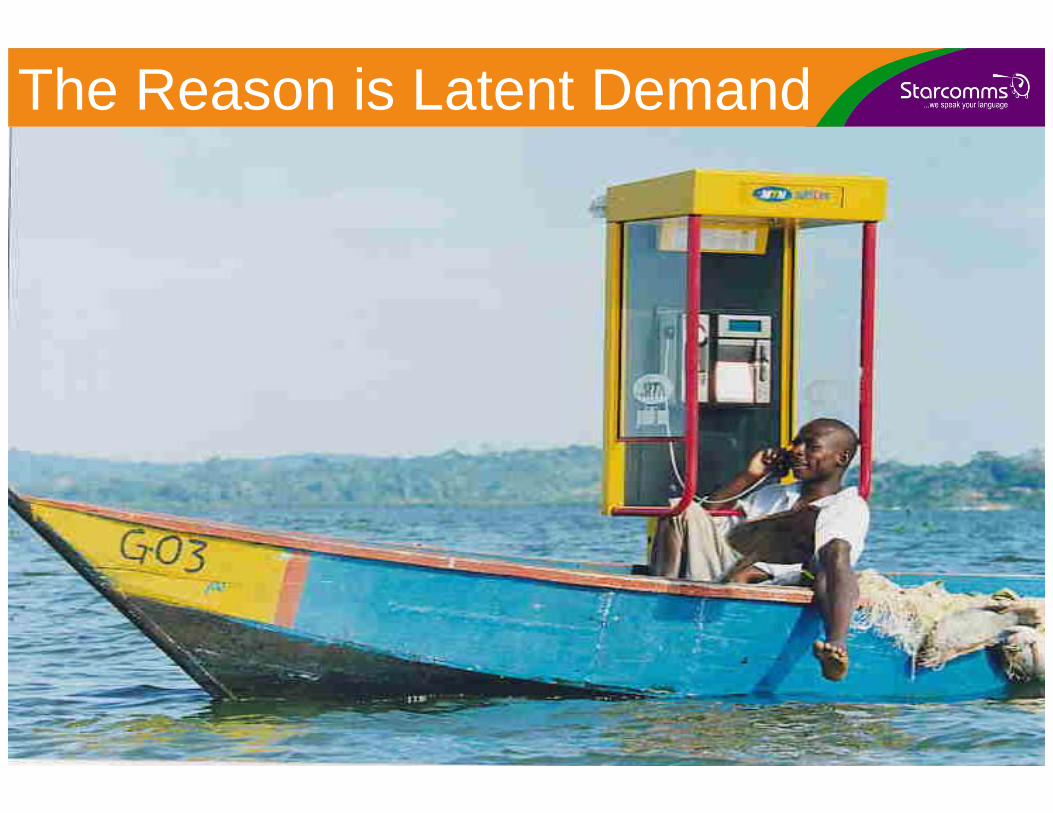
The Reason is Latent Demand
© Starcomms Ltd., 2006 Slide 10, Hong Kong 2006, Paul Edwards
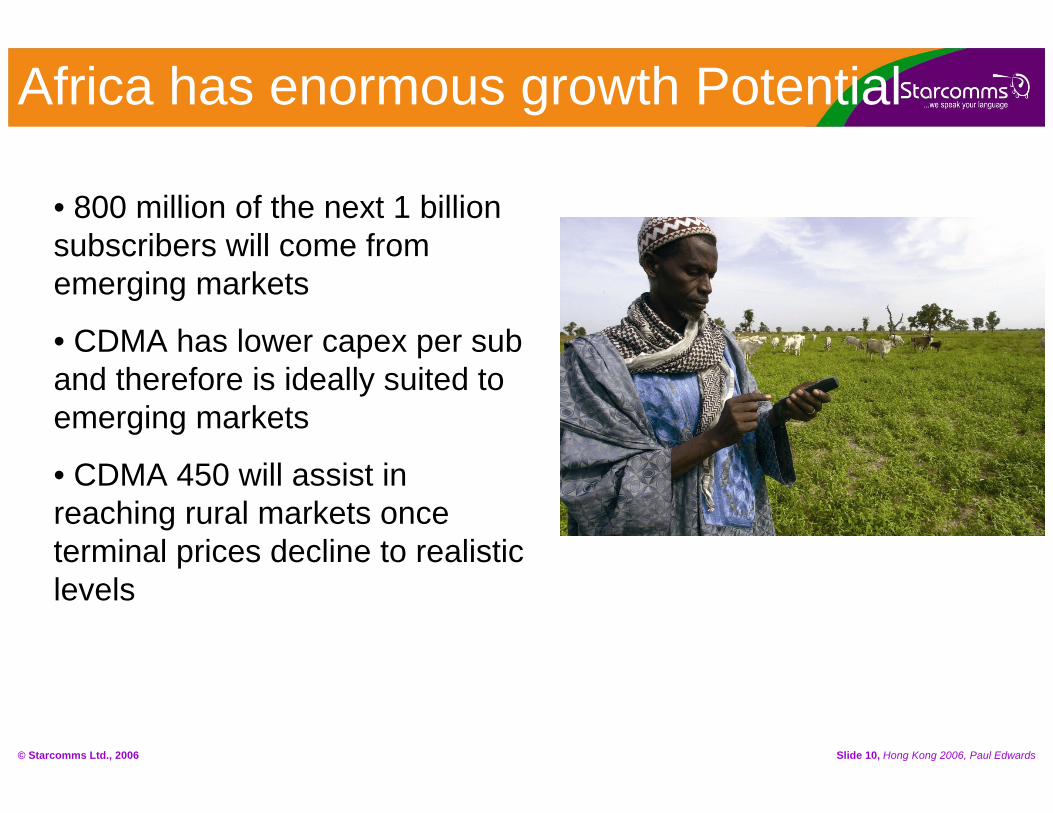
Africa has enormous growth Potential
• 800 million of the next 1 billion subscribers will come from emerging markets
• CDMA has lower capex per sub and therefore is ideally suited to emerging markets
• CDMA 450 will assist in reaching rural markets once terminal prices decline to realistic levels
© Starcomms Ltd., 2006 Slide 11, Hong Kong 2006, Paul Edwards
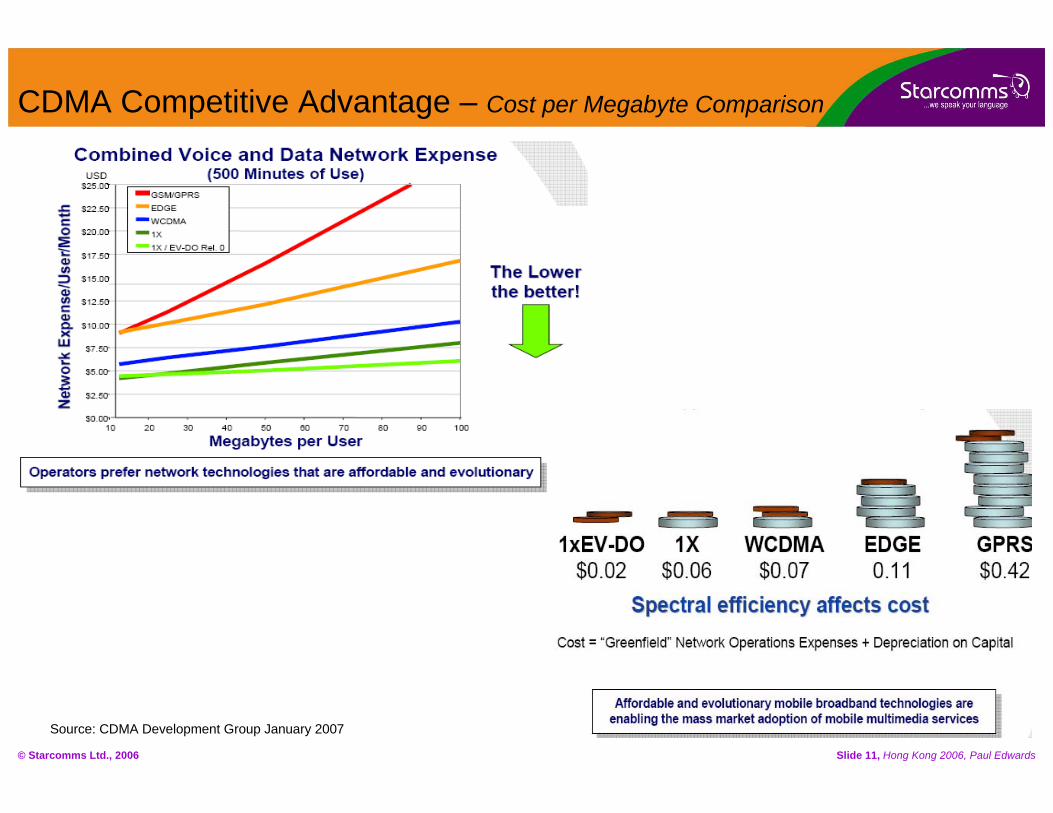
CDMA Competitive Advantage – Cost per Megabyte Comparison
Source: CDMA Development Group January 2007
© Starcomms Ltd., 2006 Slide 12, Hong Kong 2006, Paul Edwards
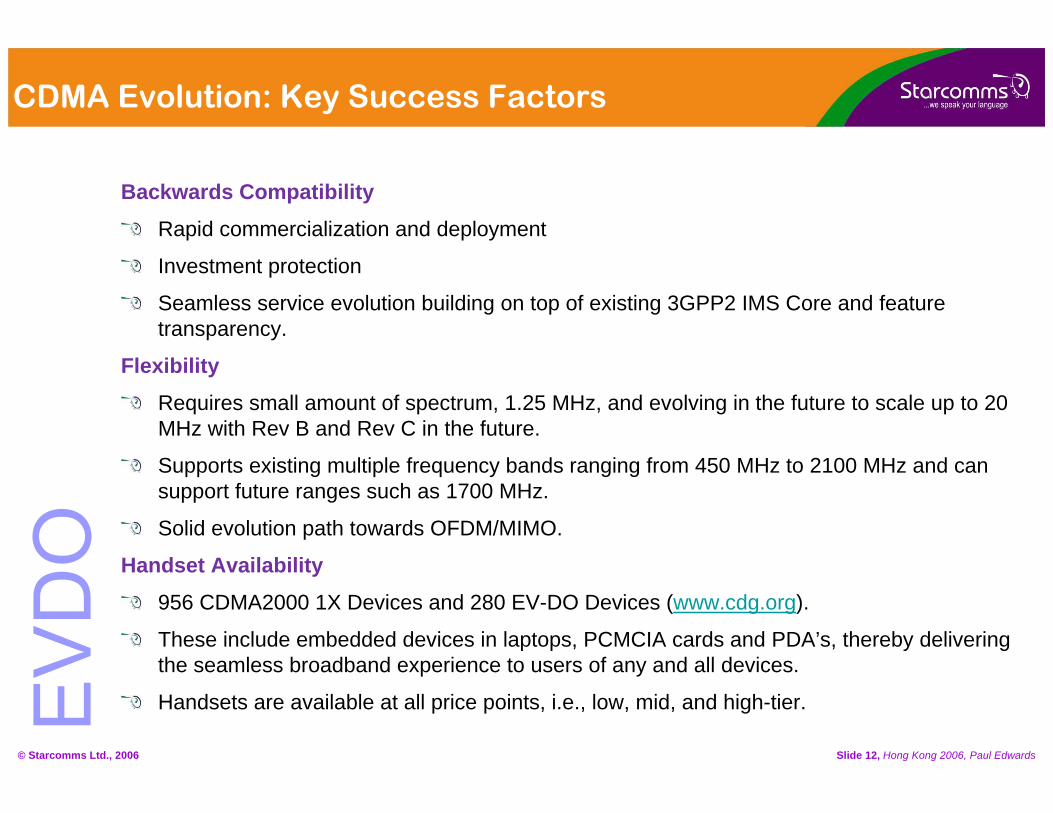
CDMA Evolution: Key Success Factors
Backwards Compatibility
Rapid commercialization and deployment
Investment protection
Seamless service evolution building on top of existing 3GPP2 IMS Core and feature transparency.
Flexibility
Requires small amount of spectrum, 1.25 MHz, and evolving in the future to scale up to 20 MHz with Rev B and Rev C in the future.
Supports existing multiple frequency bands ranging from 450 MHz to 2100 MHz and can support future ranges such as 1700 MHz.
Solid evolution path towards OFDM/MIMO.
Handset Availability
956 CDMA2000 1X Devices and 280 EV-DO Devices (www.cdg.org).
These include embedded devices in laptops, PCMCIA cards and PDA’s, thereby delivering the seamless broadband experience to users of any and all devices.
Handsets are available at all price points, i.e., low, mid, and high-tier.
© Starcomms Ltd., 2006 Slide 13, Hong Kong 2006, Paul Edwards
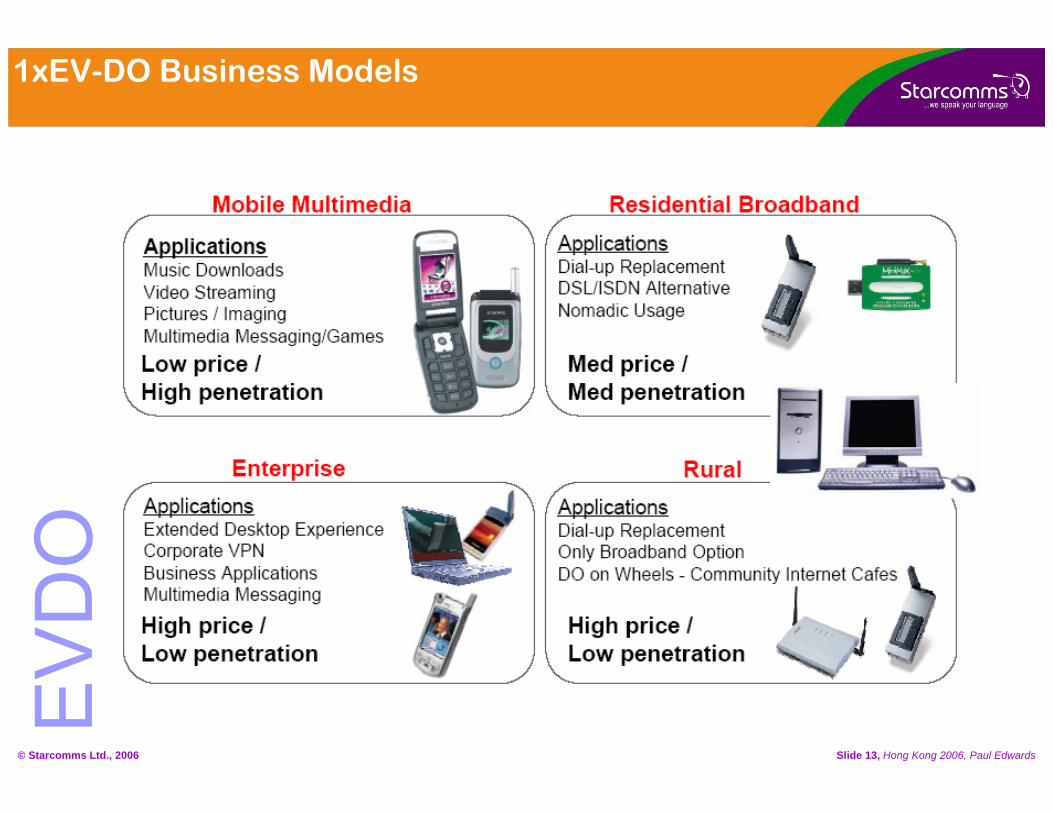
1xEV-DO Business Models
© Starcomms Ltd., 2006 Slide 14, Hong Kong 2006, Paul Edwards
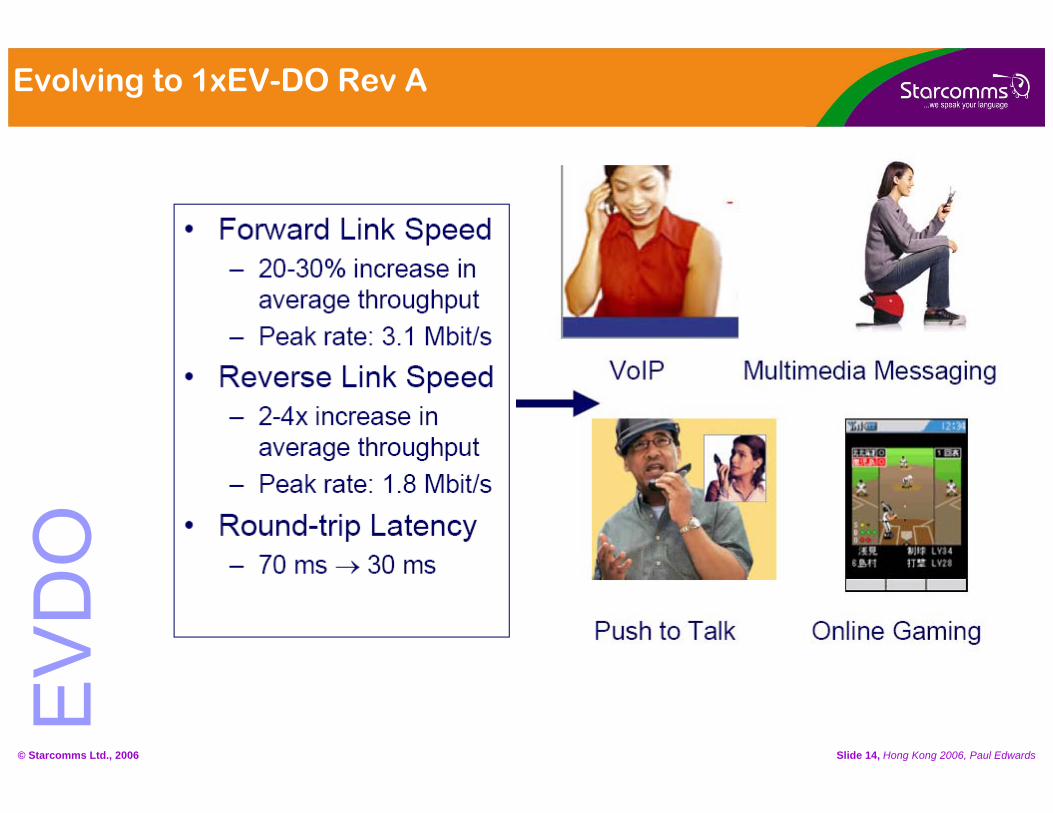
Evolving to 1xEV-DO Rev A
© Starcomms Ltd., 2006 Slide 15, Hong Kong 2006, Paul Edwards
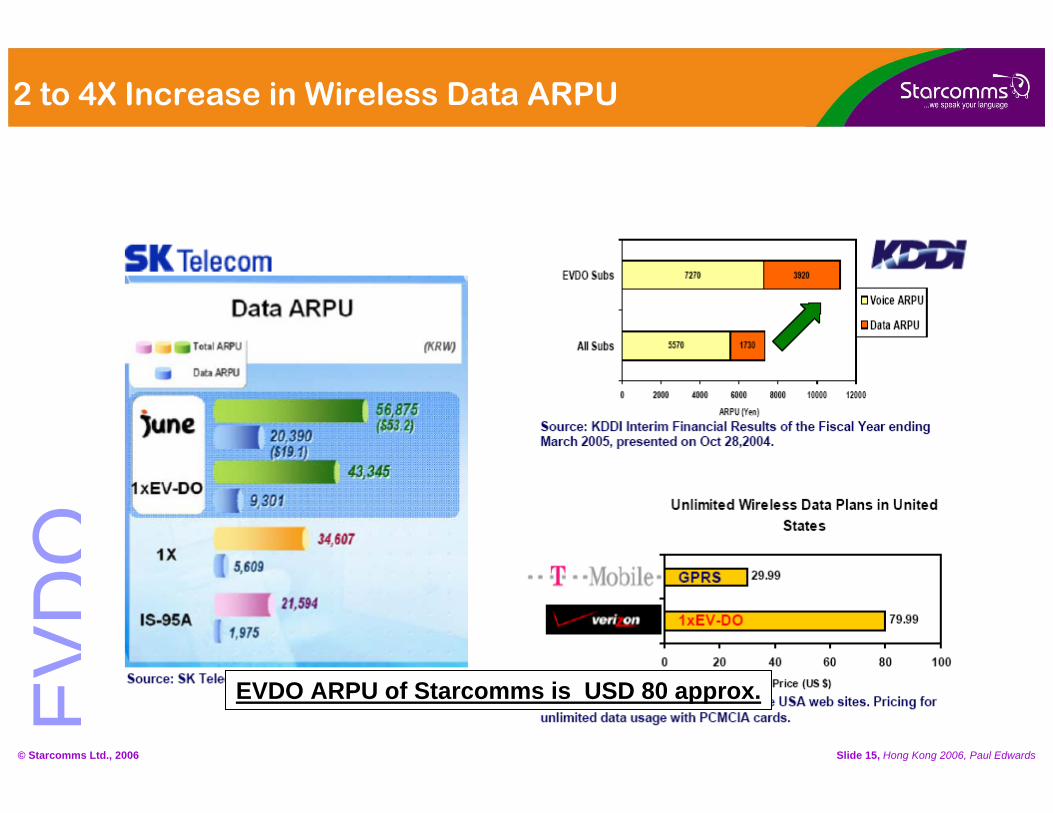
2 to 4X Increase in Wireless Data ARPU
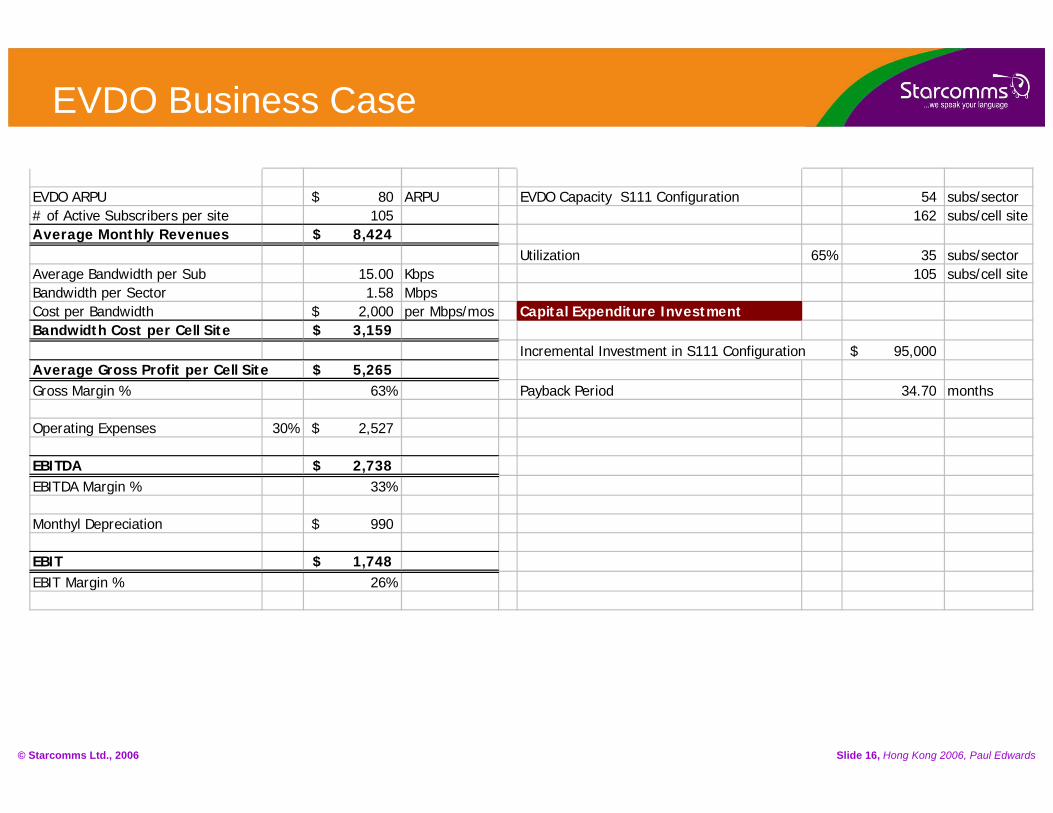
EVDO ARPU of Starcomms is USD 80 approx.
© Starcomms Ltd., 2006 Slide 16, Hong Kong 2006, Paul Edwards
EVDO ARPU 80$ ARPU EVDO Capacity S111 Configuration 54 subs/sector# of Active Subscribers per site 105 162 subs/cell siteAverage Monthly Revenues 8,424$
Utilization 65% 35 subs/sectorAverage Bandwidth per Sub 15.00 Kbps 105 subs/cell siteBandwidth per Sector 1.58 MbpsCost per Bandwidth 2,000$ per Mbps/mos Capital Expenditure InvestmentBandwidth Cost per Cell Site 3,159$
Incremental Investment in S111 Configuration 95,000$ Average Gross Profit per Cell Site 5,265$ Gross Margin % 63% Payback Period 34.70 months
Operating Expenses 30% 2,527$
EBITDA 2,738$ EBITDA Margin % 33%
Monthyl Depreciation 990$
EBIT 1,748$ EBIT Margin % 26%
EVDO Business Case
© Starcomms Ltd., 2006 Slide 17, Hong Kong 2006, Paul Edwards
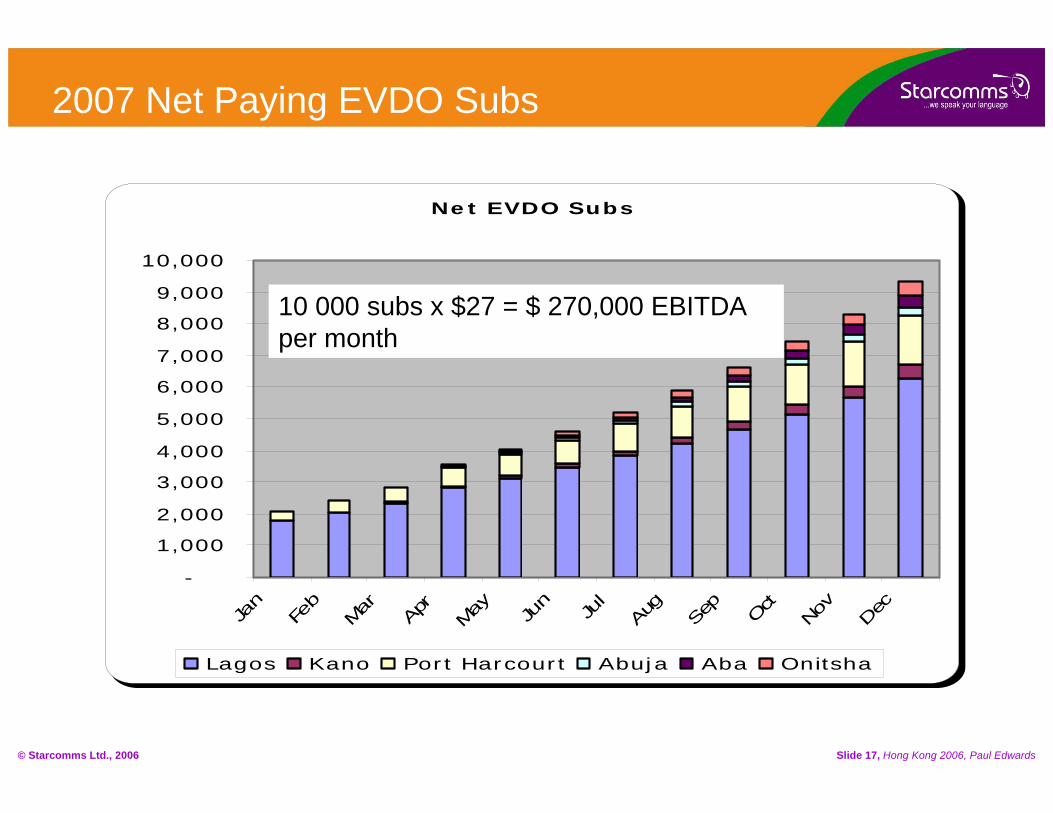
Net EVDO Subs
-
1,000
2,000
3,000
4,000
5,000
6,000
7,000
8,000
9,000
10,000
Jan
Feb
Mar Apr
May Ju
n
Jul
Aug
Sep
Oct
Nov
Dec
Lagos Kano Port Harcourt Abuja Aba Onitsha
2007 Net Paying EVDO Subs
10 000 subs x $27 = $ 270,000 EBITDA per month
© Starcomms Ltd., 2006 Slide 18, Hong Kong 2006, Paul Edwards
Thank You.
Starcomms Ltd. Contact:Telephone: +234 1 8041234Web: www.starcomms.com
Address:1261C, Bishop Kale Close,Off. Saka Tinubu Street,Victoria Island, Lagos, Nigeria.