Embed Size (px)
Citation preview
STAR REEFERS INCSTAR REEFERS INC
STRATEGY AND ACTION PLANS REVISITED
STRONGER SERVICES AND EARNINGS RECOVERY
OSLO 4 NOVEMBER 2003
STAR Reefers AS, as managers for STAR Reefers Inc Rådhusgaten 23, N-0158 Oslo, Norway
slide no. 2
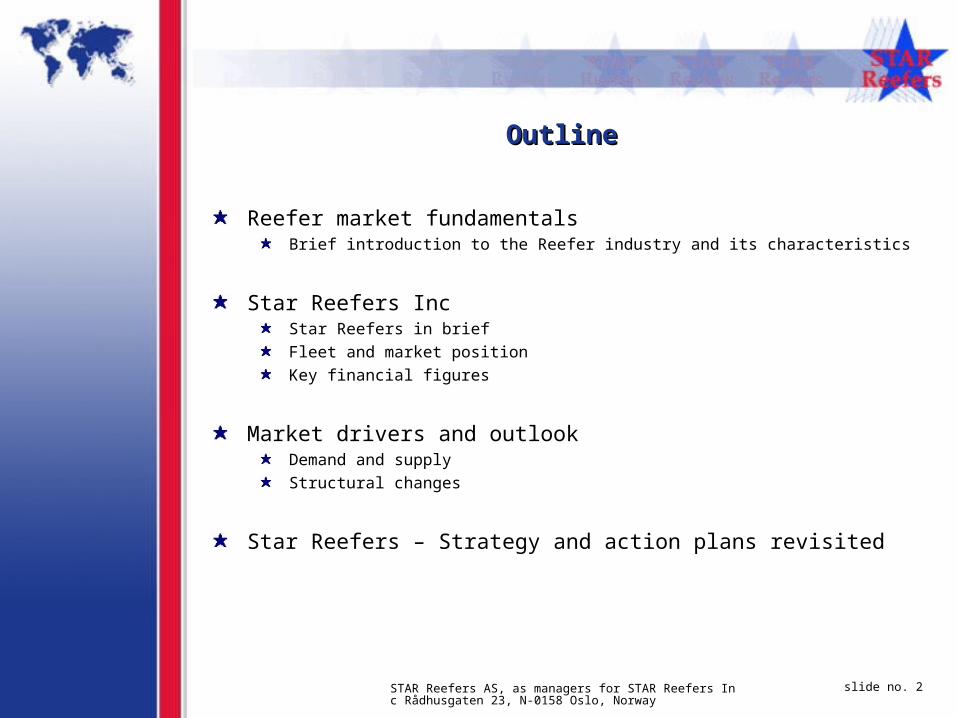
OutlineOutline
Reefer market fundamentals Brief introduction to the Reefer industry and its characteristics
Star Reefers IncStar Reefers in brief
Fleet and market position
Key financial figures
Market drivers and outlookDemand and supply
Structural changes
Star Reefers – Strategy and action plans revisited
1.1. Reefer market fundamentalsReefer market fundamentals
STAR Reefers AS, as managers for STAR Reefers Inc Rådhusgaten 23, N-0158 Oslo, Norway
slide no. 4
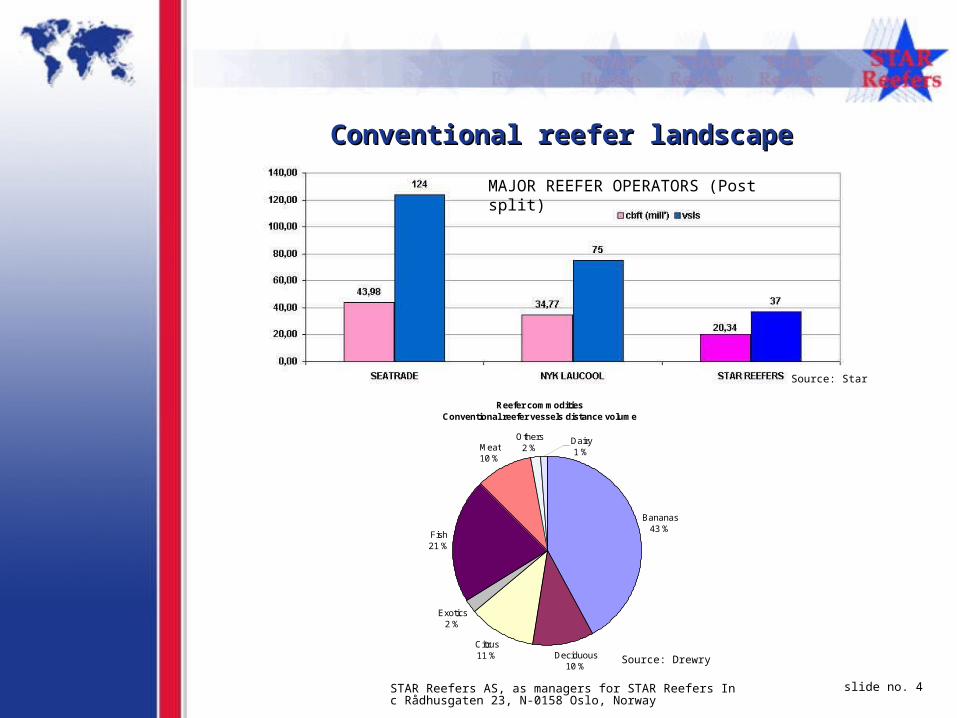
Conventional reefer landscapeConventional reefer landscape
MAJOR REEFER OPERATORS (Post split)
Source: Drewry
Source: Star
Reefer commodities Conventional reefer vessels distance volume
Bananas43 %
Deciduous10 %
Citrus11 %
Exotics2 %
Fish21 %
Meat10 %
Others2 %
Dairy1 %
STAR Reefers AS, as managers for STAR Reefers Inc Rådhusgaten 23, N-0158 Oslo, Norway
slide no. 5
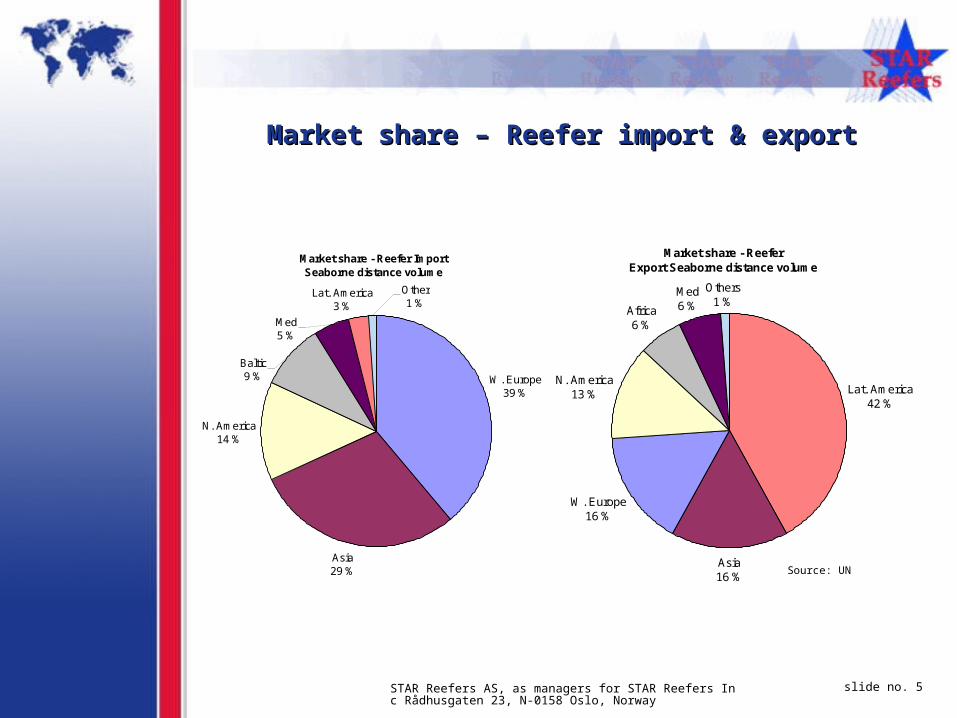
Market share – Reefer import & exportMarket share – Reefer import & export
Market share - Reefer Import Seaborne distance volume
W. Europe39 %
Asia29 %
N. America14 %
Lat. America3 %
Med5 %
Baltic9 %
Other1 %
Market share - Reefer Export Seaborne distance volume
Lat. America42 %
Asia16 %
W. Europe16 %
N. America13 %
Africa6 %
Med6 %
Others1 %
Source: UN
STAR Reefers AS, as managers for STAR Reefers Inc Rådhusgaten 23, N-0158 Oslo, Norway
slide no. 6
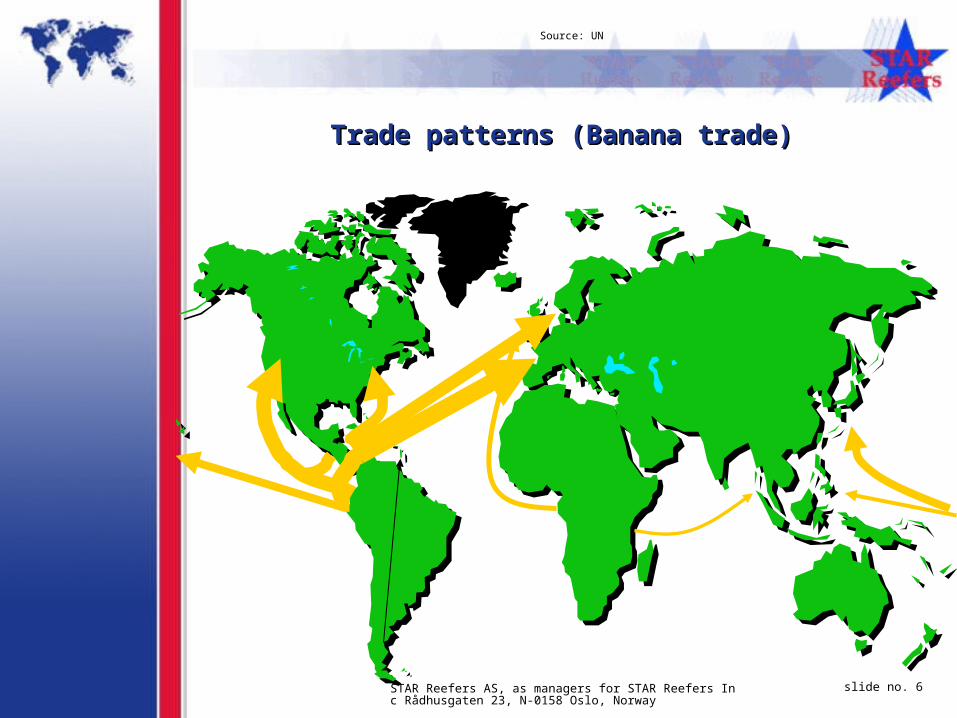
Trade patterns (Banana trade)Trade patterns (Banana trade)
Source: UN
2.2. Star Reefers IncStar Reefers Inc
STAR Reefers AS, as managers for STAR Reefers Inc Rådhusgaten 23, N-0158 Oslo, Norway
slide no. 8
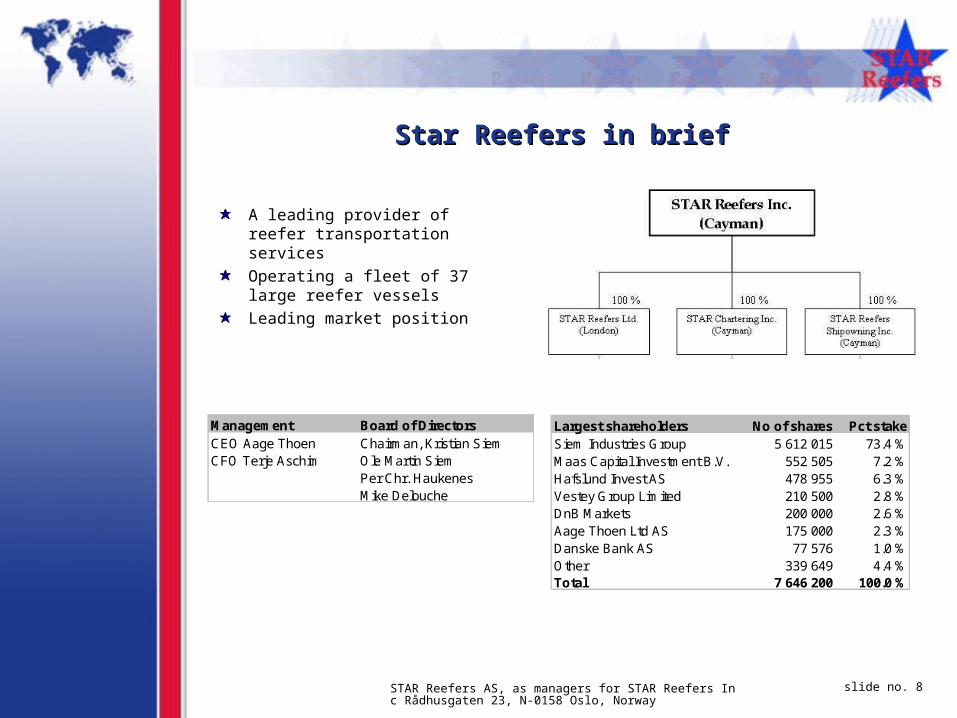
Star Reefers in briefStar Reefers in brief
A leading provider of reefer transportation services
Operating a fleet of 37 large reefer vessels
Leading market position
Largest shareholders No of shares Pct stakeSiem Industries Group 5 612 015 73.4 %Maas Capital Investment B.V. 552 505 7.2 %Hafslund Invest AS 478 955 6.3 %Vestey Group Limited 210 500 2.8 %DnB Markets 200 000 2.6 %Aage Thoen Ltd AS 175 000 2.3 %Danske Bank AS 77 576 1.0 %Other 339 649 4.4 %Total 7 646 200 100.0 %
Management Board of DirectorsCEO Aage Thoen Chairman, Kristian SiemCFO Terje Aschim Ole Martin Siem
Per Chr. HaukenesMike Delouche
STAR Reefers AS, as managers for STAR Reefers Inc Rådhusgaten 23, N-0158 Oslo, Norway
slide no. 9
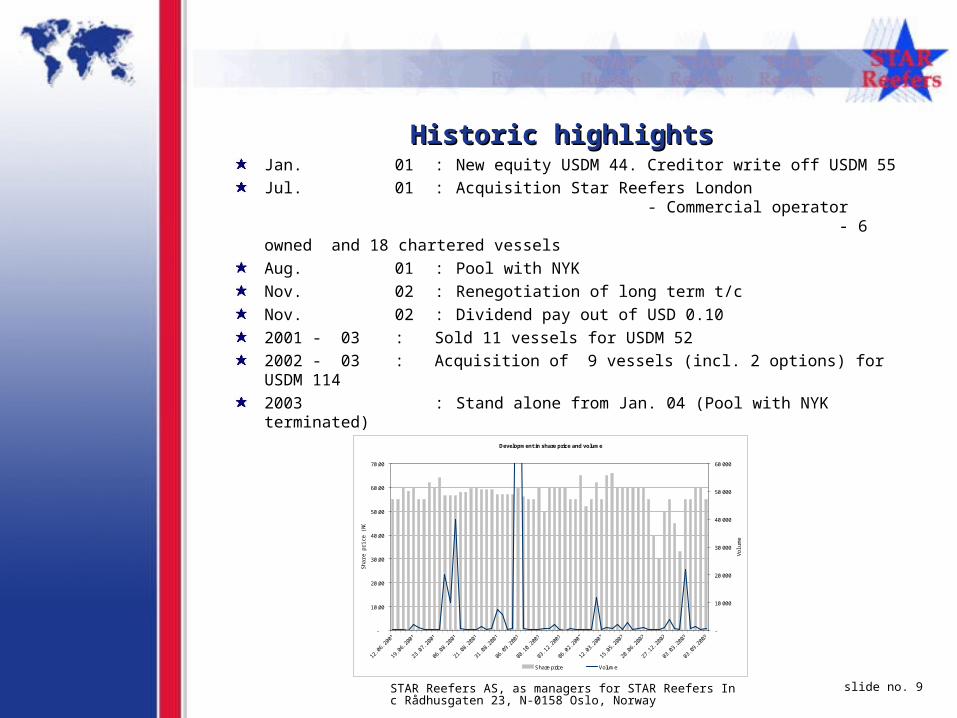
Historic highlightsHistoric highlightsJan. 01 : New equity USDM 44. Creditor write off USDM 55
Jul. 01 : Acquisition Star Reefers London- Commercial operator
- 6 owned and 18 chartered vessels
Aug. 01 : Pool with NYK
Nov. 02 : Renegotiation of long term t/c
Nov. 02 : Dividend pay out of USD 0.10
2001 - 03 : Sold 11 vessels for USDM 52
2002 - 03 : Acquisition of 9 vessels (incl. 2 options) for USDM 114
2003 : Stand alone from Jan. 04 (Pool with NYK terminated)
Development in share price and volume
-
10.00
20.00
30.00
40.00
50.00
60.00
70.00
12.0
6.20
01
19.0
6.20
01
23.0
7.20
01
06.0
8.20
01
21.0
8.20
01
31.0
8.20
01
06.0
9.20
01
08.1
0.20
01
03.1
2.20
01
06.0
2.20
02
12.0
3.20
02
15.0
5.20
02
20.0
6.20
02
27.1
2.20
02
03.0
3.20
03
03.0
9.20
03
Sh
are
pri
ce (
NO
K)
-
10 000
20 000
30 000
40 000
50 000
60 000
Vo
lum
e
Share price Volume
STAR Reefers AS, as managers for STAR Reefers Inc Rådhusgaten 23, N-0158 Oslo, Norway
slide no. 10
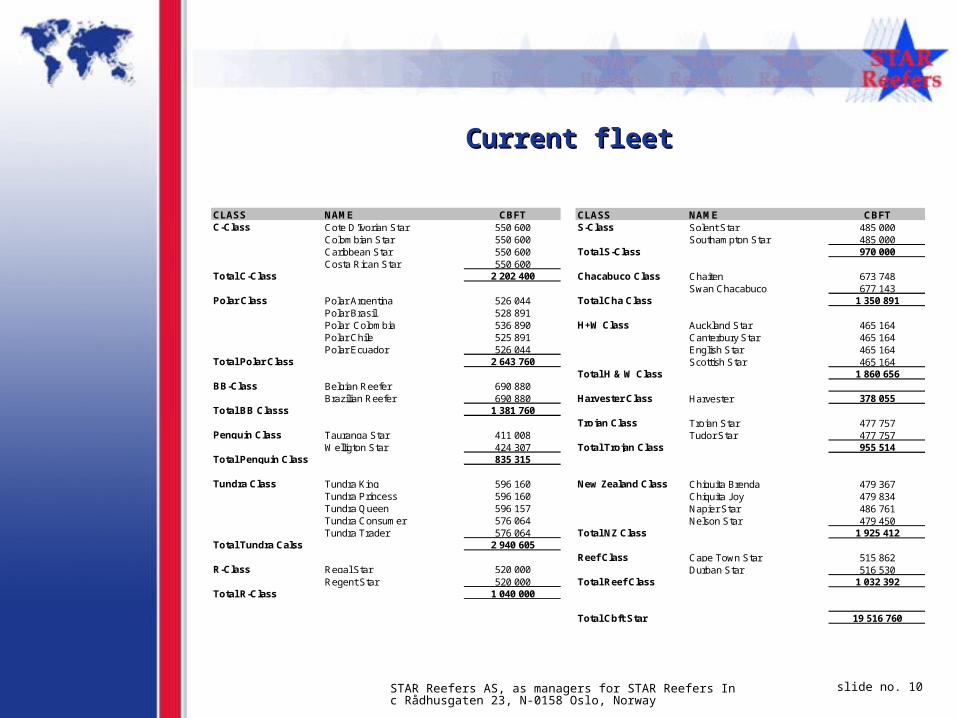
Current fleetCurrent fleet
CLASS NAME CBFTC-Class Cote D'Ivorian Star 550 600
Colombian Star 550 600Caribbean Star 550 600Costa Rican Star 550 600
Total C-Class 2 202 400
Polar Class Polar Argentina 526 044Polar Brasil 528 891Polar Colombia 536 890Polar Chile 525 891Polar Ecuador 526 044
Total Polar Class 2 643 760
BB-Class Belgian Reefer 690 880Brazilian Reefer 690 880
Total BB Classs 1 381 760
Penguin Class Tauranga Star 411 008Welligton Star 424 307
Total Penguin Class 835 315
Tundra Class Tundra King 596 160Tundra Princess 596 160Tundra Queen 596 157Tundra Consumer 576 064Tundra Trader 576 064
Total Tundra Calss 2 940 605
R-Class Regal Star 520 000Regent Star 520 000
Total R-Class 1 040 000
CLASS NAME CBFTS-Class Solent Star 485 000
Southampton Star 485 000Total S-Class 970 000
Chacabuco Class Chaiten 673 748Swan Chacabuco 677 143
Total Cha Class 1 350 891
H+W Class Auckland Star 465 164Canterbury Star 465 164English Star 465 164Scottish Star 465 164
Total H & W Class 1 860 656
Harvester Class Harvester 378 055
Trojan Class Trojan Star 477 757Tudor Star 477 757
Total Trojan Class 955 514
New Zealand Class Chiquita Brenda 479 367Chiquita Joy 479 834Napier Star 486 761Nelson Star 479 450
Total NZ Class 1 925 412
Reef Class Cape Town Star 515 862Durban Star 516 530
Total Reef Class 1 032 392
Total Cbft Star 19 516 760
STAR Reefers AS, as managers for STAR Reefers Inc Rådhusgaten 23, N-0158 Oslo, Norway
slide no. 11
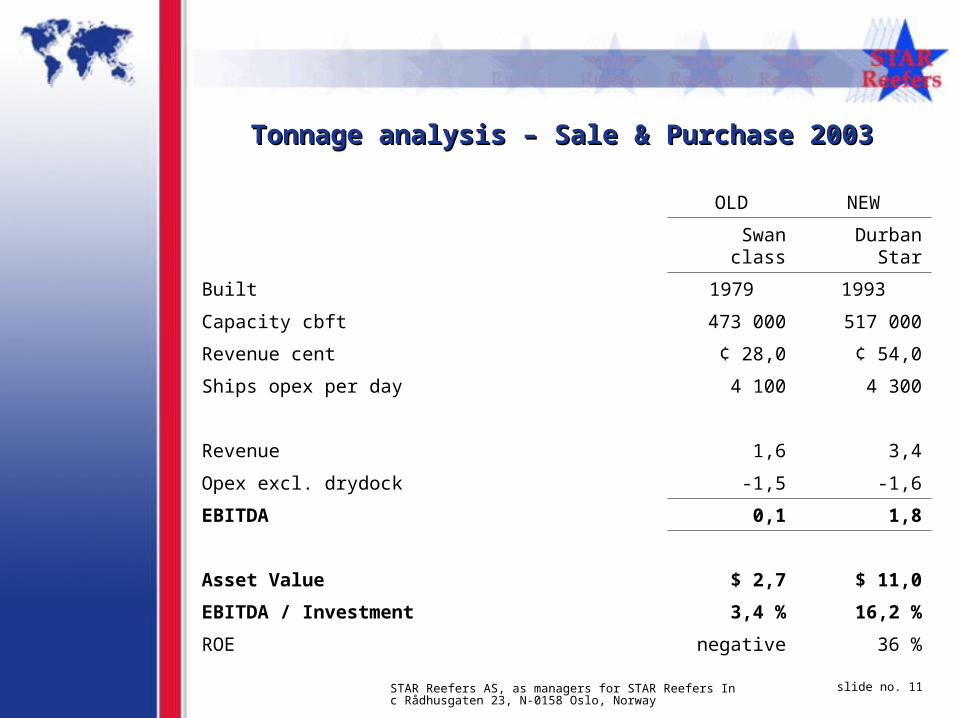
Tonnage analysis – Sale & Purchase 2003Tonnage analysis – Sale & Purchase 2003
OLD NEW
Swan class Durban Star
Built 1979 1993
Capacity cbft 473 000 517 000
Revenue cent ¢ 28,0 ¢ 54,0
Ships opex per day 4 100 4 300
Revenue 1,6 3,4
Opex excl. drydock -1,5 -1,6
EBITDA 0,1 1,8
Asset Value $ 2,7 $ 11,0
EBITDA / Investment 3,4 % 16,2 %
ROE negative 36 %
STAR Reefers AS, as managers for STAR Reefers Inc Rådhusgaten 23, N-0158 Oslo, Norway
slide no. 12
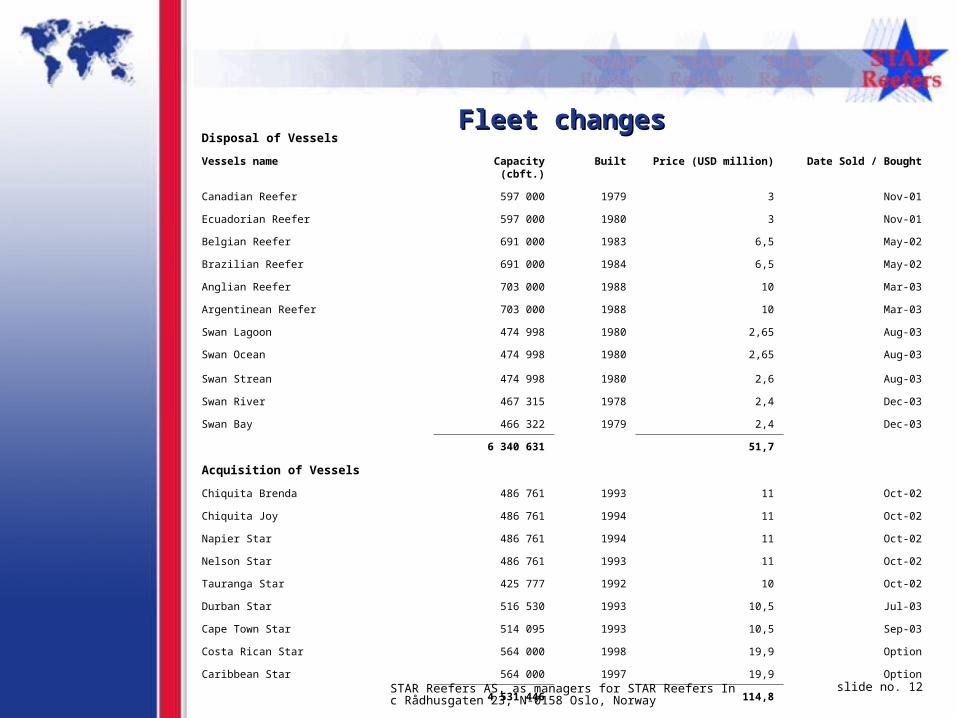
Fleet changesFleet changesDisposal of Vessels
Vessels name Capacity (cbft.) Built Price (USD million) Date Sold / Bought
Canadian Reefer 597 000 1979 3 Nov-01
Ecuadorian Reefer 597 000 1980 3 Nov-01
Belgian Reefer 691 000 1983 6,5 May-02
Brazilian Reefer 691 000 1984 6,5 May-02
Anglian Reefer 703 000 1988 10 Mar-03
Argentinean Reefer 703 000 1988 10 Mar-03
Swan Lagoon 474 998 1980 2,65 Aug-03
Swan Ocean 474 998 1980 2,65 Aug-03
Swan Strean 474 998 1980 2,6 Aug-03
Swan River 467 315 1978 2,4 Dec-03
Swan Bay 466 322 1979 2,4 Dec-03
6 340 631 51,7
Acquisition of Vessels
Chiquita Brenda 486 761 1993 11 Oct-02
Chiquita Joy 486 761 1994 11 Oct-02
Napier Star 486 761 1994 11 Oct-02
Nelson Star 486 761 1993 11 Oct-02
Tauranga Star 425 777 1992 10 Oct-02
Durban Star 516 530 1993 10,5 Jul-03
Cape Town Star 514 095 1993 10,5 Sep-03
Costa Rican Star 564 000 1998 19,9 Option
Caribbean Star 564 000 1997 19,9 Option
4 531 446 114,8
STAR Reefers AS, as managers for STAR Reefers Inc Rådhusgaten 23, N-0158 Oslo, Norway
slide no. 13
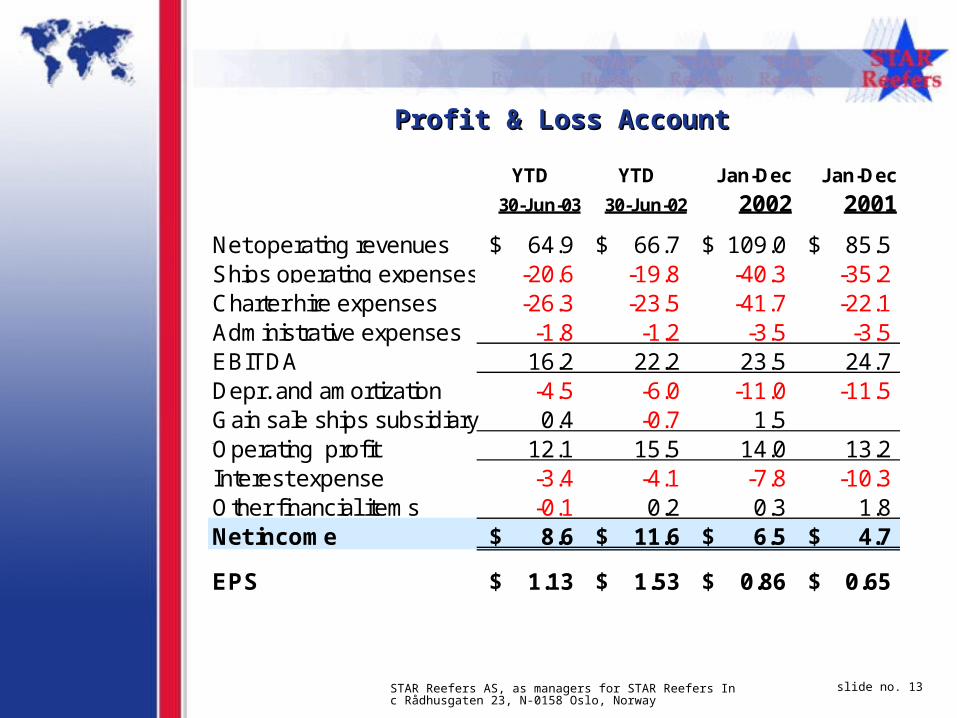
.
YTD YTD Jan-Dec Jan-Dec
30-Jun-03 30-Jun-02 2002 2001
Net operating revenues 64.9$ 66.7$ 109.0$ 85.5$ Ships operating expenses -20.6 -19.8 -40.3 -35.2 Charter hire expenses -26.3 -23.5 -41.7 -22.1 Administrative expenses -1.8 -1.2 -3.5 -3.5 EBITDA 16.2 22.2 23.5 24.7Depr. and amortization -4.5 -6.0 -11.0 -11.5 Gain sale ships subsidiary 0.4 -0.7 1.5Operating profit 12.1 15.5 14.0 13.2Interest expense -3.4 -4.1 -7.8 -10.3 Other financial items -0.1 0.2 0.3 1.8Net income 8.6$ 11.6$ 6.5$ 4.7$
EPS 1.13$ 1.53$ 0.86$ 0.65$
Profit & Loss AccountProfit & Loss Account
STAR Reefers AS, as managers for STAR Reefers Inc Rådhusgaten 23, N-0158 Oslo, Norway
slide no. 14
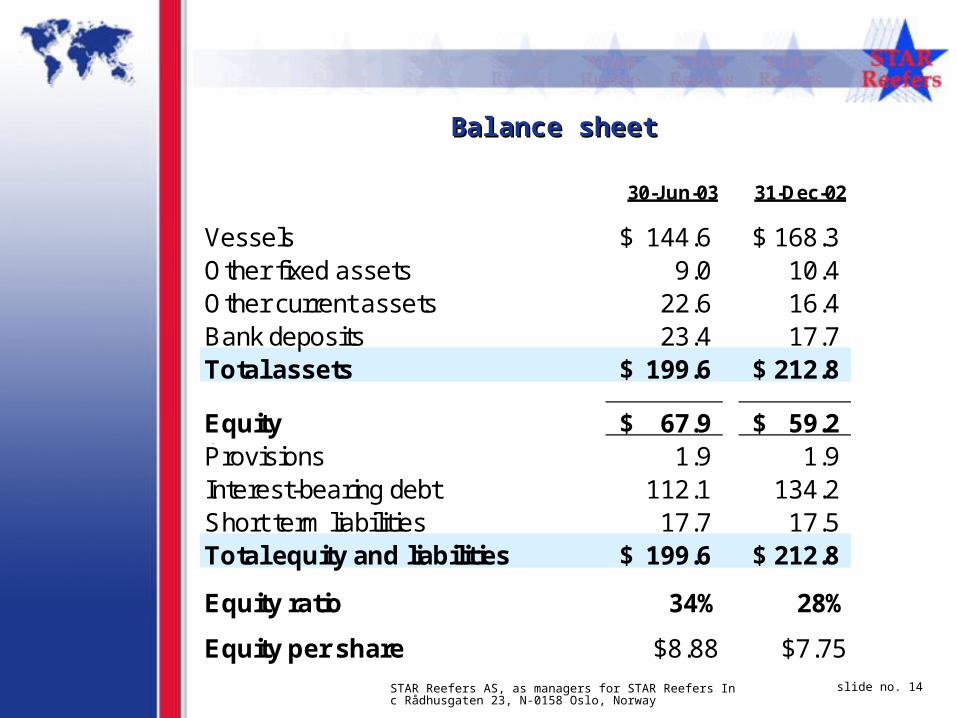
.
30-Jun-03 31-Dec-02
Vessels 144.6$ 168.3$ Other fixed assets 9.0 10.4 Other current assets 22.6 16.4 Bank deposits 23.4 17.7 Total assets 199.6$ 212.8$
Equity 67.9$ 59.2$ Provisions 1.9 1.9 Interest-bearing debt 112.1 134.2 Short term liabilities 17.7 17.5 Total equity and liabilities 199.6$ 212.8$
Equity ratio 34% 28%
Equity per share $8.88 $7.75
Balance sheetBalance sheet
STAR Reefers AS, as managers for STAR Reefers Inc Rådhusgaten 23, N-0158 Oslo, Norway
slide no. 15
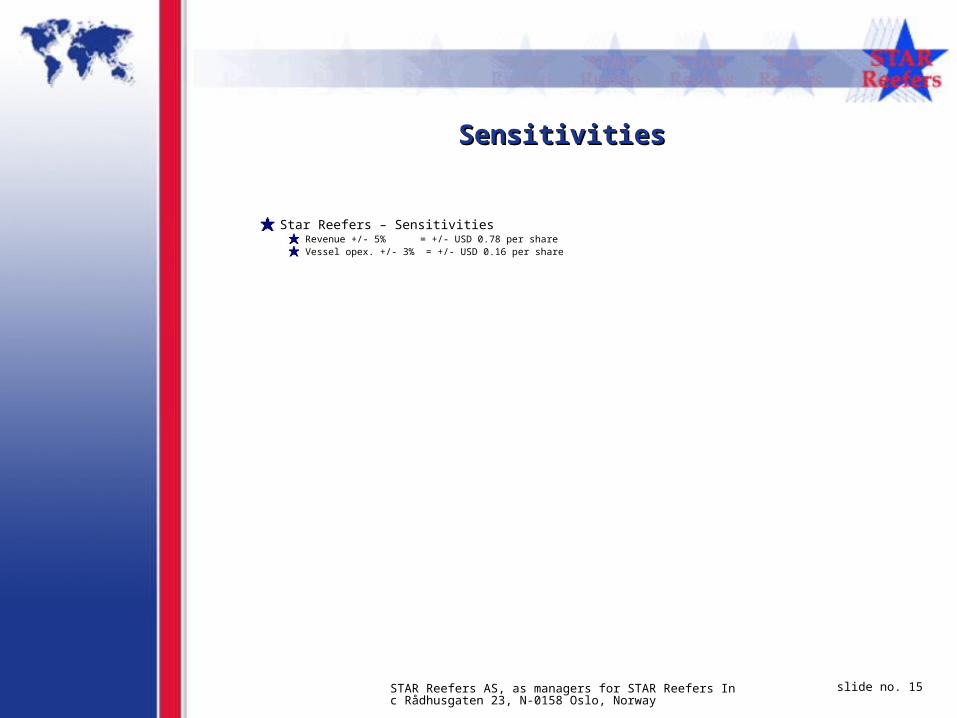
SensitivitiesSensitivities
Star Reefers – SensitivitiesRevenue +/- 5% = +/- USD 0.78 per shareVessel opex. +/- 3% = +/- USD 0.16 per share
STAR Reefers AS, as managers for STAR Reefers Inc Rådhusgaten 23, N-0158 Oslo, Norway
slide no. 16
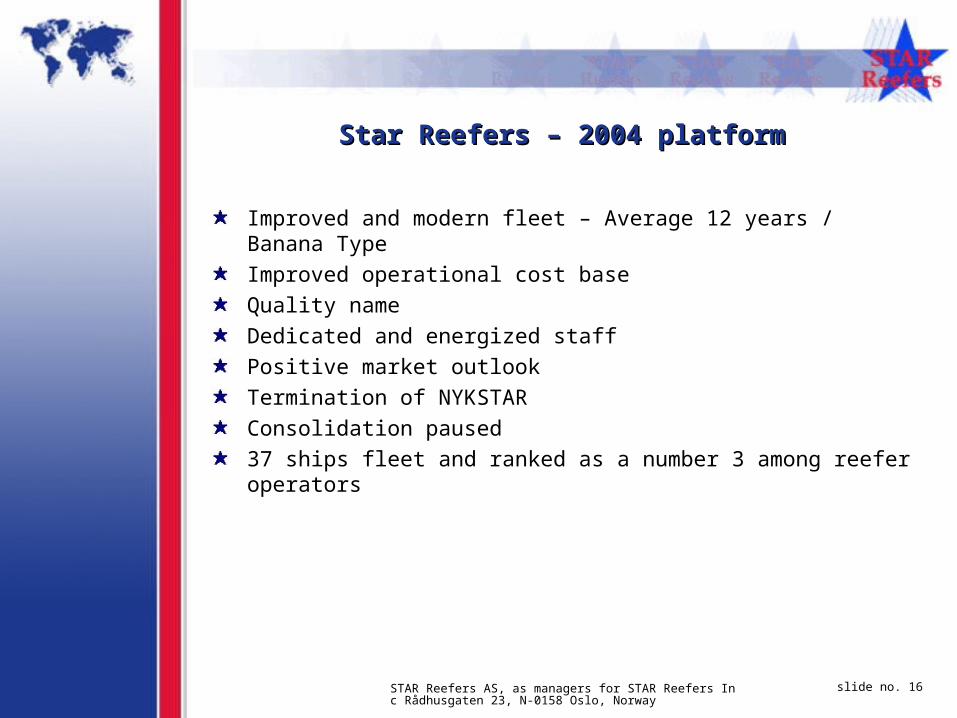
Star Reefers – 2004 platformStar Reefers – 2004 platform
Improved and modern fleet – Average 12 years / Banana Type
Improved operational cost base
Quality name
Dedicated and energized staff
Positive market outlook
Termination of NYKSTAR
Consolidation paused
37 ships fleet and ranked as a number 3 among reefer operators
33 Market drivers and outlookMarket drivers and outlook
STAR Reefers AS, as managers for STAR Reefers Inc Rådhusgaten 23, N-0158 Oslo, Norway
slide no. 18
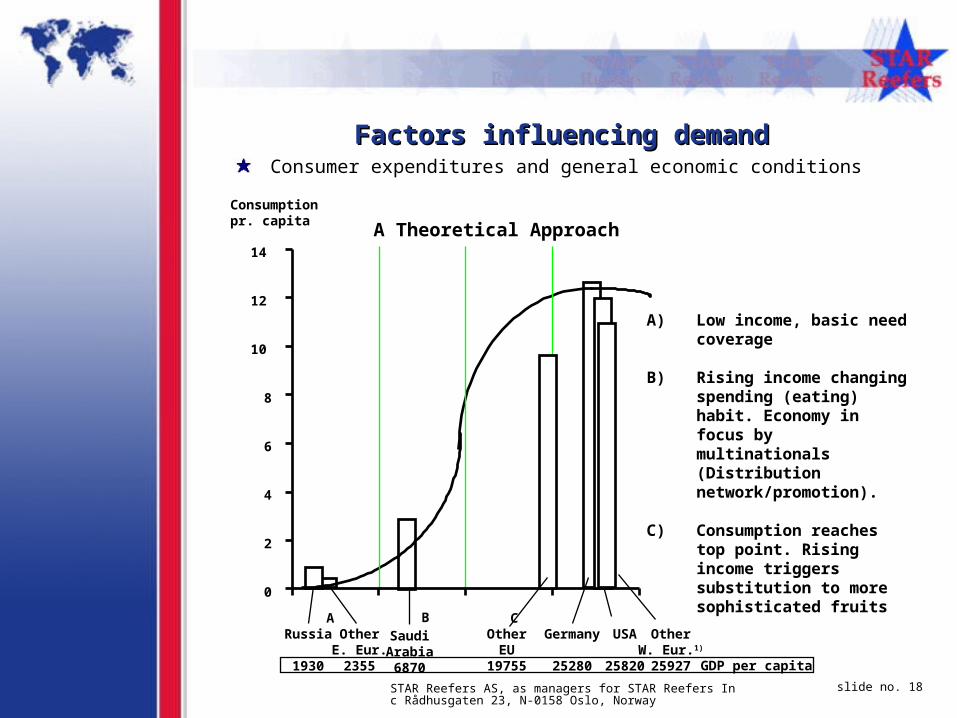
Factors influencing demandFactors influencing demandConsumer expenditures and general economic conditions
A Theoretical Approach
A B C
GDP per capita
Consumption pr. capita
0
2
4
6
8
10
12
14
Russia
1930
SaudiArabia6870
Germany
25280
USA
25820
OtherE. Eur.2355
OtherW. Eur.1)
25927
OtherEU
19755
A) Low income, basic need coverage
B) Rising income changing spending (eating) habit. Economy in focus by multinationals (Distribution network/promotion).
C) Consumption reaches top point. Rising income triggers substitution to more sophisticated fruits
STAR Reefers AS, as managers for STAR Reefers Inc Rådhusgaten 23, N-0158 Oslo, Norway
slide no. 19
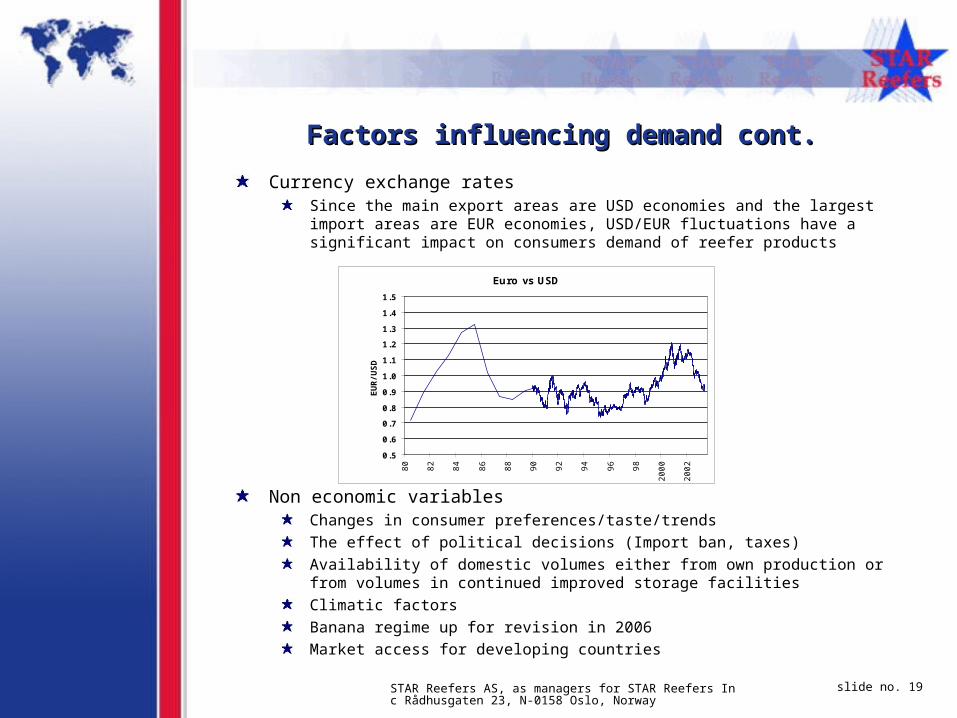
Factors influencing demand cont.Factors influencing demand cont.
Euro vs USD
0.5
0.6
0.7
0.8
0.9
1.0
1.1
1.2
1.3
1.4
1.5
80
82
84
86
88
90
92
94
96
98
2000
2002
EU
R/U
SD
Currency exchange ratesSince the main export areas are USD economies and the largest import areas are EUR economies, USD/EUR fluctuations have a significant impact on consumers demand of reefer products
Non economic variablesChanges in consumer preferences/taste/trends
The effect of political decisions (Import ban, taxes)
Availability of domestic volumes either from own production or from volumes in continued improved storage facilities
Climatic factors
Banana regime up for revision in 2006
Market access for developing countries
STAR Reefers AS, as managers for STAR Reefers Inc Rådhusgaten 23, N-0158 Oslo, Norway
slide no. 20
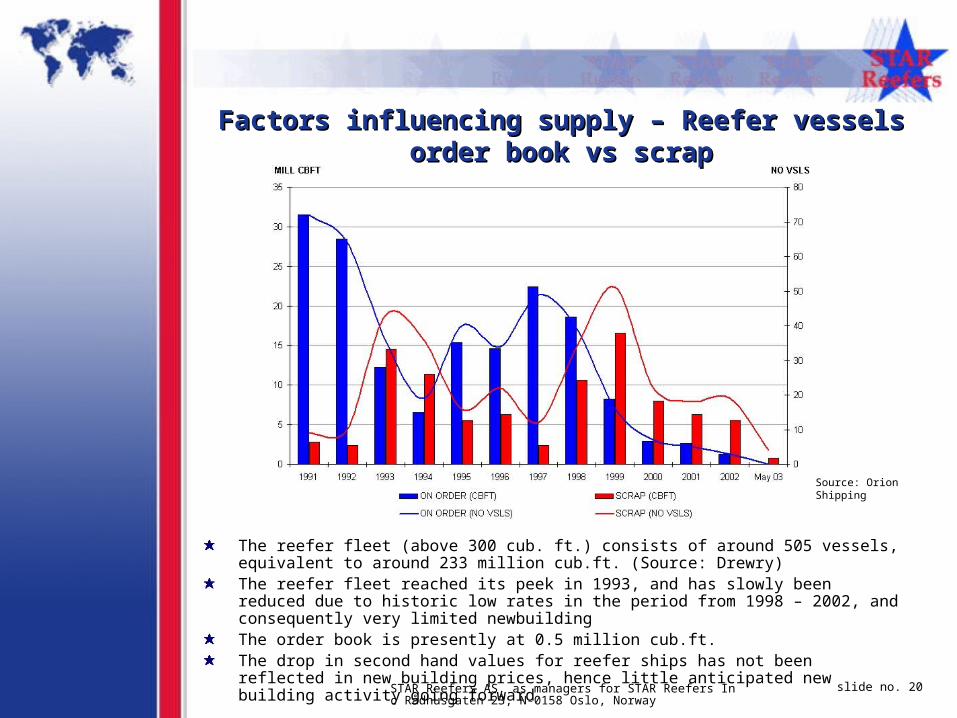
Source: Orion Shipping
The reefer fleet (above 300 cub. ft.) consists of around 505 vessels, equivalent to around 233 million cub.ft. (Source: Drewry)The reefer fleet reached its peek in 1993, and has slowly been reduced due to historic low rates in the period from 1998 – 2002, and consequently very limited newbuildingThe order book is presently at 0.5 million cub.ft.The drop in second hand values for reefer ships has not been reflected in new building prices, hence little anticipated new building activity going forward
Factors influencing supply – Reefer vessels order book Factors influencing supply – Reefer vessels order book vs scrapvs scrap
STAR Reefers AS, as managers for STAR Reefers Inc Rådhusgaten 23, N-0158 Oslo, Norway
slide no. 21
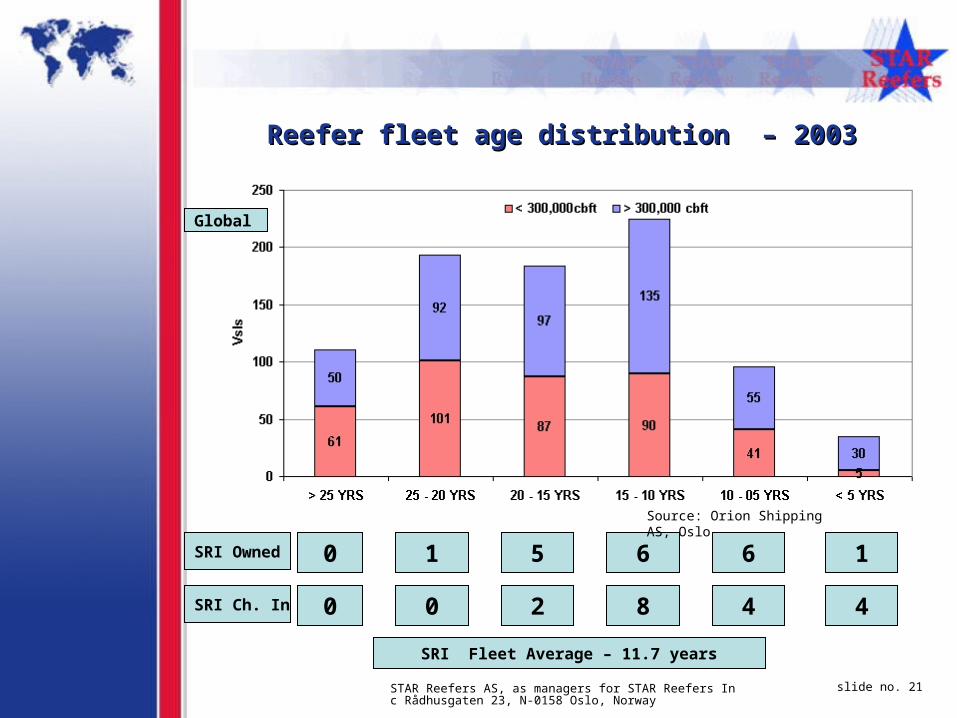
SRI Owned
Global
0 1 5 6 6 1
Reefer fleet age distribution – 2003Reefer fleet age distribution – 2003
Source: Orion Shipping AS, Oslo
SRI Fleet Average – 11.7 years
SRI Ch. In 0 0 2 8 4 4
STAR Reefers AS, as managers for STAR Reefers Inc Rådhusgaten 23, N-0158 Oslo, Norway
slide no. 22
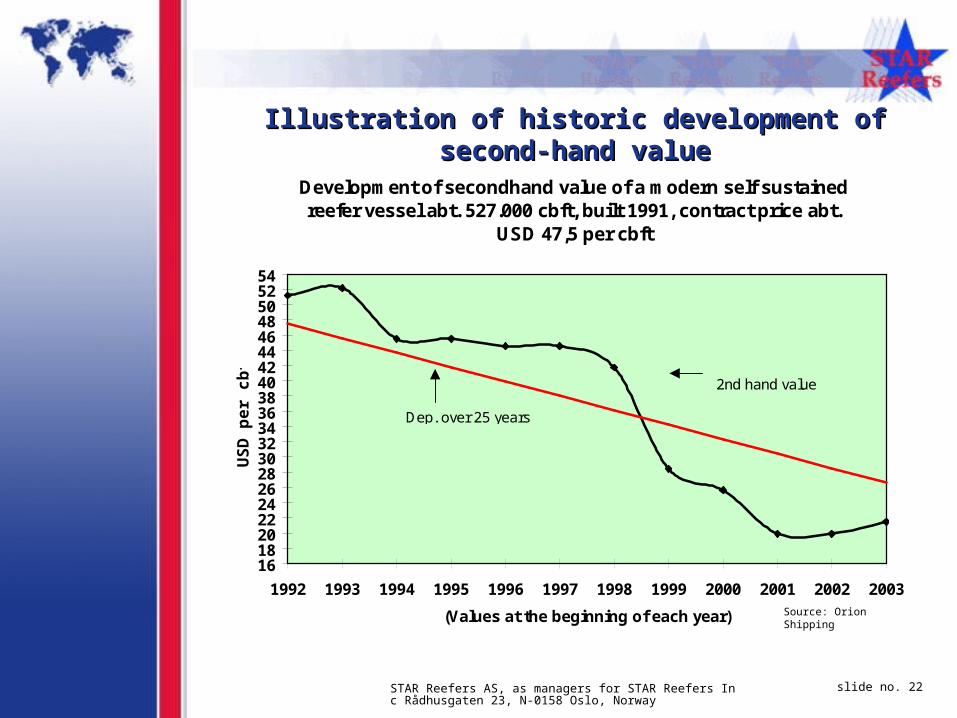
Illustration of historic development of second-hand valueIllustration of historic development of second-hand value
Development of secondhand value of a modern self sustained reefer vessel abt. 527.000 cbft, built 1991, contract price abt.
USD 47,5 per cbft
1618202224262830323436384042444648505254
1992 1993 1994 1995 1996 1997 1998 1999 2000 2001 2002 2003
(Values at the beginning of each year)
US
D p
er
cb
ft
Dep. over 25 years eco.life
2nd hand value
Source: Orion Shipping
STAR Reefers AS, as managers for STAR Reefers Inc Rådhusgaten 23, N-0158 Oslo, Norway
slide no. 23
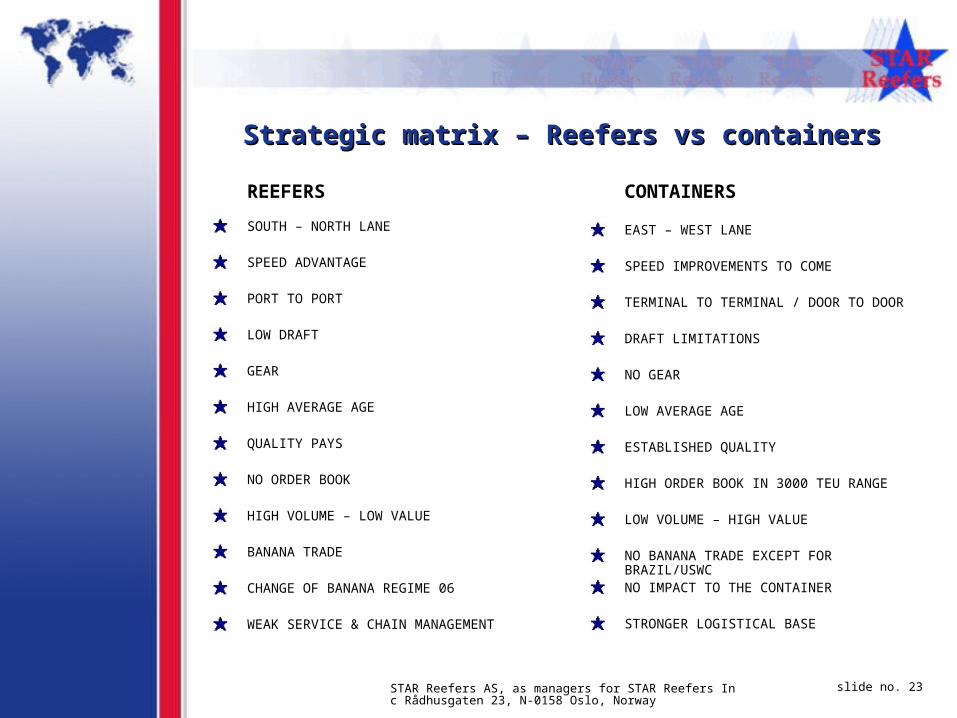
Strategic matrix – Reefers vs containersStrategic matrix – Reefers vs containers
REEFERS
SOUTH – NORTH LANE
SPEED ADVANTAGE
PORT TO PORT
LOW DRAFT
GEAR
HIGH AVERAGE AGE
QUALITY PAYS
NO ORDER BOOK
HIGH VOLUME – LOW VALUE
BANANA TRADE
CHANGE OF BANANA REGIME 06
WEAK SERVICE & CHAIN MANAGEMENT
CONTAINERS
EAST – WEST LANE
SPEED IMPROVEMENTS TO COME
TERMINAL TO TERMINAL / DOOR TO DOOR
DRAFT LIMITATIONS
NO GEAR
LOW AVERAGE AGE
ESTABLISHED QUALITY
HIGH ORDER BOOK IN 3000 TEU RANGE
LOW VOLUME – HIGH VALUE
NO BANANA TRADE EXCEPT FOR BRAZIL/USWCNO IMPACT TO THE CONTAINER
STRONGER LOGISTICAL BASE
STAR Reefers AS, as managers for STAR Reefers Inc Rådhusgaten 23, N-0158 Oslo, Norway
slide no. 24
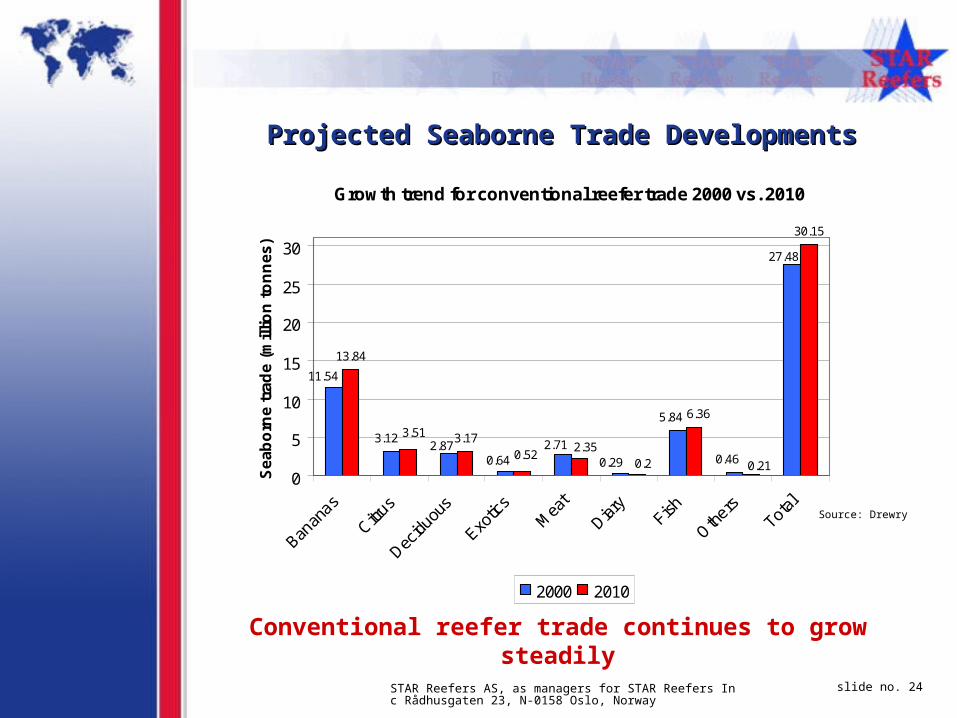
Projected Seaborne Trade DevelopmentsProjected Seaborne Trade Developments
Conventional reefer trade continues to grow steadily
Growth trend for conventional reefer trade 2000 vs. 2010
13.84
3.17
30.15
11.54
27.48
0.46
5.84
0.29
2.710.64
2.873.12
0.21
6.36
0.22.35
0.52
3.51
0
5
10
15
20
25
30
Banan
as
Citrus
Decidu
ous
Exotic
sM
eat
Diary
Fish
Oth
ersTota
l
Se
ab
orn
e t
rad
e (
mil
lio
n t
on
ne
s)
2000 2010
Source: Drewry
STAR Reefers AS, as managers for STAR Reefers Inc Rådhusgaten 23, N-0158 Oslo, Norway
slide no. 25
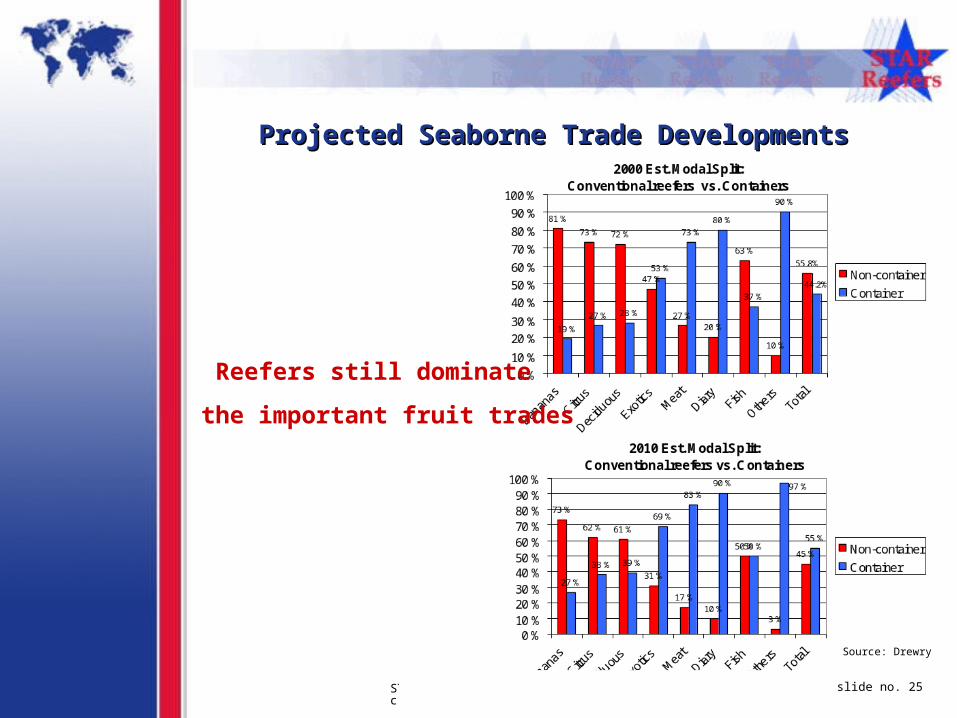
Projected Seaborne Trade Developments Projected Seaborne Trade Developments
Reefers still dominate
the important fruit trades
Source: Drewry
STAR Reefers AS, as managers for STAR Reefers Inc Rådhusgaten 23, N-0158 Oslo, Norway
slide no. 26
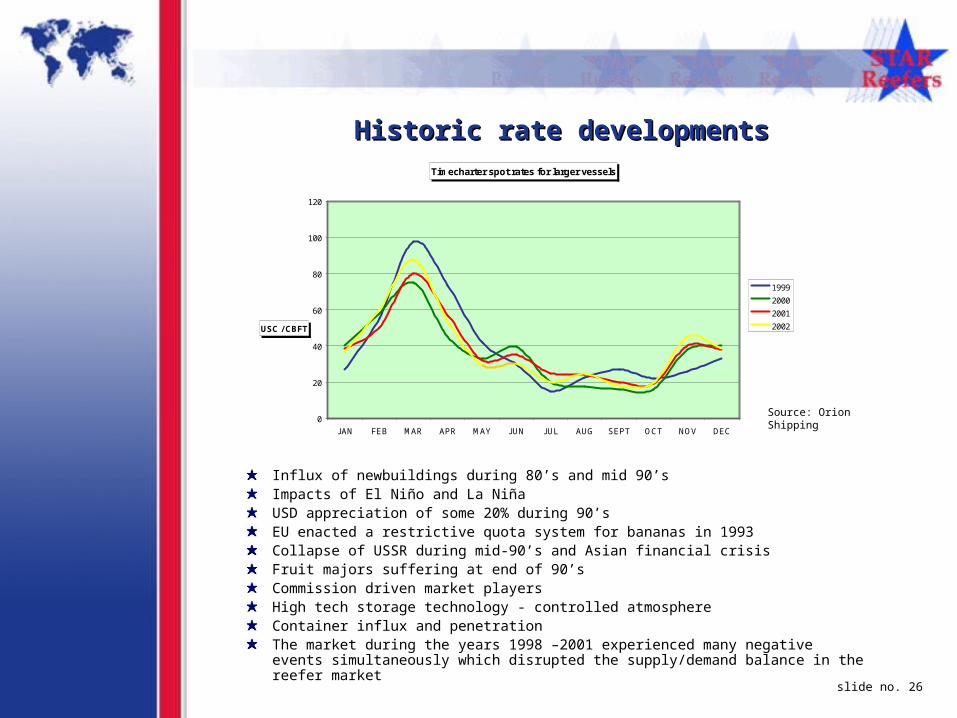
Historic rate developmentsHistoric rate developments
Influx of newbuildings during 80’s and mid 90’sImpacts of El Niño and La NiñaUSD appreciation of some 20% during 90’sEU enacted a restrictive quota system for bananas in 1993Collapse of USSR during mid-90’s and Asian financial crisis Fruit majors suffering at end of 90’sCommission driven market players High tech storage technology - controlled atmosphereContainer influx and penetrationThe market during the years 1998 –2001 experienced many negative events simultaneously which disrupted the supply/demand balance in the reefer market
Timecharter spot rates for larger vessels
0
20
40
60
80
100
120
JAN FEB MAR APR MAY JUN JUL AUG SEPT OCT NOV DEC
USC / CBFT
1999
2000
2001
2002
Source: Orion Shipping
STAR Reefers AS, as managers for STAR Reefers Inc Rådhusgaten 23, N-0158 Oslo, Norway
slide no. 27
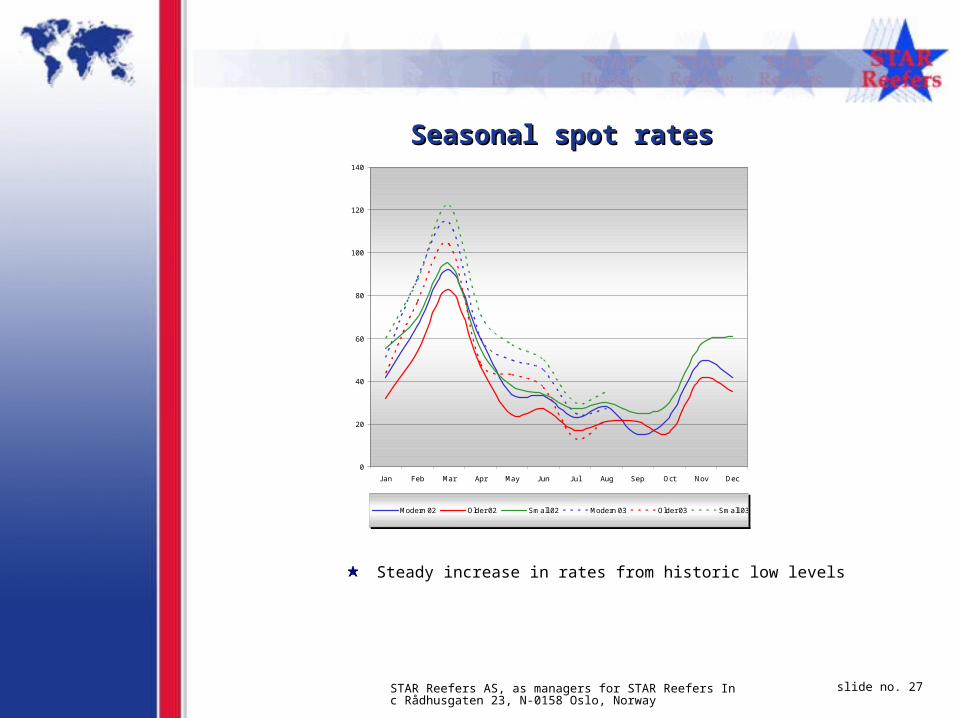
0
20
40
60
80
100
120
140
Jan Feb Mar Apr May Jun Jul Aug Sep Oct Nov Dec
Modern 02 Older 02 Small 02 Modern 03 Older 03 Small 03
Source: Orion Shipping AS, Oslo
Seasonal spot ratesSeasonal spot rates
Steady increase in rates from historic low levels
STAR Reefers AS, as managers for STAR Reefers Inc Rådhusgaten 23, N-0158 Oslo, Norway
slide no. 28
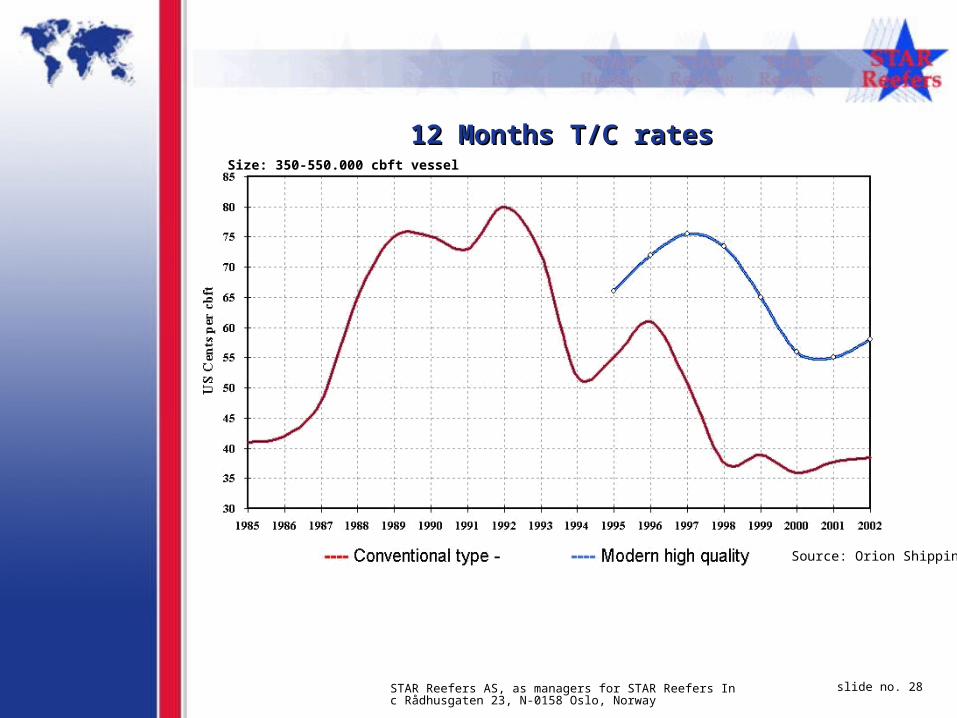
12 Months T/C rates12 Months T/C ratesSize: 350-550.000 cbft vessel
Source: Orion Shipping

4.4. Strategy and action plans revisitedStrategy and action plans revisited
STAR Reefers AS, as managers for STAR Reefers Inc Rådhusgaten 23, N-0158 Oslo, Norway
slide no. 30
Star Reefers - Strategy revisitedStar Reefers - Strategy revisited
Ad hoc logistics / chain management
Reorganisation – overhead reduction – adjustment to strategy execution
Dedicated servicesTrade sectors
Reefer services
Creative customer solutions
Rates on quality ships will increase
Increase spot exposure
Worldwide representation
Improve operating efficiency
Market growth
Tapping the tonnage supply market
Alert to consolidation – opportunity knocks
Strategy of executing accretive acquisitions
TRANSFORMATION TO A STRONGER SERVICE PROVIDER
STAR Reefers AS, as managers for STAR Reefers Inc Rådhusgaten 23, N-0158 Oslo, Norway
slide no. 31
Impact to Star ReefersImpact to Star Reefers
Improved operating margins
Increased market control
Increase in working capital needs
Increase fleet efficiency
Increased topline revenue growth
Continued quality improvements
Improved share liquidity and free float
STAR more attractive as a consolidation partner