Embed Size (px)
DESCRIPTION
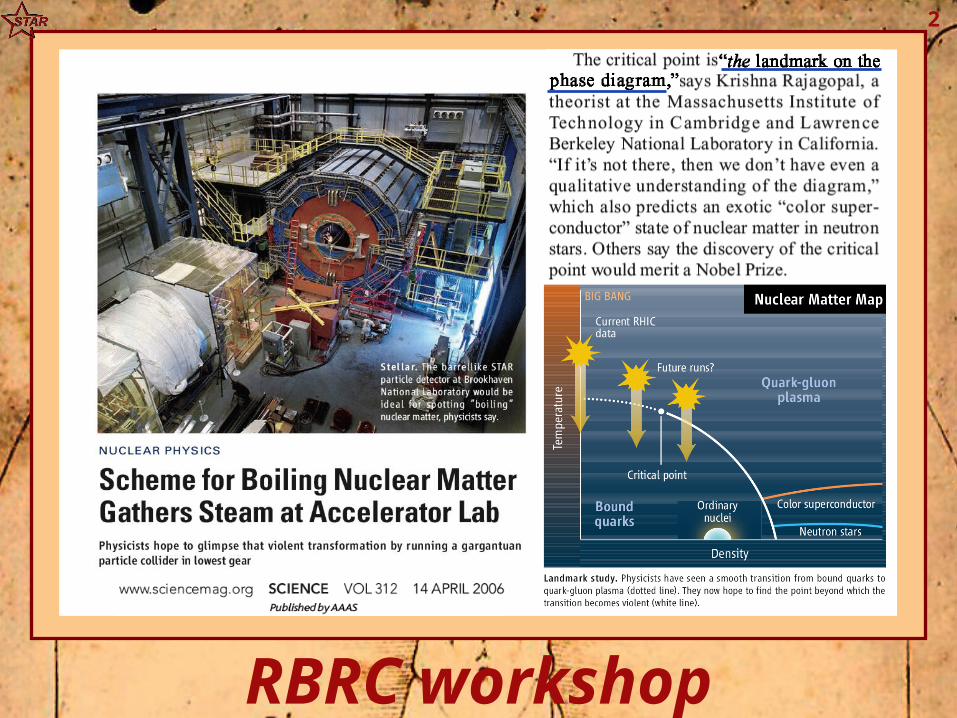
STAR Plans for Low Energy Running. Paul Sorensen for. QCD at High Temperature — BNL — July, 2006. RBRC workshop. M. Stephanov: hep-ph/0402115. location of the critical point. Ejiri, et.al. Taylor Expansion. Gavai, Gupta Taylor Expansion. Fodor, Katz Lattice Re-weighting. - PowerPoint PPT Presentation
Citation preview
STAR Plans for Low STAR Plans for Low Energy RunningEnergy Running
Paul Sorensen forPaul Sorensen for
QCD at High Temperature — BNL — July, 2006
2
RBRC workshop
3
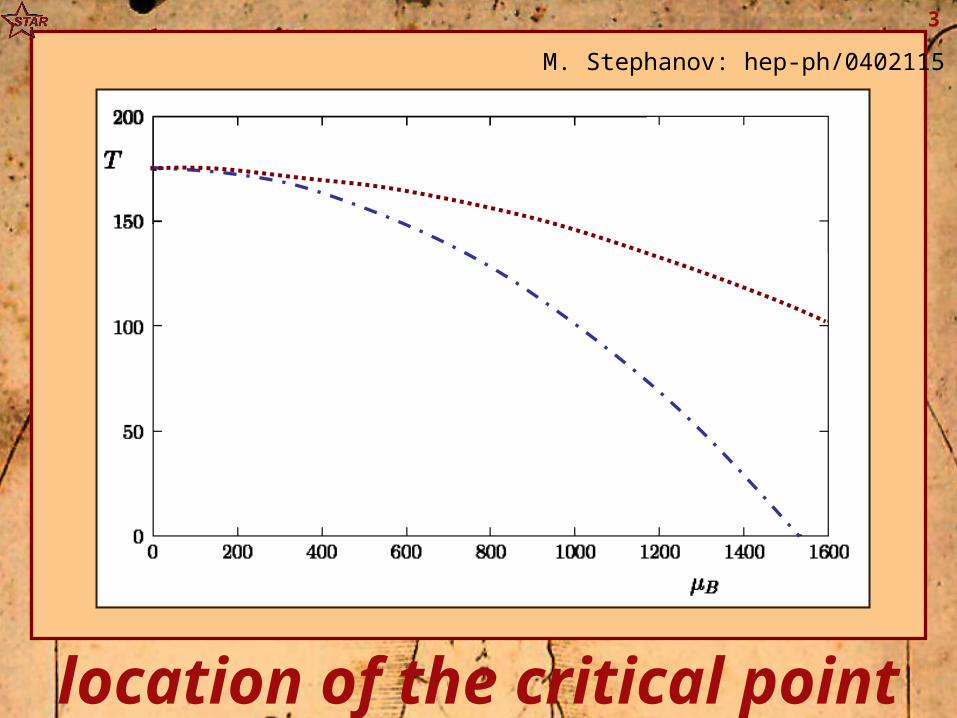
location of the critical point
M. Stephanov: hep-ph/0402115
4
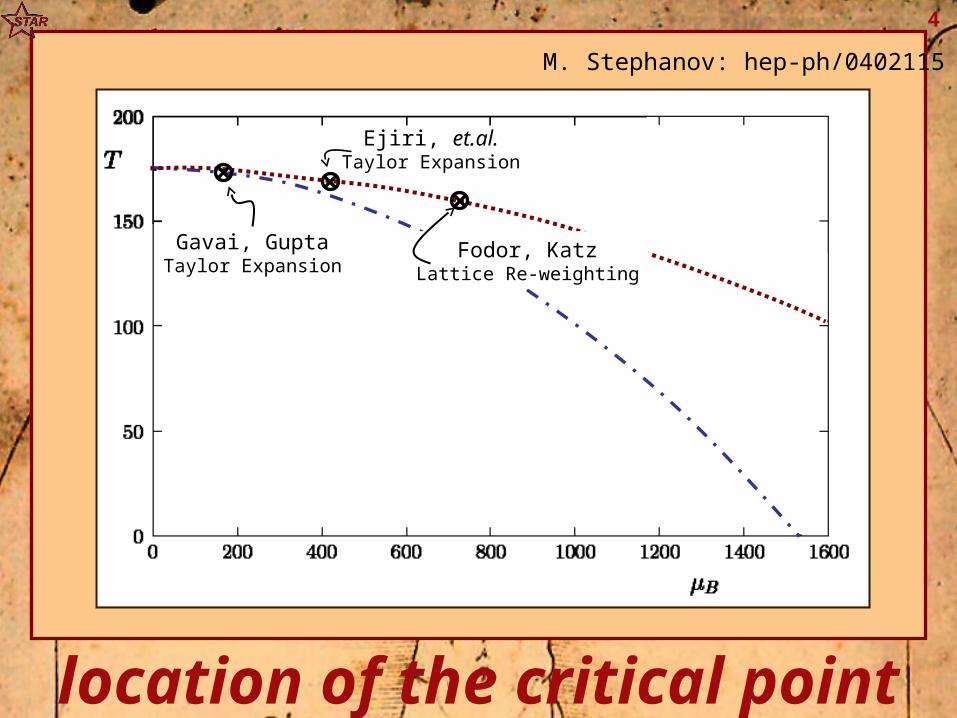
location of the critical point
Ejiri, et.al.Taylor Expansion
Fodor, KatzLattice Re-weighting
Gavai, GuptaTaylor Expansion
M. Stephanov: hep-ph/0402115
5
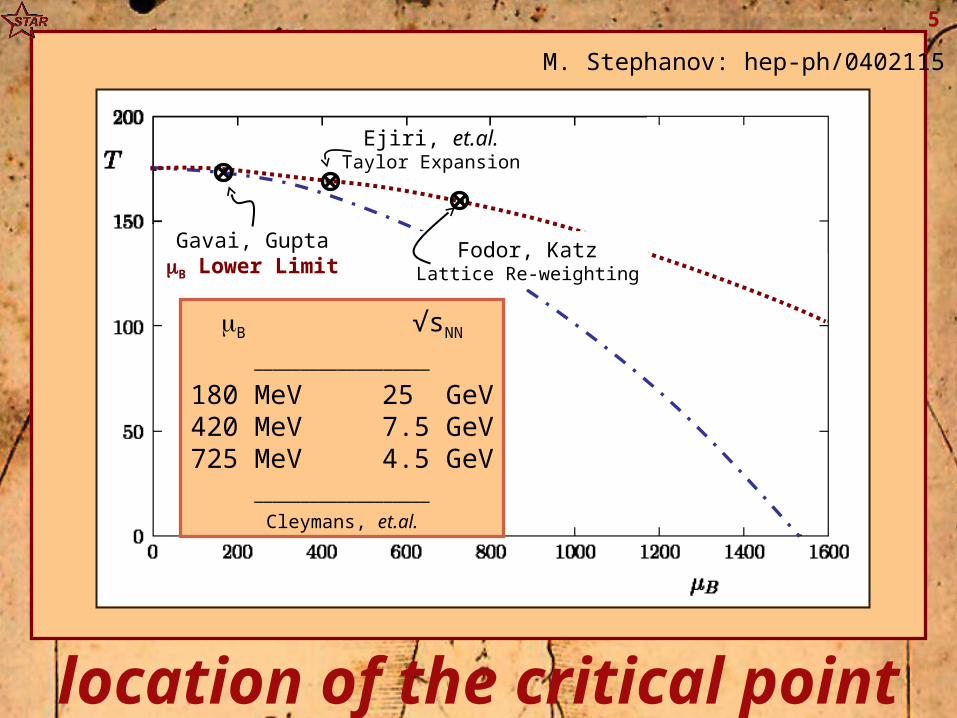
location of the critical point
Ejiri, et.al.Taylor Expansion
Fodor, KatzLattice Re-weighting
Gavai, GuptaB Lower Limit
B √sNN
———————————————————
180 MeV 25 GeV420 MeV 7.5 GeV725 MeV 4.5 GeV
———————————————————Cleymans, et.al.
M. Stephanov: hep-ph/0402115
6
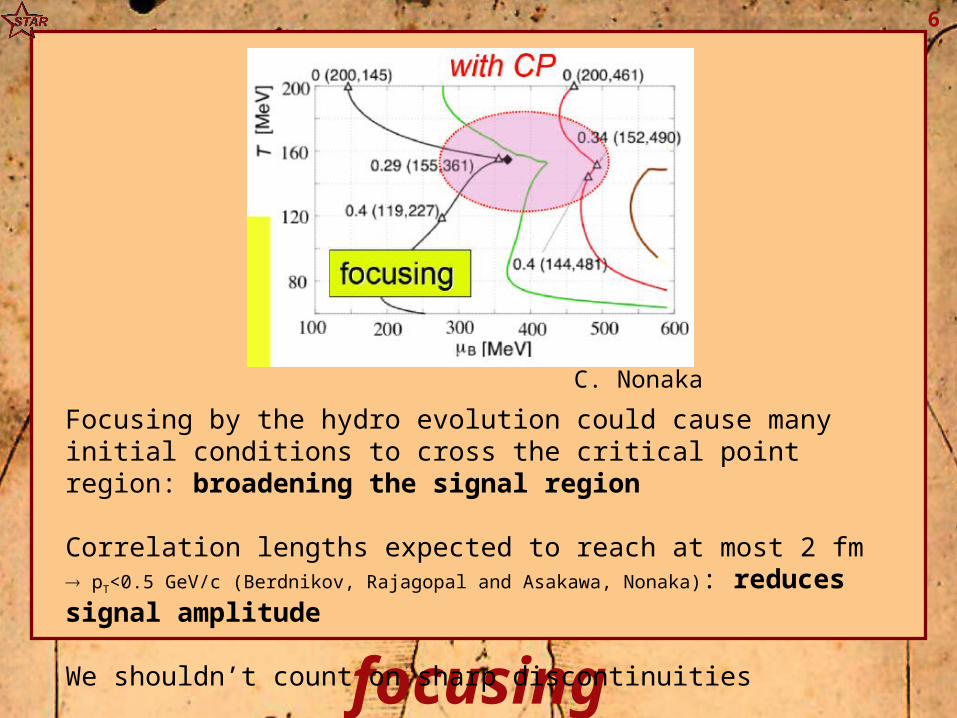
focusing
C. Nonaka
Focusing by the hydro evolution could cause many initial conditions to cross the critical point region: broadening the signal region
Correlation lengths expected to reach at most 2 fm pT<0.5 GeV/c (Berdnikov, Rajagopal and Asakawa, Nonaka): reduces signal amplitude
We shouldn’t count on sharp discontinuities
7
experimental indications?
QuickTime™ and aTIFF (Uncompressed) decompressor
are needed to see this picture.
The Horn
STAR Preliminary
8
experimental indications?
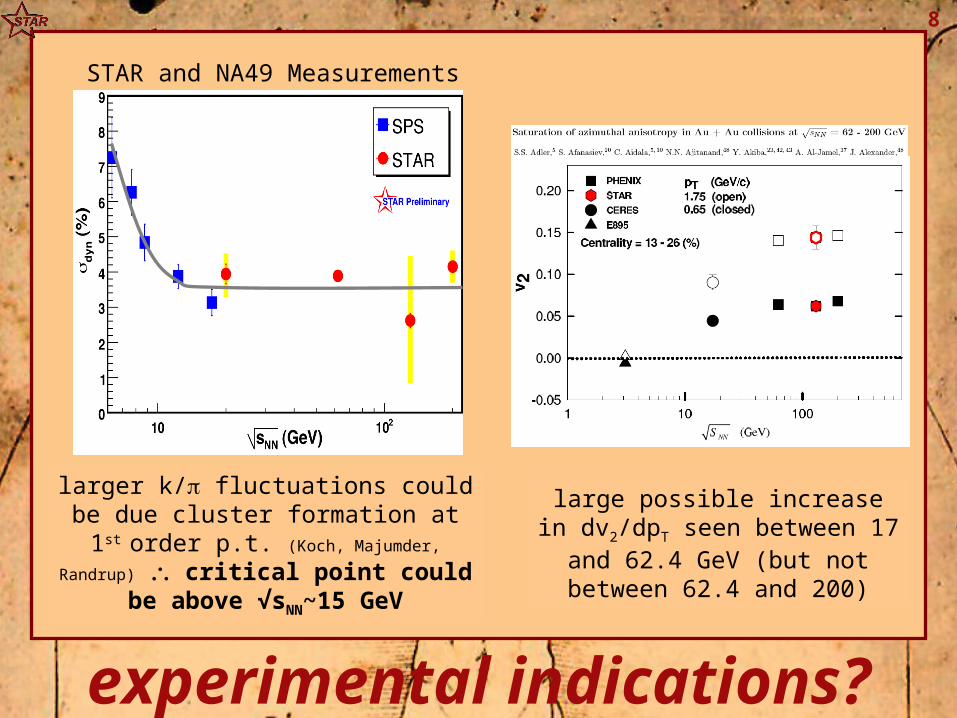
larger k/ fluctuations could be due cluster formation at 1st order p.t. (Koch, Majumder,
Randrup) critical point could be above √sNN~15 GeV
large possible increase in dv2/dpT seen between 17
and 62.4 GeV (but not between 62.4 and 200)
STAR and NA49 Measurements
9
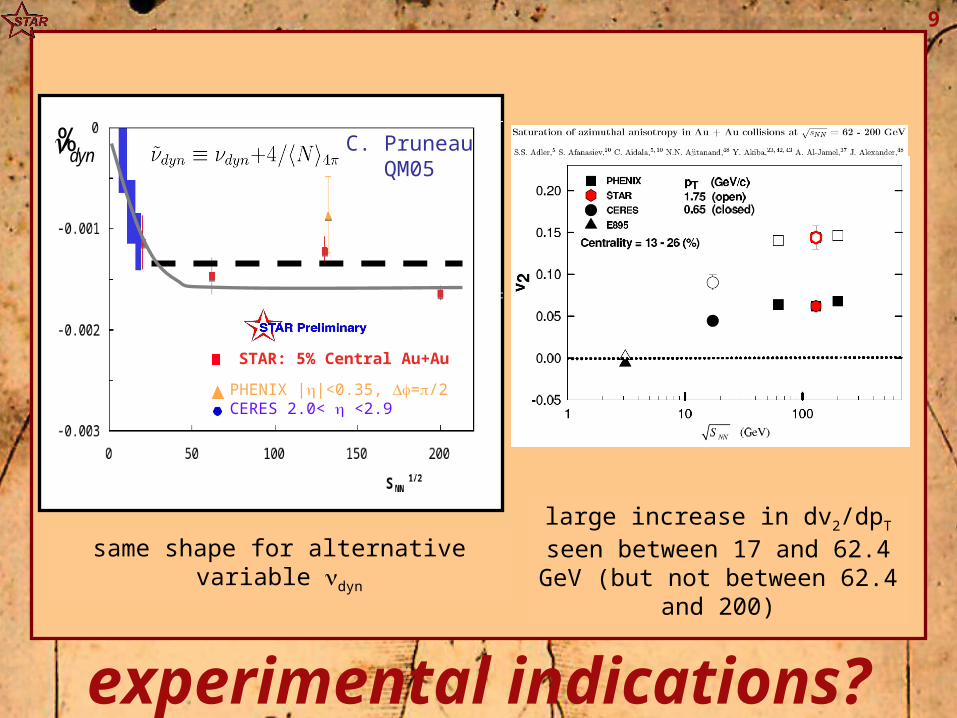
%νdyn
PHENIX ||<0.35, =/2CERES 2.0< <2.9
STAR: 5% Central Au+Au
C. PruneauQM05
experimental indications?
same shape for alternative variable νdyn
large increase in dv2/dpT seen between 17 and 62.4 GeV (but not between 62.4
and 200)
10
focus
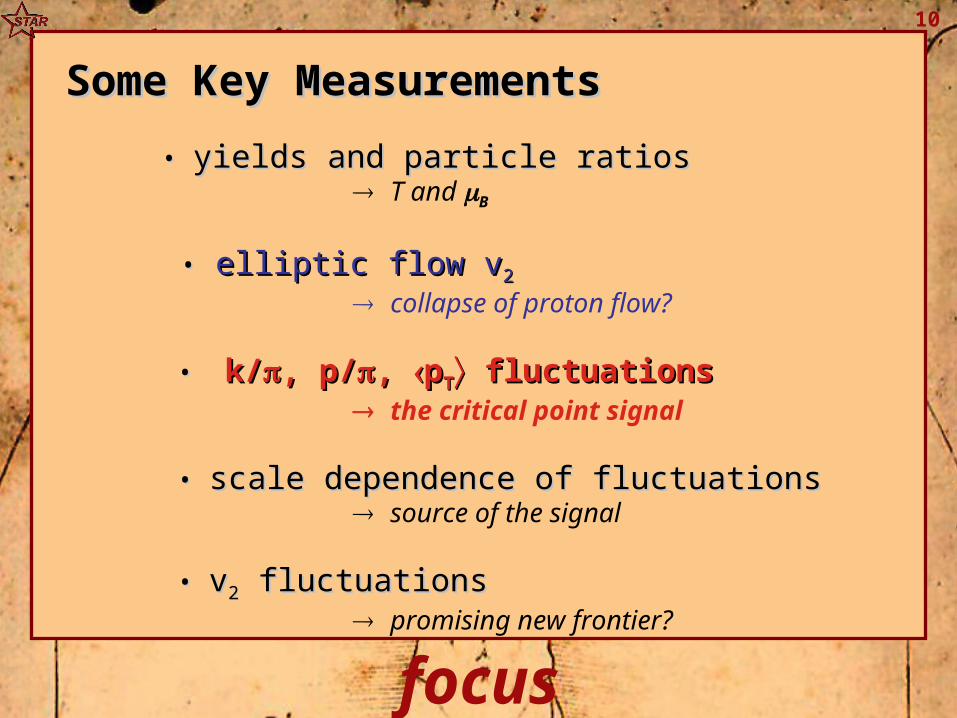
Some Key MeasurementsSome Key Measurements
• • yields and particle ratiosyields and particle ratios T and B
•• elliptic flow velliptic flow v22
collapse of proton flow?
•• k/k/, p/, p/, , ppTT fluctuations fluctuations the critical point signal
• • scale dependence of fluctuationsscale dependence of fluctuations source of the signal
•• vv22 fluctuations fluctuations promising new frontier?
11
outline
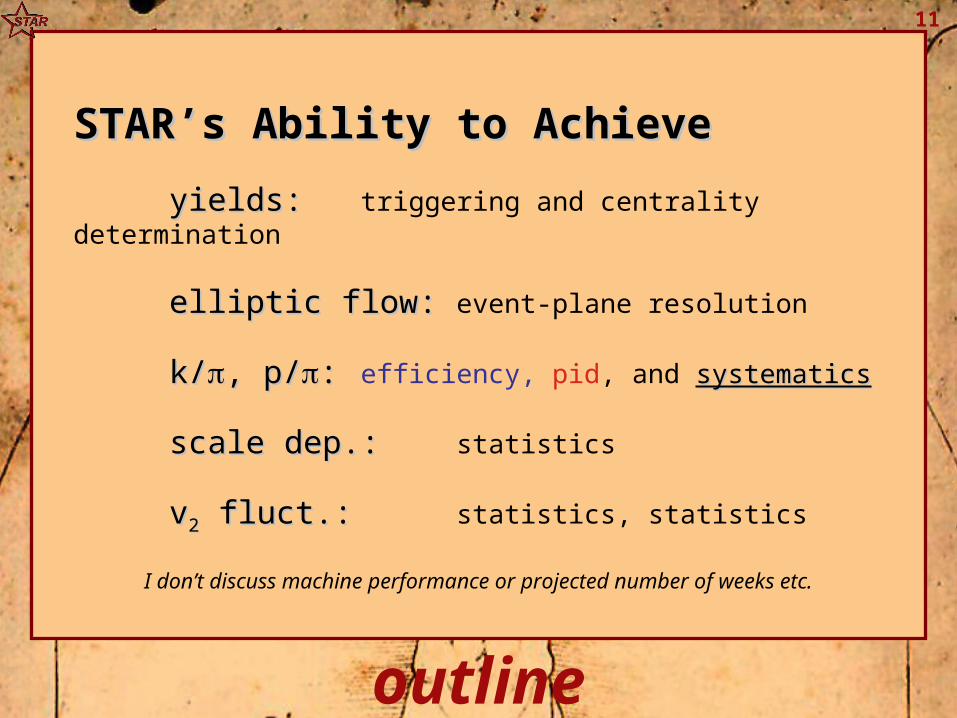
STAR’s Ability to AchieveSTAR’s Ability to Achieve
yields: yields: triggering and centrality determination
elliptic flow:elliptic flow: event-plane resolution
k/k/, p/, p/:: efficiency, pid, and systematicssystematics
scale dep.:scale dep.: statistics
vv22 fluct.: fluct.: statistics, statistics
I don’t discuss machine performance or projected number of weeks etc.
12
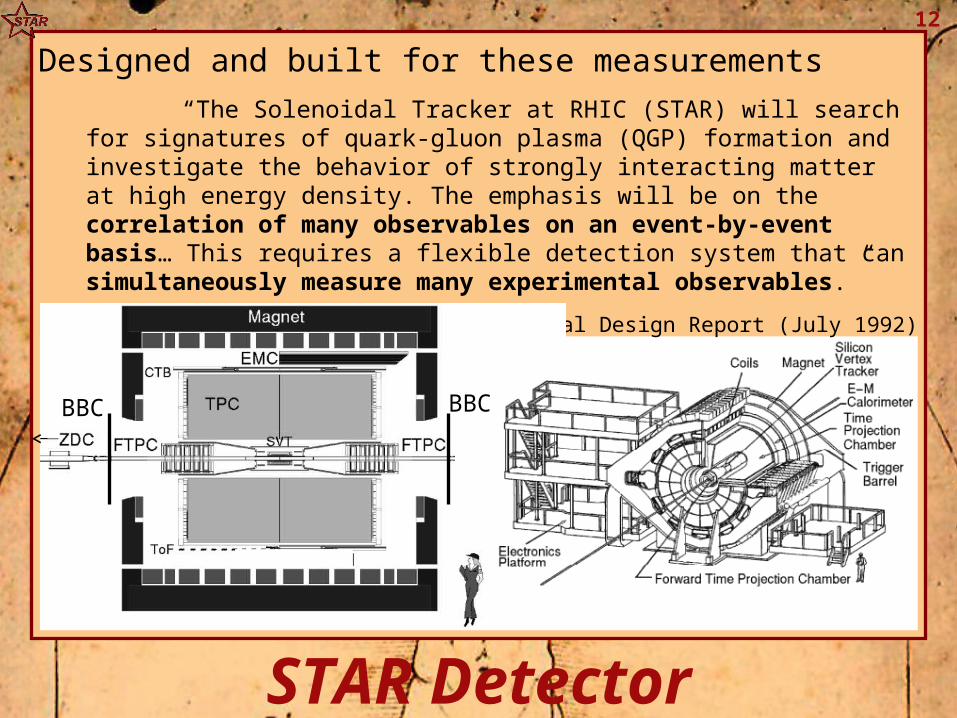
STAR Detector
Designed and built for these measurements“The Solenoidal Tracker at RHIC (STAR) will search for signatures of
quark-gluon plasma (QGP) formation and investigate the behavior of strongly interacting matter at high energy density. The emphasis will be on the correlation of many observables on an event-by-event basis… This requires a flexible detection system that can simultaneously measure many experimental observables.”
STAR Conceptual Design Report (July 1992)
BBCBBC
13
acceptance for triggering
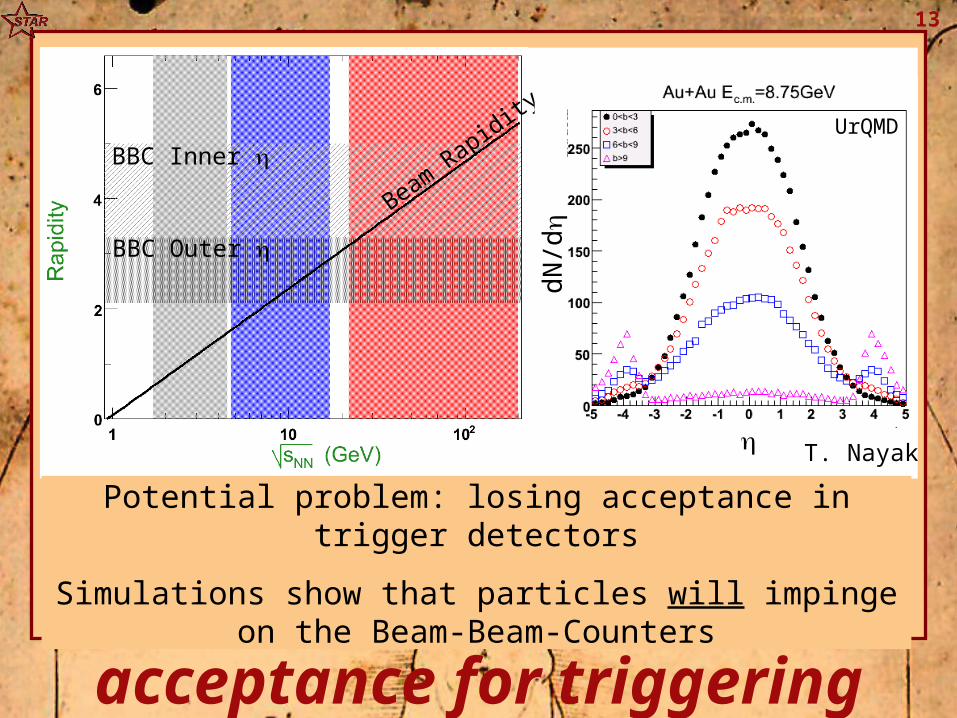
Beam Rapidity
BBC Inner
BBC Outer
UrQMD
dN/d
Potential problem: losing acceptance in trigger detectors
Simulations show that particles will impinge on the Beam-Beam-Counters
T. Nayak
14
triggering
impact paramete
r
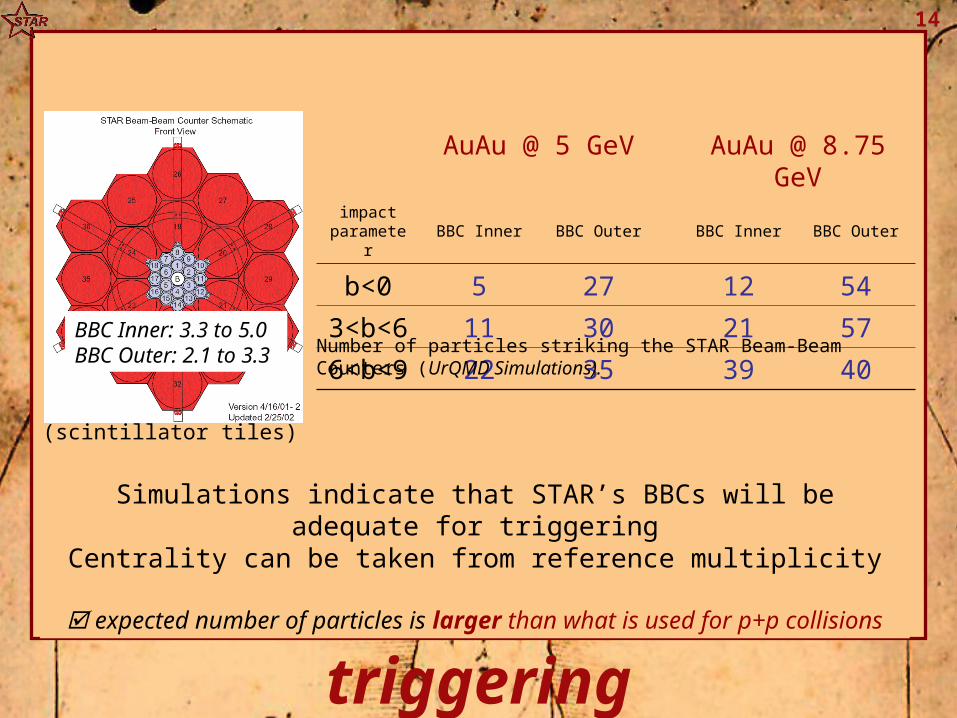
AuAu @ 5 GeV AuAu @ 8.75 GeV
BBC Inner BBC Outer BBC Inner BBC Outer
b<0 5 27 12 54
3<b<6 11 30 21 57
6<b<9 22 35 39 40
BBC Inner: 3.3 to 5.0BBC Outer: 2.1 to 3.3
Number of particles striking the STAR Beam-Beam Counters (UrQMD Simulations).
Simulations indicate that STAR’s BBCs will be adequate for triggering
Centrality can be taken from reference multiplicity
expected number of particles is larger than what is used for p+p collisions
(scintillator tiles)
15
particle identification
log10(p)
log10(dE/dx)
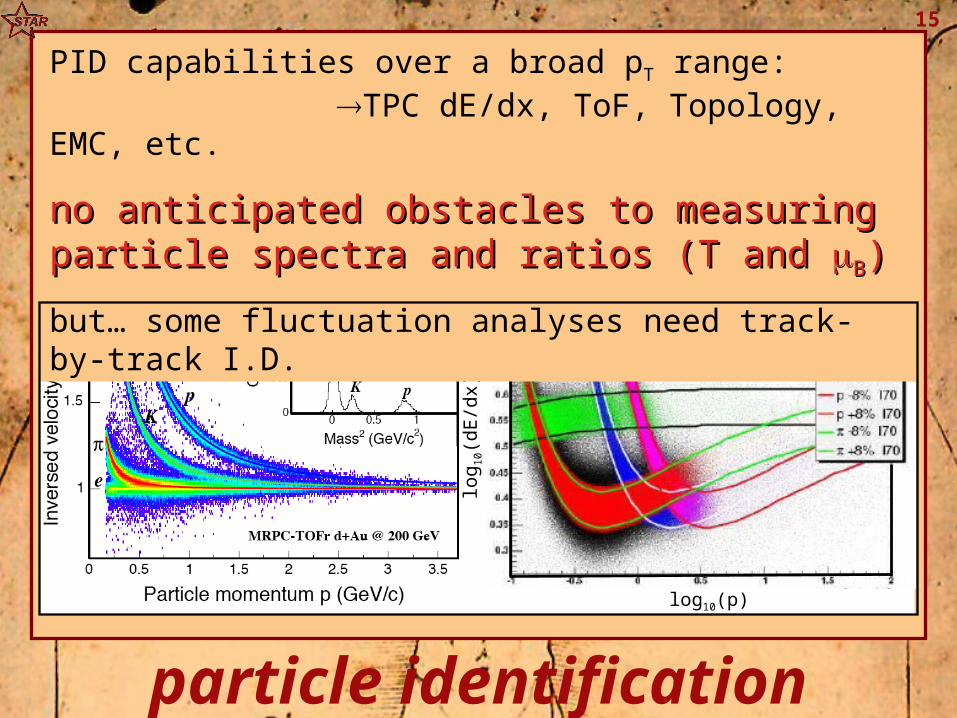
PID capabilities over a broad pT range:TPC dE/dx, ToF, Topology,
EMC, etc.
no anticipated obstacles to measuring no anticipated obstacles to measuring particle spectra and ratios (T and particle spectra and ratios (T and BB))
but… some fluctuation analyses need track-by-track I.D.
16
v2 motivation slide
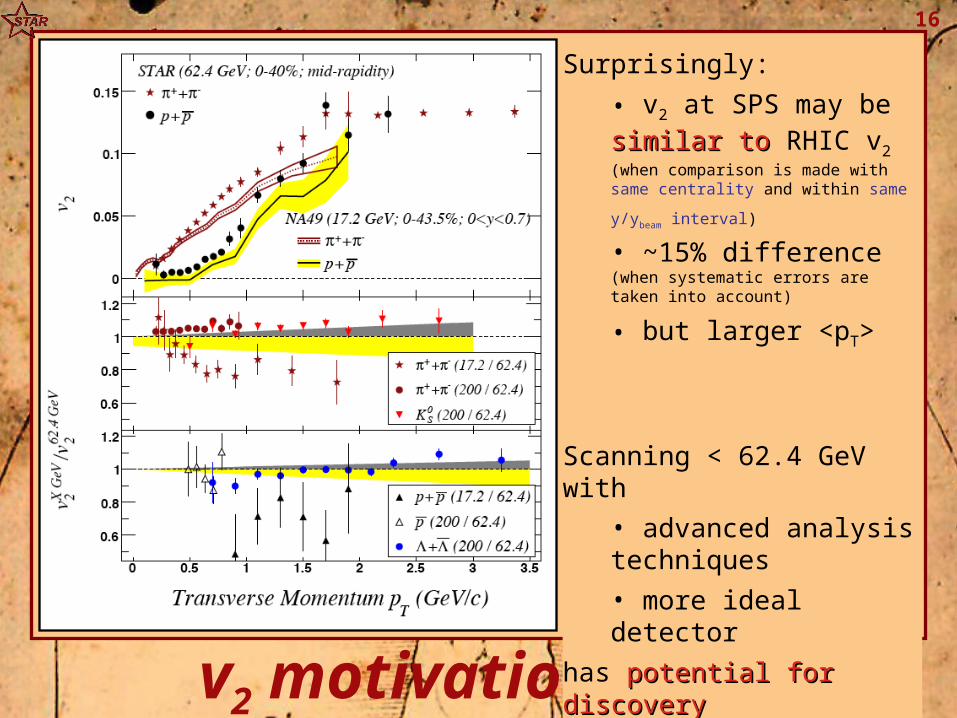
Surprisingly:
• v2 at SPS may be similar tosimilar to RHIC v2 (when comparison is made with same centrality and within same
y/ybeam interval) • ~15% difference (when systematic errors are taken into account)
• but larger <pT>
Scanning < 62.4 GeV with
• advanced analysis techniques
• more ideal detector
has potential for potential for discoverydiscovery
17
v2 motivation slide
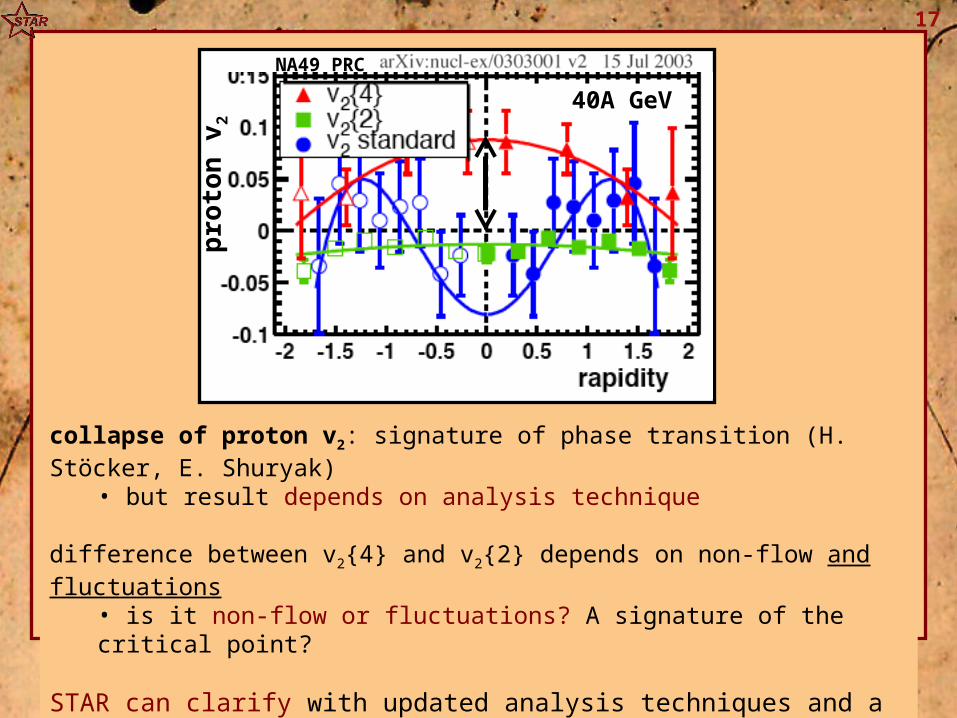
collapse of proton v2: signature of phase transition (H. Stöcker, E. Shuryak)
• but result depends on analysis technique
difference between v2{4} and v2{2} depends on non-flow and fluctuations
• is it non-flow or fluctuations? A signature of the critical point?
STAR can clarify with updated analysis techniques and a more ideal detector
40A GeV
proton v2
NA49 PRC
18
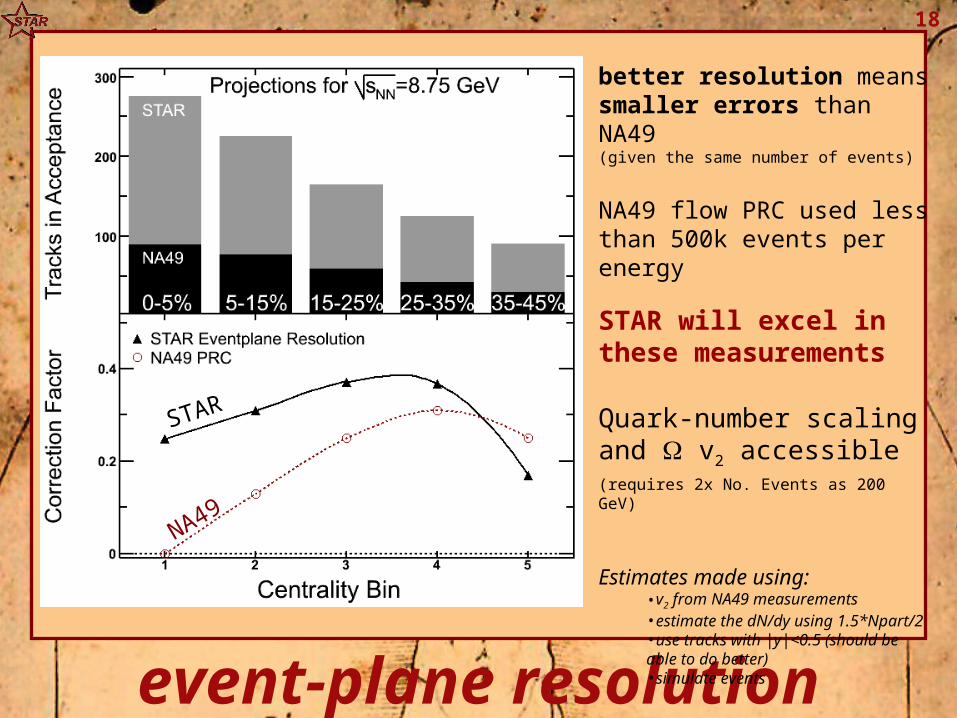
event-plane resolution
better resolution means smaller errors than NA49(given the same number of events)
NA49 flow PRC used less than 500k events per energy
STAR will excel in these measurements
Quark-number scaling and v2 accessible(requires 2x No. Events as 200 GeV)
Estimates made using:•v2 from NA49 measurements•estimate the dN/dy using 1.5*Npart/2•use tracks with |y|<0.5 (should be able to do better)•simulate events
STAR
NA49
19
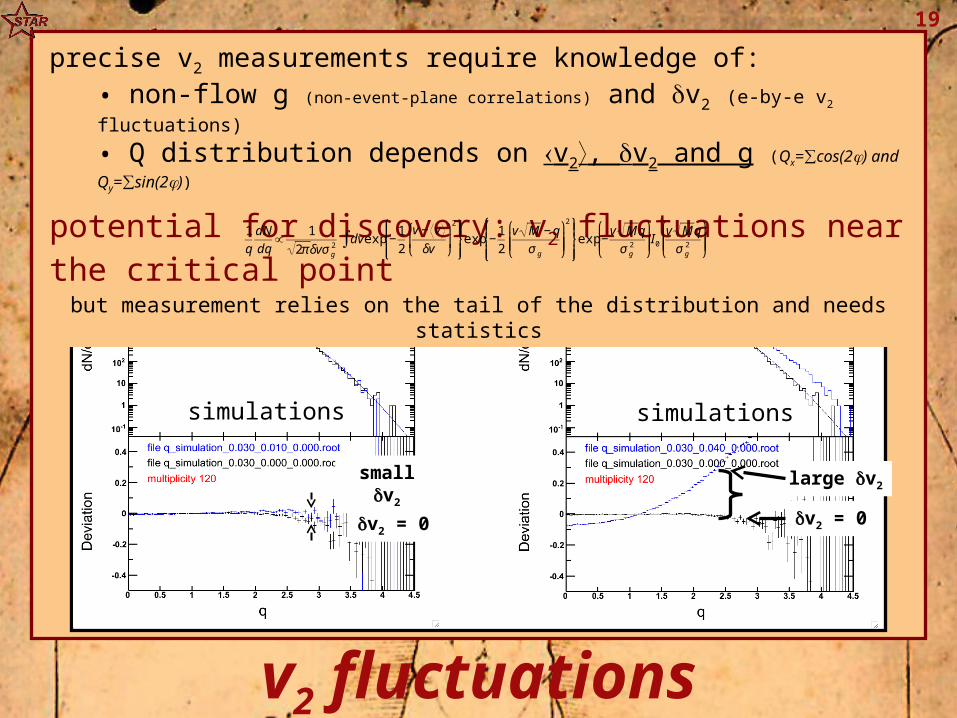
v2 fluctuations
simulations
large v2small v2
v2 = 0 v2 = 0
simulations
precise v2 measurements require knowledge of:• non-flow g (non-event-plane correlations) and v2 (e-by-e v2
fluctuations)
• Q distribution depends on v2, v2 and g (Qx=∑cos(2) and Qy=∑sin(2))
potential for discovery: v2 fluctuations near the critical pointbut measurement relies on the tail of the distribution and needs
statistics€
1
q
dN
dq∝
1
2πδvσ g2dv exp −
1
2
v − v
δv
⎛
⎝ ⎜
⎞
⎠ ⎟
2 ⎧ ⎨ ⎪
⎩ ⎪
⎫ ⎬ ⎪
⎭ ⎪exp −
1
2
v M −q
σ g
⎛
⎝ ⎜ ⎜
⎞
⎠ ⎟ ⎟
2 ⎧ ⎨ ⎪
⎩ ⎪
⎫ ⎬ ⎪
⎭ ⎪exp −
v Mq
σ g2
⎛
⎝ ⎜ ⎜
⎞
⎠ ⎟ ⎟I0v Mq
σ g2
⎛
⎝ ⎜ ⎜
⎞
⎠ ⎟ ⎟∫
20
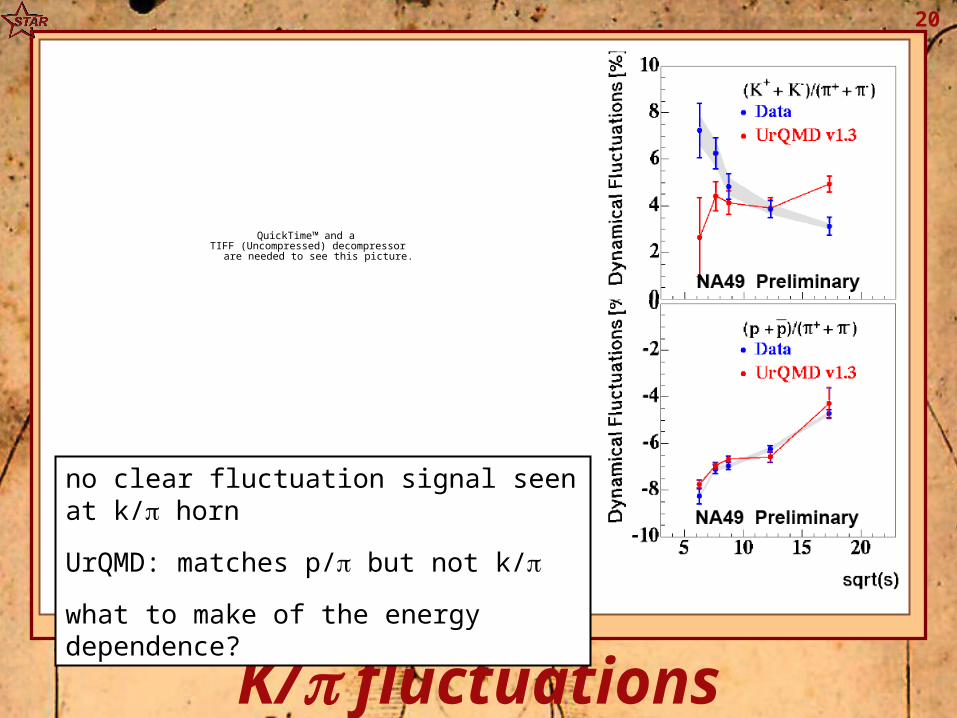
K/ fluctuations
QuickTime™ and aTIFF (Uncompressed) decompressor
are needed to see this picture.
no clear fluctuation signal seen at k/ horn
UrQMD: matches p/ but not k/
what to make of the energy dependence?
21
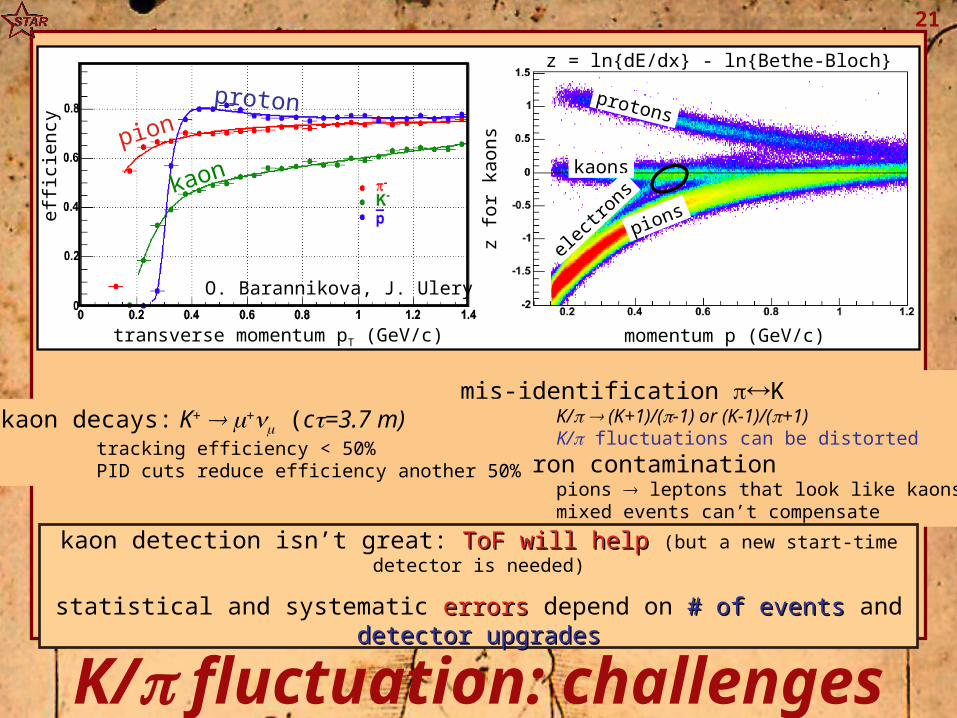
K/ fluctuation: challenges
mis-identification KK/ (K+1)/(-1) or (K-1)/(+1) K/ fluctuations can be distorted
electron contaminationpions leptons that look like kaonsmixed events can’t compensate
kaon decays: K+ +ν (c=3.7 m)tracking efficiency < 50%PID cuts reduce efficiency another 50%
kaon detection isn’t great: ToF will helpToF will help (but a new start-time detector is needed)
statistical and systematic errors errors depend on # of events# of events and detector upgradesdetector upgrades
efficiency
transverse momentum pT (GeV/c)
kaon
proton
pion
z for kaons
momentum p (GeV/c)
z = ln{dE/dx} - ln{Bethe-Bloch}
kaons
pions
protons
electrons
O. Barannikova, J. Ulery
22
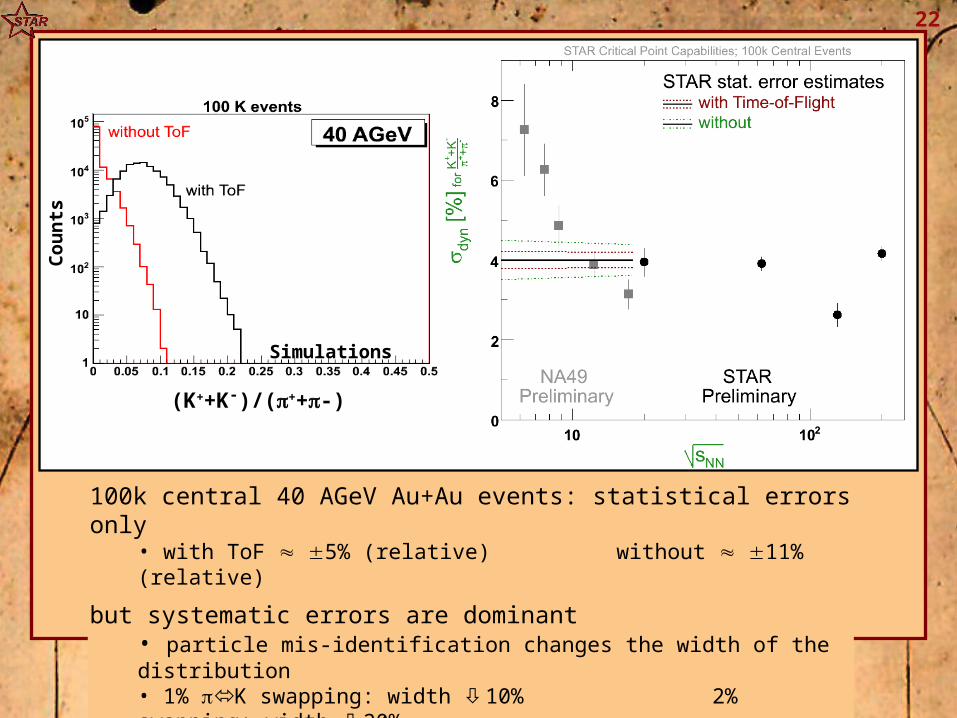
K/ fluct. error estimate
100k central 40 AGeV Au+Au events: statistical errors only
• with ToF 5% (relative) without 11% (relative)
but systematic errors are dominant• particle mis-identification changes the width of the distribution• 1% K swapping: width 10% 2% swapping: width 20%
Counts
Simulations
(K++K-)/(++-)
23
pT fluctuations
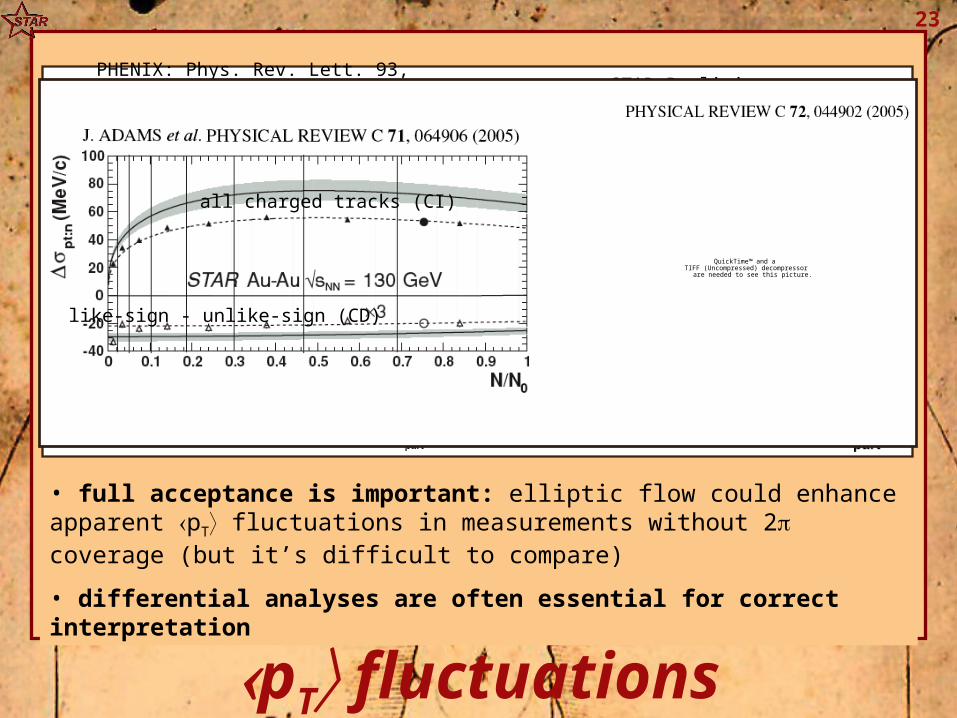
PHENIX: Phys. Rev. Lett. 93, 092301 (2004) STAR Preliminary
• full acceptance is important: elliptic flow could enhance apparent pT fluctuations in measurements without 2 coverage (but it’s difficult to compare)
• differential analyses are often essential for correct interpretation
all charged tracks (CI)
like-sign - unlike-sign (CD)
QuickTime™ and aTIFF (Uncompressed) decompressor
are needed to see this picture.
24
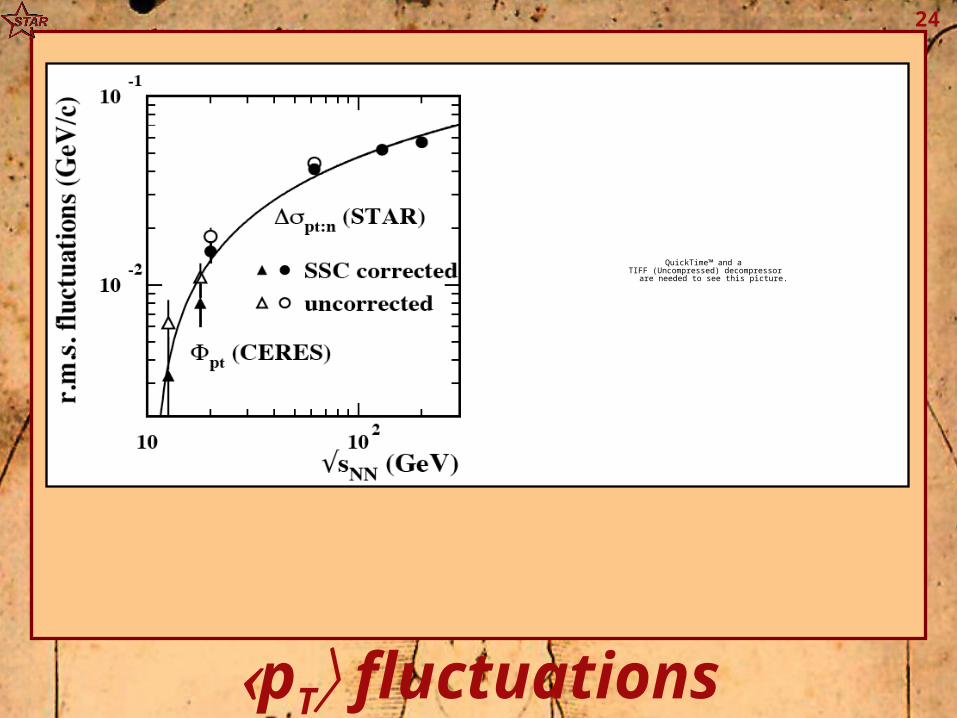
pT fluctuations
QuickTime™ and aTIFF (Uncompressed) decompressor
are needed to see this picture.
25
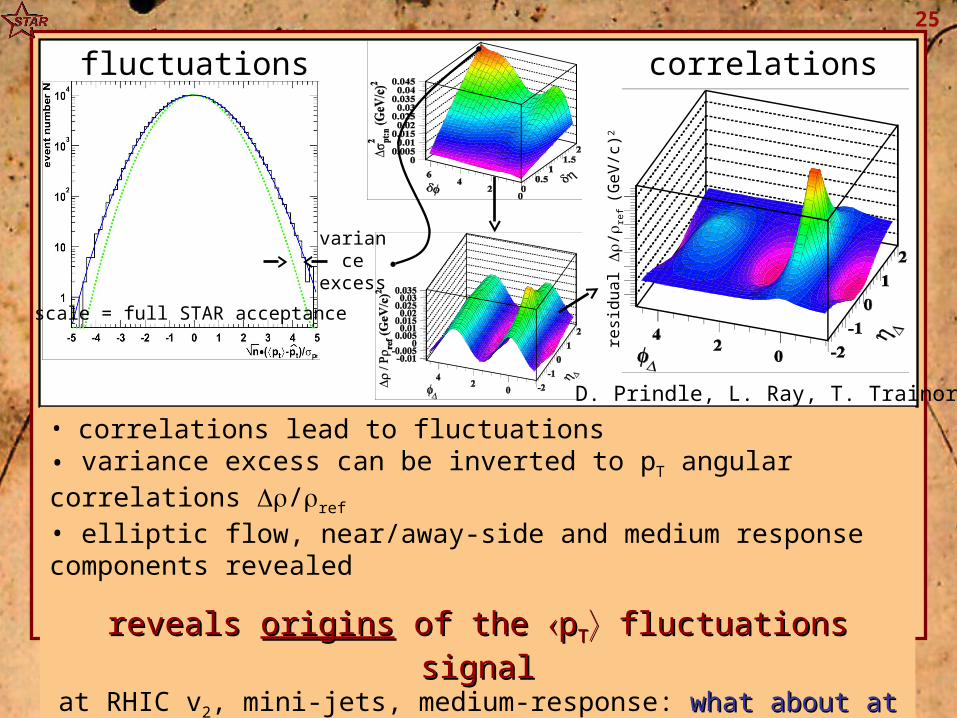
fluctuation inversion
scale = full STAR acceptance
fluctuations correlations
variance
excess
residual / r
ef (GeV/c)2
• correlations lead to fluctuations• variance excess can be inverted to pT angular correlations /ref • elliptic flow, near/away-side and medium response components revealed
reveals reveals originsorigins of the of the ppTT fluctuations fluctuations signalsignal
at RHIC v2, mini-jets, medium-response: what about at what about at 7.6 GeV?7.6 GeV?
D. Prindle, L. Ray, T. Trainor
26
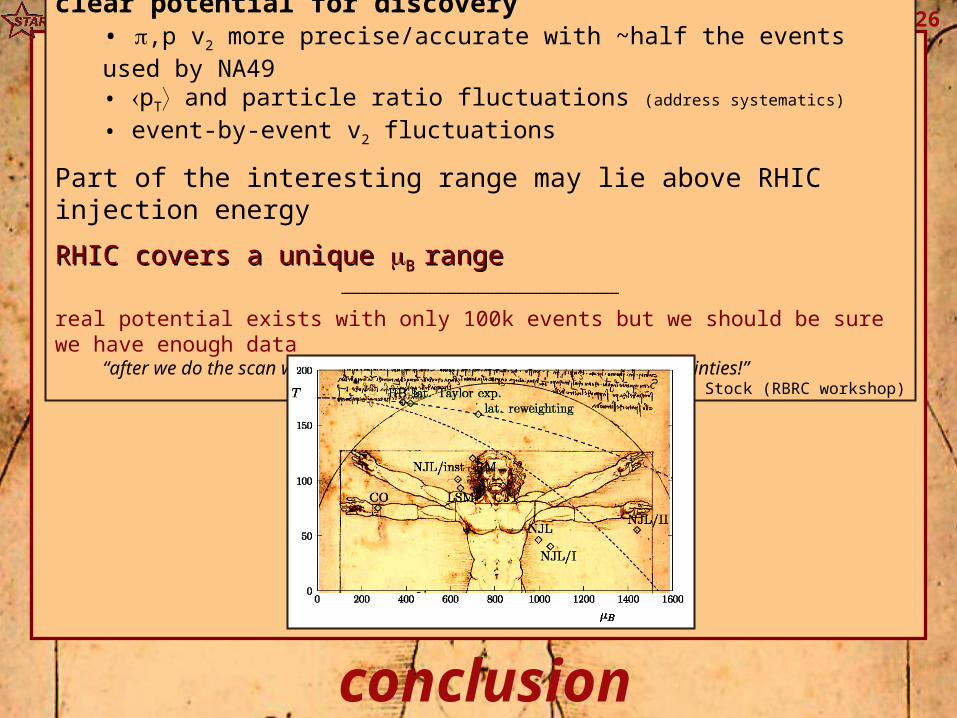
conclusion
clear potential for discovery• ,p v2 more precise/accurate with ~half the events used by NA49• pT and particle ratio fluctuations (address systematics)• event-by-event v2 fluctuations
Part of the interesting range may lie above RHIC injection energy
RHIC covers a unique RHIC covers a unique B B rangerange—————————————————————————————
real potential exists with only 100k events but we should be sure we have enough data
“after we do the scan we don’t want to end up with all the same uncertainties!”
paraphrasing R. Stock (RBRC workshop)

27
thanks
28
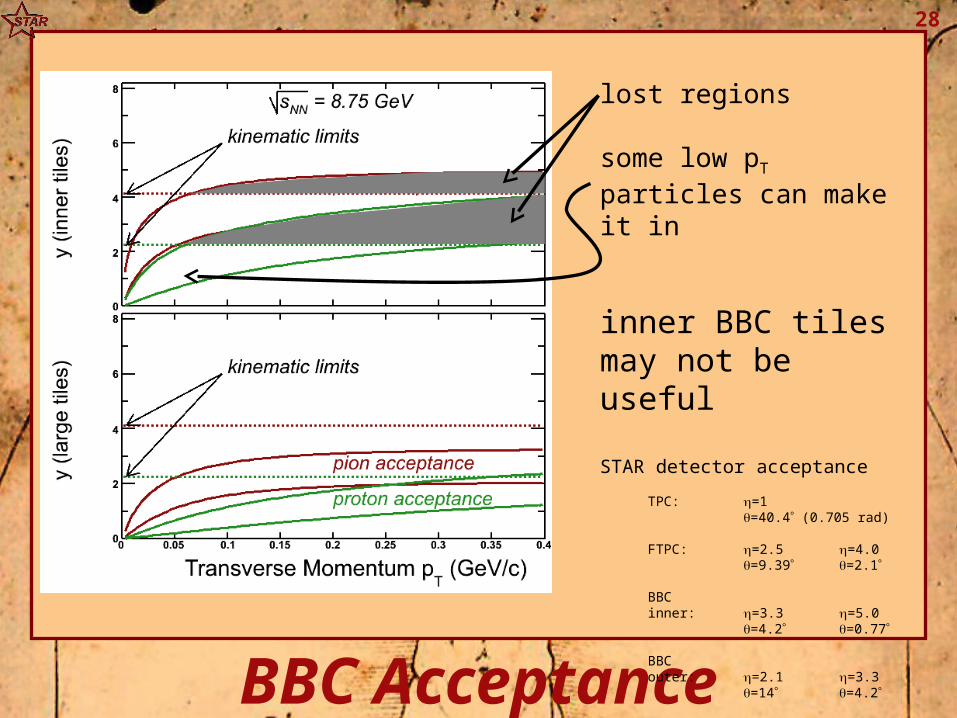
BBC Acceptance
lost regions
some low pT particles can make it in
inner BBC tiles may not be useful
STAR detector acceptance
TPC: =1=40.4 (0.705 rad)
FTPC: =2.5 =4.0=9.39 =2.1
BBC inner: =3.3 =5.0
=4.2 =0.77
BBC outer: =2.1 =3.3
=14 =4.2
29
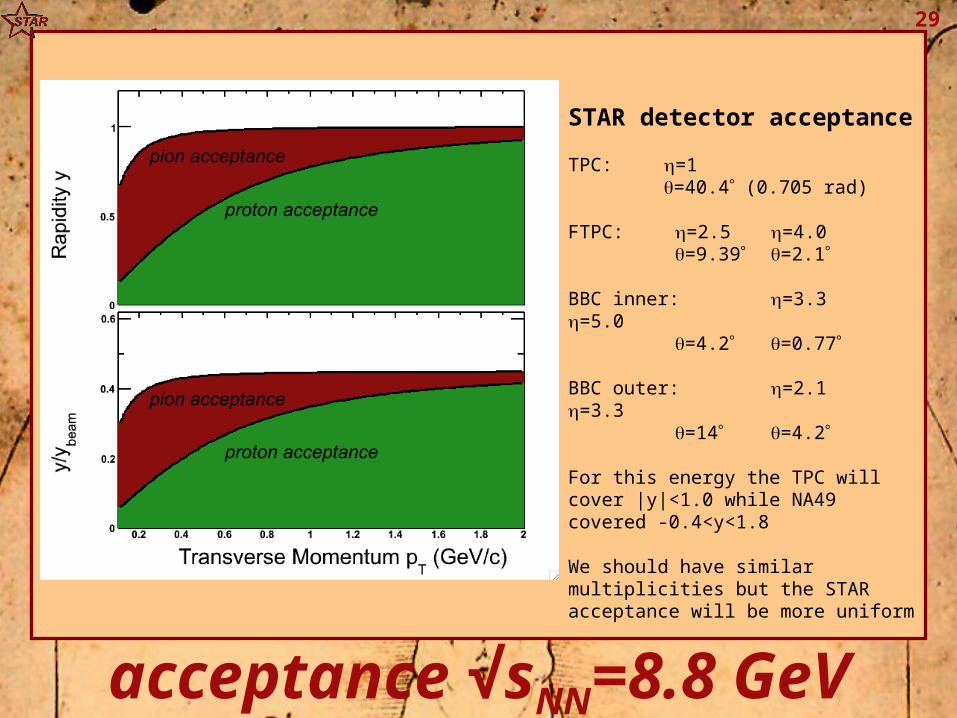
acceptance √sNN=8.8 GeV
STAR detector acceptance
TPC: =1=40.4 (0.705 rad)
FTPC: =2.5 =4.0 =9.39 =2.1
BBC inner: =3.3 =5.0
=4.2 =0.77
BBC outer: =2.1 =3.3
=14 =4.2
For this energy the TPC will cover |y|<1.0 while NA49 covered -0.4<y<1.8
We should have similar multiplicities but the STAR acceptance will be more uniform
30
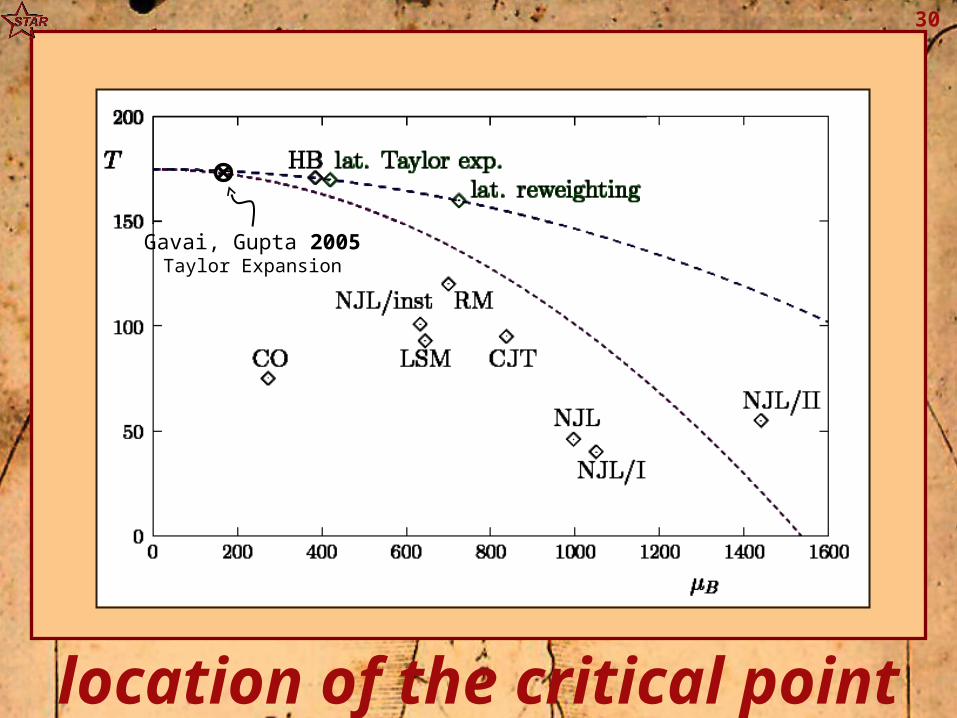
location of the critical point
Gavai, Gupta 2005Taylor Expansion
31
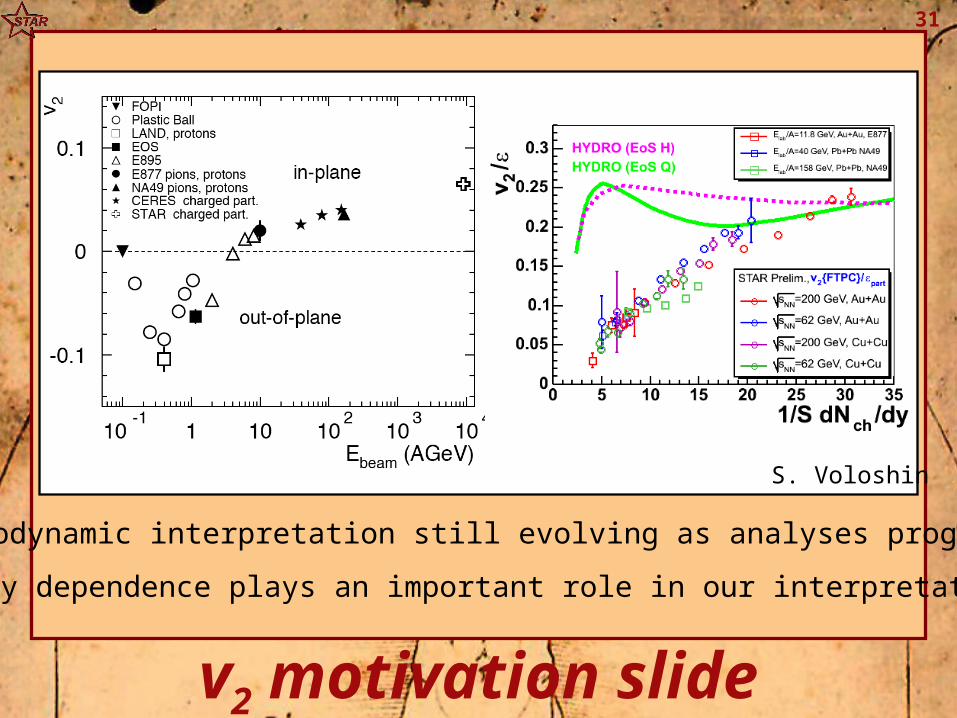
v2 motivation slide
Hydrodynamic interpretation still evolving as analyses progress
Energy dependence plays an important role in our interpretations
S. Voloshin
32
location of the critical point
M. Stephanov: hep-ph/0402115
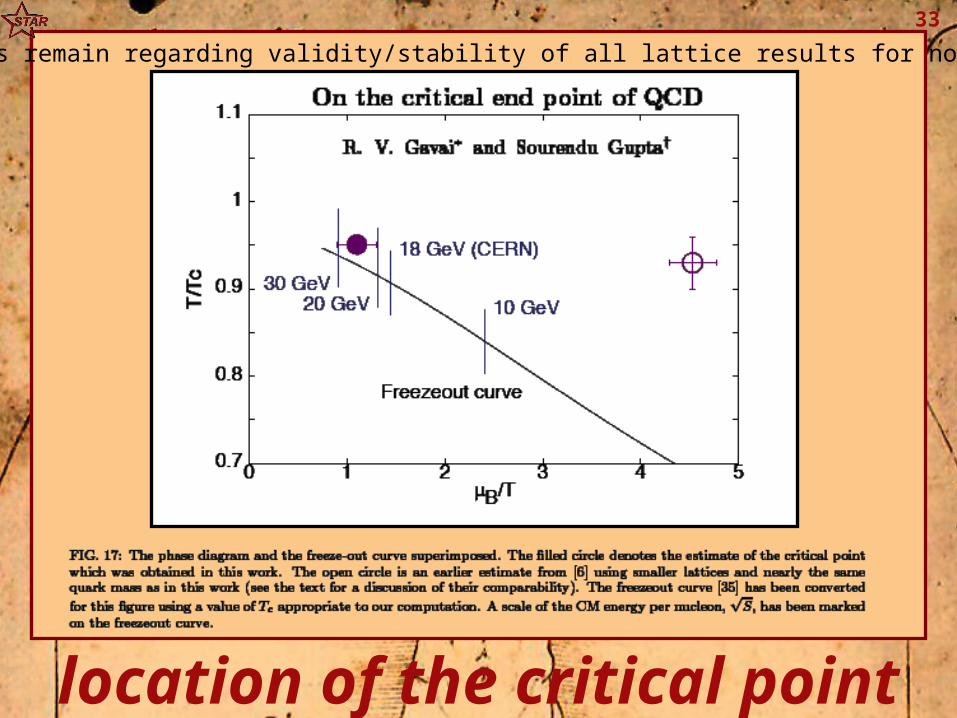
33
location of the critical point
Questions remain regarding validity/stability of all lattice results for non-zero B