Embed Size (px)
Citation preview

STAR JPSS
Monthly Newsletter
October 2016
Program Highlights
Suomi NPP SDR Reprocessing Updates: – At the October STAR JPSS Team Leads Meeting, Changyong Cao, the VIIRS SDR team lead gave a presentation reviewing the progress of the VIIRS SDR reprocessing efforts, which was covered in great detail at the NOAA Suomi NPP reprocessing workshop in May. The efforts for all SDR teams to reprocess data are moving along following the plans laid out after the May workshop.
Figure 1. An example of the benefits of reprocessing. Fires may be missing from the original CLASS data due to missing scan lines or saturation. Both problems are fixed in the reprocessed data.
A note from the Program Manager: October was a special month for the STAR JPSS teams: five years ago Suomi NPP was launched successfully! During this month, STAR JPSS SDR teams demonstrated reprocessed SDRs covering the nearly five year lifetime of the satellite and their potential impacts to EDRs and applications. The teams continued to provide excellent and innovative images of natural events – in this case, Hurricane Matthew, as it headed towards multiple landfalls in the Caribbean and the US East Coast.
On the program side, a major review was held to validate the maturity of several products from the GCOM, NUCAPS, MIRS, Polar Winds, and Land teams that are being produced by NDE. All of the products, with the exception of Vegetation Health, were approved as having reached Validated Maturity. This is expected to be the second to last review of its kind for Suomi NPP products – with the final review of additional advanced MIRS, GCOM products, and NUCAPS trace gas products expected to occur in March 2017.

Figure 2. Suomi NPP VIIRS Infrared image of Category 4 Hurricane Matthew over the Bahamas on October 6, 2016. (VIIRS IR band I-5 at 11.5 µm).
Figure 3. Significant power outage impact due to Hurricane Matthew is shown for the Southeast US Coast. DNB imagery from September 28, before Hurricane Matthew (left), and from October 10, after Hurricane Matthew (center). The right figure is a difference plot of the left and center figure with: Gold = no change, Red = possible outages, Green = “new” lights.
Hurricane Matthew Captured from Suomi NPP VIIRS - As Hurricane Matthew headed towards the East Coast of the US, CIRA/RAMMB’s real-time tropical cyclone page at http://rammb.cira.colostate.edu/products/ tc_realtime/storm.asp?storm_identifier=AL142016 displayed high-resolution imagery of Hurricane Matthew. This RAMMB/CIRA real-time tropical cyclone webpage is a popular webpage for the public as well as for other research institutes and news organizations to go to and to retrieve imagery. The interest in Matthew resulted in 68,515 page views for the period of 28 September through 8 October 2016. In addition to the natural color and rainbow false color VIS/NIR images that are often displayed in the media, the team also produced before

and after DNB images to show the effects of power outages. The DNB images showed that the power outages were worse in the Carolinas than in Florida – largely the reverse of pre-storm predictions due to a last minute eastward shift in the storms course.
Figure 4. VIIRS “Natural Color” RGB composite of high-resolution imagery bands I1, I2 and I3 of Hurricanes Matthew and Nicole (18:10 UTC October 6, 2016). In this composite, clouds topped with ice particles have a bluish color, while lower liquid clouds appear white. At this time, Matthew was classified as a major hurricane with maximum winds of 120 knot, and caused severe damage to the Bahamas.
Figure 5. A photograph taken by Frankie Lucena showing the sky above Hurricane Matthew on October 1, 2016, captured rare red bursts of light, called sprites, as well as faint gravity waves in the sky above it. The photo was taken at October 1, 2016 at 06:56 UTC).

Very rarely seen sprites and atmospheric gravity waves were captured by a photographer in a night-time photograph of Hurricane Matthew while the storm was located south of Haiti. The Huffington Post asked CIRA’s Steve Miller to explain this effect. The article “Rare Photo Captures Sprites, Gravity Waves Over Hurricane Matthew” was published on 4 October 2016. Here is Steve Miller’s explanation:
“During the early hours of Saturday, 1 October 2016, a photographer (Frankie Lucena) based in Cabo Rojo, Puerto Rico aimed his camera to the southwest and captured a rare glimpse of sprites over Hurricane Matthew.
At the time of the photograph, Matthew was offshore of Venezuela/Columbia, and far below the horizon from the vantage point of Puerto Rico. The sprites, which occur in the mesosphere (50-90 km) appear as bright pink, vertically oriented ‘tentacle-like’ structures in the original photo, can occur in response to powerful lightning flashes of positive polarity atop thunderstorms. Typically observed over continental
storms, these sprites are indicative of powerful convection in Hurricane Matthew’s rain bands. An enhanced version of the photograph reveals additional horizontal banded structures above the level of the sprites. These are perturbations of the nightglow layer (85-95 km) caused by upwelling atmospheric gravity wave disturbances. Such gravity waves can be launched by a number of mechanisms, including strong convection. In this case, the most likely source is the same as that of the sprites--Hurricane Matthew. As luck would have it, within a few minutes of Frankie Lucena’s photograph, the Suomi NPP satellite crossed over the region (October 1, 2016 at 06:51 UTC, vs. the photo time of 06:56 UTC).
On this evening the moon was not above the horizon, and the VIIRS DNB Imagery was able to capture the nightglow emissions from these waves. The attached image shows the DNB view of the region, including the concentrically oriented waves emanating from Hurricane Matthew, as well as flashes from lightning which may in fact be associated directly with the sprites observed. The VIIRS DNB provides unprecedented information on atmospheric composition and dynamics that are simply impossible to observe from conventional imaging radiometers.”
These findings were documented in a recent Huffington Post article at:
http://m.huffpost.com/us/entry/us_57f24b98e4b082aad9bbf075
Ocean Color – Can VIIRS captures phytoplankton vertical migration in the northeast Gulf of Mexico? As VIIRS data products are more mature than before, it is time to evaluate its capability for applications, in particular
Figure 6. This figure was composed by Steve Miller (CIRA). The VIIRS DNB satellite image from October 1, 2016 at 06:51 UTC shows the photographer’s location (top right) as well as the site of the gravity waves, lightning flashes and the eye of Hurricane Matthew.

for those applications that are difficult to carry out using MODIS. One such application is diurnal changes of ocean properties as VIIRS can occasionally provide > 1 observation within a day. Here we demonstrate that VIIRS captured vertical migration of Karenia brevis dinoflagellate (responsible for most of Gulf of Mexico’s red tides) during a bloom.
Blue-green band ratio Chl (OC3) and red-green band ratio Chl (RGCI) were derived from VIIRS Rrs. Rrs spectra from representative locations were extracted for further analysis and interpretation.
Figure 7 shows the K. brevis vertical migration with diel cycles in a bloom. This type of behavior is well known from laboratory cultures, but rarely measured in a real environment.
Figure 7. K. brevis vertical migration in diel cycles observed from glider measurements across a bloom in NE Gulf of Mexico between 1 August 2014 (day 213) and 4 August 2014 (day 216). Figure from Hu et al. (2016).
Figure 8. VIIRS RGCI Chl images for two consecutive satellite passes within one day. The pass at 15:41 local time shows higher Chl than the pass at 14:00 local time, possibly due to the vertical migration of K. brevis. RGCI algorithm has been demonstrated in Qi et al. (2015).

The glider measurements showed that K. brevis started to migrate upward after sunrise and migrate downward after sunset, reaching a maximum surface layer during late afternoon. The question is: can VIIRS capture some of the vertical migration behavior?
Figure 8 shows that within 2 hours, VIIRS captured surface Chl changes, with Chl increases in the later pass. This can be explained by K. brevis vertical migration (upward direction) as shown from the glider
K. brevis vertical migration was captured for the first time through synoptic glider measurements. The measurement helps interpret VIIRS observations over the same locations for more than once a day. The two consecutive VIIRS measurements over the known K. brevis bloom region show changes in RGCI Chl and spectra (magnitude and shape) that can all be explained by the vertical migration behavior. However, more cases are required to confirm the preliminary finding here.
Validated Maturity Reviews for SNPP Products in NDE – On October 19, STAR JPSS Management conducted a Validated Maturity readiness review to review several Suomi NPP products including - the suite of products derived from GCOM AMSR-2 Day-1 products (Sea Surface Temperature, Microwave Brightness Temperature, Cloud Liquid Water, Precipitation Type/Rate, Total Precipitable Water, and Sea Surface Wind Speed), OLR and CrIS Ozone Profile products from NUCAPS, the MIRS suite of products (including Moisture Profile, Temperature Profile, Rainfall Rate, Total Precipitable Water, Land Surface Emissivity, Land Surface Temperature, Cloud Liquid Water, Sea Ice Concentration, Snow Cover/Depth, and Snow-Water Equivalent), as well as the VIIRS Vegetation Health, Green Vegetation Fraction, and the Polar Winds products.
The products are all products that are produced on NDE and fell outside of the original domain of the STAR JPSS review process, but are now fully integrated into the program. This review was considered a great success, with all reviewed products except Vegetation Health being declared ready for Validated Maturity. A delta review for Vegetation Health will be held at a later date, as well as a March review for the remaining GCOM and NUCAPS products.
Upcoming Events
GOFC-GOLD Fire Implementation Team meeting and Forest Sat 2016 Conference (Nov. 15-17, Santiago, Chile)
AGU Fall Meeting (Dec 12-16, San Francisco, CA)
AMS Annual Meeting (Jan 22-25, Seattle, WA)
Publications
Aerosols - An article written on the web-based eIDEA tool by A. Huff and S. Kondragunta has been accepted for publication in Eos magazine. This article describes, using the Fort McMurray fire as an example, the eIDEA tool that uses near real time VIIRS aerosol products and how forecasters use the tool in their day to day air quality forecasting of ozone and particulate matter exceedances.
Science and Applications
Cryosphere - New experimental sea ice "trackers" have been added to the Cryosphere Now section of the WMO Global Cryosphere Watch website (globalcryospherewatch.org). Sea ice temperature (Figure 9), albedo, and thickness trackers are derived from the APP-x dataset using the VIIRS Enterprise algorithms. These are
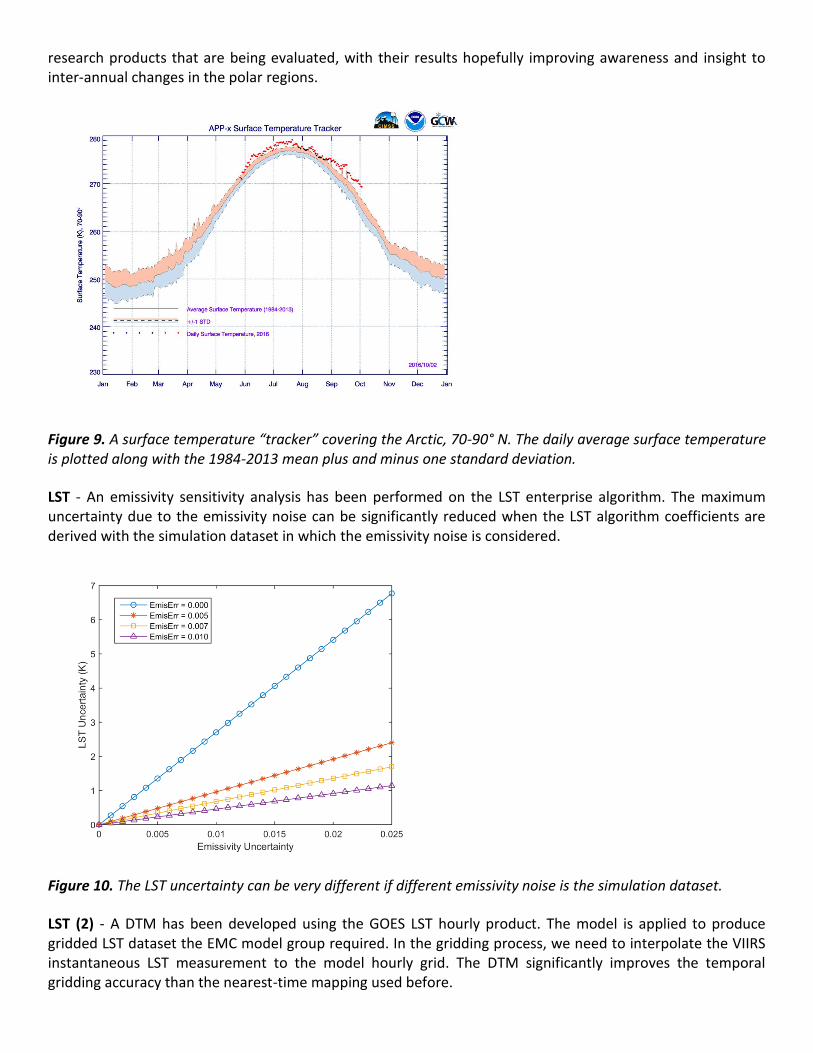
research products that are being evaluated, with their results hopefully improving awareness and insight to inter-annual changes in the polar regions.
Figure 9. A surface temperature “tracker” covering the Arctic, 70-90° N. The daily average surface temperature is plotted along with the 1984-2013 mean plus and minus one standard deviation.
LST - An emissivity sensitivity analysis has been performed on the LST enterprise algorithm. The maximum uncertainty due to the emissivity noise can be significantly reduced when the LST algorithm coefficients are derived with the simulation dataset in which the emissivity noise is considered.
Figure 10. The LST uncertainty can be very different if different emissivity noise is the simulation dataset.
LST (2) - A DTM has been developed using the GOES LST hourly product. The model is applied to produce gridded LST dataset the EMC model group required. In the gridding process, we need to interpolate the VIIRS instantaneous LST measurement to the model hourly grid. The DTM significantly improves the temporal gridding accuracy than the nearest-time mapping used before.

Figure 11. The DTM (red-color curve) derived from GOES hourly LST product is applied to interpolate the VIIRS instantaneous LST measurement (point B) to the hourly gridded (A and C) dataset.
Albedo - The VIIRS albedo production for sea-ice surface has never been updated. The albedo team has started the LUT update for the sea-ice surface, and will have it included in the enterprise albedo algorithm. The first try of this is to apply a LUT that is used for MODIS sensor and convert the LUT to VIIRS sensor. The process outline is illustrated in the following chart:
Figure 12. Flow chart of VIIRS sea-ice surface albedo production, using the MODIS LUT table. The VIIRS LUT for sea-ice surface will be generated also in next phase.
Imagery - S. Miller put together a set of PowerPoint slides to show the improvement in geo-locations with Terrain-Corrected vs ellipsoid geo-locations. The examples will be used to support the proposed change to terrain corrected geo-locations that is currently being worked thru the ADR/CCR process. One of the examples is attached. (S. Miller, C. Seaman, CIRA; W. Straka, CIMSS)

Figure 13. An example of Terrain Corrected vs. Ellipsoid geo-locations, manifested by a shift of terrain at higher elevations, the mountains on both Maui and the Big Island of Hawaii. While hard to see in this side-by-side comparison, an animation of these two images (not possible here in Word) makes the shift of higher elevations very obvious.
GCOM - The AMSR2 sea ice characterization product is generated locally to produce MYI fields. AMSR2 MYI fields are being compared to estimates of MYI from other sources. ASCAT MYI fields were obtained from BYU. These data are provided on 4.45 km polar stereographic grids and provide land, ocean, MYI and first-year ice surface types. The ASCAT data are converted to the 10 km EASE2 grid for comparison to the AMSR2 product.
Figure 14 shows the ASCAT data in its native format and the same data gridded to the 10 km EASE2 grid. Figure 15 shows the AMSR2 multiyear ice field. Figure 16 overlays the ASCAT and AMSR2 multiyear ice products for a qualitative comparison.
This work will continue with more data and a quantitative evaluation of the similarities and differences. Other MYI estimates, such as the Canadian Ice Service ice charts, will eventually be incorporated in the analysis.

Figure 14. Left: ASCAT data in its native format for Julian day 284 of 2012. Right: The ASCAT data reprojected onto the 10 km EASE2 grid.
Figure 15. AMSR2 multiyear ice field as a percentage on the 10 km EASE2 grid.
Figure 16. ASCAT and AMSR2 multiyear ice fields overlayed.

Imagery (2) - NCC imagery covering a large Pacific Northwest storm and the Junkins Fire in Colorado was produced by J. Torres and was then utilized via social media outlets (i.e. Facebook and Twitter) by ‘NOAA Satellites’ and ‘WFO-Pueblo’. This brought more exposure of the utility of NCC to the social media community and potential users (i.e. forecasters). The images of the social media posts are below. A VISIT Meteorological Interpretation Blog on this even is available at http://rammb.cira.colostate.edu/training/visit/blog/ (Jorel Torres, CIRA)
Figure 17. The two social media posts covering NCC imagery of the PNW storm by the ‘NOAA Satellites’ Facebook social media outlet (left) and the Junkins Fire by the ‘NWS-Pueblo’ Twitter account (right).
Meetings and Reviews
Ocean Color - Menghua Wang participated as an Invited Keynote Speaker at the International GOCI Symposium 2016, September 27-30, 2016, Jeju, Republic of Korea. He delivered a presentation, “"Ocean Color Remote Sensing over Open Oceans and Coastal/Inland Waters" which included some of his work with VIIRS.
Other Ocean Color team members also had presentations. An oral presentation was made by SeungHyun Son, “Comparison of GOCI and VIIRS Ocean Color Products in the Western Pacific Region,”
Two posters were presented on applications developed for multiple sensors, including VIIRS, and applied to GOCI data:
Lide Jiang, "Surface Currents in the Bohai Sea Derived from GOCI"
Xiaoming Liu, “Analysis of Ocean Diurnal Variations from the Korean Geostationary Ocean Color Imager Measurements Using the DINEOF Method."
Soundings - Flavio Iturbide-Sanchez Participated at the seminar at School of Superior Studies of Mechanical and Electrical Engineering, held in Mexico City, Mexico, with the invited talk entitled: “Introduction to Satellite Retrieval Systems Developed at NOAA/NESDIS: NUCAPS and MiRS”

Aerosols - EUMETSAT Conference: STAR aerosol team was represented at the EUMETSAT conference with a presentation on "Exceptional Events Monitoring using SNPP VIIRS Aerosol Products". This talk outlined the status of VIIRS aerosol products generated from the new EPS approach and discussed in detail three different exceptional events that led to poor air quality.
Anomalies, Monitoring, and Discrepancy Reports
OMPS - The OMPS SDR team has discovered an anomaly in the Suomi NPP OMPS medium spatial resolution data. In preparation of J1 orbital measurements, the team has collected 50 km × 50 km NP science data through Suomi NPP OMPS diagnostic measurements. Data analysis has been performed over the past week and negative radiance values were discovered. The root cause has been identified that the smear signals in the collected images are the main contributor to the anomaly. The smear is produced by incident light while the already generated image is shifted from the image sensor area to the storage area during an image collection. NASA is currently working with the sensor vendor to reduce the smear impact.
OMPS SDR team has observed another issue with the RDR content for APID11 Ephemeris data in 20-record spacecraft diary aggregations placed in the OMPS Nadir Mapper granules. The issue is seen in SDR reprocessing where RDR granules are encountered which do not contain all of the ephemeris values needed to process/geolocate the Earth-view radiance data. The OMPS LP has the same issue as well where some RDR's have only two consecutive spacecraft diary collections (most have three). The two collections often do not cover the range of times for the second 19-second scan in an RDR. A DR 8254 is issued and to be discussed on October 12 at DRAT.
Clouds - The OSPO team has found some differences in a test data set where the VCM results were being compared between Block 1.2 (e.g. operations) and Block 2.0. They reported relatively small but nevertheless noticeable differences in the Northern Hemisphere, but more severe differences in the Southern Hemisphere.
For identifying the source of the differences we used their data from October 4, 2016 which comprised one entire orbit, from 17:00-18:40 UTC. The Cloud team received VCM files of both Block 1.2 and 2.0; no geolocation or SDR data were available.
The overall results found three external conditions that impacted the Block 2.0 VCM in a negative manner. The team identified issues with band M7, which the SDR team later confirmed as bad (all negative radiances) for all daytime granules in the Block 2.0 output. The snow/ice coverage in the NH was older than that used with Block 2.0, though the differences tended to vary with the granule. Major issues were seen with snow/ice in the SH, indicative of either a bad input or, more likely, a mapping issue. This rendered the Antarctica cloud mask from Block 2.0 as fundamentally useless.
So there are three identifiable issues with the VCM from Block 2.0, tied to input data to the VCM itself: bad M7, old snow/ice in the NH, and unrealistic snow/ice in the SH. The first two, theoretically, should not be difficult to address. The latter is more concerning; no operational snow/ice mask would be this bad at the source. As a final point, the asymmetry of the available NH/SH cases explains why OSPO found more differences in the SH. If all of the Block 2.0 daytime NH granules were available, it is highly likely both hemispheres would exhibit differences approaching 10% due to the imbalance.
CrIS - Informal telecom meeting was held about the FCE module latency issue. A possible mitigation is to rewrite the software that would detect and reject the spectra with FCE without applying the FCE correction.
Acronym Index
STAR - Center for Satellite Applications and Research JPSS - Joint Polar Satellite System SDR - Sensor Data Record EDR - Environmental Data Record GCOM - Global Change Observation Mission NUCAPS - NOAA Unique ATMS/CrIS Processing System MIRS - Microwave Integrated Retrieval System NDE - NPP Data Exploitation CIRA - Cooperative Institute for Research in the Atmosphere RAMBB - Regional and Mesoscale Meteorology Branch RGB - red-green-blue UTC - Universal Coordinated Time NPP - National Polar-orbiting Partnership DNB - Day/Night Band VIIRS - Visible Infrared Imaging Radiometer Suite OC3 - 3-band ocean color algorithm RGCI - red-green chlorophyll index RRs - remote sensing reflectances MODIS - Moderate-resolution Imaging Spectroradiometer AMSR - Advanced Microwave Scanning Radiometer OLR - Outgoing Longwave Radiation CrIS - Crosstrack Infrared Sounder GOFC-GOLD - Global Observation of Forest and Land Cover Dynamics AGU - American Geophysical Union AMS - American Meteorological Society eIDEA - enhanced Infusing Satellite Data into Environmental Applications AVHRR - Advanced Very-High Resolution Radiometer APP-x - AVHRR Polar Pathfinder-Extended LST - Land Surface Temperature DTM - diurnal temperature model GOES - Geostationary Operational Environmental Satellite EMC - Environmental Modeling Center LUT - lookup table ADR - Algorithm Discrepancy Report CCR - Code Change Request CIMSS - Cooperative Institute for Meteorological Satellite Studies
MYI - multi-year ice ASCAT - Advanced Scatterometer BYU - Brigham Young University EASE - Equal-Area Scalable Earth NCC - Near-Constant Contrast PNW - Pacific Northwest VISIT - Virtual Institute for Satellite Integration Training GOCI - Geostationary Ocean Color Imager NESDIS - National Environmental Satellite, Data, and Information Service EUMETSAT - European Organization for the Exploitation for Meteorological Satellites EPS - Enterprise Processing System CSU - Colorado State University OMPS - Ozone Mapping Profiler Suite J1 - JPSS-1 RDR - Raw Data Record APID - Application Identification LP - Limb Profiler NP - Nadir Profiler DRAT - Discrepancy Report Action Team OSPO - Office of Satellite and Product Operations VCM - VIIRS Cloud Mask FCE - Fringe Count Error ATMS - Advanced Technology Microwave Sounder NOAA - National Oceanic and Atmospheric Administration