Embed Size (px)
Citation preview
arX
iv:1
305.
5849
v1 [
astr
o-ph
.CO
] 2
4 M
ay 2
013
Mon. Not. R. Astron. Soc. 000, 1–12 (2011) Printed 12 April 2018 (MN LATEX style file v2.2)
Star-forming Galactic Contrails at z=3.2 as a Source of
Metal Enrichment and Ionizing Radiation⋆
Michael Rauch1, George D. Becker2, Martin G. Haehnelt,2, Jean-Rene Gauthier31Carnegie Observatories, 813 Santa Barbara Street, Pasadena, CA 91101, USA2Institute of Astronomy and Kavli Institute for Cosmology, Cambridge University, Madingley Road, Cambridge CB30HA, UK3California Institute of Technology, Pasadena, CA 91125, USA
12 April 2018
ABSTRACT
A spectroscopically detected Lyman α emitting halo at redshift 3.216 in the GOODS-N field is found to reside at the convergence of several Lyα filaments. HST images showthat some of the filaments are inhabited by galaxies. Several of the galaxies in the fieldhave pronounced head-tail structures, which are partly aligned with each other. Theblue colors of most tails suggest the presence of young stars, with the emission from atleast one of the galaxies apparently dominated by high equivalent width Lyα. Faint,more diffuse, and similarly elongated, apparently stellar features, can be seen over anarea with a linear extent of at least 90 kpc. The region within several arcseconds of thebrightest galaxy exhibits spatially extended emission by HeII, NV and various lowerionization metal lines. The gas-dynamical features present are strongly reminiscentof ram-pressure stripped galaxies, including evidence for recent star formation in thestripped contrails. Spatial gradients in the appearance of several galaxies may representa stream of galaxies passing from a colder to a hotter intergalactic medium. Thestripping of gas from the in-falling galaxies, in conjunction with the occurrence of starformation and stellar feedback in the galactic contrails suggests a mechanism for themetal enrichment of the high redshift intergalactic medium that does not depend onlong-range galactic winds, at the same time opening a path for the escape of ionizingradiation from galaxies.
Key words:galaxies: halos – galaxies: interactions – galaxies: evolution – galaxies: intergalacticmedium –(cosmology:) diffuse radiation
1 INTRODUCTION
Long slit, spectroscopic blind surveys targeting the HI Lyαemission line have the potential to deliver detailed and other-wise unavailable insights into the gas dynamics and, in con-junction with deep, space-based imaging, the star-gas inter-actions in proto-galactic halos and the intergalactic medium.Several surveys of this kind (Rauch et al 2008, Rauch et al2011, paper I; Rauch et al 2013a, paper II; and Rauch et al2013b, paper III) have discovered a distinct subpopulationof of extended, asymmetric Lyα emitters at z ∼ 3, with acomoving space density on the order of 10−3 Mpc−3 and typ-
⋆ The data presented herein were obtained at the W.M. KeckObservatory, which is operated as a scientific partnership amongthe California Institute of Technology, the University of Califor-nia and the National Aeronautics and Space Administration. TheObservatory was made possible by the generous financial supportof the W.M. Keck Foundation.
ical observed line fluxes of a few times 10−17erg cm−2 s−1.With a large number of processes capable of producing Lyαradiation, one may expect the emitters to be drawn from ahighly inhomogeneous group of objects. However, the selec-tion by Lyα emission is likely to favor galaxies in certainphases of their formation, when the stellar populations andgas dynamics are particularly conducive to the productionand escape of Lyα photons. The peculiar spatial distributionand clustering behaviour of Lyα emitters suggests that en-vironmental effects and interactions may play an importantrole in determining whether a galaxy appears as a Lyα emit-ter (e.g., Hamana et al 2004; Hayashino et al 2004; Kovac etal 2007; Cooke et al 2010, 2013; Zheng et al 2011; Matsudaet al 2012). Indeed, all four extended emitters described sofar in the papers in this series exhibit signs of interactions.
The duration of the processes leading to the produc-tion of ionizing radiation (e.g., the lifetimes of massivestars, AGN activity), as well as the astrophysical timescalesrelevant for the emission of Lyα in high redshift gaseous
c© 2011 RAS
2 Michael Rauch et al.
halos (recombination- and resonance-line radiative-transfertime scales) tend to be short compared to the dynamicaltimescales and life times of the general stellar population.Thus the spectroscopic detection of such a halo amountsto a ”snapshot” of a particularly interactive phase in theirformation, illuminated by a ”flash” of Lyα emission.
Among those extended Lyα emitters published to date,the first one showed diffuse stellar features, in addition toa clear detection of the infall of cold gas into an ordinaryhigh redshift galaxy (paper I). Paper II described what maybe a Milky-way-sized halo with multiple galaxies hostingdisturbed, partly young stellar populations. A thin filamentapparently dominated by high equivalent width Lyα emis-sion may reflect recent intra-halo star formation in a tidaltail or in the wake of a satellite galaxy. The third object,revealing the only case in this sample clearly related to non-stellar processes, is an AGN illuminating a satellite galaxy,possibly triggering the formation of very young stars in itshalo (paper III). The object examined in the present paperis a large halo surrounded by Lyα filaments illuminated bya group of distorted, mostly blue galaxies. As we shall arguebelow, the interaction in this case appears to be between thegalaxies and a gaseous medium through which they move,and which appears to strip off part of their gas and inducestar formation in their wake.
The observations are described in the next section, fol-lowed by a description of the galaxies coinciding with thegaseous halo. The presence of spatially extended metal emis-sion, the nature of the Lyα filaments and the energetics ofthe emission are then discussed. The paper concludes witha discussion of the likely nature of the phenomenon andits significance for the metal enrichment of the intergalacticmedium and for the escape of photons responsible for itsionization.
2 OBSERVATIONS
The observations consist of a long slit, spectroscopic blindsurvey, with the slit positioned in precise N-S orientation onthe object J123647.05+621237.2 in the Hubble Deep FieldNorth (HDFN). Data were taken with the LRIS (Oke etal 1995; McCarthy et al 1998, Steidel et al 2004) B and Rarms and the D560 dichroic, using the 600/4000 grism in 2x2binning (blue side) and the 600/7500 grating in 1x1 binning(red side), through a custom long slit built from two slitsegments with a combined size of 2” × 430”. Total exposuretimes of 35.8 hours in the blue and 35 hours in the redarm of LRIS were obtained in March 2008, May 2008, andApril 2009. The resulting 1-σ surface brightness detectionlimit, measured for a 1−⊓⊔” wide aperture, is approximately1.1× 10−19 erg cm−2 s−1⊓⊔”.
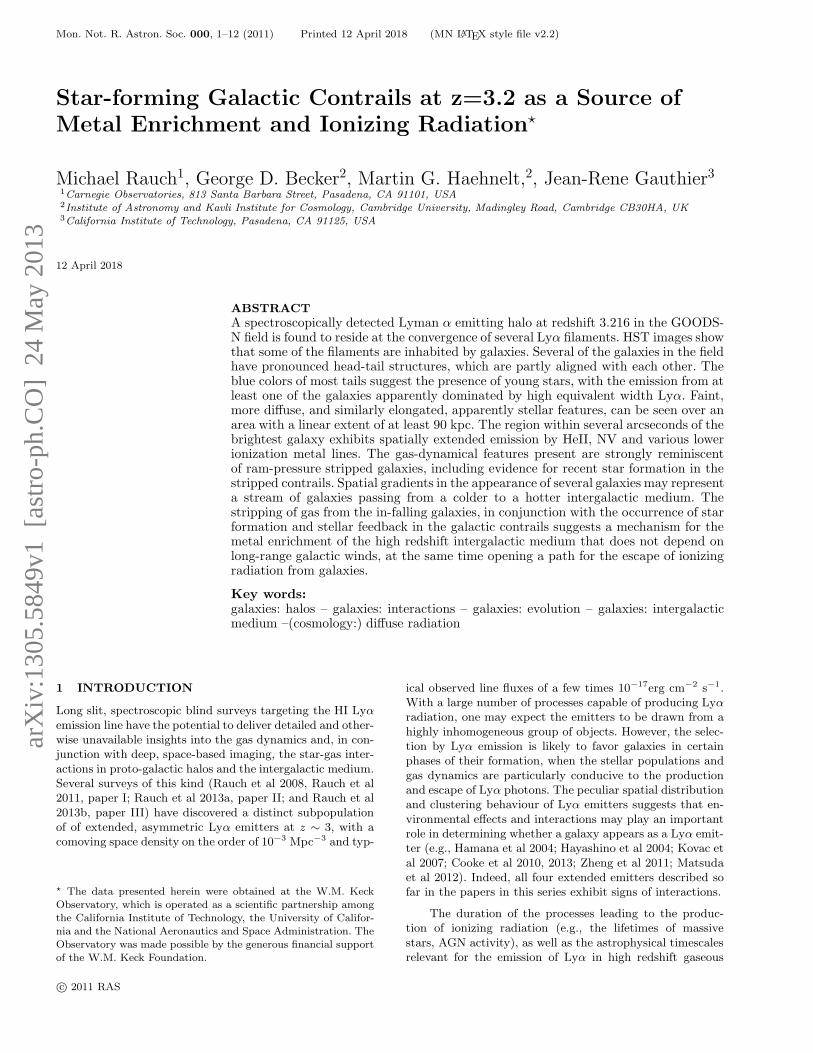
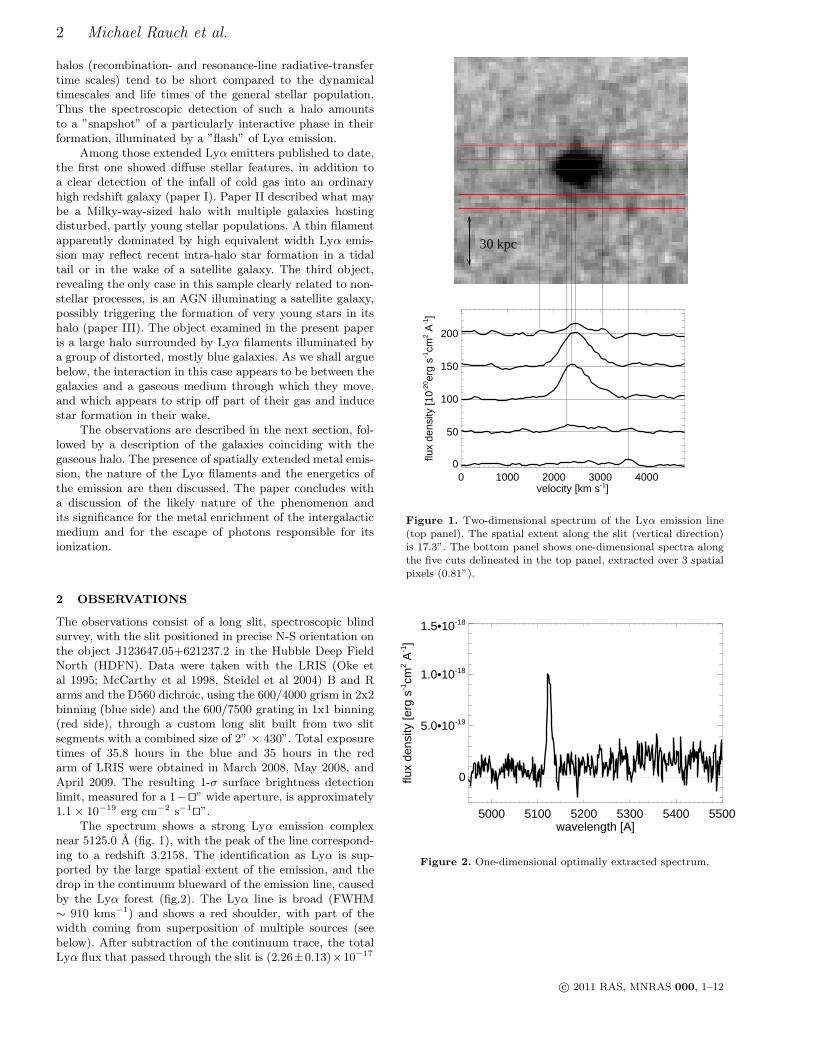
The spectrum shows a strong Lyα emission complexnear 5125.0 A (fig. 1), with the peak of the line correspond-ing to a redshift 3.2158. The identification as Lyα is sup-ported by the large spatial extent of the emission, and thedrop in the continuum blueward of the emission line, causedby the Lyα forest (fig.2). The Lyα line is broad (FWHM∼ 910 kms−1) and shows a red shoulder, with part of thewidth coming from superposition of multiple sources (seebelow). After subtraction of the continuum trace, the totalLyα flux that passed through the slit is (2.26±0.13)×10−17
0 1000 2000 3000 4000velocity [km s-1]
0
50
100
150
200
flux
dens
ity [1
0-20 er
g s-1
cm2 A
-1]
30 kpc
Figure 1. Two-dimensional spectrum of the Lyα emission line(top panel). The spatial extent along the slit (vertical direction)is 17.3”. The bottom panel shows one-dimensional spectra alongthe five cuts delineated in the top panel, extracted over 3 spatialpixels (0.81”).
5000 5100 5200 5300 5400 5500wavelength [A]
0
5.0•10-19
1.0•10-18
1.5•10-18
flux
dens
ity [e
rg s
-1cm
2 A-1]
Figure 2. One-dimensional optimally extracted spectrum.
c© 2011 RAS, MNRAS 000, 1–12
Star-forming Galactic Contrails 3
30 kpc
E
N
γδ
α9
10εζ
12
3
4
5678
β
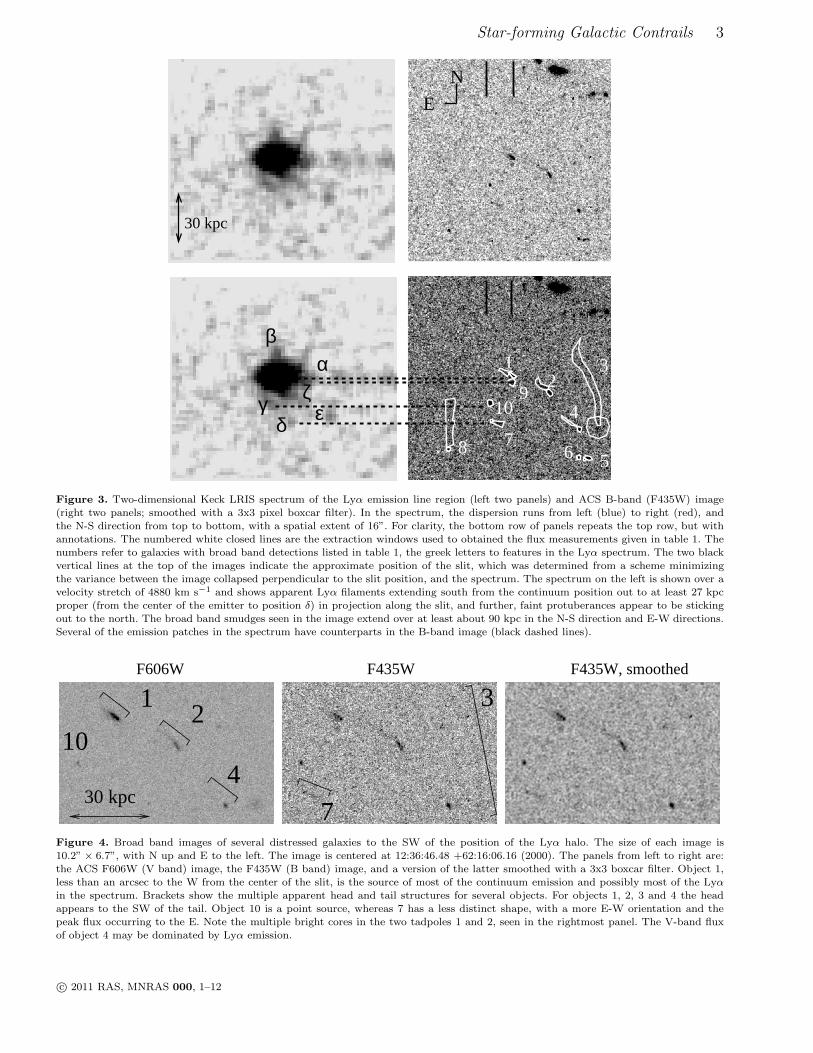
Figure 3. Two-dimensional Keck LRIS spectrum of the Lyα emission line region (left two panels) and ACS B-band (F435W) image(right two panels; smoothed with a 3x3 pixel boxcar filter). In the spectrum, the dispersion runs from left (blue) to right (red), andthe N-S direction from top to bottom, with a spatial extent of 16”. For clarity, the bottom row of panels repeats the top row, but withannotations. The numbered white closed lines are the extraction windows used to obtained the flux measurements given in table 1. Thenumbers refer to galaxies with broad band detections listed in table 1, the greek letters to features in the Lyα spectrum. The two blackvertical lines at the top of the images indicate the approximate position of the slit, which was determined from a scheme minimizingthe variance between the image collapsed perpendicular to the slit position, and the spectrum. The spectrum on the left is shown over avelocity stretch of 4880 km s−1 and shows apparent Lyα filaments extending south from the continuum position out to at least 27 kpcproper (from the center of the emitter to position δ) in projection along the slit, and further, faint protuberances appear to be stickingout to the north. The broad band smudges seen in the image extend over at least about 90 kpc in the N-S direction and E-W directions.Several of the emission patches in the spectrum have counterparts in the B-band image (black dashed lines).
F606W F435W F435W, smoothed
4
3
7
210
1
30 kpc
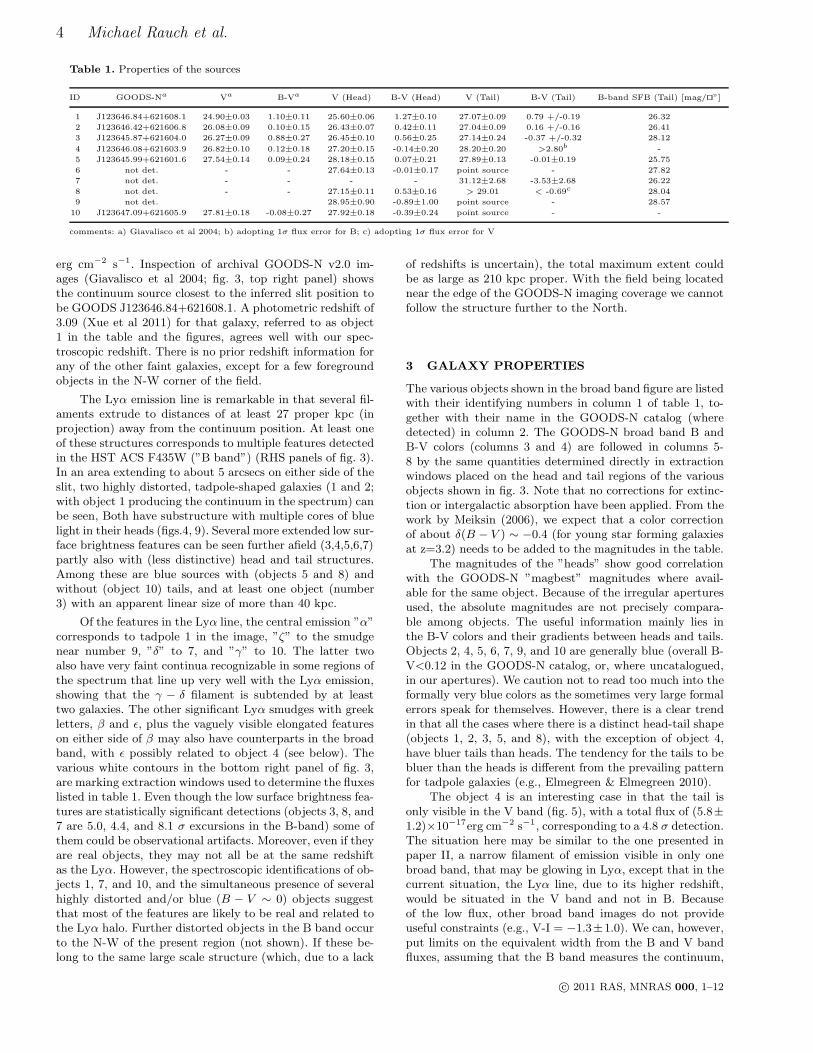
Figure 4. Broad band images of several distressed galaxies to the SW of the position of the Lyα halo. The size of each image is10.2” × 6.7”, with N up and E to the left. The image is centered at 12:36:46.48 +62:16:06.16 (2000). The panels from left to right are:the ACS F606W (V band) image, the F435W (B band) image, and a version of the latter smoothed with a 3x3 boxcar filter. Object 1,less than an arcsec to the W from the center of the slit, is the source of most of the continuum emission and possibly most of the Lyαin the spectrum. Brackets show the multiple apparent head and tail structures for several objects. For objects 1, 2, 3 and 4 the headappears to the SW of the tail. Object 10 is a point source, whereas 7 has a less distinct shape, with a more E-W orientation and thepeak flux occurring to the E. Note the multiple bright cores in the two tadpoles 1 and 2, seen in the rightmost panel. The V-band fluxof object 4 may be dominated by Lyα emission.
c© 2011 RAS, MNRAS 000, 1–12
4 Michael Rauch et al.
Table 1. Properties of the sources
ID GOODS-Na Va B-Va V (Head) B-V (Head) V (Tail) B-V (Tail) B-band SFB (Tail) [mag/⊓⊔”]
1 J123646.84+621608.1 24.90±0.03 1.10±0.11 25.60±0.06 1.27±0.10 27.07±0.09 0.79 +/-0.19 26.32
2 J123646.42+621606.8 26.08±0.09 0.10±0.15 26.43±0.07 0.42±0.11 27.04±0.09 0.16 +/-0.16 26.41
3 J123645.87+621604.0 26.27±0.09 0.88±0.27 26.45±0.10 0.56±0.25 27.14±0.24 -0.37 +/-0.32 28.12
4 J123646.08+621603.9 26.82±0.10 0.12±0.18 27.20±0.15 -0.14±0.20 28.20±0.20 >2.80b -
5 J123645.99+621601.6 27.54±0.14 0.09±0.24 28.18±0.15 0.07±0.21 27.89±0.13 -0.01±0.19 25.75
6 not det. - - 27.64±0.13 -0.01±0.17 point source - 27.82
7 not det. - - - - 31.12±2.68 -3.53±2.68 26.22
8 not det. - - 27.15±0.11 0.53±0.16 > 29.01 < -0.69c 28.04
9 not det. 28.95±0.90 -0.89±1.00 point source - 28.57
10 J123647.09+621605.9 27.81±0.18 -0.08±0.27 27.92±0.18 -0.39±0.24 point source - -
comments: a) Giavalisco et al 2004; b) adopting 1σ flux error for B; c) adopting 1σ flux error for V
erg cm−2 s−1. Inspection of archival GOODS-N v2.0 im-ages (Giavalisco et al 2004; fig. 3, top right panel) showsthe continuum source closest to the inferred slit position tobe GOODS J123646.84+621608.1. A photometric redshift of3.09 (Xue et al 2011) for that galaxy, referred to as object1 in the table and the figures, agrees well with our spec-troscopic redshift. There is no prior redshift information forany of the other faint galaxies, except for a few foregroundobjects in the N-W corner of the field.
The Lyα emission line is remarkable in that several fil-aments extrude to distances of at least 27 proper kpc (inprojection) away from the continuum position. At least oneof these structures corresponds to multiple features detectedin the HST ACS F435W (”B band”) (RHS panels of fig. 3).In an area extending to about 5 arcsecs on either side of theslit, two highly distorted, tadpole-shaped galaxies (1 and 2;with object 1 producing the continuum in the spectrum) canbe seen, Both have substructure with multiple cores of bluelight in their heads (figs.4, 9). Several more extended low sur-face brightness features can be seen further afield (3,4,5,6,7)partly also with (less distinctive) head and tail structures.Among these are blue sources with (objects 5 and 8) andwithout (object 10) tails, and at least one object (number3) with an apparent linear size of more than 40 kpc.
Of the features in the Lyα line, the central emission ”α”corresponds to tadpole 1 in the image, ”ζ” to the smudgenear number 9, ”δ” to 7, and ”γ” to 10. The latter twoalso have very faint continua recognizable in some regions ofthe spectrum that line up very well with the Lyα emission,showing that the γ − δ filament is subtended by at leasttwo galaxies. The other significant Lyα smudges with greekletters, β and ǫ, plus the vaguely visible elongated featureson either side of β may also have counterparts in the broadband, with ǫ possibly related to object 4 (see below). Thevarious white contours in the bottom right panel of fig. 3,are marking extraction windows used to determine the fluxeslisted in table 1. Even though the low surface brightness fea-tures are statistically significant detections (objects 3, 8, and7 are 5.0, 4.4, and 8.1 σ excursions in the B-band) some ofthem could be observational artifacts. Moreover, even if theyare real objects, they may not all be at the same redshiftas the Lyα. However, the spectroscopic identifications of ob-jects 1, 7, and 10, and the simultaneous presence of severalhighly distorted and/or blue (B − V ∼ 0) objects suggestthat most of the features are likely to be real and related tothe Lyα halo. Further distorted objects in the B band occurto the N-W of the present region (not shown). If these be-long to the same large scale structure (which, due to a lack
of redshifts is uncertain), the total maximum extent couldbe as large as 210 kpc proper. With the field being locatednear the edge of the GOODS-N imaging coverage we cannotfollow the structure further to the North.
3 GALAXY PROPERTIES
The various objects shown in the broad band figure are listedwith their identifying numbers in column 1 of table 1, to-gether with their name in the GOODS-N catalog (wheredetected) in column 2. The GOODS-N broad band B andB-V colors (columns 3 and 4) are followed in columns 5-8 by the same quantities determined directly in extractionwindows placed on the head and tail regions of the variousobjects shown in fig. 3. Note that no corrections for extinc-tion or intergalactic absorption have been applied. From thework by Meiksin (2006), we expect that a color correctionof about δ(B − V ) ∼ −0.4 (for young star forming galaxiesat z=3.2) needs to be added to the magnitudes in the table.
The magnitudes of the ”heads” show good correlationwith the GOODS-N ”magbest” magnitudes where avail-able for the same object. Because of the irregular aperturesused, the absolute magnitudes are not precisely compara-ble among objects. The useful information mainly lies inthe B-V colors and their gradients between heads and tails.Objects 2, 4, 5, 6, 7, 9, and 10 are generally blue (overall B-V<0.12 in the GOODS-N catalog, or, where uncatalogued,in our apertures). We caution not to read too much into theformally very blue colors as the sometimes very large formalerrors speak for themselves. However, there is a clear trendin that all the cases where there is a distinct head-tail shape(objects 1, 2, 3, 5, and 8), with the exception of object 4,have bluer tails than heads. The tendency for the tails to bebluer than the heads is different from the prevailing patternfor tadpole galaxies (e.g., Elmegreen & Elmegreen 2010).
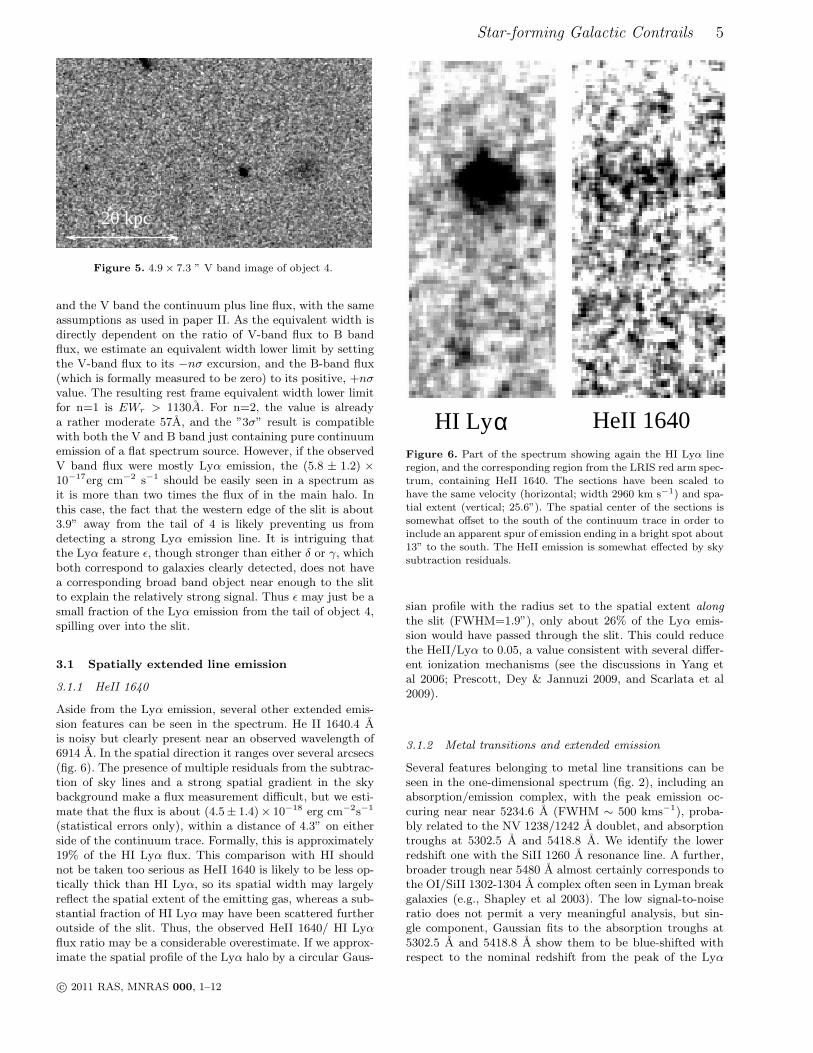
The object 4 is an interesting case in that the tail isonly visible in the V band (fig. 5), with a total flux of (5.8±1.2)×10−17erg cm−2 s−1, corresponding to a 4.8 σ detection.The situation here may be similar to the one presented inpaper II, a narrow filament of emission visible in only onebroad band, that may be glowing in Lyα, except that in thecurrent situation, the Lyα line, due to its higher redshift,would be situated in the V band and not in B. Becauseof the low flux, other broad band images do not provideuseful constraints (e.g., V-I = −1.3±1.0). We can, however,put limits on the equivalent width from the B and V bandfluxes, assuming that the B band measures the continuum,
c© 2011 RAS, MNRAS 000, 1–12
Star-forming Galactic Contrails 5
20 kpc
Figure 5. 4.9× 7.3 ” V band image of object 4.
and the V band the continuum plus line flux, with the sameassumptions as used in paper II. As the equivalent width isdirectly dependent on the ratio of V-band flux to B bandflux, we estimate an equivalent width lower limit by settingthe V-band flux to its −nσ excursion, and the B-band flux(which is formally measured to be zero) to its positive, +nσvalue. The resulting rest frame equivalent width lower limitfor n=1 is EWr > 1130A. For n=2, the value is alreadya rather moderate 57A, and the ”3σ” result is compatiblewith both the V and B band just containing pure continuumemission of a flat spectrum source. However, if the observedV band flux were mostly Lyα emission, the (5.8 ± 1.2) ×10−17erg cm−2 s−1 should be easily seen in a spectrum asit is more than two times the flux of in the main halo. Inthis case, the fact that the western edge of the slit is about3.9” away from the tail of 4 is likely preventing us fromdetecting a strong Lyα emission line. It is intriguing thatthe Lyα feature ǫ, though stronger than either δ or γ, whichboth correspond to galaxies clearly detected, does not havea corresponding broad band object near enough to the slitto explain the relatively strong signal. Thus ǫ may just be asmall fraction of the Lyα emission from the tail of object 4,spilling over into the slit.
3.1 Spatially extended line emission
3.1.1 HeII 1640
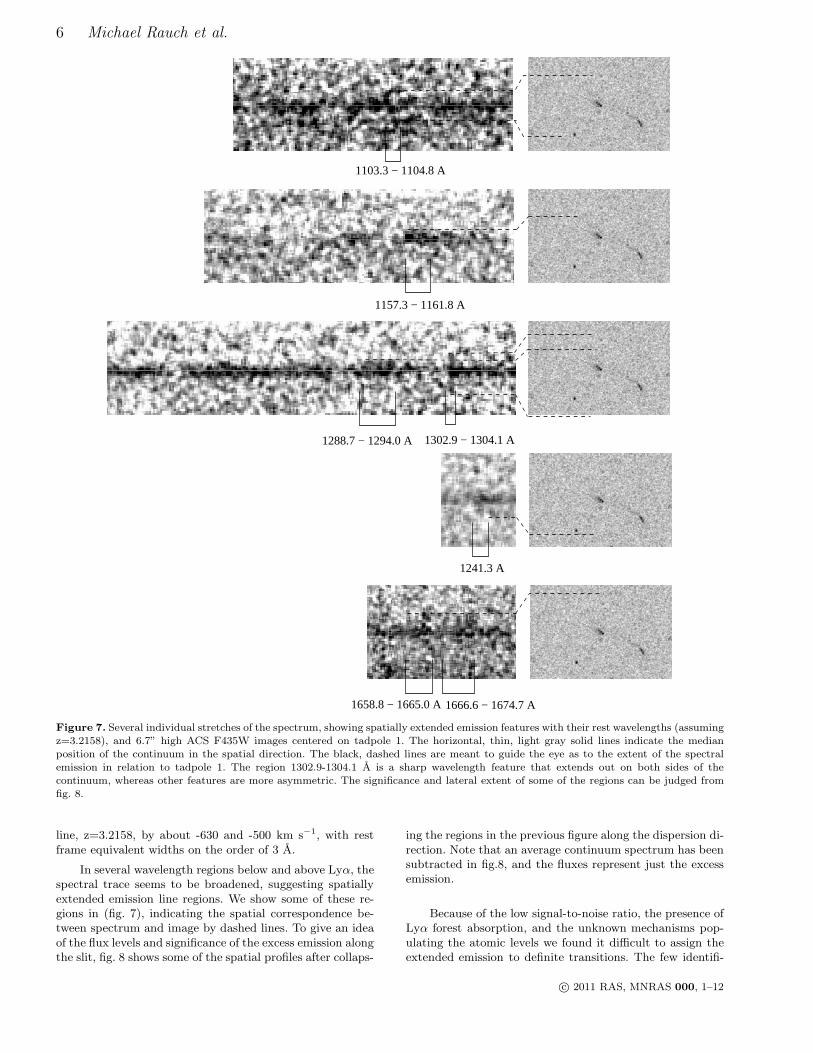
Aside from the Lyα emission, several other extended emis-sion features can be seen in the spectrum. He II 1640.4 Ais noisy but clearly present near an observed wavelength of6914 A. In the spatial direction it ranges over several arcsecs(fig. 6). The presence of multiple residuals from the subtrac-tion of sky lines and a strong spatial gradient in the skybackground make a flux measurement difficult, but we esti-mate that the flux is about (4.5± 1.4)× 10−18 erg cm−2s−1
(statistical errors only), within a distance of 4.3” on eitherside of the continuum trace. Formally, this is approximately19% of the HI Lyα flux. This comparison with HI shouldnot be taken too serious as HeII 1640 is likely to be less op-tically thick than HI Lyα, so its spatial width may largelyreflect the spatial extent of the emitting gas, whereas a sub-stantial fraction of HI Lyα may have been scattered furtheroutside of the slit. Thus, the observed HeII 1640/ HI Lyαflux ratio may be a considerable overestimate. If we approx-imate the spatial profile of the Lyα halo by a circular Gaus-
αHI Ly HeII 1640Figure 6. Part of the spectrum showing again the HI Lyα lineregion, and the corresponding region from the LRIS red arm spec-trum, containing HeII 1640. The sections have been scaled tohave the same velocity (horizontal; width 2960 km s−1) and spa-tial extent (vertical; 25.6”). The spatial center of the sections issomewhat offset to the south of the continuum trace in order toinclude an apparent spur of emission ending in a bright spot about13” to the south. The HeII emission is somewhat effected by skysubtraction residuals.
sian profile with the radius set to the spatial extent along
the slit (FWHM=1.9”), only about 26% of the Lyα emis-sion would have passed through the slit. This could reducethe HeII/Lyα to 0.05, a value consistent with several differ-ent ionization mechanisms (see the discussions in Yang etal 2006; Prescott, Dey & Jannuzi 2009, and Scarlata et al2009).
3.1.2 Metal transitions and extended emission
Several features belonging to metal line transitions can beseen in the one-dimensional spectrum (fig. 2), including anabsorption/emission complex, with the peak emission oc-curing near near 5234.6 A (FWHM ∼ 500 kms−1), proba-bly related to the NV 1238/1242 A doublet, and absorptiontroughs at 5302.5 A and 5418.8 A. We identify the lowerredshift one with the SiII 1260 A resonance line. A further,broader trough near 5480 A almost certainly corresponds tothe OI/SiII 1302-1304 A complex often seen in Lyman breakgalaxies (e.g., Shapley et al 2003). The low signal-to-noiseratio does not permit a very meaningful analysis, but sin-gle component, Gaussian fits to the absorption troughs at5302.5 A and 5418.8 A show them to be blue-shifted withrespect to the nominal redshift from the peak of the Lyα
c© 2011 RAS, MNRAS 000, 1–12
6 Michael Rauch et al.
1658.8 − 1665.0 A
23 44 66 87 109 131 152 174 195 217
1103.3 − 1104.8 A
1288.7 − 1294.0 A
1157.3 − 1161.8 A
1302.9 − 1304.1 A
1241.3 A
1666.6 − 1674.7 A
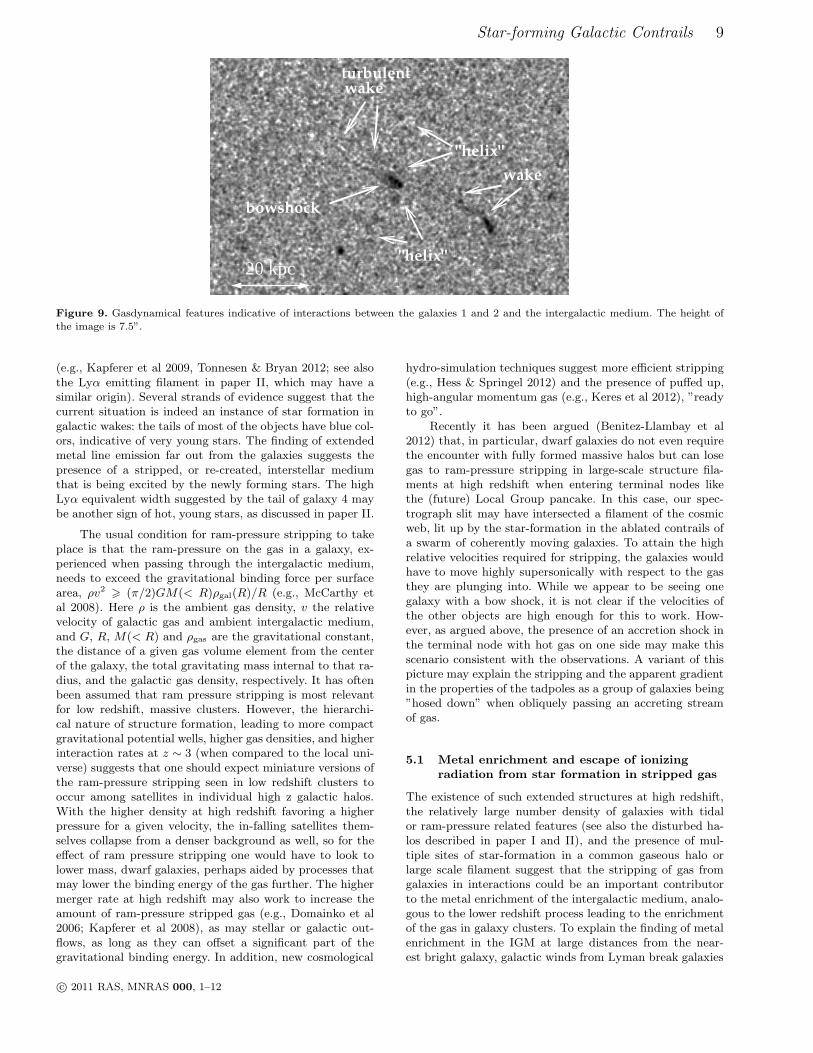
Figure 7. Several individual stretches of the spectrum, showing spatially extended emission features with their rest wavelengths (assumingz=3.2158), and 6.7” high ACS F435W images centered on tadpole 1. The horizontal, thin, light gray solid lines indicate the medianposition of the continuum in the spatial direction. The black, dashed lines are meant to guide the eye as to the extent of the spectralemission in relation to tadpole 1. The region 1302.9-1304.1 A is a sharp wavelength feature that extends out on both sides of thecontinuum, whereas other features are more asymmetric. The significance and lateral extent of some of the regions can be judged fromfig. 8.
line, z=3.2158, by about -630 and -500 km s−1, with restframe equivalent widths on the order of 3 A.
In several wavelength regions below and above Lyα, thespectral trace seems to be broadened, suggesting spatiallyextended emission line regions. We show some of these re-gions in (fig. 7), indicating the spatial correspondence be-tween spectrum and image by dashed lines. To give an ideaof the flux levels and significance of the excess emission alongthe slit, fig. 8 shows some of the spatial profiles after collaps-
ing the regions in the previous figure along the dispersion di-rection. Note that an average continuum spectrum has beensubtracted in fig.8, and the fluxes represent just the excessemission.
Because of the low signal-to-noise ratio, the presence ofLyα forest absorption, and the unknown mechanisms pop-ulating the atomic levels we found it difficult to assign theextended emission to definite transitions. The few identifi-
c© 2011 RAS, MNRAS 000, 1–12

Star-forming Galactic Contrails 7
cations suggested here are tentative and may change withbetter data:
The first region (top panel in fig. 7) comprises relativelyprominent emission extended to both the north and south oftadpole 1. The spectral traces of two other objects, 10 and7 in fig.3, are visible as well just below the trace of the maingalaxy for a wavelength stretch of about 50 A in the restframe, of which we show the central part in this panel. Hav-ing enhanced emission at the same wavelength as the maintadpole strengthens our proposed identification of these ob-jects with galaxies sharing the same redshift, responsiblefor the Lyα emission in the filaments γ and δ. Among thetransitions in this wavelength range that could produce theband-like spectral character, possible candidates are the nu-merous FeII and FeII] lines in the vicinity of 1104 A, withseveral transitions from the ground-state and accompanyinglow-lying excited states.
The second panel from the top, shows an asymmetric,extended emission region (1157.3 - 1161.8 A) redward of anabsorption trough. The nature of this feature is unclear.
In the third panel of fig.7 we find deep absorptiontroughs just blueward of extended emission near 1288.7-1294.0 A and 1302.9-1304.1 A. The identification of thelower redshift system is uncertain, but the spectrally nar-row, spatially very extended emission region 1302.9-1304.1 Amost likely corresponds to the OI 1302.17, 1304.86, 1306.02A triplet and the SiII 1304.37, 1309.28 A doublet (with pos-sible contributions by other ions) which would also accountfor the absorption trough immediately blueward. SiII maybe expected to be the dominant contributor under a widerrange of possible physical scenarios, but is perhaps some-what too far to the red of the optimal position. The spatialextent of the emission appears to exceed that of the otheremission regions discussed earlier in both directions alongthe slit. If the emission is due to OI, it could be enhancedby Bowen fluorescence (Bowen 1947), i.e., pumping of OI byHI Lyβ. A situation like this could arise in the contact zonebetween partly neutral gas (OI) embedded in more highlyionized gas where recombinations produce Ly series photons.
The fourth panel shows the NV 1238,1242 A doubletregion. NV appears to be present in the form of an absorp-tion trough, as commonly seen in high redshift galaxies, plusNV emission (marked as ”1241.3 A”), which is extended tothe south. At a flux of (1.8 ± 1.2) × 10−18 erg cm−2s−1, acomparison with other metals commonly seen in ionized gas,is difficult. The flux at the CIV 1548,1549 A doublet posi-tion (not shown), which is commonly stronger than NV, at(0.83± 1.5) × 10−18 erg cm−2s−1 is not significant.
In the bottom panel, a wavelength region from the redside of the spectrum contains a comb-shaped, multiple emis-sion line pattern extending about 2.7” (21 kpc proper) to thenorth, unfortunately marred by two background residuals.We tentatively identify the lines between 1658.8 - 1665.0 and1666.6 - 1674.7 A with OIII] 1660, 1666 A (which most likelywould be collisionally excited) and AlII 1671 A (which couldbe pumped by continuum radiation).
4 ORIGIN OF THE LYα EMISSION
The uncertain spatial extent of the Lyα emission beyond theslit prevents a measurement of the escape fraction of Lyα,
-60 -40 -20 0 20 40 60
-4-2024
-60 -40 -20 0 20 40 60
-6-4-202468
-60 -40 -20 0 20 40 60
-10-505
10
pr
ojec
ted
flux
per
pixe
l [10
-19 er
g cm
-2s-1
]
-60 -40 -20 0 20 40 60spatial direction along slit [kpc]
-6-4-2024
Figure 8. This figure gives an idea of the fluxes, spatial extentand asymmetry of several of the extended emission line featuresshown in the previous figure. It shows spatial profiles of the firstfour spectral segments from fig.7, with the origin placed at the me-dian position of the continuum profile. The regions of the spectralfeatures shown in fig. 7 were collapsed along the dispersion direc-tion, and a mean continuum obtained from a nearby wavelengthregion was subtracted. The two vertical solid lines in each profileshow roughly where the edges of the residual visible emission oc-cur in the 2-d spectrum. The total fluxes as measured between thepositions along the slit indicated by the vertical lines are given(together with their 1σ statistical errors in brackets) in units of10−19 erg cm−2 s−1.
but we can establish whether there is a sufficient source ofLyα that can explain the observed flux. If due to photoion-ization, the observed flux of Lyα photons requires an ioniza-tion rate of about 1.98×1053 erg cm−2 s−1Hz−1. Under theassumptions made in paper I and II, this can be achieved bya star-forming galaxy with rest frame luminosity L
1500A=
2.34× 1028 erg s−1Hz−1 or V band (AB) magnitude = 26.4.With the brightest galaxy, number 1, having a magnitude of24.9, there nominally are about four times as many ionizingphotons available as required to explain the observed Lyα,not counting any of the other sources in the field. Even ifthe slit losses approached a factor ∼ 4, as discussed above,stellar photoionization would remain a viable explanation.Based on the existing data we cannot rule out the presenceof an AGN, but there currently is no positive evidence forsuch an object either.
The star formation rate associated with galaxy 1, if es-timated by the usual relation (Madau, Pozetti & Dickinson1998), is found to be
SFR = 2.9M⊙yr−1 ×L1500
2.3× 1028erg s−1Hz−1. (1)
For some of the more clearly circumscribed emissionregions in the individual filaments the photon budget can bestudied independently. For example, the tail of region 7, witha V band magnitude 31.12, coincides in projection with theLyα spot δ in one of the southern filaments. The observedLyα flux of that spot requires V=30.9, which is very close tothe required value for a situation where virtually all ionizingradiation is being trapped and converted into Lyα photons,with all photons escaping.
c© 2011 RAS, MNRAS 000, 1–12

8 Michael Rauch et al.
The Lyα filamentary pattern is at least partly relatedto point sources that appear connected to the central emis-sion peak by bridges of Lyα emitting gas. In principle, thesebridges could consist of ionized gas, in which case the ve-locity position of the corresponding Lyα emission should beclose to the systemic velocity. We cannot test the ioniza-tion state of the gas for the individual filaments, but for themain galaxy we have additional evidence from the absorp-tion troughs present, which are all blue-shifted by on theorder of |vabs| ∼ 500 − 600 kms−1 with respect to the Lyαemission peak. In the case of Lyα emitters associated withLyman break galaxies, the redshifted velocity of the Lyαemission line with respect to the systemic redshift of thegalaxy, is about 2-3 times the absolute value of the (blue-shifted) outflow velocity |vabs|. This puts the redshift of theLyα emission relative to the systemic redshift at between250 - 600 kms−1, which is well consistent with the rangeobserved for Lyman break galaxies (e.g., Rakic et al 2011),and would mean that at least the central Lyα peak is highlyoptically thick. Taken together with the presence of an ab-sorption trough in the 1-d spectra (fig.2) near 5100 A, theevidence suggests that the Lyα emission is indeed the redpeak of a double humped profile, with the blue peak stronglysuppressed.
5 INTERPRETATION
As for the nature of the galaxies in the field, most of theobjects with a head-tail structure have their heads to thesouth of the tails (1,2,3,4 and 5), making it less likely thatthe features have been produced mainly by tidal interac-tions. Rather, the evidence appears consistent with largescale ram-pressure stripping (Gunn & Gott 1972; Nulsen1982) of gas, and recent star-formation in the down-streamablated tails.
Ram pressure stripping has been invoked to explain fea-tures seen in several astrophysical environments, includinggalaxy clusters (e.g., Cayatte et al 1990; Vollmer & Hucht-meier 2003; Chung et al 2007; Cortese et al 2007; Hester et al2010; Smith et al 2010; Yagi et al 2010; Fumagalli et al 2011;Fossati et al 2012; Arrigoni-Battaia et al 2012), the MilkyWay halo (e.g., Lin & Faber 1983), the Local Group (e.g.,McConnachie et al 2007) and in galaxy groups (e.g., Ras-mussen, Ponman & Mulchaey 2006; Marcolini, Brighenti,& D’Ercole 2003). So far, there is relatively scant observa-tional evidence for this process at high redshift, with theexception of the tadpole galaxies, a population of galax-ies increasingly common with redshift (e.g., Straughn et al2006), that may partly have been shaped by ram-pressure(Elmegreen & Elmegreen 2010).
Groups of galaxies falling into clusters seem to produceHα morphologies similar to the galaxy contrails observedhere (e.g., Cortese et al 2006; Owen et al 2006; Sun etal 2007; Yoshida et al 2012). In the present case, a num-ber of observational details closely resemble hydrodynamicfeatures predicted from simulations of supersonic motionsin galaxy clusters (e.g., Roediger, Bruggen, & Hoeft 2006;Zavala et al 2012): the main tadpole 1 shows a shape remi-niscent of a bow shock, with a projected tangential angle ofclose to 45 degrees (indicating, at face value, motion with a
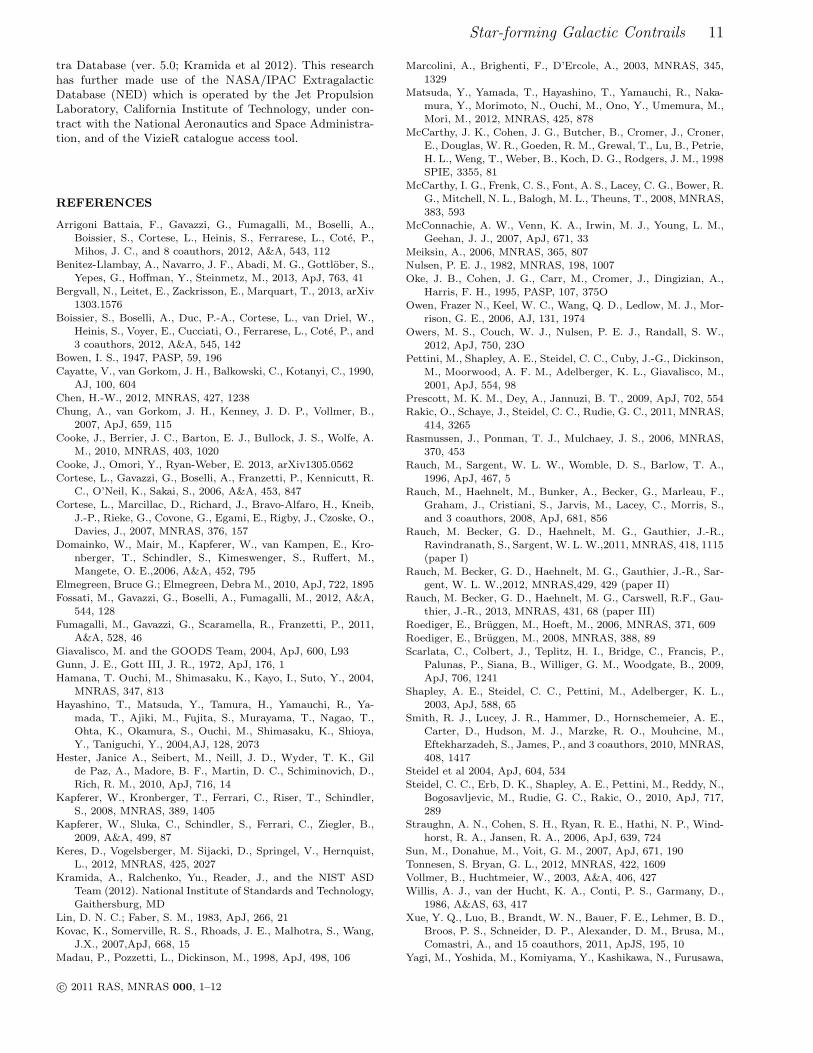
moderate Mach number ∼ 1.5), and what looks like a tur-bulent wake consisting of a vortex street with a longitudinalextent of about 12 kpc and a maximum width of about 5 kpc(fig. 9). A faint, linear structure vaguely resembling a ”he-lix” extends almost perpendicular to the axis of symmetry(i.e., the head-tail direction) to both sides of the galaxy, witha maximum traceable extent of ∼ 20 kpc to the south andsomewhat less to the north. The nature of this feature is notclear. Some of the extended emission seen in fig. 7 appearsto arise from that region, suggesting that it may be associ-ated with both low and highly ionized gas. The pattern withthe ”helical” appearance could perhaps arise through hy-drodynamic instabilities. A broadening tail of vortices (e.g.,Roediger, Bruggen, & Hoeft 2006, their fig. 4), may looksimilar, if the tadpole were viewed almost frontally, movingtoward the observer, and the ”helical” structure were on thefar side of the tadpole. Similar, curly structures also occur inthe wakes of interacting galaxies undergoing stripping (e.g.,Kapferer et al 2008, their fig. 9). Alternatively, the apparentspiral pattern may suggest a passing, rotating small galaxywith an asymmetric outflow of gas that traces out a helicalpattern. If the structure were an outflow from the tadpolegalaxy 1, e.g., the helical jet of an AGN, a large outflow ve-locity faster than the relative velocity between galaxy andambient gas could explain why the ”helices” are not beingswept back at a sharper angle.
Tadpole 2 does not show a discernible bow shock, andhas a narrower wake. The object 4 that we associated abovewith high equivalent width Lyα emission exhibits a linear,thin tail (fig. 4, 5), not unlike the expected outcome ofBondi-Hoyle accretion (Sakelliou 2000).
The proximity of the galaxies to each other, the presenceof a bow shock in one but not in the others, and the vari-ous degrees of turbulence in their tails may imply that theflow of galaxies is encountering inhomogeneous conditions.Specifically, the spatial sequence from tadpole 4 to 2 to 1(fig. 4) could be interpreted as indicating passage througha zone with a significant temperature gradient (perhaps anaccretion shock) from a colder to a hotter gaseous medium:the tadpole 4, which is most advanced in the direction ofthe flow, has a linear, apparently non-turbulent tail, sug-gesting that it may be experiencing the higher viscosity andthermal pressure of a hotter environment (e.g., Roediger &Bruggen 2008). Tadpole 2 is more turbulent, but the tail isstill narrow, and it does not have a bow shock either. Tad-pole 1 has a bow shock, presumably because it is on thecolder side of the interface between hot and cold gas, andits velocity relative to the intergalactic medium exceeds thesound speed for the colder gas. This condition would easilybe satisfied when passing through the general filamentaryIGM with even moderate velocity, as the typical tempera-ture at z ∼ 3 is only a few times 104K (Rauch et al 1996),corresponding to sound speeds of a few tens of kms−1. Thetail of tadpole 1 is flaring up and shows a turbulent vortexpattern, consistent with the lower viscosity expected in acolder medium.
A particular interesting consequence of ram-stripping isthe formation of stars in the stripped gas, which has beenthe subject of recent observational (e.g., Yoshida et al 2012;Smith et al 2010: Hester et al 2010; Fumagalli et al 2011;Boissier et al 2012; Owers et al 2012) and theoretical study
c© 2011 RAS, MNRAS 000, 1–12
Star-forming Galactic Contrails 9
turbulent
wake
bowshock
"helix"
"helix"
wake
20 kpc
Figure 9. Gasdynamical features indicative of interactions between the galaxies 1 and 2 and the intergalactic medium. The height ofthe image is 7.5”.
(e.g., Kapferer et al 2009, Tonnesen & Bryan 2012; see alsothe Lyα emitting filament in paper II, which may have asimilar origin). Several strands of evidence suggest that thecurrent situation is indeed an instance of star formation ingalactic wakes: the tails of most of the objects have blue col-ors, indicative of very young stars. The finding of extendedmetal line emission far out from the galaxies suggests thepresence of a stripped, or re-created, interstellar mediumthat is being excited by the newly forming stars. The highLyα equivalent width suggested by the tail of galaxy 4 maybe another sign of hot, young stars, as discussed in paper II.
The usual condition for ram-pressure stripping to takeplace is that the ram-pressure on the gas in a galaxy, ex-perienced when passing through the intergalactic medium,needs to exceed the gravitational binding force per surfacearea, ρv2 > (π/2)GM(< R)ρgal(R)/R (e.g., McCarthy etal 2008). Here ρ is the ambient gas density, v the relativevelocity of galactic gas and ambient intergalactic medium,and G, R, M(< R) and ρgas are the gravitational constant,the distance of a given gas volume element from the centerof the galaxy, the total gravitating mass internal to that ra-dius, and the galactic gas density, respectively. It has oftenbeen assumed that ram pressure stripping is most relevantfor low redshift, massive clusters. However, the hierarchi-cal nature of structure formation, leading to more compactgravitational potential wells, higher gas densities, and higherinteraction rates at z ∼ 3 (when compared to the local uni-verse) suggests that one should expect miniature versions ofthe ram-pressure stripping seen in low redshift clusters tooccur among satellites in individual high z galactic halos.With the higher density at high redshift favoring a higherpressure for a given velocity, the in-falling satellites them-selves collapse from a denser background as well, so for theeffect of ram pressure stripping one would have to look tolower mass, dwarf galaxies, perhaps aided by processes thatmay lower the binding energy of the gas further. The highermerger rate at high redshift may also work to increase theamount of ram-pressure stripped gas (e.g., Domainko et al2006; Kapferer et al 2008), as may stellar or galactic out-flows, as long as they can offset a significant part of thegravitational binding energy. In addition, new cosmological
hydro-simulation techniques suggest more efficient stripping(e.g., Hess & Springel 2012) and the presence of puffed up,high-angular momentum gas (e.g., Keres et al 2012), ”readyto go”.
Recently it has been argued (Benitez-Llambay et al2012) that, in particular, dwarf galaxies do not even requirethe encounter with fully formed massive halos but can losegas to ram-pressure stripping in large-scale structure fila-ments at high redshift when entering terminal nodes likethe (future) Local Group pancake. In this case, our spec-trograph slit may have intersected a filament of the cosmicweb, lit up by the star-formation in the ablated contrails ofa swarm of coherently moving galaxies. To attain the highrelative velocities required for stripping, the galaxies wouldhave to move highly supersonically with respect to the gasthey are plunging into. While we appear to be seeing onegalaxy with a bow shock, it is not clear if the velocities ofthe other objects are high enough for this to work. How-ever, as argued above, the presence of an accretion shock inthe terminal node with hot gas on one side may make thisscenario consistent with the observations. A variant of thispicture may explain the stripping and the apparent gradientin the properties of the tadpoles as a group of galaxies being”hosed down” when obliquely passing an accreting streamof gas.
5.1 Metal enrichment and escape of ionizing
radiation from star formation in stripped gas
The existence of such extended structures at high redshift,the relatively large number density of galaxies with tidalor ram-pressure related features (see also the disturbed ha-los described in paper I and II), and the presence of mul-tiple sites of star-formation in a common gaseous halo orlarge scale filament suggest that the stripping of gas fromgalaxies in interactions could be an important contributorto the metal enrichment of the intergalactic medium, analo-gous to the lower redshift process leading to the enrichmentof the gas in galaxy clusters. To explain the finding of metalenrichment in the IGM at large distances from the near-est bright galaxy, galactic winds from Lyman break galaxies
c© 2011 RAS, MNRAS 000, 1–12

10 Michael Rauch et al.
have been invoked to drive metal-enriched gas far into in-tergalactic space (e.g., Pettini et al 2001; Steidel et a 2010).Among the persistent uncertainties with this scenario is thatthe actually observed ranges of galactic winds invariably fallshort of accounting for the metals seen in QSO absorptionsystems at large distances from such galaxies. However, if,as we have argued above, ram pressure stripping of in-fallingdwarf galaxies and star formation in the stripped wake oper-ate at high redshift, there may be less need to invoke long-range winds from the central galaxy of a halo. In this al-ternative picture, the ram-pressure that led to the ablationof gas and subsequent star formation may also act to dis-pel newly formed metal enriched gas from the tails, aidedby stellar winds and supernova explosions that would findit much easier to escape from the weakly bound (and dark-matter free) star forming regions of galactic wakes. In anycase, differential motion between the lost gas and the parentstar forming galaxies will distribute the gas spatially overtime, and the assumption that this process mostly occurs inin-falling dwarf satellites implies that the gas is automati-cally reaching distances from any brightest halo galaxy aslarge as commonly observed (in metal absorption lines; e.g.,Chen 2012). Tidal interactions between satellites may leadto a similar result, metals expelled into the gaseous halo ofbrighter galaxies, that came from the shredded interstellarmedium of its satellites or from outflows in tidal dwarfs, andboth processes may exist among the extended, asymmetricLyα emitters in our study. There may be differences betweenthe metallicities of the gas ejected from tidal star-formingregions, and the gas lost by star forming regions in galac-tic contrails. Stars in the former arise from the relativelymetal-rich ISM of the parent galaxy, as would stars in gasablated by ram-pressure or viscous stripping. Stars formingin turbulent wakes behind the galaxies may feed on the lowermetallicity gas in the halo or intergalactic medium as well,which may contribute to the signatures of hot, young starsdescribed in paper II.
As argued earlier in paper II, extragalactic star forma-tion in the wakes of stripped galaxies and in tidal tails mayfacilitate the production and escape of ionizing photons andmay have brought about the reionization of the universe athigh redshift. Star formation outside of the dense galacticHI cocoons would lead to lines of sight with reduced opticaldepth for ionizing photons. The presence of young, mas-sive stars in the wakes, with the weak gravitational bindingforce enabling easy removal of neutral gas by even moder-ate amounts of stellar winds or supernova outflows wouldall tend to enhance the escape of ionizing radiation. Re-cently, Bergvall et al (2013), examining selection effects inthe search for local galaxies leaking ionizing radiation, havecome to similar conclusions as to the likely conditions re-quired, including the importance of stripping.
6 CONCLUSIONS
We have detected a Lyα emitting halo with several faint fil-aments stretching over tens of kpc. The filaments correlatewith star-forming regions in the form of mostly blue, faintgalaxies, several of which have a distinct tadpole shape andblue, partly turbulent tails, with one object showing whatappears to be a bow shock. The GOODS-N ACS F435W im-
age reveals many such features criss-crossing an area severaltimes bigger than the visible extent of the Lyα halo. Theemission of the central halo and of the filaments is broadlyconsistent with being powered by stellar photoionization.We detect spatially extended emission lines from gas sur-rounding the main tadpole, including HeII 1640, NV 1240and probably OIII], AlII, and FeII, suggesting an extended,extragalactic, interstellar medium with current star forma-tion.
The tadpole shapes, partial alignment, and the con-siderable numbers of unusual broad band objects make itunlikely that the features observed are predominantly tidalin origin (i.e., caused by individual two-body encounters).Instead, the galaxies may have experienced stripping ofgas when moving relative to the intergalactic or intra-halomedium, with stars forming downstream in the galactic con-trails. This process is observationally and theoretically wellestablished in the local universe. Our observations have iden-tified an occurrence of ram-pressure stripping at high red-shift, possibly involving dwarf galaxies interacting with thegas in more massive, individual galactic halos. The filamen-tary structure trailing behind a galaxy in the z=2.63 halodescribed in paper II may be another example of this ef-fect. In the present case, the properties of several tadpoleschange along their general direction of motion, which may beconsistent with these galaxies passing into a hotter gaseousenvironment, possibly the region behind an accretion shock.Such a stripping scenario may play out on a larger scalewhen differential motions of galaxies relative to the nodesin the gaseous cosmic web strip galaxies off their gas, assuggested by Benitez-Llambay et al 2012. As in the case oflocal clusters, the galactic contrails should be able to re-lease metal-enriched gas, perhaps enhanced by local stel-lar feedback, more easily than normal galaxies. At the veryleast these objects should provide a contribution to the in-tergalactic metal budget of galactic halos. The loss of en-riched gas from galactic contrails may suggest a solution tothe long-standing puzzle of how the intergalactic medium atlarge distances from bright galaxies was polluted with met-als. Star formation in galactic contrails would involve youngstars, surrounded by lower HI gas columns than stars bornin ordinary galaxies, and capable of clearing their environ-ment of dense gas, suggesting a way in which galaxies canionize the intergalactic medium.
ACKNOWLEDGMENTS
The data were obtained as part of a long term collabo-ration with the late Wal Sargent, to whose memory wededicate this paper. We acknowledge helpful discussionswith Guillermo Blanc, Bob Carswell, Michele Fumagalli andAndy McWilliam. We thank the staff of the Keck Observa-tory for their help with the observations. MR is gratefulto the National Science Foundation for grant AST-1108815.GB has been supported by the Kavli Foundation, and MGHreceived support by the European Research Council un-der the European Union’s Seventh Framework Programme(FP/2007-2013) / ERC Grant Agreement n. 320596. JRGacknowledges a Millikan Fellowship at Caltech. We acknowl-edge use of the Atomic Line List v2.05, maintained byPeter van Hoof, and the use of the NIST Atomic Spec-
c© 2011 RAS, MNRAS 000, 1–12
Star-forming Galactic Contrails 11
tra Database (ver. 5.0; Kramida et al 2012). This researchhas further made use of the NASA/IPAC ExtragalacticDatabase (NED) which is operated by the Jet PropulsionLaboratory, California Institute of Technology, under con-tract with the National Aeronautics and Space Administra-tion, and of the VizieR catalogue access tool.
REFERENCES
Arrigoni Battaia, F., Gavazzi, G., Fumagalli, M., Boselli, A.,Boissier, S., Cortese, L., Heinis, S., Ferrarese, L., Cote, P.,Mihos, J. C., and 8 coauthors, 2012, A&A, 543, 112
Benitez-Llambay, A., Navarro, J. F., Abadi, M. G., Gottlober, S.,Yepes, G., Hoffman, Y., Steinmetz, M., 2013, ApJ, 763, 41
Bergvall, N., Leitet, E., Zackrisson, E., Marquart, T., 2013, arXiv1303.1576
Boissier, S., Boselli, A., Duc, P.-A., Cortese, L., van Driel, W.,Heinis, S., Voyer, E., Cucciati, O., Ferrarese, L., Cote, P., and3 coauthors, 2012, A&A, 545, 142
Bowen, I. S., 1947, PASP, 59, 196
Cayatte, V., van Gorkom, J. H., Balkowski, C., Kotanyi, C., 1990,AJ, 100, 604
Chen, H.-W., 2012, MNRAS, 427, 1238
Chung, A., van Gorkom, J. H., Kenney, J. D. P., Vollmer, B.,2007, ApJ, 659, 115
Cooke, J., Berrier, J. C., Barton, E. J., Bullock, J. S., Wolfe, A.M., 2010, MNRAS, 403, 1020
Cooke, J., Omori, Y., Ryan-Weber, E. 2013, arXiv1305.0562
Cortese, L., Gavazzi, G., Boselli, A., Franzetti, P., Kennicutt, R.C., O’Neil, K., Sakai, S., 2006, A&A, 453, 847
Cortese, L., Marcillac, D., Richard, J., Bravo-Alfaro, H., Kneib,J.-P., Rieke, G., Covone, G., Egami, E., Rigby, J., Czoske, O.,Davies, J., 2007, MNRAS, 376, 157
Domainko, W., Mair, M., Kapferer, W., van Kampen, E., Kro-nberger, T., Schindler, S., Kimeswenger, S., Ruffert, M.,Mangete, O. E.,2006, A&A, 452, 795
Elmegreen, Bruce G.; Elmegreen, Debra M., 2010, ApJ, 722, 1895
Fossati, M., Gavazzi, G., Boselli, A., Fumagalli, M., 2012, A&A,544, 128
Fumagalli, M., Gavazzi, G., Scaramella, R., Franzetti, P., 2011,A&A, 528, 46
Giavalisco, M. and the GOODS Team, 2004, ApJ, 600, L93
Gunn, J. E., Gott III, J. R., 1972, ApJ, 176, 1
Hamana, T. Ouchi, M., Shimasaku, K., Kayo, I., Suto, Y., 2004,MNRAS, 347, 813
Hayashino, T., Matsuda, Y., Tamura, H., Yamauchi, R., Ya-mada, T., Ajiki, M., Fujita, S., Murayama, T., Nagao, T.,Ohta, K., Okamura, S., Ouchi, M., Shimasaku, K., Shioya,Y., Taniguchi, Y., 2004,AJ, 128, 2073
Hester, Janice A., Seibert, M., Neill, J. D., Wyder, T. K., Gilde Paz, A., Madore, B. F., Martin, D. C., Schiminovich, D.,Rich, R. M., 2010, ApJ, 716, 14
Kapferer, W., Kronberger, T., Ferrari, C., Riser, T., Schindler,S., 2008, MNRAS, 389, 1405
Kapferer, W., Sluka, C., Schindler, S., Ferrari, C., Ziegler, B.,2009, A&A, 499, 87
Keres, D., Vogelsberger, M. Sijacki, D., Springel, V., Hernquist,L., 2012, MNRAS, 425, 2027
Kramida, A., Ralchenko, Yu., Reader, J., and the NIST ASDTeam (2012). National Institute of Standards and Technology,Gaithersburg, MD
Lin, D. N. C.; Faber, S. M., 1983, ApJ, 266, 21
Kovac, K., Somerville, R. S., Rhoads, J. E., Malhotra, S., Wang,J.X., 2007,ApJ, 668, 15
Madau, P., Pozzetti, L., Dickinson, M., 1998, ApJ, 498, 106
Marcolini, A., Brighenti, F., D’Ercole, A., 2003, MNRAS, 345,
1329Matsuda, Y., Yamada, T., Hayashino, T., Yamauchi, R., Naka-
mura, Y., Morimoto, N., Ouchi, M., Ono, Y., Umemura, M.,Mori, M., 2012, MNRAS, 425, 878
McCarthy, J. K., Cohen, J. G., Butcher, B., Cromer, J., Croner,E., Douglas, W. R., Goeden, R. M., Grewal, T., Lu, B., Petrie,H. L., Weng, T., Weber, B., Koch, D. G., Rodgers, J. M., 1998SPIE, 3355, 81
McCarthy, I. G., Frenk, C. S., Font, A. S., Lacey, C. G., Bower, R.G., Mitchell, N. L., Balogh, M. L., Theuns, T., 2008, MNRAS,383, 593
McConnachie, A. W., Venn, K. A., Irwin, M. J., Young, L. M.,Geehan, J. J., 2007, ApJ, 671, 33
Meiksin, A., 2006, MNRAS, 365, 807Nulsen, P. E. J., 1982, MNRAS, 198, 1007
Oke, J. B., Cohen, J. G., Carr, M., Cromer, J., Dingizian, A.,Harris, F. H., 1995, PASP, 107, 375O
Owen, Frazer N., Keel, W. C., Wang, Q. D., Ledlow, M. J., Mor-rison, G. E., 2006, AJ, 131, 1974
Owers, M. S., Couch, W. J., Nulsen, P. E. J., Randall, S. W.,2012, ApJ, 750, 23O
Pettini, M., Shapley, A. E., Steidel, C. C., Cuby, J.-G., Dickinson,M., Moorwood, A. F. M., Adelberger, K. L., Giavalisco, M.,2001, ApJ, 554, 98
Prescott, M. K. M., Dey, A., Jannuzi, B. T., 2009, ApJ, 702, 554Rakic, O., Schaye, J., Steidel, C. C., Rudie, G. C., 2011, MNRAS,
414, 3265
Rasmussen, J., Ponman, T. J., Mulchaey, J. S., 2006, MNRAS,370, 453
Rauch, M., Sargent, W. L. W., Womble, D. S., Barlow, T. A.,1996, ApJ, 467, 5
Rauch, M., Haehnelt, M., Bunker, A., Becker, G., Marleau, F.,Graham, J., Cristiani, S., Jarvis, M., Lacey, C., Morris, S.,and 3 coauthors, 2008, ApJ, 681, 856
Rauch, M. Becker, G. D., Haehnelt, M. G., Gauthier, J.-R.,Ravindranath, S., Sargent, W. L. W.,2011, MNRAS, 418, 1115(paper I)
Rauch, M. Becker, G. D., Haehnelt, M. G., Gauthier, J.-R., Sar-gent, W. L. W.,2012, MNRAS,429, 429 (paper II)
Rauch, M. Becker, G. D., Haehnelt, M. G., Carswell, R.F., Gau-thier, J.-R., 2013, MNRAS, 431, 68 (paper III)
Roediger, E., Bruggen, M., Hoeft, M., 2006, MNRAS, 371, 609
Roediger, E., Bruggen, M., 2008, MNRAS, 388, 89
Scarlata, C., Colbert, J., Teplitz, H. I., Bridge, C., Francis, P.,Palunas, P., Siana, B., Williger, G. M., Woodgate, B., 2009,ApJ, 706, 1241
Shapley, A. E., Steidel, C. C., Pettini, M., Adelberger, K. L.,2003, ApJ, 588, 65
Smith, R. J., Lucey, J. R., Hammer, D., Hornschemeier, A. E.,Carter, D., Hudson, M. J., Marzke, R. O., Mouhcine, M.,
Eftekharzadeh, S., James, P., and 3 coauthors, 2010, MNRAS,408, 1417
Steidel et al 2004, ApJ, 604, 534
Steidel, C. C., Erb, D. K., Shapley, A. E., Pettini, M., Reddy, N.,Bogosavljevic, M., Rudie, G. C., Rakic, O., 2010, ApJ, 717,289
Straughn, A. N., Cohen, S. H., Ryan, R. E., Hathi, N. P., Wind-horst, R. A., Jansen, R. A., 2006, ApJ, 639, 724
Sun, M., Donahue, M., Voit, G. M., 2007, ApJ, 671, 190
Tonnesen, S. Bryan, G. L., 2012, MNRAS, 422, 1609Vollmer, B., Huchtmeier, W., 2003, A&A, 406, 427
Willis, A. J., van der Hucht, K. A., Conti, P. S., Garmany, D.,1986, A&AS, 63, 417
Xue, Y. Q., Luo, B., Brandt, W. N., Bauer, F. E., Lehmer, B. D.,Broos, P. S., Schneider, D. P., Alexander, D. M., Brusa, M.,Comastri, A., and 15 coauthors, 2011, ApJS, 195, 10
Yagi, M., Yoshida, M., Komiyama, Y., Kashikawa, N., Furusawa,
c© 2011 RAS, MNRAS 000, 1–12

12 Michael Rauch et al.
H., Okamura, S., Graham, A. W., Miller, N. A., Carter, D.,
Mobasher, B., Jogee, S., 2010,Yang, Y., Zabludoff, A. I. Dave, R., Eisenstein, D. J., Pinto, P.
A., Katz, N., Weinberg, D. H., Barton, E. J.,2006, ApJ, 640,539
Yoshida, M., Yagi, M., Komiyama, Y., Furusawa, H., Kashikawa,N., Hattori, T., Okamura, S., 2012, ApJ, 749, 43
Zavala, J., Balogh, M. L., Afshordi, N., Ro, S., 2012, MNRAS,426, 3464
Zheng, Z., Cen, R., Trac, H., Miralda-Escude, J., 2011, ApJ, 726,38
This paper has been typeset from a TEX/ LATEX file preparedby the author.
c© 2011 RAS, MNRAS 000, 1–12