Embed Size (px)
Citation preview

1
Stanford / MITStanford / MIT
Management by FactManagement by Fact Deep BenchmarkingDeep Benchmarking
EDUCAUSEEDUCAUSENovember 5, 2003November 5, 2003

2
Deep BenchmarkingDeep Benchmarking
Project began summer 2002Project began summer 2002
Details, charts, metrics available atDetails, charts, metrics available at
http://web.mit.edu/is/about/benchmarkinghttp://web.mit.edu/is/about/benchmarking
Article to be published in EDUCAUSEArticle to be published in EDUCAUSEQuarterly in Jan/Feb 2004Quarterly in Jan/Feb 2004

3
We had to go deep, then be strategicWe had to go deep, then be strategic
Establish partnership, scope
General understanding• Processes, definitions
Raw dataMetrics
Initial prepCorrections
Sharing, teaching
Another tool for management, cultural change
Intense, deep,iterative
project work

4
We linked goals to specific metrics andWe linked goals to specific metrics andthen created a dashboardthen created a dashboard
Invest Appropriately• % of budget• Clients served/FTE
Be Cost Effective• Cost per case by topic• Total costs by topic• Cases by media, including
self-help
Be Responsive• Elapsed time per case
(days)• Call abandonment• Hold time• Time to answer• % of cases resolved
on 1st contact
Support Customer Needswith High Quality Service
• Annual customer survey• Spot-surveys on selected
transactions
Develop Effective, Mature Processes• # of contacts vs. # of days to resolve• Origin of Help Desk cases
Develop High Performing,Competent Teams
• Employee satisfctn. survey• Individual perf. metrics• Team performance metrics• Training $$ / FTE• % Help Desk certification• Case volume compared to
staff skills mixSupport Rollout of New Systems• Case volume by topic 3 months
before and after launch• Minutes per case

5
Metrics lead to action onMetrics lead to action onmany frontsmany fronts
OrganizationalOrganizational
• Increased budget;automated support
• Measure staff
• Stanford re-org:consolidation of allclient-facing work
• Put HD staff onsolid funding, notone-time $
ManagerialManagerial
• Sharing metricswith staff, teams
• Refining metrics –measure the rightthings
• Specific responses:e.g., create “swat”team for Oraclerollout
• Everyone in ITtracks his/her time
CulturalCultural
• Understandingdata; recognizingsimilarities, pushfor action
• Collaborationacross schools
• Apply metrics toall IT projects
• Value people withtechnical andbehavioral skills

6
Metrics lead to action onMetrics lead to action onmany frontsmany fronts
OrganizationalOrganizational
• Increased budget;automatedproductionsupport
ManagerialManagerial
• Sharing metricswith staff, teams
CulturalCultural
• Understandingdata; recognizingsimilarities
• Push for action

7
Gauging investment and effectivenessGauging investment and effectivenessFY 03FY 03
53%53%$64.18$64.18$41.83$41.83Help Desk Budget / TicketHelp Desk Budget / Ticket
5%5%1,6751,6751,5951,595Tickets / Help Desk FTETickets / Help Desk FTE
42%42%1,0101,010712712Population per HD EmployeePopulation per HD Employee
-48%-48%1.71.72.22.2Tickets / School PopulationTickets / School Population
3.1%3.1%4.2%4.2%Help Desk Budget / IT BudgetHelp Desk Budget / IT Budget
4.0%4.0%2.9%2.9%IT Dept Budget / University BudgetIT Dept Budget / University Budget
VarianceVarianceStanfordStanfordMITMIT

Cost per Ticket
$0
$20
$40
$60
$80
$100
$120
$140
$160
$180
$200
Accounts
Backup
Business
Apps
Business
Func
Cluster
Connect
ivity
Course
wareEmail
Hardware
OS Soft
wareOther
Printin
g
Desk Soft
ware
Securit
y/Viru
sWeb
MIT Stanford

9
Total Annual Cost by Help Desk Topic
$0
$80,000
$160,000
$240,000
$320,000
$400,000
$480,000
Accounts
Backup
Business
Apps
Business
Func
Cluster
Connect
ivity
Courseware
Hardware
OS Soft
wareOther
Printin
g
Desk Soft
ware
Securit
y/Viru
sWeb
Annu
al C
ost
MITStanford

10
Metrics lead to action onMetrics lead to action onmany frontsmany fronts
OrganizationalOrganizational
• Increased budget;automated support
ManagerialManagerial
• Sharing metricswith staff, teams
• Refining metrics –measure the rightthings
CulturalCultural
• Understandingdata; recognizingsimilarities, pushfor action
• Collaborationacross schools

11
• Define scope
• Set goals
• Form team
• Develop plan
• Teach team
• Launch
Prepare
• Researchliterature
• Visit sites
• Map processes
• Define data
• Collect data
• Define metrics
• Calculatemetrics
Study &Define
• Draft adashboard
• Populate withavailable data
• Test and revise
• Make easilyrepeatable
• Use inoperations
Operationalize
• Usedashboard
• Publicize
• Replaceexistingreports
• Explorenext areafor bench-marking
Leverage
• Interpret athigh-level
• Identify areasto explore
• Identifypotentialimprovements
• Test initialchanges
Interpret& Test
Continuously test and revise
Deep Benchmarking: 5 Iterative Phases

12
Client Satisfaction % Clients reporting as Satisfied or Very Satisfied on per-case surveys Staff competency contributions to Client Satisfaction
Average Overall Sat.
N = 175; 5 point scale
Problem Solving Age in Days of Cases Closing per Day Cases Created per day, by Medium Used
6 or more days
1 to 5 days
< 24 hours
Residual Open Cases (Open minus Closed plus previous balance) Team Components of Residual Open Cases
Avg Cases Open
Phones ACD standard statistics, for all teams that use ACD (CHD and BusinessHelp) Miscellaneous Statistics
ACD Abandon Rate
Consultant ACD Logged Hours, average per day 61Calls Offered, avg per day 179
Wait time, avg per day 95 secLength of call, avg per day 6:36 m:sCases created by phone 38 %
Average Cases created per work day 157
goal is 10% Cases created outside working hours 23 %
4.52
20%
25%13%62%
689
60%
80%
100%
7/21 7/28 8/4 8/11 8/18 8/25 9/1 9/8 9/15 9/22 9/29 10/6 10/13
Results for Surveys from Cases created week beginning..
0
50
100
150
200
250
300
7/21 8/4 8/18 9/1 9/15 9/29 10/13
Calls
Wait
Hours
Abdn
Professionalism
4
5
7/21 8/18 9/15 10/13
Communication
4
5
7/21 8/18 9/15 10/13
Availability
4
5
7/21 8/18 9/15 10/13
Timeliness
4
5
7/21 8/18 9/15 10/13
Expertise
4
5
7/21 8/18 9/15 10/13
Resolution
4
5
7/21 8/18 9/15 10/13
300
400
500
600
700
800
900
1000
7/21 7/28 8/4 8/11 8/18 8/25 9/1 9/8 9/15 9/22 9/29 10/6 10/13
0
50
100
150
200
250
300
350
7/21 7/28 8/4 8/11 8/18 8/25 9/1 9/8 9/15 9/22 9/29 10/6 10/13
Web
Voice
0
50
100
150
200
250
300
350
7/21 8/4 8/18 9/1 9/15 9/29 10/13
6 +
1 - 5
< 1
0
200
400
600
800
1000
1200
7/21 7/28 8/4 8/11 8/18 8/25 9/1 9/8 9/15 9/22 9/29 10/6 10/13
Total
Helpdesk
BusinessHelp
MCC

13
Metrics lead to action onMetrics lead to action onmany frontsmany fronts
OrganizationalOrganizational
• Increased budget;automated support
• Measure staff
ManagerialManagerial
• Sharing metricswith staff, teams
• Refining metrics –measure the rightthings
CulturalCultural
• Understandingdata; recognizingsimilarities, pushfor action
• Collaborationacross schools

14
Facts prompted discussions aboutFacts prompted discussions aboutemployee performanceemployee performance
Stanford IT Help Desk (Level 2)
Hours Logged FY02
1086
676
630
623
532
461
414
294
130
0 200 400 600 800 1000 1200
Staff Member F
Staff Member G
Staff Member H (80%)
Staff Member B
Staff Member E (55%)
Staff Member I
Staff Member A
Staff Member C (75%)
Managers D

15
Metrics lead to action onMetrics lead to action onmany frontsmany fronts
OrganizationalOrganizational
• Increased budget;automated support
• Measure staff
• Stanford re-org:consolidation ofall client-facingwork
ManagerialManagerial
• Sharing metricswith staff, teams
• Refining metrics –measure the rightthings
• Specificresponses:e.g., create “swat”team for Oraclerollout
CulturalCultural
• Understandingdata; recognizingsimilarities, pushfor action
• Collaborationacross schools
• Apply metrics toall IT projects

16
Stanford Helpdesks: Tier Where Resolved
0
5000
10000
15000
20000
Accts/I
D's/Auth
Backup
Bus App Suppt
Bus. Functi
ons
Cluster
Connect
ivity
Course
wareEmail
Hardware
OS Soft
wareOthe
r
Printin
g
Producti
vity S
W
Securit
y/Viru
sW
eb
Cas
es &
Com
plex
ity
OtherLevel 2Level 1
See supporting data in Appendix 9
17
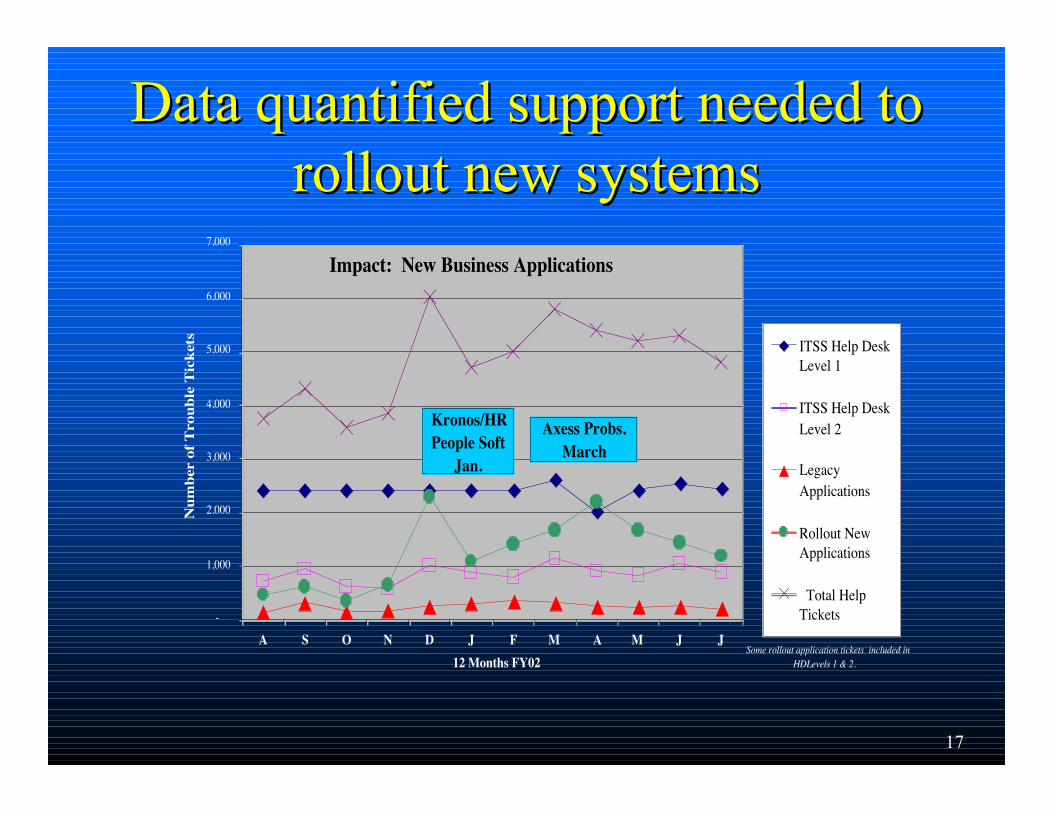
Data quantified support needed toData quantified support needed torollout new systemsrollout new systems
Impact: New Business Applications
-
1,000
2,000
3,000
4,000
5,000
6,000
7,000
A S O N D J F M A M J J12 Months FY02
Num
ber
of T
roub
le T
icke
ts ITSS Help DeskLevel 1
ITSS Help DeskLevel 2
LegacyApplications
Rollout NewApplications
Total HelpTickets
Some rollout application tickets included in HDLevels 1 & 2.
Kronos/HR People Soft
Jan.
Axess Probs. March

18
Metrics lead to action onMetrics lead to action onmany frontsmany fronts
OrganizationalOrganizational
• Increased budget;automated support
• Measure staff
• Stanford re-org:consolidation of allclient-facing work
• Emphasis on“professionalization”of Help Desk staff(solid funding,certified, etc.)
ManagerialManagerial
• Sharing metricswith staff, teams
• Refining metrics –measure the rightthings
• Specific responses:e.g., create “swat”team for Oraclerollout
• Everyone in ITtracks his/hertime
CulturalCultural
• Understandingdata; recognizingsimilarities, pushfor action
• Collaborationacross schools
• Apply metrics toall IT projects
• Value people withtechnical andbehavioral skills

19
Summary:Summary:Planning a deep benchmarking projectPlanning a deep benchmarking project
Choose a good partnerChoose a good partner Invest in site visitsInvest in site visits Plan for many iterationsPlan for many iterations Have a dedicated project managerHave a dedicated project manager Metrics must be actionable and tell a storyMetrics must be actionable and tell a story Allow time for others to internalizeAllow time for others to internalize Ensure top-level management wants to useEnsure top-level management wants to use
metrics in a meaningful waymetrics in a meaningful way

20
Cultural Change:Cultural Change:Management by FactManagement by Fact
Use facts to dispel the myth of theUse facts to dispel the myth of theanecdoteanecdote
http://web.mit.edu/is/about/benchmarkinghttp://web.mit.edu/is/about/benchmarking