Embed Size (px)
Citation preview
American Thoracic Society Documents
An Official Research Policy Statement of the AmericanThoracic Society/European Respiratory Society:Standards for Quantitative Assessment ofLung Structure
Connie C. W. Hsia, Dallas M. Hyde, Matthias Ochs, and Ewald R. Weibel, on behalf of the ATS/ERS Joint Task Forceon the Quantitative Assessment of Lung Structure
THIS OFFICIAL STATEMENT OF THE AMERICAN THORACIC SOCIETY (ATS) AND THE EUROPEAN RESPIRATORY SOCIETY (ERS) WAS APPROVED
BY THE ATS BOARD OF DIRECTORS, JULY, 2009, AND THE ERS EXECUTIVE COMMITTEE, APRIL 2009.
EXECUTIVE SUMMARY
The charge of this Joint ATS/ERS Task Force was to criticallyreview the state-of-the-art stereological methods in lungmorphometry, provide practical guidelines for use of thesemethods in basic and translational lung research, define stan-dards to promote comparability of morphometric studies, andexamine the extension of these methods to noninvasive lungimaging.
Broad conclusions regarding study design and standardization:
1. In quantitative assessment of lung structure, accuracy isfar more critical than precision, because inaccurate orbiased data cannot be made accurate by increasing thenumber of measurements. The only effective way to avoidbias and ensure accuracy is via rigorous experimental de-sign and standardization of each step of tissue fixation,processing, sampling, and analysis.
2. With an efficient study design, the number of samples,sections, images, and measurements at each analyticalstage can be kept low without compromising accuracyand still achieving reasonable global precision in theresults.
3. Principles of design-based stereology can be appliedto the sampling and morphometric analysis ofstructures obtained by in vivo imaging modalities suchas computed tomography (CT), magnetic resonanceimaging (MRI), and positron emission tomography(PET).
Principles for standardization of study design:
4. The lung should be fixed under well-defined inflation andperfusion conditions, using appropriate fixative(s) andprocessing procedures that result in the best structuralpreservation with the least tissue distortion for theintended study goal.
5. Tissue blocks or image fields should be selected usingproven unbiased sampling schemes to ensure that all
parts of the whole have an equal chance for beingsampled.
6. Structures that are nonrandom in orientation or distribu-tion, and biopsy samples from nonrandom target sites,require special sampling and analytical strategies.
Recommendations for methods of quantification:
7. Stereological methods that are free of geometric assump-tions must be used to efficiently quantify number, length,surface area, and volume at an adequate spatial resolutionto ensure that measurements made on two-dimensional(2D) images accurately represent the three-dimensional(3D) structure.
8. Alveolar surface area can be accurately estimated fromprofile boundary lengths or intersection counting usingsystematic linear probes in 2D sections that are ‘‘uniformrandom’’ (i.e., selected from all possible sections with thesame probability); however, the measurement is sensitiveto resolution.
9. Alveolar number and size (volume) can be accuratelymeasured using 3D volume probes such as the disector,but not from simple counts of profiles or measurements ofcross-sectional areas in uniform random 2D sections.
10. Stereological measurements should be related to thevolume of the lung or an appropriate reference space.Measurements made on lung biopsy specimens should berelated to an internal reference space.
Keywords: morphometry; stereology; unbiased sampling; referencelung volume; cell volume; surface area; cell size; cell number; in vivo
imaging
METHODOLOGY USED TO PREPARE THE GUIDELINES
The ATS/ERS Joint Task Force met twice as a group. In thefirst meeting, each individual was assigned a topic for review,including systematic evaluation of the literature, and presenta-tion to the entire group. More than one committee memberreviewed each topic, presented their findings to the entiregroup, and selected the most pertinent references based oncommittee discussions as well as database searches (Medline1949 to 2008). The first draft recommendations were formulatedby the Co-chairs and distributed to the committee members for
Am J Respir Crit Care Med Vol 181. pp 394–418, 2010DOI: 10.1164/rccm.200809-1522STInternet address: www.atsjournals.org
their feedback. A second meeting was convened to discussfeedback from committee members. The document was revisedand distributed again to committee members. Based on theirfeedback, a third revision was completed and distributed forfinal revision. The final document reflects the consensus ofcommittee members.
TABLE OF CONTENTS
1. Introduction1.1. The Challenges1.2. Accuracy, Bias, and Precision1.3. Unbiased Methods: Stereology1.4. Goals of the ATS/ERS Task Force
2. Principles of Stereology
2.1. Stereologic Methods2.2. Practical Application of Stereology
3. Fixation and Preparation of Lungs for Morphometry3.1. Goals of Fixation and Basic Considerations3.2. Methods of Fixation3.3. Conditional Silver Standards of Fixation3.4. Special Problems Related to Lung Size3.5. Preparation Artifacts
4. Sampling Whole Lungs for Morphometry4.1. Sampling Rules4.2. Unbiased Sampling Procedures4.3. Sampling Focal Lesions4.4. How Much Sampling Is Enough?
5. Establishing Reference Parameters5.1. Measuring the Reference Lung Volume5.2. Defining the Reference Space
6. Morphometry of Lung Parenchyma6.1. Multistage Stratified Analysis6.2. Volume Density and Absolute Volume6.3. Surface Density and Absolute Surface Area6.4. Alveolar Number6.5. Alveolar Size and its Variability6.6. Mean Linear Intercept6.7. Air–Blood Barrier Thickness6.8. Morphometric Estimation of Lung Diffusing
Capacity6.9. Selecting Suitable Test Systems
7. Assessing Lung Cell Ultrastructure7.1. Cells and Organelles7.2. Ultrasmall Particles: Immunoelectron
Microscopy8. Assessing Airway and Vasculature Systems
8.1. Bronchovascular Hierarchy8.2. Conducting Airways8.3. Acinar Airways8.4. Pulmonary Vascular Tree
9. Biopsies9.1. General Issues9.2. Endobronchial and Transbronchial Biopsies9.3. Thoracoscopic and Open Lung Biopsy
10. Quantitative Structural Assessment Using In VivoImaging Techniques
10.1. Combining Stereology and In Vivo ImagingTechniques
10.2. Computed Tomography10.3. Micro-CT10.4. Functional Lung Imaging Techniques
11. Conclusions
1. INTRODUCTION
1.1. The Challenges
To understand normal lung function, the processes of growthand development, and the mechanisms and effects of diseases,
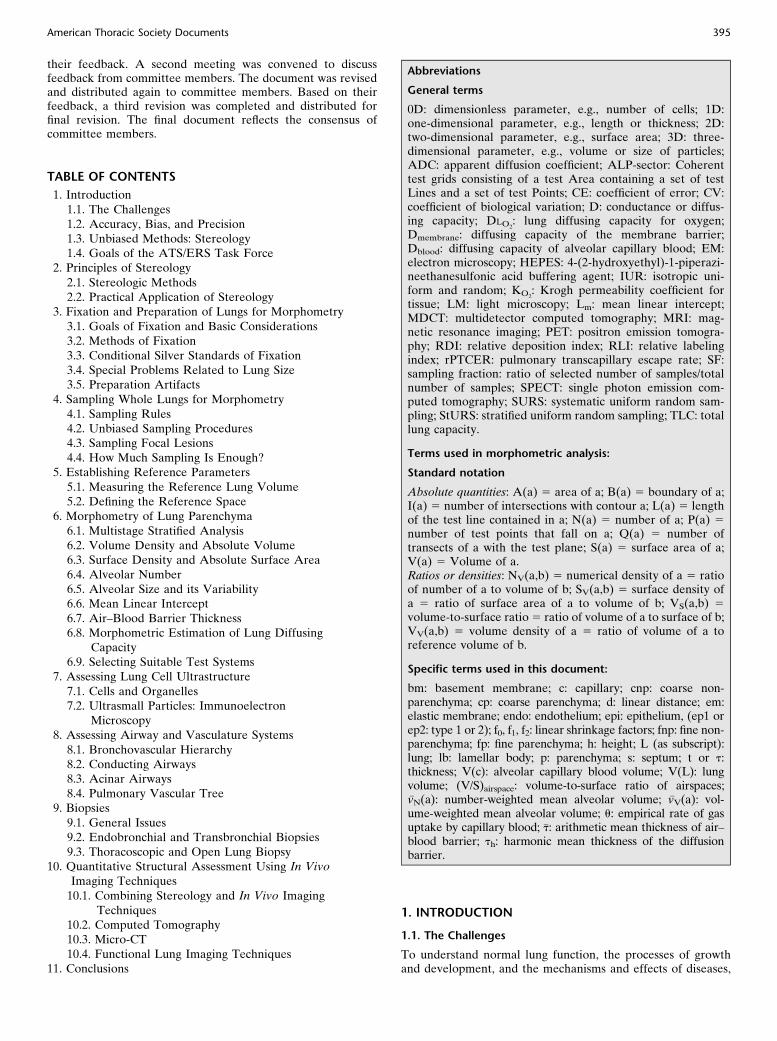
Abbreviations
General terms
0D: dimensionless parameter, e.g., number of cells; 1D:one-dimensional parameter, e.g., length or thickness; 2D:two-dimensional parameter, e.g., surface area; 3D: three-dimensional parameter, e.g., volume or size of particles;ADC: apparent diffusion coefficient; ALP-sector: Coherenttest grids consisting of a test Area containing a set of testLines and a set of test Points; CE: coefficient of error; CV:coefficient of biological variation; D: conductance or diffus-ing capacity; DLO2
: lung diffusing capacity for oxygen;Dmembrane: diffusing capacity of the membrane barrier;Dblood: diffusing capacity of alveolar capillary blood; EM:electron microscopy; HEPES: 4-(2-hydroxyethyl)-1-piperazi-neethanesulfonic acid buffering agent; IUR: isotropic uni-form and random; KO2
: Krogh permeability coefficient fortissue; LM: light microscopy; Lm: mean linear intercept;MDCT: multidetector computed tomography; MRI: mag-netic resonance imaging; PET: positron emission tomogra-phy; RDI: relative deposition index; RLI: relative labelingindex; rPTCER: pulmonary transcapillary escape rate; SF:sampling fraction: ratio of selected number of samples/totalnumber of samples; SPECT: single photon emission com-puted tomography; SURS: systematic uniform random sam-pling; StURS: stratified uniform random sampling; TLC: totallung capacity.
Terms used in morphometric analysis:
Standard notation
Absolute quantities: A(a) 5 area of a; B(a) 5 boundary of a;I(a) 5 number of intersections with contour a; L(a) 5 lengthof the test line contained in a; N(a) 5 number of a; P(a) 5
number of test points that fall on a; Q(a) 5 number oftransects of a with the test plane; S(a) 5 surface area of a;V(a) 5 Volume of a.Ratios or densities: NV(a,b) 5 numerical density of a 5 ratioof number of a to volume of b; SV(a,b) 5 surface density ofa 5 ratio of surface area of a to volume of b; VS(a,b) 5
volume-to-surface ratio 5 ratio of volume of a to surface of b;VV(a,b) 5 volume density of a 5 ratio of volume of a toreference volume of b.
Specific terms used in this document:
bm: basement membrane; c: capillary; cnp: coarse non-parenchyma; cp: coarse parenchyma; d: linear distance; em:elastic membrane; endo: endothelium; epi: epithelium, (ep1 orep2: type 1 or 2); f0, f1, f2: linear shrinkage factors; fnp: fine non-parenchyma; fp: fine parenchyma; h: height; L (as subscript):lung; lb: lamellar body; p: parenchyma; s: septum; t or t:thickness; V(c): alveolar capillary blood volume; V(L): lungvolume; (V/S)airspace: volume-to-surface ratio of airspaces;�vN(a): number-weighted mean alveolar volume; �vV(a): vol-ume-weighted mean alveolar volume; u: empirical rate of gasuptake by capillary blood; �t: arithmetic mean thickness of air–blood barrier; th: harmonic mean thickness of the diffusionbarrier.
American Thoracic Society Documents 395

we need information about the 3D structure of the lung. Quan-tification of organ structure is based upon 3D physical attributesof tissues, cells, organelles, alveoli, airways, and blood vessels.When structures of interest are inaccessible or too small to beseen macroscopically, we rely on physical or optical sectionsthrough a few representative samples taken from the largeheterogeneous organ. The resulting 2D images confer incompleteinformation about the 3D structure, and may not accuratelyrepresent true 3D properties, leading to possible misinterpre-tation when measurements are made on 2D sections. Becausestructural quantification is often considered the ‘‘gold standard’’in evaluating experimental intervention, disease severity, andtreatment response, it is imperative that these quantitativemethods are (1) accurate to allow meaningful interpretation ofresults, (2) efficient to yield adequate precision with reasonableeffort, (3) of adequate statistical power to encompass inherentvariability, and (4) adherent to uniform standards to facilitatecomparisons among experimental groups and across differentstudies. The lung poses special challenges, some of which areoutlined below and discussed in later sections:
(a) Heterogeneity of lung structure requires standardizedpreparation methods. The inflated lung consists of mostly air;only 10 to 15% of its volume consists of tissue (cells, fibers, andmatrix) and blood. In vivo lung volume and relative volumes ofair, tissue, and blood fluctuate widely, while gravitational andnongravitational gradients cause spatial heterogeneity in struc-ture and function. Failure to standardize physiological variablesor minimize tissue distortion introduces uncertainties or errorsinto subsequent measurements, to the point of their beingmeaningless (1). Careful selection of fixation and prepara-tion methods that minimize shrinkage obviates this problem(SECTION 3).
(b) Selected microscopic sections should provide a fairsample of the whole organ. The practice of picking specificsamples or sections often fails to account for regional hetero-geneity, leading to biased conclusions with respect to the wholeorgan. Deliberately choosing sections that contain a particularcompartment (e.g., profiles of alveolar type 2 epithelial cells)overestimates their abundance within the whole lung. Usinga sampling scheme that covers all regions with equal probabilityalleviates this problem (SECTION 4).
(c) Measurements made on microscopic sections must berelated to the whole organ or an appropriate referencevolume. Studies continue to appear that report only relativemeasurements (i.e., volume and surface densities or ratios)without knowledge of the lung volume. These ratios are de-pendent on lung inflation, and must be multiplied by absolutelung volume to obtain accurate total quantities of the structuresof interest. Uncertainties regarding lung volume can bias datainterpretation. For example, enlarged mean airspace size neednot signify emphysema or alveolar hypoplasia; the finding couldalso be caused by overinflation. Careful measurement of thelung volume eliminates this error (SECTION 5).
(d) Lung structures are irregular and their geometry easilyaltered by pathology and intervention. Measurements on 2Dimages that rely on assumed geometry may misrepresent the 3Dstructure. Examples include estimating alveolar size from cross-sectional areas of alveolar profiles, and reporting alveolarsurface area by the length of alveolar profile boundary. Thesemeasures can severely misrepresent the 3D structure of interest.Airspace size is often inferred from the mean linear intercept(Lm), which in fact measures airspace volume-to-surface ratioand can be converted to diameter or volume only by assuminga shape factor. Airspace distortion, or selective distortion ofalveolar ducts but not alveolar sacs, can invalidate shapeassumptions (SECTION 6).
(e) The number of lung cells cannot be estimated bycounting their profiles on random histologic sections becauselarger cells have a greater probability of being sampled. Forexample, if experimental intervention causes selective cellhypertrophy, the increased probability of counting cell profileswill lead to wrong conclusions. Again, using stereologicmethods that are free of geometric assumptions eliminates thiserror (SECTIONS 6–7).
( f) In contrast to acinar structures that exhibit nearly randomorientation (isotropy) and homogeneous distribution, conduct-ing airways and blood vessels exhibit preferred directions(anisotropy) and inhomogeneous distribution, which alter theirsampling probability on random sections. Specific samplingprocedures that account for their nonrandom nature shouldbe employed to ensure unbiased representation on 2D sections(SECTION 8).
(g) Assessment of endobronchial or lung biopsy specimens islimited by their nonrandom nature and a lack of externalreference parameter. Endobronchial biopsy specimens are alsoanisotropic with distinct luminal and basal sides and with
Definition of terms (section of text where term is defined)
Accuracy (Sec. 1.2); ALP-sector (Sec. 2.1, item a); Anisotropy(Sec. 1.1, item f); Apparent diffusion coefficient (ADC) (Sec.10.4.1); Arithmetic mean thickness of air-blood barrier (Sec.6.7); Bias (Sec. 1.2); Buffon’s needle (Sec. 1.3); CavalieriPrinciple/Method (Sec. 1.3); Coarse nonparenchyma (Sec.6.2); Coarse parenchyma (Sec. 6.2); Computer-aided stereologysystems (Sec. 2.2, item c); Connectivity of airway branchingsystems (Sec. 8.1); Delesse principle (Sec. 1.3); ‘‘Design-based’’(Sec. 1.2); Dichotomous branching of airways (Sec. 8.1, Fig.9A); Disector principle: physical, optical (Sec. 2.1, items d ande); ‘‘Do more less well ’’ (Sec. 2.2, item c); Sec. 4.4; Efficiency(Sec. 4.4); Euler characteristic (Sec. 6.4); Fine nonparenchyma(Sec. 6.2; Figure 5); Fine parenchyma (Sec. 6.2; Equation 12);Fractal tree (Sec. 8.1); Fractionator sampling (Sec. 4.2.5; Figure4); Global estimators (Sec. 2.1); ‘‘Gold standard ’’ in fixation(Sec. 3.1); Harmonic mean thickness of air–blood barrier (Sec.6.7); Horsfield ordering system (Sec. 8.1; Figure 9b); Isector(isotropic orientation) (Figure 4); Isotropic uniform random(IUR) sampling (Sec. 4.2.3); Isotropy (Sec. 1.1, item f); Localestimators (Sec. 2.1, item e); Mean chord length or mean linearintercept (Sec. 6.6); Monopodial airway branching (Sec. 8.1);Morphometry (Sec. 2.1); Multistage stratified morphometricanalysis (Sec. 6.1); Multistage stratified sampling (Sec. 4.2.6);Nucleator (Sec. 2.1, item e); Number-weighted mean particlevolume (Sec. 2.1, items e and f); Orientator (Sec. 4.2.3); Point-sampled intercept (Sec. 2.1, item e); Precision (Sec. 1.2);Reference space (Sec. 5); Reference lung volume (Sec. 5.1);‘‘Reference trap’’ (Sec. 5); Relative deposition index (RDI)(Sec. 7.2); Relative labeling index (RLI) (Sec. 7.2); Rotator(Sec. 2.1, item e); Sampling (Sec. 2.1, Sec. 4); Sampling fraction(Sec. 6.4; Figure 4); Sampling procedures (Sec. 4.2); Samplingrules (Sec. 4.1); ‘‘Silver standards’’ in fixation technique (Sec.3.1; Sec. 3.3); Stereology (Sec. 2.1); Strahler ordering system(Sec. 8.1; Figure 9b); Stratified uniform random (StUR)sampling (Sec. 4.2.2); Surface density (Sec 2.1, item b; Sec.6.3); Systematic uniform random sampling (SURS) (Sec. 4.2.1);Test probes, test systems (Sec. 2.1, item a; Sec. 6.9; Figure 6);Uniform random sections (Sec. 4.2.1; Sec. 4.2.2; Sec. 4.2.3);Vertical sections (Sec. 4.2.4; Figure 3); Volume density (Sec. 2.1,item b; Sec. 6.2); Volume-weighted mean particle volume (Sec.2.1, items e and f).
396 AMERICAN JOURNAL OF RESPIRATORY AND CRITICAL CARE MEDICINE VOL 181 2010
respect to airway generations. To minimize potential errors inquantification, specimens should be processed with their orien-tation randomized and analyzed with respect to an internalreference parameter (SECTION 9).
(h) The new imaging techniques CT and MRI offer thepossibility of obtaining high-fidelity images of lung structurein vivo that can be used for quantitative assessment of structuralchanges. Since their images are sections of the organ, stereologycan ensure accurate measurements (SECTION 10).
1.2. Accuracy, Bias, and Precision
Accuracy refers to the validity of data (i.e., without bias). Biasrefers to methodological errors that cause measurements to beinaccurate. Precision refers to the reproducibility of measure-ments, which depends on data variance, sampling design, sam-ple size, and distribution. Bias in experimental data cannot bedetected unless the true value is known; nor can biased databe saved by more measurements. In contrast, precision can bechecked and adjusted by increasing sample size. Therefore, instructural analysis, accuracy is more critical than precision. It isimpossible to correct bias after the analysis has been completed.Also, multiple sources of bias are additive. Interventions caninduce more inaccuracy in one experimental group than another.Such bias would be hard to detect or verify. The only effectiveway of avoiding bias is to anticipate and eliminate its occurrencevia rigorous experimental design that critically and repetitivelyexamines each step of tissue preparation, sampling, and analysis,to preempt possible errors and optimize the 3D information to begained from 2D sections. This is called design-based approach.
1.3. Unbiased Methods: Stereology
Because sources of bias are often not obvious, the approach topreventing bias must be based on objective scientific methodsinstead of intuition. The statistical science of sampling irregular3D structures using geometric test probes (slabs, sections, lines,points) for quantification in 2D profiles is termed stereology,which arose from geometric probability theory (2–4) with a longpunctuated history (5, 6). In 1635, Buonaventura Cavalierishowed that the mean volume of solids could be measuredfrom the sum of their profile areas in cut sections; the ‘‘Cavalierimethod’’ enabled the estimation of total volume of objects fromserial 2D sections. In 1777, George Leclerc Comte de Buffonshowed that a needle tossed onto a grid intersects the lines witha probability proportional to the length of the needle and thespacing of the grid lines; ‘‘Buffon’s needle’’ led to the estimationof total length and surface area of irregular objects in sections(7, 8). In 1847, Auguste Delesse showed that the relative 2Dprofile area of a section with random position through a pop-ulation of objects is proportional to the total volume of all theobjects (9); the ‘‘Delesse principle’’ enabled volume estimationof irregular objects based on their profile areas on random sec-tions. This process was subsequently simplified to linear in-tegration (10) and point counting (11–13).
Special problems arose when estimating particle number orsize on 2D sections. In 1925, S. D. Wicksell estimated thenumber and size distribution of tumors (assumed to bespheres) based on measurement of the radii of their 2Dprofiles (assumed to be circles) in sections (14). Other methodsfollowed, all depending on assumptions of particle shape, andall were shown to be prone to severe bias (15, 16). The solutioncame in 1984 with the ‘‘disector principle’’ (17), the firstunbiased method for estimating particle or cell number withina given volume using a pair of histological sections separatedby a known distance (SECTION 2). These and other stereolog-ical methods (18) are based on robust theoretical foundations(3, 19), require no assumptions regarding the structure of
interest, and do not invoke model constraints or correctionfactors. Hence, they minimize the potential bias introduced bymeasuring 3D objects in 2D profiles. Stereological methods are alsoefficient because implementation can be simplified and the laborinvolved in counting minimized without affecting at all the accuracyof the result (19–21).
1.4. Goals of the ATS/ERS Task Force
Stereology was first applied to quantify lung structure in 1959–1963 (16, 22–24) and has since grown into a coherent set ofmeasurement tools (25). However, unlike in other disciplines(neuroscience and nephrology), no methodological standardshave been adopted for application of stereology to the lung.This deficiency may be due to a lack of awareness of the avail-able valid tools compounded by communication barrier imposedby the jargon and mathematical equations prevalent in stereol-ogy literature. To address this deficiency and bridge the gapbetween theory and practice, this ATS/ERS Joint Task Forcewas formed to: (1) provide concise review and references for thestate-of-the-art stereological methods in lung morphometry, (2)formulate practical guidelines for the use of unbiased methodsin basic and translational investigation of lung structure, and (3)examine the extension of these methods to noninvasive imagingof the lung. Adoption of guidelines by the scientific communityand by journal editorial boards will significantly improve thevalidity and uniformity of structural assessment in lung biology,thereby promoting better understanding of respiratory struc-ture–function relationships in health and disease.
2. PRINCIPLES OF STEREOLOGY
2.1. Stereologic Methods
Stereology refers to the mathematical methods for definingphysical properties of irregular 3D structure using 2D sectionsobtained by physical or optical imaging techniques. Morphom-etry refers to the measurement of form and the practical ap-plication of stereology. By design, stereological methods makeno assumption on the size, shape, orientation, or spatial distri-bution of the structure of interest. The objective is to estimategeometrical parameters that characterize the composition of astructure using a few samples from the whole. Typical globalparameters are 3D (volume or size), 2D (surface area), 1D(length or thickness), or 0D (number). These parameters cancharacterize any lung component (Table 1, Figure 1). (Forgeneral reviews on principles of stereology, see References 18,19, 21, 26–28; for lung stereology, see References 25, 29–31; forapplications of stereology to lung health and disease, seeReferences 32–37.) The main steps in stereology are samplingand estimation.
Basic rule of sampling. Tissue blocks or image fields must beselected in an objective way such that each part of the whole hasan equal chance for being sampled. Rigorous sampling shouldnot be an intuitive exercise (e.g., pick a few good-looking areasfrom the mid-lung region), but should adhere to objectiveschemes that maintain unbiasedness at all levels. Sampling isaccurate (unbiased) when all parts and orientations of the struc-tures of interest have equal probability of being selected foranalysis. Sampling is precise when independent repetition of thesampling procedure yields data with low variability. Sampling isefficient when adequate precision is achieved with reasonableeffort and cost. Stereological methods that yield maximum ac-curacy and efficiency with reasonable precision should beselected (38–40).
Basic rules of estimation. Stereological measurements areoften simple counts of interaction events between structures ofinterest and test systems (geometric probes).
American Thoracic Society Documents 397

(a) The test probes determine which parameters can be esti-mated, such that, in 3D, the dimension of the structuralparameter plus the dimension of the probe equals 3. Therefore,test points (0D) can measure volume (3D), test lines (1D)surface area (2D), test planes (2D) length (1D), and only testvolumes (3D) can measure number (0D) (Table 1). Coherenttest grids that consist of a test area containing a set of test linesand a set of test points (ALP-sector; Figure 1) placed randomlyover a section allow for simultaneous estimation of length,surface area, and volume of the structures of interest withrespect to an appropriate reference volume.
(b) Stereological measurements are usually expressed as den-sities or ratios (i.e., quantities ‘‘per unit volume of reference space.’’That is, volume density of epithelium in lung 5 volume of epithelialcells per unit lung volume; alveolar surface density in lung 5
alveolar surface area per unit lung volume; numerical density ofalveolar type II cells in septum 5 number of type II cells per unitseptum volume. To answer the question ‘‘how much quantity ofa structure is there?’’ or ‘‘has the quantity of a structure changed?’’these ratios need to be converted to absolute values by multiplyingthem by the total volume of the reference space (SECTION 5).
(c) Particle number cannot be accurately estimated by profilecounting in random 2D sections. This ‘‘2D sample’’ is inherentlybiased toward large particles because the probability thata particle or cell is sampled on a 2D section depends on theparticle size (or height perpendicular to the section plane).
(d) Particle number may be estimated without bias using 3Dvolume probes termed the disector (17). A physical disectorconsists of two parallel histological sections generated a knowndistance apart from the same tissue block. These can be
Figure 1. Structural parameters and their
stereological representation. A structure (left)of total reference volume V(R) containing
particles of volume V(x) and surface S(x) as
well as thread-like features of length L(y) is
randomly sectioned. On an isotropic uniformrandom (IUR) section (right) the profiles of x
are characterized by their area A(x) and
boundary B(x), the feature y appears asa number of small transects Q(y), while the
reference space is represented by the section
area A(R). Applying a coherent stereological
test grid (ALP-sector) with test points PT 5 16,test lines LT 5 PT � 2d, and test area AT 5
PT � d2 to the section allows to assess volume,
surface, and length densities per unit volume
from point hits P(x) (marked by squares),intersection counts I(x) (arrowheads), and
transect counts Q(y) (short arrows) whereby
the reference area is estimated by the number
of test points included in the section profileP(R), that is, excluding the points falling out-
side (marked by triangle). In this example P(R) 5
15; the actual test area is A(R) 5 P(R) � d2,
and the length of test line included in the sample is L(R) 5 P(R) � 2d. Using a second parallel section a distance t apart and the counting frame with area
A(R) (disector), the numerical density of particles per unit volume can be assessed from counting particle tops Q2(x) in the disector volume A(R) � t.Reproduced by permission from Reference 30.
TABLE 1. BASIC PARAMETERS FOR LUNG MORPHOMETRY AND THE STEREOLOGICAL METHODS TO ESTIMATETHEM (cf. FIGURES 1, 5–8)
Parameter (Dimension) Example Method Test System (Dimension)
Volume (3D) Lung parenchyma Point counting (Figure 6a) Test points (0D)
Alveolar septal tissue
Surface area (2D) Alveolar epithelium Intersection counting (Figure 6b) Test lines (1D)
Capillary endothelium
Length (1D) Fibers Transect counting (Figure 1) Test planes (2D)
Particle number (0D) Alveoli Top counting (Figure 7) Disector (3D)
Type II cells
Mean particle size (3D) Alveoli
Type II cells
Derived from volume and number
or
Local stereology (nucleator etc.)
Test points (0D) and disector (3D)
Test lines (1D)
Mean linear intercept (chord) (1D) Airspace size mean free distance Chord measurement (Figure 8)
or
Derived from volume and surface area
Test lines (1D)
Test points (0D) and the lines (1D)
Barrier thickness (1D) Alveolar septum
Blood-air barrier
Derived from volume and surface area
(arithmetic mean barrier thickness)
or
Intercept length measurement
(harmonic mean barrier thickness)
Test points (0D) and lines (1D)
Test lines (1D)
398 AMERICAN JOURNAL OF RESPIRATORY AND CRITICAL CARE MEDICINE VOL 181 2010

adjacent sections or two sections from a stack of serial sections.An optical disector is generated by focusing a known distancethrough the z-plane of a thick section; this is easily obtained asparallel focal planes using ordinary oil objectives of highnumerical aperture (41) or confocal microscopy (42) or othertomographic techniques (e.g., micro-CT or electron tomogra-phy) (43). Placing a counting test frame of a known area AT onthe paired sections defines a reference volume of the disector,
VðdisectorÞ5 AT � h (1)
where h is the distance between the upper faces of the pairedsections or the displacement of the optical planes in an opticaldisector.
Particles within the reference volume are counted by com-paring paired sections using the ‘‘now you see it (in one sectionor plane), now you don’t (in the next section or plane)’’principle. Particles that appear in only one of the two sections,but not in both, are counted. Multiple disectors can begenerated from a stack of serial sections.
(e) The disector accurately estimates mean particle size aswell as particle number. Because particles are sampled with aprobability proportional to their number within the disectorvolume, this technique can be used to estimate mean particlesize. If the number N(y) of particles y in the disector (i.e., theirnumber density NV(y)), is known, and the volume density of theparticles is obtained by point counting VV(y) 5 P(y)/P(AT), themean particle size �vN(y), can be estimated:
�vNðyÞ5 VVðyÞ �VðdisectorÞ =NðyÞ5 VVðyÞ =NVðyÞ (2)
The various disector-based measurements of mean particlesize are collectively known as ‘‘local’’ estimators (44) becausethey use two steps to separate, without bias, the particle ofinterest from its containing space (i.e., measuring size of the‘‘bird’’ without having to measure volume of the ‘‘cage’’) (45).The first step is to sample particles in proportion to theirnumber, using the disector. Then, the volume of each sampledparticle is estimated by measuring the distance along isotropiclines radiating from one unique point (e.g., nucleolus of a cell) tothe particle boundary, e.g., cell membrane, a method called thenucleator (46). The average estimate yields a number-weightedmean particle volume. A variant of this procedure is termed therotator (47). Another technique, point-sampled intercepts, firstsamples the particles in proportion to their volume, by over-laying a grid of test points onto a field of view; the particles thatare hit by the points are selected for measurement. Then, thevolume of each particle is estimated by measuring the length ofan isotropic line intercept in the particle passing through the testpoint to yield a volume-weighted mean particle volume (48, 49).
(f) Number-weighted and volume-weighted mean particlevolumes are not the same. Both estimate mean particle size.However, volume-weighted mean volume also includes infor-mation about variance of particle size (bigger particles aresampled at a higher probability). When particle size is constant,volume-weighted and number-weighted mean volumes areequal. When particle size is heterogeneous, volume-weightedmean volume is greater than number-weighted mean volume. Anincreased volume-weighted mean particle volume can resultfrom a true increase in mean particle size, an increased sizevariation, or both (48). Therefore, volume-weighted and num-ber-weighted mean volumes yield complementary information,especially when particle size is heterogeneous.
2.2. Practical Application of Stereology
Practical stereology resources can be found in introductory text-books (28), Internet websites (e.g., the International Society for
Stereology [ISS]: http://www.stereologysociety.org/), and variouscourses that are offered regularly in North America and Europe.
(a) Performing lung stereology requires no sophisticatedequipment, except those available in most histology and mi-croscopy facilities. For tissue sectioning and sampling (SECTIONS
4 and 5.1.2), simple slicing tools often suffice. For generalmicroscopic measurements, only a properly sampled set of fieldof view (or images) and a test system appropriate for estimatingthe parameters of interest are needed. Templates for testsystems (used as transparencies or digital overlays) are availablein the literature (21, 28) and in computer-aided image analysissoftware. For any coherent grid of test area, lines, and points(Figure 1), the basic information necessary for the calculation ofcounting results includes the area of the frame (for length andnumber estimation), the area associated with a single test point(for volume estimation), and the line length associated witha single test point (for surface area estimation) corrected for thefinal magnification.
(b) Design-based stereology minimizes bias only in samplingand measurement of structure; other sources of bias must alsobe identified and minimized. These include artifacts and distor-tion during specimen fixation and processing (SECTION 3), andincorrect structure recognition. The structures of interest shouldbe unambiguously identifiable, observers should be well trained,and test systems should be simple to minimize ambiguity in thedefinition of counting events.
(c) Computer-aided stereology counting systems improveprecision and efficiency but not necessarily accuracy. Thesesystems usually consist of a light microscope, motorized x-,y-,z-microscope stage with a microcator to encode the z-axisposition, digital camera, and computer with stereology software(49, 50). Images obtained using other instruments (e.g., confocaland electron microscopes or tomographs) are also importableinto stereology software. These systems improve countingefficiency by automating certain sampling steps and by directlyproviding stereological probes, calculations, data analysis, andstorage. Advanced stereological methods may require comput-erized systems. However, the decisive step, counting structures,always requires the judgment of a trained observer. Thus, high-quality stereology does not depend on sophisticated equipmentbut rather on a rigorous study design, particularly the samplingstrategy and outcome measures.
One caveat regarding automation is the temptation to use allpixels contained in the image to measure the entire areacovered by a structural component for estimating volumefractions, or to trace all the pixels that outline the contour ofair spaces. This approach does not increase precision of theestimate over simpler point counting procedures (38), but rathercauses a loss in accuracy because of potentially inadequatediscrimination of structures by the automated detection algo-rithm, particularly in boundary areas. For example, usingsoftware erosion options eliminates pixels along boundariesleading to imprecision. Because each microscopic image repre-sents but an infinitesimal sample of the organ, it makes no senseto strive for high local precision; instead, one should try toattain high global precision with the least effort on individualimages, an approach referred to as ‘‘do more less well’’ (38, 39).
3. FIXATION AND PREPARATION OF LUNGSFOR MORPHOMETRY
3.1. Goals of Fixation and Basic Considerations
Fixation aims to preserve (1) lung volume in a defined inflationstate; (2) architectural integrity of lung parenchyma (i.e., alveoliand capillaries), airways, and vessels; (3) ultrastructure of lungcells, organelles, and matrix; (4) capillary blood; (5) surface
American Thoracic Society Documents 399
lining of alveoli and airways with surfactant film, fluid layer(hypophase, edema, or mucus); and (6) molecular identity ofcells for localization and quantification of protein and RNAexpression. No single fixation or preparation method fulfills allthese goals and could therefore be declared a ‘‘Gold Standard,’’but each of the available methods achieves some of these goalsbest; we will call them conditional ‘‘Silver Standards.’’
The results obtained with these methods are summarized inTable 2. Airway instillation fixation (SECTION 3.3.1 [SilverStandard A]) preserves alveolar septal structures and capillaryblood content, but eliminates alveolar surface lining. Vascularperfusion fixation (SECTION 3.3.2 [Silver Standard B]) preservesalveolar surface lining and internal architecture but capillaryblood is lost. Both methods adequately preserve cell and tissuestructure for morphometry under LM and EM. Formaldehydefixation for short periods (4–6 h) preserves the cell immunoge-nicity, but does not adequately preserve cell structure or tissuearchitecture; this is improved in the sense of a compromise byadding some glutaraldehyde (SECTION 3.3.3 [Silver Standard C]).The choice of fixation method depends on the pre-defined studygoal. A combination of such methods is necessary to obtaina complete picture of lung structure (51). The standards de-scribed below should be observed with the highest rigor, asthese technical considerations determine the quality of tissuesamples and hence the quality of the results. Where stringent‘‘ideal’’ fixation conditions cannot always be fulfilled (e.g., indiagnostic pathology), it is essential to control the changes,estimate the effect of deviation (correction factors), and defineand declare in any communication the limitations of thepreparation.
In summary, the fixation and preparation methods shouldbe carefully defined and consistently applied to avoid bias.Quality of the specimen depends on the fixing agent, routeof fixative application, control of pressures, and processingprocedures. The appropriate protocol should be chosen ac-cording to study goals (52, 53). Because air and blood con-tents fluctuate widely in vivo, it is necessary to documentand control the physiologic variables under which the lung isfixed.
3.2. Methods of Fixation
3.2.1. Fixing agents. (a) Formaldehyde is a good general-purpose fixative for LM, diagnostic pathology, immunohis-
tochemistry and immunocytochemistry with/without antigenretrieval techniques, because it does not completely destroyprotein immunogenicity (54, 55). However, formaldehyde doesnot adequately stabilize tissue structure; the fixed lung is subjectto significant mechanical distortion and collapse. In addition,cell ultrastructures are not adequately fixed for EM.
(b) Glutaraldehyde is a di-aldehyde with potent proteincross-linking ability (56, 57) that rapidly stabilizes cell struc-ture, resulting in stable lung architecture that resists mechan-ical distortion. It is the preferred fixative for EM studies. Thelung can be adequately fixed using buffered 2.5% glutaralde-hyde, sometimes combined with paraformaldehyde, a solidpolymer of formaldehyde (57, 58). Because cell membranesremain semipermeable after fixation, hypertonic glutaralde-hyde solutions should be avoided (59). Glutaraldehyde in highconcentrations destroys protein immunogenicity and is nota suitable fixing agent for immunohistochemistry.
(c) Osmium tetroxide in isotonic buffer is the originalfixative for EM; today it is used primarily as a ‘‘post-fixative’’of glutaraldehyde-fixed tissue, to stabilize and stain cellularmembranes by binding to unsaturated phospholipids. Osmicacid treatment reduces membrane permeability so that cells areless susceptible to osmotic effects.
(d) Uranyl acetate, a contrast agent commonly used intransmission EM, is also used as a second post-fixative thatstabilizes membranes via binding of uranyl ions to the phos-phodiester groups of saturated phospholipids, thereby reducingaxial diffusion of lipid molecules (60), an important consider-ation in preserving labile surfactant materials. Preservation ofsurfactant-containing lamellar bodies in alveolar type II cellsrequires prolonged en bloc staining with half-saturated aqueousuranyl acetate (61, 62).
(e) Ethanol or acetone, which dehydrates tissue and de-natures certain proteins, is an essential ingredient for fixing andstabilizing elastic fibers. (63)
3.2.2. Route of fixative application. (a) Immersion of tissuepieces in fixative preserves cell structure but sacrifices function-ally relevant 3D lung architecture. Only small blocks can befixed adequately for EM because penetration depth of glutar-aldehyde and osmium tetroxide is limited.
(b) Instillation of fixative solution through the airways undercontrolled pressure is the standard route that allows excellentpreservation of tissue and capillary blood, provided the fixativeis iso-osmolar with respect to plasma (51).
TABLE 2. COMPARATIVE QUALIFICATION OF RESULTS OF DIFFERENT METHODS OF LUNG FIXATION FOR MORPHOMETRY
Airway Instillation Vascular Perfusion
Rapid Freezing
GOAL To preserve:
2.5% GA buffered 0
OsO4, UrAc
Formaldehyde,
Paraformaldehyde
GA / OsO4 / UrAc /
Alcohol dehydration Freeze substitution
Lung volume 11 — 111 —
Internal architecture 11 — 111 —
Parenchyma 11 — 111 —
Airways and vessels 11 — 111 —
Tissue fine structure 111 1 11 —
Capillary blood 111 1 — —
Cell structure 111 — 11 —
Surface lining and edema — — 111 1
Cells: molecular identity — 1 — 1
LM 1 1 1 1
TEM 1 — 1 —
SEM 1 — 1 —
LSM — 1 — 1
111 excellent, 11 good, 1 acceptable, – inadequate.
Definition of abbreviations: GA 5 glutaraldehyde; LM 5 light microscopy; LSM 5 laser scanning confocal microscopy; OsO4 5 osmium tetroxide; SEM 5 scanning
electron microscopy; TEM 5 transmission electron microscopy; UrAc 5 Uranyl acetate.
400 AMERICAN JOURNAL OF RESPIRATORY AND CRITICAL CARE MEDICINE VOL 181 2010
(c) Vascular perfusion of fixative in an air-inflated lungeliminates capillary content but preserves the structure ofalveolar and airway surface, including constituents of thesurface lining layer (64–66).
(d) Intrapulmonary injection of glutaraldehyde solutionallows rapid fixation of tissue samples when the lung cannotbe fixed in toto through the airway or vasculature. (67)
(e) Rapid freezing followed by freeze-substitution is usedfor certain applications (e.g., when histology is combined withimmunocytochemical and molecular genetic studies) (68–70).The poor heat conductivity of porous lung tissue requiresfreeze-substitution fixation of frozen lung samples in alcohol-based or ethylene glycol-based fixatives, which allows LMmorphometry to be performed, for example, in correlationwith functional imaging (71, 72). Specimens thus obtainedcannot be used for EM because replacement of ice with thesubstituting fixative is feasible only to short distances (mi-crometers) from the surface, leading to inhomogeneous andinadequate cell and tissue preservation (73), except for verysmall samples (74).
3.2.3. Control of pressures. Airway pressure determines thedegree of unfolding of alveolar structures, vascular pressuredetermines capillary filling, and osmotic pressure of the fixativedetermines the degree of cell swelling or shrinkage.
(a) In airway instillation, the fixative must be instilled post-mortem using a sufficiently high pressure (20–25 cm H2O abovethe highest point of the lung) and a rapid flow to ensure uniformpenetration into the parenchyma, because lung tissue andcapillary blood is fixed immediately upon contact with fixative.The tubing must be as wide and short as possible. The in-stillation pressure and perfusion state should be standardizedand clearly documented. Instilling the fixative while blood isflowing may cause some capillaries to be engorged witherythrocytes, stacking up behind fixed capillary segments.Conversely, if the lung is exsanguinated before fixation, thecapillaries will be empty. A useful precaution is to clamp themain pulmonary artery with a snare just before instillation (75).
(b) In vascular perfusion fixation, airway pressure must becontrolled to achieve adequate alveolar distension (64, 76). Theperfusion pressures must be controlled in the pulmonary arterycannula and in the left atrium to define perfusion conditions inrelation to airway pressure (zone 2 and 3 conditions); zonalconditions determine the degree of capillary distension (64, 77).Alternatively, the lung can be fixed at defined transmuralpressures under no flow conditions (78).
(c) Osmotic pressure of the fixative is difficult to controlbecause the process of fixation binds glutaraldehyde molecules,causing osmotic pressure to fall, whereas osmium tetroxidealters semipermeability of cell membranes (59, 79). For thisreason, the fixative solutions could be made slightly hypertonic(total osmolarity 350 mOsm for instillation and 510 mOsm forperfusion fixation); higher osmolarity causes cells to shrink. Inperfusion fixation, dextran could be added to adjust oncoticpressure (64).
3.2.4. Tissue processing. The fixed lung should be immersedin the fixative solution for at least 24 hours to allow full tis-sue fixation. After sampling, tissue blocks are dehydratedthrough graded ethanol into an intermediate solvent, dependingon the embedding medium. The best quality is obtained withembedding in epoxy resins (for EM and high resolution LM) orin glycol methacrylate (for LM). Embedding in paraffin hassome advantages for LM (staining and solubility) and is thetraditional standard in pathology (archival material), but causesunpredictable tissue shrinkage, a disadvantage for morphome-try unless sampling is done with the fractionator techniqueaiming at estimation of total number of cells or alveoli (SECTION
4.2.5.). Samples for EM are post-fixed in buffered 1% osmiumtetroxide (avoid phosphate buffer here) followed by blocstaining with uranyl acetate solution (61). Dehydration inethanol series follows before embedding.
3.3. Conditional Silver Standards of Fixation
3.3.1. Silver Standard A: airway instillation fixation. The fixativeis a 2.5% glutaraldehyde solution buffered (pH 7.4) withpotassium phosphate, HEPES, or cacodylate (total osmolarity350 mOsm). This solution is instilled with rapid flow intoairways after lung collapse at a head pressure 20–25 cm abovethe highest point of the lung (51). A slow inflow may causeinhomogeneous lung fixation. In open chest preparations, themain pulmonary artery may be clamped with a snare just beforeinstillation to prevent flowing erythrocytes from stacking upbehind fixed capillary segments (75). After fixation, airwayinflation pressure must be maintained for at least 24 hours, bytying off the trachea or the tubing without leaks.
3.3.2. Silver Standard B: vascular perfusion fixation. Theprimary fixative is a 2.5% glutaraldehyde solution buffered(pH 7.4) with potassium phosphate, HEPES, or cacodylate withthe addition of 3% dextran (total osmolarity 510 mOsm) andapplied by vascular perfusion, followed by sequential perfusionof buffered solutions of (1) 1% osmium tetroxide and (2) 0.5%uranyl acetate with dextran (64), then immediately followed byperfusion of ethanol (70–100%) (63).
The lung is perfused either in situ or as isolated organ, withthe animal heparinized before surgery. An inflow cannula isinserted into the pulmonary artery and an outflow cannula intothe left atrium; pressures in both cannulas should be monitoredand controlled. The pulmonary circulation is flushed free ofblood with a buffered iso-osmolar solution containing dextranor BSA (64). Air inflation of the lung must be controlled beforeperfusing with fixative solution. After completion of perfusionfixation, the lung can immediately be sliced for volume estima-tion and sampling.
3.3.3. Silver Standard C: fixation for stereology and immuno-cytochemistry. This method is a compromise to allow retentionof immunogenicity of epitopes while preserving structural in-tegrity for morphometry. A combination of 4% formaldehydewith 0.1% glutaraldehyde in 0.2 M HEPES buffer followed byfreeze substitution in 0.5% uranyl acetate in methanol (80) hasproven successful. Depending on the antibody used, othercombinations may also be used. The fixative is applied byairway instillation or by vascular perfusion, after adding dex-tran. Lung tissue fixed this way can be processed for immuno-cytochemistry (54) or stereology (81).
3.4. Special Problems Related to Lung Size
3.4.1. Large lungs (human, dog, pig, horse). When instillingfixative solution through the airways, the diameters of the tra-cheal cannula and the tubing connecting to the fixative reservoirshould be as large as possible. To ensure rapid, even fixation,one may start with a higher pressure-head, gradually bringing itdown to the final pressure (20–25 cm H2O). The fixed lung canbe immersed in a plastic bag containing the fixative solutionand the bag floated on a water bath to avoid crushing the lungunder its own weight. Because of significant regional structuralheterogeneity, each lung should be divided into lobes or strata(e.g., upper and lower zones) and the sampling scheme per-formed separately for each stratum or lobe.
3.4.2. Small lungs (rodent, embryo, early postnatal pup). Toobtain uniform and reproducible lung fixation as well asaccurate morphometric measurements in small lungs (82),a number of issues must be considered:
American Thoracic Society Documents 401

(a) The small luminal diameter of the trachea (, 1 mm)requires narrow plastic or glass tracheal cannulas that show highresistance or capillarity forces during instillation of the fixative.Combined with a lower content of connective tissue fibers, thesmall trachea and lungs are prone to rupture when stretched.
(b) The liquid that fills embryonic lungs may dilute thefixative and impede its proper distribution. Partial removal oflung liquid by gently massaging the thorax, by careful suctionwith a syringe, and by using slightly hyper-osmolar fixatives mayhelp to overcome this problem (83). The fixed lung sectionsshould be carefully assessed for rupture artifact and, if present,the fixation approach should be modified.
(c) Caution is needed when measuring volume of small fixedlung by liquid displacement, because any liquid that is carriedwith the lung, including liquid trapped between adjacent pleuralsurfaces, will falsely elevate the estimated lung volume (SECTION
5.1).(d) Even small lungs exhibit marked regional differences
(84), which require multistage sampling just like larger lungs.Because of a high surface-to-volume ratio of small lungs, thesubpleural region with its airway tips perpendicularly orientedto the pleural surface represents a higher volume proportionthan in larger lungs.
(e) For initial sampling of larger lungs, macroscopicmethods are convenient to create slabs, slices, and cubes.For small lungs, microscopic methods are the choice; usea microtome and/or ultramicrotome to cut uniform serialsections and select tissue samples according to the principlesof systematic uniform random sampling (SECTION 4). Assump-tions or forerunning morphometric analyses may have to bemade about structural similarity between the right and leftlung, or among lobes (84).
(f) Fixed lungs are typically immersed in fixative, and aftersampling, dehydrated in a solvent for the embedding media.Small lungs may collapse during these steps, particularly ifglutaraldehyde is not used. Processing the tissue in a lowvacuum can minimize collapse. Reagents should be placed ina vacuum before use to remove dissolved gas, which otherwisemay distort or rupture the tissue when the gas comes out ofsolution. Excessive vacuum should be avoided, as it may alsorupture the fragile tissue.
(g) Compared with human lungs, higher magnification maybe required when analyzing very small lungs, to adequatelyresolve structural details due to a near fivefold difference in thescale of the structures (e.g., size of acinar airways) (SECTION 8.3).
3.5. Preparation Artifacts
Because of inherent airspace instability, dimensional changesoccurring during tissue preparation should be controlled anddetermined (85), including changes in lung volume or its sub-structures (shrinkage or swelling) as well as mechanical distor-tion caused by cutting thin sections. The volume of airspacesrepresented on paraffin-embedded formalin-fixed lung sectionsmay be as little as 15% of total lung capacity (TLC) (1) becauseeach preparatory step (formalin fixation, dehydration, paraffinembedding, and sectioning) progressively reduces apparentairspace volume of the fixed tissue. This serious problem canlargely be avoided by selecting appropriate fixation and prep-aration procedures, namely glutaraldehyde instead of formalinfixation, and epoxy or glycol methacrylate resin instead ofparaffin embedding.
Volume of instillation-fixed lungs represents about 3/4 ofTLC (86); this volume serves as reference for controllingdimensional changes in subsequent steps. Glutaraldehyde-fixedlungs are resilient to mechanical distortion during processing.Dehydration and embedding in Epoxy resins result in less than
5% linear tissue shrinkage (87). Embedding in glycol methacry-late also incurs little shrinkage (88). Sectioning of embeddedtissue may compress tissue in the cutting direction, thus re-ducing the section area in an anisotropic way. Shrinkage can beestimated by taking sequential photographs of the same tissueblock in (1) fixed state, (2) embedded block, and (3) histologicsection, and measuring the distance dx between identifiablelandmarks: the ratios d2/d1 5 f1, and d3/d2 5 f2 are stepwiselinear shrinkage factors, with total shrinkage amounting to f0 5
f1�f2. Volume shrinkage 5 f03. Assuming structural homogeneity
and isotropy of tissue shrinkage, this factor (f03) can be used to
reduce the measured lung volume V(L) in the fixed state to thatcorresponding to sections
VðLÞsection 5 f30 �VðLÞ (3)
Section compression is estimated in a similar way by mea-suring the distance between landmarks on embedded blocksand sections in the section direction and perpendicularly to it.Cell shrinkage or swelling may be avoided by carefully control-ling the osmolarity of fixative solutions (59, 79).
It is often assumed that artifacts or bias are unimportantwhen the study goal is to compare two experimental groups.This assumption is valid only if experimental conditions andstructural alteration do not lead to differential shrinkagebetween the groups being compared. For example, the fibroticor emphysematous lung shrinks differently from the normalcontrol lung. Where it is justified to conclude that relative bias isthe same among different experimental groups, biased data canstill allow valid between-group comparisons. Such data do notprovide ‘‘true’’ or accurate values but retain their comparativeworth. The weakness of this approach resides in the fact thata given study may be open to multiple sources of bias, some ofwhich yield overestimates and others underestimates of the truevalue.
4. SAMPLING WHOLE LUNGS FOR MORPHOMETRY
4.1. Sampling Rules
To ensure that selected tissue samples—whether for morphom-etry, immunocytochemistry, or gene expression—represent thewhole, all parts of the lung should have equal probability ofbeing sampled. This requirement is met by introducing ran-domness into the sampling process (19, 89–91). In the simplestrandom sampling procedure, the lung or lobe is cut into serialslices at a constant thickness interval. The slices to be selectedare determined by random numbers. The best way to avoidsampling bias is to adhere strictly to the proven unbiasedsampling procedures (below); adherence is particularly impor-tant when some components (airways and vessels) are notrandomly distributed or oriented (91, 92) because the estima-tion of volume and number is orientation-independent but theestimation of surface and length is orientation-dependent.
4.2. Unbiased Sampling Procedures
4.2.1. Systematic uniform random sampling (SURS). This isa simple procedure. An initial random cut is made throughthe lung followed by serial parallel slices made at a constantthickness interval. The slices are flipped 908 in the samedirection so the cut faces are visible. A lattice grid is laid overthe slices and tissue blocks are selected systematically (e.g.,taking a block in every fifth grid square in every fifth row, witha random start). Because more squares fall on larger slices, eachunit lung volume is sampled with equal probability.
402 AMERICAN JOURNAL OF RESPIRATORY AND CRITICAL CARE MEDICINE VOL 181 2010

4.2.2. Stratified uniform random sampling (StURS). This isa variant of SURS useful in the study of large lungs, whereheterogeneity is suspected, or in studies that affect only part ofthe lung (93). The lung is divided into strata of similar or verydifferent size (e.g., left and right lower and upper lobes); eachstratum is serially sliced at equal thickness with a random start inthe first cut (Figure 2). All slices in each stratum are laid out withthe upper cut surface up and a square grid with numbered lines isused to obtain a defined number of samples by means of randomnumbers; alternatively, one can also use the systematic samplingmethod described in SECTION 4.2.1. In the example shown, thesample blocks are divided into parts and processed for LM and EM;alternatively, independent samples can be selected separately forLM and EM (30).
4.2.3. Isotropic uniform random (IUR) sampling (30). This issimilar to SUR sampling, with the addition of specific pro-cedures termed ‘‘orientator’’ (94) or ‘‘isector’’ (95) to orient theblocks and ensure that selected blocks are embedded in random(isotropic) directions for estimating the length or surface ofairways and vessels. These orienting procedures are not neces-sary with respect to the surface of alveoli, which face alldirections with about equal probability.
4.2.4. Vertical sections. These are cut for estimating surfacearea of conducting airways and blood vessels to account forpotential bias caused by their preferential direction and non-random orientation (96) (Figure 3). They may also be used fora range of local cell size estimates.
4.2.5. Fractionator. This is a comprehensive sampling ap-proach (97, 98) that begins with serial sectioning though theentire specimen, followed by systematic selection of a knownfraction of the whole (99) (Figure 4). This procedure can becombined with point-counting (Cavalieri) estimates of volume,specific section orientation (vertical or isotropic sections), andmultistage stratified sampling (below) to quantify the number,volume, surface, and length of lung structure and specificsubcompartments. Because the fraction sampled from the wholeis known, estimates of total number are not affected by tissueshrinkage artifact.
4.2.6. Multistage cascade sampling. Unbiased sampling pro-cedures can be stratified, or repeated, at different magnificationsof the specimen where the object of interest at one level becomesthe reference object in the next level of higher magnification (90).After tissue blocks are selected from serial lung slices by anunbiased sampling procedure, multiple histologic sections are cutfrom each block, allowing for random orientation.
The same sampling procedure is reapplied to select sectionsfor analysis under the microscope, and again to select micro-scopic fields to be overlaid with a test system. The final mea-
surements are related back through the cascade of levels to theabsolute volume of the lung or lobe (SECTION 6).
4.3. Sampling Focal Lesions
The size, frequency, and distribution of lesions in the lungdictate the sampling approach. When lesions comprise greaterthan 10% of lung volume, the global sampling approaches des-cribed above work well. When lesions comprise 5% or less oftotal lung volume and are heterogeneously distributed, globalsampling is difficult. One approach is to sample the lung as des-cribed above to estimate the volume of lesions, and then sub-sample regions within the lesions for detailed analysis using anappropriate random sampling strategy (100). This approach hasbeen used to show changes in fibroblast number in lung lesionsafter treatment for bleomycin-induced pulmonary fibrosis (101).
4.4. How Much Sampling Is Enough?
Statistical efficiency of morphometric results is given by
CV2ðobservedÞ5 CV
2ðbiologicalÞ1 CE2ðmethodÞ (4)
where CV(observed) is the observed coefficient of variation,CV(biological) is the true biological variation or ‘‘signal’’ (un-known), and CE(method) is the coefficient of error or estimateof the ‘‘noise’’ introduced by sampling and measurement varia-tion. The general rule is that the ‘‘noise’’ should not exceed the‘‘signal,’’
CE2ðmethodÞ < 1=2 CV
2ðbiologicalÞ (5)
and efficiency considerations means that it is wasteful ofresources to make CE(method) � CV(biological) (i.e., the‘‘do more less well’’ paradigm) (38, 39).
The contributions of sampling and measurement variation todirect volume estimates by the Cavalieri method have beenderived (102). Contributions to measurement variation for ratioestimators like volume, number, surface, and length densitiesare also available (103). Simple guidelines suffice for samplesize within an animal (primary sampling unit) as follows: 100–200 probe interactions (e.g., point hits or intersections), 50 fields,and 10 blocks; the latter two sample sizes may have to beincreased in inhomogeneous tissue (104).
5. ESTABLISHING REFERENCE PARAMETERS
Primary morphometric measurements are usually densities(e.g., volume density 5 fractional volume of structure withinthe containing volume [in cm3/cm3] or surface density 5 surface
Figure 2. Stratified uniformrandom sampling (StURS) of
dog lung by division into four
regional strata of similar size,
for example, upper and lowerstrata of left and right lung
(207). (A) In each stratum,
serial slices of thickness h are
generated by Cavalieri sam-pling with random start of first
cut. (B) The slices are laid out
with upper cut surface up;
a grid of 10 3 10 rows isoverlaid to identify four sam-
ples by generating two-digit
random numbers that hit the lung parenchyma (gray squares). (C) The sample blocks are divided and embedded for light microscopy (LM) and
electron microscopy (EM); alternatively, one may obtain independent random number samples for LM and EM.
American Thoracic Society Documents 403
area of structure within the containing volume [in cm2/cm3]). Tomake functional sense, such primary parameters must be con-verted to absolute quantities (e.g., volume [cm3] or surface[cm2]) in relation to a defined reference volume:
Density of structure 3 Reference volume 5 Quantity of structure
(6)
Misinterpretation of data can arise if only densities areexamined without consideration of changes in the referencespace; this error is termed the ‘‘reference trap.’’ For example,after resection of one lung (pneumonectomy), the remaininglung nearly doubles its volume at a given transpulmonary pres-sure. If volume density of alveolar septal tissue in the remaininglung is normal, then the absolute quantity of alveolar tissuemust have doubled. If the density of alveolar tissue is belownormal, its absolute quantity may or may not have increased.Accurate measurement of reference volume is of critical im-portance for data interpretation because it is often the onlyabsolute quantity in the analytical scheme.
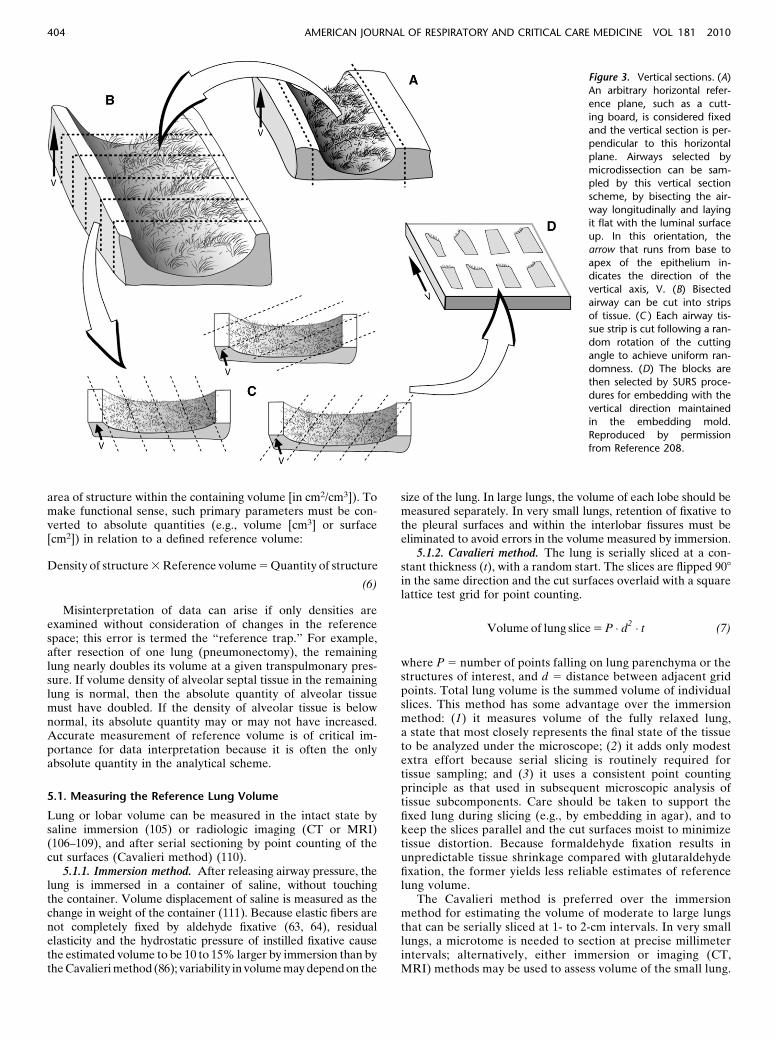
5.1. Measuring the Reference Lung Volume
Lung or lobar volume can be measured in the intact state bysaline immersion (105) or radiologic imaging (CT or MRI)(106–109), and after serial sectioning by point counting of thecut surfaces (Cavalieri method) (110).
5.1.1. Immersion method. After releasing airway pressure, thelung is immersed in a container of saline, without touchingthe container. Volume displacement of saline is measured as thechange in weight of the container (111). Because elastic fibers arenot completely fixed by aldehyde fixative (63, 64), residualelasticity and the hydrostatic pressure of instilled fixative causethe estimated volume to be 10 to 15% larger by immersion than bythe Cavalieri method (86); variability in volume may depend on the
size of the lung. In large lungs, the volume of each lobe should bemeasured separately. In very small lungs, retention of fixative tothe pleural surfaces and within the interlobar fissures must beeliminated to avoid errors in the volume measured by immersion.
5.1.2. Cavalieri method. The lung is serially sliced at a con-stant thickness (t), with a random start. The slices are flipped 908
in the same direction and the cut surfaces overlaid with a squarelattice test grid for point counting.
Volume of lung slice 5 P � d2 � t (7)
where P 5 number of points falling on lung parenchyma or thestructures of interest, and d 5 distance between adjacent gridpoints. Total lung volume is the summed volume of individualslices. This method has some advantage over the immersionmethod: (1) it measures volume of the fully relaxed lung,a state that most closely represents the final state of the tissueto be analyzed under the microscope; (2) it adds only modestextra effort because serial slicing is routinely required fortissue sampling; and (3) it uses a consistent point countingprinciple as that used in subsequent microscopic analysis oftissue subcomponents. Care should be taken to support thefixed lung during slicing (e.g., by embedding in agar), and tokeep the slices parallel and the cut surfaces moist to minimizetissue distortion. Because formaldehyde fixation results inunpredictable tissue shrinkage compared with glutaraldehydefixation, the former yields less reliable estimates of referencelung volume.
The Cavalieri method is preferred over the immersionmethod for estimating the volume of moderate to large lungsthat can be serially sliced at 1- to 2-cm intervals. In very smalllungs, a microtome is needed to section at precise millimeterintervals; alternatively, either immersion or imaging (CT,MRI) methods may be used to assess volume of the small lung.
Figure 3. Vertical sections. (A)
An arbitrary horizontal refer-
ence plane, such as a cutt-
ing board, is considered fixedand the vertical section is per-
pendicular to this horizontal
plane. Airways selected by
microdissection can be sam-pled by this vertical section
scheme, by bisecting the air-
way longitudinally and laying
it flat with the luminal surfaceup. In this orientation, the
arrow that runs from base to
apex of the epithelium in-dicates the direction of the
vertical axis, V. (B) Bisected
airway can be cut into strips
of tissue. (C ) Each airway tis-sue strip is cut following a ran-
dom rotation of the cutting
angle to achieve uniform ran-
domness. (D) The blocks arethen selected by SURS proce-
dures for embedding with the
vertical direction maintainedin the embedding mold.
Reproduced by permission
from Reference 208.
404 AMERICAN JOURNAL OF RESPIRATORY AND CRITICAL CARE MEDICINE VOL 181 2010

5.2. Defining the Reference Space
The principle of reference space extends to microscopic levels. Areference space should be defined at each level of progressivelyhigher magnification. For example, to estimate the absolutevolume of extravascular alveolar tissue [V(tissue)] by pointcounting, total lung volume [V(L)] is estimated first by theCavalieri method on gross lung slices. Then the volume density
of alveolar septum per unit lung volume, VV(s,L) is estimated atlow-power LM. Next, the volume density of alveolar tissue perunit volume of alveolar septum, VV(tissue,s), is obtained underhigh-power LM or EM. Then,
VðtissueÞ 5 VVðtissue; sÞ3 VVðs;LÞ3 VðLÞ (8)
6. MORPHOMETRY OF LUNG PARENCHYMA
6.1. Multistage Stratified Analysis
Beyond the terminal bronchiole lie the acini, the basic gasexchange units containing alveolated distal airways andalveoli. Intra-acinar airway diameter changes little with eachgeneration so that total airway cross-section nearly doubleswith each generation. The gas exchange region is subdividedby interalveolar septa, the number and size of alveoli beingdescriptors of this subdivision. The alveolar septa, cells, andcapillaries are minute and separated by large volumes of air,necessitating multistage cascade analysis at sequentially highermagnifications to ensure adequate spatial resolution whileminimizing sample number and size at each level (30) (Figure5).
6.2. Volume Density and Absolute Volume
Point counting is used to estimate the volume fractions ofparenchyma, alveolar septa, and their constituents, in a cascadeprocedure (Figure 5). A consistent definition of compartmentsmust be maintained at all levels:
Level I (macroscopic): estimating total lung volume by mea-suring the area of lung surfaces (Ai) for all tissue slices i, andmultiplying the summed areas by the slice thickness (t), that is,
VðLÞ5 Si Ai � t (9)
Level II (low-power LM): estimating the fraction of totallung volume occupied by parenchyma VV(p,L), excluding non-parenchyma, that is, bronchi, vessels, interlobular septa, lymphnodes, etc. with diameters greater than 1 mm (coarse non-parenchyma) and between 20 mm and 1 mm (fine nonparen-chyma), and expressed as a ratio of points on parenchyma P(p)to points on lung tissue P(L). Because nonparenchyma consti-tutes a small fraction (z 10%), it is more efficient to countpoints hitting nonparenchyma P(np):
VVðp;LÞ5 12PðnpÞ=PðLÞ (10)
Small rodent lungs contain only fine nonparenchyma, whilein large lungs it is useful to separately estimate coarse and finenonparenchyma in two steps:
Level II-a (macroscopic, 1–103): counting, on Cavalieri slicesurfaces, points hitting coarse nonparenchyma (cnp) (bronchiand vessels . 1 mm in diameter) yields the volume fraction ofcnp in total lung volume:
VVðcnp;LÞ5 PðcnpÞ=PðLÞ (11)
Volume fraction of coarse parenchyma in total lung volume,VV(cp, L) 5 1-VV(cnp, L).
Level II-b (low-power LM, 100–2503): estimating the vol-ume density of fine nonparenchyma VV(fnp) (bronchi andvessels 20 mm to 1 mm in diameter) as a ratio of test point hitson these structures P(fnp) to points hitting lung tissue, exclud-ing coarse nonparenchyma structures P(cp) to obtain VV(fnp) 5
Figure 4. Isotropic uniform random sampling scheme, comprised of
uniform sampling (smooth fractionator) followed by procedures that
ensure isotropic orientation (isector). (A) A lung is embedded in agar
and cut into slabs at a constant interval and a random start of the firstcut. (B) Each slab is laid flat (two are shown) and the lung volumes
estimated by point counting (volume 5 thickness 3 area). The selected
slabs are cut into bars with the same width as the slab thickness, andsorted according to the area of the upper surface (e.g., largest to
smallest). Every third bar is selected (shown by arrows, a fractionator
sequence with sampling fraction 5 1/3 using a random start). (C ) Each
selected bar is cut into bricks, sorted again according to the area of theupper surface, and every third bar is selected (shown by arrows,
continuing the fractionator sequence at sampling fraction 5 1/3 using
random start). (D) To ensure isotropic orientation, the selected bricks
are placed into spherical embedding molds (in agar or plastic), allowedto harden, removed from the mold, and rolled on the bench top before
further embedding, sectioning, and staining.
American Thoracic Society Documents 405
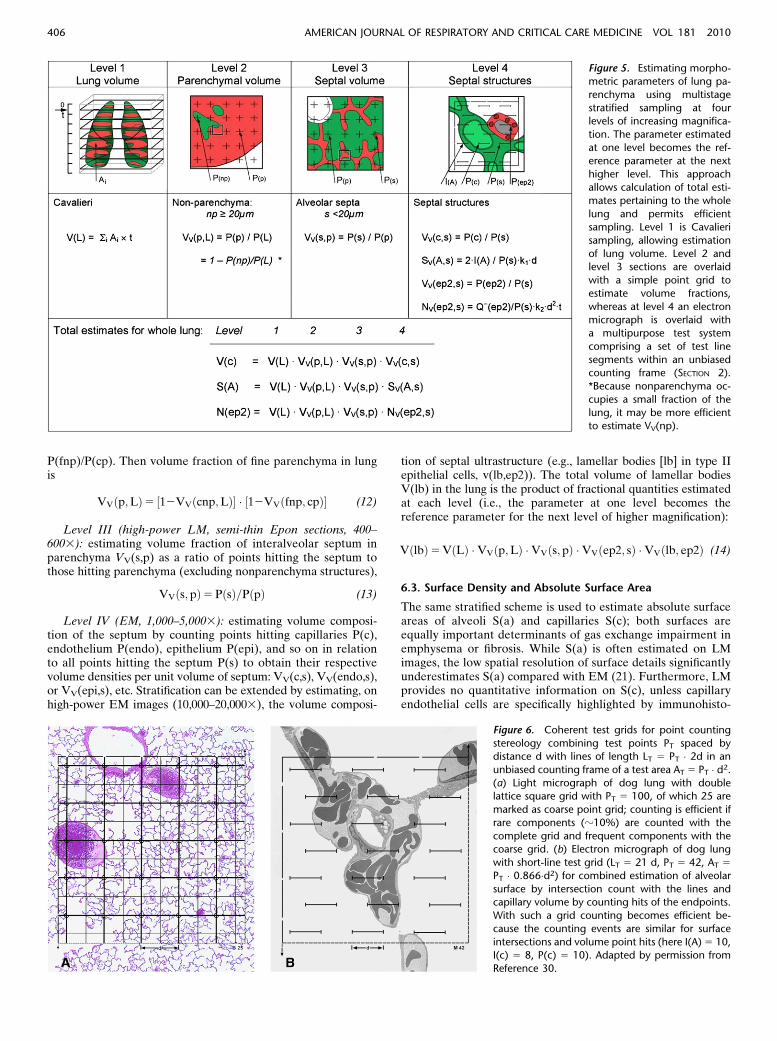
P(fnp)/P(cp). Then volume fraction of fine parenchyma in lungis
VVðp;LÞ5 ½12VVðcnp;LÞ� � ½12VVðfnp; cpÞ� (12)
Level III (high-power LM, semi-thin Epon sections, 400–6003): estimating volume fraction of interalveolar septum inparenchyma VV(s,p) as a ratio of points hitting the septum tothose hitting parenchyma (excluding nonparenchyma structures),
VVðs; pÞ5 PðsÞ=PðpÞ (13)
Level IV (EM, 1,000–5,0003): estimating volume composi-tion of the septum by counting points hitting capillaries P(c),endothelium P(endo), epithelium P(epi), and so on in relationto all points hitting the septum P(s) to obtain their respectivevolume densities per unit volume of septum: VV(c,s), VV(endo,s),or VV(epi,s), etc. Stratification can be extended by estimating, onhigh-power EM images (10,000–20,0003), the volume composi-
tion of septal ultrastructure (e.g., lamellar bodies [lb] in type IIepithelial cells, v(lb,ep2)). The total volume of lamellar bodiesV(lb) in the lung is the product of fractional quantities estimatedat each level (i.e., the parameter at one level becomes thereference parameter for the next level of higher magnification):
VðlbÞ5 VðLÞ �VVðp;LÞ �VVðs; pÞ �VVðep2; sÞ �VVðlb; ep2Þ (14)
6.3. Surface Density and Absolute Surface Area
The same stratified scheme is used to estimate absolute surfaceareas of alveoli S(a) and capillaries S(c); both surfaces areequally important determinants of gas exchange impairment inemphysema or fibrosis. While S(a) is often estimated on LMimages, the low spatial resolution of surface details significantlyunderestimates S(a) compared with EM (21). Furthermore, LMprovides no quantitative information on S(c), unless capillaryendothelial cells are specifically highlighted by immunohisto-
Figure 5. Estimating morpho-metric parameters of lung pa-
renchyma using multistage
stratified sampling at fourlevels of increasing magnifica-
tion. The parameter estimated
at one level becomes the ref-
erence parameter at the nexthigher level. This approach
allows calculation of total esti-
mates pertaining to the whole
lung and permits efficientsampling. Level 1 is Cavalieri
sampling, allowing estimation
of lung volume. Level 2 andlevel 3 sections are overlaid
with a simple point grid to
estimate volume fractions,
whereas at level 4 an electronmicrograph is overlaid with
a multipurpose test system
comprising a set of test line
segments within an unbiasedcounting frame (SECTION 2).
*Because nonparenchyma oc-
cupies a small fraction of the
lung, it may be more efficientto estimate VV(np).
Figure 6. Coherent test grids for point counting
stereology combining test points PT spaced bydistance d with lines of length LT 5 PT � 2d in an
unbiased counting frame of a test area AT 5 PT � d2.
(a) Light micrograph of dog lung with doublelattice square grid with PT 5 100, of which 25 are
marked as coarse point grid; counting is efficient if
rare components (z10%) are counted with the
complete grid and frequent components with thecoarse grid. (b) Electron micrograph of dog lung
with short-line test grid (LT 5 21 d, PT 5 42, AT 5
PT � 0.866�d2) for combined estimation of alveolar
surface by intersection count with the lines andcapillary volume by counting hits of the endpoints.
With such a grid counting becomes efficient be-
cause the counting events are similar for surface
intersections and volume point hits (here I(A) 5 10,I(c) 5 8, P(c) 5 10). Adapted by permission from
Reference 30.
406 AMERICAN JOURNAL OF RESPIRATORY AND CRITICAL CARE MEDICINE VOL 181 2010
chemistry. Hence, it is recommended that alveolar-capillarysurface areas be estimated under EM (. 1,0003), which is moreprecise but less efficient than LM combined with immunohis-tochemistry.
On EM images overlaid with a coherent test grid (Figures 5and 6), intersections with the alveolar surface contour I(a) arecounted, yielding alveolar surface density in septum SV(a,s)
SVða; sÞ5 2 � IðaÞ=LðsÞ (15)
where L(s) is the length of the test line contained in septum,ordinarily estimated by counting points P(s) on the septum:L(s) 5 K1�d � P(s); K1�d is line length per test point (21, 25).Multiplying SV(a,s) by the volume density of each stratifiedlevel and by absolute lung volume yields absolute S(a):
SðaÞ5 VL �VVðp;LÞ �VVðs; pÞ � SVða; sÞ (16)
The same principles are applied to measure surface densityof capillaries per unit volume of septum SV(c,s) and to derive anestimate of absolute S(c).
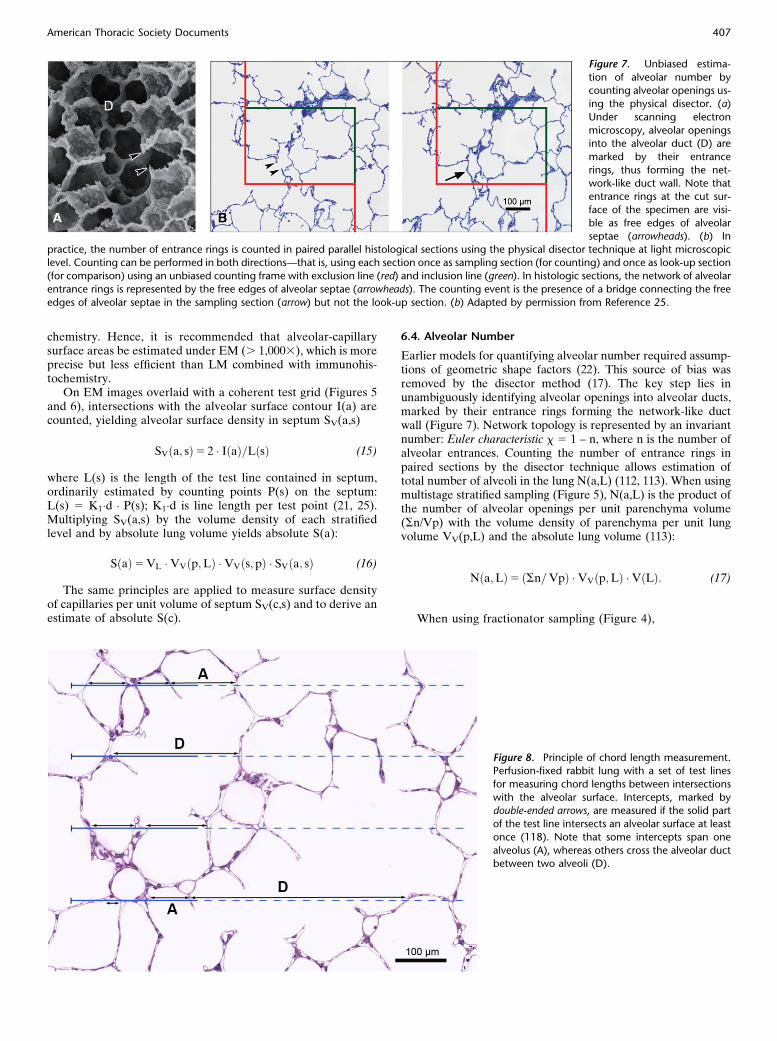
6.4. Alveolar Number
Earlier models for quantifying alveolar number required assump-tions of geometric shape factors (22). This source of bias wasremoved by the disector method (17). The key step lies inunambiguously identifying alveolar openings into alveolar ducts,marked by their entrance rings forming the network-like ductwall (Figure 7). Network topology is represented by an invariantnumber: Euler characteristic x 5 1 – n, where n is the number ofalveolar entrances. Counting the number of entrance rings inpaired sections by the disector technique allows estimation oftotal number of alveoli in the lung N(a,L) (112, 113). When usingmultistage stratified sampling (Figure 5), N(a,L) is the product ofthe number of alveolar openings per unit parenchyma volume(Sn/Vp) with the volume density of parenchyma per unit lungvolume VV(p,L) and the absolute lung volume (113):
Nða;LÞ5 ðSn=VpÞ �VVðp;LÞ �VðLÞ: (17)
When using fractionator sampling (Figure 4),
Figure 7. Unbiased estima-
tion of alveolar number bycounting alveolar openings us-
ing the physical disector. (a)
Under scanning electron
microscopy, alveolar openingsinto the alveolar duct (D) are
marked by their entrance
rings, thus forming the net-
work-like duct wall. Note thatentrance rings at the cut sur-
face of the specimen are visi-
ble as free edges of alveolarseptae (arrowheads). (b) In
practice, the number of entrance rings is counted in paired parallel histological sections using the physical disector technique at light microscopiclevel. Counting can be performed in both directions—that is, using each section once as sampling section (for counting) and once as look-up section
(for comparison) using an unbiased counting frame with exclusion line (red) and inclusion line (green). In histologic sections, the network of alveolar
entrance rings is represented by the free edges of alveolar septae (arrowheads). The counting event is the presence of a bridge connecting the free
edges of alveolar septae in the sampling section (arrow) but not the look-up section. (b) Adapted by permission from Reference 25.
Figure 8. Principle of chord length measurement.Perfusion-fixed rabbit lung with a set of test lines
for measuring chord lengths between intersections
with the alveolar surface. Intercepts, marked bydouble-ended arrows, are measured if the solid part
of the test line intersects an alveolar surface at least
once (118). Note that some intercepts span one
alveolus (A), whereas others cross the alveolar ductbetween two alveoli (D).
American Thoracic Society Documents 407

Nða;LÞ5 Sn=SF (18)
where n is the number of alveolar openings per sample and SF istotal sampling fraction, the product of the fractions of tissuebars, blocks, heights, and areas that are sampled at each level(99, 112). When estimating alveolar number using a multistagecascade sampling scheme, global specimen shrinkage should bemonitored and corrected for, whereas using fractionator sam-pling, shrinkage may be ignored.
6.5. Alveolar Size and its Variability
The ‘‘number-weighted’’ mean alveolar volume, �vNðaÞ, is esti-mated indirectly by dividing total volume of alveolar airspaces(excluding that of alveolar ducts), V(a,L), obtained by pointcounting, by total alveolar number, N(a,L), obtained by thedisector:
�vNðaÞ5 Vða;LÞ=Nða;LÞ (19)
Alternatively, the point-sampled intercept method (48) al-lows estimation of ‘‘volume-weighted’’ mean alveolar volume,�vV ðaÞ, as
�vVðaÞ5 ðp=3Þ ��l 3IAS (20)
where �l 3IAS is the mean of the cubed point-sampled intercepts of
alveoli, again excluding that of alveolar ducts. When both �vNðaÞand �vVðaÞ are known, alveolar size variability can be extractedbecause volume-weighted mean volume equals the number-weighted mean volume amplified by the relative variance, CVN
2
(48):
�vVðaÞ5 �vNðaÞ � ð1 1 CV2NÞ (21)
The coefficient of variation of alveolar volume can thus beestimated. Alveolar size as seen in fixed specimens depends onthe inflation state during fixation and subsequent shrinkageduring processing. Such measurements are meaningful only ifthese sources of variability are defined and standardized and ifalveolar architecture is preserved.
6.6. Mean Linear Intercept
A popular, but often misinterpreted, measure of lung archi-tecture is ‘‘mean linear intercept length’’ (or ‘‘mean chordlength’’) Lm, which is the mean length of line segments onrandom test lines spanning the airspace between intersectionsof the line with the alveolar surface (Figure 8). Chord linesoften cross from one alveolus through an alveolar duct to anopposite alveolus, indicating that Lm characterizes the entireacinar airspace complex and not just alveoli. In simplest terms,Lm is an estimator of volume-to-surface ratio of acinar airspaces(V/S)airspace, alveoli and alveolar ducts taken together:
Lm 5 4 �VðairspaceÞ=SðaÞ5 4 � ðV=SÞairspace (22)
where V(airspace) is air volume in alveoli and ducts, and S(a) isalveolar surface area (7, 24, 114–117). Two methods can be usedto estimate Lm (118).
(1) In analogy to the estimation of alveolar surface density,Lm can be estimated, in the first place, by simple point andintersection counting using a suitable coherent test line systemwith unit length d (Figures 5 and 6)—that is, counting pointshitting airspaces P(airspace) and intersections of a test linesystem with alveolar surface I(a) to obtain
Lm 5 2 � d � PðairspaceÞ=IðaÞ (23)
With proper sampling and interpretation, this method ofestimating Lm is unbiased. Note that Lm and the reciprocal ofalveolar surface density in parenchymal volume, SV(a,p), arenearly the same, with one exception: Lm relates to airspaces,whereas the reference for SV(a,p) includes the volume of in-teralveolar septal tissue. In fibrotic lungs this difference can besignificant; the correct measurement of Lm must exclude thevolume occupied by the septa and limit the measurement toairspaces (Figure 8), which requires adequate magnification.
(2) Digitization of images combined with computer-assistedimage analysis allows linear integration of chord lengths mea-sured automatically or semi-automatically on a set of test linesrandomly placed on a microscope field (Figure 8). From thesemeasurements the chord length distribution, Lm, and othermoments of the distribution can be calculated (118). Theproblem with this approach is the automated recognition ofbona fide airspace intercepts; thresholding and setting lowercut-offs are approximations that introduce unknown biases.Observer intervention is required to ascertain the true in-tercepts on a limited sample of random test lines (Figure 8)with the computer suggesting intercepts and measuring thoseaccepted. In view of large variability between pulmonaryregions and individuals, there is very limited gain in precisionby measuring, on single images, all intercepts generated by thescan. This approach is more laborious than the countingmethod, but justified if more information is sought than meanchord length.
Lm is often misconstrued as a measure of ‘‘airspace size.’’This is incorrect because Lm reflects particle size only if theparticles (alveoli) are convex (i.e., a line traversing the particlegives rise to only one intercept). Acinar airspaces do not fulfillthis criterion (118) (Figure 8). The best characterization is thatLm estimates the ‘‘mean free distance’’ between gas exchangesurfaces within the 3D acinar surface complex (alveoli andducts) (26). Thus, Lm can characterize the movement of gasmolecules within peripheral airspaces (e.g., in correlation with3He diffusion rates within airspaces assessed by functionalMRI) (71, 119, 120).
6.7. Air–Blood Barrier Thickness
The arithmetic mean thickness (�t) of air–blood barrier mea-sures alveolar tissue volume per surface area by point and in-tersection counting (i.e., ratio of tissue volume density toalveolar surface density):
�t 5 2 �VVðtissue; sÞ=SVða; sÞ (24)
The harmonic mean barrier thickness (th) is a measure of thediffusion resistance of air–blood barrier, where the thin barrierparts are weighed more heavily in the morphometric estimationof lung diffusing capacity (87, 121). High-resolution EM images(. 8,0003) are overlaid with random test lines, the interceptlengths between alveolar surface and erythrocyte membrane aremeasured and 1/th is obtained as 2/3 of the mean of thereciprocals of the intercept lengths (87). The magnitude of �t isusually several times greater than th. The intercept lengths mayalso be used to derive distributions of barrier thickness, whichmay be useful in documenting barrier pathology (122).
An alternative method measures orthogonal (rather thanrandom) intercept lengths on random section planes where themembrane appears as a band bounded by the alveolar epithelialsurface. Random points are sampled on this surface trace byIUR test lines; the perpendicular linear distance from this point
408 AMERICAN JOURNAL OF RESPIRATORY AND CRITICAL CARE MEDICINE VOL 181 2010

to the nearest point on the opposite surface (e.g., capillaryendothelium or erythrocyte membrane) is measured (123).Distribution of orthogonal intercept lengths is narrower thanthat of random intercept lengths, thus yielding estimates of �tand th with smaller variances.
6.8. Morphometric Estimation of Lung Diffusing Capacity
None of the above morphometric parameters alone adequatelyrelates to the functional capacity of the lung (i.e., lung diffusingcapacity for oxygen, DLO2
), which is rather determined by thejoint contribution of the volume of alveolar capillary blood Vc,the intra-acinar alveolar and capillary surfaces, S(a) and S(c),respectively, and the harmonic mean air–blood barrier thick-ness, th. These components also interact dynamically withvarying ventilation and perfusion. In simplified terms, alveolarO2 uptake can be conceptualized as occurring in two majorsteps: diffusion across the membrane barrier and binding tocapillary hemoglobin. These steps impose resistances (1/D) of
the alveolar membrane barrier and capillary blood, 1Dmembrane
and1
Dblood, respectively, such that total resistance is (121, 124, 125):
1
Dlung5
1
Dmembrane1
1
Dblood(25)
where Dmembrane and Dblood are determined by morphometricparameters:
Dmembrane 5 KO2� ½SðaÞ1 SðcÞ�=2 � th (26)
Dblood 5 uO2�VðcÞ (27)
with KO25 Krogh permeability coefficient for tissue and uO2
5
empirical rate of O2 uptake by capillary blood. MorphometricDLO2
does not take into account diffusion across intra-acinarairways (126, 127) or various dynamic factors, for example,distributions of perfusion and capillary erythrocytes with re-spect to diffusion surfaces, which influence alveolar O2 uptakein vivo. Morphometric DLO2
exceeds the corresponding DLO2
estimated by physiologic methods at rest. Upon exercise,physiologic DLO2
progressively increases owing to recruitmentof alveolar-capillary reserves, and approaches morphometricDLO2
at peak exercise (30, 128). Therefore, morphometric DLO2
provides a meaningful estimation of the structural capacity foralveolar O2 diffusion. Alveolar O2 flux is far below capacity ofthe organ in the basal physiologic state, but increases andapproaches the upper limit imposed by structure when alveolar-capillary reserves are fully recruited.
6.9. Selecting Suitable Test Systems
In the spirit of optimizing sample selection known as ‘‘do moreless well’’ (38, 39), a simple coherent test system is always thebest. Usually 100 to 200 probe ‘‘hits’’ of the structure of interest(points, lines, or transections of planes or disectors), welldistributed among about 50 fields and 10 blocks, are adequateto estimate stereological parameters per subject (90, 104).Multipurpose test systems that meet these requirements in-clude, for example, M42, which consists of 42 test lines eachwith 2 ends as test points, and double density lattice grids witha ratio of 4 fine points per coarse point (Figure 6) (21).
7. ASSESSING LUNG CELL ULTRASTRUCTURE
Quantification of lung ultrastructure requires a fixation-processingprotocol designed for transmission EM, which in the case of
immunogold labeling must also expose epitopes, necessitating acompromise between preservation of ultrastructure and antige-nicity (SECTION 3) (54, 55, 80). Many lung diseases are associatedwith hyperplasia and/or hypertrophy of certain cell types (e.g.,type II alveolar epithelial cells). To distinguish between thesemechanisms, the number and mean size of cells should be esti-mated. Changes in cell synthetic or secretory activity might bereflected by changes in number and/or size of organelles (e.g.,lamellar bodies). Cell number is also important for assessing theinflux of inflammatory cells into lung compartments (e.g., intra-alveolar, interstitial, intravascular). Moreover, distribution ofnanoparticles or immunogold labels can be quantified underhigh-magnification EM.
7.1. Cells and Organelles
Useful parameters for characterizing cells and organelles in-clude volume, number, mean size, and surface area. Theseparameters must be related to a meaningful reference volume,which is usually total lung volume (for cells) and mean cellvolume (for organelles). The volume of any cell type can beestimated via point counting in a stratified sampling design or,alternatively, as the product of cell number and mean cell size.Cell number per lung, whether resident cells or mobile in-flammatory cells, can be directly estimated using disectors(Table 1) under either LM or EM (129, 130). In conventionaltransmission EM, only the physical disector can be applied,a rather time-consuming approach. The advent of electrontomography could overcome this limitation by providing opticaldisectors in 3D stacks of ultrathin serial images (43). Dependingon the sampling strategy, disector estimates can be combinedwith stratified sampling (‘‘density 3 reference volume’’) (e.g.,References 113, 131, 132) or a fractionator design (‘‘totalcounts 3 sampling fraction’’) (e.g., References 92, 99, 112,133). Because the disector is not only a tool for countingparticles but also for sampling them with equal probability, itcan be used to directly estimate mean cell size and sizedistribution (SECTION 2.1, d and e). Alternatively, mean cell sizecan be estimated indirectly from the ratio (cell volume density/cell number density) (Table 1). When the number- and volume-weighted mean cell sizes are known, size heterogeneity can alsobe estimated, since the volume-weighted mean volume equalsthe number-weighted mean volume amplified by the relativevariance (SECTION 6.5), which is valuable for assessing thedegree of cell (de-)differentiation (48).
7.2. Ultrasmall Particles: Immunoelectron Microscopy
For subcellular localization of gene products, immunoelectronmicroscopy using colloidal gold as an immuno-marker is themethod of choice, and can be combined with stereology toquantify the distribution of labeled gold particles (see reviews inReferences 54, 134, 135).
Specific questions may include: (1) In which compartmentsdo gold particles reside? (2) Are there compartments that arepreferentially labeled, and, if so, which ones?, or (3) Does overallparticle distribution change between experimental groups?Efficient methods to answer these questions involve countinggold particles per compartment (questions 1 and 3) or estimat-ing the relative labeling index (RLI, question 2), a measure thatcompares compartmental labeling to random labeling (136).RLI is used to compare an observed distribution of goldparticles associated with defined cell compartments (whoserelative volumes or surface areas are estimated by stereologyusing point or intersection counting, respectively) with anexpected distribution that would occur if the same total num-ber of gold particles were scattered randomly according to the
American Thoracic Society Documents 409

relative compartmental volumes or surfaces. The observednumber of gold particles (Nobserved) within a cell compartmentis obtained by counting these particles in a systematic uniformrandom sample of cell profiles. The expected distribution ofgold particles in each compartment (Nexpected) is obtained fromthe total number of point or intersection counts across com-partments. The RLI for each compartment is the observedvalue divided by the expected value:
RLI 5 Nobserved=Nexpected (28)
Thus, RLI 5 1 indicates purely random labeling. Preferentialcompartmental labeling is defined by two criteria: (1) RLI issignificantly higher than 1, and (2) by x2-analysis the compart-mental partial x2-value contributes substantially to the total x2-value of all compartments. Raw gold particle distributionsbetween groups can be compared directly by contingency tableanalysis and has been successfully applied to the lung (137–139).The RLI method, developed for immunogold particles onsections after postembedding labeling (136, 140–142), has beenextended to analyze the distribution of airborne or syntheticnanoparticles within cell compartments, then termed relativedeposition index (RDI) (81, 143). A potential problem withnanoparticles is that they are distributed through the full sectiondepth rather than confined to its cut surface.
While RLI addresses the three questions above with respectto preferential labeling, RLI per se does not address thequestion of specificity of labeling, which depends on the qualityof the antibody, its interaction with the antigen, and otherfactors unrelated to stereology.
8. ASSESSING AIRWAY AND VASCULATURE SYSTEMS
8.1. Bronchovascular Hierarchy
The airway hierarchy connects a small entrance (trachea, cross-section 2.5 cm2) to a large alveolar gas exchange surface (. 100 m2
in humans) via sequential, irregular, dichotomous branching;the number of branches doubles with each generation. The gasexchange apparatus forms a sleeve of alveoli on the surface ofapproximately eight generations of the most distal airways. Twofunctionally distinct regions require different analytical strate-gies: (1) conducting airways have a multilayered wall with mu-cous membrane, smooth muscle, and in part cartilage; and (2)acinar airways are intimately associated with gas exchangingalveoli. Because these two airway regions have different struc-ture-function characteristics, their position in the airway treemust be identified. To capture the entire network, a binary codingsystem has been used (144); for general purposes, it is sufficient toidentify the position of the airway by noting the generation Z ofa dichotomous tree (Figure 9A), with the trachea being genera-tion 0. The number of branches in generation Z 5 2Z.
Dichotomous branching with fractal properties is the basicrule of airway morphogenesis, with considerable species differ-ences in the degree of irregularity (145). The main bronchial tractsfollow the form of the lobe they serve. Where lobes are slim andelongated (e.g., rodents), the bronchial tract follows the main axis,giving off smaller side branches to supply segments and lobules(i.e., ‘‘monopodial’’ branching). To account for this irregularity,airways can be ordered by numbering in reverse order, beginningat a peripheral size class (‘‘order-1’’) and then to increase theorder whenever two airways of the same order converge. Twoorder-2 airways converge into order-3, but when an order-1converges with an order-2 airway the airway continues as order-2 (Figure 9B); this is called Strahler ordering, a variant of which isHorsfield ordering (146). Whereas in dichotomous branching the
branching ratio Rb52, in Strahler or Horsfield ordering Rb.2depending on the degree of asymmetry; it describes the ratio ofthe number of branches from one order to the next.
The dichotomous model stresses connectivity and networkarchitecture, allowing assessment of branching asymmetry atdifferent levels. Strahler ordering sacrifices connectivity bygrouping airways of similar size and structural features inthe same order. Physiologists may find the dichotomous sys-tem useful, whereas Strahler system may be more useful inpathology.
Pulmonary arteries follow the airways in a similar branchingpattern except that, at nearly all levels, small ‘‘supernumerary’’branches arise from the main vessel to perfuse nearby parenchyma(147); consequently, pulmonary arteries branch over approxi-mately five more generations than airways before reaching capil-laries (22). Pulmonary arteries have been ordered according toStrahler (148); because of supernumerary branches the ordernumbers of arteries and airways are not congruent. Pulmonaryveins course independent of airways in an intermediate positionrelated to interlobular septa, converging on the left atrium in fourmain stems. In small lungs, peripheral veins converge onto mainveins that course close to the monopodial airway.
8.2. Conducting Airways
Airway sampling must account for their hierarchical positionsbecause (1) size and structure of airway wall depend on thisposition, (2) location in the connectivity matrix is functionallyimportant, and (3) there are regional differences.
8.2.1. Database for functional lung models. Functional airwaymodels are used to answer questions such as distribution ofventilation, relative role of convection and diffusion along theairway tree, or deposition of inhaled particles and the ensuingtissue reaction. Model conception and construction depend ona sound database of airway dimensions along tree generations(e.g., length, diameter of segments, and branching angles). Suchdata can be obtained on corrosion airway casts prepared withresins (24, 149, 150) or silicon rubber (144, 151). Silicon rubbercast is flexible, easy to manipulate, filling even the most pe-ripheral airways (152, 153), and the preparation can be trimmedto a certain airway size for analysis (154). The parameterslength, diameter of segments, and branching angles are esti-mated by systematic progression along the tree. This procedurebecomes problematic beyond generation 7 because severalhundred airways must be measured. Sampling becomes essen-tial, but no satisfactory solution is yet available for efficientunbiased and regionally representative sampling of peripheralairways. It remains to be explored whether a ‘‘hierarchical frac-tionator’’ sampling scheme (155) can be developed. It is es-sential that airway samples be assigned to the hierarchicalnetwork either in an irregular dichotomous model with identifi-
Figure 9. Airway branch ordering systems. (A) Dichotomy; (B) Strahlerordering system.
410 AMERICAN JOURNAL OF RESPIRATORY AND CRITICAL CARE MEDICINE VOL 181 2010
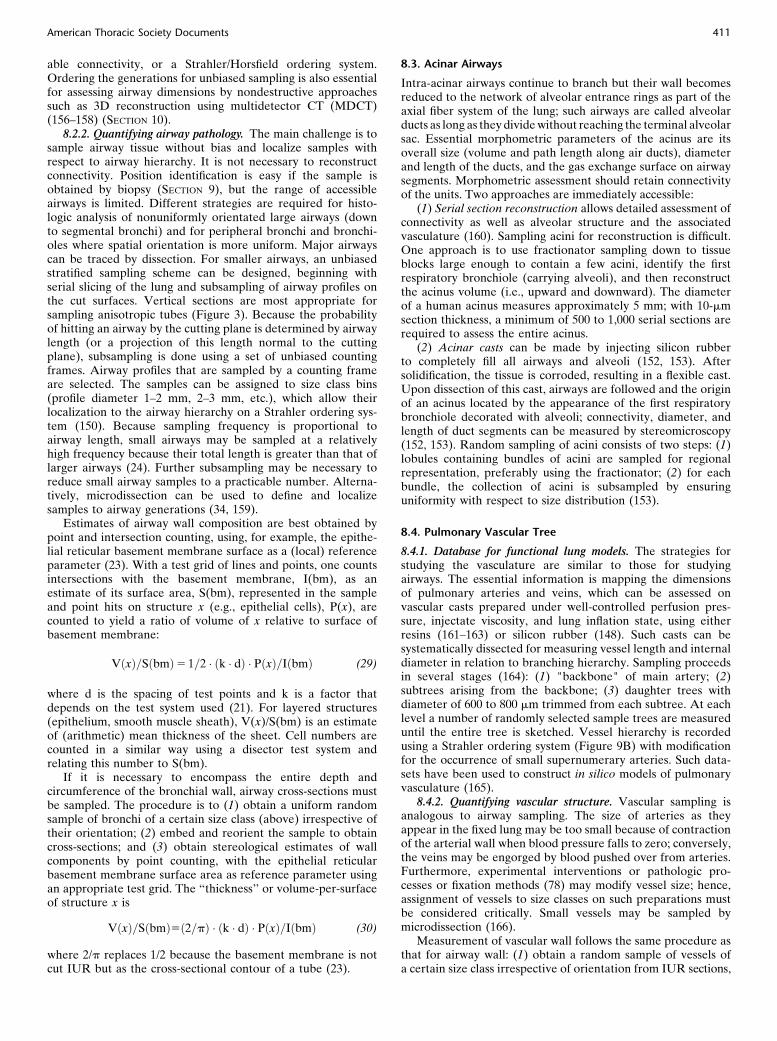
able connectivity, or a Strahler/Horsfield ordering system.Ordering the generations for unbiased sampling is also essentialfor assessing airway dimensions by nondestructive approachessuch as 3D reconstruction using multidetector CT (MDCT)(156–158) (SECTION 10).
8.2.2. Quantifying airway pathology. The main challenge is tosample airway tissue without bias and localize samples withrespect to airway hierarchy. It is not necessary to reconstructconnectivity. Position identification is easy if the sample isobtained by biopsy (SECTION 9), but the range of accessibleairways is limited. Different strategies are required for histo-logic analysis of nonuniformly orientated large airways (downto segmental bronchi) and for peripheral bronchi and bronchi-oles where spatial orientation is more uniform. Major airwayscan be traced by dissection. For smaller airways, an unbiasedstratified sampling scheme can be designed, beginning withserial slicing of the lung and subsampling of airway profiles onthe cut surfaces. Vertical sections are most appropriate forsampling anisotropic tubes (Figure 3). Because the probabilityof hitting an airway by the cutting plane is determined by airwaylength (or a projection of this length normal to the cuttingplane), subsampling is done using a set of unbiased countingframes. Airway profiles that are sampled by a counting frameare selected. The samples can be assigned to size class bins(profile diameter 1–2 mm, 2–3 mm, etc.), which allow theirlocalization to the airway hierarchy on a Strahler ordering sys-tem (150). Because sampling frequency is proportional toairway length, small airways may be sampled at a relativelyhigh frequency because their total length is greater than that oflarger airways (24). Further subsampling may be necessary toreduce small airway samples to a practicable number. Alterna-tively, microdissection can be used to define and localizesamples to airway generations (34, 159).
Estimates of airway wall composition are best obtained bypoint and intersection counting, using, for example, the epithe-lial reticular basement membrane surface as a (local) referenceparameter (23). With a test grid of lines and points, one countsintersections with the basement membrane, I(bm), as anestimate of its surface area, S(bm), represented in the sampleand point hits on structure x (e.g., epithelial cells), P(x), arecounted to yield a ratio of volume of x relative to surface ofbasement membrane:
VðxÞ=SðbmÞ5 1=2 � ðk � dÞ � PðxÞ=IðbmÞ (29)
where d is the spacing of test points and k is a factor thatdepends on the test system used (21). For layered structures(epithelium, smooth muscle sheath), V(x)/S(bm) is an estimateof (arithmetic) mean thickness of the sheet. Cell numbers arecounted in a similar way using a disector test system andrelating this number to S(bm).
If it is necessary to encompass the entire depth andcircumference of the bronchial wall, airway cross-sections mustbe sampled. The procedure is to (1) obtain a uniform randomsample of bronchi of a certain size class (above) irrespective oftheir orientation; (2) embed and reorient the sample to obtaincross-sections; and (3) obtain stereological estimates of wallcomponents by point counting, with the epithelial reticularbasement membrane surface area as reference parameter usingan appropriate test grid. The ‘‘thickness’’ or volume-per-surfaceof structure x is
VðxÞ=SðbmÞ5ð2=pÞ � ðk � dÞ � PðxÞ=IðbmÞ (30)
where 2/p replaces 1/2 because the basement membrane is notcut IUR but as the cross-sectional contour of a tube (23).
8.3. Acinar Airways
Intra-acinar airways continue to branch but their wall becomesreduced to the network of alveolar entrance rings as part of theaxial fiber system of the lung; such airways are called alveolarducts as long as they divide without reaching the terminal alveolarsac. Essential morphometric parameters of the acinus are itsoverall size (volume and path length along air ducts), diameterand length of the ducts, and the gas exchange surface on airwaysegments. Morphometric assessment should retain connectivityof the units. Two approaches are immediately accessible:
(1) Serial section reconstruction allows detailed assessment ofconnectivity as well as alveolar structure and the associatedvasculature (160). Sampling acini for reconstruction is difficult.One approach is to use fractionator sampling down to tissueblocks large enough to contain a few acini, identify the firstrespiratory bronchiole (carrying alveoli), and then reconstructthe acinus volume (i.e., upward and downward). The diameterof a human acinus measures approximately 5 mm; with 10-mmsection thickness, a minimum of 500 to 1,000 serial sections arerequired to assess the entire acinus.
(2) Acinar casts can be made by injecting silicon rubberto completely fill all airways and alveoli (152, 153). Aftersolidification, the tissue is corroded, resulting in a flexible cast.Upon dissection of this cast, airways are followed and the originof an acinus located by the appearance of the first respiratorybronchiole decorated with alveoli; connectivity, diameter, andlength of duct segments can be measured by stereomicroscopy(152, 153). Random sampling of acini consists of two steps: (1)lobules containing bundles of acini are sampled for regionalrepresentation, preferably using the fractionator; (2) for eachbundle, the collection of acini is subsampled by ensuringuniformity with respect to size distribution (153).
8.4. Pulmonary Vascular Tree
8.4.1. Database for functional lung models. The strategies forstudying the vasculature are similar to those for studyingairways. The essential information is mapping the dimensionsof pulmonary arteries and veins, which can be assessed onvascular casts prepared under well-controlled perfusion pres-sure, injectate viscosity, and lung inflation state, using eitherresins (161–163) or silicon rubber (148). Such casts can besystematically dissected for measuring vessel length and internaldiameter in relation to branching hierarchy. Sampling proceedsin several stages (164): (1) "backbone" of main artery; (2)subtrees arising from the backbone; (3) daughter trees withdiameter of 600 to 800 mm trimmed from each subtree. At eachlevel a number of randomly selected sample trees are measureduntil the entire tree is sketched. Vessel hierarchy is recordedusing a Strahler ordering system (Figure 9B) with modificationfor the occurrence of small supernumerary arteries. Such data-sets have been used to construct in silico models of pulmonaryvasculature (165).
8.4.2. Quantifying vascular structure. Vascular sampling isanalogous to airway sampling. The size of arteries as theyappear in the fixed lung may be too small because of contractionof the arterial wall when blood pressure falls to zero; conversely,the veins may be engorged by blood pushed over from arteries.Furthermore, experimental interventions or pathologic pro-cesses or fixation methods (78) may modify vessel size; hence,assignment of vessels to size classes on such preparations mustbe considered critically. Small vessels may be sampled bymicrodissection (166).
Measurement of vascular wall follows the same procedure asthat for airway wall: (1) obtain a random sample of vessels ofa certain size class irrespective of orientation from IUR sections,
American Thoracic Society Documents 411

(2) embed and reorient sample to obtain vessel cross-sections; (3)estimate wall components using point and intersection counting,with the surface area of the internal elastic membrane, S(em), asa reference space, preferably by EM—as the internal elasticmembrane of small vessels may be hard to follow in LM,particularly in the contracted state. This procedure normalizesarterial dimensions for the effect of contraction, which causesmedial thickening and crenation of elastic membrane (24).
9. BIOPSIES
9.1. General Issues
Endobronchial and transbronchial biopsies are obtained via theairways, whereas video-assisted thoracoscopic and open lungbiopsies are taken through the chest wall. Stereologic analysis ofbiopsy specimens has been discussed in a separate workshopreport (167) and outlined here:
1. Biopsy sites are nonrandom, due to technical limitations(e.g., endobronchial biopsies are taken from the carina orsubcarina and not the lateral airway wall), or because theyare directed to regions most affected by the pathologicprocess (168).
2. The tissue is partially or completely collapsed. Crush ar-tifact may be present.
3. Methods of tissue fixation and preparation are oftenconstrained by specific diagnostic requirements.
4. The reference space is restricted to the biopsy specimenand not representative of the whole organ. Where biopsyis targeted, volume of the target compartment (e.g.,primary tumor or total volume of lung metastases) maybe estimated using radiological techniques, but this ref-erence volume is limited to solid tissue and cannot beapplied to biopsies of aerated lung because volume of thesample ex vivo (prior to fixation and embedding) differssignificantly from that in the in vivo state. Total lungvolume cannot be used as a reference volume.
These constraints are present whether or not stereology isused in assessing biopsy samples. Nonetheless, stereologictechniques help avoid bias and improve the validity of analysis.For example, applying the disector technique to lung biopsyspecimens allows numerical cell density to be reliably deter-mined, thereby distinguishing cellular hypertrophy from hyper-plasia (37, 169, 170).
9.2. Endobronchial and Transbronchial Biopsies
9.2.1. Sampling. Quantification relies on local estimators withinthe specimen. Orientation of structures is neither isotropic noruniform. Options for handling of orientation include thegeneration of IUR sections using an isector mold (Figure 4)or vertical sectioning (Figure 3), with the vertical directionperpendicular to the epithelial surface (19).
9.2.2. Fixation and preparation. While inflation pressurescannot be controlled during fixation and the preferred fixativesmay depend on study goal, local laboratory capability, require-ments of multicenter studies, and the need to maintain compa-rability with archival material, faithful structural preservationremains essential to avoid quantifying artifacts rather than truestructural changes. For example, when using snap freezing andcryostat sectioning for immunohistochemistry, the structuralpreservation may not be adequate for morphometry.
9.2.3. Defining the reference space. In airway biopsies, themeasured dimensions of mucosal components have been stan-
dardized with respect to the surface area of intact epithelialreticular basement membrane (169, 171, 172), and to the vol-ume of the tissue compartment surveyed, even though the truereference space (e.g., total volume of airway tissue or airwaysurface area) is unknown. The best reference space for localestimation in the interstitial (subepithelial) compartment is lesscertain because this compartment is incompletely sampled inbiopsy specimens (37).
The same considerations applies to transbronchial biopsies,with the exception that in the latter the measured parametersmay be expressed per unit volume of the biopsy specimen, or,with respect to the unit area of alveolar basement membraneassessed under EM.
9.3. Thoracoscopic and Open Lung Biopsy
These biopsies yield wedge-shaped specimens with a pleuralbase. They are typically greater than 1 cm along each dimensionin children (173) and up to 4 cm in adults (168), large enough forsubdivision into separate portions for different purposes. Eachportion should extend from the pleural base to the deepest partof the biopsy so that it is representative of the whole sample andnot only a sub-region. Regions near the edges should not besampled due to possible crush artifacts. Subdivided portions areusually fixed by simple immersion, or they may be partiallyinflated (174) by gently injecting fixatives into the specimenthrough the pleural surface using a small syringe and needleuntil the fixative drains freely from the cut surfaces. Thisprocedure partially expands alveoli and removes much of thecrush artifact. With a recognizable, relatively flat surface alwayspresent, vertical sections are optimal. Alternatively, IUR sec-tions can be generated using the orientator (94) or isector (95).Measured parameters (volume, surface area, length. and num-ber) can be reported as densities referred to local referenceparameters (e.g., boundary surface between epithelium andreticular basement membrane in EM studies) (44).
10. QUANTITATIVE STRUCTURAL ASSESSMENT USINGIN VIVO IMAGING TECHNIQUES
10.1. Combining Stereology and In Vivo Imaging Techniques
Combining stereology with in vivo lung imaging holds greatpotential for structural assessment in three major respects: (1)stereology can be directly applied to analyze in vivo imagingdatasets using unbiased sampling procedures and test systems(e.g., Cavalieri principle, ALP-sector, or disector); (2) quanti-tative structural data obtained by in vivo imaging may need tobe validated against histomorphometry, (3) microscopy-basedstereology complements in vivo imaging and extends it tohigher levels of resolution (e.g., EM). It must be noted thatthe slice thickness may introduce a bias due to overprojection ofdense components along their edges, which may therefore beoverestimated (3). Accordingly, alveolar septa or airway wallthickness may be larger on CT slices than on correspondingmicroscopic sections.
10.2. Computed Tomography
CT imaging permits the assessment of lung volume, regional gasvolume, bronchovascular structures as well as functional pa-rameters such as regional perfusion and ventilation (175).Advances in CT technology have reduced the time for wholelung imaging to 5 to 10 seconds, fueling a growing demand forrigorous validation of CT-derived quantitative measures inapplication to drug/device discovery as well as safety andoutcomes assessment. With the rapid progress in genome-widesearches, there is an additional need to use these quantitative
412 AMERICAN JOURNAL OF RESPIRATORY AND CRITICAL CARE MEDICINE VOL 181 2010

measures along with characteristic pathology to establish dis-ease phenotypes and to identify gene associations. Clearly,stronger links between stereology and CT image analysis needto be established.
10.2.1. Lung volume, air, and tissue volumes. Volumetric im-aging using multidetector computed tomography (MDCT) per-formed at a fixed lung volume allows the partition of global orregional lung volumes into air and tissue (including microvas-cular blood) volumes (176–178) and the tissue/air volume ratio,estimated from their respective in vivo X-ray attenuationvalues. Correlation of CT attenuation values (in HounsfieldUnits) to lung biopsy samples has been used to translatequantitative radiologic data into morphometric estimates ofsurface-to-volume ratios or gas volume per gm of tissue (107,179). These CT-derived parameters have been used to followdevelopmental and compensatory lung growth (180–182), andto assess structural derangement in idiopathic pulmonary fibro-sis (183) and emphysema (107). In vivo CT estimates of air andtissue volumes significantly correlate with independent esti-mates obtained by histomorphometry (106, 108), although indirect comparisons CT-derived (tissue1blood) volume is sys-tematically larger than alveolar septal volume estimated afterfixation by morphometry (108) and antemortem by physiolog-ical methods (181); CT-derived lung gas volume is modestlylower than that measured antemortem by helium dilution (181,184). Additional measures (e.g., parenchymal texture analysis)take into account the pattern as well as the magnitude ofattenuation values, permitting further quantitative detection ofregional pathology (185, 186). All of these methods requiredesign-based validation to link them with structural reality.
There is growing awareness for the judicious use of CTbecause of the small but real risk of radiation exposure. It ispossible to limit radiation without sacrificing the accuracy ofquantitative information, by implementing limited CT samplingof the lung with the sampling tools outlined in this document.For example, noncontiguous high-resolution images (1 mmthick) may be obtained at a constant interval (e.g., 10 mmapart) throughout the lung. Lung volume can be directly esti-mated using the Cavalieri principle (SECTION 5.1.2), as has beenshown in other organs (187). The lung is either outlined, orpoint counting may be used to estimate its area. By identifyinginter-lobar fissures, each lobe can be measured separately.Using point-counting, major bronchovascular structures andlymph nodes larger than a defined diameter can be reliablyexcluded to obtain an estimate of parenchymal volume.
10.2.2. Reconstruction of airways and blood vessels. Imagesobtained by MDCT can be segmented into the right and leftlung as well as lobes and airways (188–190). Segmented airwaysare skeletonized with the branch points at their correct ana-tomic locations (191) to identify airway segments (192). Physicalmeasurements (e.g., diameter, cross-sectional area, airway wallarea and thickness, luminal perimeter) are made in the originalgray-level CT volume (193) in 2D slices that are re-sampledperpendicular to the centerline of a segment. The measuredgeometry is stored in a ‘‘tree file’’ that records the location ofbifurcation points, linkage to the tree skeleton, location ofdiscrete points that trace the path of the airway, and the airwaycross-sectional area orthogonal to each centerline point. Theresulting dataset can be used to reconstruct the first 6 to 10bronchial generations and build individualized models of thebronchovascular tree (157). Airway dimensions measuredin vivo by this method agree well with those obtained on casts,and can be used to validate or rescale hierarchical measure-ments obtained on casts (24, 144, 149, 151) and allow construc-tion of in silico models of the pulmonary airways down to theacinar airways (157).
10.3. Micro-CT
Micro-CT has been used to image the lung in vivo (10–15 mmresolution) and postmortem (down to 1–2 mm resolution). Forin vivo imaging, respiratory motion must be eliminated bybreath-holding at a fixed lung volume (194). A major advantageof micro-CT is that the dataset consists of equi-axial voxels(equal dimension on all sides), which permits virtual slicing ofsmall lung blocks from multiple angles, and provides animportant tool for cross-comparison with traditional microscopyto determine the effects of slice orientation on morphometricmeasurements. Furthermore, the ability to image the same lungin vivo and postmortem allows assessment of the alterationsthat occur after death and tissue fixation.
In vivo data obtained from MDCT and magnetic reso-nance imaging (MRI) have been compared with postopera-tive or postmortem micro-CT images of excised lung speci-mens and to morphometry (179, 195, 196). In one example,excised lungs were air-inflated at a constant transpulmonarypressure while suspended in liquid nitrogen fumes (71). Theintact frozen lung was subjected to high-resolution CT toprovide the reference volume for multistage sampling (SEC-
TION 4.2.1). While kept frozen on dry ice, the lung was seriallysliced at a constant interval and tissue samples were col-lected using a precooled thin-walled ‘‘cork borer,’’ placed inprecooled (2408C) acetone solution with 1% glutaraldehyde,allowed to fix at 2808C for 2 h, then postfixed in osmium afterwarming to room temperature and critical point dried. Thefixed tissue cores were imaged by micro-CT at an isotropicresolution (8–16 mm) sufficient for measuring surface-to-volume ratio. The same core samples may be further pro-cessed for morphometry and gene expression assays (70).However, freezing tissue introduces cellular artifacts thatlimit the resolution of ultrastructural details under EM (73).
Currently, micro-CT reaches sufficiently high resolutions foralveolar imaging only in chemically fixed tissue. This approachpermits postmortem nondestructive stereology without tissuedissection, embedding, and sectioning. Whole lung scans can beused to choose regions for high-resolution micro-CT accordingto stereological principles. In a first step, Cavalieri principle isused to estimate total lung volume and major subcomponentvolumes. Next, systemic uniform random (SUR) sampling isapplied to select sample positions and, if necessary, spatialorientation for high-resolution micro-CT, to estimate volume ofalveoli and alveolar ducts, alveolar surface, septal tissue vol-ume, septal thickness, and alveolar number and size.
10.4. Functional Lung Imaging Techniques
In addition to CT, MRI, positron emission tomography (PET),and single photon emission computed tomography (SPECT)provide noninvasive data on functional processes that reflectstructural properties and pathology. Quantitative data obtainedusing these techniques also require validation by comparisonwith stereological studies performed on CT images or histologicspecimens.
10.4.1. Combining MRI with stereology. One application ofmorphometry to functional MRI involves the estimation ofapparent diffusion coefficient (ADC) of a hyperpolarized gassuch as 3He inhaled in lung airspaces (197–199). The ADC isrelated to the size, shape, and porosity of the space within whichthe gas diffuses (120), and thus a function of the mean freedistance within the airspace; it is affected by anisotropy andtortuosity of distal airways, and by the connectivity of collateralventilatory channels (e.g., pores of Kohn). The ADC value ofhyperpolarized 3He gas in unrestricted air (0.8 cm2/s) is reducedto 0.2 cm2/s in a normal living human lung, and increases in
American Thoracic Society Documents 413

severe emphysema—0.6 cm2/s is common (199, 200); the cor-responding values are lower in small animals (198, 201).Applying intersection and point counting to histologic lungspecimens related to the MRI permits interpretation of theADC with respect to morphometric characteristics of peripheralairspaces (71, 119, 201, 202), namely, the alveolar surface-to-volume ratio or its reciprocal, Lm (SECTION 6.6). Both the ADCand Lm estimate the mean free distance within the combinedairspaces of alveolar sacs and ducts. Moreover, the in vivo lungmorphometry technique with hyperpolarized 3He diffusionMRI (120) that is based on a geometrical model of lung acinarairways (153) may allow estimation of acinar airways geo-metrical parameters analogous to those provided by castingtechniques (203). The key in comparing techniques is to ensureunbiased tissue sampling and spatial coordination betweenin vivo MRI and the excised tissue samples, by using image-guided sampling and preparation procedures that retain theoriginal tissue dimensions.
10.4.2. PET and SPECT. These evolving modalities allownoninvasive measurement of dynamic cellular and molecularprocesses, for example, metabolic rates, vascular perfusion,capillary filtration, inflammation, or genetic targets in relationto their spatial localization. Understanding these processesrequires (1) mapping imaging results onto lung microstructure,and (2) obtaining unbiased measurements of tissue structuresassociated with the functional processes.
Visualization of the 3D distribution of inhaled or injectedradionuclides with PET (204) reflects functional processes suchas inflammation or altered permeability, and can potentiallyguide therapeutic strategies in acute lung injury, provided theresults could be interpreted with respect to the underlyingstructural changes. As lung injury is characterized by heteroge-neity, tissue samples for microscopy must be selected bya strategy that allows coordinated registration with PET images;the relative volume represented by the sample on PET imagesmust be estimated by the Cavalieri method (SECTION 5.1.2). Asan example for such studies, increased permeability was in-duced by oleic acid in dogs and the pulmonary transcapillaryescape rate (rPTCER) of 68Ga-transferrin was imaged (205).Image-guided tissue samples with varying rPTCER values wereobtained and prepared for light microscopy. Stereologicalanalysis showed that rPTCER correlated not only with thedistribution of alveolar edema but more consistently with therelative surface of alveolar septa showing damage to the liningcells of endothelium and epithelium, suggesting that rPTCERmay be used as an index of lung injury. Similar strategies can bedeveloped to validate histopathologic interpretation of PETimages with respect to ventilation–perfusion inequalities, in-flammation, or gene expression. Similar strategies can also beextended to SPECT (206). For such attempts to be successful,it will be important to employ unbiased sampling and measure-ment procedures to ensure efficiency and accuracy of theresults.
11. CONCLUSIONS
Design-based stereology, characterized by accuracy, precisionand efficiency, provides a set of tools for sampling andmeasuring irregular structure. These tools are flexible in thatthey can be applied to a variety of imaging approaches. Forthese reasons, this approach has become the gold standard inquantitative structural analysis of different organs, including thelung. This document summarizes the principles and guidelinesfor basic methodological standards in lung stereology andmorphometry, aimed at promoting the uniform application ofsound analytical techniques to experimental and translational
studies in the lung. Due to space limitation, this documentcannot comprehensively cover step-by-step implementation ofeach technique, the details of which can be found in theappropriate references.
This Statement was prepared by the co-chairs on behalf ofa Joint Task Force of the American Thoracic Society and theEuropean Respiratory Society.
Members of the Task Force were:CONNIE C.W. HSIA (Co-chair), M.D.DALLAS M. HYDE (Co-chair), Ph.D.MATTHIAS OCHS (Co-chair), M.D.EWALD R. WEIBEL (Co-chair), M.D., D.Sc. (hon)KURT H. ALBERTINE, Ph.D.PETER H. BURRI, M.D.JAMES D. CRAPO, M.D.HEINZ FEHRENBACH, Ph.D.PHILIPPE A. GRENIER, M.D.HANS JØRGEN G. GUNDERSEN, M.D., D.M.Sci.ERIC A. HOFFMAN, Ph.D.JAMES C. HOGG, M.D., Ph.D.PETER K. JEFFERY, D.Sc., Ph.D., M.Sc.PAUL MCLOUGHLIN, M.B., Ph.D.TERENCE M. MAYHEW, Ph.D.WAYNE MITZNER, Ph.D.CHARLES G. PLOPPER, Ph.D.DANIEL P. SCHUSTER†, M.D.PRESCOTT WOODRUFF, M.D., M.P.H.
Conflict of Interest Statement: The following author disclosures were consistent withcurrent American Thoracic Society policy. C.C.W.H reported she did not havea financial relationship with a commercial entity that has an interest in the subjectof this manuscript. D.M.H. was a consultant to Genentech (up to $1,000). Hereceived grants from Ligocyte (.$100,000), Schering-Plough/Biopharma(.$100,000); he was on the Board of National Jewish Health (up to $1,000).M.O. reported he did not have a financial relationship with a commercial entitythat has an interest in the subject of this manuscript. E.R.W. reported he did nothave a financial relationship with a commercial entity that has an interest in thesubject of this manuscript. The following disclosures by additional contributors(members of ATS/ERS Joint Task Force) were consistent with American ThoracicSociety policy at initiation of project. K.H.A., P.H.B., and J.D.C. reported they didnot have a financial relationship with a commercial entity that has an interest inthe subject of this manuscript. H.F. received lecture fees from GlaxoSmithKlineand Altana Pharma AG. P.A.G. served on the Advisory Board of Philips MedicalSystems. H.J.G.G. reported he did not have a financial relationship witha commercial entity that has an interest in the subject of this manuscript.E.A.H. was a consultant to GlaxoSmithKline, Eli Lilly, Sanofi Aventis, SiemensMedical, and Spiration; he was on the Advisory Board of Siemens Medical andreceived grants from them; he held patents with the University of Iowa, VIDADiagnostics, and MARVAL; he was founder and shareholder in VIDA Diagnostics.P.K.J. and P.M. reported they did not have a financial relationship witha commercial entity that has an interest in the subject of this manuscript.T.M.M. received royalties from Nottingham University Press. W.M. and C.G.P.reported they did not have a financial relationship with a commercial entity thathas an interest in the subject of this manuscript. D.P.S. is deceased and is unableto provide a financial disclosure statement. P.W. had grants from Aerovance(.$100,000) and Genentech ($100,000); he held a patent with the University ofCalifornia at San Francisco.
References
1. Lum H, Mitzner W. Effects of 10% formalin fixation on fixed lung
volume and lung tissue shrink: a comparison of eleven laboratoryspecies. Am Rev Respir Dis 1985;132:1078–1083.
2. Kendall MG, Moran PAP. Geometrical probability. London: Charles
Griffin and Co., Ltd.; 1963. pp. 1–125.3. Miles RE, Davy PJ. Precise and general conditions for the validity of
a comprehensive set of stereological fundamental formulae. J Microsc1976;107:211–226.
4. Miles RE, Serra J. Geometrical probability and biological structures:
Buffon’s 200th anniversary. Lecture notes in biomathematics [Vol 23].New York: Springer-Verlag; 1978.
5. Cruz-Orive LM. Stereology: historical notes and recent evolution. Acta
Stereol 1987;6:43–56.
†Deceased.
414 AMERICAN JOURNAL OF RESPIRATORY AND CRITICAL CARE MEDICINE VOL 181 2010

6. Weibel ER. Stereology in perspective: a mature science evolves. Acta
Stereol 1992;11:1–13.7. Tomkeieff, S. I. Linear intercepts, areas and volumes. Nature 1945;155:
24 [correction on p 107].8. Saltykov SA. The method of intersections in metallography. Zavod-
skaya Laboratoriya 1946;12:816–825. (in Russian).9. Delesse A. Procede mechanique pour determiner la composition des
roches. CR Acad Sci (Paris) 1847;25:544–545.10. Rosiwal A. Ueber geometrische Gesteinsanalysen. Verh. K. K. Geol.
Reichsanst Wien 1898;143–175.11. Thomson E. Quantitative microscopic analysis. J Geol 1930;38:193–222.12. Glagolev AA. On geometrical methods of quantitative mineralogic
analysis of rocks. Trans Inst Econ Min (Moscow) 1933;59:1–47.13. Chalkley HW. Methods for quantitative morphological analysis of
tissue. J Natl Cancer Inst 1943;4:47–53.14. Wicksell SD. The corpuscle problem. Biometrika 1925;17:84–99.15. Dehoff RT, Rhines FN. Determination of the number of particles per
unit volume from measurements made on random plane sections: thegeneral cylinder and the ellipsoid. Trans AIME 1961;221:975–982.
16. Weibel ER, Gomez DM. A principle for counting tissue structures on
random sections. J Appl Physiol 1962;17:343–348.17. Sterio DC. The unbiased estimation of number and sizes of arbitrary
particles using the disector. J Microsc 1984;134:127–136.18. Gundersen HJ, Bagger P, Bendtsen TF, Evans SM, Korbo L, Marcussen
N, Moller A, Nielsen K, Nyengaard JR, Pakkenberg B. The newstereological tools: disector, fractionator, nucleator and point sampledintercepts and their use in pathological research and diagnosis. APMIS1988;96:857–881.
19. Baddeley A, Vedel Jensen EB. Stereology for statisticians. Boca
Raton, FL: Chapman and Hall; 2005. pp. 1–395.20. Reed MG, Howard CV. Surface-weighted star volume: concept and
estimation. J Microsc 1998;190:350–356.21. Weibel ER. Stereological methods, vol 1. Practical methods for bi-
ological morphometry. London: Academic Press, Inc.; 1979. pp. 1–415.22. Weibel ER, Gomez DM. Architecture of the human lung: use of
quantitative methods establishes fundamental relations between sizeand number of lung structures. Science 1962;137:577–585.
23. Weibel ER. Principles and methods for the morphometric study of the
lung and other organs. Lab Invest 1963;12:131–155.24. Weibel ER. Morphometry of the human lung. New York: Academic
Press; 1963. pp. 1–151.25. Ochs M. A brief update on lung stereology. J Microsc 2006;222:188–
200.26. Weibel ER. Stereological methods, vol. 2. Theoretical foundations.
New York: Academic Press; 1980. pp. 1–340.27. Gundersen HJ, Bendtsen TF, Korbo L, Marcussen N, Moller A,
Nielsen K, Nyengaard JR, Pakkenberg B, Sorensen FB, VesterbyA, et al. Some new, simple and efficient stereological methods andtheir use in pathological research and diagnosis. APMIS 1988;96:379–394.
28. Howard CV, Reed MG. Unbiased stereology, 2nd ed. New York:
Garland Science/BIOS Scientific; 2005. pp. 1–277.29. Weibel ER, Cruz-Orive LM. Morphometric methods. In: Crystal RG,
West JB, Weibel ER, Barnes PJ, editors. The lung: scientificfoundations, 2nd ed. Philadelphia: Lippincott-Raven; 1997. pp. 333–344.
30. Weibel ER, Hsia CC, Ochs M. How much is there really? Why
stereology is essential in lung morphometry. J Appl Physiol 2007;102:459–467.
31. Bolender RP, Hyde DM, Dehoff RT. Lung morphometry: a new
generation of tools and experiments for organ, tissue, cell, andmolecular biology. Am J Physiol 1993;265:L521–L548.
32. Nyengaard JR, Gundersen HJG. Sampling for stereology in lungs. Eur
Respir Rev 2006;15:107–114.33. Ochs M. Stereological analysis of acute lung injury. Eur Respir Rev
2006;15:115–121.34. Hyde DM, Miller LA, Schelegle ES, Fanucchi MV, Van Winkle LS,
Tyler NK, Avdalovic MV, Evans MJ, Kajekar R, Buckpitt AR, et al.Asthma: a comparison of animal models using stereologic methods.Eur Respir Rev 2006;15:122–135.
35. Fehrenbach H. Animal models of pulmonary emphysema: a stereolo-
gist’s perspective. Eur Respir Rev 2006;15:136–147.36. Hsia CCW. Quantitative morpholoogy of compensatory lung growth.
Eur Respir Rev 2006;15:148–156.37. Woodruff PG, Innes AL. Quantitative morphology using bronchial
biopsies. Eur Respir Rev 2006;15:157–161.
38. Mathieu O, Cruz-Orive LM, Hoppeler H, Weibel ER. Measuring
error and sampling variation in stereology: comparison of the effi-ciency of various methods for planar image analysis. J Microsc 1981;121:75–88.
39. Gundersen HJ, Osterby R. Optimizing sampling efficiency of stereo-
logical studies in biology: or ‘do more less well!’. J Microsc 1981;121:65–73.
40. Gupta M, Mayhew TM, Bedi KS, Sharma AK, White FH. Inter-animal
variation and its influence on the overall precision of morphometricestimates based on nested sampling designs. J Microsc 1983;131:147–154.
41. West MJ, Gundersen HJ. Unbiased stereological estimation of the
number of neurons in the human hippocampus. J Comp Neurol 1990;296:1–22.
42. Howell K, Hopkins N, McLoughlin P. Combined confocal microscopy
and stereology: a highly efficient and unbiased approach to quantita-tive structural measurement in tissues. Exp Physiol 2002;87:747–756.
43. Vanhecke D, Studer D, Ochs M. Stereology meets electron tomogra-
phy: towards quantitative 3D electron microscopy. J Struct Biol 2007;159:443–450.
44. Vedel Jensen EB. Local stereology. Singapore: World Scientific
Publishers; 1998.45. Cruz-Orive LM. Editorial. J Microsc 1988;151:1–2.46. Gundersen HJ. The nucleator. J Microsc 1988;151:3–21.47. Vedel Jensen EB, Gundersen HJG. The rotator. J Microsc 1993;170:
35–44.48. Gundersen HJ, Jensen EB. Stereological estimation of the volume-
weighted mean volume of arbitrary particles observed on randomsections. J Microsc 1985;138:127–142.
49. Nyengaard JR. Stereologic methods and their application in kidney
research. J Am Soc Nephrol 1999;10:1100–1123.50. Schmitz C, Hof PR. Design-based stereology in neuroscience. Neuro-
science 2005;130:813–831.51. Weibel ER. Morphometric and stereological methods in respiratory
physiology, including fixation techniques. In: Otis AB, editor. Tech-niques in the life sciences, part 1: Respiratory physiology. Ireland:Elsevier; 1984. pp. 1–35.
52. Hayat MA. Principles and techniques of electron microscoopy: bi-
ological applications, 4th ed. Cambridge: Cambridge University Press;2000.
53. Kiernan JA. Histological and histochemical methods, 3rd ed. New
York: A Hodder Arnold Publication; 1999. pp. 1–502.54. Griffiths G. Fine structure immunocytochemistry. Berlin: Springer;
1993. pp. 1–459.55. Skepper JN. Immunocytochemical strategies for electron microscopy:
choice or compromise. J Microsc 2000;199:1–36.56. Sabatini DD, Bensch K, Barrnett RJ. Cytochemistry and electron
microscopy: the preservation of cellular ultrastructure and enzymaticactivity by aldehyde fixation. J Cell Biol 1963;17:19–58.
57. Kiernan J. Formaldehyde, formalin, paraformaldehyde and glutaral-
hyde: what they are and what they do. Microsc Today 2000;8:8–12.58. Karnovsky MJ. A formaldehyde-glutaraldehyde fixative of high osmo-
lality for use in electron microscopy. J Cell Biol 1965;27:137A–138A.59. Mathieu O, Claassen H, Weibel ER. Differential effect of glutaralde-
hyde and buffer osmolarity of cell dimensions: a study on lung tissue.J Ultrastruct Res 1978;63:20–34.
60. Huang TH, Blume A, Das Gupta SK, Griffin RG. Nuclear magnetic
resonance and calorimetric study of the structure, dynamics, andphase behavior of uranyl ion/dipalmitoylphosphatidylcholine com-plexes. Biophys J 1988;54:173–179.
61. Fehrenbach H, Richter J, Schnabel PA. Improved preservation of
phospholipid-rich multilamellar bodies in conventionally embeddedmammalian lung tissue–an electron spectroscopic study. J Microsc1991;162:91–104.
62. Ochs M, Fehrenbach H, Richter J. Electron spectroscopic imag-
ing (ESI) and electron energy loss spectroscopy (EELS) of multi-lamellar bodies and multilamellar body-like structures in tannicacid-treated alveolar septal cells. J Histochem Cytochem 1994;42:805–809.
63. Oldmixon EH, Suzuki S, Butler JP, Hoppin FG Jr. Perfusion de-
hydration fixes elastin and preserves lung air-space dimensions.J Appl Physiol 1985;58:105–113.
64. Bachofen H, Ammann A, Wangensteen D, Weibel ER. Perfusion
fixation of lungs for structure-function analysis: credits and limita-tions. J Appl Physiol Respirat Environ Exercise Physiol 1982;53:528–533.
American Thoracic Society Documents 415

65. Gil J, Weibel ER. Extracellular lining of bronchioles after perfusion-
fixation of rat lungs for electron microscopy. Anat Rec 1971;169:185–199.
66. Gil J. Controlled and reproducible fixation of the lung for correlated
studies. In: Gil J, editor. Models of lung disease: lung biology in healthand disease. New York: Marcel Dekker; 1990. pp. 3–22.
67. Bachofen M, Weibel ER, Roos B. Postmortem fixation of human lungs
for electron microscopy. Am Rev Respir Dis 1975;111:247–256.68. Albertine KH, Wiener-Kronish JP, Bastacky J, Staub NC. No evidence
for mesothelial cell contact across the costal pleural space of sheep.J Appl Physiol 1991;70:123–134.
69. Gosselink JV, Hayashi S, Chau E, Cooper J, Elliott WM, Hogg JC.
Evaluation of small sample cDNA amplification for microdissectedairway expression profiling in COPD. COPD 2007;4:91–105.
70. Ding L, Quinlan KB, Elliott WM, Hamodat M, Pare PD, Hogg JC,
Hayashi S. A lung tissue bank for gene expression studies in chronicobstructive pulmonary disease. COPD 2004;1:191–204.
71. Woods JC, Choong CK, Yablonskiy DA, Bentley J, Wong J, Pierce JA,
Cooper JD, Macklem PT, Conradi MS, Hogg JC. Hyperpolarized3He diffusion MRI and histology in pulmonary emphysema. MagnReson Med 2006;56:1293–1300.
72. Albertine KH, Schultz EL, Wiener-Kronish JP, Staub NC. Regional
differences in pleural lymphatic albumin concentration in sheep. AmJ Physiol 1987;252:H64–H70.
73. Weibel ER, Limacher W, Bachofen H. Electron microscopy of rapidly
frozen lungs: evaluation on the basis of standard criteria. J ApplPhysiol Respirat Environ Exercise Physiol 1982;53:516–527.
74. Untersee P, Gil J, Weibel ER. Visualization of extracellular lining
layer of lung alveoli by freeze-etching. Respir Physiol 1971;13:171–185.
75. Vock R, Weibel ER. Massive hemorrhage causes changes in morpho-
metric parameters of lung capillaries and concentration of leukocytesin microvasculature. Exp Lung Res 1993;19:559–577.
76. Gil J, Bachofen H, Gehr P, Weibel ER. Alveolar volume-surface area
relation in air- and saline-filled lungs fixed by vascular perfusion.J Appl Physiol 1979;47:990–1010.
77. West JB, Dollery CT, Naimark A. Distribution of blood flow in isolated
lung; relation to vascular and alveolar pressures. J Appl Physiol 1964;19:713–724.
78. Howell K, Preston RJ, McLoughlin P. Chronic hypoxia causes angio-
genesis in addition to remodelling in the adult rat pulmonarycirculation. J Physiol 2003;547:133–145.
79. Wangensteen D, Bachofen H, Weibel ER. Effects of glutaraldehyde or
osmium tetroxide fixation on the osmotic properties of lung cells.J Microsc 1981;124:189–196.
80. Fehrenbach H, Ochs M. 1998. Studying lung ultrastructure. In: Uhlig S,
Taylor AE, editors. Methods in pulmonary research. Basel:Birkhauser; 1998. pp. 429–454.
81. Muhlfeld C, Mayhew TM, Gehr P, Rothen-Rutishauser B. A novel
quantitative method for analyzing the distributions of nanoparticlesbetween different tissue and intracellular compartments. J AerosolMed 2007;20:395–407.
82. Runciman SI, Baudinette RV, Gannon BJ. Postnatal development of
the lung parenchyma in a marsupial: the tammar wallaby. Anat Rec1996;244:193–206.
83. Burri PH. The postnatal growth of the rat lung: III. Morphology. Anat
Rec 1974;180:77–98.84. Zeltner TB, Bertacchini M, Messerli A, Burri PH. Morphometric
estimation of regional differences in the rat lung. Exp Lung Res1990;16:145–158.
85. Dorph-Petersen KA, Nyengaard JR, Gundersen HJ. Tissue shrinkage
and unbiased stereological estimation of particle number and size.J Microsc 2001;204:232–246.
86. Yan X, Polo Carbayo JJ, Weibel ER, Hsia CC. Variation of lung
volume after fixation when measured by immersion or Cavalierimethod. Am J Physiol Lung Cell Mol Physiol 2003;284:L242–L245.
87. Weibel ER, Knight BW. A morphometric study on the thickness of the
pulmonary air-blood barrier. J Cell Biol 1964;21:367–396.88. Dobrin PB. Effect of histologic preparation on the cross-sectional area
of arterial rings. J Surg Res 1996;61:413–415.89. Mayhew TM. Taking tissue samples from the placenta: an illustration
of principles and strategies. Placenta 2008;29:1–14.90. Cruz-Orive LM, Weibel ER. Sampling designs for stereology. J Microsc
1981;122:235–257.91. Gundersen HJ, Jensen EB. The efficiency of systematic sampling in
stereology and its prediction. J Microsc 1987;147:229–263.
92. Ogbuihi S, Cruz-Orive LM. Estimating the total number of lymphatic
valves in infant lungs with the fractionator. J Microsc 1990;158:19–30.
93. Hsia CCW, Herazo LF, Fryder-Doffey F, Weibel ER. Compensatory
lung growth occurs in adult dogs after right pneumonectomy. J ClinInvest 1994;94:405–412.
94. Mattfeldt T, Mall G, Gharehbaghi H, Moller P. Estimation of surface
area and length with the orientator. J Microsc 1990;159:301–317.95. Nyengaard JR, Gundersen HJG. The isector: a simple and direct
method for generating isotropic, uniform random sections from smallspecimens. J Microsc 1992;165:427–431.
96. Baddeley AJ, Gundersen HJ, Cruz-Orive LM. Estimation of surface
area from vertical sections. J Microsc 1986;142:259–276.97. Gundersen HJ. Stereology of arbitrary particles. A review of unbiased
number and size estimators and the presentation of some new ones, inmemory of William R. Thompson. J Microsc 1986;143:3–45.
98. Gundersen HJ. The smooth fractionator. J Microsc 2002;207:191–210.99. Hyde DM, Blozis SA, Avdalovic MV, Putney LF, Dettorre R,
Quesenberry NJ, Singh P, Tyler NK. Alveoli increase in numberbut not size from birth to adulthood in rhesus monkeys. Am J PhysiolLung Cell Mol Physiol 2007;293:L570–L579.
100. Muller AE, Cruz-Orive LM, Gehr P, Weibel ER. Comparison of
two subsampling methods for electron microscopic morphometry.J Microsc 1981;123:35–49.
101. Hyde DM, Henderson TS, Giri SN, Tyler NK, Stovall MY. Effect of
murine gamma interferon on the cellular responses to bleomycin inmice. Exp Lung Res 1988;14:687–704.
102. Cruz-Orive LM. Precision of Cavalieri sections and slices with local
errors. J Microsc 1999;193:182–198.103. Cruz-Orive LM. Best linear unbiased estimators for stereology. Bio-
metrics 1980;36:595–605.104. Gundersen HJ, Jensen EB, Kieu K, Nielsen J. The efficiency of
systematic sampling in stereology–reconsidered. J Microsc 1999;193:199–211.
105. Weibel ER, Kistler GS, Scherle WF. Practical stereological methods for
morphometric cytology. J Cell Biol 1966;30:23–38.106. Coxson HO, Mayo JR, Behzad H, Moore BJ, Verburgt LM, Staples
CA, Pare PD, Hogg JC. Measurement of lung expansion withcomputed tomography and comparison with quantitative histology.J Appl Physiol 1995;79:1525–1530.
107. Coxson HO, Rogers RM, Whittall KP, D’yachkova Y, Pare PD,
Sciurba FC, Hogg JC. A quantification of the lung surface area inemphysema using computed tomography. Am J Respir Crit Care Med1999;159:851–856.
108. Ravikumar P, Yilmaz C, Dane DM, Johnson RL Jr, Estrera AS, Hsia
CC. Regional lung growth following pneumonectomy assessed bycomputed tomography. J Appl Physiol 2004;97:1567–1574.
109. Pache JC, Roberts N, Vock P, Zimmermann A, Cruz-Orive LM.
Vertical LM sectioning and parallel CT scanning designs for stereol-ogy: application to human lung. J Microsc 1993;170:9–24.
110. Michel RP, Cruz-Orive LM. Application of the Cavalieri principle and
vertical sections method to lung: estimation of volume and pleuralsurface area. J Microsc 1988;150:117–136.
111. Scherle WF. A simple method of volumetry of organs in quantitative
stereology. Mikroskopie 1970;26:57–60.112. Hyde DM, Tyler NK, Putney LF, Singh P, Gundersen HJ. Total
number and mean size of alveoli in mammalian lung estimated usingfractionator sampling and unbiased estimates of the Euler character-istic of alveolar openings. Anat Rec 2004;277A:216–226.
113. Ochs M, Nyengaard JR, Jung A, Knudsen L, Voigt M, Wahlers T,
Richter J, Gundersen HJ. The number of alveoli in the human lung.Am J Respir Crit Care Med 2004;169:120–124.
114. Chalkley HW, Cornfield J, Park H. A method for estimating volume-
surface ratios. Science 1949;110:295–297.115. Campbell H, Tomkeieff SI. Calculation of the internal surface of a lung.
Nature 1952;170:116–117.116. Thurlbeck WM. Internal surface area and other measurements in
emphysema. Thorax 1967;22:483–496.117. Thurlbeck WM. The internal surface area of nonemphysematous lungs.
Am Rev Respir Dis 1967;95:765–773.118. Knudsen L, Weibel ER, Gundersen HJG, Weinstein FV, Ochs M.
Assessment of airspace size characteristics by intercept (chord)measurement: an accurate and efficient stereological approach.J Appl Physiol 2010;108:412–421.
119. Tanoli TS, Woods JC, Conradi MS, Bae KT, Gierada DS, Hogg JC,
Cooper JD, Yablonskiy DA. In vivo lung morphometry with hyper-
416 AMERICAN JOURNAL OF RESPIRATORY AND CRITICAL CARE MEDICINE VOL 181 2010

polarized 3He diffusion MRI in canines with induced emphysema:disease progression and comparison with computed tomography.J Appl Physiol 2007;102:477–484.
120. Yablonskiy DA, Sukstanskii AL, Leawoods JC, Gierada DS, Bretthorst
GL, Lefrak SS, Cooper JD, Conradi MS. Quantitative in vivoassessment of lung microstructure at the alveolar level with hyper-polarized 3He diffusion MRI. Proc Natl Acad Sci USA 2002;99:3111–3116.
121. Weibel ER. Morphometric estimation of pulmonary diffusion capacity:
I. Model and method. Respir Physiol 1970;11:54–75.122. Gundersen HJ, Jensen TB, Osterby R. Distribution of membrane
thickness determined by lineal analysis. J Microsc 1978;113:27–43.123. Jensen EB, Gundersen HJ, Osterby R. Determination of membrane
thickness distribution from orthogonal intercepts. J Microsc 1979;115:19–33.
124. Roughton FJ, Forster RE. Relative importance of diffusion and
chemical reaction rates in determining rate of exchange of gases inthe human lung, with special reference to true diffusing capacity ofpulmonary membrane and volume of blood in the lung capillaries.J Appl Physiol 1957;11:290–302.
125. Weibel ER, Federspiel WJ, Fryder-Doffey F, Hsia CCW, Kunig M,
Stalder-Navarro V, Vock R. Morphometric model for pulmonarydiffusing capacity: I. Membrane diffusing capacity. Respir Physiol1993;93:125–149.
126. Sapoval B, Filoche M, Weibel ER. Smaller is better–but not too small:
a physical scale for the design of the mammalian pulmonary acinus.Proc Natl Acad Sci USA 2002;99:10411–10416.
127. Weibel ER, Sapoval B, Filoche M. Design of peripheral airways for
efficient gas exchange. Respir Physiol Neurobiol 2005;148:3–21.128. Takeda SI, Ramanathan M, Estrera AS, Hsia CC. Postpneumonectomy
alveolar growth does not normalize hemodynamic and mechanicalfunction. J Appl Physiol 1999;87:491–497.
129. Petersen MS, Petersen CC, Agger R, Hokland M, Gundersen HJ. A
simple method for unbiased quantitation of adoptively transferredcells in solid tissues. J Immunol Methods 2006;309:173–181.
130. Hyde DM, Miller LA, McDonald RJ, Stovall MY, Wong V,
Pinkerton KE, Wegner CD, Rothlein R, Plopper CG.Neutrophils enhance clearance of necrotic epithelial cells inozone- induced lung injury in rhesus monkeys. Am J Physiol1999;277:L1190–L1198.
131. Ochs M, Knudsen L, Allen L, Stumbaugh A, Levitt S, Nyengaard
JR, Hawgood S. GM-CSF mediates alveolar epithelial type IIcell changes, but not emphysema-like pathology, in SP-D-deficient mice. Am J Physiol Lung Cell Mol Physiol 2004;287:L1333–L1341.
132. Jung A, Allen L, Nyengaard JR, Gundersen HJ, Richter J, Hawgood S,
Ochs M. Design-based stereological analysis of the lung parenchymalarchitecture and alveolar type II cells in surfactant protein A and Ddouble deficient mice. Anat Rec A Discov Mol Cell Evol Biol 2005;286:885–890.
133. Geiser M, Cruz-Orive LM, Im Hof V, Gehr P. Assessment of
particle retention and clearance in the intrapulmonary conductingairways of hamster lungs with the fractionator. J Microsc 1990;160:75–88.
134. Lucocq J. Quantitation of gold labelling and antigens in immunola-
belled ultrathin sections. J Anat 1994;184:1–13.135. Mayhew TM. Quantitative immunoelectron microscopy: alternative
ways of assessing subcellular patterns of gold labeling. Methods MolBiol 2007;369:309–329.
136. Mayhew TM, Lucocq JM, Griffiths G. Relative labelling index: a novel
stereological approach to test for non-random immunogold labellingof organelles and membranes on transmission electron microscopythin sections. J Microsc 2002;205:153–164.
137. Ochs M, Johnen G, Muller KM, Wahlers T, Hawgood S, Richter J,
Brasch F. Intracellular and intraalveolar localization of surfactantprotein A (SP-A) in the parenchymal region of the human lung. Am JRespir Cell Mol Biol 2002;26:91–98.
138. Fehrenbach H, Tews S, Fehrenbach A, Ochs M, Wittwer T, Wahlers T,
Richter J. Improved lung preservation relates to an increase in tubularmyelin-associated surfactant protein A. Respir Res 2005;6:1–12.
139. Schmiedl A, Ochs M, Muhlfeld C, Johnen G, Brasch F. Distribution of
surfactant proteins in type II pneumocytes of newborn, 14-day old,and adult rats: an immunoelectron microscopic and stereologicalstudy. Histochem Cell Biol 2005;124:465–476.
140. Mayhew T, Griffiths G, Habermann A, Lucocq J, Emre N, Webster P.
A simpler way of comparing the labelling densities of cellular com-
partments illustrated using data from VPARP and LAMP-1 immu-nogold labelling experiments. Histochem Cell Biol 2003;119:333–341.
141. Mayhew TM, Griffiths G, Lucocq JM. Applications of an efficient
method for comparing immunogold labelling patterns in the same setsof compartments in different groups of cells. Histochem Cell Biol2004;122:171–177.
142. Mayhew TM, Lucocq JM. Quantifying immunogold labelling patterns
of cellular compartments when they comprise mixtures of membranes(surface-occupying) and organelles (volume-occupying). HistochemCell Biol 2008;129:367–378.
143. Muhlfeld C, Rothen-Rutishauser B, Vanhecke D, Blank F, Gehr P,
Ochs M. Visualization and quantitative analysis of nanoparticles inthe respiratory tract by transmission electron microscopy. Part FibreToxicol 2007;4:11.
144. Raabe OG, Yeh HC, Schum GM, Phalen RF. Tracheobronchial
geometry: human, dog, rat, hamster. LF-53 Category UC-48. Albu-querque, New Mexico: Inhalation Toxicology Research Institute;1976.
145. Weibel ER. Fractal geometry: a design principle for living organisms.
Am J Physiol Lung Cell Mol Physiol 1991;5:L361–L369.146. Horsfield K. Pulmonary airways and blood vessels considered as
confluent trees. In: Crystal RG, West JB, Weibel ER, Barnes PJ,editors. The lung: scientific foundations, 2nd ed. Philadelphia: Lip-pencott-Raven Publishers; 1997. pp. 1073–1079.
147. Hislop A, Reid L. Intra-pulmonary arterial development during fetal
life-branching pattern and structure. J Anat 1972;113:35–48.148. Huang W, Yen RT, McLaurine M, Bledsoe G. Morphometry of the
human pulmonary vasculature. J Appl Physiol 1996;81:2123–2133.149. Horsfield K, Relea FG, Cumming G. Diameter, length and branching
ratios in the bronchial tree. Respir Physiol 1976;26:351–356.150. Horsfield K, Dart G, Olson DE, Filley GF, Cumming G. Models of the
human bronchial tree. J Appl Physiol 1971;31:207–217.151. Phalen RF, Oldham MJ. Tracheobronchial airway structure as revealed
by casting techniques. Am Rev Respir Dis 1983;128:S1–S4.152. Rodriguez M, Bur S, Favre A, Weibel ER. Pulmonary acinus: geometry
and morphometry of the peripheral airway system in rat and rabbit.Am J Anat 1987;180:143–155.
153. Haefeli-Bleuer B, Weibel ER. Morphometry of the human pulmonary
acinus. Anat Rec 1988;220:401–414.154. Phalen RF, Oldham MJ, Beaucage CB, Crocker TT, Mortensen JD.
Postnatal enlargement of human tracheobronchial airways and im-plications for particle deposition. Anat Rec 1985;212:368–380.
155. Maletti GM, Wulfsohn D. Evaluation of variance models for fraction-
ator sampling of trees. J Microsc 2006;222:228–241.156. Sauret V, Halson PM, Brown IW, Fleming JS, Bailey AG. Study of
the three-dimensional geometry of the central conducting airways inman using computed tomographic (CT) images. J Anat 2002;200:123–134.
157. Tawhai MH, Hunter P, Tschirren J, Reinhardt J, McLennan G,
Hoffman EA. CT-based geometry analysis and finite element modelsof the human and ovine bronchial tree. J Appl Physiol 2004;97:2310–2321.
158. Brillet PY, Fetita CI, Beigelman-Aubry C, Saragaglia A, Perchet D,
Preteux F, Grenier PA. Quantification of bronchial dimensions atMDCT using dedicated software. Eur Radiol 2007;17:1483–1489.
159. Plopper CG, Heidsiek JG, Weir AJ, George JA, Hyde DM. Tracheo-
bronchial epithelium in the adult rhesus monkey: a quantitativehistochemical and ultrastructural study. Am J Anat 1989;184:31–40.
160. Mercer RR, Crapo JD. Three-dimensional reconstruction of the rat
acinus. J Appl Physiol 1987;63:785–794.161. Singhal S, Henderson R, Horsfield K, Harding K, Cumming G.
Morphometry of the human pulmonary arterial tree. Circ Res 1973;33:190–197.
162. Horsfield K, Gordon WI. Morphometry of pulmonary veins in man.
Lung 1981;159:211–218.163. Dawson CA, Krenz GS, Karau KL, Haworth ST, Hanger CC, Linehan
JH. Structure-function relationships in the pulmonary arterial tree.J Appl Physiol 1999;86:569–583.
164. Jiang ZL, Kassab GS, Fung YC. Diameter-defined Strahler system and
connectivity matrix of the pulmonary arterial tree. J Appl Physiol1994;76:882–892.
165. Burrowes KS, Hunter PJ, Tawhai MH. Anatomically based
finite element models of the human pulmonary arterial and venoustrees including supernumerary vessels. J Appl Physiol 2005;99:731–738.
American Thoracic Society Documents 417
166. Davies P, Reid L. Hypoxic remodeling of the rat pulmonary arterialmicrocirculation assessed by microdissection. J Appl Physiol 1991;71:1886–1891.
167. Jeffery P, Holgate S, Wenzel S. Methods for the assessment ofendobronchial biopsies in clinical research: application to studies ofpathogenesis and the effects of treatment. Am J Respir Crit Care Med2003;168:S1–S17.
168. Kadokura M, Colby TV, Myers JL, Allen MS, Deschamps C, TrastekVF, Pairolero PC. Pathologic comparison of video-assisted thoracicsurgical lung biopsy with traditional open lung biopsy. J ThoracCardiovasc Surg 1995;109:494–498.
169. Regamey N, Ochs M, Hilliard TN, Muhlfeld C, Cornish N, Fleming L,Saglani S, Alton EW, Bush A, Jeffery PK, et al. Increased airwaysmooth muscle mass in children with asthma, cystic fibrosis, and non-cystic fibrosis bronchiectasis. Am J Respir Crit Care Med 2008;177:837–843.
170. Woodruff PG, Dolganov GM, Ferrando RE, Donnelly S, Hays SR,Solberg OD, Carter R, Wong HH, Cadbury PS, Fahy JV. Hyperplasiaof smooth muscle in mild to moderate asthma without changes in cellsize or gene expression. Am J Respir Crit Care Med 2004;169:1001–1006.
171. Ordonez CL, Khashayar R, Wong HH, Ferrando R, Wu R, Hyde DM,Hotchkiss JA, Zhang Y, Novikov A, Dolganov G, et al. Mild andmoderate asthma is associated with airway goblet cell hyperplasia andabnormalities in mucin gene expression. Am J Respir Crit Care Med2001;163:517–523.
172. Ferrando RE, Nyengaard JR, Hays SR, Fahy JV, Woodruff PG.Applying stereology to measure thickness of the basement membranezone in bronchial biopsy specimens. J Allergy Clin Immunol 2003;112:1243–1245.
173. Langston C, Patterson K, Dishop MK, Askin F, Baker P, Chou P, Cool C,Coventry S, Cutz E, Davis M, et al. A protocol for the handling of tissueobtained by operative lung biopsy: recommendations of the chILDpathology co-operative group. Pediatr Dev Pathol 2006;9:173–180.
174. Churg A. An inflation procedure for open lung biopsies. Am J SurgPathol 1983;7:69–71.
175. Hoffman EA, Olsen LE. 1998. Characteristics of respiratory systemcomplexity captured via X-ray computed tomography: image acqui-sition, display, and analysis. In: Hlastalla M, Robertson T, editors.Complexities of structure and function of the lung. New York: MarcelDekker, Inc.; 1998. pp. 325–378.
176. Hoffman EA, Sinak LJ, Robb RA, Ritman EL. Noninvasive quantita-tive imaging of shape and volume of lungs. J Appl Physiol 1983;54:1414–1421.
177. Hoffman EA. Effect of body orientation on regional lung expansion:a computed tomographic approach. J Appl Physiol 1985;59:468–480.
178. Won C, Chon D, Tajik J, Tran BQ, Robinswood GB, Beck KC,Hoffman EA. CT-based assessment of regional pulmonary microvas-cular blood flow parameters. J Appl Physiol 2003;94:2483–2493.
179. Madani A, Zanen J, de Maertelaer V, Gevenois PA. Pulmonaryemphysema: objective quantification at multi-detector row CT–com-parison with macroscopic and microscopic morphometry. Radiology2006;238:1036–1043.
180. de Jong PA, Nakano Y, Lequin MH, Merkus PJ, Tiddens HA, HoggJC, Coxson HO. Estimation of lung growth using computed tomog-raphy. Eur Respir J 2003;22:235–238.
181. Takeda S, Wu EY, Epstein RH, Estrera AS, Hsia CC. In vivoassessment of changes in air and tissue volumes after pneumonec-tomy. J Appl Physiol 1997;82:1340–1348.
182. Ravikumar P, Yilmaz C, Dane DM, Johnson RL Jr, Estrera AS, HsiaCC. Developmental signals do not further accentuate nonuniformpostpneumonectomy compensatory lung growth. J Appl Physiol 2007;102:1170–1177.
183. Coxson HO, Hogg JC, Mayo JR, Behzad H, Whittall KP, SchwartzDA, Hartley PG, Galvin JR, Wilson JS, Hunninghake GW.Quantification of idiopathic pulmonary fibrosis using computedtomography and histology. Am J Respir Crit Care Med 1997;155:1649–1656.
184. Wandtke JC, Hyde RW, Fahey PJ, Utell MJ, Plewes DB, Goske MJ,Fischer HW. Measurement of lung gas volume and regionaldensity by computed tomography in dogs. Invest Radiol 1986;21:108–117.
185. Uppaluri R, Hoffman EA, Sonka M, Hartley PG, Hunninghake GW,McLennan G. Computer recognition of regional lung disease pat-terns. Am J Respir Crit Care Med 1999;160:648–654.
186. Xu Y, Sonka M, McLennan G, Guo J, Hoffman EA. MDCT-based 3-Dtexture classification of emphysema and early smoking related lungpathologies. IEEE Trans Med Imaging 2006;25:464–475.
187. Roberts N, Puddephat MJ, McNulty V. The benefit of stereology forquantitative radiology. Br J Radiol 2000;73:679–697.
188. Hu S, Hoffman EA, Reinhardt JM. Automatic lung segmentation foraccurate quantitation of volumetric X-ray CT images. IEEE TransMed Imaging 2001;20:490–498.
189. Tschirren J, Hoffman EA, McLennan G, Sonka M. Intrathoracicairway trees: segmentation and airway morphology analysis fromlow-dose CT scans. IEEE Trans Med Imaging 2005;24:1529–1539.
190. Ukil S, Reinhardt JM. Anatomy-guided lung lobar surface detection inX-ray CT images. IEEE Trans Med Imaging 2009;28:202–214.
191. Palagyi K, Tschirren J, Sonka M. Quantitative analysis of intrathoracicairway trees: methods and validation. Inf Process Med Imaging 2003;18:222–233.
192. Tschirren J, McLennan G, Palagyi K, Hoffman EA, Sonka M. Match-ing and anatomical labeling of human airway tree. IEEE Trans MedImaging 2005;24:1540–1547.
193. Saba OI, Hoffman EA, Reinhardt JM. Maximizing quantitativeaccuracy of lung airway lumen and wall measures obtained from X-ray CT imaging. J Appl Physiol 2003;95:1063–1075.
194. Namati E, Chon D, Thiesse J, Hoffman EA, de Ryk J, Ross A, McLennanG. In vivo micro-CT lung imaging via a computer-controlled intermit-tent iso-pressure breath hold (IIBH) technique. Phys Med Biol 2006;51:6061–6075.
195. Cavanaugh D, Travis EL, Price RE, Gladish G, White RA, Wang M,Cody DD. Quantification of bleomycin-induced murine lung damagein vivo with micro-computed tomography. Acad Radiol 2006;13:1505–1512.
196. Litzlbauer HD, Neuhaeuser C, Moell A, Greschus S, Breithecker A,Franke FE, Kummer W, Rau WS. Three-dimensional imaging andmorphometric analysis of alveolar tissue from microfocal X-ray-computed tomography. Am J Physiol Lung Cell Mol Physiol 2006;291:L535–L545.
197. Saam B, Yablonskiy DA, Gierada DS, Conradi MS. Rapid imaging ofhyperpolarized gas using EPI. Magn Reson Med 1999;42:507–514.
198. Chen XJ, Hedlund LW, Moller HE, Chawla MS, Maronot RR, JohnsonGA. Detection of emphysema in rat lungs by using magneticresonance measurements of 3He diffusion. Proc Natl Acad Sci USA2000;97:11478–11481.
199. Leawoods JC, Yablonskiy DA, Saam B, Gierada DS, Conrad MS.Hyperpolarized 3He gas production and MR imaging of the lung.Concepts Magn Reson 2001;13:277–293.
200. Saam BT, Yablonskiy DA, Kodibagkar VD, Leawoods JC, GieradaDS, Cooper JD, Lefrak SS, Conradi MS. MR imaging of diffusion of(3)He gas in healthy and diseased lungs. Magn Reson Med 2000;44:174–179.
201. Peces-Barba G, Ruiz-Cabello J, Cremillieux Y, Rodriguez I, Dupuich D,Callot V, Ortega M, Rubio Arbo ML, Cortijo M, Gonzalez-MangadoN. Helium-3 MRI diffusion coefficient: correlation to morphometry ina model of mild emphysema. Eur Respir J 2003;22:14–19.
202. Emami K, Cadman RV, Woodburn JM, Fischer MC, Kadlecek SJ, ZhuJ, Pickup S, Guyer RA, Law M, Vahdat V, et al. Early changes of lungfunction and structure in an elastase model of emphysema–a hyper-polarized 3He MRI study. J Appl Physiol 2008;104:773–786.
203. Sukstanskii AL, Yablonskiy DA. In vivo lung morphometry withhyperpolarized 3He diffusion MRI: theoretical background. J MagnReson 2008;190:200–210.
204. Harris RS, Schuster DP. Visualizing lung function with positronemission tomography. J Appl Physiol 2007;102:448–458.
205. Velazquez M, Weibel ER, Kuhn C III, Schuster DP. PET evaluation ofpulmonary vascular permeability: a structure-function correlation.J Appl Physiol 1991;70:2206–2216.
206. Petersson J, Sanchez-Crespo A, Larsson SA, Mure M. Physiologicalimaging of the lung: single-photon-emission computed tomography(SPECT). J Appl Physiol 2007;102:468–476.
207. Hsia CC, Fryder-Doffey F, Stalder-Navarro V, Johnson RLJ, ReynoldsRC, Weibel ER. Structural changes underlying compensatory in-crease of diffusing capacity after left pneumonectomy in adult dogs.J Clin Invest 1993;92:758–764. [(Published erratum appears in J ClinInvest 1994;93:913.]
208. Hyde DM, Tyler NK, Plopper CG. Morphometry of the respiratorytract: avoiding the sampling, size, orientation, and reference traps.Toxicol Pathol 2007;35:41–48.
418 AMERICAN JOURNAL OF RESPIRATORY AND CRITICAL CARE MEDICINE VOL 181 2010