Embed Size (px)
Citation preview

PRINCIPAL LEADERSHIP FOR INSTRUCTION: ASSOCIATIONS BETWEEN
PRINCIPAL VISION, PRINCIPAL INVOLVEMENT IN INSTRUCTION,
AND TEACHERS’ PERCEPTIONS OF EXPECTATIONS FOR
STANDARDS-BASED INSTRUCTIONAL PRACTICE
by
Karin Katterfeld
Dissertation
Submitted to the Faculty of the
Graduate School of Vanderbilt University
in partial fulfillment of the requirements
for the degree of
DOCTOR OF PHILOSOPHY
in
Leadership and Policy Studies
May 2011
Nashville, Tennessee
Approved:
Professor Thomas M. Smith
Professor Ellen B. Goldring
Professor Paul Cobb
Professor Sun-Joo Cho

ii
Copyright 2011 by Karin Katterfeld All Rights Reserved

iii
DEDICATION
Três anos e meio no estrangeiro Uma língua eu esperava reconhecer
Mas o que é isso?
Surpreendente
Elegante
Dificil
E afinal, as pessoas gostam de mim
Aos que virão depois de mim

iv
ACKNOWLEDGEMENTS
Thank you to all dissertation committee members
for the time spent in reading dissertation drafts and for feedback.
Your perspectives have impacted this work throughout, from its overall
direction to the details of the analysis.
Thank you to those who worked with me to double code data:
Daniel P. Berebitsky, Anne L. Garrison, Christine J. Larson,
Rebecca Marchiafava, Brooks A. Rosenquist, and Rebecca A. Schmidt.
Data come from the
Middle School Mathematics and the Institutional Setting of Teaching (MIST) research project,
supported by the National Science Foundation under Grant No. ESI-0554535, titled
Designing Learning Organizations for Instructional Improvement in Mathematics
Thanks to Vanderbilt’s Experimental Education Research Training (ExpERT) program
(Institute of Education Sciences, U. S. Department of Education, Grant R305B080025)
for providing funding for my studies.
The opinions expressed in this study are those of the author.

v
TABLE OF CONTENTS
Page
DEDICATION.................................................................................................................................iii
ACKNOWLEDGEMENTS.............................................................................................................iv
LIST OF TABLES.........................................................................................................................viii
LIST OF FIGURE ...........................................................................................................................ix
Chapter
I. OBJECTIVES AND BACKGROUND ....................................................................................... 1
Objectives ........................................................................................................................... 1 The Nature of the Changes Required by Standards-based Instructional Reforms ............ 2 Conceptualizations of Instructional Leadership ................................................................. 6
School-wide Instructional Vision .......................................................................... 6 Focus on Instruction .............................................................................................. 9
Principal Leadership for Standards-based Instruction...................................................... 10 School Leaders’ Sense-making about Standard-based Instructional Reform ................. 12 Research Questions........................................................................................................... 16
II. THEORETICAL FRAMEWORK ........................................................................................ 17
Principal Involvement in Instruction ................................................................................ 20 Principal Vision for Math Instruction............................................................................... 24 Principal Expectations for Standards-based Instructional Practice .................................. 27 Analysis plan .................................................................................................................... 28
III. DATA AND METHOD ....................................................................................................... 31
Data................................................................................................................................... 31 Survey and Interview Data .................................................................................. 34
Measures ......................................................................................................................... 38 Involvement in Instruction Scale ....................................................................... 38 Vision of Standards-based Instructional Reform in Mathematics ...................... 40 Expectations for Standards-based Instructional Practice .................................... 41
Methods ............................................................................................................................ 43 Scale for Principal Involvement in Instruction.................................................... 43
Block 1 ................................................................................................... 44 Block 2 ................................................................................................... 47 Block 3 ................................................................................................... 49 Block 4 ................................................................................................... 50 Rating Scale Model ................................................................................ 50

vi
Multi-level Rating Scale Model ............................................................. 54 Reliability Assessed Using IRT and CTT .............................................. 56 Validity Assessed Using IRT ................................................................. 56
Investigation of Differential Item Functioning (DIF) ............... 59 School-Level Measure of Principal Involvement in Instruction ............ 61
Principal Instructional Vision.............................................................................. 62 Creation of Variables.............................................................................. 64 Two Methods for Addressing Missing Data .......................................... 66
Expectations for Standards-based Instruction ..................................................... 67 Rubric Levels ......................................................................................... 67 Procedures for Coding and Reliability ................................................... 73
Hierarchical Generalized Linear Model (HGLM) Analysis................................ 75 Test of Hypothesis 1............................................................................... 75 Test of Hypothesis 2............................................................................... 79
IV. RESULTS................................................................................................................................ 81 Involvement in Instruction Scale ..................................................................................... 81
Item Fit ................................................................................................................ 82 Multilevel Model ................................................................................................. 83 Reliability ............................................................................................................ 85
Standard Errors for IRT Estimates ......................................................... 85 Standard Error of Measurement (SEM) ................................................. 85
Validity of the Scale ............................................................................................ 86 Internal Structure .................................................................................... 91 Differential Item Functioning (DIF)....................................................... 93 Comparison with Results from Prior Research ...................................... 97 Overall Validity of the Scale for Use in Standards-based Contexts..... 101
Expectations for Standards-based Instructional Practice................................................ 101 Refinement of the Rubric .................................................................................. 101
Possible Addition of Rubric Levels ..................................................... 108 Re-examination of Levels Indicating Function-based Expectations .... 109 Curriculum and Pacing ........................................................................ 111
Description of Typical Responses at Each Level .............................................. 112 Validity of Selection of Interview Questions .................................................... 114 Reliability .......................................................................................................... 116 Faculty Reports of Principal Expectations ....................................................... 117
Vision of Standards-based Mathematics Instruction ...................................................... 119 Description of Typical Responses at Each Level .............................................. 120 Creation of Vision Measures for Use in Analyses ............................................ 122
Hierarchical Generalized Linear Model (HGLM) Analysis........................................... 125 ANOVA and Teacher-level Predictors.............................................................. 125 School-level Predictors...................................................................................... 131 Ordinal Model ................................................................................................... 133
Limitations...................................................................................................................... 134 V. DISCUSSION ........................................................................................................................ 136
Similarity of Instructional Leadership in Subject-specific Contexts and Broader Contexts .......................................................................................................................... 137 Validity of the Involvement Scale .................................................................................. 138 Questions Raised by Results .......................................................................................... 139 Directions for Future Research....................................................................................... 147

vii
VI. CONCLUSION ......................................................................................................................150 Appendices A. NESTING OF ITEM RESPONSE DATA ..............................................................................153 B. SEPARATION RELIABILITY COEFFICIENT ................................................................... 154 C. MUNTER RUBRIC FOR VISION OF HIGH QUALITY MATHEMATICS INSTRUCTION, NATURE OF CLASSROOM DISCOURSE.................................................. 155 D. MUNTER RUBRIC FOR VISION OF HIGH QUALITY MATHEMATICS INSTRUCTION, MATHEMATICAL TASKS .......................................................................... 158 E. MUNTER RUBRIC FOR VISION OF HIGH QUALITY MATHEMATICS INSTRUCTION, ROLE OF THE TEACHER............................................................................ 160 F. RATING SCALE MODEL: ESTIMATES OF ITEM LOCATIONS .....................................166 G. SCHOOL-LEVEL LOCATION ESTIMATES FOR PRINCIPAL INVOLVEMENT IN INSTRUCTION, BY DISTRICT ................................................................................................ 167 H. HISTOGRAMS OF PRINCIPAL VISION VARIABLE, BEFORE AND AFTER IMPUTATION .............................................................................................................................168 REFERENCES .............................................................................................................................169

viii
LIST OF TABLES
Table Page
1. Descriptive Statistics ................................................................................................................. 36 2. Survey Items in the Principal Instructional Involvement Scale ................................................ 39 3. Coverage Table for the Principal Involvement in Instruction Construct .................................. 48 4. Rating Scale Model, Measures of Item Fit ................................................................................ 82 5. Multi-level Rating Scale Model: Estimates of Item Locations ..................................................84 6. DIF by School District: Logistic Regression Likelihood Ratio Tests ....................................... 94 7. DIF by School District: Generalized Mantel-Haenszel Statistics ............................................. 95 8. DIF by Gender: Logistic Regression Likelihood Ratio Tests ................................................... 96 9. DIF by Gender: Generalized Mantel-Haenszel Statistics.......................................................... 96 10. Ordering of Items by Difficulty in Empirical Results and in Previous Research.................... 98 11. Rubric for Mathematics Teachers’ Reports of Principal Expectations for Standards-based Instructional Practices ...................................................................................... 103 12. Correlations among School Level Variables ..........................................................................124 13. Comparison of HGLM Models.............................................................................................. 127 14. Within-school Variability in Involvement and Expectation Measures.................................. 144

ix
LIST OF FIGURES
Figure Page
1. Theoretical Framework.............................................................................................................. 19 2. Construct Map ........................................................................................................................... 46 3. Parameters To Be Estimated in IRT Rating Scale Model for Polytomous Data, Item i ........... 52 4. Map of Latent Distributions and Response Model Location Estimates, from the Multi-level Rating Scale Model (Wright Map) ............................................................................. 89 5. Information Curve for the Principal Instructional Involvement Scale ..................................... 90
6. Item Location Estimates Based on MIST Data and CCSR Data ............................................ 100
7. Faculty Reports of Principal Instructional Expectations ......................................................... 118
1
CHAPTER I
OBJECTIVES AND BACKGROUND
Objectives
Principal instructional leadership has been labeled as one of the key supports for
improved standards-based instruction in mathematics. This study examines the relationships
among three dimensions of principal instructional leadership in the context of four school districts
implementing standards-based instructional reforms. Drawing upon both cognitive and task-
oriented perspectives on leadership, the study investigates the influence of what the principal
knows and does on the instructional expectations perceived by teachers. The three dimensions are
measured using a conventional survey scale for involvement in instruction, a qualitative coding
scheme for expectations about instructional quality, and a coding framework for several elements
of the principal’s instructional vision in mathematics. Analysis begins with an investigation of the
validity of the survey measure in the context standards-based mathematics instruction. Next, a
composite measure of principals’ vision of instruction is used to measure the goals that principals
envision for standards-based instruction in mathematics. Third, teachers’ responses to semi-
structured interview questions about their perceptions of their principals’ expectations for
standards-based instructional practices are assessed, using a rubric created for this purpose.
Finally, a hierarchical generalized linear model (HGLM) is used to investigate the extent to which
principals’ instructional involvement and vision predict teachers’ perceptions of expectations for
standards-based instructional practices. Much policy research has indicated that instructional
leadership influences school outcomes, in part through setting school-wide expectations and
monitoring of instruction. More recently, subject-specific research in mathematics education has
called for instructional leadership to support the implementation of standards-based instructional
reforms. The current analysis investigates how instructional leadership functions in the context of

2
standards-based instructional reforms, asking what principals need to know and do in order for
teachers to perceive instructional expectations for high quality standards-based practices in
mathematics. As school districts and researchers both seek to better support principals as
instructional leaders, this study investigates the degree to which the depth of principals’ vision
and the extent of their involvement in instruction influence the expectations that teachers perceive
for what should constitute classroom instructional practice.
The Nature of the Changes Required by Standards-based Instructional Reforms
Standards-based educational reforms are intended to provide educators with coherent
goals for their work and ensure challenging, equitable educational experiences for all students
(Fuhrman, 2001). Every state in the U.S. has adopted content standards for K-12 public
education, and the press to increase the rigor of the standards continues (Carmichael, 2010).
While many reform initiatives have been referred to as “standards-based,” this study uses the
term to refer to initiatives that “call for more intellectually demanding content and pedagogy for
everyone, challenging deeply rooted beliefs about who can do intellectually demanding work and
questioning popular conceptions of teaching, learning, and subject matter” (Spillane, Reiser, &
Reimer, 2002, pg. 387, emphasis the authors’). The success of policies mandating such reforms is
by no means assured (Cohen, Moffitt, & Goldin, 2007).
Standards-based instructional reforms are especially needed in mathematics, where
problems of low achievement and lack of equity in student achievement remain unresolved
(Schmidt, 2003; Schoenfeld, 2002; Moses, 1989; National Research Council, 1989). Concerns
about mathematics are particularly pressing because success in mathematics is seen as a gateway
to opportunities in higher education and future employment (Schmidt, 2003). Standards-based
mathematics reforms are intended to address these concerns by building students’ conceptual
understanding rather than simply increasing their store of memorized procedures (Stein &
Nelson, 2003). Standards-based math instruction offers students many opportunities to use

3
mathematics in problem solving (NCTM, 2000; 1980; Schoenfeld, 1982). Research has
repeatedly shown that problem-solving activities provide students with opportunities to develop
greater understanding of mathematics as they make their own connections between mathematical
concepts and develop ways to verify their conclusions. For instance, based on their review of
research findings, Hiebert and colleagues (1996) conclude that “by working through problematic
situations, students learn how to construct strategies and how to adjust strategies to solve new
kinds of problems … students who have been encouraged to treat situations problematically and
develop their own strategies can adapt them later, or invent new ones, to solve new problems”
(pg. 17). This contrasts with the pattern of student passivity that researchers maintain has
predominated in American mathematics classrooms – a pattern which Franke, Kazemi, and
Battey (2007) describe as initiation-response-evaluation (IRE). Under standards-based reform
students do not simply respond to the teacher’s questions, so that the teacher can evaluate their
mastery of procedural knowledge. Rather, they actively develop their capacity for mathematical
reasoning.
Yet, implementation of instructional practices that support students’ conceptual
understanding of mathematics poses substantial challenges for teachers. According to Spillane
and Thompson (1997), standards-based mathematics instruction “departs fundamentally from
modal practice and notions about teaching, learning, and subject matter” (pg. 185). Teachers are
asked to assign new types of tasks for students, implement new strategies for instruction, develop
new patterns of discussion in their classroom, and build new classroom roles for both themselves
and their students. For instance, standards-based practices require teachers to use instructional
grouping strategies, so that students can collaboratively explore the application of mathematical
concepts. Knowledge is no longer seen as “discrete chunks” of information to be delivered in
lecture format, then memorized or practiced (Nelson, 1999, pg. 4). Rather, it is something to be
developed through mathematical discussions with peers (Schoenfeld, 2004). Collaborative
conversations are expected to facilitate the development of “deep knowledge of the subject,” or

4
conceptual understanding, allowing students to make “mental connections among mathematical
facts” (Hiebert & Grouws, 2007, pgs. 388, 382). Spillane (2000b) characterized this type of
knowledge as principled mathematical knowledge (e.g., knowledge focused on mathematical
concepts) and contrasted it with procedural mathematical knowledge (e.g., knowledge focused on
memorization and use of algorithms). Researchers suggest that students build such knowledge
through “struggle” with challenging mathematical problems – mathematical work that differs
markedly from the “tidy curriculum” that teachers are used to presenting (Hiebert & Grouws,
2007, pg. 388).
Implementation of standards-based instruction requires different kinds of knowledge than
most teachers have developed in the course of their teaching careers (Sherin, 2002; Cohen & Hill,
2000; Cohen, Moffitt, & Goldin, 2007). In order to help students develop conceptual or principled
knowledge, teachers themselves need a deep understanding of the mathematics involved in the
problems they assign, familiarity with how students tend to struggle with those problems, and
methods for supporting students’ productive struggle (Hiebert & Grouws, 2007; Stein & Nelson,
2003). This deeper understanding is needed throughout the process of planning and implementing
standards-based instruction. To begin with, teachers are asked to select high-quality tasks for their
classes that have the potential for supporting students’ growth in conceptual understanding of
mathematical ideas (Stein, Grover, & Henningsen, 1996). Teachers are expected to assess
whether a task can be solved a number of ways and can lead to the kind of mathematical
discussions that are envisioned in standards-based reforms (Boston & Wolf, 2006). Once student
groups have generated a number of solution strategies, teachers need to facilitate classroom
discussion, helping students to think through connections among various solution methods, and
thereby enriching students’ understanding of the mathematical concepts involved (Hufferd-
Ackles, Fuson, & Sherin, 2004). Successful implementation of standards-based instructional
strategies necessitates changed roles for both the teacher and the students. As Hill (2001)
explains, “teachers should relinquish their role as explainers of mathematical topics and adopt a

5
stance akin to that of a coach who helps guide students through difficult intellectual terrain” (Pg.
293). Understood in this way, standards-based reforms require deep changes in typical patterns of
teaching (Hiebert & Grouws, 2007; Elmore, 1996).
Teachers often implement only a part of the reforms, missing the core changes that bring
increased student understanding (Stein, et al., 2008; Hill, 2001; Ball, 1992). Teachers may use
new materials such as manipulatives, assign students to work in small groups, and incorporate
more class discussion into their lessons. However, if these changes are implemented simply as
additional means of building students’ mastery of procedural knowledge, then classroom patterns
will only be changed on the surface, rather than at the depth that is being called for in current
mathematics standards (National Council of Teachers of Mathematics, 2000). Instructional
reforms like increased group work and classroom discussion, as understood by reformers, are
intended to change the function of instruction: to build students ability to reason mathematically,
to engage in complex problems solving, and to clearly communicate about their findings
(Schoenfeld, 2002; Stein, Grover, & Henningsen, 1996). This means that teachers need to focus
not only on the “forms” of standards-based instructional strategies, but also the epistemological
and pedagogical “functions” (Spillane & Callahan, 2000; Spillane, 2000b). For instance, as
Spillane and Zeuli (1999) explain, teachers may direct students to work in groups, but expect the
students to work together only to find the correct procedure to answer a question. Only the form
of instruction has changed, not the kind of understanding that students are expected to develop.
Alternately, Spillane and Zeuli note that teachers may expect that students collaborate to explore
the nature of a problem, consider the mathematical relationships involved, and arrive at
appropriate solution strategies. In this case, the function of classroom activity has changed, not
only its form. Kazemi and Stipek (2001) provide examples of class discussion implemented at the
form level and the function level. In one case, the teacher presses students for detailed
justifications for their solution methods and asks students to discuss apparent contradictions
between their method and other groups’ methods (the intended function of classroom discussion),
6
while in another case, the teacher is satisfied with only the form of classroom discussion – not
pressing students for anything more than short answers such as, “One and ½” (Kazemi & Stipek,
2001, pg. 71). Teachers struggle with development of these new practices (Coburn, 2001; Cohen
& Barnes, 1993; Sherin, 2002), and instructional leadership is viewed as one lever for supporting
the implementation of school-wide standards-based instructional reform (Nelson & Sassi, 2005;
Stein & Nelson, 2003; Fink & Resnick, 2001). Instructional leaders are seen as both articulating
goals for standards-based instruction and monitoring progress toward reaching those goals across
all classrooms.
Conceptualizations of Instructional Leadership
Research has consistently highlighted the role of principal instructional leadership in the
implementation of instructional reforms and in achieving desired student outcomes (Robinson,
Lloyd, and Rowe, 2008; Leithwood, et al., 2004; Hallinger & Heck, 1998; Purkey & Smith, 1983;
Berman & McLaughlin, 1978). Various conceptualizations for instructional leadership have been
proposed (Marks & Printy, 2003; Elmore, 2000; Hallinger, & Heck, 1998; Murphy, 1990).
However, defining a school-wide vision and creating a school-wide focus on instruction have
been shown to be two essential functions for school leadership (Supovitz, Sirinides, & May,
2010; Rosenholtz, 1985).
School-wide Instructional Vision
Hallinger and Heck’s (1998) meta-analysis of the associations between principal
leadership and student achievement finds that the principal’s work in setting, communicating, and
sustaining the school’s mission and goals has the most consistent influence on student outcomes.
They describe this area of the principal’s work as influencing the faculty’s academic expectations
for students and influencing the school’s mission and vision; they find that this work has an
indirect effect on school outcomes. Some have conceptualized school mission as part of the

7
school’s instructional climate. For example, Hallinger, Bickman, and Davis (1996) find that
stronger instructional leadership is associated with clearer school mission, and this in turn
influences teachers’ expectations and students’ academic success. Heck, Larsen, & Marcoulides
(1990) include measures of the principal’s work to articulate goals and expectations as part of
school climate, and they find associations with student achievement at both elementary- and
secondary-school levels. Case studies have also shown that in schools with clearer academic
vision and goals, teachers are able to describe specific ways in which school-wide instructional
expectations shape their day-to-day instructional practice (Elmore, 2000, Abelmann & Elmore,
1999). These case studies, while not numerous, are in line with a long history of research that has
found associations between clear goals and improved instruction. For instance, Rosenholtz (1989;
1985) found that teachers’ greater sense of certainty about the goals for classroom instruction led
to greater teacher learning and improved instructional skills.
Several pathways have been proposed through which |the school’s educational mission
may influence school outcomes. First, as noted above, a clear mission can shape teachers’
academic expectations. Second, a well-defined vision provides direction for teacher’s
improvement efforts, allows principals to measure implementation of instructional reforms
(Supovitz & Poglinco, 2001; Rosenholtz, 1985), and can serve as a foundation for discussion
about the school’s instructional program (Supovitz & Poglinco, 2001). Further, in their review of
social psychology research, Robinson, Lloyd, and Rowe (2008) find that goals allow individuals
to prioritize when “a multitude of tasks can seem equally important and overwhelming” (pg. 661).
From this perspective, vision may help teachers see reforms as a purposeful set of changes instead
of a confusing set of unconnected tasks.
Finally, sense-making theory suggests that school-wide vision influences the way that
organizational members understand the facts of their work by giving them a vision for what the
end results could be. This perspective holds that an effective leader, more than simply
prioritizing tasks, allows the organization members to envision the completed task as it may be in

8
the future, giving them “a different sense of the meaning of that which they do” (Thayer, 1988,
pg. 250, emphasis the author’s). In this regard, as teachers seek to make sense of standards-based
instructional ideas, principals can play a key role. When standards-based reforms do not seem to
fit teachers’ prior understanding of instruction, principals can provide a new frame for
interpretation. In their role of setting the school’s instructional vision, they may help teachers
focus on the goals of reform, rather than simply returning to familiar patterns of procedurally-
based math instruction.
This perspective on leadership suggests that the ways in which the principal understands
the goals of standards-based instruction is critical. Qualitative case studies have provided
examples of how a principal’s understanding of reform may influence teachers’ perception of
reform goals. In her study of standards-based reform of reading instruction, Coburn (2005) finds
that the depth of school leaders’ understanding of an instructional reform influences the ways that
the leaders communicate the policy to their faculties and, in turn, influences their faculties’
understanding. One principal described the new curriculum in terms of superficial changes to
previous instructional practices. Coburn finds that this “created strong boundaries within which
teachers’ sense-making unfolded,” and limited the progress of standards-based reform (pg. 494).
Another principal repeatedly focused teachers’ attention on the new instructional standards and
portrayed the textbook as only one of many tools available for teachers’ use. Teachers in this
school began to collaboratively develop strategies to implement the standards rather than solely
follow the textbook. School leaders’ descriptions of the goals of the instructional changes
influenced teachers’ implementation of the reforms.
Recently research has emphasized that, as important school-wide goals are, their
existence is not enough. The content of the goals is also critical (Goldring, et al., 2007). As
Leithwood and Jantzi (2006) note, “the potency of leadership for increasing student learning
hinges on the specific classroom practices that leaders stimulate, encourage and promote” (pg.
223). Given the influence exerted by the content of instructional goals, it is important to note that

9
little research has addressed the principal’s role in leading instructional changes of the depth and
complexity required for standards-based instructional reforms (Coburn, 2005; Cohen & Barnes,
1993). Earlier reforms encouraged teachers to modify instructional plans as they felt best
(Rosenholtz, 1985), and reforms often focused on students achieving academic success in
acquiring basic skills (Leithwood & Montgomery, 1982). As discussed below, recent qualitative
and quantitative research has begun to address this gap by investigating how school leaders
support challenging, standards-based instructional reforms, and the current analysis adds to that
work.
Focus on Instruction
In addition to articulating a clear vision for the school, research suggests that effective
instructional leaders focus attention on instruction, creating an academic press to ensure each
student’s educational experiences are aligned with the school’s vision. Academic press has been
described as the expectations that teachers hold, both individually and collectively, for the
academic achievement of the school’s students (Lee & Smith, 1999). Principals can impact these
expectations (Hallinger, Bickman, & Davis, 1996; Purkey & Smith, 1983), and their impact on
teacher expectations is intertwined with their articulation of the school mission (Leithwood et al.,
2004; Brookover, et al., 1979). However, principals’ focus on instruction goes beyond defining
the mission. Fink and Resnick (2001) describe the pattern of principals’ instructional leadership
in one elementary school district over a period of more than ten years when the district posted
improvements in both math and reading. In this district, New York’s Community School District
2, principals frequently visited classrooms to monitor instruction, organized professional
development, and supported the development of a professional culture in which teachers learned
from each other. Principals’ work was assessed by the quality of students’ work, the degree to
which students could talk about their learning, and the quality of teachers’ instruction. The
principals in this district – who were credited as part of the reason for the district’s improved

10
performance – were expected to listen to classroom discussions, monitor the level of teachers’
questioning strategies, and support teachers as they pressed students to think more deeply.
Principals’ focus was on instruction, and their schools showed improvements in student learning.
The expectation that principals support the instructional capacity of teachers has a long
history (Cuban, 1988). In their review of research on effective elementary school principals,
Leithwood and Montgomery (1982) found that while all principals tend to be interested in
teachers’ overall instructional objectives, only effective principals work with teachers to prioritize
among instructional objectives and concern themselves with teachers’ instructional strategies;
such principals view their own work as ensuring that the school provides students with the best
possible instructional program. Similarly, in Anderson’s (1982) review of research, principal
involvement in instruction was found to be characteristic of exemplary schools.
More recently, the meta-analysis by Robinson, Lloyd and Rowe (2008) finds that when
“leaders work directly with teachers to plan, coordinate, and evaluate teachers and teaching,”
student outcomes are significantly higher (pg. 663). Effective instructional leaders tend to discuss
instructional strategies with teachers, provide evaluations that help teachers improve their
practice, encourage the use of different instructional strategies, and observe classroom instruction
frequently (Bamburg & Andrews, 1991). They arrange their schedules to allow themselves time
to focus on instructional matters; when they visit classrooms, they focus on student work and
student explanations to ascertain students’ level of understanding; and they build systems for
teacher accountability (Supovitz & Poglinco, 2001).
Principal Leadership for Standards-based Instruction
While prior research has shown that the principal’s work to articulate an instructional
vision and involve himself/herself in instruction has been associated with positive student
outcomes, the goals of standards-based reforms may place different requirements on leaders than
conventional types of instruction (Nelson & Sassi, 2000; Cohen & Barnes, 1993). Recent research

11
suggests that principals need an in-depth understanding of standards-based instructional practices
themselves before they can adequately support the development of these practices in their
teachers. For instance, an understanding of instruction is necessary because school leaders
influence the ways that teachers talk about the goals of district-level instructional reform, and the
degree to which the conversations are aligned with intended reform goals (Coburn & Russell,
2008). Furthermore, Nelson and Sassi (2000, 2005) find that principals with primarily procedural
knowledge about mathematics are constrained in their work with the mathematics program of
their school, whereas those with conceptual understanding of mathematics are better able to set
high expectations for instructional practice, to listen to students’ mathematical thinking when
they observe classroom instruction, and to facilitate teachers’ improved practice through feedback
to teachers about instruction. Principals with greater understanding of instructional reforms can
press teachers to “make students reach just a little further than their current understanding”
(Nelson & Sassi, 2005, pg. 172).
Similarly, Stein & Nelson (2003) maintain that when principals set high expectations for
reform instruction, support their staff in developing reform instructional practice, and monitor
implementation, they can influence instructional practices across their schools. They hold that
principals need to challenge teachers to allow students to explore mathematical concepts. For
instance, they describe the expectation that one principal set for teachers to move beyond
superficial use of manipulatives toward instructional practice that supports students’ construction
of greater mathematical conceptual understanding. Stein and Nelson (2003) suggest that
principals’ role as teacher evaluators gives them opportunities to press for instructional reform.
Again, these researchers posit that where principals understand reform pedagogy thoroughly
themselves, they can effectively support teachers’ instructional growth.
Recent quantitative studies also suggest that principal instructional leadership can change
teacher practices – in ways similar to those sought in standards-based instruction. For example,
Supovitz, Sirinides, and May (2010) measure change in teachers’ instructional practice with a

12
four-item survey scale, with items asking teachers to report changes in teaching methods,
assigned student work, kinds of questions asked, and understanding of student needs (Cronbach’s
alpha = .94). Using survey data from over 700 teachers in grades two through eight, they find that
principals’ emphasis on mission and goals, emphasis on community and trust, and focus on
instruction is associated with change in teachers’ pedagogy in mathematics (p < .01). In a study
using observational data to investigate teachers’ instructional practices, Quinn (2002) also finds
that teacher-reported instructional leadership by the principal is associated with teachers’
instructional practices.
These studies suggest that principals may influence teachers’ use of standards-based
instructional practices through the instructional vision that they articulate, their expectations for
specific forms of instructional practice, and their focus on instruction. The studies also suggest
that principals’ own understanding of instructional reform influences the vision and expectations
that they articulate. Policy implementation research has investigated how principals come to
understand their leadership practice in the context of challenging instructional reforms.
School Leaders’ Sense-Making about Standard-based Instructional Reform
While research on cognition and policy implementation in education has tended to focus
on teachers’ construction of understanding about policy (Haug, 1999; Hill, 2001), school leaders
must make sense out of instructional reform policies as well (Coburn 2005). Principals need to
construct not only an understanding of the goals of standards-based mathematics reforms, but also
construct a perspective on how their own practice may need to change in the context of those
reforms (Spillane 2000b; Spillane, Reiser, & Reimer, 2002; Coburn, 2005). This is a challenging
process due in part to the amount of learning that is required for implementation of standards-
based reform policies – in contrast with some earlier, more procedural, instructional reforms
(Cohen & Barnes, 1993; Sherin, 2002).

13
Prior knowledge (e.g., expertise and experience) is held to be an important factor in the
understanding that a practitioner constructs from policy; furthermore, the constructed
understanding will tend to resemble practices with which the practitioner is already familiar
(Spillane, Reiser, & Reimer, 2002).
While this analysis does not investigate the principal’s sense-making process directly, it
holds that the goals the principal articulates for instruction are influenced by they way that the
principal interprets mathematics reform and the way the principal interprets his/her own practice
in the context of that reform. This involves much more than simply a translation of district
policies into school-based expectations, or even an interpretation of the policy; rather, this
perspective holds that the principal begins by selecting the facts from the school context and the
district policy that appear most relevant to the needs in the school’s mathematics program
(Spillane, et al., 2007; Weick, 1995; Spillane, Reiser, & Reimer, 2002). The “problems” and the
“solutions” of the situation are not pre-determined, as Schön (1983) wrote,
In real-world practice ... we select what we will treat as the ‘things’ of the situation, we
set the boundaries of our attention to it, and we impose upon it a coherence which allows
us to say what is wrong and in what directions the situation needs to be changed …
interactively, we name the things to which we will attend and frame the context in which
we will attend to them” (pg 40, emphasis the author’s).
Within the context of their regular work – tasks such as observing segments of classroom
instruction, obtaining resources, coordinating with the school leadership team, and organizing
professional development opportunities for the staff, principals select information on which to
focus and construct an understanding of that information. For instance, while engaged in these
tasks, the principal may choose to focus upon supporting the clarity of teacher explanations (and
support a more conventional view of mathematics instruction), or the principal may focus upon
the nature of student conversation in groups (and support a more standards-based view of
mathematics instruction). Often the interpretation that the principal constructs will be influenced
14
by the ways that the principal is used to understanding mathematics instruction, and familiar ideas
color how new policies are understood (Coburn, 2005; Spillane, Reiser, & Reimer, 2002).
Throughout this process, school leaders must make links between content-specific
instructional policy and their own administrative practice (Nelson, 1999; Coburn, 2005).
Instructional policy tailored to teachers is insufficient to guide leaders’ work. Principals’ focus
and understanding can be expected to differ from that of teachers, as they seek to support
standards-based instructional reforms, since teachers need to attend to how students’
mathematical thinking develops over the course of a semester, typical student misconceptions,
and students’ explanations of concepts (Nelson, 1999). School leaders must not only attend to
individual students’ thinking at the classroom level, but they must also focus on a broader level
that includes the professional work and growth of faculty, as well as the learning of students
across the school. The current analysis develops a rubric for instructional expectations that is
specific to administrators’ practice, investigating the levels of instructional expectations that
principals articulate.
The sense-making perspective highlights the need to investigate instructional leadership
in the context of standards-based mathematics reform, by explaining why the administrative
practice of principals who are implementing district standards-based instructional reform may
differ from conventional administrative practice. As Spillane, Reiser, and Reimer (2002)
maintain, the sense that implementing agents make of their own practice is shaped in part by the
policy they are implementing. A leader’s practice is constructed through the interaction of the
individual’s abilities and understanding, the people s/he is leading, and the situation in which s/he
works (Spillane, Halverson, & Diamond, 2004). The situation forms an integral part of the ways
that leaders understand the requirements and possibilities of their work: “aspects of the situation
enable or constrain leadership activity, while that activity can also transform aspects of the
situation over time… situation is both constitutive of and constituted in leadership activity
(Spillane, Halverson, & Diamond, 2004, pg. 21).
15
School leaders’ understanding of standards-based instructional policy has also been
conceptualized in terms of practical judgment theory (Nelson & Sassi, 2000; 2005). This
perspective also highlights the importance of what a principal selects to focus on, the subsequent
interpretations that the principal constructs, and the influence of the principal’s own
understanding of high quality instruction. Nelson and Sassi (2000) use a framework based in
practical judgment to explain findings from a year-long professional development seminar on
supervision of mathematics instruction, primarily for elementary school principals. They find
that classroom observation experiences present administrators with “complex situations in which
incommensurate criteria need to be balanced, the relevant facts are not necessarily evident, or no
one option jumps out as the best one” (pg. 558). These researchers observe that one administrator
would watch for whether the teacher asks questions of students in all areas of the classroom, a
more behavioral measure of instruction, while another noticed the content of the questions that
the teacher asks and listened for evidence of students’ conceptual understanding of mathematics
(pg. 558). The administrators’ understanding of high quality instruction strongly influenced
which facts they attended to when observing instruction, and what assessments they made. For
instance, early in the professional development seminar, administrators watch a video of a
standards-based lesson and evaluate the teacher’s instructional practice as “scattered.” However,
eight months later, when these administrators have gained more understanding of the goals of
standards-based instruction, they evaluate the same lesson as “strong.” Once the administrators’
instructional vision has developed, the ways that they listen to classroom instruction has changed,
and their understanding of they types of teacher practice that they want to support is different
(Nelson & Sassi, 2000).
The sense-making perspective and the practical judgment perspective both describe a
complex process in which the details that an administrator selects for notice will influence his/her
assessment of instructional practice. Together, they point to the importance of the policy context

16
in which the principal works, the potential influence of what is familiar to the principal, and the
importance of the principal’s understanding of high quality mathematics instruction.
Research Questions
Quantitative and qualitative evidence have shown that the principal can support improved
teacher instructional practice. However, factors that enable principal support for instructional
change need further exploration (Spillane, Halverson, & Diamond, 2004; Goldring, et al., 2006;
Burch, 2007). This study examines how what principals know and what they do influences the
expectations that teachers report for what counts as high quality instruction in their schools.
Investigating patterns of leadership in districts that are implementing standards-based
mathematics instruction, the study asks the following:
o When principals are more involved in instruction, to what extent do their teachers
perceive instructional expectations that are aligned with goals of standards-based
mathematics instruction?
Is the strength of this relationship enhanced when principals have more
developed visions of high quality mathematics instruction?

17
CHAPTER II
THEORETICAL FRAMEWORK
This study investigates what principals need to know and do in order to effectively
articulate expectations for specific instructional practices in support of district-level standards-
based reforms. The study analyzes the relationships between task-oriented and cognitive
dimensions of instructional leadership (Barnes, et al., 2010; Spillane, Halverson, & Diamond,
2004). One dimension concerns the means that principals used to involve themselves in the
school’s instructional program. This dimension consists of the tasks that principals complete in
order to articulate a vision for mathematics instruction, set subject-specific instructional
expectations, and monitor mathematics teachers’ progress toward that vision.1 A second
dimension involves the content of principals’ own vision of instruction. Since framing a vision
and setting goals for instruction is a key function of instructional leadership, principals’ own
understanding of those goals forms a critical dimension of their leadership. In fact, Spillane and
Thompson (1997) consider leaders’ understanding of reform ideas to be part of local capacity for
instructional improvement. The third dimension is the degree to which principals’ instructional
expectations, as reported by teachers, are aligned with the goals of standards-based instruction.
This dimension entails not the activities through which principals set expectations for instruction,
but the nature of the expectations. It involves principals’ construction of specific expectations for
the everyday classroom practices of mathematics teachers, in the context of their administrative
1 In policy research literature, several terms have been used to refer to what the principal
does. Camburn, Rowan, and Taylor (2003) wrote about the “functional tasks” that principals need to complete; Spillane, Halverson, and Diamond (2001) discussed leadership functions, both large-scale (i.e., macro), and fine-grained (i.e., micro); and others have referred to the activities that principals complete and/or to principal behavior (Supovitz, Sirinides, & May, 2010; Barnes, et al., 2010). This analysis primarily refers to broader “functional tasks” and to more fine-grained “activities.”

18
practice (Nelson, 1999). As is further explained below, I expected the degree of principals’
involvement in instruction to influence teachers’ perceptions of instructional expectations, and I
expected the depth of principals’ vision for instruction to moderate the relationship.
The theoretical framework conceptualizes instructional leadership as one of the school-
related factors that, either directly or indirectly, influences student learning (see Figure 1). Other
factors are also diagrammed, though by no means an exhaustive listing. Teacher experience and
teacher learning opportunities may influence instruction, and thereby influence student learning,
as shown at the right side of the framework. The principal’s extant knowledge of mathematics
and mathematics pedagogy, and the principal’s extant experience, knowledge, and skill in
leadership may influence instructional leadership, as shown at the left side. However, this
analysis focuses on the relationships between the dimensions of instructional leadership. Turning
now to those three dimensions, I discuss how each is conceptualized, and specifically how I
expected them to influence each other and lead to more effective principal instructional
leadership of standards-based instruction.

19
20
Principal Involvement in Instruction
When principals involve themselves directly in the school’s instruction, teachers’
classroom practices and student learning have been found to improve (Supovitz, Sirinides, &
May, 2010; Fink & Resnick, 2001; Nelson & Sassi, 2006; Hallinger, Bickman, & Davis, 1996).
This study conceptualizes principal involvement as the functional tasks through which the
principal may increase the academic press in the school, building the expectations for student
learning and ensuring that all staff strive to meet those expectations. Tasks may include
articulation of goals specific to mathematics instruction, pressing mathematics teachers to
implement the district’s instructional program, providing teachers with opportunities for
professional development, and attending closely to the nature of instruction taking place in
mathematics classrooms, among others (Nelson & Sassi, 2000, 2005; Stein & Nelson, 2003; Fink
& Resnick, 2001). To measure the principal’s involvement in the school’s mathematics program,
I use a survey-based scale of eight items, similar to measures used to assess instructional
leadership in prior research (CPRE Study of School Leadership, 2005; Knapp, et al., 2003;
Goldring & Cravens, 2006). The scale was originally developed for use by the Consortium on
Chicago School Research (CCSR), and documentation from that work describes the survey items
as asking teachers “about their principal’s leadership with respect to standards for teaching and
learning, communicating a clear vision for the school, and tracking academic progress”; the
documentation further states that high scores mean that “teachers view their principal as very
involved in classroom instruction, thereby able to create and sustain meaningful school
improvement” (CCSR, 2006, pg. 47, emphasis added). The survey items measure broad tasks,
without specifying fine-grained day-to-day activities.
However, the goal of the current study differs from the earlier research on instructional
leadership, and the validity of the scale needs to be re-examined. Here, the goal is the
measurement of subject-specific instructional leadership, and this analysis uses a revised, content-
specific version of the survey scale. Seven of the eight items have been revised to be math-

21
specific, and the revised scale is intended for use only with middle school mathematics teachers.
Therefore, the validity of the math-specific version requires investigation. This is necessary
because validity is established for the use of a particular set of items with a particular population
and cannot be established in isolation from the context in which the scale is to be used (AERA,
APA, & NCME, 1999; Kane, 2001). The scale may function differently in math-specific uses
because standards-based mathematics reform has proven especially challenging, as noted above.
Furthermore, patterns of principal involvement in instruction have been shown to differ for
implementation of standards-based mathematics reform, compared with reform in other subject
areas (Stein & D’Amico, 2000.
This analysis uses Item Response Theory (IRT)2 to examine the validity and reliability of
the involvement scale as a measure of principal leadership for standards-based mathematics
instruction. IRT assumes that assent to some items indicates a higher level of the construct than
assent to others, and the analysis process provides evidence about the internal structure of the
scale, (i.e., the nature of each level of the construct). As the first step in the analysis process,
theory is developed about the internal structure (Kane, 2001; DeVellis, 2003). This includes a
hypothesis about what constitutes each level of the construct and a prediction about which level
each item most optimally measures. The proposed theory about the structure of the principal
involvement construct is based on previous theoretical and empirical research on principal
leadership that conceptualizes the involvement construct as articulation of instructional vision and
monitoring of progress (Rosenholtz, 1985; Stein & Nelson, 2003; Fink & Resnick, 2001). Setting
a clear vision is theorized to be a precursor to monitoring because, as Supovitz and Poglinco
(2003) explain, “a concrete vision of instructional quality provides … teachers with an
instructional portrait they can work toward, and provides a picture that administrators can
measure implementation against” (pg. 4). Once principals have articulated an instructional
vision, then they have a standard to which they can refer when monitoring and providing 2 For a comparison of IRT and Classical Test Theory (CTT), see Hambleton & Jones (n.d.)

22
feedback. Results from previous IRT analysis of the scale (CCSR, 2006) were reviewed to assess
the degree to which they were aligned with this two-level structure. Those previous results, based
on data about leadership across multiple subject areas, were viewed through the lens of a two-
level structure for involvement. This showed survey items that appear to measure the setting of
instructional standards are ranked lower (i.e., less “difficult” and more frequently occurring3), and
items that appear to measure monitoring are ranked higher (i.e., more “difficult” and less
frequently occurring). This suggests that principals in the earlier study engaged in articulation of
standards more frequently than they monitored instruction, and that they tended to monitor
progress toward instructional standards only when they had already articulated goals for
instructional practice4. However, while the CCSR results supported the two-level structure
proposed here, they are based on a large study that measured principal leadership for many
content areas.
The current analysis examines whether the revised version of the scale functions
similarly. To evaluate the validity of the scale for math-specific contexts, empirical results are
compared with the hypothesized results. The empirical results provide a hierarchical ranking of
items on an interval scale – from those to which teachers assent most frequently and strongly, to
those that they endorse least frequently and least strongly. This hierarchical ranking makes it
3 IRT results provide the “difficulty” of each item, and this is the location of the estimated item parameter on an interval scale. It is an indication of how frequently teachers endorse, or assent to, the item. For polytomous data, each category will have a difficulty parameter (i.e., location on the scale). However, the meaning of the term frequency as used in IRT differs from the meaning in CTT. The IRT frequency is estimated based on comparison of person and item locations, using a probability structure. The CTT frequency can be expected to be similar to the IRT frequency, especially in a Rasch model (which has no item discrimination term), but it is derived differently.
4 The IRT multi-level rating scale model is a Rasch model (or, a one-parameter logistic model). When a Rasch model has a good fit to the data, items ranked high in the results not only occur less often, but they also only tend to occur only when the items ranked lower in the hierarchical ordering have also occurred.

23
possible to compare the hypothesized functioning of the involvement construct with the observed
results.5 Validity is supported if the internal structure is found to be as expected.
I hypothesized that communication of instructional vision serves as a basis for
monitoring, and monitoring means looking for evidence that the instructional vision was being
implemented. However, an alternate pattern is possible. Because research has shown that
understanding standards-based math initiatives poses large challenges for principals (Nelson,
1999; Nelson & Sassi, 2000; Coburn, 2005), principals may feel ill-equipped to articulate
expectations aligned with new district-wide standards (Stein & D’Amico, 2000). They may be
more familiar with monitoring instruction and tracking student progress (Rosenholtz, 1985;
Leithwood & Montgomery, 1982), and they may interpret and enact the new policy in ways that
are familiar to them (Spillane, Reiser, & Reimer, 2002). In this alternate case, instructional
leaders who seek to implement challenging instructional reforms in mathematics would begin by
monitoring instruction in their schools, and the hierarchical ordering of items would show
monitoring activities near the bottom of the ranking (i.e., precursors to articulation of
instructional expectations). I examined whether the data fit this alternate conception of the
construct.
5 The hierarchical ordering of items in IRT results can be used to confirm a theoretical understanding about a construct. Bryk, Camburn, & Louis (1999) examined results from Rasch rating-scale analyses for six survey measures of the components of professional community. They found that for each of the six measures, estimates of item locations “appear to follow a theoretically consistent hierarchical ordering” (pg. 761). Printy (2002) used of the hierarchical ordering of items in survey scales that measure school-level organizational characteristics to support her hypothesis about communities of practice. As she explained, “the logit, or item difficulty, is one of a number of statistics that the model provides with which to evaluate a construct's validity and reliability. Rasch scales assign the largest ‘difficulty’ scores to items respondents have the most trouble agreeing with. These items are understood to be ‘rare.’ Items with the lowest difficulty are easier to agree with, and thus, are ‘frequent.’ Examining the logit ranking of items in the scale, an analyst must agree that the hierarchical ranking of the items makes theoretical sense. For instance, the hierarchical ordering of the items used in the communities of practice Rasch scale theoretically supports my hypothesis that teachers have greater opportunities to learn when they participate in purposeful activities out of the subject department and interact with a wide range of school members” (pg. 81).
24
IRT results also provide evidence about whether the scale effectively measures all
observed levels of the involvement construct. The type of IRT model used in this analysis (i.e.,
one of the Rasch family of models) places results for items and teachers on the same interval
scale. This allows comparison of the range of involvement levels reported by teachers with the
range of levels optimally measured by scale items. Also, a measure of the precision of the scale at
each level is provided (i.e., the information function for the amount of information provided by
the scale at each level of the construct).
The principal involvement scale measures the degree to which principals set instructional
goals and monitored instructional progress, but it does not measure the content of the goals or the
focus of the monitoring. In the four districts in this study, principal involvement is intended to
result in implementation of the functions of standards-based reform – to build school capacity to
support students’ conceptual understanding of mathematics and their ability to debate the
effectiveness of mathematical strategies. Principals’ own vision of mathematics instruction is
likely to influence the ways in which they enact leadership activities, and the degree to which
they provide support for function-oriented implementation of the district mathematics initiative
(Nelson & Sassi, 2000; Spillane, 2000b; Coburn, 2005). The second dimension of instructional
leadership examines this.
Principal Vision for Math Instruction
In order to lead a district instructional reform initiative, principals must construct a new
understanding of their leadership practice through the sense-making process described above
(Spillane, Reiser, & Reimer, 2002). For instance, principals need to reconsider the nature of the
goals that they set for mathematics instruction and the assessments that they make when
monitoring teachers’ instruction. It is not only the existence of instructional goals, but also the
content of the goals that matters (Leithwood & Jantzi, 2006). Similarly, as described above, it is
not only the existence of monitoring activities, but principals’ focus while monitoring that matters

25
(Nelson & Sassi, 2000). Principals’ subject-specific vision is likely to inform the content of the
goals that they set and the assessments they make when monitoring teachers’ instruction.
Research suggests that the principal’s own vision of high quality instructional practice
has multiple influences on teachers’ practice (Coburn, 2005; Coburn & Russell, 2008; Nelson &
Sassi, 2000, 2005; Stein & Nelson, 2003). Here, the importance of subject-specific vision is
conceptualized as two-fold: The principal’s vision both provides capacity for, and sets
constraints upon, the principal’s implementation of standards-based instructional reform policy.
The principal’s own vision of instruction is part of school capacity; when the principal has a well-
developed, subject-specific vision of the goals of standards-based instructional reform, s/he is
likely to be better able to press the school toward those goals (Coburn, 2005, Spillane and
Thompson, 1997; Nelson & Sassi, 2000). However, when administrator understanding of reform
is lacking, or focused only on the forms of standards-based practices, the administrator’s ability to
press for instructional reform is likely to be hindered (Nelson & Sassi, 2000; Stein & D’Amico,
2000; Cobb, et al., 2003). Vision gives administrators’ a lens for selecting relevant information
and constructing a day-to-day practice that effectively supports district instructional policy
(Nelson, 1998).
As Nelson and Sassi (2005) write, it is not yet clear exactly what depth of vision
principals need, or which elements of standards-based instruction they need to understand most
clearly, to function as effective instructional leaders in support of instructional reform. This study
investigates the effect of principal vision of standards-based instruction in mathematics. It
measures principal vision about three elements of instruction: the types of tasks that have the
most potential to support students’ learning (Stein, Grover, & Henningsen, 1996; Boston & Wolf,
2006), the forms of classroom discussion that support students’ development of greater
conceptual understanding, and the teacher’s role in the instructional process (Hufferd-Ackles,
Fuson, & Sherin, 2004; Hill, 2001). Academic task is a critical part of classroom instruction
(Doyle, 1983). In mathematics, students need to engage in tasks that allow them to think through
26
mathematical concepts and reason about mathematical ideas (Spillane & Zeuli, 1999; Boston &
Wolf, 2006). Research has suggested that principals can influence teachers’ choice and use of
mathematical tasks (Nelson & Sassi, 2005; Stein & Nelson, 2003). The second element,
classroom discourse, potentially influences the ways in which a mathematical task is enacted by
teacher and students (Kazemi & Stipek, 2001). A mathematical task may have potential to
support students’ development of conceptual understanding, but realization of that potential often
happens during classroom discussion as students compare and refine their mathematical
conjectures. For instance, teachers may hold more classroom discussions and ask students more
questions, but there may still be “a very definite sense in which the answer was the chief
orienting force for these interactions”; in these cases, teachers are not “pressing students to
explain their ideas, asking questions that pressed students to defend their explanations, and
nurturing student-student discourse” (Spillane & Zeuli, 1999, pg. 20). The third element, the role
of the teacher, describes the teacher’s responsibilities in mathematics instruction (Hiebert et al.,
1997). As principals pay attention to the teacher’s instructional choices during a math lesson
(Nelson & Sassi, 2006), they consider whether teachers focus on delivering accurate content,
explaining procedures clearly, encouraging student collaboration and discussion, and/or building
norms for students to question each others’ mathematical strategies.
When a principal has a greater depth of vision for one or more of these elements, I
expected this to be an enabling condition, making principal involvement more effective and
resulting in more developed, standards-based instructional expectations for teachers’ classroom
practice. Furthermore, these elements are seen as part of a system (Munter, 2009b; Hiebert et al.,
1997), and I expected that a principal who had a vision that encompassed all elements would have
the strongest instructional leadership practice. A principal with a more developed vision for
standards-based mathematics instruction would be more able to frame instructional expectations
for the mathematics teachers at their schools.
27
Principal Expectations for Standards-based Instructional Practice
The first measure of instructional leadership, the involvement scale, includes survey
items that measure the degree to which principals set instructional expectations, but as noted
above, it does not measure the content of those expectations. High scale scores could indicate
that a principal sets standards-based expectations for mathematics instruction; however, they
could also reflect more general expectations for students to perform well on high-stakes
accountability tests, or expectations for diligent use of conventional instructional practices. The
third measure of instructional leadership, derived from teacher interview data, assesses the
content of the instructional expectations that mathematics teachers perceive from their principals.
I expect that principals, as instructional leaders, select relevant information from classroom
observations and other data about the school’s instructional program, drawing conclusions about
how well the school was implementing the district’s instructional reforms, and articulating
expectations for the specifics of the district’s instructional reforms in mathematics.
I did not expect that the expectations that principals articulate would mirror the
principal’s vision of the district’s instructional policy, for several reasons. First, in the sense-
making process administrators construct not only an understanding of the district’s instructional
policy, but also “an interpretation of their own practice in light of the message, and …
conclusions about potential changes in their practice as a result” (Spillane, Reiser, & Reimer,
2002, pg. 392). Administrators not only build an understanding of the goals of the district’s
instructional reforms, but they also come to an understanding about how their day-to-day
practices aligns with those goals. This means that they have to consider the steps necessary to
lead their school toward greater instructional quality, and how they can facilitate those steps. A
well-developed vision of the goal (i.e., standards-based instruction) is not necessarily sufficient to
provide them with the steps to reach that goal. Second, expectations articulated to faculty may
differ from principals’ espoused vision for instruction. Principals’ day-to-day expectations for
standards-based instruction may differ from what they understand to be the ideal model of
28
standards-based instructional practice in mathematics. This is to say that principals’ intended
theories of action may not completely align with the ‘theories in use” that describe their actual
actions (City, et al., 2009, pg. 40). Because principals must balance many priorities, they may feel
pressure day-to-day to focus on other reform initiatives (Stein & D’Amico, 2000), and their
expectations for instructional practice may be different than they if other pressures were not
present. This study investigated the content of principals’ expectations as perceived by teachers –
the individuals who must carry those expectations out.
Analysis Plan
Having measured three dimensions of instructional leadership, I next investigate the
associations among the three dimensions in a standards-based setting, testing two hypotheses.
First, as principals involve themselves to a greater extent in the instructional program of their
schools, I expected an increase in the likelihood that teachers perceived instructional expectations
in line with the goals of standards-based reform. Principals may involve themselves in instruction
through tasks such as articulating standards for teaching and learning, monitoring the progress of
teaching and learning in mathematics, or pressing mathematics teachers to use innovations
learned in professional development. I expect the involvement scale to measure the kinds of tasks
that principals need to complete in order to facilitate teachers’ perceptions of expectations for
standards-based instruction (Supovitz, Sirinides, & May, 2010; Rosenholtz, 1985; Hallinger and
Heck, 1998). I predicted that higher scores on the involvement scale would be associated with
teachers’ reports of more developed expectations for standards-based instruction.
Hypothesis 1: Where the principal has greater involvement in instruction, teacher perception of
expectations for standards-based instruction will be greater.
I also expected that principals needed a well-developed vision of standards-based practice
in order to orient the involvement tasks with a focus on standards-based instruction. As Newmann

29
and Wehlage (1995) write, though instructional vision is not sufficient for school reform, it is “a
necessary guide” (pg. 4). When the principal holds a clear vision of the instructional practices
s/he wants to see, this allows the principal to construct an administrative practice through which
teachers perceived expectations for standards-based instructional practices. Following Supovitz
and Poglinco (2001) who find that principal vision setting is useful, and focus on instruction is
good, but the combination of the two has an “exponential value” (pg. 3), I predicted that when
principals have a more developed vision of standards-based instruction, greater involvement in
instruction would be more strongly associated with teachers’ reports of specific expectations for
standards-based instruction.
Hypothesis 2: The relationship between principal involvement in instruction and expectations for
standards-based instruction will be stronger when the principal holds a more developed vision.
This study investigates leadership by school-level administrative teams. It does not
distinguish between the influence of the principal and that of assistant principals. This is in
accordance with a distributed perspective on leadership (Spillane, Halverson, & Diamond, 2004).
Survey data comes from questions that ask teachers to describe leadership by the principal and/or
assistant principal, and teacher interview questions allow the teacher to describe instructional
expectations held by either. Similarly, to develop the principal vision scores, assistant principal
interviews are used as well as principal interviews, wherever an assistant principal had
responsibility for the mathematics department. A focus on the principal as an individual, without
regard to others who exercise leadership in the school, has sometimes been called a shortcoming
in instructional leadership literature (Copland, 2003; Murphy, 1988). Investigating leadership by
both principals and assistant principals acknowledges that leadership is “stretched over” a number
of people (Spillane, Halverson, & Diamond, 2001; 2004). Some have suggested that the
principal’s work is especially critical due to his/her role as evaluator of school staff (Stein &

30
Nelson, 2003), but this argument about the importance of evaluators applies to all administrators
who evaluate teachers (e.g. all assistant principals interviewed for this study).
31
CHAPTER III
DATA & METHOD
Data
Data come from the Middle School Mathematics and the Institutional Setting of Teaching
(MIST) project, funded by the National Science Foundation (Co-Principal Investigators: Paul
Cobb and Thomas Smith). This project is a four-year longitudinal study in four urban school
districts. Six to ten schools were selected in collaboration with district leaders to be representative
of the middle schools in each district. Principals of selected schools were invited to participate,
and if principals agreed, teachers were recruited at the start of the first school year during school-
site visits. A small number of assistant principals were invited to participate if their
responsibilities included oversight of the mathematics department. To select teachers, names of
all math teachers at a school site were listed in random order. Then, teachers were asked to
participate in that order, and up to five teachers at each school were recruited. In the second year,
the same teachers were invited to continue participating in the study during visits to the school
sites. Wherever some participating teachers had left the school, current teachers’ names were
placed in random order, and teachers were invited to join the study in that order, until a total of
five participating teachers was again obtained, or until all teachers in the school were invited.
About 120 mathematics teachers in 30 schools participated in total, each year.
All four districts were selected because they had adopted standards-based instructional
reforms in middle school mathematics. Three of the districts had adopted a nationally known
curriculum that was well aligned with the NCTM (2000) Standards. The MIST research project
collected data at several levels within the participating districts in order to assess the influence of
institutional supports on the implementation of standards-based instructional reforms in
mathematics (Cobb & Smith, 2008). The interviews with district leaders provide information

32
about the district goals for instruction and indicate that all districts were seeking to implement
standards-based instructional reform in middle school mathematics. The following descriptions
of each district are taken from interviews with district leaders in the second year of the MIST
project’s data collection.
In the Lakewood District, leaders held a variety of opinions about what the district
needed to do to better serve its students, but the district as a whole continued to press for the
standards-based instructional practice through use of the Connected Mathematics curriculum in
all its middle schools. An assistant director of the Curriculum and Instruction Department
described her understanding of high quality instruction (i.e., the district’s goals for instruction) as
follows: group work with students in pairs, trios, or quartets, and students engaged in higher level
thinking; high-level questions from both teacher and students; and the teacher paying attention to
how students are thinking about a problem as s/he circulates around the classroom while the
groups work. This district leader noted that math tasks can appear rigorous without really being
rigorous, but a truly good task is one that kids with different achievement levels can enter – and it
doesn’t necessarily have a “right answer.” The focus in this district was not on procedural
calculations, but rather on building students’ ability to think conceptually about mathematic. A
number of other leaders in this district spoke of supports needed to better implement this kind of
instruction in classrooms: provision of content-based professional development for math teachers,
and facilitation of professional learning communities for mathematics teachers.
In the Adams District, the chief academic officer described the district’s goals for
mathematics instruction: high quality questioning, the teacher posing a question and giving
students space to think – not yes/no questions, challenging tasks for all students because low-
achieving students need much more than extra practice and basics, and use of mathematical
representations (e.g. graphs) to model mathematical problems. In this district, the leaders
explicitly stated that drill is insufficient, and they described several key characteristics of
standards-based math instruction (e.g., the type of questions, the space for students to grapple
33
with a question, and multiple representations), specifying that this kind of instruction is for all
students in their district. Furthermore, the district leader responsible for middle school
mathematics curriculum, assessment, and professional development has participated in summer
training about the district’s standards-based middle school mathematics curriculum, Connected
Mathematics. The district also has provided each middle school with a half-time coach in each of
the content areas that are tested by the state, including mathematics.
Leaders in Washington District described both form-based and function-based goals for
standards-based instruction in middle school math. Some described goals as hands-on learning,
relevant tasks, and experiential learning, while others named cognitively demanding task, and
tasks that allow students to use multiple representations as evidences of high quality mathematics
instruction. Again, these district leaders named key facets of standards-based instruction as part
of their vision for mathematics education. Like the first two districts, Washington District
provided subject-specific professional development for its staff; it also provided extra planning
time dedicated to professional learning communities for mathematics teachers, and a protocol for
lesson planning that facilitated teachers’ use of cognitively demanding tasks. Additionally, the
district developed its own curriculum rather than direct teachers to use the conventional
mathematics textbook that the district had purchased in a previous year. While these district
leaders may not describe strongly function-oriented goals for standards-based instructional
reforms in mathematics, their goals diverged from conventional perspectives on mathematics
instruction. As one district leader stated, “no worksheets!”
The Oceanside District adopted the Connected Mathematics curriculum for use in all its
middle schools. The district superintendent considered this curriculum well aligned with the
district’s goals for mathematics instruction. Those goals included key parts of standards-based
instruction, similar to the other three districts: implementation of inquiry-based instruction, higher
level thinking, problems with multiple answers, students involved in dialogue, and use of
manipulatives to visualize problems. The district’s goal, the superintendent explained, was not

34
just training students to memorize times tables and procedures, but ensuring that students learned
to think mathematically. Other leaders concurred that the district sought to strengthen its inquiry-
based, collaborative approach to mathematics. This district had also provided mathematics
coaches to support the development of teachers’ content knowledge and to facilitate teacher
collaboration. All four districts expected middle school principals to serve as instructional leaders
in mathematics, setting expectations for teachers’ instructional practice, and working to improve
standards-based instruction in mathematics in their buildings. This made the four districts an
excellent location for research into instructional leadership in support of standards-based
instruction.
Survey and Interview Data
Teacher surveys were administered in March of each year, and all study participants
completed the survey. Most completed an online version; a few participants completed a paper-
copy for their own convenience. Participants were emailed and/or phoned, as needed, if they had
not finished their survey. The teacher survey included items to measure teachers’ perceptions of
the support structures for developing ambitious instructional practices in mathematics, including
teacher learning communities and informal networks, formal and informal instructional
leadership, and professional development in support of improved instructional practices in
mathematics.
Teacher survey data come from the second year of the project (N=122 teachers, 30
principals), as described in Table 1.6 Each district contributes approximately the same number of
teachers (between 28 to 31 teachers per district). The involvement survey scale uses eight survey
6 Initial investigations also used a subset of data from the first year (i.e., teachers who only participated in the first year of the study, and worked in schools where the principal remained the same in both years). However, the small number of observations in this subset (N=34 additional teachers) meant that DIF could not be effectively tested by year of study. Therefore, only second year data was used in final analyses for both IRT and HLM models.

35
items that ask teachers about their school leaders’ practices in setting expectations for teaching
and learning, and in monitoring the progress of teaching and learning in mathematics.
Teacher and principal interviews were conducted using semi-structured, role-specific
interview protocols. Interviews were audio taped and transcribed. These data also come from the
second year of the project. The principal interview provides data about the principal’s vision of
standards-based mathematics instruction. The teacher interview provides data about the
instructional expectations that principals articulate. It is appropriate to use teacher data to
measure principal expectations. Principals and teachers do not always describe the same
situations in similar ways (Desimone, 2006; Heller & Firestone, 1995). Since research indicates
that principals influence student performance indirectly through influencing teachers, this
analysis measures expectations as perceived by teachers (Supovitz, Sirinides, & May, 2010).

36
Table 1: Descriptive Statistics Frequency Characteristic Year11 Year21
Principal Data2 N = 30 Principal Years of Experience in Teaching Math Zero 18 One to four years 5 Five to ten years 4 Over ten years 3 Principal Gender Female 12 Male 18 Principal Race/Ethnicity (Respondents Could Select More Than One Category) African American or Black 11 Caucasian or White 13 Hispanic or Latino/a 3 Other or missing 3 Teacher Data N= 34 N = 122 Teacher Certification in the Year that the Teacher Completed the Survey Full certification (middle or secondary) 33 110 Not full certification 1 12 Teacher Gender Female 17 82 Male 17 40 Teacher Race/Ethnicity (Respondents Could Select More Than One Category) African Amer. or Black 9 34 Caucasian or White 21 77 Hispanic or Latino/a 5 12 Other 1 4 Teacher Years of Experience in Teaching Math Under two years 2 18 Two to four years 12 31 Five to ten years 6 36 Over ten 14 39 District Lakewood School District 6 28 Adams School District 8 32 Washington School District 12 31 Oceanside School District 8 31

37
Table 1 (Continued) Additional Descriptive Statistics for HLM Models Variable N Mean SD Min Max Level 1 Teacher Perception of Instructional Involvement 122 0.10 1.89 -4.17 4.46
Expectations for Standards-based Instruction 122 3.16 0.95 1.0 6.0 Level 2 Faculty Perception of Instructional Involvement3 30 0.10 0.71 -1.38 1.68 School Rank 30 3.87 1.55 1.0 6.0 Composite of Three Dimensions of Principal Instructional Vision
30
5.03
2.28
1.0
11.0
1 A subset of Year 1 teachers included for initial analyses of DIF. Only Year 2 data was used for all multi-level IRT and HLM analyses. 2Principal data is based on the Year 2 principal survey. Assistant principals were not surveyed. 3As estimated by the multi-level IRT rating scale model.

38
Measures
Involvement in Instruction Scale
The principal involvement scale is created from eight survey items (See Table 2). These
items were included in the MIST teacher survey in order to measure the construct of instructional
leadership. The items are very similar to a nine-item scale for instructional leadership scale used
by the Consortium on Chicago School Research (CCSR), and similar items have been used
repeatedly (Goldring & Cravens, 2006; Berends, et al., 2010; CPRE Study of School Leadership
School Staff Questionnaire, 2005; Knapp, et al., 2003). Results from previous research indicate
that the items function well together as a scale, with CCSR (2006) results showing high reliability
for the nine-item scale when used with high school teachers and when used with elementary
school teachers (Cronbach’s alpha > 0.90). The current analysis tests a revised version of the
instructional leadership scale that measures subject-specific instructional leadership, using items
revised by the MIST research team to focus solely on mathematics.

39
Table 2: Survey Items in the Principal Instructional Involvement Scale 1 N= 122 teachers Item #
Item2,3
M
SD
Question Stem: #23 To what extent do you agree or disagree that your principal (or assistant principal) does the following?
1 (t23g)
Knows what’s going on in my classroom
3.61 1.10
2 (t23h)
Actively monitors the quality of mathematics teaching in this school.
3.70 1.07
3 (t23f)
Carefully tracks student academic progress in mathematics
3.75 1.01
4 (t23e)
Presses mathematics teachers to use what they have learned in professional development
3.86 .93
5 (t23i)
Communicates a clear vision for mathematics instruction.2
3.70 1.13
6 (t23d)
Sets high standards for student learning in mathematics
4.04 .90
7 (t23b)
Sets high standards for mathematics teaching
4.23 .96
8 (t23a)
Makes clear to the staff his/her expectations for meeting instructional goals in mathematics.
4.06 .99
1 Items were listed in the MIST survey as measuring the instructional leadership construct. Items are similar to those used in a CCSR (2003) instructional leadership scale. 2CCSR versions of the items did not include references to mathematics (italicized above). The CCSR version of Item 5 states, “The principal communicates a clear vision for our school.” Furthermore, CCSR items reference only “the principal at this school.” MIST items specify mathematics and reference the “principal (or assistant principal).” 3All items used five response options (strongly disagree; disagree; neither disagree nor agree; agree; strongly agree); (CCSR items used 4 options).

40
The items provided participants with Likert-type response options ranging from strongly
disagree to strongly agree. Similar to the CCSR analysis, the current study uses IRT to validate
the survey scale (see below). IRT can be used for Likert-type data. Typical Classical Test Theory
(CTT) analysis simply averages all items together without any consideration about which levels
of the construct each item measures. Furthermore, regarding the response options for an item,
CTT assumes that a teacher’s choice of a higher, adjacent category indicates the same increase in
perception of principal involvement, across all response categories (i.e., across the continuum for
the construct). IRT analysis, on the other hand, begins with hypotheses about how survey items
measure different levels of the construct, and results provide evidence about this. Further, IRT
analysis allows the meaning of a teacher’s choice of an adjacent, higher response option to vary
across the set of response categories. For these reasons, the survey scale is validated using an IRT
model. Because CCSR analysis also used an IRT model to create a survey scale, the internal
structure of the scale in each analysis can be compared. Empirical IRT results from the CCSR
analysis and the current analysis cannot be compared because the scales are not identical, but the
relative position of each item in the results is compared. This is a comparison of how items
function to measure subject-specific instructional leadership and how they function to measure
instructional leadership more broadly across all subject areas. Teacher-level results are used to
measure teachers’ reports of principal involvement in instruction, and item-level results are used
to analyze the internal structure of the scale.
Vision of Standards-based Instructional Reform in Mathematics
Principal responses to the following questions are used to measure principal vision: “If
you were asked to observe a teacher's math classroom for one or more lessons, what would you
look for to decide whether the mathematics instruction is high quality?” Follow-up probes
inquired about what the teacher should be doing, what type of problems or tasks students should
be working on, what discussion would look and sound like, and any other distinguishing

41
characteristics. This set of questions followed immediately after a question about the principal’s
practices of classroom observation and feedback, “Do you formally drop in on or formally
observe your math teachers?” Follow-up probes included frequency, purpose, whether the
principal had conversations about classroom observations with teachers afterward, forms or
rubrics used in classroom observation, and whether the principal ever intervened in instruction.
Additionally, if the principal stated that s/he has observed mathematics instruction, the
interviewer asked a third question, “Given what you just described as high quality math
instruction, could you please describe a lesson that you observed this year that you view as high-
quality instruction?”
In some cases, the interviewer opened the question about high quality mathematics
instruction by saying, “I know you talked about this some already.” This indicates that the
principal has discussed his/her vision of high quality mathematics instruction while answering the
classroom observation question, and that the interviewer may have abbreviated the questions
about high quality mathematics instruction. Classroom observation is a natural place for
principals to discuss their views about high quality mathematics instruction. In their role as
evaluators of instruction, they are assessing how well instruction matches their instructional goals
whenever they observe classrooms. Therefore, all three questions are coded.
Data are coded using the Munter (unpublished) rubrics. The same three interview
questions used here are also used by Munter and the MIST research group when coding principal
interview data for vision of high quality mathematics instruction.
Expectations for Standards-based Instructional Practice Measure
To measure teacher perception of principal expectations for improved standards-based
instructional practices, I use a question from the teacher interview: “Can you please describe what
your principal expects you to do to be an effective math teacher in your school?” A follow-up
probe is also used, asking, “Does your principal expect you to teach mathematics in a certain

42
way?” Additionally, I scan a question that asks teachers what kind of feedback the principal
provides after observing classroom instruction (or, if no feedback is provided, what the teacher
thinks the principal focused on while observing instruction).
A six-point rubric is used to code teacher reports of principal’s expectations for
standards-based instructional practice. The rubric is intended to differentiate between principal
instructional expectations that are strongly aligned with standards-based instruction, those that are
moderately aligned with standards-based instruction, and those that are not aligned. The first two
levels describe instructional expectations that are not aligned with standards-based instructional
goals. At these levels, teachers either report that they have much leeway in instructional choices,
or that principal expectations do not involve standards-based curriculum or standards-based
instructional strategies. The middle two levels describe form-based instructional expectations. At
these levels, teachers report that the principal expects at least one aspect of the district’s
standards-based instructional reform, and the principal may have named a combination of several
aspects or elaborated on his/her description of one expected instructional strategy. The highest
two levels describe function-based instructional expectations. Here, teachers report that the
principal expects standards-based instructional practices to be used in ways that had more
potential to achieve the goals intended by standards-based reform. Initially the highest level was
intended for expectations that included clear statements about the goals that standards-based
strategies were intended to reach and/or how standards-based instructional practices were to be
implemented. According to Heller and Firestone (1995), research shows that school leaders need
to frame goals in both conceptual and operational terms, because change occurs when teachers
know both the specific procedures they need to follow and the broad reasons behind them. In the
context of standards-based mathematics reforms, this means communication about how to
implement new instructional strategies in ways that achieve standards-based goals, and why those
goals matter for student learning. However, through the iterative process of coding the interview

43
data, the highest rubric levels were revised to include all function-based expectations for
instruction.
Methods
Scale for Principal Involvement in Instruction
The study investigates the validity and reliability of a scale that measures principal
involvement in instruction, in the context of standards-based instructional reform in mathematics,
and then it examines associations between principal involvement, principal vision of standards-
based mathematics instruction, and teacher perception of expectations for standards-based
instructional practice in mathematics. To begin, the study investigates the psychometric
properties of the involvement scale using both IRT and CTT analyses. While previous large-scale
research finds high reliability and validity for the involvement scale, no research has tested the
scale in the context of standards-based mathematics instruction. Principals’ leadership practices
have been found to differ by subject area (Stein & D’Amico, 2000), so there is reason to think the
scale items may function differently when used to measure principal involvement in instruction in
specific subject areas. Furthermore, validity is not established for an instrument, but for a
particular use of the instrument (e.g., use of a scale with a specific population) (Kane, 2001).
Therefore, this study investigates the reliability and validity of the scale for measuring principal
involvement in instruction in schools that are implementing standards-based mathematics
reforms.
A researcher can observe neither principal involvement nor a teacher’s perception of
principal involvement. In this analysis, the degree of principal involvement that a teacher
perceived is considered a latent variable, and it is assumed to have a continuous structure. Survey
items are used to infer the degree of principal involvement. The items are based on those
developed for use across a large, urban school district and validated with data from that district
44
(CCSR, 2006). Subsequently, the MIST research project revised the items to focus on
mathematics. The current analysis evaluates the validity of the revised items for use in measuring
principal involvement as perceived by mathematics teachers, in schools that are implementing
standards-based instructional reforms in math.
As a first step in this analysis, a theory is developed about the functioning of the principal
involvement construct. This facilitates investigation of construct validity (Kane, 2001). The Four
Building Blocks approach (Wilson, 2005) is used, as follows: In Block 1 the construct is
developed based on theory, and a construct map is constructed to outline the levels of the
construct; in Block 2, items are matched with the level of the construct that they measure, and a
coverage table is created to ensure that all levels of the construct are measured; in Block 3, the
outcome space is defined (i.e., since items come from a pre-existing survey, the outcome space is
the Likert-type response options used in the survey); and in Block 4, the measurement model is
selected and analysis conducted to validate the construct. If results based on the measurement
model are shown to be reliable and valid, and if results agree with those hypothesized in the first
and second blocks (e.g., the order of items, from least to most frequent, is similar in both theory
and empirical results), this is considered confirmatory evidence for the theoretical description of
the unidimensional construct in the first two blocks; these steps emphasize the importance of the
theoretical model in the first two blocks.
Block 1. The construct of principal involvement in instruction is developed based on
prior research that suggests two central functions of instructional leadership. First, leaders
articulate goals and vision for instruction. Second, after expected goals have been delineated,
leaders monitor progress toward achieving them (Bamburg & Andrews, 1991; Rosenholtz, 1985;
Fink & Resnick, 2001; Nelson & Sassi, 2000; Stein & D’Amico, 2000; Stein & Nelson, 2003;
Supovitz, Sirinides, & May, 2010). Research also suggests that goals and expectations serve as a
benchmark for subsequent evaluation of instruction and feedback to teachers (Supovitz &

45
Poglinco, 2001; Rosenholtz, 1985). Prior IRT analyses using a similar survey scale fit this two-
part model of the construct (CCSR, 2006). The earlier results indicate that items that measured
setting expectations for instruction had relatively low item locations, and items that measured
monitoring had relatively high item locations. However, no theory about the internal structure of
the involvement scale has been formally proposed or tested in the previous research that was
examined for the current study. This study combines the suggestions from previous qualitative
and quantitative research and then more formally tests a two-part structure of the involvement
scale. Based on the research noted above, the proposed internal structure of the scale is as
follows: At lower levels of the construct, administrators articulate a clear instructional vision. At
higher levels of the construct, administrators monitor instructional progress, using the clearly
articulated the vision, as a benchmark. This study investigates the validity of this structure in the
context of subject specific leadership in support of standards-based mathematics reforms.
A construct map (Wilson, 2005) provides a diagram of the hypothesized levels of a
unidimensional, continuous, latent variable. The process of creating the construct map ensures
that the measure is neither too narrow nor too broad (Messick, 1994). The construct map in
Figure 2 also presents a juxtaposition of individuals and items on the same logit scale. The left
side of the construct map shows that teachers can be located on the continuum according to the
amount of involvement in instruction that they perceive from the principal. Moving upward,
teachers located nearer the top are those who perceive more involvement on the part of their
principal. On the right side of the construct map, items are located on the same continuum, with
those items that indicate larger degrees of involvement placed nearer the top of the logit scale.

46
Figure 2: Construct Map for Teacher Perception of Principal Involvement in Instruction
Direction of increasing involvement in instruction by the principal
Respondents
A teacher who perceives moderate to strong
involvement in instruction by the principal.
A teacher who perceives low to moderate involvement in instruction by the principal.
Direction of decreasing involvement in instruction by the principal
Responses to Items Items that indicate moderate-high level of involvement in instruction by the principal
Items that indicate a low-moderate level of
involvement in instruction by the principal

47
Block 2. Given the hypothesis that the principal sets expectations at lower levels of
involvement, and that the principal both sets expectations and monitors progress at higher levels,
the next step is to specify which levels of the construct are most clearly measured by each survey
item. A coverage table is created to do this (See Table 3), and to ensure sufficient coverage at
each level. The coverage table shows which items are expected to provide information about
participants at each level of the construct, because the most precise information about an
individual respondent comes from items that measure levels close to that person’s location on the
continuum.7
7 Sufficient coverage at each level also minimizes standard errors for the person location parameter estimates. In this case, however, with only eight items and under 200 in the sample, the person estimates may still have large standard errors, even with good coverage of all levels.

48
Table 3: Coverage Table for the Principal Involvement in Instruction Construct
Hypothesized Levels of Involvement
Item #
Item1
Level 1 Low-moderate Involvement
Level 2 Moderate-high
Involvement 1
(t23g) The principal knows what’s going on in my classroom
O
2 (t23h)
The principal actively monitors the quality of mathematics teaching in the school
O
3 (t23f)
The principal carefully tracks student academic progress in mathematics
O
4 (t23e)
The principal presses mathematics teachers to use what they learn in professional development
O
5 (t23i)
The principal communicates a clear vision for math instruction.3
O
6 (t23d)
The principal sets high standards for student learning in mathematics
O
7 (t23b)
The principal sets high standards for mathematics teaching
O
8 (t23a)
The principal makes clear to the staff his/her expectations for meeting instructional goals in mathematics.
O
1 Items are in listed on this table in the hierarchical ordering found by the CCSR study (2006)

49
The current analysis hypothesizes that the following items measure articulation of
goals/expectations: items that ask teachers the degree to which the principal makes instructional
expectations clear, sets high standards for teaching and for learning, and clearly communicates
the school’s instructional vision. Items selected to measure monitoring are those that ask teachers
the degree to which the principal actively monitors instruction, tracks student progress, presses
them to use what they learn in professional development, and knows what is happening in each
classroom. Note that the construct is hypothesized to be unidimensional, and this means that each
level of the construct is inclusive of those levels below it. When the indicators of a high level of
involvement are present, then the indicators of low involvement would also generally be present.
(As conceptualized here, indicators may be both the kind of activities and the degree of principal
participation in those activities.)
The eight items used here are based on items from the CCSR instructional leadership
scale, however, the CCSR scale is not subject-specific.8 A CPRE (2005) scale also uses similar
items, two of which specifically ask about math (#2 and #5 above). However, the items used here
were revised by the MIST research project to consistently focus on instructional leadership for
mathematics: seven of the eight items specify “mathematics.” Use of pre-existing survey items
places limits on the items available for inclusion in the scale; however, it also means that items
had been pre-tested.
Block 3. The next step involves the definition of the outcome space (e.g., the response
categories for an item). In this case, the survey items in the involvement scale use five response
options in a Likert-type scale. However, initial analysis of the data showed that the “strongly
disagree” and “disagree” categories had low response frequencies. These two response categories
8 The CCSR instructional leadership scale included one item that the MIST project did not assign to the instructional leadership scale, “The principal at this school understands how children learn mathematics.” That item was not used in this analysis. It was also omitted from other instructional leadership scales (CPRE, 2005).

50
were collapsed and subsequent analysis uses four response categories instead of five.
Of critical importance to analysis, the hypothesized order of items in the coverage table
does not limit the outcome space. For any given item, there was a range of five answer options.
Participants could choose any of the options. An item that is expected to be frequently
experienced by teachers would be located low on the coverage table, but participants could still
select any of the options (even “strongly disagree”). Conceptually, the coverage table (and the
construct map) functions as a hypothesis. It does not limit participants’ responses.
Block 4. Next, item locations are estimated using an IRT measurement model. IRT
results locate each item on an interval logit (i.e., log-odds) scale9 allowing estimates of item
locations to be compared. Results show, empirically, which items are primarily indicators of low
levels of the construct, and which items are primarily indicators of higher levels of the construct.
Additionally, estimates of teacher locations are placed on the same interval scale, so they can be
compared with item estimates: the probability of any given teacher assenting to a particular item
can be predicted based on the estimated location for that teacher on the logit scale.
Rating scale model. An IRT rating scale model (Andrich, 1978) was selected as the most
appropriate measurement model for the Likert-type data in this analysis. The data are
polytomous, (i.e., the survey items had multiple, ordered-response categories), and each category
of an item has a particular probability of being endorsed. However, the significance of a teacher
choosing a higher, adjacent category is not necessarily be the same across all response categories.
9 The outcome variable in IRT is the probability of a teacher endorsing a particular category of a given item. When a predictor variable, X, is graphed against that probability, the probability ranges from zero to one and is in the shape of a sigmoid (“S”) curve. However, the log of the odds ratio has no limits on its range and the graph of X versus the log-odds is linear. Then, in IRT models, the difference between teacher location and item location forms the independent variable and is used to predict the log of the odds ratio (See Embretson & Reise, 2000, pg. 49). So, results for teacher and item locations are in logits and are graphed on a logit scale.

51
For instance, the difference in the degree of principal involvement that a teacher perceives when
s/he responds with “strongly disagree,” instead of responding with “disagree,” is not necessarily
the same as the difference in principal involvement when a teacher responds with “neither agree
nor disagree” instead of “agree.” The rating scale model allows the differences in the probabilities
between adjacent categories to differ. Category threshold parameters, τk, indicate how commonly
teachers endorsed each response category, and the category threshold parameters do not need to
be equally spaced (see Figure 3). The rating scale model does make the assumption that the
distances between category thresholds are the same for all items. Since all eight items share the
same Likert-type response categories, the relative locations of the category thresholds are not
expected to change across items10 (Embretson & Reise, 2000), and this allows for a more
parsimonious model.
10 By contrast, for a series of mathematics questions, the relative difficulty of the answer options may vary greatly across items.

52
Figure 3: Parameters To Be Estimated in IRT Rating Scale Model for Polytomous Data, Item i
Figure 3 shows hypothetical category transition points for one item. For instance, if the
item location estimate for the item was 3.0, and the category threshold estimates were –0.3, 0.1,
and 0.4, then the transition point between the first and second categories would be 2.7 (e.g., if a
teacher location parameter is greater than 2.7, the teacher would be likely to assent to the second
category). The second transition point would be 3.1, and the third would be 3.4 (e.g., if a teacher
had a location parameter of 3.4 or greater, that teacher would be likely to assent to the highest
category for that item).
In the survey data, each item response can be seen as cross-classified by items and
teachers (see Appendix A). Participant responses are viewed as nested in teachers, and a person
location parameter, θj, for is estimated for each teacher; this estimate indicates the degree of
principal involvement that the teacher perceives. Additionally, for each of the eight items,
participant responses are viewed as nested in items, and an item location parameter, δi, is
estimated for each item; this estimate indicates how commonly teachers endorse that item.
Threshold parameters, τk, are also estimated for each category (e.g., the distance on the interval
scale between a particular category and the previous category). Then, δik, represents the transition
point for category k of item i (see Equation 3.1). If a teacher location parameter is below a
Logit scale
Item i (four response options, k=3)

53
particular category transition point, then the teacher is not likely to assent to that category of the
item, and if a teacher location parameter is above the category transition point, that teacher is
likely to assent to that category. Standard errors for item and teacher location estimates are
provided.
Equation 3.1 gives the transition points for each category of an item,
δik = δi + τk [3.1]
where
i is the item index;
k is the threshold index;
δi is the item location parameter for item i; and
τk is the item threshold parameter for category k.
Item location parameters, δi, category threshold parameters, τk, and person locations
parameters, θj, are estimated using item responses, yji. For each observed outcome, yji, the
probability of that outcome for item i and person j is calculated across a range of possible item
locations (i.e., possible category transition points, δik). The IRT rating scale model produces
parameter estimates with the highest likelihood of the outcomes found in the data. To do this, the
model uses Equation 3.2,
[3.2]
where
j is the person index;
θj is the person location parameter for person j;
k is an index for response category;
m is the number of categories (the total number of categories –1); and
h is an index to facilitate an additive structure.
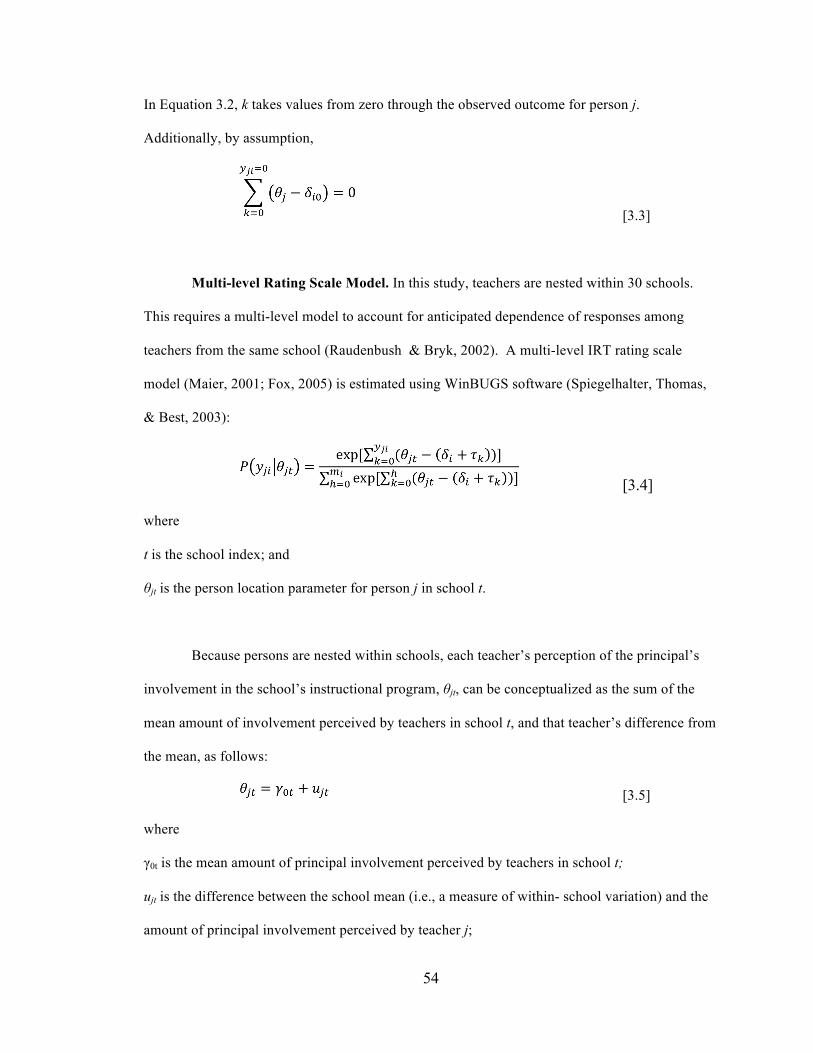
54
In Equation 3.2, k takes values from zero through the observed outcome for person j.
Additionally, by assumption,
[3.3]
Multi-level Rating Scale Model. In this study, teachers are nested within 30 schools.
This requires a multi-level model to account for anticipated dependence of responses among
teachers from the same school (Raudenbush & Bryk, 2002). A multi-level IRT rating scale
model (Maier, 2001; Fox, 2005) is estimated using WinBUGS software (Spiegelhalter, Thomas,
& Best, 2003):
[3.4]
where
t is the school index; and
θjt is the person location parameter for person j in school t.
Because persons are nested within schools, each teacher’s perception of the principal’s
involvement in the school’s instructional program, θjt, can be conceptualized as the sum of the
mean amount of involvement perceived by teachers in school t, and that teacher’s difference from
the mean, as follows:
[3.5]
where
γ0t is the mean amount of principal involvement perceived by teachers in school t;
ujt is the difference between the school mean (i.e., a measure of within- school variation) and the
amount of principal involvement perceived by teacher j;

55
where ujt ~ N (0, τ12), where τ1
2 is the teacher-level variance.
Furthermore, the school average, γ0t, can be seen as the sum of the grand mean for principal
involvement perceived by teachers across all schools, and the difference between perceived
principal involvement at school t and the grand mean, given by the following equation:
[3.6]
where
γ00 is the mean amount of principal involvement in instruction perceived by teachers across all
schools, and
vt is the difference between the amount of mean principal involvement perceived at school t and
the grand mean (i.e., a measure of between-school variation),
with vt ~ N (0, τ22), and τ2
2 is the school-level variance.
Within- and between-school variance is examined. Equation 3.7 is used to calculate the
intra-class correlation (ICC), or the proportion of total variance that lies between schools.
Between-school variance has typically been found to be smaller than within-school variance; for
instance, Rowan, Raudenbush, & Kang, (1991) examine within- and between-school variance for
three school climate measures, including principal leadership, using data from 348 schools in the
High School and Beyond study. They find that the ICC ranges from 0.16 to 0.24. Their models
are able to explain very little of the within-school variation (e.g., 2% for the principal leadership
measure), though some with-in school variation is accounted for by the teacher’s subject area.
Since the current study involves only mathematics teachers, the ICC may be slightly smaller.
Variation may also be smaller because the current study includes schools from only four school
districts. Principals in the same school district can be expected to be more alike than principals in

56
different districts, and drawing a sample from a smaller number of districts would result in less
between-school variation.
[3.7]
Reliability Assessed Using IRT and CTT. Reliability for the scale is measured using
the separation reliability coefficient and using Cronbach’s alpha. In both cases, the reliability
statistic measures the proportion of the variance accounted for by the model. The person
separation reliability coefficient, used in IRT analysis, is defined as the ratio of the variance
explained by the IRT model to the observed total variance (Wright & Masters, 1981) (See
Appendix B).
[3.8]
where
is the variance accounted for by the model, is the observed total variance, and
is the person location estimate, or the amount of involvement perceived by an individual teacher – the scale value for that individual.
The person separation reliability coefficient is interpreted similarly to Cronbach’s alpha
in CTT. Both these reliability measures range from zero to one, with values closer to one
indicating greater proportion of the variance attributable to the latent variable.
Validity Assessed Using IRT. This analysis uses several means to assess the validity of
the principal involvement scale for use in the context of standards-based mathematics reform.
First, the four building blocks described above provide a means for establishing content validity
(Wilson, 2005). By following the steps of describing a construct based in theory, developing a
hypothesis about the level of the construct that each item measures, defining expected responses,
57
and employing an appropriate measurement model, evidence is gathered about the validity of the
instrument. In this approach, where empirical results from the fourth block match those expected
from the first three blocks, content validity is supported.
Second, examination of the internal structure of the measure provides additional evidence
about validity. After the analysis has been completed in Block 4, the hypothesized hierarchical
ordering of items is compared with the empirical ordering of items, through inspection of the
Wright map. The Wright map is expected to display a pattern of bands, with items that measure
higher levels lying in an upper band and items that measure lower levels lying in a lower band.
As a rule of thumb, standard errors for item location estimates are expected to be less than 0.1.
Selected 95% confidence intervals for item location estimates (selected based on inspection of
Wright map) are also calculated to examine whether the bands represent separate groups of items.
Little or no overlap of confidence intervals is expected. If empirical results indicate that the items
are grouped hierarchically in the two hypothesized groups, then this is confirmation of the theory
used to create the coverage table. Furthermore, if the empirical results agree with the results
expected based on the coverage table, then the validity of the scale is strengthened because the
scale measures both high and low levels of the construct.
Empirical results for item location estimates are also compared with results from previous
research CCSR (2003), to investigate whether the items in the scale function similarly in a
mathematics-specific context and in a context that is not subject-specific. The CCSR scale
included one item that was not included here, and it did not use mathematics-specific survey
items. This precludes direct comparison of results. However, I investigate relative item locations
in each set of results by examining which items are least likely to be experienced by teachers, and
which are most commonly experienced by teachers. I compare the CCSR ordering with the
ordering of items in empirical results for the current study. To evaluate this comparison, I use
Spearman’s rank-order correlation, Spearman’s ρ. While this statistic has no cut-off score for
acceptable levels, a positive correlation indicates agreement, and values closer to one indicate

58
greater agreement. Spearman’s rank-order correlation is calculated using Equation 3.9, where D
is the rank difference for an item between the hypothesized construct map and the empirical
results, and I is the number of items:
[3.9]
If Spearman’s rank-order correlation indicates substantial agreement between the CCSR scale
results and results from the current analysis, this would support the validity of results from the
current analysis. This would also suggest that the scale functions similarly in subject-specific and
non-subject-specific contexts. A lower correlation would not necessarily threaten the validity of
the scale as a measure of principal involvement in a math-specific context, but it would indicate
that the scale function differently depending upon context. In that case, more research may need
to be done, and the Wright map examined, to investigate whether the scale items sufficiently
cover the levels of the involvement construct in the math-specific setting.
Results also provide evidence about whether the scale measures all levels of the
involvement construct. First of all, the results place item location estimates, which indicate the
construct levels that each item measures, and teacher location estimates, which indicate the level
of principal involvement that each teacher reports, on the same interval scale (e.g., the Wright
map). With teacher and item location estimates on the same scale, it is possible to compare the
range of levels of involvement that teachers report with the range of the levels observed in the
item location estimates. This shows whether the scale includes items that optimally measured the
full range of involvement levels that are observed in teacher responses. An information curve for
the scale presents similar evidence graphically, showing the amount of information the scale
supplies across each level of the construct. If the Wright Map and information curve show that
the scale provides information about principal involvement across all levels of the construct, then
scale validity is supported. On the other hand, if teacher responses on the Wright Map indicate the
existence of higher levels of the construct, but no items optimally differentiated among the

59
teachers who perceived those higher levels of the construct, and the information curve suggests
the same, then the validity of the scale is reduced.
Investigation of Differential Item Functioning. Finally, if the scale is a valid measure of
subject-specific leadership for instructional reform in mathematics, each scale item functions the
same way in all school districts in the study. Scale results would not be confounded with district
characteristics. To investigate this, I assess whether there is any evidence of differential item
functioning (DIF).
Teachers in some districts may be more likely to report higher principal instructional
leadership (e.g., the overall scale scores may be higher) because some districts may in fact
encourage principal instructional leadership more effectively. School district policies have been
shown to both enable and constrain principals’ leadership (Fink & Resnick, 2001; Kaufman &
Stein, 2009). This is a difference in the impact of the scale items for different groups of
respondents, and it does not indicate any threat to the validity of the scale (Dorans & Holland,
1993). By contrast, tests of DIF measure whether particular district influences (e.g., a district’s
principal professional development) have an inordinate effect on any single survey item. Tests of
DIF assess whether participants in some districts are more likely to assent to a particular item,
even when they perceive equal amounts of principal involvement overall (e.g., after respondents
have been matched based on their person location estimates).
If DIF exists, then there is test bias. If items show evidence of DIF, it is easier for
teachers to assent to them in some districts than other districts, even when the teachers perceive
the same degree of principal involvement. In the context of IRT, this means that the rank
ordering of items would differ by district. For the group of teachers who perceive principal
involvement at a level of 0.25 (e.g., the person location estimate is 0.25), if results hypothetically
show that the item location estimate is also .25 for Item 4, “Principal presses math teachers to use
what they have learned in professional development,” then those teachers would have a 50%

60
likelihood of assenting to Item 4. However, if one district required principals to push their
teachers to use professional development more, then Item 4 would appear higher in the rank order
of items. This would introduce test bias – teachers in that district would be more likely to obtain a
higher score on the item with DIF, and their overall score would be higher than all other items
would suggest. This would decrease the validity of the measure. It would produce different
results in different districts. I investigate potential differences in patterns of teachers’ responses to
individual items using the Generalized Mantel-Haenszel (GMH; Mantel-Haenszel, 1959) statistic,
and using the logistic regression likelihood ratio test (Miller & Spray, 1993; Zumbo, 1999). For
each scale item, the GMH statistic tests for conditional independence of district and the item.11
The logistic regression likelihood ratio test conducts a logistic regression of total test score on
probability of a particular score for an item. The full model regression equation includes
independent variables for district, for total involvement scale score, and for an interaction of
district by total score. Reduced models remove all but the total score variable, and likelihood
ratio tests determine whether the additional independent variables are significant contributors to
the model. The test statistic has a chi-square distribution when the sample size is large and the
models are fully nested (df = 1). The likelihood ratio test depends on the existence of unbiased
items that function as anchors, and the influence of biased anchor items on results is not
completely understood. For both the GMH and the logistic regression likelihood ratio test, tests
for DIF in each of the four school districts are conducted, and a Bonferroni correction is used for
the results.
I also examine outliers in person estimates from the rating scale model results. I define
outliers as 1.5* inter-quartile-range greater than the third quartile or less than the first quartile. 11 To calculate the GMH statistic for an item, a contingency table is created to tabulate teachers’ responses by response category and by group (i.e., group of teachers in a particular district, and group not in that district). A separate contingency table is created for each level of involvement, so each table only contains responses from teachers who report the same level of involvement. The GMH statistic tests the null hypothesis that responses are not dependent on group membership, after teachers have been matched on their involvement scale values. The test statistic has a chi-squared distribution (df = K-1, with K = number of response categories).

61
This identifies approximately 5% of the sample. Outliers are examined to determine whether
they are correlated with teacher characteristics (e.g., first year teachers may report greater
involvement from the principal). Outliers are removed from selected subsequent analyses, as
needed to test the robustness of results.
School-Level Measure of Principal Involvement in Instruction. This study includes
two variables for principal involvement in instruction. One measures the involvement perceived
at the teacher level, and the other measures principal involvement perceived by the faculty. Both
were estimated with the multi-level IRT rating scale model. Researchers have used aggregated
variables previously (Hallinger, Bickman, & Davis, 1996), although there has been debate about
whether group-level or individual-level measures were best. Hierarchical generalized linear
analysis, (HGLM) used in this study, allows inclusion of both teacher- and school-level variables
in the same model (Rowan, Raudenbush, & Kang, 1991).
Teacher-level variability is expected due to measurement error and to structural
differences that teachers experience within the same school. For example, within-school
variability may result from using teacher responses to survey items in order to measure the latent
construct of principal instructional involvement. A teacher’s responses may be influenced by
experiences such as his/her most recent communications with the principal, and those
communications may not be representative of the principal’s practice. Additionally, the teacher’s
class schedule, including timing of conference period and even the location of classroom may
influence how often the principal visits, and how much communication the principal has with the
teacher about classroom instruction. Variability at the school level is also expected, potentially
due to differences in principal practices from one school to another.
62
Principal Instructional Vision
Principal interviews provide the data to measure three elements of principals’ vision for
standards-based mathematics instruction: vision of mathematical task, classroom discourse, and
teacher role. Principals have been found to support standards-based instructional reform through
influencing teachers’ choice and use of mathematical tasks (Nelson & Sassi, 2005; Stein &
Nelson, 2003), through influencing patterns of classroom discourse (Kazemi & Stipek, 2001;
Spillane & Zeuli, 1999), and through attention to the teacher’s role during instruction (Nelson &
Sassi, 2006). This analysis does not assume that principals have the same breadth and depth of
instructional vision that teachers have. As Stein and Nelson (2003) write in their discussion of
leadership content knowledge, “Surely, principals and district leaders cannot know subject matter
in the same way as do mathematicians or historians, nor even to the level that they expect their
teachers to understand them” (pg. 424). Nelson (1999) explains further, “administrative work has
a different relation to children’s mathematical thinking than does teaching” (pg. 7-8). However,
these three elements are expected to differentiate among principals who have a well-developed
vision of the functions of standards-based instructional practices, and principals who have a more
surface-level vision of standards-based instruction.
Three of Munter’s (unpublished) rubrics for vision of high quality mathematics
instruction are used to code principal vision. Using the mathematics education research literature
on high quality mathematics instruction, as well as data from the MIST research project, Munter
(2009a,b) developed the rubrics to assess the ways in which teachers, principals, and other
educational professionals describe high-quality mathematics instruction. The rubrics were refined
through iterative discussions and coding of teacher, principal, and coach interview data from the
MIST research project, and they will be used in future analysis conducted by the MIST research
group. For the study of instructional leadership described here, coding began with Munter’s
rubric for vision of high quality mathematics tasks, the August 25, 2010, version; Munter’s rubric
for vision of classroom discourse, the September 8, 2010, version; and Munter’s rubric for vision

63
of teacher role, August 25, 2010 version. Coding continued with the September 10, 2010, version
of all three rubrics (See Appendices C, D, and E).
Munter’s classroom discourse rubric measures five aspects of discourse. The two aspects
of classroom discourse that Munter designed to be the broadest, Patterns/Structure of Classroom
Talk and Nature of Classroom Talk, are used in this analysis. The other three aspects, Student
Questions, Teacher Questions, and Student Explanation, are more detailed, and scores for these
three tend to be reflected in the broader Nature of Talk score. For each principal interview
transcript, a single score is recorded for the classroom discourse element of vision, using the
higher score from Patterns/Structure or Nature of Classroom Talk.
The Munter rubrics are intended to describe an expected trajectory of practitioner growth.
Teachers are expected to move through levels two and three (perhaps not sequentially) before
they become expert in implementing a “function” view of standards-based reform. While more
research needs to be done on typical development of principal vision, and principals stand in a
different relation to student thinking than teachers do (Nelson, 1999; Nelson & Sassi, 2000),
nonetheless, the current analysis assumes that a principal who describes a level three vision is
better able to move his/her school toward standards-based instructional reform than a principal
who describes a level two vision, since the principal at level three perceives the importance of
whole class discussion. Notes were kept during coding, to record any comments or questions
about coding for a particular transcript. Memos were kept about decisions made in the process of
coding the data for this analysis (Corbin & Strauss, 2008).
The rubric for vision of high quality mathematical discourse has four levels. The first
level describes discourse as it typically happens in conventional instruction (i.e., clear
explanations given by the teacher to the students). The second and third levels describe a “form”
view of standards-based instructional practice. At level two, participants value student discourse
in small groups. Students are expected to discuss mathematics problems with each other rather
than work quietly or only converse with the teacher; students’ discussion may be calculational or

64
conceptual in nature. At level three, the participants also value whole class discussion in which
students explain their groups’ mathematical work to the class; at this level, there is potential for
students to question each others’ methods and compare several strategies – thereby building their
conceptual understanding of math. At level four, participants make explicit the function of
student discussion, expecting to hear student discussion at a conceptual level.
The rubric for vision of high quality mathematical task has five levels. At the first level,
a principal indicates that any type of task was acceptable. At the second level, the principal’s
vision of a high quality mathematical task conforms to conventional mathematics tasks (e.g.,
work that allows students to practice a procedure and then apply the same procedure to a
problem). In the upper three levels, the principal describes tasks aligned, to some degree, with
standards-based instructional reform.
The rubric for vision of teacher role has five levels. At the first level, the teacher is seen
as providing accurate explanations of procedures. At the second level, the teacher is seen as
providing initial explanations and then encouraging students to work together. As principals
develop greater understanding about standards-based instruction, they expect teachers to be
supporting students in developing their own mathematical strategies for solving problems, in
justifying their own mathematical conjectures, and in debating the validity of various strategies.
The third and fourth levels of the rubric describe these teacher roles.
Creation of Measures for Use in Analysis. Several versions of vision variables are
investigated for use in the HGLM analysis. First of all, I first create a composite indicator by
summing principals’ scores for the three elements. Standards-based vision for mathematical task,
classroom discourse, and teacher role are each considered important for the implementation of
standards-based instructional practices (Hufferd-Ackles, Fuson, & Sherin, 2004; Hiebert, et al.,
1997; Kazemi & Stipek, 2001; Boston & Wolf, 2006). This suggests that it may be important for
65
a principal to articulate a vision for more than one element. Depth of the principal’s vision, alone,
may not be as important as depth of vision across several elements.
Additionally, math education researchers have maintained that all aspects of instruction
function together as a system of interrelated parts (Munter, 2000b). This makes it is reasonable to
expect that higher composite scores would have a greater predictive effect than lower scores, in
more than simply a linear relationship. Higher composite scores indicate that the principal has a
function-based vision of several elements of classroom instruction, and this may be more valuable
to a principal’s leadership than additional elements described at only a form-level. These higher
composite scores may have a magnified effect beyond simply their sum. Based on this
expectation, I create two splines to look for evidence of a non-linear effect (Jacob & Lefgren,
2004). (Splines are preferable to creating a binary indicator variable to indicate high composite
scores, because such a binary variable discards much information.) A cut-point in the middle of
the distribution was decided upon, based on the shape of the distribution, and two variables are
created, Sum0-6 and Sum7-11. The second variable records how many points each score was (if
any) above the cut-point. For example, for a composite score of 8, then Sum0-6 is 6 and Sum7-11 is
2. If scores in the upper range of the distribution have a stronger effect on the expectations that
teachers perceive, then the coefficients for Sum7-11 and Sum0-6 will differ. To test this, I use a
multivariate hypothesis test available in the HLM software; this is a multivariate contrast that
provides a chi-squared statistic for the likelihood that the two coefficients are the same. If the
coefficients differ, this means that the relationship between vision and expectations is in the shape
of a spline (i.e., two line segments, with a change in slope at the cut-point). A second version of
the spline was also created with a cut-point at 5 instead of 6, to test the sensitivity of results to the
location of the cut-point.
Finally, I also investigate the polychoric correlations between the three elements to
determine empirically if they appear to measure a single construct, or if one or more elements
provides unique information. Polychoric correlations estimate the associations between ordinal
66
measures and are an approximation of the Pearson moment correlations if the measures represent
normally distributed latent variables. If the correlations are not strong, meaning that one or more
of the elements of vision appear to provide unique information about the principal’s goals for
mathematics instruction, then I also test the elements separately in the analysis.
Two Methods for Addressing Missing Data. Most principals responded to interview
questions about each of the three elements. However, in some cases the interviewer did not probe,
or the principal did not respond with comments that applied to the rubric. The missing data is
addressed in two ways.
First, where only a single score is missing, it is imputed by averaging the two vision scores that
had been obtained. If two of the three vision scores are missing, no imputation is done. Second,
an alternative version of data without imputation is also created. In this version, any missing
score is replaced with zero. This assumes that the lack of response means that the participant
does not include a particular category in his/her vision of high quality mathematics instruction.
However, it also assumes that interviewer probing was sufficient. Replacing missing data with a
zero, in effect, assumes that the participant would have replied at the lowest level. On the math
task rubric, a zero indicates that a participant states that there are no appreciable differences
between various math tasks. For the teacher’s role rubric, a zero indicates that the participant says
the teacher simply needs to be enthusiastic and hold the students’ attention. The classroom
discourse rubric does not contain a zero; however, since level one includes students answering
questions from the teacher, without any student to student discourse, a zero may suggest that the
participant does not consider any student response to be essential. Thus, use of zero in place of
missing data makes strong implications about what the participant’s views would have been. Yet,
lack of any comment about an element of instruction also may be an important indicator.

67
In the HGLM model, the composite of vision scores is used, with and without imputation,
and two versions of a spline are used. These versions of the vision variable test the sensitivity of
the results to imputation and to differing effects across the range of vision variable scores.
Expectations for Standards-Based Instruction
A six-point rubric is used to code teacher reports of principal’s expectations for
standards-based instructional practice. The rubric is intended to describe the degree to which
principal instructional expectations are aligned with the goals of standards-based instruction.
Development of the rubric began with review of the research literature and descriptive coding of
the data (Young, 2006) and continued with iterative analysis (Corbin & Strauss, 2008).
Rubric Levels. Initial levels in the emerging framework for teacher report of
instructional expectations were as follows. At Level 1, the teacher reports receiving little, if any,
feedback from the principal about instruction. The teacher indicates that the principal had few
expectations if s/he observes classroom instruction. The teacher may report that the principal
allows him/her to modify the curriculum as s/he thinks best for the students (Rosenholtz, 1985),
and the teacher may describe this positive or supportive. In one example, a teacher states that the
principal gives her much latitude in instructional matters and that all his feedback about
classroom observations is positive. She interprets this as evidence of the principal’s trust in her
and belief that she is doing what needs to be done instructionally, even though she is still a first
year teacher.
At Level 2, the principal has expectations for instruction or instructional outcomes, but
the expectations do not involve standards-based curriculum or standards-based instructional
strategies. The principal tends to look for behavioral characteristics of instruction that are not
connected with a particular subject area, including “the degree of orderliness, good classroom
management, understandable and well-executed structural components of the lesson, and teacher

68
behaviors (e.g., wait time, gender inequities) that might affect students’ opportunity to learn”
(Nelson & Sassi, 2000, pg. 565). Examples from the data include principals who measure the
quality of instruction based on the degree to which students appear “engaged.” At this level,
principals are not concerned about the task in which students are engaged or the nature of the
learning opportunities. Rather, they simply look to see whether students are paying attention and
participating in whatever task the teacher has assigned. Other examples from the data include
principal expectations about what is posted on bulletin boards or white board (e.g., vocabulary or
a “word wall,” course objectives, and state standards), and expectations for improving test scores
and/or meeting federal Annual Yearly Progress targets. None of these indicators refer to the
district’s standards-based instructional reforms. When Nelson and Sassi (2000) discuss the types
of indicators that administrators may look for when they observe and evaluate classroom
instruction, they specifically contrast attention to these more behavioral indicators with attention
to the instructional practices that support students in developing conceptual understanding in
mathematics. When principals expect to see evidence of standards-based practices, the
expectations are coded as Level 3. By contrast, at Level 2, the principal does not refer to the
district’s instructional reforms.
At Level 3, the teacher reports that the principal expresses a cursory expectation for at
least one aspect of the district’s standards-based instructional reform. This may be use of district
reform curriculum, use of a standards-based instructional strategy (e.g., student discussion), or
implementation of standards-based practices from professional development. However, there is
no indication that the principal elaborates on the expectation. As noted above, many principals set
general instructional objectives but do not discuss specific instructional strategies with teachers
(Leithwood & Montgomery, 1982). In examples from this analysis, teachers state that principals
said they want to see “group work,” but there is no further explanation about what students
should be doing in groups, (e.g., collaborating about mathematics problems). Similarly, one
teacher describes her principal’s expectations for making use of what she learned in district-based

69
professional development. The principal refers to professional development that is intended to
promote standards-based instructional practice, but the principal does not specific any particular
practices.
At Level 4, teachers report that the principal goes beyond cursory naming of one practice
related to standards-based instruction. The principal either names a combination of several
aspects of standards-based instructional practices or elaborates on his/her description of one
expected instructional strategy. It is potentially useful for the principal to describe several
expected practices, because standards-based instruction is intended to involve a number of
interconnected practices. For example, Stein and colleagues (2008) describe the importance of
students working together on cognitively demanding tasks in order to prepare for class discussion
of mathematical ideas, and they conclude that the nature of the task and the nature of the
discussion both impact the potential of a lesson for building mathematical understanding. If the
principal holds expectations for several features of instruction, expecting that teachers use more
challenging tasks, increase classroom discussion, and attend to the nature of the questions that
they pose during discussion – all of which are expectations held by principals participating in this
study), there appears to be more potential for those expectations to impact instructional practice.
Alternately, if the principal elaborates on the expectation for a single practice, (e.g., providing
examples of the kinds of higher level questions that teachers need to use during discussion, rather
than simply expecting to hear teachers questioning students more frequently, there appears to be
more potential for improved teacher instructional practice (Nelson & Sassi, 2005; Fink &
Resnick, 2001). Stigler and Hiebert (1999) provide a rationale for multiple expectations and
elaborations. They argue that classroom instruction functions as a system of multiple structural
features, and changing any one feature is insufficient to change the patterns of instruction. For
example, they note that increased use of the chalkboard can be connected with creation of a
record of the class’s thinking about a mathematical concept, but cursory expectations that
teachers increase their use of the chalkboard, alone, may not lead to improved instruction.

70
Similarly, they argue that simply presenting more challenging mathematical tasks to students
does not, by itself, change the nature of instruction. These examples also imply that elaboration
about instructional changes is needed.
Research does not specify whether elaboration of an expected practice or a combination
of expected practices has most potential to lead to improved instructional practice. Further
research is needed into the relationship between administrative practice and classroom
instruction. However, based on researchers’ attempts to influence classroom instruction, I expect
that administrators’ elaborated or multiple expectations for standards-based instructional practices
have more potential to lead to teachers’ growth than when administrators hold an expectation for
only a single change in practice.
At Level 4, the principal does not include a standards-based purpose for the practices s/he
expected. No goals such as strengthening students’ conceptual understanding of mathematics or
supporting their ability to construct a mathematical argument are mentioned. At this level, the
principal describes a form view of standards-based instructional practice (Spillane, 2000a,
2000b). The principal may have expected student collaboration, problem solving, and use of
manipulatives, but s/he does not indicate that these instructional strategies are intended to build
students’ conceptual understanding of mathematics – or how they may do so.
Examples of Level 4 expectations include a report from a teacher that her school
administrators expect to see teachers acting as facilitators and students engaging in discussion
about mathematics. When asked for an example of what administrators mean, the teacher
describes a recent lesson in which two students were talking through a math problem, describing
their mathematical strategies to each other – though they both actually have an incorrect answer;
when the teacher realized that the students were both describing incorrect strategies, she stepped
in, validated their efforts, and suggested the correct way to look at the problem. This teacher
describes expectations for teachers to function in the role of a facilitator and for students to
participate in class discussion, even when this may take more time than direct instructional

71
methods and even when students may explore incorrect solution strategies. At the same time, the
goal of students’ collaborative work is to arrive at a correct answer, rather than to build
mathematical conceptual understanding. When students do not arrive at that correct answer, the
teacher moves out of the facilitator role and gives directions about how to proceed. The teacher is
not expected to remain in a facilitative role, asking questions that could lead the students to
question their own work. The form of teacher facilitation and student discussion is described well,
but the function is not clearly developed.
Another participant states that the principal recently discussed the importance of group
work during a faculty meeting. The principal commented that students may understand material
better when it’s explained by peers, and teachers may have more opportunity to assess how much
students understand as they listen to their explanations. The teacher describes this as a strong
expectation. The principal has emphasized it by spending time on it during a faculty meeting and
by elaborating a rationale for the practice. At the same time, this perspective on group work is not
grounded in standards-based reforms. Group work is seen as providing the teacher with a means
of assessing student mastery of the lesson, and providing students with peer tutors. It is not seen
as a means for students to develop solutions for mathematical problems that none of them can
initially explain. Since the goals for group work do not differ from the goals of conventional
instruction, this is considered a form-oriented expectation standards-based practice.
At Level 5, teachers report that the principal expects standards-based instructional
practices to be used in ways that have potential to achieve the goals intended by standards-based
reform. This is to say that the principal expresses a functional view of standards-based
instruction (Spillane, 2000b). Instructional strategies are considered “means of enabling students
to develop understandings of principled mathematical knowledge (i.e., mathematical concepts)
and to appreciate doing mathematics as more than computations” (Spillane, 2000b, pg. 154). For
instance, principals who express this level of instructional expectations may convey the
expectation that students build their conceptual understandings, day by day. Principals at this

72
level may attend to evidences of student thinking when they observe classroom instruction. They
may analyze comments made by individual students and by the teacher (City, et al., 2009).
Feedback to teachers may include comments about the teacher’s questioning strategies. Whereas
a principal at Level 4 may listen for the existence of teacher questions to students, a principal at
level 5 also listens for the content of those questions. This allows the principal to press teachers to
use high-level questioning strategies, questioning that leads students to think through connections
between mathematical concepts (Nelson & Sassi, 2000). The principal also may press for
teachers to support students’ development of conceptual understanding throughout the class
period, looking at “the teacher’s instructional moves—discussion questions, brief dialogues with
particular students, assignment of follow-up tasks, and so on” (Nelson & Sassi, 2006, pg. 47).
Describing instructional expectations at this level, a teacher at Cypress Middle School in Adams
District states that his principal presses faculty to avoid questions with obvious answers. He adds
that the principal restates one or more of the questions that the teacher used during the lesson, to
provide an example. This principal does not focus only on the teacher behavior of asking
questions, but he also listens for the content of the questions.
At Level 6, teachers report that the principal expresses not only expectations about
standards-based strategies, but also why teachers need to use those strategies. Expectations
include clear statements about the goals that standards-based strategies are intended to reach
and/or how standards-based instructional practices are to be implemented. As noted earlier, Heller
and Firestone (1995) suggest the importance of principals communicating goals in both
conceptual and operational terms, ensuring that teachers know both the specific procedures they
need to follow and the broad reasons behind them. In the context of standards-based mathematics
reforms, this means communication about how to implement new instructional strategies in ways
that achieve standards-based goals, and why those goals matter for student learning. Teachers
who report expectations at this level may state that the principal expects students to engage in
discussion in order to make connections between mathematical ideas, to develop mathematical
73
justifications for their solutions, and to build their mathematical reasoning ability (Boston &
Wolf, 2006; U.S. Dept. of Education, 2003; Spillane, 2000b). Teachers may report that principal
feedback supports them in improving their use of standards-based instructional strategies (Stein &
Nelson, 2003). At this level, teachers have a clearer understanding of the nature of the principal’s
expectations, because the principal describes the specifics of expected strategies and/or the goals
of the strategies. Based on initial coding of the data, this level appears to be rare. While it is
suggested by the research literature, no examples of this level are found in the data for this study.
(Note: this level was later revised during the iterative coding process.)
Procedures for Coding and Reliability. The expectations rubric is intended to code
principals’ expectations for pedagogy. Only instructional expectations are included, not
expectations for non-instructional time. No expectations about teacher collaboration are included
unless they involve specific instructional outcomes (e.g., if a principal were to expect that
teachers collaborate in order to improve their ability to ask higher-level questions, then the
principal’s expectation for higher-level questioning would be coded). Expectations regarding
matters that have little relationship to instruction (e.g., paperwork) are not coded. Expectations
for use of ideas from professional development is considered an expectation related to instruction.
If the professional development is math-specific, then it is coded as at least a three; if not math-
specific, then coded as a two.
Teachers sometimes report that principals hold expectations from several levels of the
rubric, and in this case the highest level that is described is used. For instance, one teacher reports
that the principal expects group work but also states that the principal does not expect teachers to
teach in any certain way. This is recorded as level three. While the principal allows much leeway
in instructional matters, nonetheless, he briefly expresses an expectation for an instructional
practice aligned with standards-based instructional reform.
Additionally, teachers sometimes state that they are making an assumption about the

74
nature of the principal’s expectations, or that the principal’s expectations are only stated
informally. These expectations are coded using the rubric, because expectations can be perceived
even when not formally stated. The goal of the coding is to describe the instructional
expectations that teachers perceive from principals; the impact of the method of communication
is not investigated in this analysis.
Before teachers are asked about administrators’ instructional expectations, they are asked
who conducts their evaluations. If an assistant principal evaluates their teaching, then they are
asked about the instructional expectations of the principal and the assistant principal. For this
analysis, all teacher reports of expectations are coded together, whether communicated by the
principal or an assistant principal. Conceptually, leadership is often stretched over a number of
people, and these people may influence each other’s leadership practice (Spillane, Halverson, &
Diamond, 2001, 2004). This analysis concerns itself with the specific expectations that teachers
perceive, not the division of responsibilities on the leadership team.
Coding reliability is established through a double coding process. At the beginning of
coding, two individuals coded the same interviews until 80% reliable on at least 10 consecutive
scores. This meant 80% exactly the same, and none more than one point different, on ten
consecutive interviews. The primary coder then continued coding. The double coding was
repeated after the primary coder had coded half the interviews were coded. The two coders again
coded the same interviews until reaching the same level of reliability. The primary coded then
completed the coding. The interviews were randomly ordered, so that no one district was coded
first.
A reliability score cannot be calculated for this measure using Cronbach’s alpha, since
there is only one value for each teacher. However, within- and between- school variance is
compared. Previous research on organizational conditions in schools found ICCs from .16 to .24,
with .24 for a measure of principal leadership (Rowan, Raudenbush, & Kang, 1991). This serves
as a general benchmark, and I expected to find approximately as much between-school variance

75
in the expectations measure. The between-school variance in teachers’ perceptions of
instructional expectations could be due to school-level factors (e.g., differences in school context
and differences in principal behavior), and it could potentially be explained in the HGLM model.
Hierarchical Generalized Linear Model (HGLM) Analysis
Next, I investigate the associations among principal vision, involvement in instruction,
and expectations for standards-based instructional practice. I regress instructional expectations
on vision and involvement. I measure principal involvement at both teacher and school level,
principal vision at the school level, and instructional expectations at the teacher level. A multi-
level model allows inclusion of variables at both the teacher and school level, and it accounts for
clustering of teachers in schools – providing accurate standard errors for hypothesis testing
(Raudenbush & Bryk, 2002). The multi-level model also allows investigation of how
associations among variables differ across schools, the heterogeneity of regression (Raudenbush
& Bryk, 2002).
Test of Hypothesis 1. To test the first hypothesis, which posits that teacher perception of
expectations for standards-based instruction will be greater where the principal had greater
involvement in instruction, I used the following Level 1 equation (variables in bold type are
group-mean centered):
Yij = Instructional expectations communicated to teacher i in school j [3.10]
Yij = β0j + β1j(Teacher-reported Principal Involvement)ij
+ β2j(Teacher Female)ij
+ β3j(Teacher Experience)ij
+ β4j(Teacher Race/Ethnicity)ij + rij
The teacher-level involvement variable is group-mean centered, and it is used to test the effect of
within-school variation in perceived involvement. When a teacher reports greater involvement by

76
the principal than is reported by an average teacher at the school, that teacher is expected to
perceive more developed instructional expectations from the principal. The coefficient, β1j,
represents the within-school effect of a teacher in school j reporting principal involvement that is
one unit higher than an average teacher at school j. The mean within-school effect is given by γ10,
as shown in Equations 3.11.12 If results confirm that γ10 is positive and significant, it may be due
to the principal focusing his/her attention on a subgroup of teachers, or it may be due to greater
awareness of principal activity and expectations on the part of some teachers; it is not possible to
disentangle whether the source of the within-school variation derives from individual differences
in teachers or from within-school differences in principal behavior. (The effect of between-school
differences in principal involvement was also tested, through grand-mean centering the
involvement variable, and later by including a Level 2 variable for faculty-level perception of
principal involvement.)
Control variables at Level 1 include teacher years of experience in teaching math,
race/ethnicity, and gender. Teacher experience has not necessarily been shown to be associated
with teacher perception of principal leadership (Rowan, Raudenbush, & Kang, 1991), however, it
may be an important factor in teacher perception of principals’ instructional expectations. Newer
teachers may be more concerned about meeting the principal’s expectations, and they may
perceive those expectations clearly; principals may be more concerned about newer teachers
building experience in effective types of instruction, and they may take more time to discuss
expectations with inexperienced, untenured teachers (leading the newer teachers to report more
well-defined instructional expectations). Teacher experience is entered as a dummy variable to
12 Teacher report of principal involvement is group-mean centered here. However, the mean within-school effect, γ10 , is the same regardless of whether involvement is group-mean centered or grand-mean centered (because the aggregated involvement variable was included at Level 2). In the case of group-mean centering, we obtain the mean effect by looking at an “average” school, and the mean of an “average” school will be the grand mean. The γ10 coefficient is also not substantially influenced by whether β1j is specified as random or fixed, though setting a constraint that Var(β1j) = τ11 = 0 when τ11 is not close to zero will underestimate the standard error for the within-school effect (See Raudenbush & Bryk, 2002, pg. 136, Note to Table 5.10).

77
indicate whether the teacher is in the first two years of teaching. I group-mean center the teacher
experience variable, using the difference between the teacher’s level of experience and the mean
level of teacher experience at the teacher’s school. This means that the coefficient, β3j, represents
the degree to which the less experienced teachers at a school perceive different instructional
expectations from that school’s principal. Several other Level 1 controls are included. Rowan,
Raudenbush, and Kang (1991) find teacher’s background characteristics (i.e., race and sex) are
associated with teachers’ perceptions of some school climate measures, including principal
leadership. I include these and group-mean center them. Teacher certification is not included as a
control due to lack of variation in the data: out of 122 teachers, 110 have full certification at the
middle or high school level).
The level-2 equations include school level variables, as follows (underlined variables are
grand-mean centered, principal background characteristics are uncentered dummy variables, and
school district is entered as a series of three dummy variables):
β0j = γ00 + γ01(Faculty-reported Principal Involvement)j [3.11] + γ02(Principal Math Background)j + γ03(Principal Female)j + γ04(School Ranking)j + γ05(School District)j + u0j
β1j = γ10 + u1j
β2j = γ20 β3j = γ30 β4j = γ40
An aggregate measure of principal involvement is included at Level 2 (estimated with the IRT
multi-level rating scale model). This measures the influence on instructional expectations when a
school’s faculty perceives greater principal instructional involvement than an average faculty in
the sample. The coefficient, γ03, gives this between-school effect. A compositional or context

78
effect is the effect of aggregate, faculty-level perception, even after controlling for effect of
individual perception. Because I group-mean center the teacher-level variable, a compositional
effect would be given by γ01, - γ10 . (If this effect appears to exist, then I re-run the analysis with
the teacher-variable grand-mean centered, to obtain a SE for the effect.) I initially allow the
coefficient for principal involvement to vary. However, I constrain the variance for the teacher
background characteristics to be zero. There is no substantive reason to expect these effects to
differ across schools. I use two tests to determine if the coefficient for the involvement scale can
be fixed: a univariate chi-square test, and a check of the reliability for the coefficient13.
Relationship between the involvement scale and perceived instructional expectations is
tested to see if it remains constant across all schools. If the variance in the effect (i.e., slope) of
principal involvement, u1j, is significant, then equal levels of principal involvement are associated
with different levels of perceived expectations. This may be caused by observed or unobserved
school level factors, or by random variation.
Two variables are included at Level 2 to control for principal characteristics. I control for
whether the principal has math teaching experience because an individual’s prior knowledge and
experience influences his/her practice (Spillane, Reiser, & Reimer, 2002). If a principal has
experience in teaching mathematics, on average s/he can be expected to have more prior
knowledge and experience in both mathematics and mathematics instruction. I expected this to be
associated with teachers’ reports of more developed standards-based instructional expectations
13 I use a univariate chi-square test of the null hypothesis that the level-2 variance component does not differ significantly from zero:
Ho: Var(uqj) = Var(βqj ) = 0 for q = 0, 1 If the p-value for the chi-square test was less than .05, then the null hypothesis can be rejected and it is likely that the βqj coefficient does vary across schools. However, this chi-square test is not precise, because it does not take into account other random variables in the model, and it can only be computed using a subset of the data (i.e., data that has sufficient variability for a series of separate OLS regressions for each independent variable) (See Raudenbush & Bryk, 2002, pg. 123). As an additional test, I check the reliability for the coefficient. Reliability indicates how much “signal” is in the data, and how much one set of results will fit across all schools. If reliability is below .05, this also indicates that a fixed coefficient is appropriate.
79
from the principal, because when the principal understands more about mathematics and math
teaching, s/he is better prepared to construct an administrative practice that supports the district’s
standards-based instructional reforms – and to articulate expectations for teachers to implement
the reforms as intended. Research has also found that female administrators may appear to be
more active as instructional leaders, though the reason(s) are not certain, and a control is included
for whether the principal is female (Hallinger, Bickman, & Davis, 1996; Hallinger & Murphy,
1985).
Additionally, I control for two school characteristics: district and school ranking in Year
1 (the year prior to data collection). While all school districts in this study support principal
instructional leadership to implement standards-based instructional reform, research suggests that
district context can affect principal practice (McLaughlin & Talbert, 2003; Bossert et al., 1982;
Marks & Nance, 2007; SREB, 2009). Furthermore, where schools have relatively low student
achievement compared with the state average and other schools in their district, principals may be
under greater pressure to effect change, and this may influence on principal instructional
leadership (possibly intensifying it, since the principal may become more involved in order to
influence student achievement; possibly diminishing it, if the principal seeks to increase test
scores without focusing on instructional improvement). The school-ranking variable is coarse-
grained, but it allows me to compare schools across several states regardless of differences in
state achievement tests.
Test of Hypothesis 2. Hypothesis 2 posits that when the principal has a more developed
vision of standards-based instruction, the relationship between the principal’s instructional
involvement and teachers’ perceptions of expectations for standards-based instruction will be
stronger. To test this, vision is added as an interaction term with principal involvement, β1j , and
this requires that it be added as a main effect as well. The Level 1 equations remain unchanged.
The principal vision term and the interaction of principal vision and principal involvement are
added to the Level 2 equations, as follows:

80
β0j = γ00 + γ01(Faculty-reported Principal Involvement)j [3.12] + γ02(Principal Math Background)j + γ03(Principal Gender)j + γ04(School Ranking)j + γ05(School District)j
+ γ06(Principal Vision for Instruction)j + u0j
β1j = γ10 + γ11(Principal Vision for Instruction)j + u1j
β2j = γ20 β3j = γ30 β4j = γ40
This yielded the following combined (or mixed) model:
Yij = γ00 + γ01(Faculty-reported Principal Involvement)j [3.13] + γ02(Principal Math Background)j + γ03(Principal Gender)j + γ04(School Ranking)j + γ05(School District)j
+ γ06(Principal Vision for Instruction)j
+ u0j + γ10 (Teacher-reported Principal Involvement)ij + γ11(Principal Vision for Instruction)j *(Faculty-reported Principal Involvement)ij
+ u1j*(Faculty-reported Principal Involvement)ij + γ20 (Teacher Gender)ij
+ γ30 (Teacher Experience)ij
+ γ40 (Teacher Race/Ethnicity)ij + rij
I expected that the coefficient for the interaction term between involvement and vision,
γ11, would be significant. This would indicate that where both variables are present, there is an
additional impact on instructional expectations, above and beyond the influence that each variable
may have on expectations separately.

81
CHAPTER IV
RESULTS
This study assesses principal instructional leadership in support of standards-based
mathematics instruction using survey- and interview-based measures. Use of three measures
allows for the investigation of associations between measures of what principals know, what
principals do, and mathematics teachers’ perceptions of instructional expectations. The validity of
the survey-based scale of instructional leadership tasks was assessed first, testing how the scale
functions in districts that are implementing standards-based reforms focused on mathematics
instruction. Next, the rubric for teachers’ perceptions of instructional expectations for standards-
based instructional practices was refined. Then, models were developed to combine the scale
scores, the rubric scores, and several measures of principals’ visions of high quality mathematics
instruction. Hypotheses were tested about the ways that principal vision and involvement in
instruction may predict instructional expectations.
Involvement in Instruction Scale
A survey-based measure of each teacher’s perception of their principal’s involvement
with the school’s instructional program was investigated for use in a standards-based context.
First, data were analyzed using a rating scale model, with ConQuest (Wu, Adams, & Wilson,
1997) software. This model provided initial evidence about model fit. Then, a multilevel rating
scale model was used in order to account for the fact that teachers clustered in the same school
are more likely to respond to survey questions in similar ways than those in other schools –
regardless of the similarity of the principals across schools. This model was estimated using
WinBUGS 1.4.3 (Spiegelhalter, Thomas, & Best, 2003) software. Finally, validity of the scale for
use as a measure of leadership for standards-based mathematics instruction was assessed.
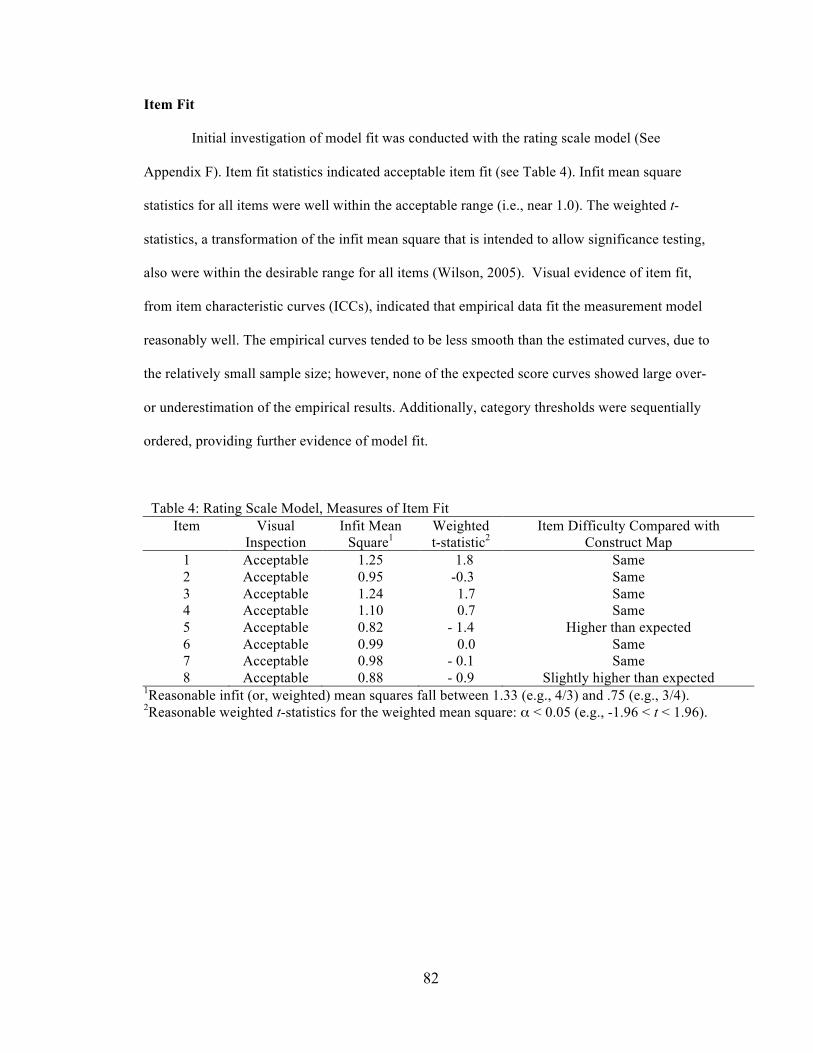
82
Item Fit
Initial investigation of model fit was conducted with the rating scale model (See
Appendix F). Item fit statistics indicated acceptable item fit (see Table 4). Infit mean square
statistics for all items were well within the acceptable range (i.e., near 1.0). The weighted t-
statistics, a transformation of the infit mean square that is intended to allow significance testing,
also were within the desirable range for all items (Wilson, 2005). Visual evidence of item fit,
from item characteristic curves (ICCs), indicated that empirical data fit the measurement model
reasonably well. The empirical curves tended to be less smooth than the estimated curves, due to
the relatively small sample size; however, none of the expected score curves showed large over-
or underestimation of the empirical results. Additionally, category thresholds were sequentially
ordered, providing further evidence of model fit.
Table 4: Rating Scale Model, Measures of Item Fit Item Visual
Inspection Infit Mean
Square1 Weighted t-statistic2
Item Difficulty Compared with Construct Map
1 Acceptable 1.25 1.8 Same 2 Acceptable 0.95 -0.3 Same 3 Acceptable 1.24 1.7 Same 4 Acceptable 1.10 0.7 Same 5 Acceptable 0.82 - 1.4 Higher than expected 6 Acceptable 0.99 0.0 Same 7 Acceptable 0.98 - 0.1 Same 8 Acceptable 0.88 - 0.9 Slightly higher than expected
1Reasonable infit (or, weighted) mean squares fall between 1.33 (e.g., 4/3) and .75 (e.g., 3/4). 2Reasonable weighted t-statistics for the weighted mean square: α < 0.05 (e.g., -1.96 < t < 1.96).

83
Multilevel Model
A multilevel rating scale model was used to estimate item, teacher, and school location
parameters, while accounting for the clustered nature of the data (see Table 5). Because a Rasch
model was used, all estimates could be placed on a single logit scale, and magnitudes of all three
sets of estimates could be compared. Results for item location estimates were clustered near the
center of the logit scale, with values ranging from -0.56 to 0.73. Standard errors were under 0.2,
which is considered acceptable.14 Results for teacher location estimates were more dispersed.
Teachers participating in this study report a wide range of degrees of principal involvement in
instruction with values for teacher location estimates ranging from – 4.17 to 4.46. School-level
parameters, measuring faculty perception of principal involvement, were also estimated using
WinBUGS software. School location estimates ranged from – 1.38 to 1.68. Schools from
Lakeside District tended to be in the lower half of the involvement scores15, while schools from
Adams District tended to be in the upper half of the distribution (See Appendix G).
Five values for teacher location estimates were outliers; one exceeded the third quartile
by more than 1.5 * IQR, and four were more than 1.5 * IQR below the first quartile. Associations
between outlier status and teacher background characteristics were investigated. All four teachers
who reported the least principal involvement had taught over five years. School district was not
associated with outlier status (the four teachers represented three districts). No school-level
location estimates were identified as outliers.
14 Standard errors of under 0.2 are considered acceptable for parameter estimates, since standard errors of this size mean that 95% confidence intervals will be approximately 0.8 logits. (Whether or not the confidence interval includes zero is not relevant here. The distances between parameters can be compared on the logit scale, but the location of zero is not meaningful.) 15 Schools in this district also showed the greatest variability among teachers’ perceptions of principal involvement. The five schools with the greatest standard errors for the school level location estimates were located in Lakeside District.

84
Table 5: Multi-level Rating Scale Model: Estimates of Item Locations
Item
Teacher Survey Item: To what extent do you agree or disagree that your principal (or assistant principal) does the following?
Item Parameter Estimate
Standard Error
1 Knows what’s going on in my classroom
0.73 (0.15)
2 Actively monitors the quality of mathematics teaching in this school.
0.49 (0.15)
3 Carefully tracks student academic progress in mathematics
0.40 (0.15)
4 Presses mathematics teachers to use what they have learned in professional development
0.10 (0.15)
5 Communicates a clear vision for mathematics instruction.
0.45 (0.15)
6 Sets high standards for student learning in mathematics
– 0.47 (0.15)
7 Sets high standards for mathematics teaching
– 1.14 (0.17)
8 Makes clear to the staff his/her expectations for meeting instructional goals in mathematics.
– 0.56 (0.16)
Category Threshold Parameters1
– 2.74 (0.32)
– 1.61 (0.27)
1.67 (0.28) 1In rating scale models, location of thresholds between categories are constant across all items.

85
The multilevel model provided an estimate of the variance between schools and the
variance within schools. Teacher-level variance was 4.542 and school-level variance was 1.203.
Using Equation 3.7, the percent of variance attributable to between-school differences and
potentially associated with differences between principals was 13.3%. While most of the variation
was within schools, as expected, the portion of the variance that may be attributable to differences
in principals was substantial enough to investigate.
Reliability
Reliability for the eight-item scale is high. In IRT, the person separation reliability
coefficient is 0.918; this reliability coefficient can be interpreted in the same way as Cronbach’s
alpha. In CTT, reliability is also high (Cronbach’s alpha = .936).
Standard Errors for IRT Estimates. The sample size is adequate to estimate item
locations with reasonably small standard errors, as noted above. However, standard errors for the
person location estimates are large due to the small number of survey items. Use of a multi-level
rating scale model adjusts the standard errors to account for expected dependency in the data.
This increases the size of the standard errors. The mean teacher location estimate in the sample is
.10 on the logit scale. Standards errors for teacher location estimates range from .83 to 1.40, with
a mean standard error of .98. This produces a 95% confidence interval for a typical teacher
location estimate of [–1.82, 2.02] on a logit scale.
Standard Error of Measurement (SEM). While IRT provides a standard error for each
teacher’s scale score, CTT provides the standard error of measurement (SEM), which is the same
across all teachers in the sample. The SEM is based on the idea that if individual teachers
responded to the eight involvement survey items repeatedly, a distribution of scale scores would
be obtained for each teacher, and the mean would be expected to be the true score for that teacher.

86
The SEM, σε , is intended to describe the variation that would be expected in repeated scores. It is
calculated from item-level data, not teacher-level data, and given by the following equation:
[4.1]
where
σ y is the standard deviation of the scale scores, and
ρ is the reliability of the scale
For this sample, the SEM is .213 (Cronbach’s alpha = .936, standard deviation for involvement
scale scores in the sample = .843). Consequently, for a teacher who perceived the mean level of
principal instructional involvement (i.e., 3.87 on a 5-point scale), the 95% confidence interval is
bounded by [3.45, 4.29].
By contrast, in IRT the standard error is the inverse of the information function. It varies
across person estimates, with extreme values for person estimates usually having the largest
standard errors.
Validity of the Scale
The involvement scale is designed to align with the hypothesized instructional
involvement construct, and IRT results are used to assess whether the scale measured all domain
content levels. Then, IRT analysis results are used to assess the degree to which the scale items
functioned as expected. This is evaluated through examination of the internal structure of the
scale, and through investigating whether items functioned in the same way across all districts in
the study.
Initial support for content validity is provided through use of the Four Building Blocks
process (Wilson, 2005). This process establishes a hypothesized theory underlying the variable
of interest before proceeding to measure that latent variable. Development of theory behind the
latent variable facilitates investigation of construct validity (Kane, 2001). The first step in the

87
Four Building Blocks process was the development of a construct map to describe the expected
levels of the instructional involvement construct: I hypothesized that at low levels of instructional
involvement, the principal articulated expectations for instruction and student learning, and at
higher levels, the principal articulated expectations and monitored school progress toward
instructional goals. This hypothesis was based on prior research as described above. In the second
step in the process, survey items were mapped to each construct level. This ensured that both
hypothesized levels of the construct would be measured. Items were assigned to levels based on
their content, and based on results from previous large-scale research (CCSR, 2006). Four items
were mapped to each level. Third, the outcome space was assessed. Because the scale used pre-
existing items, the outcome space was already defined. However, response categories were
collapsed from five to four due to lack of data in the lowest category. Fourth, an IRT
measurement model was used to assess the validity of the hypothesized structure.
Results show that the scale measures most domain content levels, however, improvement
could be made. There is more dispersion in the levels of principal involvement reported by
teachers than in item location estimates. On the Wright Map (see Figure 4), the item location
estimates are clustered between –1 and 1 on the logit scale. The category transition points are
clustered between –3.9 and 2.4 (i.e., item location estimates added to category threshold
estimates; see equation 3.1). Teacher reports of principal involvement, on the other hand, range
from less than –4 to greater than 4. This indicates that items do not measure all levels of the
construct. No items are well suited to measure the extreme levels of the construct, especially the
higher levels. Additional evidence from the information curve (Figure 5) also shows that the scale
provides the most precise information about a relatively narrow range of principal involvement.
The information curve is a diagram of the information function (i.e., the inverse of the standard
error for persons), and it shows the amount of information that the scale provides about a teacher
with a person location estimate at any given point on the logit scale. According to the information
curve, the scale provides the most information about teachers who report levels of principal

88
involvement from –2 to 0. The scale would be improved by the addition of items that ask teachers
about less frequently observed principal involvement tasks, items associated with levels of
principal involvement above 1.
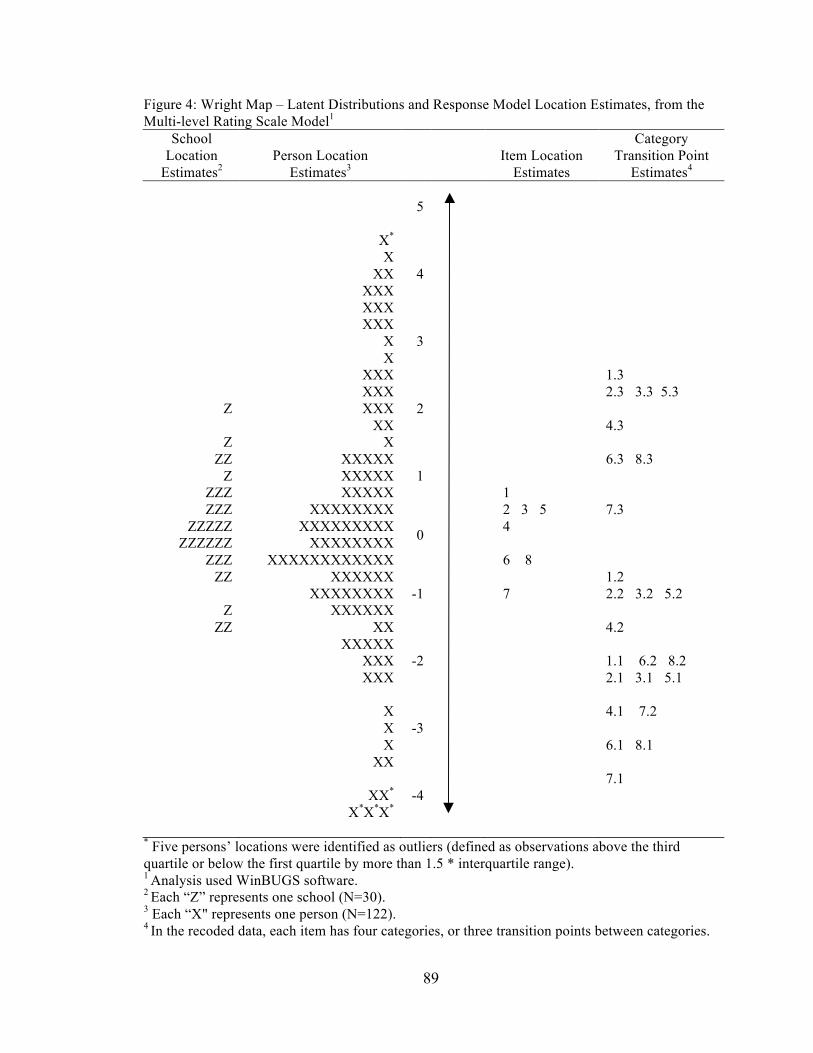
89
Figure 4: Wright Map – Latent Distributions and Response Model Location Estimates, from the Multi-level Rating Scale Model1
School Location
Estimates2
Person Location
Estimates3 Item Location
Estimates
Category Transition Point
Estimates4 5 X* X XX 4 XXX XXX XXX X 3 X XXX 1.3 XXX 2.3 3.3 5.3
Z XXX 2 XX 4.3
Z X ZZ XXXXX 6.3 8.3
Z XXXXX 1 ZZZ XXXXX 1 ZZZ XXXXXXXX 2 3 5 7.3
ZZZZZ XXXXXXXXX 4 ZZZZZZ XXXXXXXX 0
ZZZ XXXXXXXXXXXX 6 8 ZZ XXXXXX 1.2
XXXXXXXX -1 7 2.2 3.2 5.2 Z XXXXXX
ZZ XX 4.2 XXXXX XXX -2 1.1 6.2 8.2 XXX 2.1 3.1 5.1 X 4.1 7.2 X -3 X 6.1 8.1 XX 7.1 XX* -4 X*X*X*
* Five persons’ locations were identified as outliers (defined as observations above the third quartile or below the first quartile by more than 1.5 * interquartile range). 1 Analysis used WinBUGS software. 2 Each “Z” represents one school (N=30). 3 Each “X" represents one person (N=122). 4 In the recoded data, each item has four categories, or three transition points between categories.

90
Figure 5: Information Curve for the Involvement Scale
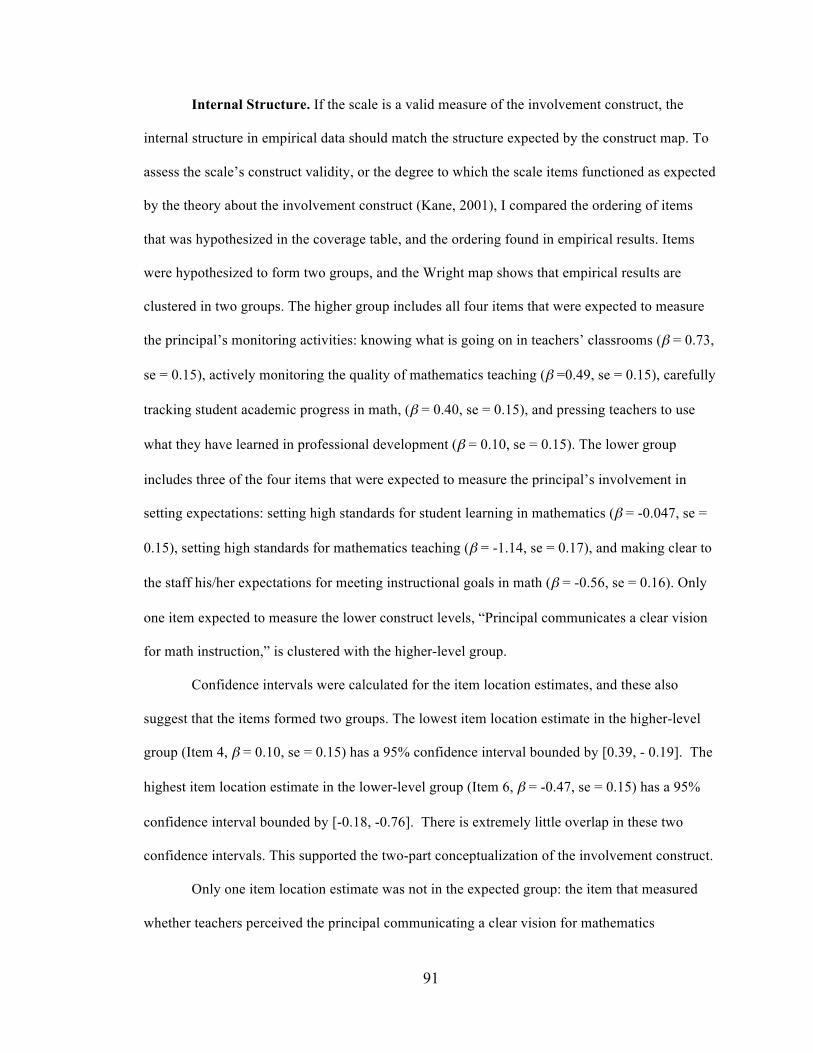
91
Internal Structure. If the scale is a valid measure of the involvement construct, the
internal structure in empirical data should match the structure expected by the construct map. To
assess the scale’s construct validity, or the degree to which the scale items functioned as expected
by the theory about the involvement construct (Kane, 2001), I compared the ordering of items
that was hypothesized in the coverage table, and the ordering found in empirical results. Items
were hypothesized to form two groups, and the Wright map shows that empirical results are
clustered in two groups. The higher group includes all four items that were expected to measure
the principal’s monitoring activities: knowing what is going on in teachers’ classrooms (β = 0.73,
se = 0.15), actively monitoring the quality of mathematics teaching (β =0.49, se = 0.15), carefully
tracking student academic progress in math, (β = 0.40, se = 0.15), and pressing teachers to use
what they have learned in professional development (β = 0.10, se = 0.15). The lower group
includes three of the four items that were expected to measure the principal’s involvement in
setting expectations: setting high standards for student learning in mathematics (β = -0.047, se =
0.15), setting high standards for mathematics teaching (β = -1.14, se = 0.17), and making clear to
the staff his/her expectations for meeting instructional goals in math (β = -0.56, se = 0.16). Only
one item expected to measure the lower construct levels, “Principal communicates a clear vision
for math instruction,” is clustered with the higher-level group.
Confidence intervals were calculated for the item location estimates, and these also
suggest that the items formed two groups. The lowest item location estimate in the higher-level
group (Item 4, β = 0.10, se = 0.15) has a 95% confidence interval bounded by [0.39, - 0.19]. The
highest item location estimate in the lower-level group (Item 6, β = -0.47, se = 0.15) has a 95%
confidence interval bounded by [-0.18, -0.76]. There is extremely little overlap in these two
confidence intervals. This supported the two-part conceptualization of the involvement construct.
Only one item location estimate was not in the expected group: the item that measured
whether teachers perceived the principal communicating a clear vision for mathematics
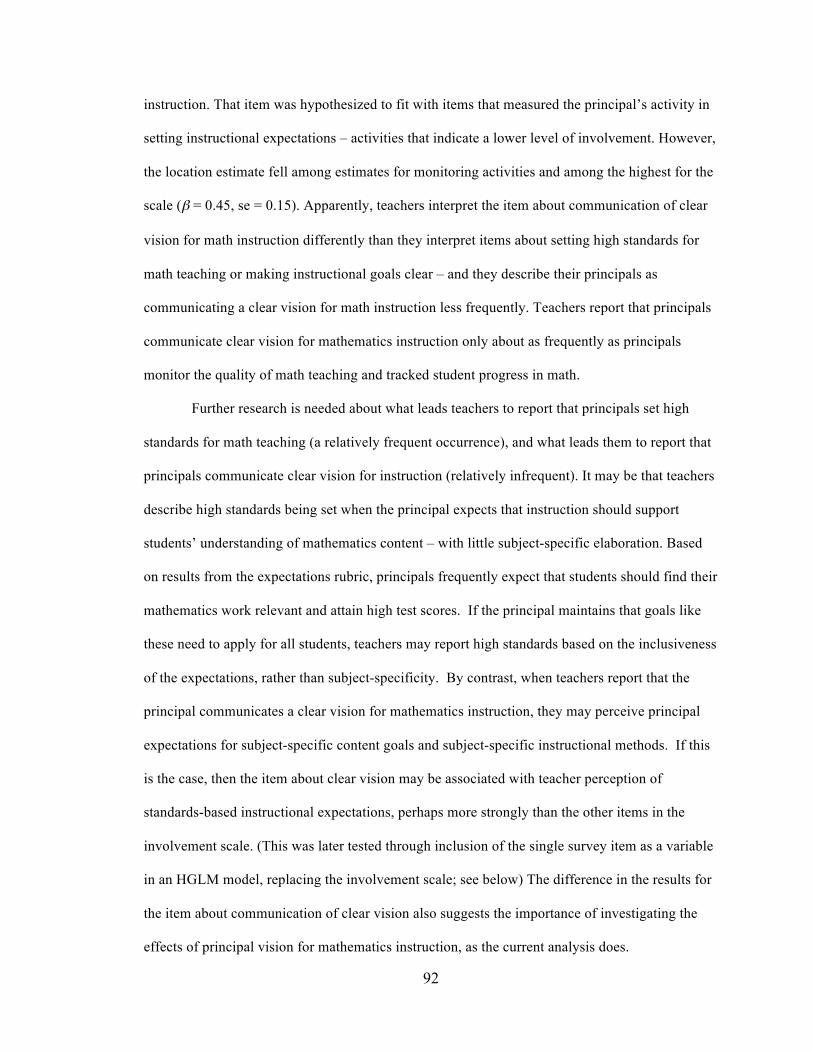
92
instruction. That item was hypothesized to fit with items that measured the principal’s activity in
setting instructional expectations – activities that indicate a lower level of involvement. However,
the location estimate fell among estimates for monitoring activities and among the highest for the
scale (β = 0.45, se = 0.15). Apparently, teachers interpret the item about communication of clear
vision for math instruction differently than they interpret items about setting high standards for
math teaching or making instructional goals clear – and they describe their principals as
communicating a clear vision for math instruction less frequently. Teachers report that principals
communicate clear vision for mathematics instruction only about as frequently as principals
monitor the quality of math teaching and tracked student progress in math.
Further research is needed about what leads teachers to report that principals set high
standards for math teaching (a relatively frequent occurrence), and what leads them to report that
principals communicate clear vision for instruction (relatively infrequent). It may be that teachers
describe high standards being set when the principal expects that instruction should support
students’ understanding of mathematics content – with little subject-specific elaboration. Based
on results from the expectations rubric, principals frequently expect that students should find their
mathematics work relevant and attain high test scores. If the principal maintains that goals like
these need to apply for all students, teachers may report high standards based on the inclusiveness
of the expectations, rather than subject-specificity. By contrast, when teachers report that the
principal communicates a clear vision for mathematics instruction, they may perceive principal
expectations for subject-specific content goals and subject-specific instructional methods. If this
is the case, then the item about clear vision may be associated with teacher perception of
standards-based instructional expectations, perhaps more strongly than the other items in the
involvement scale. (This was later tested through inclusion of the single survey item as a variable
in an HGLM model, replacing the involvement scale; see below) The difference in the results for
the item about communication of clear vision also suggests the importance of investigating the
effects of principal vision for mathematics instruction, as the current analysis does.

93
Differential Item Functioning. If items function differently depending upon the
characteristics of the respondents, the validity of the scale is threatened. When teachers perceive
similar degrees of involvement in instruction by their principals, each teacher should be likely to
assent to the same category of a particular item – regardless of the teacher’s characteristics. To
test this, two tests of DIF were used: the logistic regression (LR) likelihood ratio test and the
Generalized Mantel-Haenszel (GMH) statistic.
First, DIF was investigated for each of the four school districts (see Tables 6 & 7). No
consistent evidence of DIF was found, though several items showed evidence of DIF in one of the
tests for one district. The LR test of nonuniform DIF was significant for Item 8 in District 1; this
would suggest that for teachers with the same total scale score, teachers in District 1 responded
differently to Item 8 than teachers in other districts, and this difference varied depending upon
their total scale scores (Bonferroni post hoc, p < 0.05). The LR test of uniform DIF was
significant for Item 6 in District 2; this would suggest that for teachers with the same total scale
score, teachers in district 2 responded differently to item 6 than teachers in other districts, and the
difference was uniform for all teachers in district 2 (Bonferroni post hoc, p < .05). The LR test of
uniform DIF was also significant for Item 8 in District 3. However, the GMH statistic was not
significant for any of these items. In fact, the GMH statistic did not suggest DIF for any item in
any of the four districts. There is no single standard for interpreting these instances of potential
DIF. However, in no cases is the evidence for DIF substantiated by both the GMH and LR test.
All items are considered to function acceptably in the scale. Additionally, DIF was investigated
for teacher gender (see Tables 8 & 9). No DIF was indicated by either the GMH statistics or LR
tests.
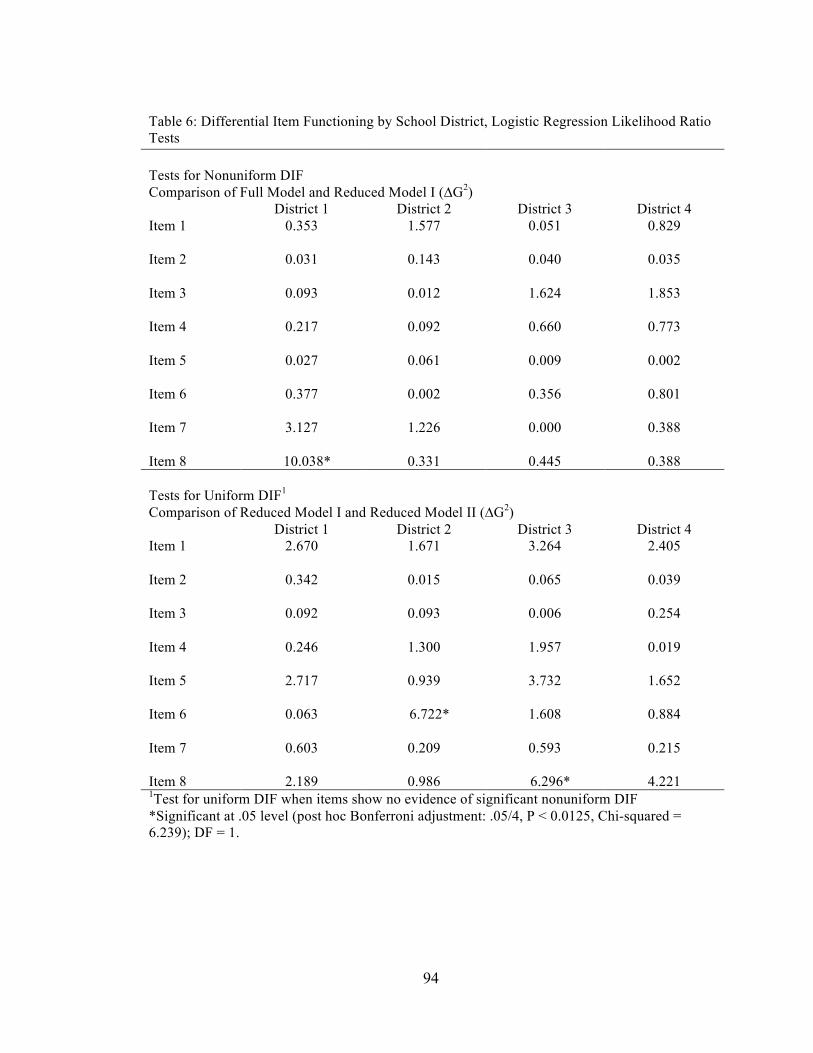
94
Table 6: Differential Item Functioning by School District, Logistic Regression Likelihood Ratio Tests Tests for Nonuniform DIF Comparison of Full Model and Reduced Model I (∆G2)
District 1 District 2 District 3 District 4 Item 1 0.353 1.577 0.051 0.829
Item 2 0.031 0.143 0.040 0.035
Item 3 0.093 0.012 1.624 1.853
Item 4 0.217 0.092 0.660 0.773
Item 5 0.027 0.061 0.009 0.002
Item 6 0.377 0.002 0.356 0.801
Item 7 3.127 1.226 0.000 0.388
Item 8 10.038* 0.331 0.445 0.388
Tests for Uniform DIF1 Comparison of Reduced Model I and Reduced Model II (∆G2)
District 1 District 2 District 3 District 4 Item 1 2.670 1.671 3.264 2.405
Item 2 0.342 0.015 0.065 0.039
Item 3 0.092 0.093 0.006 0.254
Item 4 0.246 1.300 1.957 0.019
Item 5 2.717 0.939 3.732 1.652
Item 6 0.063 6.722* 1.608 0.884
Item 7 0.603 0.209 0.593 0.215
Item 8 2.189 0.986 6.296* 4.221 1Test for uniform DIF when items show no evidence of significant nonuniform DIF *Significant at .05 level (post hoc Bonferroni adjustment: .05/4, P < 0.0125, Chi-squared = 6.239); DF = 1.

95
Table 7: Differential Item Functioning, by District, Generalized Mantel-Haenszel Statistics1 Probability of DIF2 District 1 District 2 District 3 District 4 Item 1 0.194 0.255 0.025 0.185 Item 2 0.567 0.773 0.640 0.993 Item 3 0.821 0.434 0.368 0.118 Item 4 0.841 0.434 0.524 0.879 Item 5 0.571 0.290 0.273 0.154 Item 6 0.550 0.059 0.106 0.548 Item 7 0.216 0.668 0.687 0.577 Item 8 0.067 0.719 0.186 0.054 1Analysis conducted using SAS 9 software. 2No statistics were significant at .05 level (post hoc Bonferroni adjustment: .05/4, P< 0.0125)

96
Table 8: Differential Item Functioning by Gender Logistic Regression Likelihood Ratio Tests,* N=156 Item Nonuniform DIF1 Uniform DIF2 Item 1 2.141 1.028 Item 2 0.791 1.702 Item 3 0.209 0.251 Item 4 3.281 0.002 Item 5 0.105 1.661 Item 6 2.523 0.010 Item 7 0.013 0.273 Item 8 0.065 0.045 1Comparison of Full Model and Reduced Model I (∆G2) 2Comparison of Reduced Model I and Reduced Model II (∆G2) *No tests were significant at .05 level (with Bonferroni adjustment: Chi-squared = 6.239); DF=1.
Table 9: Differential Item Functioning, by Gender Generalized Mantel-Haenszel Statistics,*1 N=156
Alternative Hypothesis DF Value Probability of DIF Item 1 General Assoc. 3 1.6701 0.6436 Item 2 General Assoc. 3 6.5303 0.0885 Item 3 General Assoc. 3 2.1743 0.537 Item 4 General Assoc. 3 0.6562 0.8835 Item 5 General Assoc. 3 2.2620 0.5198 Item 6 General Assoc. 3 1.1900 0.7554 Item 7 General Assoc. 3 0.5436 0.9092 Item 8 General Assoc. 3 0.8245 0.8436 1Analysis conducted using SAS 9 software. *No statistics were significant at .05 level (incl. Bonferroni adjustment: .05/4, P< 0.0125)

97
Comparison with Results from Prior Research
Results were also compared with findings from previous research (CCSR, 2006). This
serves not only as a test of validity, but also an investigation into the degree that instructional
leadership functions similarly in standards-based mathematics contexts and in non-subject-
specific contexts. Two methods were used: Spearman’s rank order correlation and visual
comparison of relative item locations. A Pearson correlation could not be used to compare item
locations because the scale used in the CCSR analysis was not identical with the scale in this
analysis. The CCSR scale used an additional item, and this analysis used math specific phrasing
in seven of the eight items. Unless scale items were exactly the same in number of items and in
content, item location estimates could not be compared numerically. However, it was possible to
compare the ordering of similar items in each scale using Spearman’s rank order correlation, and
that correlation was .905 (see Table 10). This indicated substantial agreement between the
empirical structure for the instructional involvement construct in both analyses. Items that
represent lower levels of the construct in earlier research are, in fact, more frequently reported by
teachers in the current study; items that measure higher levels of the construct in earlier research
are less frequent. This provided initial evidence that the set of survey items functions in the same
way when used in a subject-specific, standards-based setting as in a broader sample.

98
Table 10: Ordering of Items by Difficulty in Empirical Results and in Previous Research
Item Number
Survey Item
CCSR Ranking
Empirical Ranking
(Wright Map) D
1 Knows what's going on in my classroom
8th 8th 0
2 Actively monitors the quality of math teaching
7th 7th 0
3 Carefully tracks student academic progress in math
6th 5th 1
4 Presses math teachers to use what they have learned in prof. development
5th 4th 1
5 Communicates a clear vision for math instruction
4th 6th 2
6 Sets high standards for student learning in math
3rd 3rd 0
7 Sets high standards for mathematics teaching
2nd 1st 1
8 Makes clear his/her expectations for meeting instructional goals in math
1st 2nd 1

99
Second, the pattern of relative item locations in these results, using MIST data, was
visually compared with the pattern in CCSR results. As Figure 6 indicates, the relative locations
of the eight items in each set of results are fairly similar. The overall pattern across the eight
items shows item locations decreasing in each set, meaning that Item 8 is easier for teachers to
agree with than Item 1, and they assented to it more frequently. Only two differences stand out.
In the MIST results, Items 5 and 7 appear in different locations relative to the rest of the items
than in results for the CCSR analysis. Item 5 asks teachers whether the principal communicated a
clear vision for mathematics instruction. Teachers in the MIST sample were less likely to agree to
Item 5 than to the adjacent items (i.e., the item location estimate was higher than expected), a
different pattern than in the CCSR sample; this was also noted above in the comparison of
hypothesized and empirical results for this analysis. Additionally, teachers in the MIST sample
were more likely to agree to Item 7 than adjacent items, again a different pattern than in the
CCSR results. Item 7 asks teachers the extent to which they agreed that the principal set high
standards for mathematics teaching. This suggests that teachers in the MIST sample perceive
challenging standards for mathematics teaching – but less frequently perceive a clear vision for
implementing those standards. Though no survey data was available about mathematics’ teacher
perceptions before the district instructional reforms, it may be that the district standards-based
mathematics reform initiatives have led to teachers’ sense that standards for mathematics teaching
are set high. For all other items, teachers interpret the same questions as relatively easy to agree
with, and the same questions as more difficult to agree with, suggesting that the other
instructional leadership tasks measured in this scale occur in the same patterns in both MIST and
CCSR samples.

100
Figure 6: IRT Item Location Estimates Based on MIST Data and CCSR Data1
1IRT estimates are not numerically comparable when they are based on different samples. However, relative locations of the eight items in each set of results can be compared.

101
Overall Validity of the Scale for Use in Standards-based Contexts. Bryk, Camburn,
and Louis (1999) hold that the combination of results for item location estimates, item fit as
measured by infit mean square statistics, and reliability measured by the person separation
reliability coefficient provide effective means to assess the reliability and validity of a measure.
In this analysis, all three of these statistics indicate a reliable and valid scale. At the same time,
the Wright Map and information curve suggest that the scale does not effectively measure the
range of levels of principal involvement that is reported by teachers. The scale would be
improved by the addition of more items about less frequently observed principal involvement
tasks. The two-part structure developed in this analysis builds greater understanding of the
involvement construct, and it provides direction for development of additional items.
Expectations for Standards-based Instructional Practice
This study posits that instructional leadership has the potential to influence teachers’
instructional practices through the nature of the expectations that principals set for classroom
instruction (Stein & Nelson, 2003). The study investigates several dimensions of instructional
leadership, hypothesizing that the principal’s involvement in instruction and the principal’s
instructional vision influence the principal’s expectations for instruction. In order to test the
associations between these dimensions, the study measures the nature of the instructional
expectations that teachers perceive, using a rubric designed for that purpose. As described above,
the rubric differentiates between form- and function-oriented expectations for instruction
(Spillane, 2000b), assessing the degree to which expectations are aligned with standards-based
instruction and able to support improved teacher instructional practice (Nelson & Sassi, 2000,
2005).
Refinement of the Rubric
The rubric for teachers’ perceptions of principals’ instructional expectations was refined

102
through iterative coding (Corbin & Strauss, 2008) and through conferences with other members
of the MIST research team, in order to better measure the degree to which teachers report
standards-based instructional expectations from their principals (see Table 11). I considered the
creation of additional rubric levels, the revision of the function-oriented levels, and the
implications of principal expectations for teachers to use the district’s curriculum and pacing
guides.

103

104

105
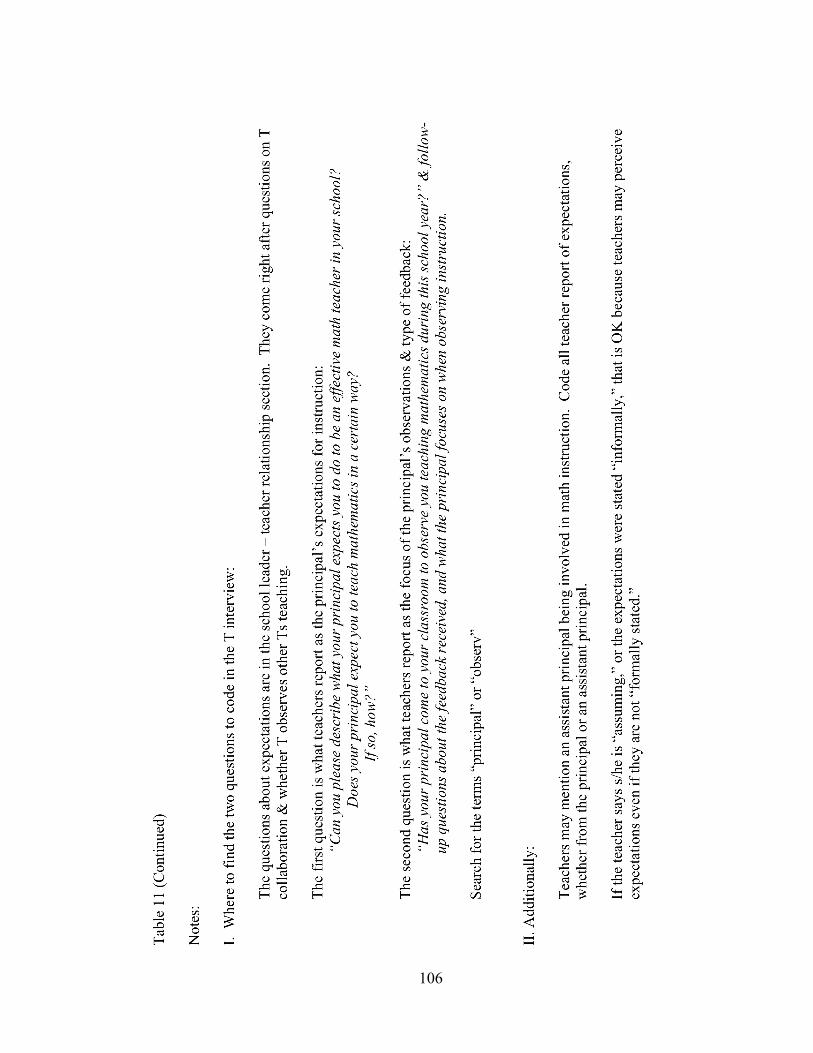
106

107
108
Possible Addition of Rubric Levels. Creation of more fine-grained rubric levels was
investigated. If a relationship between instructional leadership dimensions exists, it would be
more precise (i.e., standards errors may be smaller) if the expectations rubric captured more
variation through use of an additional level. Level 4 was designed to include several types of
form-oriented instructional expectations. If teachers described the principal as elaborating on an
expectation for a single standards-based practice, or if they reported that the principal expected
several standards-based practices, Level 4 was assigned. Further differentiation of Level 4 was
explored. Those teachers who listed three or more practices may be describing expectations for a
more coherent set of instructional strategies, and those who elaborated on one practice may be
describing stronger expectations. Yet, little theory was available to suggest whether one type
indicated more developed instructional expectations than the other.
It may be useful to add a rubric level for expectations that included several instructional
practices and elaborated on at least one, since these reports suggest that the principal’s
expectations have both greater coherence and greater strength. To explore this possibility, Level 4
descriptions of principal expectations were re-coded for whether they included at least three
standards-based practices (e.g., practices such as use of group work, hands-on tasks, higher-level
questioning strategies, manipulatives, lessons with real-life connections, teacher facilitation of
student learning rather than lecture, and use of the district’s standards-based mathematics
curriculum). Descriptions of expectations were also re-coded for whether they contained
elaborations about at least one standards-based practice. Then, reports that included at least three
standards-based practices and elaboration of at least one were identified. With sufficient data,
quantitative analysis could examine the effect of splitting Level 4. In the present sample,
however, only five reports of multiple and elaborated expectations were found. No change to the
rubric was made.

109
Re-examination of Levels Indicating Function-based Expectations. Levels 5 and 6 of
the expectations rubric were intended to describe function-oriented expectations. Initially, Level 5
was used when the principal clearly expected standards-based practices to be used for the
function intended by mathematics education reformers (i.e., to support students’ growth in
mathematical reasoning and conceptual understanding). Initially, Level 6 was only used if the
principal provided a rationale for the expectations based on the goals of standards-based reforms
or provided specifics about how to implement the standards-based strategies. For instance, at
Level 4, the principal might have elaborated, perhaps maintaining that students learn well from
peer explanations. However, if the principal wanted teachers to use student grouping so that
students could work together to investigate math problems and develop solution strategies, the
expectations would have been coded at Level 5. At Level 6, the principal might expect group
work so that students have the opportunity to challenge each other’s reasoning and build greater
understanding of their solution strategies. No examples of Level 6 expectations, as initially
conceptualized, were found in the data.
During data analysis, conceptualizations of Levels 5 and 6 were both revised. Analysis of
interview data revealed a number of cases in which standards-based function was implied but not
explicitly stated. Level 5 was revised to include inferences of a function-oriented view of
standards-based instruction. For instance, a teacher may state that the principal expects to see
students struggling to reason through a math problem together and doing more than memorizing
rules or formulas (Reed, Goldsmith & Nelson, 2006), but s/he may not articulate the benefits of
such struggle. One teacher at Aspen Middle School in the Lakewood District reports that the
principal understands the standards-based curriculum to some degree, and understands that group
work is a part of standards-based instruction even if it looks “rather chaotic” at times. This
principal is willing to accept classrooms that look and sound less organized than in conventional
instructional practices, and the teacher reports that this is connected with an understanding of the
goals of standards-based instruction. As this teacher explains, “You know, he understands CMP,

110
you know, to an extent, and the … group work. I feel that when he comes in you know, if we’re
doing, because again, CMP many times you’re doing group work and it can look rather chaotic …
I think he tends to understand that.” While there is no explicit statement of function-based goals
for students’ group work (e.g., multiple solution strategies or mathematical argumentation),
nonetheless, the standards-based function is implied. This is coded at the revised Level 5. By
contrast, another teacher reports that her principal wants to see students talking with one another
and “doesn't mind a little bit organized noise or organized chaos,” but she does not report any
connection with the standards-based curriculum or standards-based instructional goals. This
continues to be an indicator of Level 4 expectation – an elaboration of the expectation for
students to work together in groups but not necessarily to achieve the goals of standards-based
mathematics instruction.
As revised, Level 6 expectations are more direct than Level 5, but they do not necessarily
elaborate about how or why teachers should implement standards-based instructional strategies.
For example, a teacher at Alder Middle School reports that the principal expects students to have
group discussions in order to present their work to the class and justify their answers. This brief
statement contains a clear expectation for student discussion to include mathematical reasoning
and justification of solutions. This principal has grasped one of the key functions of student
discussion and communicates it as an expectation to teachers. Standards-based mathematics
instruction does not involve class discussion simply to increase student engagement, or to allow
students to hear explanations in the words of their peers. Rather, students are expected to use
discussion to construct mathematical arguments in support of their responses. Correct answers,
alone, are insufficient. Explanations of answers based in mathematical concepts, and clearly
communicated to others, are also required. Teachers in this principal’s school are likely to have a
clearer understanding of the nature of the principal’s expectations, because the principal explicitly
communicated both the expectation for standards-based practice and the function of the practice.
Teachers have been given a clearer benchmark for their instructional practice.

111
Curriculum and Pacing. The location of curriculum and pacing on the rubric was
reconsidered twice. The initial version of the rubric listed use of district curriculum and use of
district pacing as indicators of Level 3 (i.e., standards-based instruction), This was reconsidered
in conference with two other MIST team members. A unanimous decision was reached to
consider the mention of pacing by itself as an indicator of Level 2 expectations. Pacing concerns
speed of instruction, not content of instruction. Use of curriculum remained as a Level 3
indicator. All districts have adopted a standards-based curriculum, and effective use of the
curriculum involves implementation of standards-based instructional practices.
After pacing had been removed from Level 3, additional coding of interview data led to
further re-evaluation of the appropriate rubric level for expectations about the district curriculum.
Some teachers state that principals expect them to “follow the curriculum” or “cover the
curriculum.” The phrase “cover the curriculum” sounds similar to “covering” content standards
and/or adhering to a pacing schedule, and the latter are not indicators of standards-based
practices. Therefore, the location of curriculum on the rubric was considered further. In some
cases, use of a particular curriculum is named along with other standards-based expectations and
appeared to be part of standards-based practices. For instance, one teacher describes the
expectation that she follow the curriculum and structure the class so that students’ ideas direct the
discussion. This is clearly a standards-based expectation. It was only when curriculum was
named alone that it seems to require more inference. However, the question is really about
whether curriculum should be coded at Level 3/4 or at Level 5/6, that is to say, whether it is an
example of form- or function-oriented expectations. In reality, the same challenge exists in
coding other expectations, as well, because any standards-based instructional strategies (e.g.,
group work, teacher facilitation, student discussion) can be implemented in procedural ways
without the intended use of standards-based methods (Stein, Grover, & Henningsen, 1996;
Garrison, 2010; Spillane & Zeuli, 1999). Therefore, use of district curriculum remained at least a
Level 3 indicator. If the principal specifies standards-based goals (e.g., perhaps stating that the

112
district curriculum should be used because it provides mathematical tasks that allow students to
struggle with new mathematical concepts), then the expectations are coded at Level 5 or 6.
Otherwise, expectations for use of district curriculum are coded at Level 3 or 4, indicating form-
oriented expectations. A total of 37 out or 122 teachers name the use of a particular curriculum
as an administrator’s expectation for instruction; about half of these teachers report expectations
at Level 3 (naming only use of curriculum) and half at Level 4 (naming it along with other
expectations for standards-based instructional practices).
Description of Typical Responses at Each Level
A total of 29 teachers (24%) report principal expectations for instruction at Level 2,
meaning that they report some expectations, but these expectations are not grounded in standards-
based instructional practices. Two common themes are classroom management and test scores.
Teachers who report this level of instructional expectations tend to state that the principal expects
high test scores or wants to make sure the students “were moving” and that “gaps were closing.”
Nine teachers report that the principal’s expectations involves only raising student test scores;
three of these are from the same school, Cedar Middle School. Another common theme is
classroom organization – clear objectives for the sake of effective classroom management or
daily agenda posted.
At Level 3, teachers report that the principal expects one aspect of the district’s
standards-based instructional reform to be implemented. Of the 42 teachers (34%) at this level,
18 name use of district curriculum, while others name use of a particular standards-based
professional development course, group work, or hands-on activities. At this level, there is no
indication that the principal elaborates on the strategy or described how s/he intends the strategy
to be implemented.
When teachers report instructional expectations at Level 4, they state that the principal
names more than one expected strategy or describes one strategy in more detail. A total of 42

113
teachers (34%) describe principal expectations at this level. For instance, one reports that the
principal clearly states that students should be working in groups, even early in the semester when
the teacher may not feel like she knows the students well enough to choose the best groups for
them. Another administrator expects teachers to have students work in groups and monitor their
work, ensuring that they are not just talking socially with friends. In these examples, there is no
indication about the content of the conversation, except that it should be broadly about
mathematics. It is not clear whether these principals expected teachers to achieve the functions of
standards-based mathematics instruction, but both examples indicate that the principal’s
expectations go beyond a cursory naming of a standards-based strategy.
Five teachers (4%) report principal instructional expectations at the revised Level 5.
These teachers’ comments indicate that principals are likely to have function-based expectations
for instruction. One or more of the goals intended by standards-based educational researchers is
implied. For instance, one teacher reports that her principal looks for some students asking
questions of the class and other students responding. There is no indication that the principal had
expectations about the specific content or depth of the questions. However, students are not
simply to be seated in groups, working on math and turning to the teacher when they have a
problem. Rather, they are to take the initiative to construct questions about their work and to
suggest their own answers. When principals begin to look for these particular kinds of classroom
discourse, they suggest that they are moving beyond the forms for standards-based reform
(Nelson & Sassi, 2006). One teacher (1%) reports expectations at the revised Level 6; as
described above, the principal at Level 6 wants students engaged in group discussions and
presentations, and justifying answers and responses. Three teachers (2%) report expectations at
Level 1, stating that the principal gives them great leeway in their instructional decisions.
Differences between Levels 4, 5, or 6, can be illustrated by expectations of several
principals’ who all maintain that some noise in the classroom is useful. At Level 4, the principal
wants to see students talking together. As one teacher explains, "Some people [say]… 'Oh, in

114
order for kids to learn it has to be quiet.' He's not like that. You know, he wants to see kids
talking. He doesn't mind a little bit of organized noise, or organized chaos we could call it" The
noise is expected to have a purpose – to be “organized” noise – yet the purpose is unspecified. At
Level 5, inferences about the goals of the group work are provided. The “chaotic” classroom with
multiple discussions happening among students, described above, is specifically connected to the
goals of a standards-based curriculum. While goals are not explicitly delineated, they are implied
by the teacher reporting that the principal allows loud classrooms because he understands the
standards-based curriculum. By contrast, at Level 6, instructional expectations from the principal
are explicitly linked to a function-based understanding of standards-based instruction. Again, the
teacher describes the principal’s expectations for noise in the classroom, saying, "It's very clear
with him that he doesn't, you know, expect 'sit down, be quiet, work on your own' kinds of math
problems. He is very clear, upfront, that he wants the kids to be engaged in high rigor, having
group discussions and presentations, and justifying answers and responses. So that's something
that he's always looking for.” However, no inference is required here. This teacher references the
specific activities in which the principal expects students to engage. Students are not only to
work together, but they are to present their mathematical answers to the class and justify their
reasoning. These are among the key goals of standards-based mathematics instruction. The
principal expects standards-based instructional practices to achieve the goals intended by
reformers.
Variation in teachers’ reports of instructional expectations across the four school districts
is not statistically significant (chi-squared = 20.3021, df = 15, p-value = 0.16).
Validity of Selection of Interview Questions
Teachers’ responses to two sets of interview questions were selected to provide data
about principals’ expectations for classroom instruction. One set of questions asks directly about
the principals’ instructional expectations. Interviewers first ask, “Can you please describe what

115
your principal expects you to do to be an effective math teacher in your school?” Then, in
follow-up question they ask, “Does your principal expect you to teach mathematics in a certain
way?” The follow-up was not asked in every interview, but when it was, teachers often simply
respond with “no” – even if they describe instructional expectations for group work or hands-on
activities in response to other questions. For example, at Maple Middle School, while all teachers
in the study report instructional expectations, and the mean level of expectations is 3.8, only one
teacher states that the principal expects her to teach in a certain way. Three teachers respond that
he does not expect them to teach in any certain way, and two teachers were not asked the follow-
up question. Apparently, teachers interpret “teach mathematics in a certain way” narrowly. The
follow-up question, by itself, would not provide sufficient information about instructional
expectations.
The second set of questions that was coded concerned classroom observation and
feedback. In 17 out of 122 cases (14%), teachers provide information about expectations in these
questions that they have not discussed in the earlier set of expectations questions. One teacher
describes feedback she has received about the kinds of questions that the principal wants teachers
to ask students. This principal wants to hear teachers asking for answers to math problems. The
teacher reports that he wants to hear “Could there be another answer? Is there another
possibility?” Another teacher reports that the principal has given her feedback about the
importance of group work in every lesson – no exceptions. However, use of information from this
question requires a caveat: Information was only coded if it was a principal expectation, rather
than just a teacher description of his/her instruction on a day the principal observed. For example,
one teacher relates an activity in which students acted out rational expressions, some standing on
a table to represent the numerator, some under the table to represent the denominator, and then
students wrote their own rules for simplifying rational expressions. No classroom observation had
been scheduled, and when the principal walked into the classroom to observe on that day, the
teacher was concerned that he might not be pleased. Her concern shows that, while the activity
116
perhaps represents the teacher’s conception of good instruction, it does not typify instructional
expectations articulated by the principal. It was not coded on the expectations rubric.
To examine whether the two sets interview questions captured all the interview data
about principals’ instructional expectations, several additional questions were scanned, from the
section of the interview about the teacher-school leader relationship. Three of these were further
prompts to the first principal expectations question: teachers were asked about expectations for
collaboration with other teachers, what happens if they do not fulfill the principal’s expectations,
and whether they have ever disagreed with the principal’s expectations. Two other questions
asked teachers whether test scores are used to evaluate their performance, and how the principal
supports their teaching. These additional questions provide little additional data about principal
expectations for instruction. One teacher states that the principal gives teachers flexibility to teach
as they think best, but then states that test scores were used to evaluate her performance; this
changes her rubric score from level one to level two. One teacher does not wait to be asked about
classroom observation and feedback, but describes the principal’s feedback about instruction
when asked about how the principal supports her teaching. In total, rubric scores for two out of
the 122 teachers are changed by data from the additional questions. This suggests that the
questions listed for coding on the expectations rubric capture the interview data about principals’
instructional expectations.
Reliability
A double coding procedure was used to establish inter-rater reliability at the start of
coding the interviews and in the middle of coding. When the interviews had been placed in
random order so that no one district would be scored at one time, primary and secondary coders
began double coding. Both coders scored interviews until they achieved .90 identical scores on
ten consecutive interviews, with no scores differing by more than one level. The primary coder
then continued coding until half of the interviews had been coded. Then, the primary and
117
secondary coders repeated the inter-rater reliability process, double coding until achieving .90
identical scores.
The second coder was a former elementary school teacher and district administrator; she
had no previous familiarity with the NCTM (2000) Standards and no experience with standards-
based mathematics instruction. She was trained to use the rubric through discussion with the
primary coder and review of excerpts from Reed, Goldsmith, and Nelson (2006) and Spillane and
Zeuli (1999), along with Spillane (2000), and Spillane and Callahan (2000). While the second
coder agreed with the goals of standards-based mathematics instruction, she found that
identifying the differences between form-based and function-based comments in interviews was
the most challenging coding task. Identifying expectations at Level 5 and 6 was difficult.
Discussions between coders led to the addition of clarifying notes in section III of the rubric.
Faculty Reports of Principal Expectations
This analysis investigates the instructional expectations reported by individual teachers in
the study, and it investigates the level of expectations reported by the school faculty. In order to
investigate the latter, scores for teachers’ descriptions of instructional expectations were averaged
across each school. Figure 7 plots the mean value for each school, along with the maximum and
minimum values. Results suggest that in many schools, the majority of teachers perceive similar
expectations from the principal.
In two schools, all teachers report Level 4 expectations. In seven other schools, all
teachers report Level 3 or 4 expectations. In another four schools, the majority of teachers report
Level 2 expectations; in each of these four cases, all teachers in the school report Level 2
expectations except for a single case that reports Level 4.
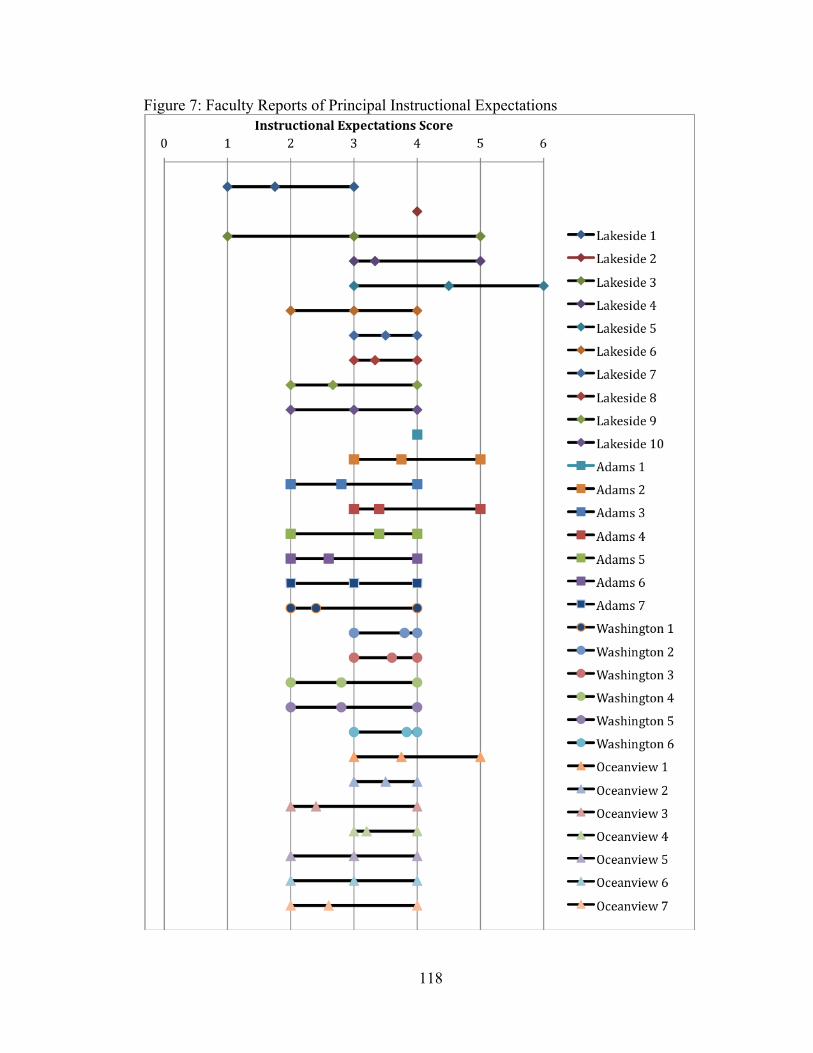
118
Figure 7: Faculty Reports of Principal Instructional Expectations

119
In other schools, faculty reports of principal instructional expectations show more
variability. Teachers’ reports range across three consecutive rubric levels in 15 schools. At one
school, the three participating teachers report Levels 1, 3, and 5 expectations. At one other school,
the two participating teachers report Levels 3 and 6.
Within school differences in teachers’ perceptions of principals’ instructional
expectations may be due to factors at the school. For instance, a teacher may report more
developed expectations than other faculty at the school if the teacher’s classroom has been
observed just previous to the interview, and feedback is fresh in her mind. Additionally, perhaps
the teacher’s classroom is closer to the main office, and the principal visits more often because of
proximity, or perhaps the principal has expressed expectations for mathematics instruction more
to the teacher because of a particular lesson that he has observed in her classroom. These reasons
do not exhaust the possibilities. Within school differences may also be due to interviewing
techniques. Interviewers may not have consistently probed for exhaustive listing of principal
expectations. This is a limitation of the data.
At the same time, because teachers respond to a number of interview questions that all
provided information about principal expectations for mathematics instruction, teachers have a
number of opportunities to add to their responses, and interviewers have a number of
opportunities to probe. Furthermore, interviews were coded holistically, so that if a teacher
responds with three different form-oriented expectations in response to three of the questions, her
response is coded as a Level 4. If one of the expectations contains inferences to standards-based
functions, then the entire response is coded as Level 5.
Vision of Standards-based Mathematics Instruction
Three elements of principal vision were measured: first, principals’ descriptions of the
role of the teacher in during mathematics instruction; second, their descriptions of high quality
mathematics tasks; and finally, the kinds of classroom discourse that they look for. Two sub-

120
rubrics for classroom discourse (“Patterns and Structure” and “Nature of Talk”) were combined,
and the highest score was used as the classroom discourse score. At the time of the coding for this
analysis, the vision rubrics were recently refined. Consensus coding with MIST team members
who were trained in use of the Munter rubrics was conducted for over 50% of the data.
In seven schools where both the principal and an assistant principal were interviewed,
scores from the interview with the highest scores are used. In three cases, the principal has higher
scores; in four cases the assistant principal has higher scores. Combination of scores for
principals and assistant principals acknowledges that leadership was “stretched over” a number of
people (Spillane, Halverson, & Diamond, 2001; 2004).
Description of Typical Responses at Each Level
In 27 of the 30 schools (90%), administrators describe the role of the teacher when
discussing their vision of high quality mathematics instruction, but few describe advanced vision
in this element. The lack of advanced descriptions of the role of the teacher may not be
surprising, since administrators’ work differs from that of teachers (Nelson, 1999) and may leave
them more likely to articulate advanced views of the classroom discourse and mathematical tasks
than teacher role. Administrators in only one school describe a Level 4 vision of teacher role,
explaining that the teacher should be questioning students in order to push them to draw their own
conclusions rather than telling students the answers to problems. This administrator envisions a
teacher who proactively designs questions that support students in thinking more deeply about
connections between mathematical concepts. In two additional schools, administrators describe
the teacher’s role at Level 3, envisioning a teacher who allows students to think through
connections between mathematical ideas with each other in new ways, but without describing
purposeful teacher intervention to support students’ thinking. One of these administrators said, “I
would rather see kids trying to figure it out on their own first and then having teachers kind of
walk around and [give] kids the opportunity to ask each other questions … It’s very powerful

121
because so much of it requires the teacher to hold back. And, and allow struggle time.” In the
majority of schools (n=19, 63%), administrators describe a Level 2 vision for the role of the
teacher, saying that teachers need to ensure that they have taught students how to work together
in groups, or that after teachers explain a lesson, students should then work together to apply the
new ideas to their work. However, at Level 2, the teacher is responsible to provide initial
explanations and then monitor students’ group work; students are expected to apply what they
have learned, but they are not expected to struggle with mathematical problems to arrive at new
understandings. In five schools, administrators envision a conventional role for the teacher (Level
1) in which the teacher presents information to students without student discussion.
In the same proportion of schools (27 out of 30), administrators discuss the nature of
classroom discourse, describing either the structure of classroom discourse (e.g., students talking
in small groups, or whole class discussion) and/or describing the nature of classroom discussion
(e.g., students explaining calculations, questioning conceptual arguments, etc.) In one school, the
administrator describes Level 4. This principal envisions students arriving at multiple solution
methods, using a document camera to demonstrate how they arrive at their answers during whole-
class discussion, and questioning each other about their evidence for using a particular strategy.
In 14 schools, administrators describe Level 3 vision for classroom discussion. These
administrators describe whole class discussion as a critical part of high quality math instruction
and/or they describe students questioning each other in small groups. They sometimes mention
students using a document camera and explaining their thinking during whole class discussion,
though they do not emphasize the importance of students questioning each other during the whole
class discussion. Administrators in 11 schools describe Level 2 vision of classroom discourse;
these administrators envision students talking with each other about mathematics and/or students
working in groups without having to depend on the teacher for direction; one administrator said
that students will “possibly learn new ways to do [the math problem] that they hadn’t thought
about … before, or if they’re discussing and somebody has a problem, then the other person at the
122
table should be able to help them fix that problem.” One administrator describes a vision of
classroom discourse at Level 1, emphasizing the importance of information being presented
clearly to students, but without any description of student discussion.
Administrators at fewer schools discuss the nature of the mathematical tasks that teachers
assign (n = 16, 53%). No administrators describe mathematical tasks at Level 4. Administrators in
five schools describe tasks at Level 3, discussing the importance of math tasks that can be solved
in a number of ways (though they do not elaborate on why this is important); one of these
administrators holds that tasks with real-life connections are more likely to have multiple solution
methods. Administrators in 11 schools describe Level 2 mathematical tasks. These administrators
often envision real-life tasks (without mention of multiple possible solution strategies), or they
describe the importance of hands-on tasks. One suggests that students look at volume by work
with drawing boxes, connections to architecture, or work with cylinders of multiple sizes –
actually checking which cylinders fit inside each other. In the remaining 14 schools,
administrators do not discuss math tasks as part of their vision for high quality math instruction.
Creation of Vision Measures for Use in Analyses
In about half of the cases, principals described a vision for all three elements of
mathematics instruction. I used two methods of addressing missing data, as discussed above.
First, where only one score was missing, the missing score was imputed through averaging the
other two. Use of this procedure is supported by the fact that in most cases (93%), scores obtained
for each principal are within one level of each other. Since principals tend to articulate consistent
visions of standards-based instruction for the elements that they discuss, it is more reasonable to
expect that they might hold a similar vision for missing elements. Only three cases had missing
data for more than one element, and these were not imputed. Imputation creates less variability in
the data (See Appendix H).
The second method for addressing missing data was to replace missing scores with zeros.

123
This method holds that whether a principal does (or does not) describe all elements is, in itself,
important information about the principal’s vision. Here, it is not assumed that the principal has a
vision about math tasks, classroom discussion, and the math teacher’s role in standards-based
mathematics unless the principal describes it. As noted above, on the math task rubric, zero
indicates that the principal did not consider mathematical tasks as inherently higher or lower; on
the teacher’s role rubric, zero indicated simply that the teacher needed to motivate the students;
on the classroom discussion rubric, zero implies that principal did not consider student-to-student
discussion in his/her description of standards-based mathematics instruction. The two versions of
the vision variable, with and without imputation, showed a .92 correlation. Both versions were
both tested in the HGLM model.
Linear and nonlinear versions of vision variables were constructed, beginning with a
composite of the three vision elements. Standards-based instruction requires that teachers change
their practices in the areas of students’ tasks, classroom discourse, and their own role in the
classroom – all three elements measured in this study (Kazemi & Stipek, 2001; Spillane & Zeuli,
1999; Boston & Wolf, 2006; Nelson & Sassi, 2005). A vision that focused only on standards-
based tasks or only on standards-based classroom discourse could be useful, but an integrated
vision that included all three elements would be needed for standards-based instruction to
succeed. This suggested that the sum of the vision scores may be more meaningful than any
single score. Splines were also created, as a sensitivity test for the linearity of the relationship
between vision and instructional expectations.
Additionally, indicator variables were created for each of the three vision elements.
Polychoric correlations among the elements ranged from .39 to .65 (See Table 12). This suggests
that the individual elements may provide unique information about principals’ vision for
standards-based math instruction. Indicator variables were created for levels with the sufficient
data: Classroom Discourse, Level 2 and Levels 3/4; Math Tasks, Level 2 and Level 3; Role of
Teacher, Level 2 and Levels 3/4.

124
Table 12: Correlations among School-level Variables1 Principal’s Vision
of Classroom Discourse
Principal’s Vision of Math Task
Principal’s Vision of Teacher’s Role
Ordinal Variables (Polychoric Correlations)
Vision of Classroom Discourse
1.00
Vision of Math Task
.40 (.19) 1.00
Vision of Teacher’s Role .65 (.14) .39 (.20) 1.00 Continuous Variables (Polyserial Correlations)
Composite, Three Vision Dimensions
.85 (.06) .82 (.09) .85 (.06)
Faculty Perception of Principal Involvement in Instruction
.18 (.19) –.28 (.23) .16 (.15)
School Mean, Teacher Perception of Expectations for Standards-based Instruction
.68 (.09) .51 (.17) .44 (.14)
1Standard errors in parentheses

125
Hierarchical Generalized Linear Model (HGLM) Analysis
A two-level HGLM model was used to analyze data from the 30 principals and 122
teachers participating in the MIST study in 2008-2009, across four school districts. Most
principals (60%) had no experience teaching mathematics, though seven (23%) had five or more
years experience teaching math. Most teachers (90%) were fully certified at either the middle or
secondary school level. A small group (15%) had been teaching less than two years, while fairly
even numbers of teachers had been teaching between two and four years, between five and ten
years, and over ten years. Teachers’ perception of principal involvement in instruction was
centered approximately at zero, with a range of [– 4.17, 4.46]; faculty perception of principal
involvement had a range of [ – 1.38, 1.68]. The composite of three elements of principal
instructional vision had a mean of 5.03, and a range of [0, 11]. Finally, teachers’ reports of
principal instructional expectations were measured using a six-level, categorical variable, with a
mean of 3.16. The HGLM analyses investigated the degree to which principal instructional
vision and instructional involvement predicted teachers’ reports of principal expectations for
standards-based instructional practices. Ordinal models16 and linear models were compared to
ascertain whether the expectations variable fit a linear model.
ANOVA and Teacher-level Predictors
Analysis began with a one-way random effects ANOVA, to investigate the amount of
within- and between- school variation in principal instructional expectations. The estimate of the
grand mean of all teachers’ reports of principal instructional expectations was 3.18 (SE = .11),
16 A multinomial logit model was also investigated as a sensitivity test, to explore whether the categories of the outcome variable were, in fact, ordered categories. The ordinal model posits that the effect of each predictor variable is the same across all levels of the outcome (i.e., the predictor has the same influence for moving one level at very low levels of the outcome, as at very high levels of the outcome) (Raudenbush & Bryk, 2002). A multinomial model, by contrast, provides a separate set of coefficients for each level of the outcome variable. Because results for each level of the multinomial model were similar, the simpler ordinal model was investigated below.

126
with a 95% confidence interval of [2.96, 3.40]. Between-school variation, which is the expected
variation of individual school means around the grand mean, is described by a plausible values
range. With variance of the school means estimated to be 0.15, the plausible values range for
95% of school means is [2.42, 3.94]. This suggests that the majority of faculty reports range from
instructional expectations for conventional instruction to elaborated/multiple expectations for the
forms of standards-based instruction. Faculties do not tend to report expectations for the functions
of standards-based mathematics instruction. A formal test for whether the variability is significant
confirmed that there was significant variability in the school means (chi-squared = 53.469, df =
29, p-value = .004). The ICC, which measures the proportion of total variability that lies between
schools, is .17. With 17% of variation in instructional expectations lying between schools,
investigation of predictor variables at both the teacher and school levels is warranted.

127
Table 13: Comparison of HGLM Models: Predicting Teacher Report of Standards-based Instructional Expectations, Using Principal Instructional Vision and Involvement,1 Model 1a Model 1b Model 1c Model 2 Model 3 Anova Random
Coefficients Final
Continuous Model
Spline Ordinal Model
Model for initial status (average likelihood of Level 2 instructional expectations) B0j Intercept G00 3.18**
(0.11) 3.18** (0.11)
3.52** (0.36)
3.47*** (0.38)
– 5.70*** (1.19)
Principal Math Teaching Experience, 0 Years G01
– 0.21 (0.28)
-0.19 (0.29)
0.47 (0.76)
Principal Math Teaching Experience, 5 + Years G02
– 0.05 (0.34)
-0.05 (0.35)
0.05 (0.93)
Principal - Female G03 – 0.29 (0.22)
-0.31 (0.22)
0.77 (0.60)
School District 2 G04 – 0.07 (0.27)
-0.03 (0.26)
0.14 (0.67)
School District 3 G05 – 0.42 0.25)
-0.33 (0.38)
0.98 (0.94)
School District 4 G06 0.08 (0.40)
0.15 (0.26)
– 0.26 (0.67)
Principal Vision, Sum of Three Dimensions G07
0.19*** (0.04)
– 0.45** (0.13)
Principal Vision, Spline: Sum0-6 G07
0.14 (0.08)
Principal Vision, Spline: Sum6-11 G08
0.26* (0.11)
Model for Effect of Teacher-reported Principal Involvement in Instruction B1j Intercept for
Involvement G10 0.05
(0.06) 0.05
(0.06) 0.05
(0.06) – 0.14 (0.16)
Models for Teacher Background Characteristics Intercept for Female
G20 0.47*
(0.18) 0.45* (0.19)
0.45* (0.19)
– 1.28** (0.48)
Intercept for Experience, Zero to Two Years G30
0.75* (0.35)
0.65° (0.35)
0.66° (0.35)
– 1.80* (0.89)
Models for the Likelihood of Report of Instructional Expectations at Adjacent Rubric Level Threshold for Level 2 3.52***
(0.72) Threshold for Level 3 5.52***
(0.76) Threshold for Level 4 8.62***
(0.90) Threshold for Level 5 10.67***
(1.34)
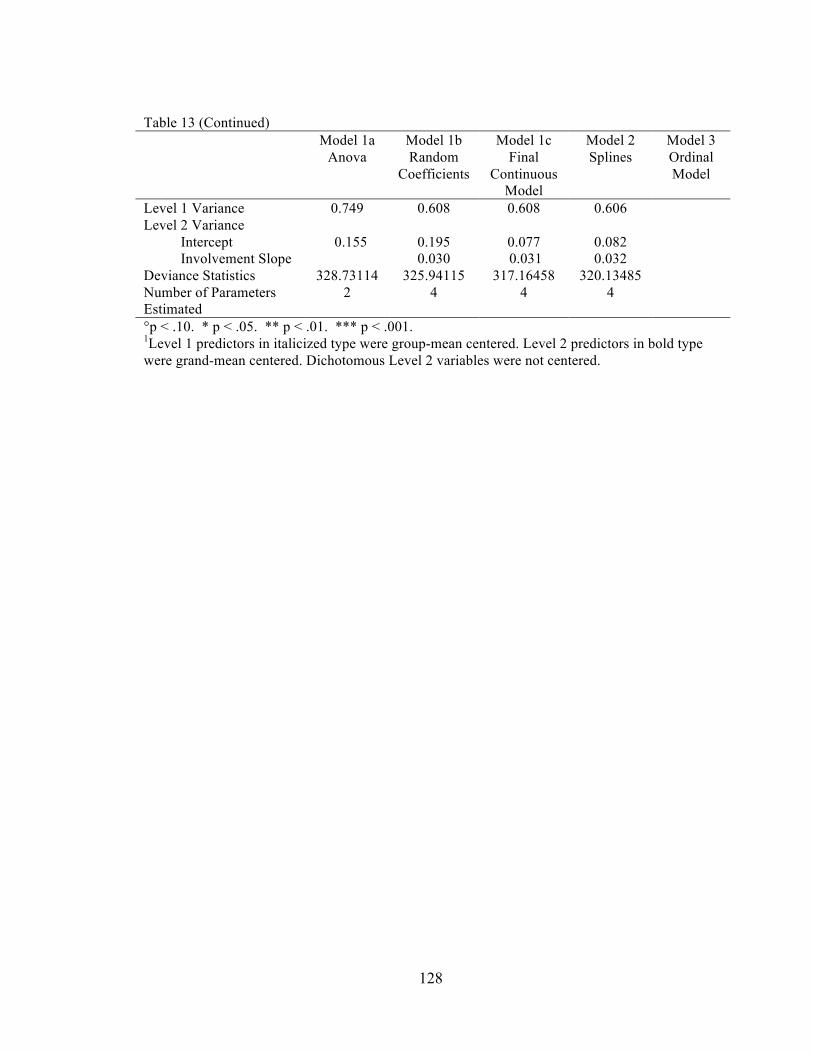
128
Table 13 (Continued) Model 1a Model 1b Model 1c Model 2 Model 3
Anova Random Coefficients
Final Continuous
Model
Splines Ordinal Model
Level 1 Variance 0.749 0.608 0.608 0.606 Level 2 Variance Intercept 0.155 0.195 0.077 0.082 Involvement Slope 0.030 0.031 0.032 Deviance Statistics 328.73114 325.94115 317.16458 320.13485 Number of Parameters Estimated
2 4 4 4
°p < .10. * p < .05. ** p < .01. *** p < .001. 1Level 1 predictors in italicized type were group-mean centered. Level 2 predictors in bold type were grand-mean centered. Dichotomous Level 2 variables were not centered.

129
A model that included principal instructional involvement and teacher-level control
variables was used to test Hypothesis 1. The instructional involvement scale variable was group-
mean centered. This meant that when a teacher perceived a different level of principal
involvement in instruction than the school average, the coefficient gave the association between
the difference in involvement score and that teacher’s perception of expectations for standards-
based instruction. This was intended to be a measure of individual differences (i.e., within-school
variation). When a principal involved him/herself in instruction more in order to support
particular teachers’ growth in instructional practices, those teachers would then report greater
principal involvement in instruction than the average teacher at the school, and this was expected
to be associated with teacher report of more developed instructional expectations (dependent also
upon whether the principal had a well-developed vision for standards-based instruction, to be test
below). However, contrary to the hypothesis, there was no evidence of an association between
the within-school variations in involvement and teacher reports of expectations (p > .25). The
instructional involvement scale was also tested as a grand-mean centered variable. If some of the
teachers at a particular school perceived a different level of principal involvement than the sample
average, this effect on instructional expectations would be given by grand-mean centering. This
was intended to measure differences between individual teachers and the sample average. Again,
there was no evidence of an association between the involvement scale and instructional
expectations (p > .25). An additional test of associations of between-school differences in
involvement and teacher reports of instructional expectations was conducted when school-level
variables were added to the model. A school-level estimate of principal involvement was tested at
that point (see below).
Four teacher-level predictors were included in this model. These Level 1 variables
controlled for race/ethnicity, sex, and teaching experience (e.g., less than two years experience as
a math teacher, and two to four years experience). These variables have been suggested as
influences on teacher perceptions in past research (Rowan, Raudenbush, & Cheong, 1993;

130
Rowan, Raudenbush, & Kang, 1991). In the present case, I expected that new teachers and
untenured teachers might report more instructional expectations, perhaps because they may place
more focus on administrators’ expectations. Results show that female teachers and teachers in
their first two years of teaching report significantly higher expectations for standards-based
instructional practices. Based on Model 1b, female teachers tend to report instructional
expectations that are about a half a standard deviation higher than the average for their school (β
= .47, p < .05); for new teachers, the difference is about three fourths of a standard deviation (β =
.75, p < .05). Chi-squared tests of variance indicate that these effects do not vary significantly
across schools and can be fixed (Bryk & Raudenbush, 2002). These variables account for 19% of
the Level 1 variance. Teacher race/ethnicity and two-to-four years of teaching experience did not
show a significant association with instructional expectations and were not retained in the model.
Because analysis of the involvement scale showed unexpected results, an alternate
involvement variable was investigated. Based on results from IRT analysis of the involvement
scale, teachers were less likely than expected to report that the principal communicated a clear
vision for mathematics instruction. Results suggest the possibility that the survey item about clear
vision may carry more information about the principal’s leadership of mathematics instruction
than an average scale item. Since teachers are not as likely to strongly endorse this item, when
they do, it may be associated with communication of specific instructional expectations.
Furthermore, results show that teachers report the principal is more likely to set high standards for
teaching than communicate clear vision for instruction – again suggesting that teacher
endorsement of the clear vision item is a stronger indication of principal leadership. Therefore,
though not part of a hypothesis for this study, this single survey item was added to the HLM
model as an alternate measure of principal involvement in instruction, replacing the involvement
scale, to test its predictive effect on teacher report of instructional expectations. First, the variable
was group-mean centered. This tested the effect of a difference between a teacher’s report of how
well the principal articulated clear instructional vision and the average report from teachers at the
131
school. Then it was grand-mean centered. This tested the effect of difference between a teacher’s
report and the average across the sample. Only the grand-mean centered variable was significant
(β = .17, p = .03). The survey item had provided teachers with five response options, and when a
teacher’s response was one level higher than the average across all schools, this was associated
with 1/5 standard deviation higher instructional expectations. This suggests that when principals
are actively involved in articulating a clear vision for mathematics instruction, teachers are more
likely to report instructional expectations. This one type of principal involvement in instruction
appears important in predicting instructional expectations.
School-level Predictors
A model for Hypothesis 2 was tested next (see Model 1c). Principal instructional vision
was added to the model, as both a predictor of the initial value of teachers’ perceptions of
principal involvement, and as a moderator of principal involvement. According to Hypothesis 2,
the strongest results were expected to lie in the interaction term. However, the interaction
between vision and principal involvement was not significant and was not retained in the model.
Only the main effect of principal vision on teachers’ perception of instructional expectations was
significant. The vision composite variable was added with and without imputation. The
coefficient for the composite was slightly more significant when data were not imputed, than
when data were imputed, and this suggests that whether or not the principal articulates a vision
for each of the three elements is a significant aspect of his/her vision. Results in Model 1c show
that an increase of one point on the composite measure (i.e., an increase of one level in one
element of principal vision, about .5 SD) is associated with an increase of .20 standard deviations
in teachers’ perceptions of instructional expectations (β = .19, p < .001). The addition of the
composite measure leads to a 50% reduction in Level 2 variance compared with the ANOVA
model.
Additional Level 2 predictors were tested. Faculty perception of principal involvement in
132
instruction was included. This school-level variable was intended to measure the influence of
between-school differences in principal involvement, and it was an additional test of Hypothesis
1. I expected that when a principal involves him/herself in the school’s instructional program,
more than an average principal, teachers would report greater instructional expectations.
However, contrary to Hypothesis 1, this variable was not a significant predictor of instructional
expectations.
The model also tested the effects of several Level 2 control variables, including indicator
variables for school district, and principal background characteristics that have been associated
with leadership practices in previous research (Hallinger, Bickman, & Davis, 1996; Hallinger &
Murphy, 1985). Results show that teacher perception of instructional expectations does not vary
by school district, and it does not vary based on whether the principal has math teaching
experience, or whether the principal is female. The principal’s race/ethnicity also is not a
significant predictor. The school’s ranking within the district was a coarse measure reflecting how
close each school’s achievement scores were to district and state scores in 2007-2008 (scores
averaged across grades 6, 7, and 8). This blunt measure of the relative standing for each school
was somewhat correlated with school level estimates for the principal instructional involvement
scale (r = .37), and higher school achievement was associated with greater principal involvement.
However, school ranking did not show evidence of an association with instructional expectations.
In this final model, whether a teacher is new to the profession was only marginally significant (β
= .65, p < .10).
Several alternate measures of principal instructional vision were investigated as a
sensitivity test of the linearity of the relationship (see Model 2). Two versions of a spline were
tested to investigate whether scores at the higher end of the distribution had an effect on
perceived expectations above and beyond what the linear model suggested. The cut-point for the
spline was set first at a composite score of five, and then at a composite score of six. The latter fit
133
the data marginally better.17 When principals have composite vision scores in the upper half of
the distribution, the effect of a one-unit increase in the composite score shows a slightly greater
predictive effect than the composite measure as a whole, though the precision is reduced (spline-
sum7-11: β = .26, p < .05, versus composite: β = .19, p < .001). Use of the spline does not account
for any additional variance at Level 2. The spline with imputed data fit the model slightly less
well than the spline with unimputed data.
Associations between teacher perception of instructional expectations and single
elements of principal instructional vision were also tested, in order to examine which element(s)
of principal vision had the strongest association with perceived instructional expectations. Two
indicator variables (i.e., dummy variables) were included first for whether the principal described
a vision of math tasks at Level 2, or Level 3 (no principals described Level 4); only the Level 3
variable was significant (p < .01). Next, two variables for description of role of teacher at Level
2 and Levels 3/4 were entered; neither was significant. Lastly, variables for classroom discourse
at Level 2 and Levels 3/4 were entered, and both were significant at p = .05. When the variables
for single elements of vision were entered simultaneously, those that had been significant
remained so (i.e., classroom discourse described at Level 2, classroom discourse described at
Levels 3/4, and math task described at Level 3).
Ordinal Model
An ordinal model was estimated to investigate whether the simplified, linear model
provided a reasonable approximation of the associations in the data (See Table 13, Models 1c and
3). An ordinal model does not assume that the differences between the levels of instructional
expectations are the same. For instance, the difference between a teacher who reports Level 4
expectations and one who reports Level 5 expectations is not necessarily the same as the
17 The coefficients for the two parts of the spline were significantly different from one another (chi-square = 17.917331, df = 2, p < .001).

134
difference between a teacher who reports Level 1 and one who reports Level 2. Comparison of
results from the ordinal and linear models provide a test of whether the linear model fits the data
adequately. In this case, results for the ordinal and linear models were similar. The same
coefficients tended to be significant in both models. In both the linear and ordinal models, the
vision variable (without imputation) was a highly significant predictor of teacher perception of
instructional expectations in the final models (p < .01). The coefficients in the ordinal model have
less intuitive meaning than those in the linear model, since they affect the probability of responses
through their impact on the log odds ratio, and the predicted probability for every level of the
instructional expectations variable. Also, due to the equations used in the ordinal model,
coefficients have opposite signs compared with those in the linear model (Long, 1997; Reise &
Duan, 2003).
Limitations
The study investigates the associations between the three instructional leadership
variables described above, in four school districts that were implementing standards-based
instructional programs in middle school mathematics classrooms. Results must be set in the
context of the study’s sample. The four school districts were selected because they had invested
in middle school mathematics reform more than most. Participants are representative of their
schools, but not representative of middle school mathematics teachers more broadly.
The study does not investigate how teacher perception of expectations for instruction may
impact teacher practice. Research has suggested numerous ways. For instance, Coburn (2005)
finds that the principal’s understanding of reform affects the expectations that the principal sets
for teachers and “set boundaries within which teacher sense-making unfolded” (pg. 493).
According to this perspective, principal expectations for instruction influence the ways that
teachers understand instructional reforms, in turn influencing teachers’ instructional practice.
Other pathways of influence are possible. This study does not examine relationships between

135
principal expectations and teacher change in practice.
This analysis uses interview data for two variables, including the outcome variable. One
of the inherent limitations of interview data is that there may be under-reporting due to lack of
interviewer probing. Interviewers may not have consistently probed for an exhaustive listing of
principal expectations. When teachers only report that one form-based instructional practice is
expected, there is no way to know whether further probing by the interviewer would have
uncovered more expectations. The amount of this type of measurement error is difficult to
estimate. If school-level reports of principal expectations had been the outcome variable, it
would be possible to triangulate reports from all participating teachers in a school. If all teachers
reported form-oriented expectations for instruction, then one could conclude that there is no
evidence of function-oriented expectations. Even then, the adequacy of interviewer probing
would be difficult to assess. In the present analysis, teacher reports of expectations are used as a
teacher-level outcome variable, not allowing for such triangulation.
At the same time, two factors mitigate the problem of under-reporting. First, this analysis
uses teachers’ responses from multiple questions to ascertain their views. Both teachers and
interviewers had a number of opportunities to discuss instructional expectations. This provided
more opportunities for teachers to recall additional expectations and for interviewers to probe.
Furthermore, teacher’s responses are coded holistically. This means that if the teacher describes
more developed expectations in response to any of the coded questions, the entire response is
coded at that higher level.
For the reasons discussed above, IRT analysis was used to investigate the internal
properties of the scale. IRT provides a standard error for each item, teacher, and school location
estimate. The sample size is adequate to estimate item locations with reasonably small standard
errors. However, because the involvement scale included only eight survey items, teacher
location estimates have large standards errors. For a typical teacher in the sample, the 95%
confidence interval for the person location estimate is [–1.82, 2.02] on a logit scale.

136
CHAPTER V
DISCUSSION
This study uses both cognitive- and task-based measures of instructional leadership to
investigate what principals must know and be able to do in order to effectively articulate
instructional expectations aligned with the goals of standards-based reform. Given the
importance of instructional expectations (Supovitz and Poglinco, 2003), the study seeks to predict
teacher’s perceptions of expectations for standards-based instructional practices in mathematics.
The explanatory model indicates that the principal’s vision for standards-based mathematics
instruction has a significant predictive effect on teachers’ perceptions of instructional
expectations. A one point increase in the composite measure of principal’s vision is associated
with .20 to .25 SD increase in teachers’ perceptions of instructional expectations. The model
accounts for 50% of between-school variance in instructional expectations, meaning that the
principal’s instructional vision for mathematics, along with control variables, explains over half
of the differences in the school means for instructional expectations.
At the same time, neither of the hypotheses about associations between instructional
leadership constructs is supported by results. Contrary to the first hypothesis, no association is
evident between principal involvement in the school’s mathematics program and the degree to
which teachers report instructional expectations aligned with the goals of standards-based
instruction. I had hypothesized that principal’s vision of standards-based instruction would
moderate the relationship between principal involvement and teacher perception of instructional
expectations. Instead, when a principal has a more developed, multi-dimensional vision for high
quality mathematics instruction, teachers in his/her school report expectations more aligned with
the goals of standards-based instruction regardless of the principal’s degree of involvement in
instruction. This leaves the means through which the principal’s vision influences teacher
137
perception unclear. While it would seem reasonable that principal vision would operate through
the function-based tasks of the involvement construct, this does not appear to be the case.
Similarity of Instructional Leadership in Subject-specific Contexts and Broader Contexts
My investigation of the involvement scale was intended to provide information about the
degree to which instructional leadership functions similarly when the principal leads instructional
reforms in mathematics or when s/he leads instructional reforms across the whole school. Results
support the same two-level conceptualization of the involvement construct for both contexts.
Vision setting has been described as a foundation for monitoring of instruction (Supovitz &
Poglinco, 2003), and results suggest that articulation of expectations serves as a lower level of the
involvement construct, while monitoring serves as a higher level. This is consistent with the view
that principals need to set clear expectations in order to effectively monitor instruction and
learning. Empirical results are similar to those from prior research (CCSR, 2006). With the
exception of two survey items, principals’ relative levels of involvement in most tasks does not
appear to depend upon whether they are leading subject-specific standards-based instruction, or
leading instruction more broadly across an entire school.
At the same time, results for two survey items suggest some differences in how
instructional leadership functions in math-specific contexts relative to the more general leadership
contexts. The first item shows that teachers in this study more strongly agree that principals set
high standards for mathematics teaching (e.g., relative to other items in the scale), and this is a
different pattern than in previous research. Teachers’ relative ease in reporting that the principal
sets high standards may be a reflection of the challenging standards set by the school districts in
this study. The second item shows that teachers are less likely to report that the principal
communicates a clear vision for mathematics instruction in the standards-based environment.
Comparison is difficult, since the parallel items from the earlier CCSR research are not subject
specific. It may be that subject-specific leadership is difficult in any type of instruction, or it may

138
be that standards-based is difficult in any subject area. The differences in results for the two
items, however, suggest that in the standards-based setting represented in MIST data, standards
are high but less easily articulated. Overall, subject-specific leadership appears to follow similar
patterns to that of instructional leadership across an entire school, yet pose some additional
challenges for principals. The difficulty of articulation of subject-specific vision, as evidenced by
the reduced frequency with which teachers report principals engaging in this activity, suggests the
importance of principal professional development about subject-specific vision, if the principal’s
role is conceptualized to include setting subject-specific instructional expectations.
Validity of the Involvement Scale
Before addressing questions about why findings contrast with hypotheses, it is useful to
further examine whether the scale does in fact measure principal involvement in mathematics
instruction. As described above, reliability of the scale is high, and evidence generally supports
the validity of the scale as a measure of principal leadership for standards-based mathematics
instruction. However, because of the unexpected findings, additional assessments of scale validity
were conducted using alternate measures of principal involvement in instruction. The MIST
teacher survey includes four items about the frequency of principal instructional involvement
(e.g., the frequency with which principals discussed instruction with teachers, observed classroom
instruction, gave feedback after classroom observation, and reviewed student work with teachers.
The survey also includes eight items about assistance the principal provides to teachers in areas
such as planning for instruction, matching the curriculum to the standards, identifying individuals
who could share mathematics expertise, and understanding the central mathematical ideas of the
curriculum. The involvement scale shows moderate correlations with each of the four individual
items (from r = .52 to r = .33); additionally, the items about principal assistance work well as a
scale (alpha = .87), and the assistance and involvement scales show a moderate correlation (r =
.49). While these correlations are only moderate, they further support the validity of the scale.
139
Similar to findings for the involvement scale, described above, when these alternate measures of
involvement are tested in the HGLM model, none of them are significant predictors of
instructional expectations. This again suggests that the involvement construct is not associated
with teacher perception of specific expectations for standards-based mathematics instruction. I
turn now to potential reasons for this lack of association between involvement and the
instructional expectations.
Questions Raised by Results
The lack of evidence for a relationship between principal involvement in instruction and
teachers’ perceptions of instructional expectations, in contrast with the predictive effect of
principal instructional vision, leads to two questions. First, why is greater principal involvement
in mathematics instruction – including the principal setting high standards for mathematics
instruction and monitoring instructional quality, not systematically related to instructional
expectations that are more aligned with the goals of standards-based reform? Second, through
what pathway(s) does principal vision for mathematics instruction lead to teacher perception of
more developed expectations? The first question can be investigated through the research
reviewed the data used in this analysis, while the second question may lie beyond the scope of
this analysis.
Some explanation for the lack of association between principal involvement and teacher
perception of instructional expectations may be found in policy implementation research. This
analysis primarily takes a sense-making perspective, holding that each person who is involved in
implementation must construct an understanding of his/her practice in light of the policy being
implemented, and that the constructions tend to resemble what is already familiar to the
implementer (Spillane, Reiser, & Reimer, 2002; Coburn, 2005). If teachers interpret the
principal’s practice in light of what is familiar (not only their own practice in light of what is
familiar) then if teachers were used to the principal involving himself/herself in instruction in

140
general ways across all content areas, they would continue to consider the principal to be
involved if s/he pressed for general instructional matters such as carefully planned lessons and
differentiated instruction. Therefore, even though the involvement scale items are worded to
refer specifically to mathematics, teachers may be reporting how much principals involve
themselves in instruction broadly, not only the degree to which they press for specific patterns of
standards-based mathematics practice.
Additional perspectives on policy implementation also apply. These suggest that
principals often must coordinate multiple reforms and initiatives (Knapp, 1997; Grant, et al, 1996;
Newmann, Smith, Allensworth, & Bryk, 2001). Schools have a multiplicity of aims (Schoenfeld,
2004), and principals may focus on a range of goals alongside those of the standards-based
reforms. For instance, school leaders often concern themselves with scores on high-stakes
accountability tests (Cobb & McClain, 2006). Principals could engage in the activities of the
involvement scale in order to strongly press teachers for high students scores on accountability
tests, or the school may have a literacy or writing initiative and principals may press teachers to
implement literacy practice or writing assignments in the context of their mathematics instruction.
In such cases, teachers may consider the principal involved, while the principal is in fact pressing
for multiple instructional goals.
It is useful to compare the involvement scale and the expectations rubric. The scale
measured expectations in a broader sense than the instructional expectations rubric. Researchers
have suggested that survey scales may tap broader constructs (Goldring, et al., 2008). The
instructional expectations rubric measured expectations for specific practices that a teacher uses,
but no such practices are named in the involvement survey scale. For instance, teachers may have
interpreted the survey items that asked if the principal set high standards for student learning to
mean that the principal wanted all students to be successful, to understand their math lessons, to
be able to apply the concepts that they learn, etc. This may be the case at Azalea Middle School,
described below. Principal involvement to press for these types of goals does not require that the

141
principal hold standards-based expectations.
Additionally, the model posits that the three leadership dimensions can be separated from
each other. However, the separation of content and activity may be problematic, because of the
breadth of purposes that principals may seek to promote through the activities listed in the survey
scale. Since all school districts in this study were engaged in implementation of standards-based
instructional reforms, the model expected that principals would use the activities in support of
instructional reforms – to the degree that their vision for standards-based mathematics instruction
allowed. Yet, while the content of survey items was broadly math-specific for seven out of eight
items, it was not focused on the goals of standards-based math instruction, and the degree to
which principals used the activities to support standards-based instruction is not clear. For
instance, an item asked teachers if the principal made his/her expectations for meeting
instructional goals in mathematics clear, but it did not specify whether those goals were aligned
with the district’s standards-based instruction, or whether the goals simply involved providing
students with clear learning goals for each class, etc. Another item asked teachers if the principal
actively monitored the quality of mathematics teaching in the school, but it did not ask whether
the principal looked for indicators of standards-based instruction or more general indicators such
as classroom organization.
Data were reexamined to further investigate the lack of association between involvement
and standards-based instructional expectations. Several schools with unexpected results were
selected. At Azalea Middle School in Lakewood District, the faculty rates the principal relatively
highly in involvement scores, while the instructional expectations that the faculty perceive are in
the lowest quartile for the sample (see Table 14). Further investigation shows that in recent years,
Azalea Middle School has been labeled a low-performing school. In addition, the school serves as
a center for English language learners (ELL). The principal was under pressure to raise the
school’s test scores while simultaneously serving ELL students. When she describes high quality
mathematics instruction, the principal says she wants to see scaffolding by teachers with steps

142
clearly explained, rigor, and differentiated instruction. This suggests that she wants teachers to
meet the needs of each individual student to ensure that all students do well on accountability
tests and that she expects teachers to accomplish this through fairly traditional methods – wanting
to see clarity and scaffolding rather than students exploring solution methods on their own. From
teachers’ perspectives, if the principal expects them to raise students’ achievement and, for a
large percent of their students, to concurrently build greater understanding of both mathematics
and English language, the principal’s expectations might appear high – challenging – though not
associated with standards-based math. This case represents an example in which the principal
may have several goals for her involvement in instruction and this may lead teachers to rate her
highly for involvement despite lack of focus on standards-based instructional practices.
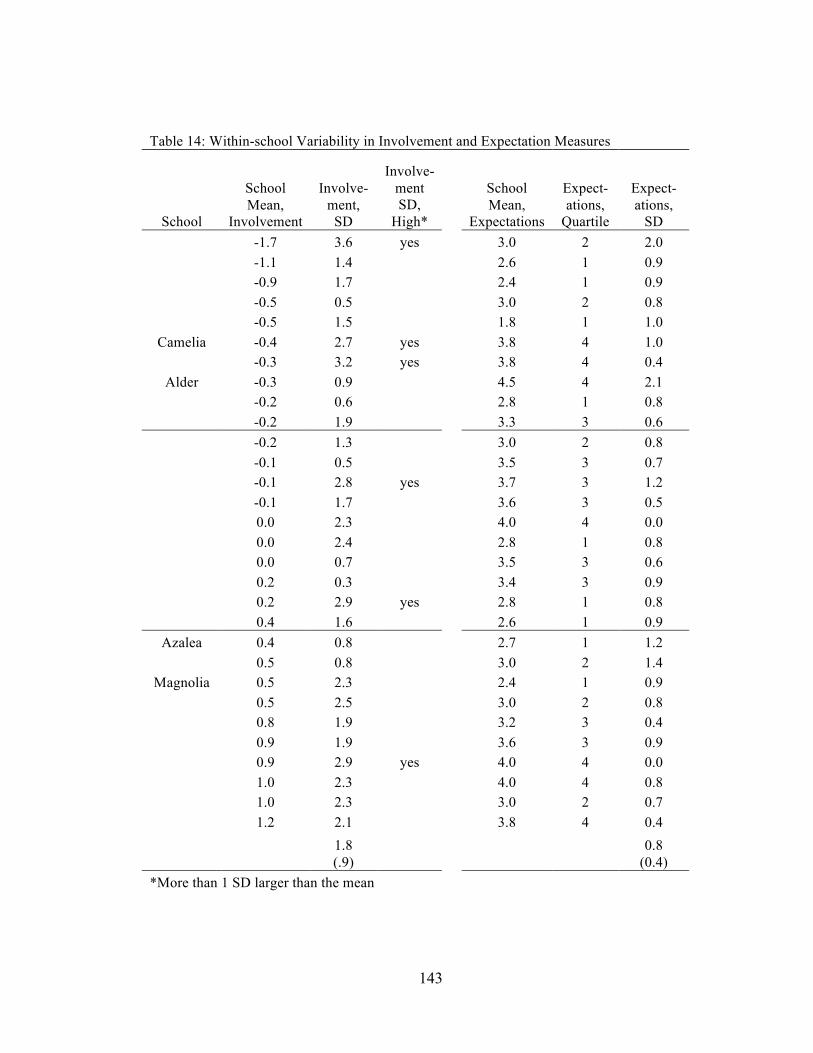
143
Table 14: Within-school Variability in Involvement and Expectation Measures
School
School Mean,
Involvement
Involve-ment, SD
Involve-ment SD,
High*
School Mean,
Expectations
Expect-ations,
Quartile
Expect-ations,
SD -1.7 3.6 yes 3.0 2 2.0 -1.1 1.4 2.6 1 0.9 -0.9 1.7 2.4 1 0.9 -0.5 0.5 3.0 2 0.8 -0.5 1.5 1.8 1 1.0
Camelia -0.4 2.7 yes 3.8 4 1.0 -0.3 3.2 yes 3.8 4 0.4
Alder -0.3 0.9 4.5 4 2.1 -0.2 0.6 2.8 1 0.8 -0.2 1.9 3.3 3 0.6 -0.2 1.3 3.0 2 0.8 -0.1 0.5 3.5 3 0.7 -0.1 2.8 yes 3.7 3 1.2 -0.1 1.7 3.6 3 0.5 0.0 2.3 4.0 4 0.0 0.0 2.4 2.8 1 0.8 0.0 0.7 3.5 3 0.6 0.2 0.3 3.4 3 0.9 0.2 2.9 yes 2.8 1 0.8 0.4 1.6 2.6 1 0.9
Azalea 0.4 0.8 2.7 1 1.2 0.5 0.8 3.0 2 1.4
Magnolia 0.5 2.3 2.4 1 0.9 0.5 2.5 3.0 2 0.8 0.8 1.9 3.2 3 0.4 0.9 1.9 3.6 3 0.9 0.9 2.9 yes 4.0 4 0.0 1.0 2.3 4.0 4 0.8 1.0 2.3 3.0 2 0.7 1.2 2.1 3.8 4 0.4
1.8 (.9)
0.8 (0.4)
*More than 1 SD larger than the mean

144
Several schools were also selected from Table 14 to investigate why teachers may report
that the principal is not active in the eight activities of the involvement scale, yet still report
relatively high levels of instructional expectations from the principal. At Camelia Middle School
in Adams District, leadership conflicts exist in the math department. Several teachers hold
traditional views of math instruction, though the district math specialist responsible for the school
and one of the school administrators both hold standards-based goals for math instruction..
District math staff have had to participate in the school’s math department meetings because of
the conflict. The views of teachers who participated in this study are aligned with the district’s
standards-based reforms, and these teachers report a mean of Level 4 principal expectations. They
may have reported little involvement from the principal, however, because the principal may not
have involved herself in instruction due to the conflicts within the math department. Teachers
may not perceive the principal as setting strong standards set for teaching and learning, since they
are well aware of the continuing conflicts in their department. Teachers may focus on based on
district-level expectations since district personnel attend math department meetings. In this case,
contextual factors may influence principal behavior more than in typical schools.
In the case of Alder Middle School in Lakewood District, the issue appears to be great
variability in teacher perception of instructional expectations from the principal (SD = 2.1). One
teacher reports Level 6 expectations, but this perception is not shared across the school. In fact,
another teacher reports Level 3 expectations, (i.e., a form-oriented expectation for one standards-
based instructional practice). Neither of these teachers is in his/her first two years of teaching, so
amount of experience is not the cause of the variation. Based on available data, the single report
of well-developed expectations appears to be idiosyncratic. This is a case of within-school
variability exerting a strong influence on results. As discussed earlier, there is a range of possible
reasons for the unusually high score, from scheduling to location of classroom, among others.
Having examined processes that may explain the lack of association between principal
involvement and instructional expectations – from principals pressing toward multiple goals, to
145
contextual factors, to within-school variability, I turn briefly to more foundational issues that
underlie the two main questions raised above: the nature of the principal’s role as an instructional
leader, and the means through which the principal most effectively influences instruction. The
current analysis is founded upon research that shows that principals’ influence instruction through
a supportive, supervisory role. However, the evidence for the effect of principals’ work to
monitor instruction remains contradictory (Leithwood & Jantzi, 2008). In very recent work,
Louis, Dretzke, & Wahlstrom, (n.d.) find that instructional leadership (conceptualized as defining
standards, observing instruction, and discussing instruction with teachers) does not influence
teachers’ self-reports about instructional practice. Based on their findings, these authors suggest
that the nature of relationships between adults in the school, conceptualized as professional
community and trust, influences the nature of instruction. These and other possible pathways
through which the principal may exercise formal and informal influence on teachers’ instruction
have been investigated in previous research – for example, shaping the school culture and climate
(Leithwood, et al., 2004), supporting professional community (Bryk, Camburn, & Louis, 1999),
building trust (Bryk and Schneider, 2003), and strengthening the coherence of the school’s
instructional program (Newmann et al., 2001), among others. These pathways are not examined
in this analysis, but given the quantitative and qualitative findings here, combinations of these
methods should be further researched. There is reason to expect that they would not be highly
correlated with the involvement scale used in this analysis, since the scale does not include items
about such constructs as trust, professional community, or instructional program coherence. As
Louis, Dretzke, & Wahlstrom, (n.d.) observe, research studies “often assume that leadership
affects students because it changes teacher behavior, but relatively few studies look at the
connection between leadership and instructional practice” (pg. 3). The connections require further
study.
This analysis is also built upon research that connects the principal’s work in setting
school-wide goals with principal’s work in monitoring instructional practice. However, in

146
qualitative studies discussed earlier, the function of articulating vision (measured here as part of
the involvement scale) is connected with additional pathways through which the principal may
influence instruction. Coburn (2005), in her study of elementary reading instruction, finds that
principals set vision by defining instructional goals in staff meetings as well as in informal
conversations with teachers. In that study, school leaders function to shape the policy ideas to
which teachers have most access, the ways teachers understand those policies, and teachers'
opportunities to learn (e.g., in collaboration with other teachers at the school). Their main
pathway for influencing instruction is not through setting specific instructional expectations,
though Coburn’s results do not preclude that as a pathway, as well. However, in that study, the
principal who is most supportive of the kinds of instructional reforms discussed here is also the
least likely to provide teachers with specific, detailed expectations for their practice. Coburn and
Russell (2008) investigate principal influence on scale up of an ambitious elementary
mathematics curriculum. They find that principals influence the degree to which staff
conversation about instructional reform is congruent with the intentions of the district
mathematics reform. Congruence of conversation with reform goals may involve setting goals
and standards, and it may be expected to influence teacher instruction – potentially an additional
pathway from articulation of vision to changed instruction.
Finally, the goal of this analysis is investigation of the degree to which principal
instructional vision and principal involvement in instruction predict expectations for what should
constitute classroom practice in mathematics. The investigation is limited by the amount of
observed variation in each of the constructs. Results show that kinds of expectations perceived
by teachers tend to be form-oriented levels. Function-oriented expectations are not commonly
described. Teachers are about equally as likely to briefly report that the principal expects one type
of standards-based instructional strategy (e.g., group work, hands-on tasks, use of district
curriculum) as they are to report elaborated expectations. Yet, whether brief or somewhat
lengthier, these instructional expectations tend to set standards for the outward patterns of

147
instruction, but not for instructional goals. Teachers report that principals tend to expect that
students work in groups and do more hands-on tasks, but not that students make more
connections between mathematical ideas or grasp mathematical principles more deeply.
Connections between hands-on tasks and greater conceptual understanding are not usually made.
A small number of teachers report function-oriented expectations that address the goals of
instruction. These teachers state that principals expect students to learn how to support their ideas
with valid mathematical arguments, or show their understanding of mathematical concepts by
constructing questions about peers’ mathematical strategies. However, the majority of teachers
do not report that principals provide specific, detailed expectations for standards-based
instructional practices, even though all four school districts are implementing instructional
programs that differ greatly from conventional instruction, and more detailed expectations may
have helped teachers grasp the new programs more fully. Currently, the four districts in this
sample envision the implementation of standards-based instruction at a function-level – not only a
form-level. It does not appear that teachers are receiving detailed expectations for their
instructional practice from principals to the degree required for implementation of district plans.
Also, the mean of the composite for principal instructional vision is about 5.0. Because of the
fairly limited variation in both the vision measure and the expectations measure, the effectiveness
of principal instructional vision to predict function-oriented expectations for classroom
instruction could not be assessed.
Directions for Future Research
Results from this analysis indicate several directions for future research. First, further
work with the measures and model used in this analysis is needed. While the involvement scale
does not show a significant predictive effect, a single item from the scale does – the item that asks
teachers whether the principal articulates a clear vision for mathematics instruction. In fact, when
a teacher reports that the principal articulates clear vision at one level higher than the average

148
across the study, this is associated with the same size increase in instructional expectations as a
one level increase in the principal vision composite. This suggests that both the depth of
principals’ vision and the degree to which principals articulate that vision influences the
expectations for standards-based instruction perceived by mathematics teachers. Based upon this
finding, and upon validity tests of the scale, the involvement scale needs to be studied further in
the context of subject-specific leadership. Items that optimally measure higher levels of the
construct need to be developed. Further investigation is needed into what teachers mean when
they describe principals as setting high expectations, or rate principals highly in the eight
involvement activities.
Given the unexpected influence of the principal’s vision on teachers’ perceptions of
expectations for mathematics instruction, further investigation is necessary into the pathways
through which the principal’s vision operates. The results of this analysis offer few clues to the
means through which the principal’s instructional vision is impacts teachers’ perceptions of the
standards-based expectations for their practice. However, as noted above, previous research has
suggested potential pathways. Further research is needed into the pathways in operation here.
Research beyond the model used in this analysis is also suggested. Future work needs to
investigate the connections between instructional expectations and teachers’ actual instructional
practice. This is beyond the scope of this analysis. However, connections with actual classroom
practice need to be investigated. Future studies need to examine the relationship between
teachers’ perception of instructional expectations and the degree to which teachers’ practice is
shaped by the expectations they perceive. When principals are more involved in the school’s
instructional program, articulating their vision for mathematics instruction and monitoring
progress toward that vision, teachers may be more likely to act upon the expectations that they
perceive.
Finally, given the expertise needed by principals to lead subject-specific instructional
improvement, leadership is likely to require teams such as those described in studies of

149
distributed leadership (Spillane, Halverson, & Diamond, 2001). The distribution of subject-
specific leadership for principals and assistant principals needs further study.
.
150
CHAPTER VI
CONCLUSION
This study focuses on the relationships between three dimensions of principal
instructional leadership for subject-specific instructional improvement. As school districts and
researchers expect instructional leaders to press for the implementation of instructional practices
that allow students to build a conceptual understanding of mathematics, this study was intended
to investigate the degree to which principal vision and involvement could predict math teachers’
perceptions of standards-based instructional expectations. Results show that principal vision of
high quality mathematics instruction has a significant predictive effect on the expectations for
instruction that math teachers describe. An increase of about half a standard deviation in principal
vision predicts an increase of about one fourth a standard deviation in teacher perception of
standards-based instructional expectations.
The effect of the principal’s work to set an academic vision for the school has been
described in much policy research literature. That literature consistently finds that when
instructional leaders articulate a clear vision for a school, then outcomes improve – from school
culture to student learning. The current study adds to that literature by suggesting the importance
of more specific aspects of the principal’s vision for instruction. This study shows that when
principals’ own vision of high quality math instruction includes use of hands-on tasks or
problems with real-world connections, and when their vision includes students talking about their
mathematical tasks in small groups or questioning each other in whole class discussion, teachers
are more likely to report expectations for standards-based instructional practices. The pathway
through which the principal’s own vision influences teachers’ perceptions about instructional
expectations is not clear, though the association is highly significant (p < .001). The instructional
visions that principals describe in this study do not suggest that they understand the specifics of
151
standards-based mathematics instruction in the ways that teachers need to understand. However,
their vision involves more than student engagement. Principals with high vision composites
describe the content of instruction – what students are doing, what they are saying, and to whom.
They have a vision that suggests they look at the nature of students’ tasks, the ideas the students
present to the class, and perhaps the degree to which students engage each other in mathematical
arguments. This predicts teachers’ perceptions of expectations for standards-based instruction.
At the same time, the study’s hypotheses are not supported by results. This raises
additional questions about relationships between the dimensions of instructional leadership, and
perhaps even questions about the most effective roles for the principal in supporting standards-
based instruction. The association that exists between principal vision and teacher perception of
instructional expectations – as well as the lack of association between principal involvement in
instruction and teacher perception of instructional expectations, are both surprising. The nature of
the outcome variable may provide some insight into these unexpected results. The outcome
variable involves cognition, but it does not involve actual teaching activity. Results show that the
outcome is associated with another cognitive variable, perceived instructional expectations. It
may be that the task-oriented involvement scale would be associated with implementation of
changes to instructional practice. The influence of principal involvement on mathematics
teachers’ actual practice requires further study.
Additionally, analysis of the involvement scale generally supported its validity for use in
subject-specific contexts, but results also showed the need for more complete domain content
coverage. If the scale were augmented with items designed to measure higher levels of the
involvement construct, the scale may show more association with perceived instructional
expectations. Currently, a single survey item that measures the higher level does show a
significant predictive effect on instructional expectations. The two-part internal structure of the
involvement construct, developed in this analysis, gives direction about the focus of the items that
could be added. Additional items might ask teachers not only whether the principal monitors

152
instruction, but also what the principal focuses on when observing instruction, the degree to
which the principal focuses on classroom management, the degree to which s/he listens to the
content of instruction, and whether the principal discusses the subject of the lesson with students.
For districts that seek to implement standards-based methods of mathematics instruction,
results indicate the importance of attending to several elements of principals’ vision of
instruction, so that principals gain a greater appreciation for the interrelated parts of instructional
practice. Results show that when principals articulate a vision for the kinds of tasks that students
solve and the discussion in which students engage, then teachers in their schools are more likely
to report higher levels of standards-based instructional expectations. The principal’s description
of the role of the teacher appears less influential, based on results when elements are entered
individually in the HGLM model. At the same time, the instructional expectations that teachers
typically perceive from principals are form-oriented. This means that the models in this analysis
primarily provide information about how form-oriented expectations can be predicted. This is a
limitation of the data. The qualitative differences between form- and function-oriented
expectations appear too great to allow for much extrapolation. Further research is needed to
ascertain the degree to which leadership dimensions may predict function-oriented expectations
for standards-based instruction – and how leadership may support the intended goals of
standards-based mathematics instruction.
Finally, this study hypothesized that the pathway through which principals influence
instruction is involvement in the instructional program – involvement conceptualized as setting
standards for instruction and monitoring progress. Given the results of this study, investigation of
additional pathways is warranted. This lies beyond the scope of the current analysis. As briefly
reviewed above, research has suggested a number of ways that the principal, and the principal’s
vision of instruction, may operate. These include the principal’s influence on the coherence of the
school’s instructional program, on school climate, on professional community, and on trust in the
school. Also noted above, the principal’s vision has been found to shape teachers’ access to, and

153
understanding of, instructional policy ideas. It may be useful to investigate how these additional
pathways for principal influence may function in connection with standards-based instructional
expectations, and standards-based instructional practice, in subject-specific contexts.

154
APPENDIX A – NESTING OF ITEM RESPONSE DATA
Item responses were nested within items (vertically, in the table below) and within
persons (horizontally, below). Each item represented one way that a principal may be involved in
the school’s instructional program. Each person reported his/her perception of the level of
involvement in instruction from his/her principal. IRT analysis used the data to produce estimates
describing each person’s report of principal involvement in instruction, and to produce estimates
describing how commonly each type of involvement is likely to occur. Estimates were placed on
a common scale – an interval scale, and location estimates for persons and items could be
compared (see Figure 4, Wright Map, above).
Hypothetical Item Response Data about Principal Involvement in Instruction Item 1 Item 2 … Item I Total Score Person 1 1 2 … 0 11 Person 2 3 1 … 0 14 Person 3 2 2 … 1 17 … … … yij … … Person J 2 3 … 2 23 Total 105 83 … 72

155
APPENDIX B – SEPARATION RELIABILITY COEFFICIENT The person separation reliability coefficient, used in IRT analysis, is defined as the ratio of the
variance explained by the IRT model to the observed total variance (Wright & Masters, 1981):
where
is the variance accounted for by the model,
is the observed total variance, and
is the person location estimate, the amount of involvement perceived by an individual teacher,
the scale value for that individual.
The variance accounted for by the model is the difference between the observed total variance
and the mean square of the standard error of measurement.
and
Where
j is the person index,
J is the total number of teachers,
is the mean square of the standard errors of measurement (MSE),
is the standard error of measurement for the observed location estimates,
is the standard error of measurement for the location estimate for teacher j
Finally,
Where
is the mean of location estimates
is the location estimate for person j.

156

157

158
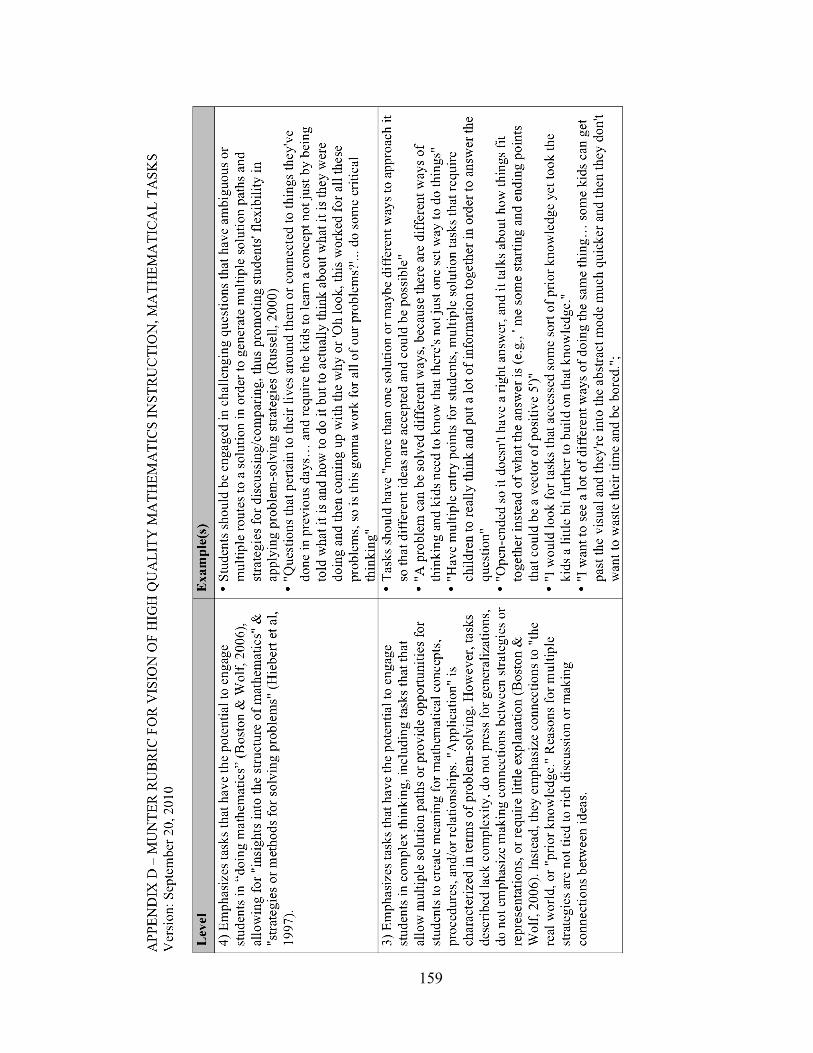
159

160

161

162

163

164

165

166

167
APPENDIX F – RATING SCALE MODEL, ESTIMATES OF ITEM LOCATIONS
Item
Item Parameter Estimate
Standard Error 1 0.80 (0.12) 2 0.54 (0.12) 3 0.43 (0.12) 4 0.11 (0.12) 5 0.48 (0.12) 6 – 0.52 (0.12) 7 – 1.23 (0.12) 8 – 0.60*
Category Thresholds (i.e., “Step” Parameters)
– 2.02 (0.08)
– 0.71 (0.08)
2.73* Final Deviance 1792.87489 Number of Parameters Estimated 11 Person Separation Reliability 0.924 * Estimate is constrained

168
APPENDIX G – SCHOOL-LEVEL LOCATION ESTIMATES FOR PRINCIPAL INVOLVEMENT IN INSTRUCTION, BY DISTRICT
School Location Estimates District – 1.38 Oceanside – 1.29 Lakeside – 1.05 Oceanside – 0.58 Oceanside – 0.51 Lakeside – 0.47 Adams – 0.34 Washington – 0.29 Washington – 0.21 Washington – 0.14 Lakeside – 0.12 Lakeside – 0.1 Lakeside
– 0.06 Lakeside – 0.06 Lakeside 0.04 Lakeside 0.07 Oceanside 0.12 Washington 0.16 Adams 0.2 Lakeside
0.28 Adams 0.39 Lakeside 0.49 Adams 0.56 Oceanside 0.59 Washington 0.69 Adams 0.91 Oceanside 1.02 Oceanside 1.03 Adams 1.28 Adams 1.67 Washington

169
APPENDIX H – HISTOGRAMS OF TWO VERSIONS OF PRINCIPAL VISION VARIABLE, BEFORE AND AFTER IMPUTATION
170
REFERENCES
Abelmann, C., & Elmore, R. (1999). When accountability knocks, will anyone answer? Consortium for Policy Research in Education, Research Report Series RR-42. American Educational Research Association, American Psychological Association, & National Council on Measurement in Education. (1999). Standards for educational and psychological testing. Washington, DC: American Psychological Association. Anderson, C. S. (1982). The search for school climate: A review of the research. Review of Research in Education, 52(3), 368-420. Andrich, D. (1978). A rating formulation for ordered response categories. Psychometrika, 43(4), 561-573. Ball, D. L. (1992). Magical hopes: Manipulatives and the reform of math education. American Educator, 16(2), 14-18 & 46-47. Bamburg, J. D., & Andrews, R. L. (1991). School goals, principals and achievement. School Effectiveness and School Improvement, 2(3), 175-191. Barnes, C. A., Camburn, E., Sanders, B. R., & Sebastian, J. (2010). Developing instructional leaders: Using mixed methods to explore the black box of planned change in principals' professional practice. Educational Administration Quarterly, 46(2), 241-279. Berends, M., Goldring, E., Stein, M., & Cravens, X. (2010). Instructional conditions in charter schools and students' mathematics achievement. American Journal of Education, 116(303-335). Berman, P., & McLaughlin, M. W. (1978). Federal programs supporting educational change, Vol. VIII: Implementing and sustaining innovations: Rand, Santa Monica. Bossert, S. T., Dwyer, D. C., Rowan, B., & Lee, G. V. (1982). The instructional management role of the principal. Educational Administration Quarterly, 18(3), 34-64. Boston, M., & Wolf, M. K. (2006). Assessing academic rigor in mathematics instruction: The development of the instructional quality assessment toolkit, CSE technical report 672: Center for the Study of Evaluation, National Center for Research on Evaluation, Standards, and Student Testing. Brookover, W., Beady, C., Flood, P., Schweitzer, J., & Wisenbaker, J. (1979). School social system and student achievement: Schools can make a difference. New York: Praeger Publishers. Bryk, A., Camburn, E., & Louis, K. S. (1999). Professional community in Chicago elementary schools: Facilitating factors and organizational consequences. Educational Administration Quarterly, 35(Supplement), 751-781. Bryk, A. S., & Schneider, B. (2002). Trust in schools: A core resource for improvement. New York: Russell Sage Foundation.

171
Burch, P. (2007). The professionalization of instructional leadership in the United States: Competing values and current tensions. Journal of Education Policy, 22(2). Carmichael, S. B., Martino, G., Porter-Magee, K., & Wilson, W. S. (2010). The state of state standards and the common core – in 2010. Thomas B. Fordham Institute. City, E. A., Elmore, R. F., Fiarman, S. E., & Teitel, L. (2009). Instructional rounds in education: A network approach to improving teaching and learning. Cambridge, MA: Harvard Education Press. Cobb, P., McClain, K., Lamberg, T. D., & Dean, C. (2003). Situating teachers’ instructional practices in the institutional setting of the school and district. Educational Researcher, 32(6), 13-24. Cobb, P., & McClain, K. (2006). The collective mediation of a high-stakes accountability program: Communities and networks of practice. Mind, Culture, and Activity, 13(2), 80-100. Cobb, P., Smith, T. (2008). The challenge of scale: Designing schools and districts as learning organizations for instructional improvement in mathematics. In K. Krainer & T. Wood (Eds.), International handbook of mathematics teacher education: Vol. 3. Participants in mathematics teacher education: Individuals, teams, communities, and networks (pp. 231-254). Rotterdam, The Netherlands, Sense. Coburn, C. E. (2001). Collective sensemaking about reading: How teachers mediate reading policy in their professional communities. Educational Evaluation and Policy Analysis, 23(2), 145-170. Coburn, C. E. (2005). Shaping teacher sensemaking: School leaders and the enactment of reading policy. Educational Policy, 19(3), 476-509. Coburn, C. E., & Russell, J. L. (2008). District policy and teachers’ social networks. Educational Evaluation and Policy Analysis, 30(3), 203-235. Cohen, D. K., & Barnes, C. A. (1993). Pedagogy and policy. In D. K. Cohen, M. W. McLaughlin, & J. E. Talbert (Eds.), Teaching for understanding: Challenges for policy and practice. (pp. 207-239). San Francisco: Jossey-Bass Publishers. Cohen, D. K., Moffitt, S. L., & Goldin, S. (2007). Policy and practice: The dilemma. American Journal of Education, 113(4), 515-548. Consortium for Policy Research in Education (CPRE). (2005). Study of School Leadership, School Staff Questionnaire. Consortium on Chicago School Research. (2006). Public Use Data Set: 2003 Survey of Students and Teachers User's Manual: Author. Copland, M. A. (2003). Leadership of inquiry: Building and sustaining capacity for school improvement. Educational Evaluation and Policy Analysis, 25(4), 375-395.

172
Corbin, J., & Strauss, A. (2008). Basics of qualitative research: Techniques and procedures for developing grounded theory. Los Angeles: Sage Publications. Cuban, L. (1988). The managerial imperative and the practice of leadership in school. Albany, NY: State University of New York Press. Doyle, W. (1983). Academic work. Review of Research in Education, 53(2), 159-199. Desimone, L. M. (2006). Consider the source: Response differences among teachers, principals, and districts on survey questions about their education policy environment. Educational Policy, 20(4), 640-676. DeVellis, R. F. (2003). Scale development: Theory and applications. Thousand Oaks, CA: Sage Publications. Dorans, N. J., & Holland, P. W. (1993). DIF detection and description: Mantel-Haenszel and standardization. In P. W. Holland & H. Wainer (Eds.), Differential item functioning (pp. 35-66). Hillsdale NJ: Erlbaum. Elmore, R. F. (1996). Getting to scale with good educational practice. Harvard Educational Review, 66(1), 1-26. Elmore, R. F. (2000). Building a new structure for school leadership. Washington. DC: The Albert Shanker Institute. Embretson S. E.., & Reise, S. P. (2000). Item response theory for psychologists. Mahwah, NJ: Lawrence Erlbaum Associates, Publishers. Fielding, A. (2003). Ordered category responses and random effects in multilevel and other complex structures. In S. P. Reise & H. Duan, (Eds.) Multilevel modeling: Methodological advances, issues, and applications. Mahwah, NJ: Lawrence Erlbaum Associates, Inc. Fink, E., & Resnick, L. (2001, April). Developing principals as instructional leaders. Phi Delta Kappan, 598 – 606. Fox, J.-P. (2005). Multilevel IRT using dichotomous and polytomous response data. British Journal of Mathematical and Statistical Psychology, 58, 145-172. Franke, M. L., Kazemi, E., & Battey, D. (2007). In F. K. Lester, Jr., (Ed.). Second handbook of research on mathematics teaching and learning. (pp. 225-256). National Council of Teachers of Mathematics. Fuhrman, S. H. (2001). Introduction in S. H. Fuhrman (Ed.) From the capitol to the classroom: Standards-based reform in the States, One hundredth yearbook of the National Society for the Study of Education, Part II. (pp. 1-12). Chicago: University of Chicago Press. Garrison, A. (2010). Understanding variation in maintenance of the cognitive demand of mathematical tasks across school districts. In Brosnan, P., Erchick, D. B., & Flevares, L. (Eds.), Proceedings of the 32nd annual meeting of the North American Chapter of the International Group for the Psychology of Mathematics Education. Columbus, OH: The Ohio State University.

173
Goldring, E., & Cravens, X. (2006). Teachers' academic focus on learning in charter and non-charter schools. Paper prepared for the National Conference on Charter School Research. Goldring, E., Huff, J., Camburn, E., & Spillane, J. (2008). Measuring mediating variables in randomized experiments with school principals. Paper presented at the Society for Research on Educational Effectiveness, First Annual Conference, Washington, D.C. Goldring, E., Huff, J., May, H., & Camburn, E. (2006). School context and individual characteristics: What influences principal practice? Paper presented at the 2006 University Council of Educational Administration Annual Conference. Goldring, E. B., Huff, J., Spillane, J. P., & Barnes, C. (2006). Measuring the instructional leadership expertise of school principals. Paper presented at the 2006 meeting of the American Educational Research Association. Goldring, E., Porter, A. C., Murphy, J., Elliott, S. N., & Cravens, X. (2007). Assessing learning-centered leadership: Connections to research, professional standards, and current practices: The Wallace Foundation. Grant, S. G., Peterson, P. L., & Shojgreen-Downer, A. (1996). Learning to teach mathematics in the context of systemic reform. American Educational Research Journal, 33, 509-541. Hallinger, P., Bickman, L., & Davis, K. (1996). School context, principal leadership, and student reading achievement. The Elementary School Journal, 96(5), 527-549. Hallinger, P., & Heck, R. H. (1998). Exploring the Principal’s Contribution to School Effectiveness: 1980-1995. School Effectiveness and School Improvement, 9(3), 157-191. Hallinger, P., & Murphy, J. (1985). Assessing the instructional management behavior of principals. The Elementary School Journal, 86(2), 217-247. Hambleton, R. K. & Jones, R. W. (n.d.) Comparison of classical test theory and item response theory and their applications to test development. ITEMS: Instructional Topics in Educational Measurement. National Council on Measurement in Education. Haug, C. (1999). Local understanding, resources, and policies: Obstacles to standards-based mathematics education reform. Unpublished doctoral dissertation, University of Colorado, Boulder. Hayton, J. C., Allen, D. G., & Scarpello, V. (2004). Factor retention decisions in exploratory factor analysis: A tutorial on parallel analysis. Organizational Research Methods, 7(2), 191-205. Heck, R. H., Larsen, T. J., & Marcoulides, G. A. (1990). Instructional leadership and school achievement: Validation of a causal model. Educational Administration Quarterly, 26(2), 94-125. Heller, M. F., & Firestone, W. A. (1995). Who's in charge here? Sources of leadership for change in eight schools. The Elementary School Journal, 96(1), 65-86. Hiebert, J., Carpenter, T. P., Fennema, E., Fuson, K., & Human, P. (1996). Problem solving as a basis for reform in curriculum and instruction: The case of mathematics. Educational Researcher, 25(4), 12-21.

174
Hiebert, J., Carpenter, T. P., Fennema, E., Fuson, K. C., Wearne, D., Murray, H., Olivier, A., & Human, P. (1997). Making sense: Teaching and learning mathematics with understanding. Portsmouth, NH: Heinemann. Hiebert, J., & Grouws, D. A. (2007). The effects of classroom mathematics teaching on students’ learning. In F. K. Lester, Jr., (Ed.). Second handbook of research on mathematics teaching and learning. (pp. 371 – 404). National Council of Teachers of Mathematics. Hill, H. C. (2001). Policy is not enough: Language and the interpretation of state standards. American Educational Research Journal, 38(2), 289-318. Hufferd-Ackles, K., Fuson, K. C., & Sherin, M. G. (2004). Describing levels and components of a math-talk learning community. Journal for Research in Mathematics Education, 35(2), 81-116. Jacob, B. A., & Lefgren, L. (2004). The impact of teacher training on student achievement: Quasi-experimental evidence from school reform efforts in Chicago. The Journal of Human Resources, 39(1), 50-79. Kane, M. T. (2001). Concerns in validity theory. Journal of Educational Measurement, 38(4), 319-342. Karabenick, S. A., Woolley, M. E., Friedel, J. M., Ammon, B. V., Blazevski, J., Bonney, C. R., et al. (2007). Cognitive processing of self-report items in educational research: Do they think what we mean? Educational Psychologist, 42(3), 139-151. Kaufman, J. H., & Stein, M. K. (2009). Teacher learning opportunities in a shifting policy environment for instruction. Educational Policy. Kazemi, E., & Stipek, D. (2001). Promoting conceptual thinking in four upper-elementary mathematics classrooms. The Elementary School Journal, 102(1), 59-80. Knapp, M. S. (1997). Between systemic reforms and the mathematics and science classroom: The dynamics of innovation, implementation, and the professional learning. Review of Educational Research, 67(2), 227-266. Knapp, M. S., Copland, M. A., Ford, B., Markholt, A., McLaughlin, M. W., Milliken, M., et al. (2003). Leading for learning sourcebook: Concepts and examples: Center for the Study of Teaching and Policy. Leithwood, K., & Jantzi, D. (2006). Transformational school leadership for large-scale reform: Effects on students, teachers, and their classroom practices. School Effectiveness and School Improvement, 17(2), 201-227. Leithwood, K., Jantzi, D. (2008). Linking leadership to student learning: The contributions of leader efficacy. Educational Administration Quarterly, 44(4), 496-528. Leithwood, K., Louis, K. S., Anderson, S., & Wahlstrom, K. L. (2004). How leadership influences student learning: Center for Applied Research and Educational Improvement.

175
Leithwood, K. A., & Montgomery, D. J. (1982). The role of the elementary school principal in program improvement. Review of Educational Research, 52(3), 309-339. Linacre, J. M. (1994). Sample size and item calibration stability. Rasch Measurement Transactions, 7, 328. Long, J. S. (1997). Regression models for categorical and limited dependent variables. Thousand Oaks, CA: Sage Publications. Lord, F., M., & Novick, M. R. (1968). Statistical theories of mental test scores. Reading, MA: Addison-Wesley Publishing Company. Louis, K. S., Dretzke, B., & Wahlstrom, K. (n. d.) How does leadership affect student achievement? Results from a national U. S. survey. Maier, K. S. (2001). A Rasch hierarchical measurement model. Journal of Educational and Behavioral Statistics, 26(3), 307-330. Mantel, N., & Haenszel, W. (1959). Statistical aspects of the analysis of data from retrospective studies of disease. Journal of the National Cancer Institute, 22(4), 719-748. Marks, H. M. & Printy, S. M. (2003). Principal leadership and school performance: An integration of transformational and instructional leadership. Educational Administration Quarterly, 39(3), 370-397. Marks, H. M., & Nance, J. P. (2007). Contexts of accountability under systemic reform: Implications for principal influence on instruction and supervision. Educational Administration Quarterly, 43(1), 3-37. McLaughlin, M., & Talbert, J. (2003). Reforming districts: How districts support school reform: Center for the Study of Teaching and Policy. Messick, S. (1994). Validity of psychological assessment: Validation of inferences from persons' responses and performances as scientific inquiry into score meaning (Research Report RR-94-45): Educational Testing Service, Princeton, NJ. Miller, T. R., & Spray, J. A. (1993). Logistic discriminant function analysis for DIF identification of polytomously scored items. Journal of Educational Measurement, 30(2), 107-122. Moses, R. P., Kamii, M., Swap, S. M., & Howard, J. (1989). The algebra project: Organizing in the spirit of Ella. Harvard Educational Review, 59(4), 423-443. Munter, C. (unpublished). High Quality Mathematics Instruction Rubrics: Nature of Classroom Discourse Rubric, Mathematical Tasks Rubric, and Role of Teacher Rubric. Munter, C. (2009a). Defining visions of high-quality mathematics instruction. In S. L. Swars, D. W. Stinson, & S. Lemons-Smith, (Eds.), Proceedings of the Thirty First Annual Meeting of the North American Chapter of the International Group for the Psychology of Mathematics Education (pp. 983-991). Atlanta, GA: Georgia State University.

176
Munter, C. (2009b). Developing visions of high-quality mathematics instruction. Unpublished major area Paper, Vanderbilt University. Murphy, J. (1988). Methodological, measurement, and conceptual problems in the study of instructional leadership. Educational Evaluation and Policy Analysis, 10(2), 117-139. Murphy, J. (1990). Principal instructional leadership. In R. S. Lotto & P. W. Thurston (Eds.), Advances in Educational Administration: Changing Perspectives on the School (Vol. 1, Pt. B, pp. 163-200). Greenwich, CT: JAI Press Inc. National Council of Teachers of Mathematics. (1989). Curriculum and evaluation standards for school mathematics. Reston, VA: Author. National Council of Teachers of Mathematics. (2000). Principles and standards for school mathematics. Reston, VA: Author. National Research Council. (1989). Everybody counts: A report to the nation on the future of mathematics education. Washington, DC: Author. Nelson, B. S. (1998). Lenses on learning: Administrators' views on reform and the professional development of teachers. Journal of Mathematics Teacher Education, 1, 191-215. Nelson, B. S. (1999). Building new knowledge by thinking: How administrators can learn what they need to know about mathematics education reform. Newton, MA: Education Development Center. Nelson, B. S., & Sassi, A. (2000). Shifting approaches to supervision: The case of mathematics supervision. Educational Administration Quarterly, 36(4), 553-584. Nelson, B. S., & Sassi, A. (2005). The effective principal: Instructional leadership for high-quality learning. New York: Teachers College Press. Nelson, B. S., & Sassi, A. (2006). What to look for in your math classrooms. Principal 46-49. Newmann, F. M., & Wehlage, G. G. (1995). Successful school restructuring. A report to the public and educators by the Center on Organization and Restructuring of Schools: The American Federation of Teachers Newmann, F. M., Smith, B., Allensworth, E., & Bryk, A. S. (2001). Instructional program coherence: What it is and why it should guide school improvement policy. Educational Evaluation and Policy Analysis, 23(4), 297-321. Nussbaum, M. C. (1990). Love’s knowledge: Essays on philosophy and literature. New York: Oxford University Press. Printy, S. M. (2002). Communities of practice: Participation patterns and professional impact for high school mathematics and science teachers. Unpublished doctoral dissertation, Ohio State University. Purkey, S. C., & Smith, M. S. (1983). Effective schools: A review. The Elementary School Journal, 83(4), 426-452.

177
Quinn, D. M. (2002). The impact of principal leadership behaviors on instructional practice and student engagement. Journal of Educational Administration, 40(5), 447-467. Raudenbush, S. W., & Bryk, A. S. (2002). Hierarchical linear models. Thousand Oaks, CA: Sage Publications. Reed, K. E., Goldsmith, L. T., & Nelson, B. S. (2006). Elementary and middle school teachers' perceptions of their principals' instructional leadership in mathematics: Preliminary results. Paper presented at the Research Pre-Session of the Annual Meeting of the National Council of Teachers of Mathematics. Robinson, V. M. J., Lloyd, C. A., & Rowe, K. J. (2008). The impact of leadership on student outcomes: An analysis of the differential effects of leadership types. Educational Administration Quarterly, 44(5), 635-674. Rosenholtz, S. J. (1985). Effective schools: Interpreting the evidence. American Journal of Education, 93(3), 352-388. Rosenholtz, S. J. (1989). Teachers’ workplace: The social organization of schools. New York: Longman, Inc. Rowan, B., Raudenbush, S. W., & Kang, S. J. (1991). Organizational design in high schools: A multilevel analysis. American Journal of Education, 99(2), 238-266. Schmidt, W. H. (2003). Too little too late: American high schools in international context. In D. Ravitch (Ed.), Brookings papers on education policy (pp. 253-309). Washington D.C.: The Brookings Institution. Comments by I. Rotberg & A. Seigel, pp. 278 – 309. Schoenfeld, A. H. (1982). Measures of problem-solving performance and of problem-solving instruction. Journal for Research in Mathematics Education, 13(1), 31-49. Schoenfeld, A. H. (2002). Making mathematics work for all children: Issues of standards, testing, and equity. Educational Researcher, 31(1), 13-25. Schoenfeld, A. H. (2004). The Math Wars. Educational Policy, 18(1), 253-286. Schön, D. A. (1983). The reflective practitioner: How professionals think in action. New York: Basic Books. Shepard, L. A. (1993). Evaluating test validity. Review of Research in Education, 19, 405-450. Sherin, M. G. (2002). When teaching becomes learning. Cognition and Instruction, 20(2), 119-150. Shulman, L. (1986). Those who understand: Knowledge growth in teaching. Educational Researcher, 15(2), 4-14. Southern Regional Education Board (SREB), Bottoms, G., & Frye, B. (2009). The district leadership challenge: Empowering principals to improve teaching and learning.

178
Spiegelhalter, D., Thomas, A., & Best, N. (2003). WinBUGS User Manual: Version 1.4, January 2003. Retrieved on October 30, 2010, from http://www.mrc-bsu.cam.ac.uk/bugs/winbugs/manual14.pdf Spillane, J. P. (2000a). District leaders’ perceptions of teacher learning. CPRE Occasional Paper Series OP-05. Consortium for Policy Research in Education. Spillane, J. P. (2000b). Cognition and policy implementation: District policymakers and the reform of mathematics education. Cognition and Instruction, 18(2), 141-179. Spillane, J. P., & Callahan, K. A. (2000). Implementing state standards for science education: What district policy makers make of the hoopla. Research in Science Teaching, 37(5), 401-425. Spillane, J. P., Halverson, R., & Diamond, J. B. (2001). Investigating school leadership practice: A distributed perspective. Educational Researcher, 30(3), 23-28. Spillane, J. P., Halverson, R., & Diamond, J. B. (2004). Towards a theory of leadership practice: A distributed perspective. Journal of Curriculum Studies, 36(1), 3-34. Spillane, J. P., Reiser, B. J., & Reimer, T. (2002). Policy implementation and cognition: Reframing and refocusing implementation research. Review of Research in Education, 72(3), 387-431. Spillane, J. P., & Thompson, C. L. (1997). Reconstructing conceptions of local capacity: The local education agency's capacity for ambitious instructional reform. Educational Evaluation and Policy Analysis, 19(2), 185-203. Spillane, J. P., & Zeuli, J. S. (1999). Reform and teaching: Exploring patterns of practice in the context of national and state mathematics reforms. Educational Evaluation and Policy Analysis, 21(1), 1-27. Stein, M. K., & D’Amico, L. (2000). How subjects matter in school leadership. Paper presented at the annual meeting of the American Educational Research Association. Stein, M. K., Grover, B. W., & Henningsen, M. (1996). Building student capacity for mathematical thinking and reasoning: An analysis of mathematical tasks used in reform classrooms. American Educational Research Journal, 33(2), 455-488. Stein, M. K., & Nelson, B. S. (2003). Leadership content knowledge. Educational Evaluation and Policy Analysis, 25(4), 423-448. Stein, M. K., Engle, R. A., Smith, M. S., & Hughes, E. K. (2008). Orchestrating productive mathematical discussions: Five practices for helping teachers move beyond show and tell. Mathematical Thinking and Learning, 10(4), 313-340. Stigler, J. W., & Hiebert, J. (1999). The teaching gap: Best ideas from the world’s teachers for improving education in the classroom. New York: NY: The Free Press. Supovitz, J. A., & Poglinco, S. M. (2001). Instructional leadership in a standards-based reform: Consortium for Policy Research in Education.

179
Supovitz, J., Sirinides, P., & May, H. (2010). How principals and peers influence teaching and learning. Educational Administration Quarterly, 46(1), 31-56. Thayer, L. (1988). “Leadership/Communication: A critical review and a modest proposal” in G. M. Goldhaber, & G. A. Barnett (Eds.) Handbook of organizational communication. Norwood, NJ: Ablex Publishing Corp. U.S. Department of Education, National Center for Education Statistics. (2003). Teaching Mathematics in Seven Countries: Results From the TIMSS 1999 Video Study, NCES (2003-013), by James Hiebert, Ronald Gallimore, Helen Garnier, Karen Bogard Givvin, Hilary Hollingsworth, Jennifer Jacobs, Angel Miu-Ying Chui, Diana Wearne, Margaret Smith, Nicole Kersting, Alfred Manaster, Ellen Tseng, Wallace Etterbeek, Carl Manaster, Patrick Gonzales, and James Stigler. Washington, DC: Author. Weick, K. E. (1995). Sensemaking in organizations. Thousand Oaks, CA: Sage Publications. Wilson, M. (2005). Constructing Measures: An Item Response Modeling Approach. Mahwah, NJ: Lawrence-Erlbaum. Wright, B. D. & Masters, G. N. (1981). Rating scale analysis. Chicago: MERA Press. Wu, M.L., Adams, R.J. & Wilson, M.R. (1997). Conquest: Generalised Item Modelling Software. Australian Council for Educational Research: Hawthorn, Victoria. Young, V. M. (2006). Teachers' use of data: Loose coupling, agenda setting, and team norms. American Journal of Education, 112, 521-548. Zumbo, B. D. (1999). A handbook on the theory and methods of differential item functioning (DIF): Logistic regression modeling as a unitary framework for binary and Likert-type (ordinal) item scores. Ottawa, Ontario, Canada: Directorate of Human Resources Research and Evaluation, Department of National Defense.