Embed Size (px)
Citation preview

Standard X-ray Diffraction
Powder Patterns
NBS CIRCULAR 539VOLUME III
UNITED STATES DEPARTMENT OF COMMERCE
NATIONAL BUREAU OF STANDARDS

Standard X-ray Diffraction Powder Patterns
The two previously issued volumes in this series are avail-
able from the Superintendent of Documents, U. S. Govern-ment Printing Office, Washington 25, D. C., as follows:
NBS Circular 539, Volume I, Standard X-ray Diffraction
Powder Patterns (Data for 54 inorganic substances)
NBS Circular 539, Volume II, Standard X-ray Diffraction
Powder Patterns (Data for 30 inorganic substances)
The price of each volume is 45 cents. Send orders withremittance to: Superintendent of Documents, GovernmentPrinting Office, Washington 25, D. C.
/

UNITED STATES DEPARTMENT OF COMMERCE • Sinclair Weeks, Secretary
NATIONAL BUREAU OF STANDARDS • A. V. Astin, Director
Standard X-ray Diffraction
Powder Patterns
Howard E. Swanson, Ruth K. Fuyat, and George M. Ugrinic
National Bureau of Standards Circular 539
Volume III, Issued June 10, 1954
For sale by the Superintendent of Documents, U. S. Government Printing Office, Washington 25, D. C.
Price 45 cents

Contents
Page
1. Introduction 1
2. X-ray data 4
2.1. Elements 4
Titanium, Ti 4
Arsenic, As 6
Rhodium, Rh 9
Cadmium,Cd 10
Indium, In 12
Antimony, Sb 14
Iodine, I 2 16
Hafnium, Hf 18
Bismuth, Bi 20
2.2. Selenides 23
Zinc selenide, ZnSe 23
2.3. Oxides 24
Silicon dioxide (alpha quartz), Si02 24
Scandium oxide, Sc20
327
Yttrium oxide, Y20328
Molybdenum trioxide (molybdite), Mo03
30
Antimony trioxide (senarmontite),Sb
20
3 31
Lanthanum oxide, La203
33
Mercury (II) oxide (montroydite) HgO 35
2.4. Oxide hydrates 38
Aluminum oxide mono-hydrate, alpha,
(bohmite), A1203
"H20 38
Aluminum oxide mono-hydrate, beta, (dia-
spore), A1203*H
20 41
2. X-ray data—Con. Page
2.5. Multiple oxides 44
Strontium titanate, SrTi03
44
Barium titanate, BaTi03 45
2.6. Halides 47
Sodium bromide, NaBr 47
Cesium bromide, CsBr 49
Cesium dichloroiodide, CsICl2 50
2.7. Chlorates 51
Sodium chlorate, NaC103
51
2.8. Carbonates 53
Calcium carbonate (aragonite), CaC03 53
Strontium carbonate (strontianite)
,
SrC03 56
2.9. Nitrates 58
Potassium nitrate (niter), KN03 58
2.10. Sulfates and Sulfites 60
Sodium sulfite, Na2S03
60
Potassium sulfate (arcanite), K2S04 62
Barium sulfate (barite), BaS04 65
Lead sulfate (anglesite), PbSC>4 67
2.11. Phosphates 69
Potassium dihydrogen phosphate, KH2P0
469
2.12. Bromoosmates 71
Ammonium bromodsmate, (NH4) 20sBr 671
3. Cumulative index to volumes I, II,
and III 72
ERRATA
Vol. I. Page 64, table 37, Swanson and Tatge pattern. The a value
for the d spacing at 2.680 should read 4.642.
Vol. II. Page 54, column 1. The a and c values for Bergen should
read 4.99003 and 17.0605.
II

STANDARD X-RAY DIFFRACTION POWDER PATTERNS
Vol. Ill—Data for 34 Inorganic Substances
Howard E. Swanson, Ruth K. Fuyat 1,
and George M. Ugrinic
Data for thirty-two standard X-ray diffraction powder patterns are presented in
revision of the eighty-one corresponding patterns in the American Society for Testing
Materials card file, a system for the identification of unknown crystalline materials
based on the three strongest reflections of each structurally distinct phase. Pat-
terns for two compounds not represented in the file are also included. A comparison
is made between all powder data available for each of the substances reported. The
patterns were made with a geiger counter X-ray spectrometer, using samples of excep-
tionally high purity. The d-spacings were assigned Miller indices determined from
calculated patterns of theoretical spacings and from space group considerations. The
lattice constants and densities were calculated, and the refractive indices were
measured whenever possible.
Included in this report is X-ray data for the following thirty-four substances:
Ti, As, Rh, Cd, In, Sb, I2 ,
Hf, Bi, ZnSe, Si02
(a-quartz), Sc20
3 , Y20
3 ,Mo0
3(molyb-
dite), Sb20
3(senarmontite)
,La
203 ,HgO (montroydite)
,a-Al
20
3'H
20 (bohmite),
/3-Al20
3'H
20 (diaspore), SrTi0
3 ,BaTi0
3 ,NaBr, CsBr, CsICl
2 ,NaC10
3,CaCo
3(aragonite),
SrC03(strontianite)
,KN0
3(niter), Na
2S0
3, K
2S0
4(arcanite), BaS0
4(barite), PbS0
4
(anglesite), KH 2 P0 4 ,and (NH
4 )20sBr
6
1. INTRODUCTIONoxide and ammonium bromoosmate, not repre-
sented in the file, have been added.
Experimental procedures and the general
plan of these reports are discussed in the
first three papers of this series, two by
Swanson and Tatge [1, 2] 4 and one by Swanson
and Fuyat [3]. The significant changes in
procedure and certain basic data discussed
below are arranged in the same form as the
data for each compound in the body of the re-
port .
ASTM Cards. Each section of this paper,
devoted to the discussion of X-ray data for
one substance, contains a table listing old
and new file card numbers, the ASTM index
lines, the radiation used and the literature
reference for each card. The old card num-
bers of these tables refer to the original
ASTM card file (1939) and the first supple-
ment (1944). The new card numbers are from
4 Figures in brackets indicate the literature refer-
ences at the end of each section of this paper.
The National Bureau of Standards program 3
for revision and evaluation of published
X-ray data for the American Society for Test-
ing Materials card file presents in this paper
a third series 3 of standard powder diffrac-
tion patterns for nine elements and twenty-
three inorganic compounds. These patterns
are recommended to replace eighty- four cards
now in the file. Two compounds, scandium
3 Fellow at the National Bureau of Standards sponsoredby the Joint Committee on Chemical Analysis by X-ray Dif-fraction Methods.
2 This project is sponsored by the Joint Committee on
Chemical Analysis by X-ray Diffraction Methods, composed of
members from the American Society for Testing Materials,
the American Crystallographic Association, and the BritishInstitute of Physics. Financial support is being given by
the National Bureau of Standards and the Flight ResearchLaboratory, Wright Air Development Center, Wright-PattersonAir Force Base.
3 The first paper of this series is Standard X-ray Dif-
fraction Powder Patterns, I. Data for 53 Inorganic Sub-
stances by H. E. Swanson and E. Tatge, and the second is
Standard X-ray Diffraction Powder Patterns, II. Data for
30 Inorganic Compounds by H. E. Swanson and R. K. Fuyat.
1

the second edition and include the second
supplement (1950).
Additional published patterns. Litera-
ture references and radiation data for pat-
terns that had not been published as ASTMcards were listed and the patterns were included
in the tables of d-spacings and intensities.
INBS pattern. The samples used to make
the NBS patterns were special preparations
of exceptionally high purity obtained or pre-
pared only in small quantities.
The purity of each sample was determinedby a spectrographic or chemical analysis. Aphase purity check was made on the nonopaque
materials during the refractive index deter-
mination. Another excellent check on the
phase purity was provided by the X-ray pat-
tern itself, since it was indexed by compari-
son with theoretical d-values. However, some
uncertainty was possible in the unequivocal
isolation of the desired isomorphic forms
when their d-spacings tended to coincide.
The majority of the samples that were in-
itially too coarse for X-ray analysis could
be reduced to the proper size and then an-
nealed to remove the lattice distortion
caused by grinding. It was found that powder
samples of soluble salts which could not be
annealed successfully or which could not be
obtained free from the distortion of grind-
ing, could be recrystallized by using a
throat aspirator. Particles averaging 15 mi-
crons were obtained by using an aspirator or
a nebulizer in which a concentrated solution
of a salt was atomized to form a fine mist.
This mist was confined in a box set over a
glass plate on which the crystallites fell as
they formed. Sufficient material, fine
enough for .an intensity pattern, could be
collected in a few hours.
The equipment and procedures were essen-
tially the same as those described in Stand-
ard X-ray Diffraction Patterns [1] and
Standard X-ray Diffraction Powder Patterns I
[2] with the exception of the newer X-ray
spectrometer equipment described in Standard
X-ray Diffraction Powder Patterns II [3].
At least two intensity patterns were pre-
pared to check reproducibility of measured
values. The grain sizes of samples used were
less than 25 microns. A flat piece of glass
was held temporarily over the face of an open
cell while the sample was drifted in from the
top. The sample holder was then turned face
up, and the piece of glass removed. This
surface was used for exposure to the X-ray
beam. For a few powder samples which did not
flow readily or were prone to orient badly,
25 to 50 percent finely ground silica-gel was
added as a diluent. The intensity values of
each pattern were measured as peak height
above background and were expressed as per-
centages of the strongest line. The d-spacing
patterns were made with a sample packed into
a shallow sample holder, using approximately
5 weight percent of tungsten as an internal
standard, whose lattice constant at 25 °C is
3.1648 A, as determined by Jette and Foote
[4] . All the NBS patterns were made by using
copper radiation with a wavelength of 1.5405.
Interplanar spacings and intensity meas-
urements. Interplanar spacing data presented
in the tables were converted to angstrom
units as internationally defined in 1946 [5],
from Bragg angle data, from d-spacings in kX
units or supposed kX units, using the factor
1.00202, or from d-spacings with specifically
stated wavelengths other than kX. In each
case the type of conversion made was indi-
cated. The wavelength values in the tables
of d-spacings and intensities are given in
angstroms; the values listed under the first
section of the reports, ASTM cards, are the
original values taken from the literature.
The tables of patterns contain data from
the original literature except in those in-
stances where there is no reference other
than an ASTM card.
Intensities, when not numerically evalu-
ated, were given the following abbreviations:
strong, s; medium, m; weak, w; very, v; dif-
fuse, D; and doublet, db.
Indexing of the NBS patterns was accom-
plished by comparison of the experimental
data with theoretical values of all possible
Miller indices of a particular cell calcu-
lated with the aid of IBM punched-card ma-
chines. The unit cells used for these calcu-
lations were obtained either through a review
of the literature or with an estimated cell
based on partial indexing of the NBS pat-
tern. The indexing as it appears in the
tables includes all of the probable indices
for any given d-spacing allowed by the space
group of that structure. Although an attempt
was made to reconcile these values with pub-
2
lished single crystal work when it was avail-
able, errors inherent in this method of in-
dexing undoubtedly are present. For the NBSpattern a maximum of 40 lines were generally
considered sufficient for any identification
problem, and indexing of a cell large enough
to have many more lines would become increas-
ingly indefinite beyond that number.
The intensity of the three strongest
lines is particularly important as the ASTMcard file system of identification depends
upon comparing the three strongest lines of
the unknown material with those on the file
cards, which are arranged according to their
first, second, and third strongest lines, re-
spectively. Thus a table of the three
strongest lines of each pattern is listed for
comparison with the NBS values.
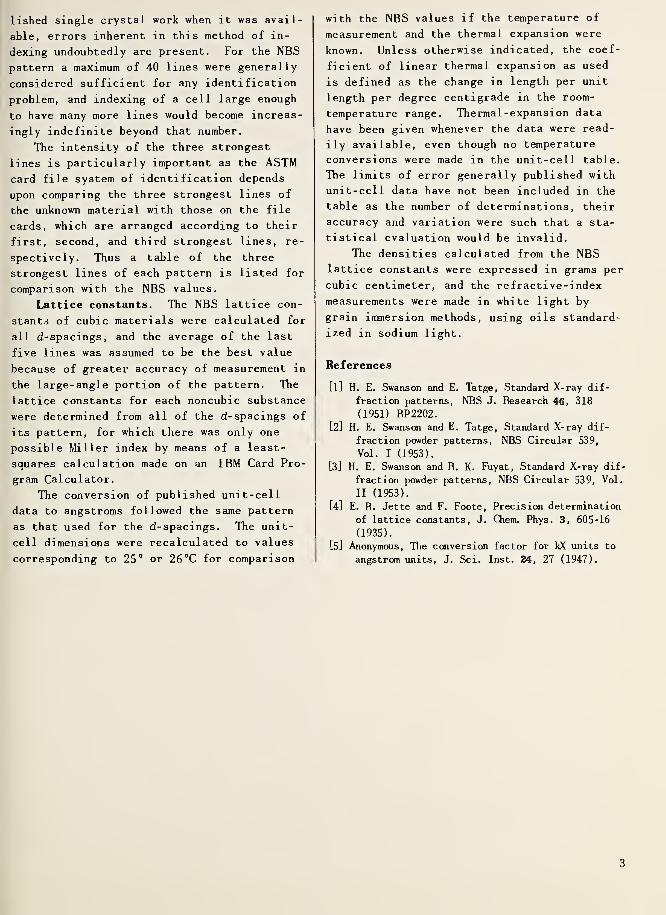
Lattice constants. The NBS lattice con-
stants of cubic materials were calculated for
all d-spacings, and the average of the last
five lines was assumed to be the best value
because of greater accuracy of measurement in
the large-angle portion of the pattern. The
lattice constants for each noncubic substance
were determined from all of the d-spacings of
its pattern, for which there was only one
possible Miller index by means of a least-
squares calculation made on an IBM Card Pro-
gram Calculator.
The conversion of published unit-cell
data to angstroms followed the same pattern
as that used for the d-spacings. The unit-
cell dimensions were recalculated to values
corresponding to 25° or 26°C for comparison
with the NBS values if the temperature of
measurement and the thermal expansion were
known. Unless otherwise indicated, the coef-
ficient of linear thermal expansion as used
is defined as the change in length per unit
length per degree centigrade in the room-
temperature range. Thermal -expansion data
have been given whenever the data were read-
ily available, even though no temperature
conversions were made in the unit-cell table.
The limits of error generally published with
unit-cell data have not been included in the
table as the number of determinations, their
accuracy and variation were such that a sta-
tistical evaluation would be invalid.
The densities calculated from the NBSlattice constants were expressed in grams per
cubic centimeter, and the refractive-index
measurements were made in white light by
grain immersion methods, using oils standard-
ized in sodium light.
References
[1] H. E. Swanson and E. Tatge, Standard X-ray dif-
fraction patterns, NBS J. Research 46, 318
(1951) RP2202.
[2] H. E. Swanson and E. Tatge, Standard X-ray dif-
fraction powder patterns, NBS Circular 539,
Vol. I (1953).
[3] H. E. Swanson and R. K. Fuyat, Standard X-ray dif-
fraction powder patterns, NBS Circular 539, Vol.
II (1953).
[4] E. R. Jette and F. Foote, Precision determination
of lattice constants, J. Chem. Phys. 3, 605-16
(1935).
[5 ] Anonymous, The conversion factor for kX units to
angstrom units, J. Sci. Inst. 24, 27 (1947).
3
2. X-RAY DATA
2.1. Elements
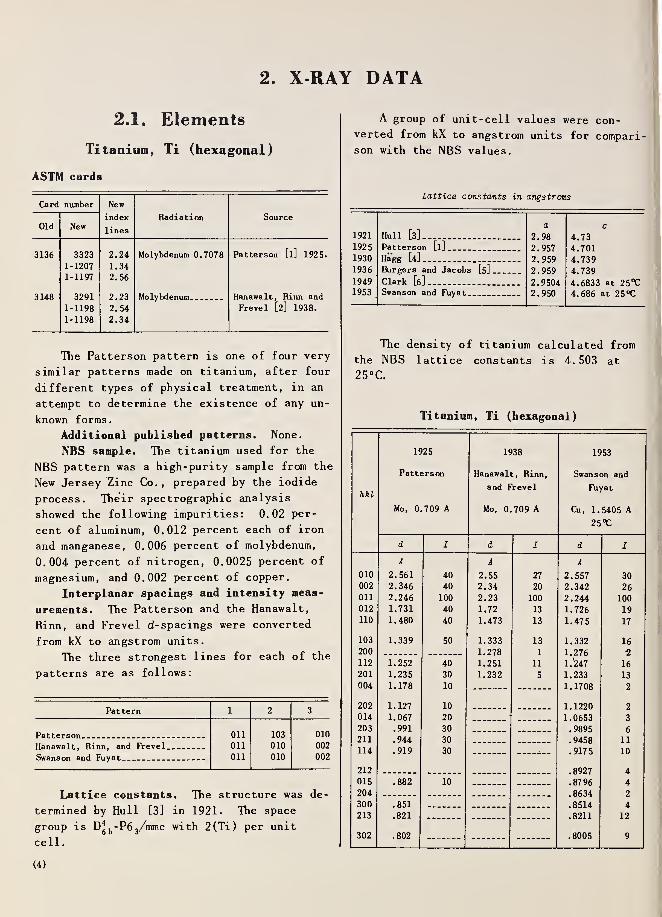
Titanium, Ti (hexagonal)
ASTM cards
Card number New
index
lines
Radiation SourceOld New
3136 3323 2.24 Molybdenum 0.7078 Patterson [l] 1925.
1-1207 1.34
1-1197 2.56
3148 3291 2.23 Molybdenum. Hanawalt, Rinn and
1-1198 2.54 Frevel [2 ] 1938.
1-1198 2.34
The Patterson pattern is one of four very
similar patterns made on titanium, after four
different types of physical treatment, in an
attempt to determine the existence of any un-
known forms.
Additional published patterns. None.
NBS sample. The titanium used for the
NBS pattern was a high-purity sample from the
New Jersey Zinc Co.,prepared by the iodide
process. Their spectrographic analysis
showed the following impurities: 0.02 per-
cent of aluminum, 0.012 percent each of iron
and manganese, 0.006 percent of molybdenum,
0.004 percent of nitrogen, 0.0025 percent of
magnesium, and 0.002 percent of copper.
Interplanar spacings and intensity meas-
urements. The Patterson and the Hanawalt,
Rinn, and Frevel d-spacings were converted
from kX to angstrom units.
The three strongest lines for each of the
patterns are as follows:
Pattern 1 2 3
Patterson Oil 103 010
Hanawalt, Rinn, and Frevel Oil 010 002
Swanson and Fuyat Oil 010 002
Lattice constants. The structure was de-
termined by Hull [3] in 1921. The space
group is Dgh-P6
3/mmc with 2(Ti) per unit
cell
.
A group of unit-cell values were con-
verted from kX to angstrom units for compari-son with the NBS values.
Lattice constants in angstroms
1921 Hull [3]
a
2.98
c
4.731925 Patterson [l] 2.957 4.7011930 Hagg [4 ] .. . 2.959 4.7391936 Burgers and Jacobs [5]-. 2.959 4.739
1949 Clark fc] 2.9504 4.6833 at 25^1953 Swanson and Fuyat 2.950 4.686 at 25°C
The density of titanium calculated from
the NBS lattice constants is 4.503 at
25°C.
Titanium, Ti (hexagonal)
hkl
1925
Patterson
Mo, 0.709 A
1938
Hanawalt, Rinn,
and Frevel
Mo, 0.709 A
1953
Swanson and
Fuyat
Cu, 1.5405 A
25°C
d I d I d I
A A A
010 2.561 40 2.55 27 2.557 30002 2.346 40 2.34 20 2.342 26011 2.246 100 2.23 100 2.244 100012 1.731 40 1.72 13 1.726 19110 1.480 40 1.473 13 1.475 17
103 1.339 50 1.333 13 1.332 16
200 1.278 1 1.276 2112 1.252 40 1.251 11 1.247 16
201 1.235 30 1.232 5 1.233 13
004 1.178 10 — 1.1708 2
202 1.127 10 1.1220 2
014 1.067 20 1.0653 3
203 .991 30 .9895 6
211 .944 30 .9458 11
114 .919 30 .9175 10
212 .8927 4
015 .882 10 .87 96 4
204 .8634 2
300 .851 .8514 4
213 .821 .8211 12
302 .802 .8005 9
(4)

References
[1] R. A. Patterson, Crystal structure of titanium
and chromium, Phys. Rev. 26, 56-9 (1925).
[2] J. D. Hanawalt, H. W. Rinn, and L. K. Frevel,
Chemical analysis by X-ray diffraction, Ind.
Eng. Chem.,Anal. Ed. 10, 457-512 (1938).
[3 ] A. W. Hull, The crystal structures of Ti, Zr, Ce,
Th, and Os, Phys. Rev. 18 ,88-9 (1921).
[4 ] G. Hagg, Rontgenuntersuchungen uber die Hydride
von Titan, Zirkonium, Vanadin und Tantal, Z.
physik. Chem. Bll, 433-454 (1930).
[5] VV. G. Burgers and F. M. Jacobs, Crystal structure
of beta titanium, Z. Krist. 94 ,299-300 (1936).
[6] H. T. Clark, The lattice parameters of high pu-
rity alpha titanium; and the effects of oxygen
and nitrogen on them, J. Metals 1, 588-589
(1949).
5
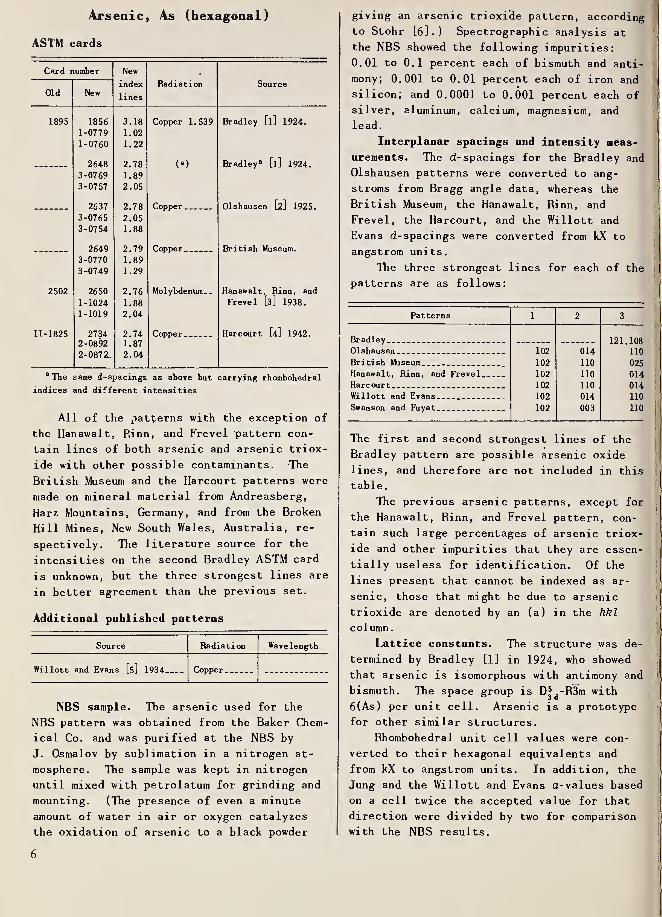
Arsenic, As (hexagonal)
ASTM cards
Card number New
index
lines
Radiation SourceOld New
1895 1856 3.18 Copper 1.539 Bradley [l] 1924.
1-0779 1.02
1-0760 1.22
2648 2.78 o Bradley 8[l] 1924.
3-0769 1.89
3-0757 2.05
2637 2.78 Copper Olshausen [2] 1925.
3-0765 2.05
3-0754 1.88
2649 2.79
3-0770 1.89
3-0749 1.29
2502 2650 2.76 Molybdenum__ Hanawalt, Rinn, and
1-1024 1.88 Frevel [3] 1938.
1-1019 2.04
IT-1825 2734 2.74 Copper. . Harcourt [4] 1942.2-0892 1.87
2-0872. 2.04
8 The same d-spacings as above but carrying rhombohedral
indices and different intensities
All of the patterns with the exception of
the Hanawalt, P.inn, and Frevel pattern con-
tain lines of both arsenic and arsenic triox-
ide with other possible contaminants. The
British Museum and the Harcourt patterns were
made on mineral material from Andreasberg,
Harz Mountains, Germany, and from the Broken
Hill Mines, New South Wales, Australia, re-
spectively. The literature source for the
intensities on the second Bradley ASTM card
is unknown, but the three strongest lines are
in better agreement than the previous set.
Additional published patterns
Source Radiation Wavelength
Willott and Evans [5] 1934 Copper
NBS sample. The arsenic used for the
NBS pattern was obtained from the Baker Chem-
ical Co. and was purified at the NBS by
J. Osmalov by sublimation in a nitrogen at-
mosphere. The sample was kept in nitrogen
until mixed with petrolatum for grinding and
mounting. (The presence of even a minute
amount of water in air or oxygen catalyzes
the oxidation of arsenic to a black powder
giving an arsenic trioxi'de pattern, according
to Stohr [6].) Spectrographic analysis at
the NBS showed the following impurities:
0.01 to 0.1 percent each of bismuth and anti-
mony; 0.001 to 0.01 percent each of iron and
silicon; and 0.0001 to 0.001 percent each of
silver, aluminum, calcium, magnesium, and
lead.
Interplanar spacings and intensity meas-
urements. The d-spacings for the Bradley and
Olshausen patterns were converted to ang-
stroms from Bragg angle data, whereas the
British Museum, the Hanawalt, Rinn, and
Frevel, the Harcourt, and the Willott and
Evans d-spacings were converted from kX to
angstrom units.
The three strongest lines for each of the
patterns are as follows:
Patterns 1 2 3
Bra die y 121 10ft
Olshausen 102 014 noBritish Museum _ 102 110 025
Hanawalt, Rinn, and Frevel 102 110 014
Harcourt 102 110 014
Willott and Evans 102 014 noSwanson and Fuyat 102 003 110
The first and second strongest lines of the
Bradley pattern are possible arsenic oxide
lines, and therefore are not included in this
table
.
The previous arsenic patterns, except for
the Hanawalt, Rinn, and Frevel pattern, con-
tain such large percentages of arsenic triox-
ide and other impurities that they are essen-
tially useless for identification. Of the
lines present that cannot be indexed as ar-
senic, those that might be due to arsenic
trioxide are denoted by an (a) in the hkl
column.
Lattice constants. The structure was de-
termined by Bradley [1] in 1924, who showed
that arsenic is isomorphous with antimony and
bismuth. The space group is D^d-R3m with
6(As) per unit cell. Arsenic is a prototype
for other similar structures.
Rhombohedral unit cell values were con-
verted to their hexagonal equivalents and
from kX to angstrom units. In addition, the
Jung and the Willott and Evans a-values based
on a cell twice the accepted value for that
direction were divided by two for comparison
with the NBS results.
6

Lattice constants in angstroms The density of arsenic calculated fromthe NBS lattice constants is 5.778 at
1925 Olshausen [2] 3.758
c
10.64626°C.
1926 Jung [7] . 3.765 10.6381934— Willott and Evans [5].. 3.770 10.5751935... Hagg and Hybinette [s] 3.758 10.5471939— Stohr k] 3.762 10.5431953... Swanson and Fuyat 3.760 10.548 at 26°C
Arsenic, As (hexagonal)
1924 1925 __ .. 1938 1942 1934 1953
Bradley Olshausen British Museum Hanawalt, Rinn, Harcourt Willott and Swanson and
hkland Frevel Evans Fuyat
Cu, 1 5405 A Cu, 1.5405 A Cu, 1.5405 A Mo, 0.709 A Cu, 1.5405 A Cu, 1.5405 A Cu, 1.5405 A
26°C
d I d I d 1 d 1 d I d I d
—1
A A A A A A A
(°)6.51
6.18
3— — — 254.02 20
003 3.56 76 3.537 w 3.58 40 3.52 4 3.52 26— — — — 3.46 25
3.28 20(
a) 3.184 100 3.211 w 3.15 * 50
Oil ----- 3.12 60 3.112— 2.97 60— — ----- — 2.82 6
102
(a
)
2.786 4 2.774 s 2.80 100 2.77 100 2.75
2.53
100
25
2.782 s 2.771 100
(a
) 2.29 20(a
)
62.14 20
014 2.0556
12 2.056 m 2.05 60 2.04 13 2.04 63 2.053 s 2.050 24
(a
) 1.95
1.871
13
75no(a
)
1.892 8 1.877 m 1.89 80 1.88 20 1.884 s 1.879 261.841 5— — ----- ----- 1.80 60
105
006
1.785
1.768 )6
|
1.765 w 1.78 20 1.77 5 1.76 38 1.768 10
1.71 60
i t I J 1 7
113
(a
)
1 . 664 48 1.661 w 1.66 4 1.65 38 1.658 6— 1 . 594 w 1.59
1.535 1.602
1.559022
(a
)
1.566 32 1.551 m 1.56 60 1.56 8 63 s 1.556 111.47 20
(a
) 1.42 20 1.436 13204 1.389
) 20f 1.382 m 1.39 60 1.385 4 1.383 25 1.388 m 1.386 6017 1.370 i l 1.37 40 1.371 1 1.363 13 1.371 w 1.367 4
l )
025— — 1.348 13
1.286 28 1.285 m 1.29 70 — — 1.302 6 1.289 m 1.289 5
116
121
108) . „„
— — — 1.284 4 1.286 38 1.284 5
1.225 92 1.233 w1.222
1.1987212
(a
)
009
1.203
1.18524
84
1.200
1.172
m
vw
1.20 70 1.198 5 1.197 50
1.174
— 7
(a
)
•L • JL f ZZ
124
207
300
(a
)
1.120] 36
|
1.115 m 1.12 50 1.114 25
1 . loo
1.116 m 1.1158 41.109
1.090
1.06856
60
1.084
1.065
w
w
1.11
1.09
50
40
1.102
1.087
2
1
1.104
1.085
1.070
1.063
13
25
13
13
1.087
1.072
1.064
w1.1062
1.0857
2
3
215 1.06 40 1
— —m 1 . 0631 3
7

Arsenic, As (hexagonal)—Con.
1924 1925 1938 1942 1934 1953
Bradley Olshausen Br i ti sh \Aiseum Hanawalt, Rinn, Harcourt Willott and Swanson and
hkland Frevel Evans Fuyat
Cu, 1. 5405 A Cu, 1.5405 A Cu, 1.5405 A Mo, 0.709 A Cu, 1.5405 A Cu, 1. 5405 A Cu, 1.5405 A
26°C
d I d I d 1 d 1 d I d I d I
A A A A A A A
303 1.042 80 1.041 1.04 20 1.034 W 1.0374 2
(a
) 1.025 96
119 .998 40 .999 .995 25 .997 w .9948 2
(a
) .966 6 .972 w
127 .955 64 .955 .954 13 .9531
.9397
.9198
2
220 .943 72 .944 .940 13 .944 1
1*0*11 .929
|
.925 m .923 13 .925 3
.923 j
44.920 vw
.910 88
218 .902 w .899 6 .899 vw .8995 1
132 .892 52 .895 .891 6 .890 .8903 2
(a
) .860 m .864 3 .866
.855 68 .855 13 .856
.829 13
.834 m1
Possible arsenic trioxide lines not superimposed on arsenic lines.
References
[1] A. J. Bradley, The crystal structure of metallicarsenic, Phil. Mag. 47 , 657-671 (1924).
[2] S. v. Olshausen, Strukturuntersuchungen nach der
Debye -Scherrer-Methode, Z. Krist, 61 ,463-514
(1925).
[3] J. D. Hanawalt, H. W. Rinn, and L. K. Frevel,
Chemical analysis by X-ray diffraction, Ind.
Eng. Chem.,Anal. Ed. 10 , 457-512 (1938).
[4] G. A. Harcourt, Tables for the identification of
ore minerals by X-ray powder patterns, Am. Miner-alogist 27, 63-113 (1942).
[5] W. H. Willott and E. J. Evans, An X-ray investiga-
tion of the arsenic-tin system of alloys, Phil.
Mag. 18 ,114-128 (1934).
[6] H. Stohr, The allotropy of arsenic, Z. anorg.
Chem. 242 , 138 (1939).
[7] H. Jung, Centralbl. Min. Geol. (1926) 107-114,
as quoted in Z. Krist., Structurbericht I, 57
(1913-28).
[8] G. Hagg and A. G* Hybinette, X-ray studies on the
systems tin-antimony and tin-arsenic, Phil. Mag.
20, 913 (1935).
8

Rhodium, Rh (cubic) Lattice constant in angstroms
ASTM cards
Care number New
index
lines
Radiation SourceOld New
3188 3333 2.20 Molybdenum, Hall [l] 1921.
1-1214 1.15 0.712.
1-1214 1.91
3187 3303 2.20 Molybdenum Hanawalt, Rinn, and
1-1205 1.90 Frevel [2 ] 1938.
1-1213 1.15
Additional published patterns. None.
NBS sample. The rhodium used for the
NBS pattern was obtained from the Baker
Chemical Company. Spectrographic analysis at
the NBS showed the following impurities:
0.01 to 0.1 percent of silver; 0.001 to 0.01
percent each of aluminum, iron, iridium, mag-
nesium, manganese, palladium, platinum, and
silicon; and 0.0001 to 0.001 percent each of
calcium, copper, lead, and ruthenium.
Interplanar spacings and intensity meas-
urements. The Hull and the Hanawalt, Rinn,
and Frevel d-spacings were converted from kX
to angstrom units.
The three strongest lines for each of the
patterns are as follows:
Patterns 1 2 3
Hull... 111 311 200Hanawalt, Rinn, and Frevel., 111 200 311
Swanson and Fuyat 111 200 311
Lattice constant. The structure was de-
termined by Hull [1] in 1921. The space
group is 0^-Fm3m with sodium-chloride-
structure type and 4(Rh) per unit cell.
Several unit-cell determinations have
been converted from kX to angstrom units for
comparison with the NBS values.
1921
1925
1928
1932
Hull [l]
Barth and Lunde [3 ]
van Arkel [4 ]
Owen and Yates [5 ]
3.828
3.803
3.802
3.8034 at 25°C1953 Swanson and Fuyat __ 3.8031 at 25°C
Hie density of rhodium calculated from
the NBS lattice constant is 12.424 at 25°C.
Rhodium, Rh (cubic)
1921 1938 1953
Hull Hanawalt, Rinn, Swanson and Fuyat
anc Frevelhkl
Mo, 0.709 A Mo, 0.709 A Cu, 1.5405 A, 25°C
d I a d I a d I a
A A A A A A
111 2.204 100 3.817 2.20 100 3.81 2.1958 100 3.8032
200 1.912 20 3.824 1.90 50 3.80 1.9016 50 3.8032
220 1.353 20 3.827 1.348 30 3.813 1.3446 26 3.8031
311 1.152 30 3.821 1.148 40 3.807 1.1468 33 3.8035
222 1.102 4 3.817 1.101 13 3.814 1.0979 11 3.8032
400 .954 4 3.816 .9508 7 3.8032
331 .880 4 3.836 .875 15 3.814 .8724 20 3.8027
420 .855 3 3.824 .854 15 3.819 .8504 14 3.8031
422 .783 2 3.836 .779 8 3.816
511 .737 1 3.830 .734 10 3.814
531 .648 1 3.834
Average of the
last five
lines 3.832 3.816 — — 3.8031
References
[1] A. W. Hull, X-ray crystal analysis of thirteen
comnon metals, Phys. Rev. 17 ,571-58 6 (1921).
[2] J. D. Hanawalt, H. W. Rinn, and L. K. Frevel,
Chemical analysis by X-ray diffraction, Ind.
Eng. Chem.,Anal. Ed. 10 ,
457-512 (1938).
[3] T. Barth and G. Lunde, Der Einfluss der
Lanthaniden Kontraktion auf die Gitterdimensionen
der kubischen Platinmetalle , Z. physik. Chem.
117 ,478-490 (1925).
[4] A. E. van Arkel, Eine einfache Methode zur
Erhohung der Genauigkeit bei Debye -Scherrer-
Aufnahmen, Z. Krist. 67, 235-238 (1928).
[5] E. A. Owen and E. L. Yates, Precision measure-
ments of crystal parameters, Phil. Mag. 15, 472-
488 (1933).
9

Cadmium, Cd (hexagonal)
ASTM cards
Card number New
index
lines
Radiation SourceOld New
3065 3204 2.33 Molybdenum, Hull [l] 1921.
1-1177 2.79 0.712.
1-1178 1.89
3043 3203 2.34 Molybdenum Hanawalt, Rinn, and
1-1176 2.80 Frevel [2] 1938.
1-1175 2.58
Additional published patterns
Source Radiation Wavelength
Roux and Cournot [3] 1928
McLennan and Monkman [4] 1929
Taylor [5] 1932 Copper 1.539
NBS sample. The cadmium used for the
NBS pattern was prepared by the New Jersey
Zinc Co. and is 99.99 percent pure. Spectro-
graphic analysis at the NBS showed the fol-
lowing impurities: 0.001 to 0.01 percent of
mercury, 0.0001 to 0.001 percent of silicon,
and less than 0.0001 percent each of calcium,
copper, iron, magnesium, and lead.
Interplanar spacings and intensity meas-
urements. The d-spacing for the Roux and
Cournot and the Taylor patterns were calcu-
lated from Bragg angle data. The other three
were converted from d-spacings in kX to ang-
strom units. The Roux and Cournot pattern
contains a d-spacing at 2.130 A, which is not
possible theoretically. The McLennan and
Monkman pattern is incomplete and contains no
intensity values.
The three strongest lines for each of the
patterns are as follows:
Patterns 1 2 3
Hull 101 002 102
Hanawalt, Rinn, and Frevel.. 101 002 100
Roux and Cournot 101 103 004Taylor 101 112 203
Swanson and Fuyat 101 002 100
Lattice constants. The structure was in-
vestigated by Hull [1] in 1921. The space
group of the hexagonal close packed cell is
D* -P6_/mmc with 2(Cd) per unit cell.
A number of unit cell measurements were
converted from kX to angstrom units and were
converted from the temperatures indicated in
parentheses to 26°C. for comparison with the
NBS values. The thermal expansion, accord-
ing to McLennan and Monkman [4], is 48.2x10" 6
parallel to the C-axis and 18.5xl0' 6 perpen-
dicular to it.
Lattice constants in angstroms
1921 Hull [l]
a
2.949
c
5.572
1929 McLennan and Monkman [4] 2.971 5.610 at 26°C (18°C)
1931 Jenkins and Preston |j>] 2.9784 5.6155
1932 Taylor [5] 2.969 5.656
1932 Stenzel and Weerts [7] 2.9801 5.6191 at 26°C (20°C)
1933 Jette and Gebert (j)] 2.9773 5.6159
1935 Jette and Foote [9] 2.97918 5.61858 at 26°C (25°C)
1935 Kossolapow and Trapesnikow [lo] 2.97910 5.61728 at 26°C
1936 Owen and Roberts [llj ._ .. 2.97887 5.61765 at 26°C (18°C)
1941 Lu and Chang [l2] . _ 2 . 9791 5.6183 at 26°C (21°C)
1947 Vegard [l 3] 2.9802 5.6155
1953 Swanson and Fuyat 2.9793 5.6181 at 26°C
10

The density of cadmium calculated from the NBS lattice constants is 8.642 at 26 °C.
Cadmium, Cd (hexagonal)
hkl
1921
Hull
Mo, 0.70926 A
1938
Hanawalt, Rinn,
and Frevel
Mo, 0.70926 A
1928
Roux and Cournot
Cu, 1.5405 A
1929
McLennon and
Monkman
Cu, 1.5405 A
1932
Taylor
Cu, 1.5405 A
1953
Swanson and Fuyat
Cu, 1.5405 A, 26 °C
d I d I d I d I d I d I
A A A A A A
002 2.779 33 2.81 40 2.859 2.809 65
100 2.555 17 2.59 30 2.563 W 2.598 vw 2.580 32
101 2.316 100 2.34 100 2.356 VS 2.336 m 2.345 100
2.130
102 1.886 20 1.89 20 1.926 m 1.891 1.900 w 1.901 32
103 1.502 17 1.51 25 1.519 s 1.513 1.520 w 1.516 26
110 1.470 13 1.489 18 1.484 1.489 w 1.490 19
004 1.392 2 1.403 3 1.353 s 1.404 3
112 1.301 17 1.313 27 1.301 w 1.316 1.314 m 1.316 17
200 1.282 0 1.289 2 1.293 w 1.290 2
201 1.245 10 1.255 20 1.216 1.255 1.258 13
104 1.219 2 1.230 2 1.179 vw 1.231 1.231 w 1.234 4
202 1.112 3 1.172 3 1.124 1.171 1.1724 3
203 1.051 3 1.062 5 1.083 vw 1.060 1.062 m 1.0622 5
105 1.020 3 1.022 4 1.033 vw 1.028 1.019 m 1.0303 3
114 1.010 3 1.004 vw 1.020 1.0220 4
210 .9749 w .9752 2
211 .949 7 .961 10 .951 vw .958 .9601 m .9609 9
204 .9517 w .9501 1
006 .9363 1
212 .910 2 .923 2 .919 .9218 m .9212 4
106 .8802 2
213 .857 5 .865 4 .864 .8650 10
300 .858 .8600 2
205 .840 2 .846 .8473 1
302 .814 2 .823 2 .821 .8223 5
214 .8010 2
References [8] E. R Jette and E. B. Gebert, An X-ray study of
[1] A. W. Hull, X-ray crystal analysis of thirteen
common metals, Phys. Rev. 17, 571-588 (1921).
[2] J. D. Hanawalt, H. W. Rinn, and L. K. Frevel,
Chemical analysis by X-ray diffraction, Ind.
Eng. Chem.,Anal. Ed. 10 ,
457-512 (1938).
[3] A. Roux and J. Cournot, Etude cristallographique
par rayons X de la structure de depots electro-
lytiques simultanes de deux metaux, Compt. rend.
(Paris) 186, 1733-36 (1928).
[4] J. C. McLennan and R. J. Monkman, Ch the thermal
expansion of zinc and cadmium crystals and on
the crystal structure of erbium and niobium,Trans. Roy. Soc. Can. Ill, 23 ,
255-267 (1929).
[5] N. W. Taylor, Solid cadmium amalgams. An X-rayproof of the compound Cd 3Hg, J. Am. Chem. Soc.
54, 2713-2720 (1932).[6] C. H. M. Jenkins and G. 0. Preston, Some proper-
ties of metallic cadmium, J. Inst. Metals 45,307-343 (1931).
[7] W. Stenzel and J. Weerts, Prazisionsbestimmungvon Gitterkonstanten nichtkubischer Stoffe, Z.
Krist. 84, 20-44 (1932).
the binary alloys of silicon with Ag, Au, Pb,
Sn, Zn, Cd, Sb, and Bi, J. Chem. Phys. 1, 753
-
755 (1933).
[9]
E. R. Jette and F. Foote, Precision Determina-
tion of lattice constants, J. Chem. Phys. 3,
605-616 (1935) .
[10] G. F. Kossolapow and A. K. Trapesnikow, X-ray
investigation of the thermal expansion of Cd, Z.
Krist. 91A, 410-423 (1935).
[11] E. A. Owen and E. W. Roberts, The thermal expan-
sion of the crystal lattices of cadmium, osmium,
and ruthenium, Phil. Mag. 22 ,290-304 (1936).
[12] S. S. Lu and Y. L. Chang, The accurate evalua-
tion of lattice spacings from back -re flection
powder photographs, Proc. Phys. Soc. (London)
53, 517-528 (1941).
[13] L. Vegard, Investigation into the structure and
properties of solid matter with the help of
X-rays, Skrifter Norske Videnskaps-Akad. Oslo I,
Mat. Naturv. Kl. 1947, No. 2, 83 p. (1947).
11

Indium, In (tetragonal)
ASTM cards
Card number New
Old Newindex
lines
Radiation Source
2568 2714
1-1046
1-1042
2.72
2.29
1.68
Molybdenum Hanawalt, Rinn, and
Frevel [l] 1938.
2599 2.70 Hull [2] 1920.
2.29
1.675
The Hull pattern was not reproduced in
the revised edition of the file or in the
1950 index and is found only in the original
card file and index.
Additional published patterns. None.
NBS sample. The indium used for the NBSpattern was obtained from the Fisher Scien-
tific Co. through the NBS Spectrographic
Laboratory. Spectrographic analysis at the
NBS showed the following impurities: 0.001
to 0.01 percent each of iron, nickel, sili-
con, and tin; 0.0001 to 0.001 percent each of
aluminum, copper, and calcium; and less than
0.0001 percent of silver.
The intensities were determined from sev-
eral patterns produced from indium filings
and from vaporized indium made by arcing two
indium electrodes under water.
Interplanar spacings and intensity meas-
urements. The d-spaeings for the Hanawalt,
Rinn, and Frevel and the Hull patterns were
converted from kX to angstrom units.
The three strongest lines for each of the
patterns are as follows:
Patterns 1 2 3
Hanawalt, Rinn, and Frevel 101 no 112
Hull 101 no 112
Swanson and Fuyat 101 no 112
Lattice constants. The structure was de-
termined by Hull [2] in 1920. The space
group is D^-14/mmm with 2(In) per unit cell.
Indium is a prototype for other similar
structures.
A group of unit cell values were con-
verted from kX to angstrom units for compari-
son with the NBS values. Several a-values
given in terms of the larger cell produced by
a 45° rotation about the C-axis were reduced
to the true cell size.
Lattice constants in angstroms
a c
1920 Hull [2] 3.25 4.87
1932 Dwyer and Mellor [3J 3.251 4.956
1933 Zintl and Neumayr [4] 3.247 4.946
1933 Shinoda [5] 3.246 4.943
1935 Frevel and Ott [6] _ 3.251 4.948
1936 Ageev and Ageeva [7] 3.284 5.007
1938 Betteridge [s] 3.2514 4.9457
1953 Swanson and Fuyat. 3.2517 4.9459 at 26°C
The density of indium calculated from the
NBS lattice constants is 7.286 at 26 °C.
Indium, In (tetragonal)
hkl
1938
Hanawalt, Rinn,
and Frevel
Mo, 0.709 A
1920
Hull
Mo, 0.709 A
1953
Swanson and Fuyat
Cu, 1.5405 A, 26 °C
d I d I d I
A A A
101 2.73 100 2.71 100 2.715 100
002 2.46 25 2.42 3 2.471 21
no 2.29 40 2.29 25 2.298 36
112 1.68 30 1.678 10 1.683 24
200 1.62 15 1.620 3 1.625 12
103 1.465 20 1.453 5 1.470 16
211 1.398 30 1.395 10 1.395 23
202 1.358 15 1.351 10 1.358 11
004 1.2368 3
220 1.146 2 1.152 1 1.1493 5
213 1.090 10 1.082 5 1.0904 12
301 1.057 2 1.0587 4
222 1.042 2 1 . 0425 5
310 1.027 2 1.0282 8
204 .982 2 — — .9845 1
312 .950 6 . 9495 3
303 .907 2 .9056 2
321 .890 2 .8874 4
215 .8180 3
References
[1] J. D. Hanawalt, H. W. Rinn, and L. K. Frevel,
Chemical analysis by X-ray diffraction, Ind.
Eng. Chem.,Anal. Ed. 10 , 457-512 (1938).
[2] A. W. Hull, Arrangement of the atoms in some com-
mon metals, Science 52 , 227-229 (1920).
[3] F. D. Dvyer and D. P. Mellor, J. Proc. Roy. Soc.
N. S. Wales 66, 234-239 (1932) as quoted in [7].
[4] E. Zintl and S. Neumayr, Gitterstruktur des In-
diums, Z. Elektrochem. 39 ,81-84 (1933).
12

[5] G. Shinoda, X-ray investigations on the thermal
expansion of solids. I., Mem. Coll. Sci. Kyoto
Imp. Univ. 16A, 193-201 (1933).
[6] L. K. Frevel and E. Ott, The X-ray study of in-
dium and the indium-silver system, J. Am. Chem.
Soc. 57 , 228 (1935).
[7] N. W. Ageev and V. Ageeva, Solid solutions of in-
dium and lead, J. Inst. Metals 59, No. 2, 311-
316 (1936).
[8] W. Betteridge, The crystal structure of Cd-In
alloys rich in In, Proc . Phys. Soc. (London) 50A,
519 (1938).
13
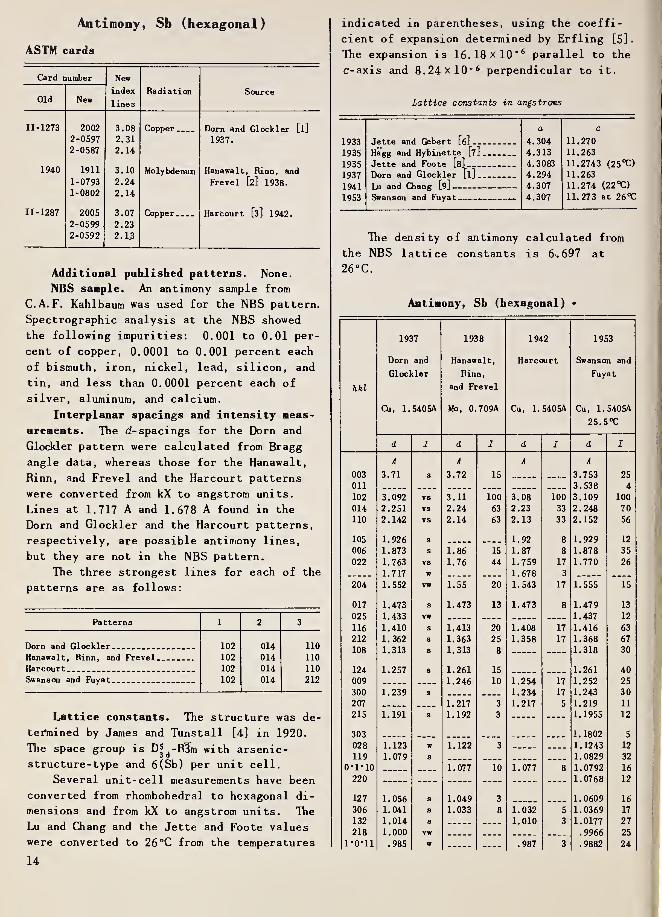
Antimony, Sb (hexagonal)
ASTM cards
Card number New
Radiation SourceOld New
index
lines
11-1273 2002 3.08 Copper Dorn and Glockler [l]
2-0597 2.31 1937.
2-0587 2.14
1940 1911 3.10 Molybdenum Hanawalt, Rinn, and
1-0793 2.24 Frevel [2] 1938.
1-0802 2.14
11-1287 2005 3.07 Copper Harcourt [3] 1942.
2-0599 2.23
2-0592 2.13
Additional published patterns. None.
NBS sample. An antimony sample from
C.A. F. Kahlbaum was used for the NBS pattern.
Spectrographic analysis at the NBS showed
the following impurities: 0.001 to 0.01 per-
cent of copper, 0.0001 to 0.001 percent each
of bismuth, iron, nickel, lead, silicon, and
tin, and less than 0.0001 percent each of
silver, aluminum, and calcium.
Interplanar spacings and intensity meas-
urements. The d-spacings for the Dorn and
Glockler pattern were calculated from Bragg
angle data, whereas those for the Hanawalt,
Rinn, and Frevel and the Harcourt patterns
were converted from kX to angstrom units.
Lines at 1.717 A and 1.678 A found in the
Dorn and Glockler and the Harcourt patterns,
respectively, are possible antimony lines,
but they are not in the NBS pattern.
The three strongest lines for each of the
patterns are as follows:
Patterns 1 2 3
Dorn and Glockler 102 014 110
Hanawalt, Rinn, and Frevel 102 014 noHarcourt 102 014 noSwanson and Fuyat 102 014 212
Lattice constants. The structure was de-
termined by James and Tunstall [4 ] in 1920.
The space group is D5d-R3m with arsenic-
structure-type and 6(Sb) per unit cell.
Several unit-cell measurements have been
converted from rhombohedral to hexagonal di-
mensions and from kX to angstrom units. The
Lu and Chang and the Jette and Foote values
were converted to 26 °C from the temperatures
14
indicated in parentheses, using the coeffi-
cient of expansion determined by Erfling [5]
.
Ihe expansion is 16.18x10" 6 parallel to the
C-axis and 8.24 Xl0" 6 perpendicular to it.
Lattice constants in angstroms
1933 Jette and Gebert [6]
a
4.304
c
11.270
1935 Hagg and Hybinette [7] 4.313 11.263
1935 Jette and Foote [8] 4.3083 11.2743 (25°C)
1937 Dorn and Glockler [l] 4.294 11.263
1941 Lu and Chang [9] 4.307 11.274 (22 °C)
1953 Swanson and Fuyat — -—-
—
4.307 11.273 at 26°C
The density of antimony calculated from
the NBS lattice constants is 6.697 at
26°C.
Antimony, Sb (hexagonal) *
1937 1938 1942 1953
Dorn and Hanawalt, Harcourt Swanson and
Glockler Rinn, Fuyat
hkl and Frevel
Cu, 1. 5405A Mo, 0.709A Cu, 1.5405A Cu, 1. 5405A
25. 5°C
d I d I d I d I
A A A A
003 3.71 s 3.72 15 3.753 25
Oil 3.538 4
102 3.092 vs 3.11 100 3.08 100 3.109 100
014 2.251 vs 2.24 63 2.23 33 2.248 70
no 2.142 vs 2.14 63 2.13 33 2.152 56
105 1.926 s 1.92 8 1.929 12
006 1.873 s 1.86 15 1.87 8 1.878 35
022 1.763 vs 1.76 44 1.759 17 1.770 26
1.717 w 1.678 3
204 1.552 vw 1.55 20 1.543 17 1.555 15
017 1.473 s 1.473 13 1.473 8 1.479 13
025 1.433 vw 1.437 12
116 1.410 s 1.413 20 1.408 17 1.416 63
212 1.362 s 1.363 25 1.358 17 1.368 67
108 1.313 s 1.313 8 — 1.318 30
124 1.257 s 1.261 15 1.261 40
009 1.246 10 1.254 17 1.252 25
300 1.239 s 1.234 17 1.243 30
207 „ _ 1.217 3 1.217 5 1.219 11
215 1.191 s 1.192 3 — 1.1955 12
303 1.1802 5
028 1.123 w 1.122 3 1.1243 12
119 1.079 s 1.0829 32
0*1*10 1.077 10 1.077 8 1.0792 16
220 1.07 6 8 12
127 1.056 s 1.049 3 1.0609 16
306 1.041 s 1.033 8 1.032 5 1.0369 17
132 1.014 s _ 1.010 3 1.0177 27
218 1.000 vw .9966 251*0*11 .985 w — .987 3 .9882 24
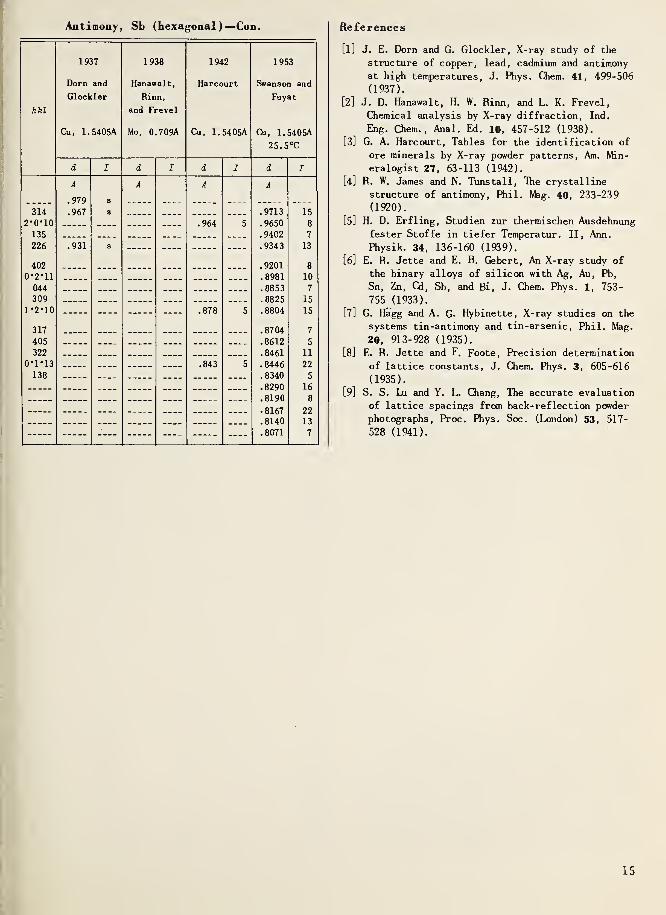
Antimony, Sb (hexagonal)—Con. References
hkl
1937
Dorn and
Glockler
Cu, 1.5405A
1938
Hanawalt,
Rinn,
and Frevel
Mo, 0.709A
1942
Harcourt
Cu, 1.5405A
1953
Swanson and
Fuyat
Cu, 1.5405A
25. 5°C
d I d I d I d I
A A A A
.979 s
314 .967 s .9713 15
2*0*10 .964 5 .9650 8
135 .9402 7
226 .931 s — — — .9343 13
402 .9201 8
0*2*11 .8981 10
044 .8853 7
309 .8825 151*2*10 — — — .878 5 .8804 15
317 .8704 7
405 .8612 5
322 .8461 11
0*1*13 .843 5 .8446 22
138 . 8340 5
.8290 16
.8190 8
. pi 67 22
. 8140 13
.8071 7
[1] J. E. Dorn and G. Glockler, X-ray study of the
structure of copper, lead, cadmium and antimony
at high temperatures, J. Phys. Chem. 41, 499-506
(1937).
[2] J. D. Hanawalt, H. W. Rinn, and L. K. Frevel,
Chemical analysis by X-ray diffraction, Ind.
Eng. Chem., Anal. Ed. 10, 457-512 (1938).
[3] G. A. Harcourt, Tables for the identification of
ore minerals by X-ray powder patterns, Am. Min-
eralogist 27, 63-113 (1942).
[4 ] R. W. James and N. Tunstall, The crystalline
structure of antimony, Phil. Mag. 40, 233-239
(1920).
[5] H. D. Erfling, Studien zur thermischen Ausdehnung
fester Stoffe in tiefer Temperatur. II, Ann.
Physik. 34, 136-160 (1939).
[6] E. R. Jette and E. B. Gebert, An X-ray study of
the binary alloys of silicon with Ag, Au, Pb,
Sn, Zn, Cd, Sb, and Bi, J. Chem. Phys. 1, 753-
755 (1933).
[7] G. Hagg and A. G* Hybinette, X-ray studies on the
systems tin-antimony and tin-arsenic, Phil. Mag.
20, 913-928 (1935).
[8] E. R. Jette and F. Foote, Precision determination
of lattice constants, J. Chem. Phys. 3, 605-616
(1935).
[9] S. S. Lu and Y. L. Chang, The accurate evaluation
of lattice spacings from back-reflection pcwder
photographs, Proc. Phys. Soc. (London) 53, 517-
528 (1941).
15
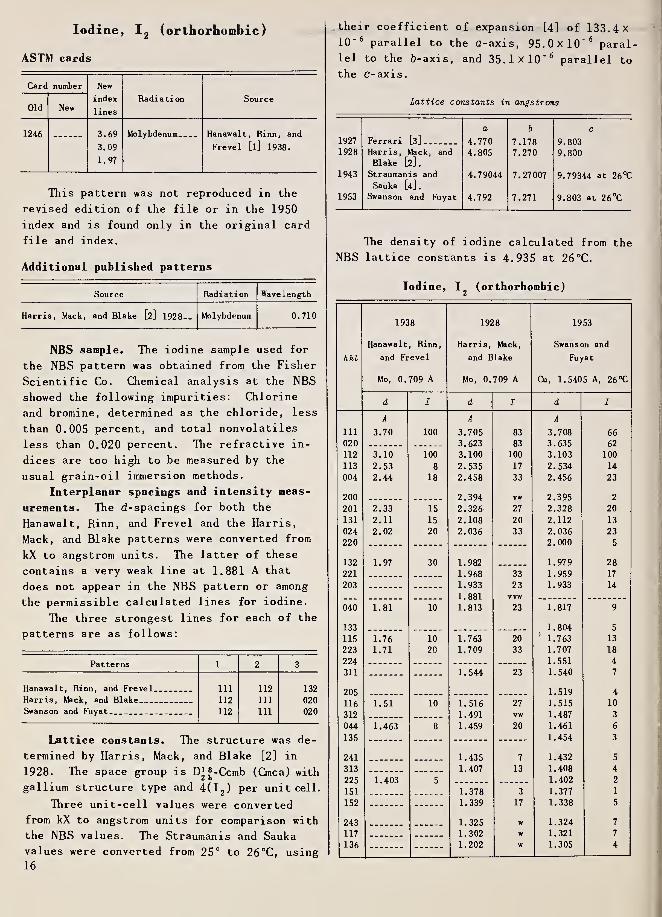
Iodine, I2
(orthorhombic)
ASTM cards
Card number New
Old Newindex
lines
Radiation Source
1246 3.69 Molybdenum Hanawalt, Rinn, and
Frevel [l] 1938.3.09
1.97
This pattern was not reproduced in the
revised edition of the file or in the 1950
index and is found only in the original card
file and index.
Additional published patterns
Source Radiation Wavelength
Harris, Mack, and Blake fc] 1928-- Molybdenum 0.710
NBS sample. Hie iodine sample used for
the NBS pattern was obtained from the Fisher
Scientific Co. Chemical analysis at the NBSshowed the following impurities: Chlorine
and bromine, determined as the chloride, less
than 0.005 percent, and total nonvolatiles
less than 0.020 percent. Hie refractive in-
dices are too high to be measured by the
usual grain-oil immersion methods.
Interplanar spacings and intensity meas-
urements. The d-spacings for both the
Hanawalt, Rinn, and Frevel and the Harris,
Mack, and Blake patterns were converted from
kX to angstrom units. The latter of these
contains a very weak line at 1.881 A that
does not appear in the NBS pattern or among
the permissible calculated lines for iodine.
The three strongest lines for each of the
patterns are as follows:
Patterns 1 2 3
Hanawalt, Rinn, and Frevel 111 112 132
Harris, Mack, and Blake 112 111 020Swanson and Fuyat 112 111 020
Lattice constants. The structure was de-
termined by Harris, Mack, and Blake [2] in
1928. The space group is Di*|-Ccmb (Cmca) with
gallium structure type and 4(I2 ) per unit cell.
Three unit-cell values were converted
from kX to angstrom units for comparison with
the NBS values. The Straumanis and Sauka
values were converted from 25° to 26°C, using16
their coefficient of expansion [4] of 133. 4
X
10' 6 parallel to the a-axis, 95.0X10' 6paral-
lel to the 5-axis, and 35. lx 10' 6 parallel to
the C-axis.
Lattice constants in angstroms
1927 Ferrari [3] _
a
4.770
b
7.178
c
9.8031928 Harris, Mack, and 4.805 7.270 9.800
1943
Blake [2].
Straumanis and 4.79044 7.27 007 9.79344 at 26 °C
1953
Sauka [4]
.
Swanson and Fuyat 4.792 7.271 9.803 at 26°C
Hie density of iodine calculated from the
NBS lattice constants is 4.935 at 26 °C.
Iodine, I2
(orthorhombic)
hkl
1938
Hanawalt, Rinn,
and Frevel
Mo, 0.709 A
1928
Harris, Mack,
and Blake
Mo, 0.709 A
1953
Swanson and
Fuyat
Cu, 1.5405 A, 26 °C
d I d I d I
A A A
111 3.70 100 3.705 83 3.708 66
020 3.623 83 3.635 62
112 3.10 100 3.100 100 3.103 100
113 2.53 8 2.535 17 2.534 14
004 2.44 18 2.458 33 2.456 23
200 2.394 vw 2.395 2
201 2.33 15 2.326 27 2.328 20
131 2.11 15 2.108 20 2.112 13
024 2.02 20 2.036 33 2.036 23
220 2.000 5
132 1.97 30 1.982 1.979 28
221 1.968 33 1.959 17
203 1.933 23 1.933 14
1.881
040 1.81 10 1.813 23 1.817 9
133 1.804 5
115 1.76 10 1.763 201
1.763 13
223 1.71 20 1.709 33 1.707 18
224 1.551 4
311 1.544 23 1.540 7
205 1.519 4
116 1.51 10 1.516 27 1.515 10
312 1.491 VW 1.487 3
044 1.463 8 1.459 20 1.461 6
135 1.454 3
241 1.435 7 1.432 5
313 1.407 13 1.408 4
225 1.403 5 1.402 2
151 __ 1.378 3 1.377 1
152 1.339 17 1.338 5
243 1.325 W 1.324 7
117 1.302 W 1.321 7
136 — 1.202 w 1.305 4

References
[1] J. D. Hanawalt, H. W. Rinn, and L. K. Frevel,
Chemical analysis by X-ray diffraction, Ind.
Eng. Chem.,Anal. Ed. 10, 457-512 (1938).
[2] P. M. Harris, E. Mack, and F. C. Blake, The
atomic arrangement in the crystal of orthorhom-
bic iodine, J. Am. Chem. Soc. 50, 1583-1600
(1928).
[3] A. Ferrari, La struttura cristallina dello iodio,
Rend, accad. nazb. Lincei 5, 582-586 (1927).
[4] M. Straumanis and J. Sauka, Die Gitterkonstanten
und Ausdehnungskoeffizienten des Jods, Z.
physik. Chem. B53, 320-330 (1943).
17

Hafnium, Hf (hexagonal)
ASTM cards
Card number New
index
lines
Radiation SourceOld New
2748 2.73 Zinc _ Noethling and Tolksdorf [l]
2-0898 1.66 1925.
2-0885 1.42
Additional published patterns
Source Radiation Wavelength
Sidhu and McGuire [2] 1952
_
Copper Ka
NBS sample. The hafnium used for the
NBS pattern came from two sources, a cross-
sectional slice of an "as deposited" crystal
bar supplied by the Atomic Energy Commission
and a rolled sheet contributed by the Foote
Mineral Co. Both were prepared by the iodide
process. The Foote sample was annealed in
vacuum for 1 hour at 850 °C. Flat surfaces
were filed on the AEC sample and then etched
with hydrofluoric acid.
Hie AEC spectrographic analysis of their
sample showed the following impurities: 2.0
percent of zirconium, 0.02 percent of iron,
0.001 to 0.01 percent each of silicon, alumi-
num, titanium, calcium, nickel, and chromium,
and less than 0.001 percent each of copper,
manganese, magnesium, lead, molybdenum, and
tin. Spectrographic analysis of the Foote
Mineral Co. sample at the NBS showed the fol-
lowing impurities: 0.1 to 1.0 percent of
zirconium, 0.01 to 0.1 percent each of
nickel, silicon, and zinc, 0.001 to 0.01 per-
cent each of aluminum, iron, and magnesium,
0.0001 to 0.001 percent of copper, and less
than 0.0001 percent of silver.
Interplanar spacings and intensity meas-
urements. The d-spacings for the Noethling
and Tolksdorf pattern were calculated from
Bragg angle data; the d-spacings for the
Sidhu and McGuire pattern were published in
angstrom units. Since the NBS samples were
either oriented or large-grained, the rolled
sheet and several different surfaces of the
chunk were used to obtain all of the d-spac-
ings. It was possible to combine these val-
ues into one pattern because the reflections
in both samples had identical d-spacings. The
ASTM card for the Noethling and Tolksdorf
pattern made with zinc radiation contains a
d-spacing of 1.50 not found in the original
reference, whereas the original reference
contains a d-spacing of 1.36 not found on the
ASTM card. Another Noethling and Tolksdorf
pattern made with copper radiation contains
an additional d-spacing of 1.808 that has not
been included in the card- file pattern or in
the table in this report because it is not a
possible hafnium line. The line at 0.924
angstrom, hkl of 300, found in the Sidhu and
McGuire pattern is not in the NBS pattern.
The NBS intensity values were the aver-
age of four sets of values measured, using
filings mixed with silica gel. The three
strongest lines for each of the patterns are
as follows:
Patterns 1 2 3
Sidhu and McGuire 101 100 002
Swanson and Fuyat 101 002 100
The strong lines of the Noethling and
Tolksdorf pattern do not coincide with the
indexed NBS pattern, and they apparently
represent quite a different material.
Lattice constants. The structure was de-
termined by Noethling and Tolksdorf [1] ,who
showed its similarity to the zirconium struc-
ture. The space group is D^h-P6
3/mmc with
2(Hf) per unit cell.
The Noethling and Tolksdorf and the van
Arkel lattice constants were converted from
kX to angstrom units, whereas the Fast, the
Duwez, and the Sidhu and McGuire values were
published in angstroms.
Lattice constants in angstroms
1925 Noethling and Tolksdorf [l]
a
3.33
c
5.47
1927 Van Arkel [3] 3.206 5.087
1948 Fast [4]- 3.187 5.041
1951 Duwez [5] 3.1952 5.0569
1952 Sidhu and McGuire fal 3.200 5.061
1953 Swanson and Fuyat. . „ 3.1967 5.0578 at 26 °C
The density of hafnium calculated from
the NBS lattice constants is 13.248 at 26°C.
18

Hafnium, Hf (hexagonal)
1925 1952 1953
Noethling and Sidhu and Swanson and Fuyat
hkl Tolksdorf McGuire
Zn, 1.4351 A Cu, 1.5405 A Cu, 1.5405 A, 26°C
d I d I d I
A A A
2.84 s
100 2.77 s 2.768 27
2.72
002 2.54 w 2.53 s 2.531 34
101 — 2.43 vs 2.428 100
2.35
1.99 w
102 1.868 s 1.866 16
1.65 vs
no 1.59 w 1.600 s 1.599 14
1.53 vw
103 1.443 s 1.440 16
200 1.41 vs 1.383 w 1.385 2
112 1.36 ms 1.354 s 1.351 16
201 1.31 w 1.337 s 1.336 12
004 1.26 w 1.265 m+ 1.265 4
202 1.23 w 1.216 m 1.214 3
104 1.152 m 1.1503 3
203 1.08 ms 1.065 s 1.0697 4
210 — — 1.049 w+ 1.0464 1
211 1.027 s 1.0247 6
114 .991 w .993 s .9917 5
212 .968 m .9671 2
105 .957 ms .951 s .9502 5
204 .931 ms .935
.924
m
m
.9336 3
213 .907 ms .890 s .8891 5
302 .868 m .8668 4
006 .844 w .8428 1
205 — — .817 m .8168 2
106
214 j.798 s .807 m .8060 3
References
[1 ] W. Noethling and S. Tolksdorf, Die
Kristallstruktur des Hafniums, Z. Krist. 62,
255-259 (1925).
[2] S. S. Sidhu and J. C. McGuire, An X-ray diffrac-
tion study of the hafnium-hydrogen system, J.
Appl. Phys. 23 , 1257-1261 (1952).
[3] A. E. van Arkel, Das Atomvolum des Zirkoniums und
des Hafniums, Z. physik, Chem. 130 ,100-104
(1927).
[4 ] J. D. Fast, The allotropic transformation of haf-
nium and a tentative equilibrium diagram of the
system zirconium-hafnium, J. Appl. Phys. 23,
350-351 (1952), as quoted from J. D. Fast, Chem.
Weekblad 44 , 621 (1948).
[5] P. Duwez, The allotropic transformation of hafni-
um, J. Appl. Phys. 22, 1174-1175 (1951).
19

Bismuth, Bi (hexagonal)
ASTM cards
Card number New
index
lines
Radiation SourceOld New
1710 1659 3.26 Molybdenum Davey [l] 1925.
1-0700 2.35
1-0699 2.26
11-1078 1683 3.25 Copper Parravano and Caglioti
[2] 1930.
2-0491 1.44 Copper Caglioti [3] 1930.
2-0491 2.35
1692 1658 3.28 Molybdenum Hanawalt, Rinn, and
1-0699 2.35 Frevel [4] 1938.
1-0688 2.27
11-1124 1776 3.21 Copper Harcourt [5] 1942.
2-0527 1.44
2-0518 2.25
The Harcourt ASTM card erroneously
states that molybdenum radiation was used.
The Parravano and Caglioti and the Caglioti
patterns are identical except for one line
listed 44.47 and 44.42, respectively, and
they are combined on one card.
Additional published patterns
Source Radiation Wavelength
Solomon and Jones [5] 1931 Copper
NBS sample. The bismuth used for the
NBS pattern was prepared by the Johnson
Matthey & Co. Ltd. Their spectrographic
analysis shows less than 0.001 percent each
of lead, silicon, copper, iron, aluminum,
calcium, magnesium, and sodium.
Interplanar spacings and intensity meas-
urements. The d-spacings of the Davey, the
Hanawalt, Rinn, and Frevel, the Harcourt, and
the Solomon and Jones patterns were converted
from supposed kX to angstrom units. The
Parravano and Caglioti pattern, expressed in
Bragg angles, was converted directly into
angstroms. The Parravano pattern contains
four lines with d-spacings 2.982, 2.707,
1.836, and 1.743 not possible in the bismuthstructure, as shown by the theoretical pat-
tern.
The three strongest lines for each of the
patterns are as follows:
Patterns 1 2 3
Davey _ _ 102 014 noParravano and Caglioti. __ _ 102 212 132
Hanawalt, Rinn, and Frevel. 102 014 noHarcourt _ 102 212 noSolomon and Jones _ _ 102 014 110
Swanson and Fuyat 102 110 014
Lattice constants. The structure was de-
termined by Hassel and Mark [7] in 1924 fol-
lowing several more general investigations.
The space group is DJ ,-R3m with arsenic-
structure type and 6 (Bi ) per unit cell.
A group of unit-cell determinations were
converted from kX to angstrom units for com-
parison with the NBS values. The Hassel and
Mark, the Ehret and Fine, and the Solomon and
Jones data also were converted from rhombohe-
dral to hexagonal form. The Hassel and Mark,
and the Solomon and Jones values were origi-
nally presented in terms of a nonprimitive
cell with a-values twice their true length.
These have been halved for comparison.
Lattice constants in angstroms
1924 Davey [l] __
a
4.548
c
11.853
1924 Hassel and Mark [7]-. 4.55 11.85
1930 Ehret and Fine [8] -- - -- 4.551 11.867
1931 Solomon and Jones [6] 4.525 11.799
1935 Jette and Foote [9] __ 4. 54643 11.8620
1938 levins, Straumanis, and
Karls ons [lo] 4.54590 11.86225
1953 Swanson and Fuyat 4.546 11.860 at 25 °C
The coefficient of expansion parallel to
the C-axis, as determined by Jacobs and Goetz
[11], is approximately 13.8 X 10" 6. The den-
sity calculated from the NBS lattice con-
stants is 9.808 at 25°C.
20

Bismuth, Bi (hexagonal)
hkl
1925
Davey
Mo, 0.709 A
1930
Parravano and
Caglioti
Cu, 1.5405 A
1938
Hanawalt, Rinn,
and Frevel
Mo, 0.709 A
1938
Harcourt
Cu, 1.5405 A
1931
Solomon and Jones
Cu, 1.5405 A
1953
Swanson and Fuyat
Cu, 1.5405 A, 25°C
d I d I d I d I a I d I
A A A A A A
003 3.94 11 3.95 9
Oil 3.71 11 3.74 3
102 3.27 100 3.26 s 3.29 100 3.22 100 3.254 s 3.28 100
2.982
2.707
014 2.35 89 2.346 ms 2.35 50 2.34 33 2.358 m 2.39 40
110 2.26 89 2.258 ms 2.27 50 2.250 67 2.262 m 2.273 41
105 2.02 33 2.01 7 2.019 17 2.022 w 2.030 8
006 1.976 3
113 1.968 45 1.988 w 1.96 13 1.959 17 1.969 m 1.970 10
201 1.941 1.941 1
022 1.866 78 1.886 w 1.86 30 1.854 33 1.866 m 1.868 23
1.836
1.743
204 1.638 67 1.636 m 1.63 20 1.628 33 1.633 m 1.639 9
017 1.553 33 1.550 ms 1.54 3 1.548 17 1.552 w 1.556 6
025 1.514 22 1.515 2
116 1.489 67 1.480 ms 1.493 20 1.483 67 1.488 m 1.491 13
212 1.442 78 1.445 s 1.443 27 1.438 100 1.441 m 1.443 16
108 1.386 22 1.381 17 1.386 w 1.387 4
124 1.329 45 1.331 ms 1.330 13 1.328 67 1.326 m 1.330 ii
009 1.319 1
300 1.313 45 1.313 1.307 33 1.310 m 1.312 6
207 1.286 22 1.281 17 1.284 w 1.284 2
215 1.260 11 1.237 raw 1.257 17 1.259 vw 1.261 2
303 1.243 10 1.246 1
028 1.184 22 1.182 3 1.102 17 1.1843 2
119 1.139 33 1.1399 4
220 1.134 mw 1.137 10 1.134 67 1.133 vw 1.1368 4
127 1.118 11 1.114 33 1.1179 2
306 1.093 33 1.094 mw 1.091 7 1.090 67 1.090 vw 1.0932 4
132 1.074 33 1.072 s 1.075 7 1.071 67 1.071 w 1.0738 5
218 1.048 22 1.047 3 1.049 17 1.0501 2
1 '0 *11 1.043 1.038 17 1.0399 2
314 1.023 22 1.022 1.022 3 1.023 33 1.0247 3
135 .9920 1
226 .986 22 . 984 .984 17 .9854 3
402 .969 22 .971 . 970 17 .9709 2
0*2*11. 945 17 .9455 2
309 .933 22 .927 ms .929 17 .9301 4
1*2*10 .9276 2
317 .919 .917 17 .9178 2
1*1*12 .9065 2
322 .892 22 .893 33 .8928 2
0*1*13 .890 ms .8886 2
138 .878 11 . 880 10 .8792 2
2*1*11 .873 ms .874 33 .8731 2
234 .864 33 .8640 2
410 .859 11 .860 ms .860 33 .8591 4
047 .8511 <1
.794 22 .829 33
.752 22 .821 17
21

References
[1] W. P. Davey, Precision measurements of the lat-
tice constants of twelve coirmon metals, Phys.
Rev. 25, 7 53-761 (1925).
[2] N. Parravano and V. Caglioti, Ricerche sul
sistema bismuto-selenio, Gazz. chim. ital. 60,
923-935 (1930).
[3] V. Caglioti, Sulla non esistenza dei sottoioduri
di bismuto RiJ2
e RiJ, Gazz. chim. ital. 60,
935 (1930).
[4] J. D. Hanawalt, H. W. Rinn, and L. K. Frevel,
Chemical analysis by X-ray diffraction, Ind.
Eng. Chem.,Anal. Ed. 10 ,
457-512 (1938).
[5] G. A. Harcourt, Tables for the identification of
ore minerals by X-ray powder patterns, Am. Min-
eralogist 27 ,63-113 (1942).
[6] D. Solomon and W. M. Jones, An X-ray investiga-
tion of the lead -bismuth and tin-bismuth alloys,
Phil. Mag. 11, 1090-1103 (1931).
[7] 0. Hassel and H. Mark, Uber die Struktur des
Wismuts, Z. Physik. 23, 269-277 (1924).
[8] W. F. Ehret and R. D. Fine, Crystal structure in
the system copper-bismuth, Phil. Mag. 10, 551-
559 (Oct. 1930).
[9] E. R. Jette and F. Foote, Precision determina-
tion of lattice constants, J. Chem. Phys. 3,
605-616 (1935).
[10] A. levins, M. Straumanis, and K. Karlsons, Die
Prazisionsbestimnung von Gitterkonstanten
nichtkubischer Stoffe (Bi, Mg, Sn) nach der
asymmetrischen Methode, Z. physik. Chem. 40B,
347-356 (1938).
[11] R. B. Jacobs and A. Goetz, The thermal expansion
of the bismuth lattice between 25° and 530°
Abs., Phys. Rev. 51, 159-164 (1937).
22
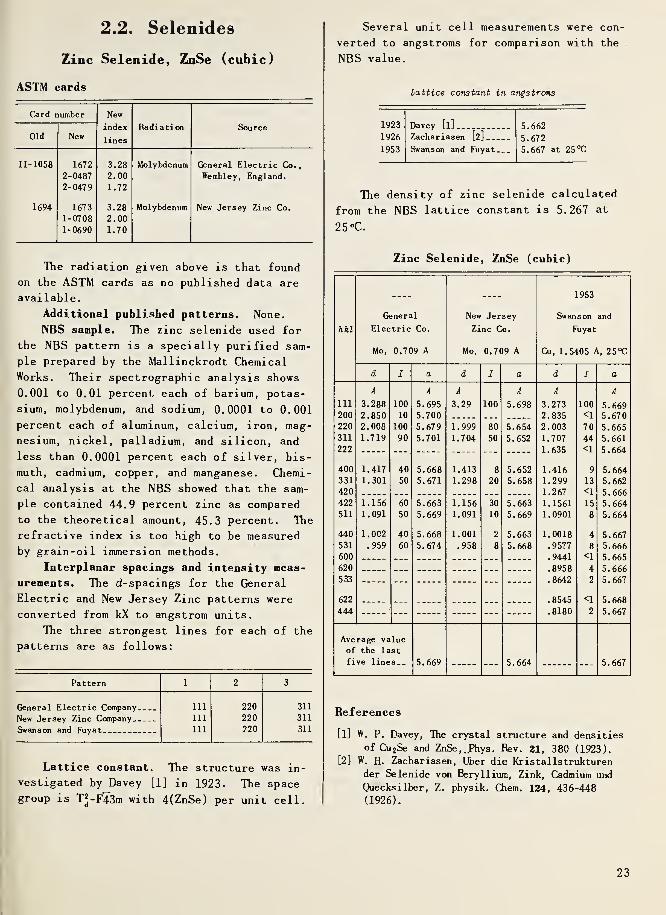
2.2. Selenides
Zinc Selenide, ZnSe (cubic)
Several unit cell measurements were con-
verted to angstroms for comparison with the
NBS value.
ASTM cards
Card number New
index
lines
Radiation SourceOld New
11-1058 1672 3.28 Molybdenum General Electric Co.
,
2-0487 2.00 Wembley, England.
2-0479 1.72
1694 1673 3.28 Molybdenum New Jersey Zinc Co.
1-07 0 8 2.00
1-0690 1.70
Lattice constant in angstroms
1923 Davey [l] 5.662
1926 Zachariasen [2] 5.672
1953 Swanson and Fuyat 5.667 at 25 °C
The density of zinc selenide calculated
from the NBS lattice constant is 5.267 at
25 °C.
The radiation given above is that found
on the ASTM cards as no published data are
available.
Additional published patterns. None.
NBS sample. The zinc selenide used for
the NBS pattern is a specially purified sam-
ple prepared by the Mallinckrodt Chemical
Works. Their spectrographic analysis shows
0.001 to 0.01 percent each of barium, potas-
sium, molybdenum, and sodium, 0.0001 to 0.001
percent each of aluminum, calcium, iron, mag-
nesium, nickel, palladium, and silicon, and
less than 0.0001 percent each of silver, bis-
muth, cadmium, copper, and manganese. Chemi-
cal analysis at the NBS showed that the sam-
ple contained 44.9 percent zinc as compared
to the theoretical amount, 45.3 percent. The
refractive index is too high to be measured
by grain-oil immersion methods.
Interplanar spacings and intensity meas-
urements. The d-spacings for the General
Electric and New Jersey Zinc patterns were
converted from kX to angstrom units.
The three strongest lines for each of the
patterns are as follows:
Pattern 1 2 3
General Electric Company in 220 311
New Jersey Zinc Company in 220 311
Swanson and Fuyat in 220 311
Lattice constant. The structure was in-
vestigated by Davey [1] in 1923. The space
group is T^-F43m with 4(ZnSe) per unit cell.
Zinc Selenide, ZnSe (cubic)
hkl
General
Electric Co.
Mo, 0.709 A
New Jersey
Zinc Co.
Mo, 0.709 A
1953
Swanson and
Fuyat
Cu, 1.5405 A, 25°C
d I a d J a d I a
A A A A A A
111 3.288 100 5.695 3.29 100 5.698 3.273 100 5.669200 2.850 10 5.700 2.835 <1 5.670
220 2.008 100 5.679 1.999 80 5.654 2.003 70 5.665311 1.719 90 5.701 1.704 50 5.652 1.707 44 5. 661
222 1.635 <1 5.664
400 1.417 40 5.668 1.413 8 5.652 1.416 9 5.664331 1.301 50 5.671 1.298 20 5.658 1.299 13 5.662
420 1.267 <1 5.666
422 1.156 60 5.663 1.156 30 5.663 1.1561 15 5.664511 1.091 50 5.669 1.091 10 5.669 1.0901 8 5.664
440 1.002 40 5.668 1.001 2 5.663 1.0018 4 5.667
531 .959 60 5.674 .958 8 5.668 .9577 8 5.666
600 .9441 <1 5.665
620 .8958 4 5. 666
533 . 8642 2 5.667
622 . 8545 <1 5.668
444 . 8180 2 5.667
Average va lue
of the last
fi ve lines.. 5.669 — — 5.664 ... 5.667
References
[1] W. P. Davey, The crystal structure and densities
of Cu 2Se and ZnSe,..Phys. Rev. 21, 3 80 (1923),
[2] W. H. Zachariasen, Uber die Kristallstrukturen
der Selenide von Beryllium, Zink, Cadmium und
Quecksilber, Z. physik. Chem. 124 ,436-448
(1926).
23

2.3. Oxides
Silicon dioxide (alpha-quartz), Si02
(hexagonal)
ASTM cards
Card number New
index
lines
Radiation SourceOld New
11-1034 1597 3.32 Molybdenum, Harrington [l] 1927.
2-0474 1.82 0.710.
2-0471 1.38
1535 3.35 No data Waldo [2] 1935.
2-0456 1.81
2-0459 1.37
1612 1472 3.35 Molybdenum Hanawalt, Rinn and
1-0633 4.25 Frevel [3] 1938.
1-0649 1.82
1471 3.35 Favejee [4] 1939.
3-0407 4.26 B3-0419 1.37
1534 3.35 Cobalt, Clark [5] 1946-
3-0427 1.81 1.786.
3-0427 1.54
11-1007 1533 3.35 Copper British Museum.
2-0455 1.81
2-0458 1.54
1602 3.32 Allis-Chalmers Mfg.
3-0454 1.54 Co.
3-0444 1.81
The Waldo pattern from the literature islabeled chrysocolla and the ASTM card car-
ries chrysocolla optical data. The pattern
contains both quartz and chrysocolla lines,
and is not typical of either material. No
explanation can be found for reference "B"
who is responsible for one line on the
Favegee card. The British Museum pattern ap-
pears to have been made with copper radiation
although molybdenum is listed.
Additional published patterns. None.
NBS sample. The alpha-quartz sample used
for the NBS pattern is a natural mineral from
Lake Toxaway, Transylvania County, North Car-
olina. The material was contributed by the
Geophysical Laboratory of the Carnegie Insti-
tution of Washington. Spectrographic analy-
sis at the NBS showed 0.001 to 0.01 percent
of aluminum and 0.0001 to 0.001 percent each
of calcium, copper, iron, and magnesium. The
NBS sample is uniaxial positive with refrac-
tive indices of w= 1 . 544 and e= 1.553.
Two additional samples of quartz were
considered for use in preparing the NBS pat-
tern. One was a high quality radio grade
crystal from Brazil, and the other a syn-
thetic crystal contributed by the Bell Tele-
phone Laboratories. Spectrographic analysis
at the NBS indicated that the Brazilian
crystal contained a slightly larger percent-
age of silver, copper, and magnesium than the
Lake Toxaway sample while the Bell crystal
had a slightly larger percentage of iron and
approximately 0.01 percent magnesium.
The synthetic and Lake Toxaway samples
showed no appreciable difference in
d-spacings. The Brazilian quartz averaged
about 0.00006 A smaller than the Lake Toxaway
sample for the last seven lines measured.
Interplanar spacings and intensity meas-
urements. All of the patterns were expressed
as d-spacings and were converted from kX to
angstrom units. The British Museum and
Allis-Chalmers patterns were taken from the
ASTM cards and the others from the original
literature. The Allis-Chalmers pattern con-
tains a number of completely erroneous lines,
30.0, 15.5 and 7.25 and a 1.84 line not al-
lowed by the space group. In addition the
pairs of lines at the end of the pattern are
presumably Ka.j and Ka2doublets of which only
the Ka.j lines have been included in the com-
parison table. The 3.73 line added to the
Favejee pattern by "B" is not allowed by the
space group.
The three strongest lines for each of the
patterns are as follows:
Patterns 1 2 3
Harrington. _ 101 112 212
Waldo.. 101 112 203,301Hanawalt, Rinn, and Frevel.. 101 100 112
Favejee 101 100 203,301
Clark 101 112 211
British Museum 101 112 211
Allis-Chalmers 101 211 112
Swanson and Fuyat 101 100 112
Lattice constants. The structure was de-
termined by Bragg and Gibbs [6] in 1925.
They found the space group was D^-P3j21 or
24
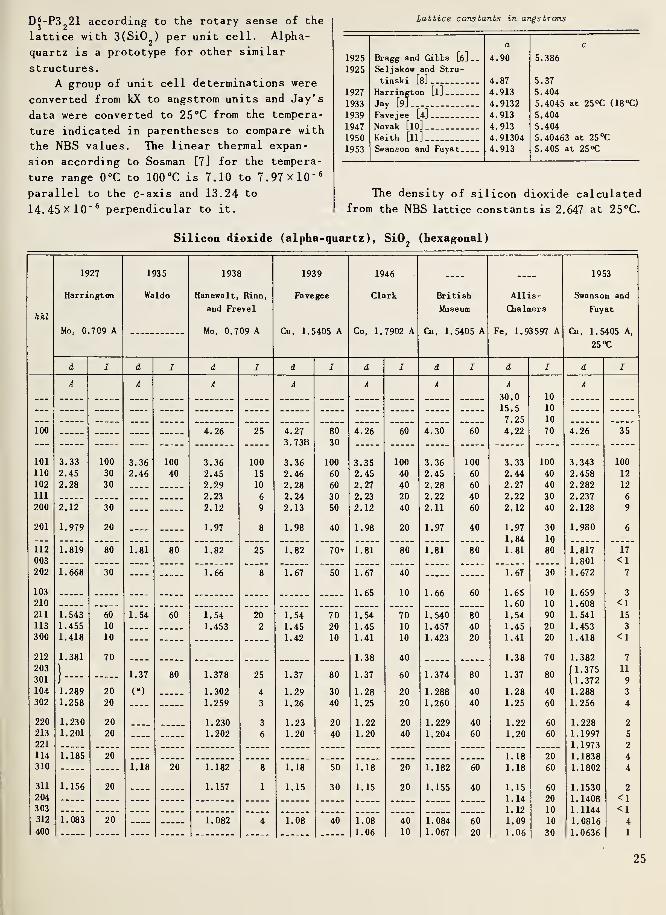
D^-P3221 according to the rotary sense of the
lattice with 3(Si02
) per unit cell. Alpha-
quartz is a prototype for other similar
structures
.
A group of unit cell determinations were
converted from kX to angstrom units and Jay’s
data were converted to 25°C from the tempera-
ture indicated in parentheses to compare with
the NBS values. The linear thermal expan-
sion according to Sosman [7] for the tempera-
ture range 0°C to 100 °C is 7.10 to 7.97x10" 6
parallel to the c-axis and 13.24 to
14.45x10" 6 perpendicular to it.
Lattice constants in angstroms
1925 Bragg and Gibbs fc]--
a
4.90
c
5.386
1925 Seljakow and Stru-
tinski [8] 4.87 5.37
1927 Harrington [l] - 4.913 5.404
1933 Jay [9]-- 4.9132 5.4045 at 25°C (18°C)
1939 Fave jee [4] 4.913 5.404
1947 Novak [lo] 4.913 5.404
1950 Keith [ll]... 4.91304 5.40463 at 25 °C
1953 Swanson and Fuyat 4.913 5.405 at 25°C
The density of silicon dioxide calculated
from the NBS lattice constants is 2.647 at 25°C.
Silicon dioxide (alpha-quartz), Si02
(hexagonal)
1927 1935 1938 1939 1946 .. .. . 1953
Harrington Waldo Hanawal t, Rinn, Faye gee Clark British Allis- Swanson and
and Frevel Museum Chalmers Fuyathkl
Mo. 0.709 A Mo. 0.709 A Cu, 1.5405 A Co, 1. 7902 A Cu, 1. 5405 A Fe. 1 .93 5 07 A Cu, 1.5405 A,
25°C
d I d I d I d I d I d I d I d I
A A A A A A A
30.0
15.5
7.25
4.22
10
10
10
70
A
100 — — - — 4.26 25 4.27
3.73B
80
30
4.26 60 4.30 60 4.26 35
101 3.33 100 3.36 100 3.36 100 3.36 100 3.35 100 3.36 100 3.33 100 3.343 100
110 2.45 30 2.46 40 2.45 15 2.46 60 2.45 40 2.45 60 2.44 40 2.458 12
102 2.28 30 2.29 10 2.28 60 2.27 40 2.28 60 2.27 40 2.282 12
111 2.23 6 2.24 30 2.23 20 2.22 40 2.22 30 2.237 6
200 2.12 30 — 2.12 9 2.13 50 2.12 40 2.11 60 2.12 40 2.128 9
201 1.979 20 — — 1.97 8 1.98 40 1.98 20 1.97 40 1.97
1.84
1.81
30
10
80
1.980 6
112 1.819 80 1.81 80 1.82 25 1.82 70+ 1.81 80 1.81 80 1.817 17
003 1.801 <1202 1.668 30 — — 1.66 8 1.67 50 1.67 40 — — 1.67 30 1.672 7
103
210
211
— — — — — — — — 1.65 10 1.66 60 1.65
1.60
1.54
10
10
90
1.659
1.608
1.541
3
<1151.543 60 1.54 60 1.54 20 1.54 70 1.54 70 1.540 80
113 1.455 10 1.453 2 1.45 20 1.45 10 1.457 40 1.45 20 1.453 3
300 1.418 10 1.42 10 1.41 10 1.423 20 1.41 20 1.418 <1
212 1.381 70 1.38 40 1.38 70 1.382 7
2031.37
(a
)
80 1.378
1.302
25
4
1.37
1.29
80
30
1.37
1.28
60
20
1.374
1.288
80
40
1.37
1.28
80
40
(1.375 11
301
104
i
1.289 20U.3721.288
9
3
302 1.258 20 — 1.259 3 1.26 40 1.25 20 1.260 40 1.25 60 1.256 4
220 1.230 20 1.230 3 1.23 20 1.22 20 1.229 40 1.22 60 1.228 2
213 1.201 20 1.202 6 1.20 40 1.20 40 1.204 60 1.20 60 1.1997 5
221 1.1973
1.1838
2
114 1.185 20 1.18 20 4310 1.18 20 1.182 8 1.18 50 1.18 20 1.182 60 1.18 60 1.1802 4
311 1.156 20 .... 1.157 1 1.15 30 1.15 20 1.155 40 1.15 60 1.1530 2
204 1.14
1.12
20 1.1408
1.1144
<1303 10 <1312 1.083 20 1.082 4 1.08 40 1.08 40 1.084 60 1.09 10 1.0816 4
400 1.06 10 1.067 20 1.06 30 1.0636 1
25

Silicon dioxide (alpha-quartz), SiO (hexagonal)—Con.
1927 1935 1938 1939 1946 __ _
Harrington Waldo Hanawalt, Rinn, Favegee Clark British Allis-
and Frevel Museum Chalmers
Mo, 0 709 A Mo. 0.709 A Cu. 1.5405 A Co. 1.7902 A Cu, 1. 5405 A Fe. 1.93597
d I d I d I d I d I d I d I
A A A A A A A
1.046 10 1.05 20 1.050 2 1.05 30 1.04 10 1.051 40 1.05 30
1.04 10 1.04 30
1.03 20 1.037 1 1.04 30 1.03 10 1.038 40 1.03 30
1.018 10 — — 1.017 1 1.02 30 1.01 10 1.017 40 1.01 30
|
.993 10 .990 40 .987 10
.985 10— — — - — — —
.974 10
— —.963 5 .958 20
.918 5
— - —.917 10
— —— - — — — .915
.912
20
10
— — —
-
.908 10
.898 2.5
.... — — — — — — -
.817
.793
2.5
2.5
—
-
— — — — — —
-
hkl
1953
Swanson and
Fuyat
Cu, 1.5405 A,
25°C
d
105
401
214
223
402
115
313
304
320
321
410
322
403
411
224
006
215
314
106
412
305
116
501
404
206
413
330
502
225
331
420
315
421
A
1.0477
1.0437
1.0346
1.0149
.9896
.9872
.9781
.9762
.9607
.9285
.9182
.9160
.9152
.9090
.9008
.8971
.8889
.8812
.8782
.8598
.8460
.8405
.8359
.8295
.8254
.8189
.8117
.8115
.8096
.8041
.7971
.7952
2
<11
2
<1
1
3
2
1
<1
2
2
<11
<1
<1<1<1
3
2
1
3
3
2
2
2
1
'Line at 1.32 not included.
References
[1] E. A. Harrington, X-ray diffraction measurements
on some of the pure compounds concerned in the
study or Portland cement, Am. J. Sci. 13, 467-
479 (1927).
[2] A. W. Waldo, Identification of the copper ore
minerals by means of X-ray powder diffraction
patterns, Am. Mineralogist 20, 586 (1935),
[3] J. D. Hanawalt, H. W. Rinn, and L. K. Frevel,
Chemical Analysis by X-ray diffraction, Ind.
Eng. Chem. ,Anal. Ed. 10 ,
457-512 (1938).*
[4] J. Ch. L. Favegee, Zur Methodik der rontgeno-
graphischen Bodenforschung, Z. Krist. 100, 430
(1939).
[5] C. B. Clark, X-ray diffraction data for compounds
in the system CaO-MgO-SiC>2 , J. Am. Ceram. Soc.
29, 25-30 (1946).
[6] W. H. Bragg and R. E. Gibbs, Structure of a and fi
quartz, Proc. Roy. Soc. (London) A109 ,405-427
(1925).
[7] R. B. Sosman, The properties of silica, Reinhold
Publishing Corporation, p. 370 (1927).
[8] N. Seljakow, L. Strutinski, and A. Krasnikow, Zur
Frage nach der Struktur des Glases, Z. Physik.
33 , 53-62 (1925).
[9] A. H. Jay, The thermal expansion of quartz by
X-ray measurements, Proc. Roy. Soc. (London)
A142, 237 (1933).
[10] J. Novak, Les modifications fibreuses de la
silice, Bull. soc. franc, mineral. 70, 288-299
(1947).
[11] H. D. Keith, Precision lattice -parameter measure-
ments, Proc. Phys. Soc. (London), 63B, 1034-1036
(1950).
26

Scandium oxide, Sc20
3(cubic)
ASTM cards. None.
Additional published patterns. None.
NBS sample. The scandium oxide used for
the NBS pattern was obtained from the Fair-
mount Chemical Co. ,Inc. Spectrographic
analysis at the NBS showed the following im-
purities: 0.01 to 0.1 percent each of plati-
num and silicon; 0.001 to 0.01 percent each
of calcium, copper, and magnesium; and 0.0001
to 0.001 percent of barium. The refractive
index of the NBS sample is 1. 964.
Interplanar spacings and intensity meas-
urements. The three strongest lines for the
NBS pattern are as follows:
Patte rns i 2 3
Swanson and Fuyat 222 440 622
Lattice constant. The structure was de-
termined by Zachariasen [1] in 1928. The
space group is T 5 -I213 with thallium oxide-
structure type and 16 (Sc20
3 ) per unit
cell
.
The Zachariasen unit cell value has been
converted from kX to angstrom units for com-
parison with the NBS values.
Lattice constant in angstroms
1928 Zachariasen [l] 9.81
1953 Swanson and Fuyat 9.845 at 25 °C
The density of scandium oxide calculatedfrom the NBS lattice constant is 3.847 at
25°C.
Scandium oxide, Sc20
3(cubic)
hkl
1953
Swanson and Fuyat
Cu, 1.5405 A, 25°C
d I a
A A
211 4.021 30 9.849222 2.841 100 9.842321 2.631 4 9.844400 2.461 15 9.844411 2.321 8 9.847
420 2.202 3 9.848332 2.099 26 9.845
422 2.009 4 9.842510 1.9301 20 9.842521 1.7977 9 9.846
440 1.7406 78 9.846530 1.6885 5 9.846
600 1.6407 2 9.844
611 1 . 5968 10 9.843620 1.5573 4 9.849
541 1.5188 9 9.843
622 1.4839 33 9.843
631 1.4517 12 9.846
444 1.4205 4 9.842
710 1.3924 4 9.846
640 1.3654 3 9.846
721 1.3397 8 9.845
642 1.3158 3 9.847
732 1.2507 3 9.848
800 1.2308 7 9.846
811 1.2120 5 9.846
820 1.1938 4 9.844
653 1.1769 3 9.847
822 1.1603 3 9.845
831 1.1445 4 9.845
662 1.1293 8 9.845
752 1.1147 2 9.845
840 1.1008 3 9.846
Average of the last five lines 9.845
References
[l] W. H. Zachariasen, Untersuchungen uber die Kri-stallstruktur von Sesquioxyden und VerbindungenAB0
3 ,Skrifter utgitt av Det Norske Videnskaps-
Akademi i Oslo, I. Mat.-Naturv. Klasse 1928,No. 4, 1928.
27
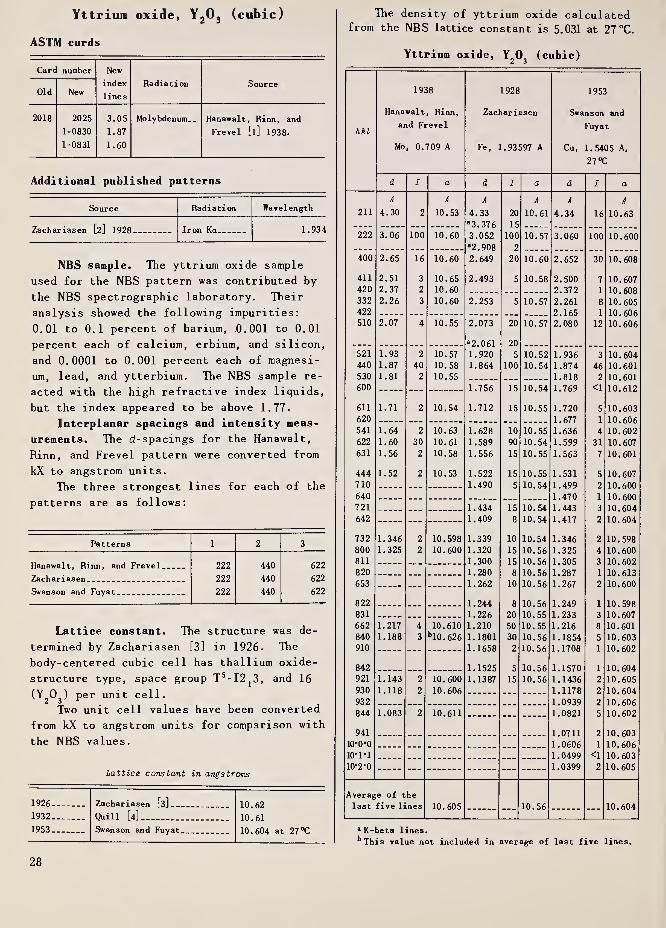
Yttrium oxide, Y20
3(cubic)
ASTM cards
Card number New
index
lines
Radiation SourceOld New
2018 2025 3.05 Molybdenum__ Hanawalt, Rinn, and
1-0830 1.87 Frevel [l] 1938.
1-0831 1.60
Additional published patterns
Source Radiation Wavelength
Zachariasen [2] 1928 Iron Ka_ 1.934
NBS sample. The yttrium oxide sample
used for the NBS pattern was contributed by
the NBS spectrographic laboratory. Their
analysis showed the following impurities:
0.01 to 0.1 percent of barium, 0.001 to 0.01
percent each of calcium, erbium, and silicon,
and 0.0001 to 0.001 percent each of magnesi-
um, lead, and ytterbium. The NBS sample re-
acted with the high refractive index liquids,
but the index appeared to be above 1.77.
Interplanar spacings and intensity meas-
urements. The d-spacings for the Hanawalt,
Binn, and Frevel pattern were converted from
kX to angstrom units.
The three strongest lines for each of the
patterns are as follows:
Patterns 1 2 3
Hanawalt, Rinn, and Frevel. 222 440 622
Zachariasen 222 440 622
Swanson and Fuyat 222 440 622
Lattice constant. Hie structure was de-
termined by Zachariasen [3] in 1926. The
body-centered cubic cell has thallium oxide-
structure type, space group T 5 -I2J3, and 16
(Y20
3) per unit cell.
Two unit cell values have been converted
from kX to angstrom units for comparison with
the NBS values.
Lattice constant in angstroms
1926 Zachariasen [3] 10.62
1932 Quill [4] . 10.61
1953 Swanson and Fuyat. 10.604 at 27 °C
The density of yttrium oxide calculatedfrom the NBS lattice constant is 5.031 at 27 °C.
Yttrium oxide, Y20
3(cubic)
hkl
1938
Hanawalt, Rinn,
and Frevel
Mo, 0.709 A
1928
Zachariasen
Fe, 1.93597 A
1953
Swanson and
Fuyat
Cu, 1.5405 A,
27°C
d / a d I a d I a
A A A A A A
211 4.30 2 10.53 4.33 20 10.61 4.34 16 10.63a 3 . 37 6 15
222 3.06 100 10.60 3.052 100 10.57 3.060 100 10.600“2.908 2
400 2.65 16 10.60 2.649 20 10.60 2.652 30 10.608
411 2.51 3 10.65 2.493 5 10.58 2.500 7 10.607420 2.37 2 10.60 2.372 1 1 0 ,
60R
332 2.26 3 10.60 2.253 5 10.57 2.261 8 10.605422 2.165 1 10^605510 2.07 4 10.55 2.073 20 10.57 2.080 12 10.606
“2.061 20
521 1.93 2 10.57 1.920 5 10.52 1.936 3 10.604440 1.87 40 10.58 1.864 100 10.54 1.874 46 10.601530 1.81 2 10.55 1.818 2 10.601600 1.756 15 10.54 1.769 <1 10.612
611 1.71 2 10.54 1.712 15 10.55 1.720 5 10.603620 1.677 1 10.606
541 1.64 2 10.63 1.628 10 10.55 1.636 4 10.602
622 1.60 30 10.61 1.589 90 10.54 1.599 31 10.607
631 1.56 2 10.58 1.556 15 10.55 1.563 7 10.601
444 1.52 2 10.53 1.522 15 10.55 1.531 5 10.607
710 1.490 5 10.54 1.499 2 10.600
640 1.470 1 10.600
721 1.434 15 10.54 1.443 3 10.604
642 1.409 8 10.54 1.417 2 10 604
732 1.346 2 10.598 1.339 10 10.54 1.346 2 10.598
800 1.325 2 10.600 1.320 15 10.56 1.325 4 10.600811 1.300 15 10.56 1.305 3 10.602820 1.280 8 10.56 1.287 1 10.613
653 1.262 10 10.56 1.267 2 10.600
822 1.244 8 10. 56 1.249 1 10. 598
831 1.226 20 10.55 1.233 3 10.607
662 1.217 4 10.610 1.210 50 10.55 1.216 8 10.601
840 1.188 3 b10. 626 1.1801 30 10.56 1.1854 5 10.603910 1.1658 2 10. 56 1.1708 1 10.602
842 1.1525 5 10.56 1.1570 1 10.604921 1.143 2 10.600 1.1387 15 10.56 1.1436 2 10.605
930 1.118 2 10.606 1.1178 2 10.604
932 1.0939 2 10.606
844 1.083 2 10.611 1.0821 5 10.602
941 1.0711 2 10.603
io-o-o 1.0606 1 10.606io-i-i 1.0499 <1 10.60310-2-0 1.0399 2 10.605
Average of the
last five lines 10.605 10.56 10.604
“ K-beta lines.b This value not included in average of last five lines.
28

References
[1] J. D. Hanawalt, H. W. Rinn and L. K. Frevel,
Chemical analysis by X-ray diffraction, Ind.
Eng. Chem., Anal. Ed. 10 ,457-512 (1938).
[2] W. H. Zachariasen, The crystal structure of the
sesquioxides and compounds of the type AB03 ,
Skrifter Norske Videnskaps-Akad. Oslo I. Mat.
Naturv. Kl. 1928 .No. 4 (1928).
[3] W. H. Zachariasen, The crystal structure of the
modification C of the sesquioxides of the rare
earth metals and of indium and thallium, Norsk
Geol . Tidsskr . 9, 310-316 (1926).
[4] L. L. Quill, Die Kristallstruktur des Yttriums,
Z. anorg. Chem. 208 ,59-64 (1932).
29

Molybdenum trioxide, Mo03
(orthorhombic
)
ASTM cards
Card number New
Old Newindex
lines
Radiation Source
1720 1621 3.25 Molybdenum.. Hanawalt, Rinn, and
1-0683 3.80 Frevel [l] 1938.
1-0706 3.46
Additional published patterns. None.
NBS sample. The molybdenum trioxide
used for the NBS pattern was obtained from
the Merck Chemical Co. Spectrographic anal-
ysis at the NBS showed the following impuri-
ties: 0.01 to 0.1 percent each of aluminum,
cobalt, manganese, and silicon; 0.001 to 0.01
percent of iron; 0.0001 to 0.001 percent each
of copper and magnesium; and less than 0.0001
percent of calcium. The refractive indices are
too high to be measured by the usual grain
immersion liquids.
Interplanar spacings and intensity meas-
urements. The d-spacings for the Hanawalt,
Rinn, and Frevel pattern were converted from
kX to angstrom units.
The three strongest lines for each of the
patterns are as follows:
Patterns 1 2 3
Hanawalt, Rinn, and Frevel 021 110 040
Swanson and Fuyat 021 110 040
Lattice constants. The structure was
determined by Wooster [2] and Brakken [3l
both in 1931. The space group is Dj^-Pbnm
(Pnma) and there are 4(Mo03 ) per unit cell.
Data for two unit cells were converted
from kX to angstrom units for comparison with
the NBS values.
Lattice constants in angstroms
1931 Wooster [2]
a
3.93
b
13.97
c
3.67
1931 Brakken T3] 3.962 13.853 3.701
1953 Swanson and Fuyat 3.962 13.858 3.697 at 26°C
The density of molybdenum trioxide calcu-
lated from the NBS lattice constants is 4.709
at 26°C.
Molybdenum trioxide, Mo03
(orthorhombic)
hkl
1938
Hanawalt, Rinn,
and Frevel
Cu, 1.5405A
1953
Swanson and
Fuyat
Cu, 1.5405A, 26°C
d I d I
A A
020 6.9 24 6.93 34
no 3.81 60 3.81 82
040 3.47 40 3.463 61
120 3.441 44
021 3.26 100 3.260 100
130 3.01 6 3.006 13
101 2.702 19
111 2.67 32 2.655 35
140 2.607 6
041 2.53 8 2.527 12
131 2.332 12
060 2.30 32 2.309 31
150 2.26 6 2.,' 1 18
141 2.13 6 2 \’*
j 9
160 1. 4
200 1. %2 13
061 1.97 24 1
,
17
002 1.85 24 1 21
230 11
170 , 1 ./ 7 i 5
161 1.756 5
080 1.73 16 1.733 17
221 1.70 4 1 . 693 8
112 1.67 12 1.663 13
042 1.63 12 1.631 13
171 1.60 12 1.597 15
180 1. 587 6
081 1.57 14 1.569 16
260 1.50 3 1.504 5
251 1.478 8 1.477 10
062 1.443 20 1.443 12
190 1.435 12
270 1.398 6 1.400 5
O’ KTO 1.386 5
202 1.352 6
References
[1] J. D. Hanawalt, H. W. Rinn, and L. K. Frevel,
Chemical analysis by X-ray diffraction, Ind. Eng.
Chem. , Anal. Ed. 10, 457-512 (1938).
[2] N. Wooster, The crystal structure of molybdenum
trioxide, Mo03> Z. Krist. 80 ,504-512 (1931).
[3] H. Brakken, Die Kristallstrukturen der Trioxyde
von Chrom, Molybdan und Wolfram, Z. Krist. 78,
484-488 (1931).
30

Antimony trioxide (senarmontite),Sb
20
3(cubic)
ASTM cards
Card number New
index
lines
Radiation SourceOld New
1767 1764 3.22 Molybdenum.
_
Hanawalt, Rinn, and
1-0742 1.96 Frevel [l] 1938.
1-0729 1.68
11-3011 3609 1.96 Iron __ Mikheev and Dubinina2-1273 3.18 [2] 1938.
2-1283 1.67 British Museum.
The orthorhombic antimony trioxide, val-
entinite, is represented in the ASTM card
file by patterns by the British Museum and
the Dow Chemical Co.
Additional published patterns
Source Radiation Wavelength
Dehlinger [3] 1927 Copper
NBS sample. The antimony trioxide used
for the NBS pattern was prepared by the Mal-
linckrodt Chemical Works. Their spectro-
graphic analysis showed the following impuri-
ties: 0.01 to 0.1 percent each of lead and
silicon; 0.001 to 0.01 percent each of sil-
ver, arsenic, calcium, copper, iron, nickel,
and tin; 0.0001 to 0.001 percent each of alu-
minum, gold, barium, bismuth, cadmium, co-
balt, sodium, and thallium; and less than
0.0001 percent each of cesium, indium, potas-
sium, lithium, and magnesium.
Interplanar spacings and intensity meas-
urements. The Dehlinger d-spacings were cal-
culated from Bragg angle data and the Hana-
walt, Rinn and Frevel and the Boldyrev d-spac-
ings were converted from kX to angstrom
units. The British Museum pattern which con-
tains d-spacings at 2.11, 1.159, 1.035 and
presumed /3-lines at 1.379 and 1.349 not found
in the Mikheev and Dubinina pattern, was not
published except as the ASTM card with Mikheev
and Dubinina and so was not included in the
table of d-spacings. The Dehlinger pattern
contains two d-spacings at 4.12 and 3.445
angstroms, neither of which are theoretically
possible antimony trioxide lines.
The three strongest lines for each of the
patterns are as follows:
Patterns 1 2 3
Hanawalt, Rinn, and Frevel__ 222 440 622
Mikheev and Dubinina 622 222 440
Dehlinger. _ ________ 440 622 662
Swanson and Fuyat 222 440 400
Lattice constant. The structure was de-
termined by Bozorth [4 ] in 1923. The space
group is 0^-Fd3m with 8(Sb40
6). The struc-
ture type is the same as that of cubic arsenic
trioxide
.
A group of unit cell values were con-
verted from kX to angstrom units for compari-
son with the NBS values.
Lattice constant in angstroms
1923 Bozorth [4] 11.16
1927 Dehlinger [3] _ 11.16
1938 Mikheev and Dubinina [2] 11.130
1942 Almin and Westgren [5]-- - __ 11.15
1953 Swanson and Fuyat 11.152 at 26 °C
The density of antimony trioxide calcu-
lated from the NBS lattice constant is 5. 583'
at 26 °C.
31

Antimony trioxide (senarmontite), Sb20
3(cubic)
hkl
mm1938
Hanawalt, Rinn, and Frevel
Mo, 0.709 A
1938
Mikheev and Dubinina
Fe, 1.93597 A
1927
Dehl inger
Cu, 1.5405 A
1953
Swanson and Fuyat
Cu, 1.5405 A, 26°C
d i a d I a d I a d 1 a
A A A A A A A A
111 6.4 10 11.09 6.44 12 11.15
4.12
3.445 W
222 3.23 100 11.18 3.218 8 11.15 3.225 m 11.17 3.218 100 11.147
400 2.79 30 11.14 2.785 5 11.14 2.794 w 11.18 2.788 40 11.152
331 2.57 8 11.18 2.559 3 11.15 2.567 vw 11.19 2.559 11 11.154
422 2.276 2 11.150
511 2.178 11.32 2.145 3 11.146
440 1.96 50 11.11 1.966 8 11.12 1.969 s 11.14 1.972 42 11.155
531 1.885 2 11.152
622 1.68 50 11.16 1.676 9 11.12 1.681 s 11.15 1.681 35 11.150
444 1.61 10 11.18 1.604 6 11.11 1.610 m 11.15 1.611 11 11.161
711 1.56 10 11.16 1.558
1.499
5
1
11.13 1.572 w-m 11.23 1.562 7 11.155
731 1.453 2 11.16 1.449 2 11.13 1.453 W-31 11.16 1.452 3 11.152
800 1.397 6 11.18 1.392 w 11.14 1.394 4 11.152
733 1.358 4 *11.12 1.363 4 11.157
662 1.286 15 11.21 1.277 7 11.13 1.280 s 11.16 1.279 12 11.150
840 1.250 10 *11.18 1.246 7 11.15 1.248 s 11.16 1.247 8 11.153
911 1.219 1 *11.11 1.223 1 11.14 1.224 2 11.151
931 1.186 1 11.32 1.1694 1 11.155
844 1.140 4 *11.17 1.136 4 11.13 1.138 m 11.15 1.1384 5 11.154
1.121 2
951 1.073 7 11.10 1.0783 4 11.15410*2*2 1.075 8 *11.17 1.0732 6 11.153
953 1.0402 1 11.15511*1*1 1.0056 1 11.153
880 .9856 2 11.151
11*3*1 .9744 3 11.15311*3*3 .9457 1 11.150
10*6*2 .9425 5 11.15212*0*0 .9291 3 11.14911*5*1 .9196 <1 11.15011*5*3 .8956 <1 11.15012*4*0 .8817 2 11.153
991 .8734 1 11.15113*1*1 .8527 3 11.15110*6*6 .8505 3 11.15412*4*4 .8406 2 11.15213*3*1 .8335 3 11.151
13*3*3 .8154 2 11.15013*5*1 .7986 2 11.152
Average value of last
five 1 ines 11.15 — 11.13 — — 11.15 — — 11.152
aValues used for average cell size.
References
[1] J. D. Hanawalt, H. W. Rinn and L. K. Frevel,
Chemical analysis by X-ray diffraction, Ind.
Eng. Chem., Anal. Ed. 10, 457-512 (1938).
[2] V. I. Mikheev and V. N. Dubinina, X-ray powder
diagrams of the oxide group, Zap. Len. Gorn.
Inst. 1938.
[3] U. Dehlinger, Uber die Kristallstruktur der Anti-
monoxyde, Z. Krist. 66, 108 (1927).
[4] R. M. Bozorth, The crystal structures of the
cubic forms of arsenious and antimonious oxides,
J. Am. Chem. Soc. 45, 1621 (1923).
[5] K. E. Almin and A. Westgren, Lattice parameters
of cubic As40
6and Sb
40
ft,Arkiv. Kemi. Mineral.
Geol. 15B, No. 22, (1947).
32

Lanthanum oxide, La20
3
(hexagonal)
ASTM cards
Card number New
index
lines
Radiation SourceOld New
11-1432 2172 2.97 Molybdenum.
_
General Electric Co.
2-0673 3.41 Wembley, England.
2-0688 1.96
The following ASTM card for lanthanum oxide is the patternfor the cubic form at 450°C.
2.02 Copper, Lohberg [l] 1935.
4-0855 1.72 1.5418.
4-0856 3.30
Additional published patterns
Source Radiation Wavelength
NBS sample. The lanthanum oxide used
for the NBS pattern was obtained from the
Fairmount Chemical Co. The sample was
annealed at 1,200°C for one hour and was
mounted in petrolatum to prevent reabsorption
of carbon dioxide and water, with which lan-
thanum oxide readily combines, according to
Hiittig and Kantor [3].
Spec trographic analysis at the NBS showed
the following impurities: 0.001 to 0.01 per-
cent each of calcium, magnesium, and silicon;
and 0.0001 to 0.001 percent each of aluminum,
copper, iron, and lead.
Interplanar spacings and intensity meas-
urements. The d-spacings for the Zachariasen
pattern were calculated from Bragg angle data
while the General Electric d-spacings were
converted from kX to angstrom units.
The three strongest lines for each of the
patterns are as follows:
Patterns 1 2 3
General Electric Company 101 100 110
Zachariasen 101 112,201 103
Swanson and Fuyat 101 no 102
Lattice constants. The structure was de-
termined by Zachariasen [2] in 1926. The
space group is D3-P321 with l(La
20
3 ) per
unit cell. Lanthanum oxide is a prototype
for other similar structures.
Data for two unit cells have been con-
verted from kX to angstrom units for compari-
son with the NBS values.
Lattice constants in angstroms
a c
1926 Zachariasen [2] 3.94 6.13
1929 Pauling [4] 3.93 5.63
1953 Swanson and Fuyat 3.9373 6.1299 at 26°C
The density of lanthanum oxide calculated
from the NBS lattice constants is 6.573 at 26 °C.
Lanthanum oxide, La20
3(hexagonal)
hkl
General Electric
Co.,Wembly, Eng.
Mo, 0.709A
1926
Zachariasen
W, 0.20904A
1953
Swanson and
Fuyat
Cu, 1.5405A, 26°C
d I d 1 d I
A A A
100 3.42 60 3.419 40 3.41 34002 3.07 50 3.076 40 3.063 31
101 2.978 100 2.988 100 2.980 100
102 2.278 50 2.289 50 2. 278 58
no 1.964 60 1.975 60 1.968 63
103 1.750 50 1.760 70 1.753 52200 1.702 10 1.710 10-20 1.705 4
112 1.655 40 1.661 )f1.656 24
201 1.640 30 1,646 j
100(1.642 17
004 1. 531 10 1.541 10-20 1.532 3
202 1.488 30 1.496 20 1.490 5
104 1.393 10 1.403 30 1.398 2
203 1.307 20 1.315 50 1. 309 7
210 1.286 10 1.293 10 1.289 2
211 1.259 30 1.266 70 1.261 12
114 1.206 10 1.214 70 1.209 6
212 1 192 30-40 1 1879 4
105 1.158 50 1 1538 4
204 1. 140 40 1.1396 2
300 1 1367 4
213 1.094 70 1.0901 7
302 1 070 50 1 0658 4
006 1.026 0- 10 1 0220 < 1
205 1.000 50 . 9952 3
220 . 9840 3
106 9787 1
310 .9459 < 1
222 . 9372 3
311 . 9345 5
304 . 9131 2
116 .9070 2
215 . 8883 5
206 . 8766 1
313 . 8583 4
107 . 8480 2
401 . 8443 1
224 8283 2
314 .8050 1
1171
216 8007 21
33

References
[1] K. Lohberg, Uber die C-modi filiation der Sesqui-oxyde von Neodym und Lanthan, Z. physik. Chem.
B28, 402-7 (1935).
[2] W. Zachariasen, Die Kristallstruktur der A-Modifi-kation von den Sesquioxyden der seltenen Erd-metalle (La.O,, Ce„CL, Pr„0,
, Nd,0, ), Z. physik.Chem. 123, 134-150 (1926)
323
[3] G. F. Hiittig and M. Kantor, Das System Lanthan
(III) oxyd/Wasser, Z. anorg. allg. Chem. 202,
421-428 (1931).
[4] L. Pauling, The crystal structure of the A-modi
fication of the rare earth sesquioxides, Z.
Krist. 69, 415-421 (1929).
34

Mercury (II) oxide (montroydite ) ,HgO
(orthorhombic
)
ASTM cards
Card number New
index
lines
Radiation SourceOld New
11-672 1089 3.85 Bird [l] 1932.
2-0309 2.862-0305 5.26
2190 2183 2.96 Molybdenum.. Hanawalt, Rinn, and1-0882 2.83 Frevel [2] 1938.
1-0896 2.40
Additional published patterns
Source Radiation Wavelength
Levi [3 ] 1924-
Zachariasen [4] 1927-- Iron 1.934
NBS sample. The red and yellow mercuric
oxides used for the NBS pattern were ACSstandard samples from the Mallinckrodt Chemi-
cal Works. Spectrographic analysis at the
NBS showed the following impurities for the
yellow form: 0.01 to 0.1 percent each of
calcium and magnesium; 0.001 to 0.01 percent
each of aluminum, iron, nickel, and silicon;
and 0.0001 to 0.001 percent of chromium; and
the red form: 0.01 to 0.1 percent each of
aluminum, calcium, magnesium, and silicon;
and 0.001 to 0.01 percent each of chromium
and iron. The refractive indices are too
high to be measured by the usual grain-oil
immersion methods.
The NBS pattern is that of the yellow
oxide as it gave a better pattern than the
red form. However, measuring the red pattern
as accurately as possible, there were no sys-
tematic differences between the two samples
and any differences observed were smaller
than the experimental error of the apparatus.
Therefore, it is believed, at least for pow-
der data, that the two forms are identical
and the NBS pattern will serve for both the
red and yellow mercuric oxides.
Interplanar spacing and intensity meas-
urements. The d-spacings for the Levi and
the Zachariasen patterns were calculated from
Bragg angle data while d-spacings for the
Bird and the Hanawalt, Rinn, and Frevel pat-
terns were converted from kX to angstrom
units
.
The controversy concerning the possible
existence of two distinct forms of mercuric
oxide, the red and the yellow, has been rec-
onciled and the present authors feel both are
the same form; the difference in color being
due to grain size or some other factor not
affecting the structure. The data supports
this contention.
The Levi patterns for both the red and
yellow oxides are thought to be identical.
The Zachariasen d-spacings were made on a
sample containing sodium chloride which
covered four lines of the pattern as indi-
cated in the table. The intensity pattern
made without the sodium chloride standard
contains these four lines.
Three lines of the Bird pattern, includ-
ing his first and third strongest lines are
due to kleinite, a mercury ammonium chloride
of uncertain composition. This contamination
is understandable since the pattern was made
from a natural mineral sample. Both of the
Levi patterns also contain extra lines appar-
ently due to eglestonite, Hg4Cl
20.
The three strongest lines for each of the
patterns are as follows:
Pattern 1 2 3
101
Hanawalt, Rinn, and Frevel __ Oil 101 110
Levi, yellow sample _ 112 022 noLevi, red sample 112 022 123
112 130 Oil
Swanson and Fuyat Oil 101 no
Lattice constants. The structure was de-
termined by Zachariasen [ 4 ] in 1947. The
space group is D^-Pmnm (Pmmn) with 2(HgO)
per unit cell.
The Zachariasen unit cell data were con-
verted to angstrom units for comparison with
the NBS values.
Lattice constants in angstroms
1927 Zachariasen [4 ]
a
3.302
b
3.519
c
5.513
1953 Swanson and Fuyat __ 3.304 3.519 5.518 at 25°C
The density of mercuric oxide calculated
from the NBS lattice constants is 11.211 at
25 °C.
35

Mercury (II) oxide (yellow), HgO (orthorhombic)
hkl
1932
Bird
1938
Hanawalt, Rinn,
and Frevel
Mo, 0.709 A
1924
Levi
Cu, 1.5405 A
1927
Zachariasen
Fe, 1.93597 A
Yellow HgO Red HgO
1953
Swanson and Fuyat
Cu, 1.5405 A, 25°C
Oil
101
002
110
112
020
200
013
103
210
121
022
211
202
004
212
220
114
123
213
031
130
222
024
301
032
204
015
310132
A
a5. 272
a3. 856
30
100
2.870
“2.622
2.407
50
10
2.97
2.84
2.76
100
75
38
30 2.40 75
1.766 30
1.81
1.75
1.64
1.60
63
8
15
10
1*3.10
2.98
2.83
2.73
2.65b2. 56
2.33bl . 95
1.77
1.73
b3.16
2.98
2.86
2.75
2.67
2.977
(c
)
2.758
70
70
50
2.35bl . 97
1.79
1.74
2.409 70
1.63
1.60
bl .58
|1.500
1.444
30
10
1.489
1.443
1.416
1.381
38
20
8
5
1.47
1.42
1.40
1.36
1.30
1.64
1.61
bl. 59
1.52
1.48
1.43
1.41
1.37
1.31
1.813
1.761
1.650
(c
)
1.608
100
20
40
40
40
mw
vw
mw
vw
1.495
1.484
1.443
1.416
1.378
70
40
60
40
30
1.182 10
1.143
1.134
10
10
1.202
1.189
1.163
1.150
13
10
5
3
1.19
1.17
1.15
1.14
ms
ms
1.19
1.16
1.15
1.197
1.186
1.161
(c
)
50
35
50
30
(C) 80
1.105 1.09 1.11
1.081 1.07 1.08
1.052
1.028
5B
3
1.05
1.02
1.05
1.03
ms
mw
2.967
2.834
2.759
2.408
1.814
1.759
1.651
1.630
1.607
1.495
1.484
1.443
1.417
1.379
1.315
1.204
1.1971
1.1866
1.1605
1.1475
1.1052
1.1039
1.0855
1.0801
1.0589
1.0532
1.0510
1.0262
1.015 10
033
312
303
231
321
224
.984
.945
.977 .986
.940
.917d .903
.943
.921e .905
.9890
.9823
.9450
.9425
.9202
.9072
100
81
58
67
49
11
11
15
13
25
12
18
11
4
1
5
10
9
7
4
aThese lines probably kleinite, a mercury ammonium chloride.^These lines probably due to eglestonite, Hg^^O.cLines covered by NaCl-std; the intensity pattern made without standard.dTwel ve additional lines omitted.eSeven additional lines omitted.
36

References
[1] P. H. Bird, A new occurrence and X-ray study of
mosesite, Am. Mineralogist 17 ,541-550 (1932).
[2] J. D. Hanawalt, H. W. Rinn, and L. K. Frevel,
Chemical analysis by X-ray diffraction, Ind.
Eng. Chem.,Anal. Ed. 10 ,
457-512 (1938).
[3] G. R. Levi, Identita cristallografica delle due
forme di ossido mercurico, Gazz chim. ital. 54,
709-712 (1924)...
[4] W. Zachariasen, Uber die Kristallstruktur des
Quecksilberoxyds, Z. physik. Chem. 128 ,421-429
(1927).
37

2.4. Oxide Hydrates
Alpha-aluminum oxide mono-hydrate(bohmite), 3 <x-A1
20
3*H
20 (orthorhombic)
ASTM cards
Card number New
index
lines
Radiation SourceOld New
11-3183 3695 1.85 No data Weiser and Milligan [l]
2-1314 2.34 1932.
2-1316 1.31 Iron.. Kovalev [2] 1938.
0277 6.9 Copper Noll [3] 1936.
3-0063 6.1
3-0065 2.35
0278 A continuation of the
3-0064 preceding, card.
3-0066
1868 1848 3.16 Molybdenum New Jersey Zinc Company.
1-0777 1.85
1-0774 2.33
3544 3689 1.85 Molybdenum Physics Department,
1-1281 6.20 Newcastle-on-Tyne,
1-1284 3.16 England.
11-216 0360 6.2 Molybdenum Imperial Chem. Indus-
2-0130 3.17 tries, Billingham,
2-0129 2.34 England.
The Imperial Chemical Co. sample was a
mineral specimen while all of the rest were
synthetic materials. The seven line Weiser
and Milligan pattern combined with the Kova-
lev pattern on an ASTM card, is called delta-
alumina by the authors.
Additional published patterns
Source Radiation Wavelength
Reichertz and Yost [5] 1946 Mo. and Cu
.
—NBS sample. The alpha-aluminum oxide
mono-hydrate used for the NBS pattern was
prepared at the Aluminum Co. of America, Alu-
minum Research Laboratories by digesting
alpha-aluminum trihydrate (made by the Bayer
process) in steam at 200°C. Spectrographic
analysis at the NBS showed the following im-
aThe Greek letter designation used is that of the Alumi-
num Company of America. Bohmite also has been referred to
as gamma- alumina monohydrate.
purities: 0.01 to 0.1 percent each of calci-
um, magnesium, and silicon; 0.001 to 0.01
percent each of iron, manganese, nickel and
titanium; and 0.0001 to 0.001 percent each of
chromium and copper. The NBS sample was too
fine for detailed optical measurements but
the average index of the crystal aggregates
is 1.64 to 1.65.
Interplanar spacxngs and intensity meas-
urements. The d-spacings for the Weiser and
Milligan, the Kovalev, and the Reichertz and
Yost patterns were converted from kX to ang-
strom units while d-spacings for the Noll,
the New Jersey Zinc, the Physics Department,
Newcastle-on-Tyne, the Imperial Chemical In-
dustries, Billingham, England, and the Schwi-
ersch patterns were calculated from Bragg an-
gle data.
The three strongest lines for each of the
patterns are as follows:
Patterns 1 2 3
Weiser and Milligan 002 200 041,130
Noll - 020 041,130
Kovalev 041,130 002 152
New Jersey Zinc 021 002 041,130Physics Department, Newcastle--,- 002 020 021
Imperial Chemical Industries 020 021 041, 130
020 021
Reichertz and Yost , 020 150,002 021
Swanson and Fuyat —, 020 021 041,130
Reichertz and Yost measured integrated
intensities rather than peak height above
background.
Lattice constants. The structure was de-
termined by Reichertz and Yost [5] in 1946.
The space group is D^-Cmcm with 2(A120
3*H
20)
per unit cell.
Data for two unit cells were converted
from kX to angstrom units for comparison with
the NBS values.
Lattice constants in angstroms
1936 Goldsztaub [b]
a
2.86
b
11.8
c
3.79
1946 Reichertz and Yost [5] 2.865 12.26 3.698
1953 Swanson and Fuyat 2.868 12.227 3.700 at 26°C
The density of bohmite calculated from
the NBS lattice constants is 3.070 at 26°C.
38

Alpha-aluminum oxide mono-hydrate (bohmite), a-Al20
3*H
20 (orthorhombic)
1932 1936 1938 _ 1933 1946 1953
Weiser and Noll KovaJ ev New Jersey Physics Imperial Schwiersch Reichertz Swanson and
Milligan Zinc Co. Dept Chem. and Yost Fuyat
Newcastle- Industries
,
hkl on-Tyne, Billingham,
England England
Cu. 1. 5405 A Fe. 1 .93597A Mo. 0.709A Mo. 0.709A Mo. 0.709A Cu. 1.5405 A Cu. 1.5405 A.
and Mo, 0.709A 26°C
d I d I d i d I d I d I d I d I d I
A A A A A A A A A
6.86 100 6.91 100
020 6.09 100 — — — 6.21 72 6.2 100 6.06 100 6.12 100 6.11 100
---- 3.51 40
3.300 60
021 3.15 50 3.146 90 3.164 80 3.17 100 3. 17 72 3.18 100 3.140 100 3.160 48 3. 164 65
2. 938 20
2.597 50 2.605 40
2. 415 60
041 ) ( 2.355
130 ]2 . 36 70 2.340 100 2.349 100 2.33 75 2.350 72 2.34 100 2.331 100[ 2.341 )
42 2.346 53
2.037 60 2.047 50
131 1.977 30 1.979 30 1.980 13 1.979 9 1.985 60 1.988 30 1.977 4 1.980 6
150 1.8591 to
( 1.860 32
002 1.85 100 1.841 100 1.853 100 1.851 83 1.85 100 1.859 100 1.843 100 1.845 j52
l 1.850 27
1.785 (
022 — — 1.763 40 1.764 30 1.757 3 1.76 19 1.771 60 1.770 40 1.7661
4i 1.770 6
151 1.657 60 1.667 70 1.659 18 1.659 31 1.663 70 1.657 60 1.660 11 1.662 13
1.61 1 1.604 20 1.609 30 1.538\
(
080 1.524 50 1.524 60 1.523 1 1.527 9 1. 529 60 1. 527 50 1.530 ] 1.527 6
132 1.449 80 1.455 80 1.451 18 1.448 31 1.453 70 1.450 80 1.449) (
1.453 16
200 1.43 80 1.432 50 1.431 19 1.433 60 1.438 20 1.429 21 1 1.434 9
081 1.413 ) ( 1.412 1
220 1.397 50 1.38 25 1.392)
(1.396 2
171 1.379 60 1.382 50 1.385 70 1.385 50 1.383 9 < 1.383 6
062 1.368 i l 1.369 2
152 1.32 60 1.309 100 1.309 26 1.309 50 1.310 80 1.310 80 1.3101 , Q (
1.312 15
221 1.305 80 1.302 )
18l 1.303 3
1.285 10 —1.253 10
241 1.205 20 1.223 20 1.224 3 1.222 20 1.224 10 1.224 1
023 1.208 20 1.204 3 1.207 40 1.211 10 1.206 1.209 2
082 1.178 f 1.1782 3
260 — — 1.175 40 1.177 40 — — 1.177 9 1.179 60 1.179 40 1.171 ) 1 1. 1711 <1
1. 165) (
1. 162|
172 1.157 40 1.158 40 1. 158 9 1.159 60 1.162 40 1. 160 J ( 1.1609 3— 1.148 60
202 1. 13 10 1.112 30 1.133 60 1. 130 6 1. 13 13 1.133 70 1.134 50 1.130 1.1337 5
222 1. 11 6 1.115 60 1.117 20 1.1152 2
133 1.090 5 1.091 30b 1.0917 < 1
280 — — 1.045 30 — — — 1.043 3 1.047 60 1.046 40 — 1.0459 2
153 1.021 30 1.029 50 1.027 40 1.0281 1
1.023 3 1.019 40
262 .990 20 ... .9903 <1.9795 10 .982 40 .986 10 .9818 <1
( . 9586 10 1
173 — —(
. 9479 50.951 60 .951 40 .9506 2
330 .9304 30 .931 50 .930 30 .9310 2
0041
223— .9218 50 .925 60 .924 40 — — .9247 2
39

Alpha- aluminum oxide mono-hydrate (bohmite), a.-Al20
3-H
20 (orthorhombic )—Con.
1938
Kovalev
Fe, 1. 93597
A
New Jersey
Zinc Co.
Mo, 0.709A
Physics
Dept.
Newcastle-
on -Tyne,
England
Mo, 0.709A
Imperial
Chem.
Industries,
Billingham,
England
Mo, 0.709A
1933
Schwiersch
1946
Reichertz
and Yost
Cu, 1.5405 A
and Mo, 0.709A
1953
Swanson and
Fuyat
Cu, 1.5405 A,
26°C
d I d I d I d I d I d I d I
A A A A
.915 30
A A A
.912 60 .911 40 .9105 2
.903 60 .904 40 . 9023 2
... — .... — ...
.891 40
..... .8937
.8907
<11
. 868 50 .8660 < 1
.861 50 .8607 1— — .831 60 — .8316 2
.828 60 . 8286 3
.819 40 .8180 1
.803 60 .8026 2
.792 40
hkl
1932
Weiser and
Milligan
1936
Noll
Cu, 1.5405 A
282
331
243
350
351
134
332
154
371
352
.9091
.9013
.8896
.8662
.8586
.8317
.8266
.8170
.8098
.8016
References
[1] H. B. Weiser and W. 0. Milligan, X-ray studies on
the hydrous oxides. I. Alumina, J. Phys. Chem.
36 , 3010-3029 (1932).
[2] J. A. Kovalev, Debye-Sherrer diffraction diagrams
of some oxide and borate minerals, Materialy
TsNIGRI 1938. From A. K. Boldyrev and others,
Annales de l'Institut des Mines a Leningrad 11
(2) (1938).
[3] W. Noll, Mineralbildung im System Al203-Si0
2-H
20,
Neues Jahr. Mineral. 70, 76 (65-115) (1936).
[4] H. Schwiersch, Thermischer Abbau der naturlichen
Hydroxyde des Aluminiums und des dreiwertigen
Eisens, Chem. Erde 8, 252 (1933). From Noll,
reference 3.
[5] P. P. Reichertz and W. J. Yost, The crystal struc-
ture of synthetic boehmite, J. Chem. Phys. 14 ,
495-501 (1946).
[6] S. Goldsztaub, Quelques Observations sur la Boeh-
mite, Bull. soc. franc, mineral. 59 ,348-350
(1936).
40

Beta-aluminum oxide mono-hydrate(diaspore),® /3-Al
20
3*H
20 (orthorhombic)
ASTM cards
Card number New
index
lines
Radiation SourceOld New
11-2498 3217 2.33 Molybdenum Hansen and Brownmiller
2-1104 2.14 [l] 1928.
2-1106 2.08
1038 1009 4.00 Molybdenum Weiser and Milligan [2]
1-0446 2.34 1932.
1-0447 2.13
11-628 1059 3.99 No data British Museum.
2-0301 2.13 Iron Kovalev [3] 1938.
2-0291 1.64 No data Kerr [4] 1932.
Molybdenum Weiser and Milligan [2]
1932.
1046 1058 3.99 Molybdenum Hanawalt, Rinn, and
1-0470 2.31 Frevel [5] 1938.
1-0449 1.63
1056 1057 3.98 Molybdenum Physics Department,
1-0469 2.31 Newcastle-on-Tyne,
1-0454 2.13 England.
The British Museum contributed five lines
with d-spacings and intensities of 4.45, 60;
3.60, 20; 2.02, 20; 1.91, 40; 1.76, 20 to the
composite pattern, card 2-0291. Because
these d-spacings represent only lines not
found in any of the other three patterns in
the composite, and the complete British Mu-
seum pattern apparently was not published,
the above data were not presented in the ta-
ble of d-spacings.
Additional published patterns
Source Radiation Wavelength
Rooksby [6] 1929-
-
NBS sample. The diaspore sample was
contributed by the Aluminum Research Labora-
tories, Aluminum Company of America. It is a
* The Greek letter designation used is that of the Alumi-
num Company of America. Diaspore has also been referred to
as alpha-alumina monohydrate.
mineral from Springfield, Mass, containing
0.18 percent of Si02
and 0.64 percent of
Fe20 3
by chemical analysis at the Aluminum
Company. Spectrographic analysis at the NBSshowed the following impurities: 0.1 to 1.0
percent each of iron, magnesium, silicon, and
titanium, 0.01 to 0.1 percent each of nickel
and vanadium, and 0.001 to 0.01 percent each
of calcium, chromium, copper, and manganese.
The sample is biaxial positive with large 2V,
a= 1.700 and y= 1.745. The /3-index was not
readily available due to the platy character
of the crystal perpendicular to that direc-
tion.
Interplanar spacings and intensity meas-
urements. The d-spacings for all the pat-
terns were converted from kX to angstrom
units. The pattern from the Physics Depart-
ment, Newcastle-on-Tyne and the British Mu-
seum pattern have not been published except
in the ASTM file.
The intensity values for the (010) planes
of diaspore are difficult to determine as di-
aspore commonly grows platy crystals perpen-
dicular to the b- axis. The three strongest
lines for each of the patterns are as fol-
lows :
Patterns 1 2 3
Hansen and Brownmiller 111 121 140
Weiser and Milligan no 111 121
Kerr _ __ no 111 121
221 121 140
Hanawalt, Rinn, and Frevel _ no in 221
Physics Department, Newcastle _ no in 121
Rooksby -- -- no 111 221
Swanson and Fuyat no in 121
There are four lines present in some of
the patterns that do not appear in the NBSpattern. The lines, d-spacing 4.87 and 4.40
are probably due to the alpha-alumina monohy-
drate or to one of the trihydrates. The 3.50
line might be due to corundum, and the 2.82
line could be a strong line for either kappa
or beta alumina. All the patterns were made
41

by using mineral diaspore, as it has never
been prepared sufficiently pure or in large
enough quantity for an X-ray pattern.
Lattice constants. The structure was de-
termined by Deflandre [7] in 1932. The space
group is Dijj-Pbnm (Pnma) with 2(A120
3*H
20)
per unit cell.
A group of unit-cell values were con-
verted from kX to angstrom units for compari-
son with the NBS values.
Lattice constants in angstroms
1932 Deflandre [7 ]
a
4.41
b
9.40
c
2.84
1933 Takane [8] 4.44 9.38 2.81
1935 Ewing [9] - 4.41 9.41 2.85
1940 Hoppe [lo] 4.43 9.46 2.85
1953 Swanson and Fuyat 4.396 9.426 2.844 at 25°C
The density of diaspore calculated from
the NBS lattice constants is 3.380 at 25°C.
Beta- aluminum oxide mono-hydrate (diaspore), /3-Al20
3•H
20 a
1928 1932 1932 1937 1938 1929 1953
Hanson and Weiser and Kerr Kovalev Hanawalt, Physics Dept. Rooksby Swanson and
Brownmiller Milligan Rinn, and Newcastle, Fuyat
hkl Freve] Eng.
Mo. 0.709 A Mo. 0.709 A Fe. 1.93597 A Mo. 0.70Q A Mo. 0.709 A Cu. 1.5405 A.
25 °C
d I d I d I d I d I d I d I d I
A A A
4.87 5
A A A A A
020 4.68 5 4.699 20 4.71 9 4.700 10 4.71 13
4.44 3
no — ... 4.01 100 4.02 100 3.996 60 4.00 100 3.99
3.51
100
6
3.985
3.513
100
20
3.99 100
120 3.28 20 3.256 10 3.21 8 3.22 6 3.222 20 3.214 10
2.83 5
130 2.58 s 2.58 80 2.59
2.52
50
5
2.559 60 2.56 33 2.57 41 2.563 40 2.558 30
021
101
040
— —— —
2.37 5
2.38 3 ---
2.434
2.386
2.356
3
5
8
111 2.33 vs 2.34 100 2.328 100 2.318 60 2.31 100 2.31 72 2.317 80 2.317 56
121 2.14 vs 2.13 100 2.148 100 2.134 80 2.12 67 2.13 59 2.128 70 2.131 52
140 2.08 vs 2.08 20 2.088 100 2.076 80 2.06 67 2.07 50 2.076 70 2.077 49
131 ... 1.898 6 1.896 5 1.901 3
041 1.81 w 1.82 10 1.838 5 1.81 7 1.81 6 1.811 10 1.815 8
150 1.738 5 1.733
1.712
3
211 1.715 s 1.71 20 1.710 40 1.71 20 1.711 19 1.710 30 15
141 1.675 w 1.676 20 1.678 3
221 1.634 vs 1.63 100 1.643 100 1.633 100 1.63 83 1.63 •59 1.632 80 1.633 43
240 1.604 w 1.608 30 1.60 5 1.607 6 1.606 20 1.608 12
060 1.574 vw 1.54 10 1.548 5 1.570 20 1.570 4
231 1.525 Cl 1.50 20 — — 1.520 20 1.52 8 1.52 6 1.522 10 1.522 6
160
151 j
1.483 s 1.47 20 1.498 30 1.480 80 1.480 33 1.481 41 1.480 30 1.480 20
250 1.438 30 1.429 30 1.431 7
002 1.427 s ... 1.423 27 1.423 31 1.421 20 1.423 12
320 1.404 m 1.40 80 1.403 30 1.403 8 1.400 10 1.400 6
061 1.377 s 1.38 10 1.388 30 1.375 60 1.373 20 1.37 31 1.375 30 1.376 16
112 1.338 m 1.34 10 1.353 20 1.340 20 — — 1.339 10 1.340 5
330 1. 32 10 1.333 10 1.333 19 1.328 10 1.329 6
301 1.302 ra 1.308 20 1.303 30 1.299 9 1.303 5 1.304 3
311
170 j1.285 m 1.29 10 — 1.286 30 1.293 8 1.286 13 1.287 5 1.289 6
251
321 1.250 m— —
1.263 20 1.265 20 1.263 5 1.259 6
— — 1.279
1.256
1
4
42

Beta-aluminum oxide mono-hydrate (diaspore), /3-Al20
3•H
20
a—Con.
References
[1] W. C. Hansen and L. T. Brownmiller, Equilibriumstudies on alumina and ferric oxide, and on
combinations of these with magnesia and calcium
oxide, Am. J. Sci. 15, 225-242 (1928).
[2] H. B. Weiser and W. 0. Milligan, X-ray studies
on the hydrous oxides I. Alumina, J. Phys. Chem.
36 , 3010 (1932).
[3] J. A. Kovalev, Debye diffraction diagrams of some
oxide and borate minerals, Materialy TsNIGRI1938. From A. K. Boldyrev and others, Annales
de l’lnstitut des Mines a Leningrad 11 ,( 2 ) ( 1938 )
.
[4] P. F. Kerr, The occurence of andalusite and re-
lated minerals at White Mountain, California,
Econ. Geol. 27, 614-643 (1932).
[5] J. D. Hanawalt, H. W. Rinn, and L. K. Frevel,
Chemical analysis by X-ray diffraction, Ind.
Eng. Chem., Anal. Ed. 10 ,457-512 (1938).
[6 ] H. P. Rooksby, An X-ray examination of the effect
of heat on aluminum hydroxide, AljOj'^O, Trans.
Ceram. Soc. (England) 28, 399-404 (1929).
[7] M. M. Deflandre, Crystal structure of. diaspore,
Bull. soc. franc, mineral. 55 , 140 (1932).
[ 8 ] K. Takarie, Crystal structure of diaspore, Proc.
Imp. Acad. (Tokyo) 9 , 113, (1933).
[9] F. J. Ewing, The crystal structure of diaspore,
J. Chem. Phys. 3 , 203-207 (1935).
tlOj W. Hoppe, The crystal structure of a-AlOOH (dia-
spore) and a-FeOOH (needle iron ore), Z. Krist.
103 ,73-80 (1940).
43

2.5. Multiple Oxides
Strontium titanate, SrTi03
(cubic)
ASTM cards
Card number New
index
lines
Radiation SourceOld New
11-4192 3982 1.04 Copper Hoffmann Ll] 1934=
2-1457 1.59
' 2-1454 2.76
2501 2647 2.76 Molybdenum New Jersey Zinc Co,
1-1023 1.94
1-1018 1.59
2667 2.76 No data..
-
Megaw.
3-0775 0.80
3-0769 1.95
Additional published patterns. None.NBS sample. The strontium titanate sam-
ple used for the NBS pattern was prepared by
the National Lead Co. Spectrographic analy-
sis at the NBS showed the following impuri-
ties: 0.001 to 0.01 percent each of aluminum,
barium, calcium, and silicon; and 0.0001 to
0.001 percent each of copper and magnesium.
The refractive index of the NBS sarrple could not
be determined because the sample was opaque.
Interplanar spacings and intensity meas-
urements. The Hoffmann Bragg angle data were
converted to angstrom units. The New Jersey
Zinc Co. and the Megaw d-spacings were converted
from kX to angstrom units.
The three strongest lines for each of the
patterns are as follows:
Patterns i 2 3
Hoffmann 321 211 110New Jersey Zinc 110 200 211Megaw 110 422 200Swanson and Fuyat 110 200 211
Lattice constant. The structure was de-
termined by Goldschmidt [2] in 1927. The
space group is 0^-Pm3m with pe rovski te- type
structure and l(SrTi03 ) per unit cell.
Hoffmann’s lattice constant was converted
from kX to angstrom units for comparison with
the NBS values.
Lattice constant in angstroms
1935 Hoffmann [l] 3.907
1953 Swanson and Fuyat__ 3.9050 at 25°C
Tie density of strontium titanate calculatedfrom the NBS lattice constant is 5. 116 at 25°C.
Strontium titanate, SrTi03
(cubic)
hkl
1934
Hoffmann
Cu, 1. 5405 A
New Jersey
Mo, 0.709
Zinc
A
Megaw
1953
Swanson and Fuyat
Cu, 1.5405 A, 25°C
d i a d I a d / a d I a
A A A A A A A A
100 3.90 12 3.90
110 2.76 80 3.90 2.77 100 3.92 2.77 100 3.92 2.759 100 3.902
111 2.25 30 3.897 2. 25 10 3.897 2.25 70 3.90 2.253 30 3.902
200 1.951 70 3.902 1.948 30 3.896 1.95 80 3.90 1.952 50 3.904
210 1.744 10 3.900 1.746 3 3.904
211 1. 593 90 3.902 1.592 30 3.900 1.60 80 3.92 1. 594 40 3.904
220 1.378 80 3.898 1.379 23 3.900 1.38 80 3.90 1.381 25 3.906
300 1.302 1 3.906
310 1.232 18 3.896 1.23 70 3.89 1.235 15 3.905
311 1. 176 50 3.900 1. 175 2 3.897 1.18 60 3.91 1.1774 5 3.9050
222 1. 127 50 3.904 1. 124 3 3.894 1.13 60 3.91 1.1273 8 3.9051
321 1.043 100 3.903 1.043 15 3.903 1.04 80 3.89 1.0437 16 3.9052
400 .976 40 3.904 .978 50 3.91 .9765 3 3.9060
411 .920 60 3.903 .922 70 3.91 .9205 10 3.9053
T31 .8959 3 3. 9051
420 .875 80 3.91 .8731 10 3.9046
332 .835 70 3.92 .8325 6 3.9048
422 .799 100 3.91 .7972 9 3.9054
Average value o f last
five lines 3.903 — — 3. 898 — 3.91 3.9050
References[l] A. Hoffmann, Untersuchungen iiber Verbindungen mit
Perowkitstruktur, Z. physik. Chem. 28b, 65(1935).
[2] V. M. Goldschmidt, Geochem. Verteilungses. derElemente. Norske Videnskaps-Akad. Oslo, VII
(1926) and VIII (1927). From Z. Krist. Struktur-bericht I, 333 (1913-1928).
44

Barium titanate, BaTi03
(tetragonal)
ASTM cards
Card number New
index
lines
Radiation SourceOld New
2570 2.83 Copper „ Megaw (pattern unpub-
3-0744 1.63 lished)
.
3-0725 0.82
2571 A continuation of the pre-
3-07 4 5 ceding card.
3-0726
Additional published patterns. None.
NBS sample. The barium titanate used
for the NBS pattern was contributed by
the National Lead Co.,Titanium Division.
Hie sample was annealed at 1,480°C in a mag-
nesium crucible. After this treatment spec-
trographic analysis at the NBS showed the
following impurities: 0.01 to 0.1 percent
each of bismuth and strontium; 0.001 to 0.01
percent each of aluminum, calcium, iron, mag-
nesium, lead, and silicon; and 0.0001 to
0.001 percent each of manganese and tin. The
NBS sample was too finely divided for re-
fractive index measurements.
Interplanar spacings and intensity meas-
urements. The d-spacings of the Megaw pat-
tern were assumed to be in angstrom units.
The three strongest lines for each of the
patterns are as follows:
Patterns 1 2 3
Me gaw, _ 101,110 211 422
Swanson and Fuyat__ _ . 101,110 111 200
Lattice constants. The structure was de-
termined by Evans [1] in 1951. The space
group is C^-P4mm with perovskite-structure
type and l(BaTi03 ) per unit cell. The tet-
ragonal cell inverts to the cubic system at
approximately 120 °C, as reported by Megaw [2]
and many others. A number of investigators
also report changes below room temperature.
All of the unit cell data have been con-
verted from kX to angstrom units and data for
three cells have been converted to 26°C from
the temperatures indicated in parentheses.
The mean linear expansion is 3.5 ±1.5xl0' 6,
the change being positive perpendicular to
the C-axis and negative parallel to it, ac-
cording to Megaw [2].
Lattice constants in angstroms
a c
1945 Rooksby [ 3 ] _ __ 3.9947 4.0277 at 26°C (22°C)
1947 Megaw [2 ] 3.9947 4.0336 at 26°C (20°C)
1947 de Bretteville [4] 4.00 4.041949 Danielson [5 ] . 3.9863 4.0043 at 26°C (25°C)
1953 Swanson and Fuyat_„ 3.994 4.038 at 26 °C
The density of barium titanate calculatedfrom the NBS lattice constants is 6.012 at
26 °C.
Barium titanate, BaTi03
(tetragonal)
hklMegaw
Cu, 1.5405 A
1953
Swanson and Fuyat
Cu, 1.5405 A, 26°C
d I d I
A A
001( 3.99 20
< 4.03 12
100 ) 1 3.99 25
101
j2.83 100
f 2.8381 100
110 l 2.825 i
111 2.31 70 2.314 46
002 2.02 70 2.019 12
200 2.00 80 1.997 37
102 1.80 50 1.802 6
2011 1.79 60 (
1.790 8
210 1 l 1.786 7
112 1.64 70 1.642 15
211 1.63 100 1.634 35
202 1.42 80 1.419 12
220 1.41 70 1.412 10
212) 1.34 50
( 1.337 5
221 ) l 1.332 2
103 1.28 60 1.275 5
301) 1.26 70
|
1.264 7
310 I l 1.263 9
113 1.21 50 1.214 3
311 1.21 60 1.205 5
222 1.16 70 1.1569 7
203 1.12 40 1.1194 <1302 1.11 40 1.1161 1
320 1.11- 40 1.1082 <1
213 1.07 80 1.0746 7
312 1.07 80 1.0703 12
321 1.07 80 1.0679 12
004 1.01 40 1.0093 1
400 .999 50 .9984 2
104 .978 20 .9784 <1223 .974 20 .9742 1
45

Barium titanate, BaTi03
(tetragonal)—Con.
hklMegaw
Cu, 1.5405 A
1953
Swanson and Fuyat
Cu, 1.5405 A, 26°C
d I d I
A A
322 .971 50 .9710 1
401
410 j.969 50 .9686 1
114 .950 60 .9506 3
303 .946 60 .9465 1
411
330 j.942 80 .9419 5
313 .921 60 .920 8 2
331 .917 50 .9166 2
204 .900 70 .9008 3
402 .895 70 .8948 5
420 .893 80 .8929 7
214 .878 50 .8787 2
412 .873 50 .8733 1
421 .872 50 .8720 1
323 .855 80 .8552 7
332 .853 80 .8531 6
224 .821 70 .8211 3
422 .817 100 .8167 4
.807 10
.804 40
.802 40
.799 40
References
[1] H. T. Evans, Jr., The crystal structure of tet-
ragonal barium titanate, Acta Cryst. 4, 377
(1951).
[2] H. D. Megaw, Temperature changes in the crystal
structure of barium titanium oxide, Proc. Roy.
Soc. (London) 189A, 261-283 (1947).
[3] H. P. Rooksby, Compounds of the structural type
of calcium titanate, Nature 155, 484 (1945).
[4] A. P. de Bretteville and S. B. Levin, The lattice
constants of a single crystal of barium titanate,
Am. Mineralogist 32, 686 (1947).
[5] G. C. Danielson, Domain orientation in polycrys-
talline barium titanate, Acta Cryst. 2, 90-93
(1949).
46

2.6. Halides
Sodium bromide, NaBr (cubic)
ASTM cards
Card number New
index
lines
Radiation SourceOld New
3281 3380 2.10 Molybdenum.. Davey [l] 1923.
1-1225 2.98
1-1230 1.79
2197 2228 2.96 Molybdenum.
_
Hanawalt, Rinn, and1-0900 2.09 Frevel [2] 1938.
1-0901 3.44
Additional published patterns. None.
NBS sample. The sodium bromide used for
the NBS pattern was an analytical reagent-
grade sample prepared by the Mallinckrodt
Chemical Works. Spectrographic analysis at
the NBS showed the following impurities:
0.01 to 0.1 percent of potassium, 0.001 to
0.01 percent each of aluminum, calcium, iron,
and molybdenum, 0.0001 to 0.001 percent each
of barium, magnesium, lead, and silicon, and
less than 0.0001 percent of copper. The re-
fractive index of the NBS sample is 1.641.
Interplanar spacings and intensity meas-
urements. Both the Davey and the Hanawalt,
Rinn, and Frevel d-spacings were converted
from kX to angstrom units.
The three strongest lines for each of the
patterns are as follows:
Patterns 1 2 3
Davey 220 200 311
Hanawalt, Rinn, and Frevel 200 220 111
Swanson and Fuyat 200 m 220
Lattice constant. The structure, deter-
mined by Davey [ 1 ] in 1923, is the face-
centered, sodium chloride type, 0^-Fm3m with
4(NaBr) per unit cell.
A group of unit-cell data was converted
from kX to angstrom units for comparison with
the NBS values. The coefficient of expan-
sion according to levins, Straumanis, and
Karlsons is 42.52 x 10~ 6.
Lattice constant in angstroms
1921 Wyckoff [3] 5.96
1923 Davey [l] -- 5.951
1926 Ott [4] 5.974
1938 levins, Straumanis, and Karlsons [5] 5.97324 at 26°C
1942 Batuecas and Fernandez- Alonso [6] 5.984
1949 Nickels, Fineman, and Wallace [?] 5.9737
1953 Swanson and Fuyat 5.9772 at 26°C
The density of sodium bromide calculated
from the NBS lattice constant is 3.200 at
26°C.
Sodium bromide, NaBr (cubic)
hkl
1923
Davey
Mo, 0.709 A
1938
Hanawalt, Rinn,
and Frevel
Mo, 0.709 A
1953
Swanson and
Fuyat
Cu, 1.5405 A, 26°C
d I a d I a d I a
A A A A A A
111 3.46 25 5.99 3.45 45 5.98 3.449 64 5.974
200 2.99 80 5.98 2.97 100 5.94 2.988 100 5.976
220 2.10 100 5.94 2.09 63 5.91 2.113 63 5.976
311 1.795 30 5.953 1.79 20 5.94 1.802 21 5.977
222 1.717 30 5.948 1.71 20 5.92 1.725 19 5.976
400 1.486 10 5.944 1.490 10 5.960 1.495 8 5.980
331 1.366 10 5.954 1.365 5 5.950 1.371 7 5.976
420 1.332 30 5.957 1.332 35 5.957 1.337 15 5.979
422 1.215 20 5.952 1.218 10 5.967 1.221 9 5.982
511 1.147 5 5.960 1.1506 4 5. 9787
440 1.051 5 5.945 1.055 5 5.968 1.0566 2 5.9770
531 1.007 5 5.957 1.0103 2 5.9770
47

Sodium bromide, NaBr (cubic)—Con.
hkl
1923
Davey
Mo, 0.709 A
1938
Hanawalt, Rinn,
and Frevel
Mo, 0.709 A
1953
Swanson and
Fuyat
Cu, 1.5405 A, 26°C
d I a d I a d I a
A A A A A A
600 991 10 5.946 .9963 3 5.9778
620 940 10 5.945 .9451 2 5.9773
533 .9117 <1 5.9784
622 .9012 2 5. 9779
444 .8626 < 1 5. 9763
711 .8370 1 5.9774
640 .8289 1 5.9773
642 .796 5 5.957 .7987 2 5.9769
Average value of last five
5.950 5.960 5.9772
References
E l] W. P. Davey, Precision measurements of crystals of
the alkali halides, Phys. Rev. 21, 143-161 (1923).
[2] J. D. Hanawalt, H. W. Rinn, and L. K. Frevel,
Chemical analysis by X-ray diffraction, Ind. Eng.
Chem.,Anal. Ed. 10, 457-512 (1938).
[3] R. W. G. Wyckoff, The crystal structures of the
alkali halides, J. Wash. Acad. Sci. 11, 429-434
(1921).
[4] H. Ott, Die Strukturen von MnO, MnS, AgF, NiS,
SnJ4 ,
SrCl2 ,
BaF2 ;
Prazisionsmessungen einiger
Alkalihalogenide, Z. Krist. 63, 222-230 (1926).
[5] A. levins, M. Straumanis, and K. Karlsons, Prazi-
sionsbestimmung von Gitterkonstanten hygrosko-
pischer Verbindungen (LiCl, NaBr), Z. physik.
Chem. 40B, 146-150 (1938).
[6] T. Batuecas and J. I. Fernandez-Alonso, Pycnome-
trische Prazisionsmethode fur Fliissigkeiten und
feste Korper. IV Neubestimmung der Dichte von
reinem Kaliumchlorid, Kaliumbromid und Natrium-
bromid bei 0°C, Z. physik. Chem. A190,272-277 (1942).
[7] J. E. Nickels, M. A. Fineman and W. E. Wallace, X-
ray diffraction studies of sodium chloride- sodiumbromide solid solutions, J. Phys. & Colloid Chem.
53, 625-628 (1949).
48

Cesium bromide, CsBr (cubic) Lattice constant in angstroms
ASTM cards
Care number New
index
lines
Radiation SourceOld New
2054 2138 3.03 Davey [l] 1923.
1-0866 1.75
1-0843 2.15
The following ASTM card for body-centered cesium bromide
at 455°C. is also in the file but the ASTM index does not
specify that this is a high temperature form.
3.10 Copper Wagner and Lippert [2 ]
4-0608 1.79 1923.
4-0609 2.19
Additional published patterns. None.
NBS sample. The cesium bromide sample
used for the NBS pattern was prepared at the
NBS by R. B. Johannesen from cesium chlo-
ride. Spectrographic analysis at the NBSshowed the following impurities: 0.001 to
0.01 percent each of calcium, potassium, and
sodium and less than 0.001 percent each of
aluminum, barium, copper, iron, magnesium,
and silicon. The refractive index of the
NBS sample is 1.703.
Interplanar spacings and intensity meas-
urements. The d-spacings for the Davey pat-
tern were converted from kX to angstrom
units.
The three strongest lines for each of the
patterns are as follows:
Patterns 1 2 3
Davey no 211 200
Swanson and Fuyat no 211 321
Lattice constant. The structure was de-
termined by Wyckoff [3] in 1921. Hie simple-
cubic lattice has space group Oi-Pm3m, cesium
chloride-structure type, and l(CsBr) per unit
cell
.
Several unit cell values were converted
from kX to angstrom units for comparison with
the NBS values.
1921 Wyckoff [3 ] _ _ . 4.31
1923 Davey [l] _ 4.297
1936 Wagner and Lippert [2]- 4.296
1953 Swanson and Fuyat _ . 4.2953 at 25°C
The density of cesium bromide calculated
from the NBS lattice constant is 4.456 at
25 °C.
Cesium bromide, CsBr (cubic)
hkl
1922
Davey
Mo, 0.709 A
1953
Swanson and Fuyat
Cu, 1.5405 A, 25°C
d I a d I a
A A A A
100 4.34 1 4.34 4.29 8 4.29
110 3.04 100 4.30 3.039 100 4.298
111 2.42 .75 4.20 2.480 3 4.295
200 2.15 10 4.31 2.148 18 4.296
210 1.929 .75 4.313 1.921 6 4.295
211 1.754 35 4.295 1.754 43 4.296220 1.523 7 4.308 1.519 18 4.296300 1.434 .5 4.302 1.432 3 4.296310 1.359 5 4.297 1.358 16 4.294311 1.295 <1 4.295
222 1.242 1.5 4.304 1.240 6 4.295
320 1.1919 1 4.2975321 1.150 3.5 4.304 1.1482 20 4.2962400 1.075 .75 4.301 1.0741 1 4.2964411 1.013 1.5 4.297 1.0125 9 4.2957
331 .9856 1 4.2961
420 .959 .75 4.289 .9605 5 4.2955332 .916 .75 4.296 .9157 3 4.2950422 .877 .75 4.296 .8768 3 4.2954500 .8590 <1 4.2950
510 .843 1.5 4.297 .8424 9 4 . 29 54
Average of last five
lines. 4.295 4.2953
References
[1] W. P. Davey, Precision measurements of crystals
of the alkali halides, Phys. Rev. 21, 143-161
(1923).
[2] G. Wagner and L. Lippert, Liber polymorphe Umwand-
lung bei einfachen Ionengittern. I. Versuche zur
Umwandlung von CsCl- in NaCl-Gitter durch
Erhitzen, Z. physik. Qiem. B31, 263-274 (1936).
[3] R. W. G. Wyckoff, The crystal structures of the
alkali halides, J. Wash. Acad. Sci. 11 ,429-434
(1921).
49

Cesium dichloroiodide, CsICl2
(hexagonal
)
ASTM cards
Care number New
Old Newindex
lines
Radiation Source
1857 1795 3.16 Molybdenum Hanawalt, Rinn, and
1-0758 4.07 Frevel [l] 1938.
1-07 69 1.71
Additional published patterns. None.
NBS sample. The cesium dichloroiodide
used for the NBS pattern was prepared by
R. B. Johannesen at the NBS. The product
was purified by recrystallization three times
from dilute hydrochloric acid. Spectro-
graphic analysis at the NBS showed the fol-
lowing impurities: 0.001 to 0.01 percent
each of calcium, potassium, and sodium; and
less than 0.001 percent each of aluminum,
barium, copper, iron, magnesium, and silicon.
The refractive indices of the NBS sample are
as follows: co= 1.611 and e= 1.645 with posi-
tive optical sign.
Interplanar spacings and intensity meas-
urements. The Hanawalt d-spacings were con-
verted from kX to angstrom units.
The three strongest lines for each of the
patterns are as follows:
Patterns i 2 3
Hanawalt, Rinn, and Frevel no 102 124
Swanson and Fuyat no 102 014
Lattice constants. The structure was de-
termined by Wyckoff [2] in 1920. The space
group is D| d -R3m with 3 (CsIC12 ) per unit
cell. Cesium dichloroiodide is representa-
tive of the group of similar rhombohedral
compounds that possess a distorted cesium
chloride- type arrangement.
Wyckoff’ s lattice constants have been
converted from kX to angstrom units for com-
parison with the NBS values.
Lattice constants in angstroms
1920 Wyckoff Ma
6.331
c
12.213
1953 Swanson and Fuyat_ 6. 328 12.216 at 26°C
The density of cesium dichloroiodide cal-
culated from the NBS lattice constants is
3.888 at 26 °C.
Cesium dichloroiodide, CsICl2
(hexagonal)
1938 1953
Hanawalt, Rinn and Swanson and
hkl Frevel Fuyat
Mo, 0.709 A Cu, 1. 5405 A, 26°C
d I d I
A A
102 4.08 53 4.081 75110 3.17 100 3.164 100014 2.67 40 2.668 50022 2.51 20 2.499 23204 2.03 27 2.039 25
212 1.96 20 1.961 15300 1.82 20 1.827 15124 1.71 53 1.713 32220 1.58 13 1.582 9132 1.475 13 1.475 6
108 1.471
1.360
7314
306 |
1.360 20 10
042 1.337
1.334
4028 1.334 7 4
231
044 j
1.253 8 1.250 5
322 1.231
1.229
4
218 1.227 8 3
410 1.1958
1.1923
5
0-1*10 1.193 11 4
234 1.163 7 1.1624 3
3252*0*10 ]
1.117 4 1.1169 3
047 1.0775
1.0522
2
2-1*10 1.053 7 4
421 1.032 5 1.0318 4
242] 1.0209 1
333 )
424 .9807
.9705
.9522
.9364
.8777
.8060
1
328 1
3-1-10 2
336 2
520 1
1614
1526 I
References
[1] J. D. Hanawalt, H. W. Rinn, and L. K. Frevel,
Chemical analysis by X-ray diffraction, Ind.
Eng. Chem.,Anal. Ed. 10 ,
457-512 (1938).
[2] R. W. G. Wyckoff, The crystal structure of cesium
dichloroiodide, J. Am. Chem. Soc. 42, 1100-1116
(1920).
50

2.7. Chlorates
Sodium chlorate, INaCl03
(cubic)
ASTM cards
Care number New
Old Newindex
lines
Radiation Source
2227 2296 2.94 Molybdenum Hanawalt, Rinn, and
1-0917 3.28 Frevel [l] 1938.
1-0908 1.76
Additional published patterns
Source Radiation Wavelength
Kolkmeijer, Bijvoet, and Karssen [2]
1921..
Vegard [3] 1922
Copper
Copper
K*i
NBS sample. The sodium chlorate used
for the NBS pattern was procured from the
Fisher Scientific Co. Spectrographic analy-
sis at the NBS showed the following impuri-
ties: 0.001 to 0.01 percent of calcium;
0.0001 to 0.001 percent each of aluminum,
iron, magnesium, and silicon; and less than
0.0001 percent of copper. The refractive in-
dex of the NBS sample is 1.515.
Interplanar spacings and intensity meas-
urements. The d-spacings for the Kolkmeijer,
Bijvoet, and Karssen and the Vegard patterns
were calculated from Bragg angle data while
the d-spacings for the Hanawalt, Rinn, and
Frevel pattern were converted from kX to ang-
strom units.
The three strongest lines for each of the
patterns are as follows:
Patterns 1 2 3
Kolkmeijer, Bijvoet, and Karssen 210 321 200Vegard _ . . 321 210 510Hanawalt, Rinn, and Frevel 210 200 321
Swanson and Fuyat __ 210 200 321
Lattice constant. The structure was de-
termined by Dickinson and Goodhue [4 ] in
1921. The space group is T 4 -P21 3 with
4(NaC103 ) per unit cell. Sodium chlorate is
a prototype for other similar structures.
Several unit cell values have been con-
verted from kX to angstrom units for compari-
son with the NBS values.
Lattice constant in angstroms
1921 Dickinson and Goodhue r 4.1 6.571921 Kolkmeijer, Bijvoet, and Karssen [2] 6.561929 Zachariasen [5] 6.581953 Swanson and Fuyat.. 6.5755 at 25°C
The density of sodium chlorate calculated
from the NBS lattice constant is 2.486 at
25°C.
Sodium chlorate, NaC103
(cubic)
hkl
1921
Kolkmeijer, Bijvoet,
and Karssen
Cu, 1.5405 A Cu,
1922
Vegard
1.54 05 A
1938
Hanawalt, Rinn,
and Frevel
Mo, 0.709 A
1953
Swanson and Fuyat
Cu, 1.5405 A, 25°C
d I a d I a d I a d I a
A A A A A A A A
no 4.77 w 6.75 4.69 10 6.63 4.66 20 6.59 4.65 23 6.58111 3.80 w 6.58 3.86 60 6.69 3.80 33 6.58 3.797 35 6.577200 a 3.255 s 6.510 3.292 60 6.584 3.29 67 6.58 3.289 65 6.578210 2.932 vs 6.556 2.957 70 6.612 2.95 100 6.60 2.941 100 6.576211 2.673 m 6.547 2.695 50 6.601 2.69 40 6.59 2.685 41 6.577
220 2.32 1 6 56 ? ^25 2 6 576221 2.179 m 6.537 2.195 30 6.585 2.18 33 6.54 2.192 26 6.576310 2.066 vw 6.533 2.07 7 6. 55 2.080 6 6 578311 1.975 w 6.550 1.976 30 6.554 1.98 13 6.57 1.983 n 6.577222 1.89 1 6.55 1.898 2 6.575
51

Sodium chlorate, I\aC103
(cubic)—Con.
hkl
1921
Kolkmeijer, Bijvoet,
and Karssen
Cu, 1.5405 A Cu,
1922
Vegard
1.5405 A
1938
Hanawalt, Rinn,
and Frevel
Mo, 0.709 A
1953
Swanson and Fuyat
Cu, 1.5405 A, 25 °C
d 1 a d I a d I a d I a
A A A A A A A A
320 1.816 vw 6.548 1.828 20 6.591 1.83 7 6.60 1.824 7 6.577
321 1.753 vs 6.559 1.759 100 6.582 1.76 67 6.59 1.757 42 6.574
400 1.64 1 6.56 1.644 2 6. 576
410 1.592 w 6.564 1.594 30 6.572 1.59 11 6.56 1.595 10 6.576
411 1.555 10 6.597 1.55 3 6.58 1.550 3 6.576
331 1.505 vw 6.560 1.512 20 6.591 1.51 11 6.58 1.509 7 6.578
420 1.471 10 6.579 1.473 3 6.59 1.470 3 6.574
421 1.435 w 6.576 1.435 30 6.576 1.437 13 6.59 1.435 9 6.576
332 1.407 1 6.60 1.402 2 6.576
422 1.344 1 6.58 1.342 2 6.574
430 1.320 1 6.60 1.315 2 6.575
510 1.287 m 6.562 1.291 70 6.583 1.292 3 6.59 1.2895 14 6.5752
511 1.263 30 6.563 1.267 5 6.58 1.2657 5 6. 5768
520 1.224 30 6.591 1.224 5 6.59 1.2208 4 6.5742
521 1.200 20 6.573 1.202 5 6.58 1.2004 5 6.5749
522 1.142 10 6.560 1.147 3 6.59 1.1445 2 6. 5747
530 1.132 1 6.60 1.1276 2 6.5750
531 1.110 10 6.567 1.116 3 6.60 1.1114 2 6.5751
600 1.096 1 6.58 1.0958 1 6.5748
610 1.0810 1 6. 5755
611 1.068 10 6.584 1.070 3 6.60 1.0666 2 6.5750
620 1.043 10 6.597 1.044 1 6.60 1.0397 2 6.5756
621 1.027 70 6.576 1.030 8 6.60 1.0269 8 6.5754
541 1.0146 4 6.5754
533 1 . 0027 4 6.5751
630 .9803 2 6.5761
631 .9697 1 6.5768
632 .9393 1 6.5751
710 .9299 3 6.5754
711 .9207 1 6.5751
720 .9033 3 6.5761
721 — ,8949 2 6.5761
Average of the last
five lines 6.564 — 6.577 — 6.60 6.5755
“d-spacing 3.553, vw was omitted as it cannot be indexed.
References
[1] J. D. Hanawalt, H. W. Rinn, and L. K. Frevel,
Chemical analysis by X-ray diffraction, Ind.
Eng. Chem., Anal. Ed. 10
,457-512 (1938).
[2] N. H. Kolkmeijer, J. M. Bijvoet, and A. Karssen,
Investigation by means of X-rays of the crystal
structure of sodium chlorate and sodium bromate,
Koninkl. Akad. Wetenschap. Amsterdam 23, 644-653
(1921).
[3] L. Vegard, Die Lage der Atome in den optisch
aktiven Kristallen NaC103 und NaBrOj, Z. Physik
12, 289-303 (1922).
[4] R. G. Dickinson and E. A. Goodhue, The crystal
structures of sodium chlorate and sodium bro-
mate, J. Am. Chem. Soc. 43, 2045-2055 (1921).
[5] W. H. Zachariasen, The crystal structure of so-
dium chlorate, Z. Krist. 71, 517-529 (1929).
52

2.8. Carbonates
Calcium carbonate (aragonite), CaC03
(orthorhombic
)
ASTM cards
Card number New
index
1 ines
Radiation SourceOld New
3106 2.46 Rhodium Bragg [l] 1924.
3-0894 1.23
3-0893 1.86
1506 3.35 Copper, 1.53923.. Olshausen [2 ] 1925.
3-0417 2.70
3-0425 2.36
2357 2.92 Copper Norton [3 ] 1937.
3-0680 1.86
3-0670 1.85
3604 1.97 Iron Allis-Chalmers.
3-1062 3.39
3-1067 3.26
1531 3.39 Copper _ British Museum.
3-0426 1.99
3-0405 2.72
1560 1456 3.40 Molybdenum Hanawalt, Rinn, and
1-0628 1.98 Frevel
.
1-0628 2.70
The Bragg pattern is a single crystal
pattern which accounts for the duplicate
d-spacings and the absence of intensities in
certain cases. The Norton card is mislabeled
calcite.
Additional published patterns. None.
NBS sample. The aragonite used for the
NBS pattern was prepared by H. E. Kissinger
of the NBS. Solutions of potassium carbon-
ate and calcium chloride were heated to boil-
ing and poured quickly together into a third
beaker. The resulting mixture was digested
until precipitation was complete and then
filtered. Spectrographic analysis at the NBSshowed the following impurities: 0.01 to 0.1
percent each of silicon and strontium; 0.001
to 0.01 percent each of aluminum, barium,
copper, iron, magnesium, nickel, and lead;
and 0.0001 to 0.001 percent each of silver,
manganese, and tin. The NBS sample is opti-
cally negative with the following refractive
indices: a= 1.529, /3= 1.680, y was not ob-
tainable due to the acicular crystal form.
Interplanar spacings and intensity meas-
urements. Ihe Bragg, Olshausen, and Norton
data were converted from Bragg angles to
d-spacings in angstroms. The Allis-Chalmers,
British Museum, and Hanawalt, Rinn, and Frevel
d-spacings were converted from kX to angstrom
units. In the Bragg pattern the reflections
of zero intensity listed on the ASTM card
have been dropped and only one of the two
possible intensities given for certain d-spac-
ings is included in the table of patterns.
The 3.06 d-spacing of the Hanawalt, Rinn, and
Frevel pattern is the strong line for cal-
cite.
The three strongest lines for each of the
patterns are as follows:
Patterns 1 2 3
Olshausen in 112
Norton. 002 041 132,230
A1 lis-Chalmers 221 111 021
British Museum., in 221 121
in 221
Swanson and Fuyat in 221 021
The Bragg intensity values for the three
strongest lines were not included in this
table as they represent single crystal data.
Lattice constants. The structure, deter-
mined by Bragg [1] in 1924, is the orthorhom-
bic pseudo-hexagonal potassium nitrate-type
structure with space group D^-Pbnm (Pnma)
and 4(CaC03 ,
aragonite) per unit cell.
Several unit cell values have been con-
verted from kX to angstrom units for compari-
son with the NBS values.
Lattice constants in angstroms
a b c
1924 Bragg [l] 4.95 7.96 5.73
1925 Olshausen [2 ] 4.965 7.977 5.748
1953 Swanson and Fuyat 4.959 7.968 5.741 at 26 °C
The density of aragonite calculated from
the NBS lattice constants is 2.930 at 26°C.
53

Calcium carbonate (aragonite) CaC03
(orthorhombic)
1924 1925 1937 .... .... 1953
Bragg Olshauseni
Norton Allis British Hanawait
,
Rinn, Swanson and
hkl G*a lasers Museum and Frevei Fuyat
Rh, 0.61326 A Cu, 1.5405 A Cu, 1.5405 A Fe. 1.93597 A Cu, 1.5405 A Mo, 0.70926 A Cu, 1.5405 A, 26°C
d I d!
I d I d I d I d I d I
110
A A
4.287 m
A A\
A A A
4.21 2
111
....... .... 3.745
3.348
w
s 3.40 80 3.40 100 3.41 100 3.396 100
021 — — — 3.23 6 3.27 60 .... — 3.30
3.06
48
2
3.273 52
002 2.855 34 2.92 100 3.02 30 2.89 2 2.871 4
121 _ 2.73 10 2.73 80 ______ 2.730 9— — .... 2.693 s .... 2.70
2.58
2.49
20
10
20
.... 2.71 64 2.700 46
200 2.471 Too 2.457 m — 2.51 65 2.50 48 2.481 33
2.39 25 2.39 10 2.409 14
112 2.358 s 2.37 20 2.36 80 2.36 48B 2.372 38
130
022
040
2.328
2.316
60
61
— .... 2.32 40 2.341
2.328
2.188
31
2.192 w 2.20 38 2.19 65 2.19 11 11
220 2.094 63 2.076 W 2.10 20 2.09 65 2.10 24 2.106 23
221 1.980 26 1.982 s 1.97 100 1.99 100 1.98 100 1.977 65
041
202 1.866
)
68
1.881 m 1.86 63 1.88 60 1.88 65 1.88 64 1.882
1.877
32
25
132
2301.801 w 1.83 63 1.81 40 1.83 65 1 . 82 32 1.814 23
141
113
....... .... — .... — .... ----- —
-
1.74 80 1.74 40
1.759
1.742
4
25
231 — 1.728 s — — 1.73
1.72
40
40
— — - - — 1.728 15
222 1.698 3
311
232
241
— .... 1.631
1.551
vw
w 1.59 6 1.55 10 1.56 30
1.63
1.56
1.53
1.50
2
6 1.557
1.535
1.499
4
2
1.49 13 1.49 10 6 4
321 _ _ „ 1.474 w __ ________ ____ 1.473 8 1.475 3
151
1 490 7
— — 1.44 13 1.46 10 ________ 1.466 5
312
330 1.404 w
— .... ....
1.39 30
1.413 8 1.411
1.404
5
3
242
331
114
j
1.363 21 1.354 m .... 1.36 20 1.37 30 1.365 6 1.365
1.358
3
3
060 1.320 19 1.328 2
332 1.26 10 1.266 6 1.261 6
400 1.236 70 1.238 m ____ 1.25 30 1.243 13 1.240 7
134]...... 1.23 20 1.212 6 1.224 5
410
243
062
J
11.204 vw 1.205 6
153 .... .... ________ ____ 1.192 2 1.1892 5
162
260 |
1.164 42 1.163 w 1.17 13 1.17 20 — .... 1.175 8 1.1712 6
421 1.158 4 1.15 20 1.1599 3— .... — .... — —
-
1.132
1.112
5
2
»360 1.047 40 1.034 !m 1.03 20 __________
225 1.007 01
54

Calcium carbonate (aragonite) CaC03(orthorhombic)—Con.
hkl
1924
Bragg
Rh, 0.61326 A
1925
Olshausen
Cu, 1.5405 A
1937
Norton
Cu, 1.5405 A
Allis-
Chalmers
Fe, 1.93597 A
British
Museum
Cu, 1.5405 A
Hanawalt, Rinn,
and Frevel
Mo. 0.70926 A
1953
Swanson and
Fuyat
Cu, 1.5405 A, 26°C
d I d I d I d I d 1 d I d I
450
173
325
381
A
.990
.952
.933
.926
.913
(b
)
9
18
2
6
2
A
.975
.957
.936
.914
.896
vd
w
m
m
m
A
....
A
....
A A A
.... —a This and succeeding indices are taken from Olshausen’s data.b Twelve additional lines are omitted.
References
[l] W. L. Bragg, The structure of aragonite, Proc.
Roy. Soc. (London), 105A, 16-39 (1924).
[2] S. v. Olshausen, Strukturuntersuchungen nach der
Debye-Scherrer-Methode, Z. Krist. 61 ,463-514 (1925).
[3] F. H. Norton, Accelerated weathering of feldspars,
Am. Mineralogist 22, 1-14 (1937).
55

Strontium carbonate (strontianite ),
SrC03 ( orthorhombic
)
ASTM cards
Card number New
index
lines
Radiation SourceOld New
1394 1309 3.53 Molybdenum Hanawalt, Rinn, and
1-0562 2.45 Frevel [l] 1938.
1-0556 2.05
11-893 1377 3.49 Copper British Museum.
2-0405 2.42
2-0397 2.03
II-893a 1378
2-0406 preceding card.
2-0398
The British Museum pattern was made using
a natural mineral specimen from Strontian,
Argyll, Scotland.
Additional published patterns
Sou rce Radiation Wavelength
J. J. Lander [2] 1949 .. Copper 1.5418
NBS sample. The strontium carbonate used
for the NBS pattern was specially purified
material contributed by the Mallinckrodt
Chemical Works. Spec trographic analysis at
the NBS showed the following impurities:
0.01 to 0.1 percent of barium; 0.001 to 0.01
percent each of calcium and lithium; 0.0001
to 0.001 percent each of aluminum, potassium,
manganese and sodium; and less than 0.0001
percent each of copper, iron, magnesium, and
silicon. The refractive indices of the NBSsample are: a =1.517, /3 = 1.663 and y- 1.667
with negative optical sign.
Interplanar spacings and intensity meas-
urements. The d-spacings for the Hanawalt,
Binn, and Frevel and the British Museum pat-
terns were converted from kX to angstrom
units.
The three strongest lines for each of the
patterns are as follows:
Patterns 1 2 3
Hanawalt, Rinn, and Frevel. __ in 130 221
British Museum _ in 130 221Lander. _ _______ 111 021 221Swanson and Fuyat- in 021 221
Four d-spacings of the British Museum
pattern, 6.71, 6.09, 4.83, and 3.11 cannot be
indexed and are probably due to mineral con-
tamination.
Lattice constants. The structure was de-
termined by Wilson [3] in 1928. The space
group is D^-Pmcn (Pnma) with potassium
nitrate-structure type and 4(SrC03 ) per unit
cell. A rhombohedral form of SrC03stable
above 912°C is also known, according to J. J.
Lander [2]
.
The Wilson unit cell data were converted
from kX to angstrom units for comparison with
the NBS values.
Lattice constants in angstroms
Wilson [2] -
a b c
1928 5.128 8.421 6.094
1953 Swanson and Fuyat 5.107 8.414 6.029 at 26°C
The density of strontium carbonate calcu-
lated from the NBS lattice constants is 3.785
at 26°C.
(See table on next page)
References
[1] J. D. Hanawalt, H. W. Rinn, and L. K. Frevel,
Chemical analysis by X-ray diffraction, Ind. Fjig.
Chem.,Anal. Ed. 10 ,
457-512 (1938).
[2] J. J. Lander, Polymorphism in the alkaline earth
carbonates, J. Chem. Phys. 17 ,892-901 (1949).
[3] T. A. Wilson, The lattice constants and the space
groups of BaC03and SrC0
3,Phys. Rev. 31 ,
305
(1928).
56

Strontium carbonate, SrC03
(orthorhombic)
1938 ___ _ 1949 1953
Hanawalt, British Lander Swanson and
Rinn, and Museum Fuyat
hkl Frevel
Mo, 0.709 A Cu, 1.5405 A Cu, 1.5418 A Cu, 1.5405 A,
26°(
d i d I d I d I
A
...
A
6.71
6.09
4.83
4.24
40
40
20
20
A
...
A
...
110
—4.32 3 4.367 14
020 ... 3.87 60 4.18 3 4.207 6
“ 3.90 3
111 3.54 100 3. 50 100 3. 50 100 3.535 100
021 — ... 3.38
3. 11
2.98
60
20
40
3.42 50 3.450 70
002 2.98 20 3.014 22
121 2.82 60 2.859 5
012 _ 2.71 60 2.81 20 2.838 20
102 2. 58 10 2. 596 12
200 2.57 8 2.55 40 2. 54 20 2. 554 23
112 ... — ... 2.46 30 2.481 34
130 2.45 40 2.42 80 2.44 30 2.458 40
022 2.4511 33
211 2.25 40 2.25 5 2.2646 5
220 2.18 8 2. 16 40 2.17 15 2.1831 16
040 — ... 2.09 20 2.090 5 2. 1035 7
221 2.05 40 2.03 80 2.040 50 2.0526 50
041 1.98 8 1.975 60 1.973 30 1.9860 26
202 1.936 60 1.936 30 1.9489 21
132 1.90 16 1.881 70 1.893 40 1.9053 35
141 1.8514 3
113 — — 1.816 30 1.8253 31
Strontium carbonate, SrC03
(orthorhombic )—Con.
hkl
1938
Hanawalt,
Rinn, and
Frevel
Mo, 0.709 A
British
Museum
Cu, 1.5405 A
1949
Lander
Cu, 1.5418 A
1953
Swanson and
Fuyat
Cu, 1.5405 A,
26°C
d I d I d I d I
A A A A
023 1.81 32 1.802 70 1.804 10 1.8134 16
231 1.8023 4
222 ... 1.756 20 1.758 5 1.7685 7
042 — — 1.704 20 1.716 3 1.7253 5
310 1.654 20 1.660 5 1.6684 3
240 ___ 1.617 5 1.6236 4
311 1.603 60 1.602 20 1.6080 13
150 1. 5981 3
241 ... 1.556 60 1. 562 20 1.5676 13
151 1.531 60 1. 537 20 1.5447 11
004 1. 500 3 1.5072 3
223 1.471 40 1.473 8 1.4782 6
312 1.4596 4
330 ... 1.443 50 ... 1.4551 9
242 1.4293 6
114 1.413 60 1.420 10 1.4246 7
152 1.392 20 1.4120 5
060 _ „ _ 1.354 20 1.4024 4
332 ... 1. 305 70 ... 1.3103 10
204 1.2977 4
313 1.278 60 1.2840 13
400 ----- ... (b) ... ... 1.2766 4
a Probably beta line for 111.kTwelve additional lines have been omitted.
57

2.9. Nitrates
Potassium nitrate (niter), KN03
(orthorhombic
)
ASTM cards
Card number New
index
lines
Radiation SourceOld New
1188 1132 3.77 Molybdenum. _ Hanawalt, Rinn, and
1-0497 3.03 Frevel [l] 1938.
1-0493 2.66
The two additional patterns, one by Barth and the other by
Finbak and Hassel, were made at 115°C and represent high
temperature forms.
2910 2.60 Copper. _ _ Barth [2] 1939.
2-0982 1.81
2-0991 2.15
1650 3.25 Copper Finbak and Hassel
3-0474 2.73 1937.
3-0482 2.08
Additional published patterns
Source Radiation Wave length
Edwards [4] 1931..
NBS sample. The potassium nitrate used
for the NBS pattern was obtained from the
Mai linckrodt Chemical Works. Spectrographic
analysis at the NBS showed the following im-
purities: 0.01 to 0.1 percent sodium; 0.001
to 0.01 percent each of aluminum, calcium,
and iron; 0.0001 to 0.001 percent each of
barium, magnesium, lead and silicon; and less
than 0.0001 percent of copper. The refrac-
tive indices of the NBS sample are as fol-
lows: a is too low for the usual liquids
(1.335), /3= 1 . 505, and 7= 1.509.
Interplanar spacings and intensity meas-
urements. The d-spacings for the Edwards
pattern were calculated from Bragg angle data
while the Hanawalt, Rinn, and Frevel d-spac-
ings were converted from kX to angstrom
uni ts
.
The Edwards pattern contains no powder
intensity data, although Edwards did exten-
sive single crystal work on potassium ni-
trate.
The three strongest lines for each of the
patterns are as follows:
Patterns 1 2 3
Hanawalt, Rinn, and Frevel.. 111 012 130
Swanson and Fuya t ... _ ... in 021 012
The literature reference for Edwards’ pat-
tern lists some indices which are not in com-
plete agreement with those assigned to the
corresponding d-spacings of the NBS pattern.
Lattice constants. The structure was de-
termined by Zachariasen [5] in 1928. The
space group is D* ®-Pmcn (Pnma) with 4(KN03 )
per unit cell. Orthorhombic potassium ni-
trate is a prototype for other similar struc-
tures. This form designated KN03II is re-
ported to change at 127. 7 °C to KNO^I, a rhom-
bohedral form, and on cooling below 125 °C to
another rhombohedral form, KNOjIII, all ac-
cording to Kracek, Barth, and Ksanda [6].
Hie two patterns in the card file made at
115 °C by Barth [2] and by Finbak and Hassel
[3] do not agree with either of the high tem-
perature forms described by Kracek, Barth,
and Ksanda.
Two unit cell values have been converted
from kX to angstrom units for comparison with
the NBS values.
Lattice constants in angstroms
1928 Zachariasen [5]
a
5.41
b
9.16
c
6.42
1931 Edwards [4] 5.44 9.19 6.46
1953 Swanson and Fuyat 5.414 9.164 6.431 at 26°C
The density of potassium nitrate calcu-
lated from the NBS lattice constants is
2.104 at 26 °C.
58

Potassium nitrate, KN03
(orthorhombic)
hkl
1931
Edwards
Mo, 0.709 A
1938
Hanawalt, Rinn,
and Frevel
Mo, 0.709 A
1953
Swanson and
Fuyat
Cu, 1.5405 A, 26°C
d I d I d I
A A A
110 4.70 4.67 12 4.66 23
020 4.58 11
111 3.78 3.78 100 3.78 100
021 3.73 56
002 3.215 5
121 3.070 15
012 3.04 3.04 36 3.033 55
102 2.78 2.78 8 2.763 28
200 2.707 17
130 — 2.67 28 2.662 41
112 2.654 2.647 55
022 2.632 20
211 2.419 2.409 7
122 2.367 4
220 2.339 ——
—
— 2.332 9
040 2.292 5
221 2.199 2.19 24 2.192 41
041 2.159 20
202 2.071 13
132 2.063 2.06 8 2.050 18
113 1.941 1.96 12 1.947 24
023 1.942 6
222 1.888 3
042 1.866 2
142 1.763 6
240 1.76 4 1.750 2
150 1.733 1
311 1.707 4
241 1.685 1.688 6
151 — ——
-
1.677 4
321 1.626 1.624 3
014 1.585 3
312 1.557 1.552 2
242 1.54 4 1.536 2
114] 1.519 1.519 6
024 i
Potassium nitrate, KN03
(orthorhombic)—Con.
1931 1938 1953
hkl
Edwards Hanawalt, Rinn,
and Frevel
Swanson and
Fuyat
Mo, 0.709 A Mo, 0.709 A Cu, 1.5405 A, 26 °C
d I d I d I
124
A A A
1.461 1
332 1.399 5
204 1.3 81 5
134 1.376 2
214
313 )
— — 1.368 4 1.365 4
243 •
1.354 8400
153
i
1.350 8
260 1.330 4
References
[1] J. D. Hanawalt, H. W. Hinn, and L. K. Frevel,
Chemical analysis by X-ray diffraction, Ind.
Eng. Chem., Anal. Ed. 10, 457-512 (1938).
[2] F. T. W. Barth, Die Kristallstruktur der Druck-
modifikation des Saltpeters, Z. physik. Chem.
B43, 448-450 (1939).
[3] C. Finbak and 0. Hassel, Kristallchemie der Ni-
trate einwertiger Kationen II, Z. physik. Chem.
B37, 75-80 (1937))
[4] D. A. Edwards, A determination of the complete
crystal structure of potassium nitrate, Z.
Krist. 80, 154-163 (1931).
[5] W. H. Zachariasen, Untersuchungen liber die Kri-
stallstruktur von Sesquioxyden und Verbindungen
ABO3 ,
Skrifter Norske Videnskaps-Akad. Oslo, I.
Mat. Naturv. Kl. 10, 14 (1928).
[6 ] F. C. Kracek, F. T. W. Barth, and C. J. Ksanda,
Molecular rotation in the solid state and the
polymorphic relation of the univalent nitrates,
Phys. Rev. 40, 1034 (1932).
59

2.10. Sulfates and Sulfites
Sodium sulfite, I\a2S0
3(hexagonal)
ASTM cards
Care number New
index
lines
Radiation SourceOld New
1138 3.77 Molybdenum.. Zachariasen and
3-0311 2.72 Buckley [l] 1931.
3-0305 2.58
2565 2695 2.72 Molybdenum.... , _ Hanawalt, Rinn, and
1-1040 2.57 Frevel [ 2] 1938.
1-1039 1.87
The Zachariasen pattern found in the
ASTM file is a combination of single-crystal
d- spacings and powder- intensity data.
Additional published patterns. None.
NBS sample. The sodium sulfite used to
make the NBS pattern was an analytical re-
agent grade sample prepared by the Mallinc-
krodt Chemical Works. Spectrographic analy-
sis at the NBS showed the following impuri-
ties: 0.01 to 0.1 percent of calcium; 0.001
to 0.01 percent each of aluminum, iron, mo-
lybdenum, and strontium; 0.0001 to 0.001 per-
cent each of barium, magnesium, lead, and
silicon; and less than 0.0001 percent of cop-
per. The sample used for the NBS pattern is
optically negative with the following refrac-
tive indices: hj= 1.568 and e- 1.517.
Interplanar spacings and intensity meas-
urements. The Zachariasen and Buckley Bragg
angle data were converted to angstroms and
the Hanawalt, Rinn, and Frevel d-spacings
were converted from kX to angstrom units.
The d-spacings of the Zachariasen and
Buckley single-crystal pattern of nil inten-
sity have been omitted from the table, but
many points, which combined would make a sin-
gle powder diffraction line or which would be
invisible, still remain.
The three strongest lines for each of the
patterns are as follows:
Patterns 1 2 3
Zachariasen and Buckley 101 no 102
Hanawalt, Rinn, and Frevel... 110 102 202
Swanson and Fuyat 102 no 101
Lattice constants. The structure was de-
termined by Zachariasen and Buckley [1] in
1931. The space group is C3i-P3 with 2(Na
2S0
3 )
per unit cell.
The Zachariasen and Buckley unit-cell
measurements were converted from kX to ang-
strom units for comparison with the NBS val-
ues.
Lattice constants in angstroms
—“ ""
a c
1931 Zachariasen and Buckley [ l] 5.452 6. 145
1953 Swanson and Fuyat 5.459 6.160 at 25°C
The density of sodium sulfite calculated
from the NBS lattice constants is 2.633 at
25°C.
Sodium sulfite, Na2SQ (hexagonal)
1931 1938 1953
Zachariasen Hanawalt, Swanson and
hki and Buckley Rinn, and Frevel Fuyat
Mo, C .709 A Mo, 0.709 A Cu, 1.5405 A, 25°C
d I d I d I
A A A
100 4.72 vw 4.72 3 4.73 5
101 3.741 vs 3.73 67 3.75 60
002 3.072 m 3.08 27 3.078 55
no 2.724 vs 2.73 100 2.728 78
102 2.574 vs 2.58 100 2.580 100
111 2.489 m 2.49 20 2.495 11
200 2.361 w 2.35 11 2.364 4
201 2.204 m 2.20(
20 2.207 9
uuo
112 2.038 jvw
1 2.02 3 2.043 2
103 1.8791
( ______ _______ 1.883 <1202 1.870 )
s ' vs(1.87 100 1.876 34
210 1.783 inw 1.78 11 1.788 3
211 1.713 vvw 1.71 1 1.714 1
113 1.637 w 1.63 3 1.641 2
300 1.573 ms\
1.57 40 1.576 12
212
1 • DfrO
1.543 • I 1.54 53 1.546 16
004 1.536 J ( — 1.540 1
104 1.461 m 1.463 17 1.465 15
220 1.362 ms 1.363 27 1.365 6
114 1.338 vvvw 1.342 1
310 1.309 vw 1.311 <1204 1.287 ( 1.291 8
311 1.280 J1.285 13
( 1.283 2
303 1.248 \
222 1.246 jvvw 1.248 1 1.250 1
132 1.204 ms 1.203 20 1.207 11
214 1. 164 f 1.1668 13
401 1.159 )m 1.163 20
t - --
60

Sodium sulfite, Na2S0
3(hexagonal )—Con References
[ 1] W. H. Zachariasen and H. E. Buckley, The crystallattice of anhydrous sodium sulfite, Na
2S0
3 ,
Phys. Rev. 37 , 1295 (1931).
[2] J. D. Hanawalt, H. W. Rinn, and L. K. Frevel,
Chemical analysis by X-ray diffraction, Ind. Eng,
Chem.,Anal. Ed. 10 , 457-512 (1938).
61

Potassium sulfate (arcanite), K2S0
4
(orthorhombic
)
ASTM cards
Card number New
index
lines
Radiation SourceOld New
2298 2417 2.89 Molybdenum, Goeder [l] 1928.1-0954 3.01 0.712.1-0939 2.08
2308 2418 2.88 Molybdenum __ Hanawalt, Rinn, and1-0955 3.00 Frevel [2] 1938.1-0944 2.08
11-1343 2077 3.02 Copper, Ka, Goubeau, Kolb, and2-0628 2.91 1.539. Krall [3] 1938.
2-0626 2.10
2078 3.01 Bredig [4] 1942.3-0599 2.903-0608 2.23
2420 2.88 Copper, Ka._ O’ Daniel and3-0695 2.99 Tscheischwili [5]
3-0695 2.07 1942.
Additional published patterns. None.
NBS sample. The potassium sulfate used
for the NBS pattern was contributed by the
Mallinckrodt Chemical Works. Spectrographic
analysis at the NBS showed the following im-
purities: 0.01 to 0.1 percent of sodium;
0.001 to 0.01 percent of calcium; 0.0001 to
0.001 percent each of aluminum, magnesium,
and silicon; and less than 0.0001 percent
each of silver, barium, copper, and iron.
Hie refractive indices of the NBS sample are
as follows: a= 1.493, /?= 1.495, and y- 1.498,
with 2V of 70° and positive optical sign.
Interplanar spacings and intensity meas-
urements. The d-spacings for the Goeder, the
Goubeau, Kolb, and Krall, and the O’Daniel
and Tscheischwili patterns were calculated
from Bragg angle data, whereas those for the
Hanawalt, Binn, and Frevel and the Bredig
patterns were converted
units
.
The three strongest
patterns are as follows:
From kX to angstrom
Lines for each of the
Patterns 1 2 3
Goeder. _ _ 130 022-112 042
Hanawalt, Rinn, and Frevel 130 022-112 042
Goubeau, Kolb, and Krall 022-112 130 042
Bredig 022-112 130 113-212
O’Daniel and Tscheischwili 130 022-112 032
Swanson and Fuyat 130 022-112 200
Lattice constants. The structure was de-
termined by Ehrenberg and Hermann [6] in
1929. The space group is D^-Pmcn (Pnma)
with 4(K 2S0 4 ) per unit cell. Potassium sul-
fate is a prototype for other similar struc-
tures.
A group of unit cell determinations were
converted from kX to angstrom units for com-
parison with the NBS values.
Lattice constants in angstroms
1916 Ogg and Hopwood [7]
a
5.743
b
10.028
c
7.439
1927 Koch-Holm and
Schonfeldt [8] 5.29 10.27 7.52
1928 Gossner [9] . . 5.86 10.08 7.34
1928 Goeder [l] . 5.783 10.084 7.533
1938 Goubeau, Kolb, and
Krall [3] 5.83 10.05 7.43
1942 Bredig [4] 5.77 10.07 7.48
1953 Swanson and Fuya 5.772 10.072 7.483 at 25°C
The density of potassium sulfate calcu-
lated from the NBS lattice constants is
2.660 at 25°C.
(See table on next page)
62

Potassium sulfate, K SO, (orthorhombic)2 4
1928 1938 1938 1942 1942 1953
Goeder Hanawalt, Rinn, Goubeau,Kolb, Bredig O’Daniel and Swanson and
hkl and Frevel and Krall Tscheischwili Fuyat
Mo, 0 709 A Mo, 0. 709 A Cu, 1. 5405 A Cu, 1. 5405 A Gi. 1.5405 A. 25 °r.
d I d I d I d I d I d I
A A A A A A
020 5.0 2 5.03
4.176
4.160
3.743
8
021 4.19 30 4.20 24 4.19 m 4.12 28
23111 4.23 W
002 3.76 25 3.74 8 3.86 vw 3.76 vw 3.68 w 18
012 3.508 6
121 3.39 5 3.351 vw 3.371 3.384 13
102 3.095 V VW 3.140 9
031 3.062 8
022
112 |
3.00 90 3.01 80 3.028 s 3.02 vs 2.983 ms 3.001 77
130 2.883 100 2.88 100 2.921 s 2.91 vs 2.871 s 2.903 100
200 2.886 53
122 2.676 5 2.67 2 2.682 vvw 2.665 7
211 2.602 2
040 2.513 30 2.51 12 2.522 m 2.520 m 2.518 13
032 2.491 ms 2.499 15
013 2.424 40 2.41 20 2.455 m 2.426 01 2.413 m 2.422 25
041 2.389 w 2.386 13
221 2.370 w 2.374 17
113
|
2.223 40 2.254 m 2.230 s 2.273 vvw 2.230 19212
141 2.21 24 2.201 2.206 14
231 2.101 6
042 2.081 50 2.08 40 2.104 s 2.087 s 2.072 ms 2.089 25
222 2.082 25
033 2.022 5 2.00 5 2.015 w — -— 1.994 w 2.002 7
142 1.964 4
051 1.950 5 1.94 4 1.956 w 1.933 vw 1.945 7
232 1.88 10 1.889 12
004 1.873 m 1.874 mw 1.870 8
213 1.835 30 1.85 4 1.841 w 1.855 6
052 1.765 15 1.76 3 1.771 vw 1.774 5
114 1.743 vw 1.752 4
302 1.715 m 1.711 5
143 1.694 9
124 1.681 30 1.68 10 1.679 mw 1.679 5
330 1.669 1.662 mw 1.669 8
034 1.634 4
331 1.627 vw 1.629 3
251 1.619 20 1.62 4 1.613 vw 1.613 4
134 1.57 6 1.590 m 1.567 m 1.5715 7
214 1.5508 1
062 1.528 25 1.5312 1
252 1.508 5 1.5105 1
341 1.493 5 1.494 vw 1.4977 2
015 1.4807 2
260 1.4513 5
400 1.441
]
30 1.442 10 1 . 4427 8
0251.435 m 1.4332 9
115 I
234 1.421 3 1.4219 10
63
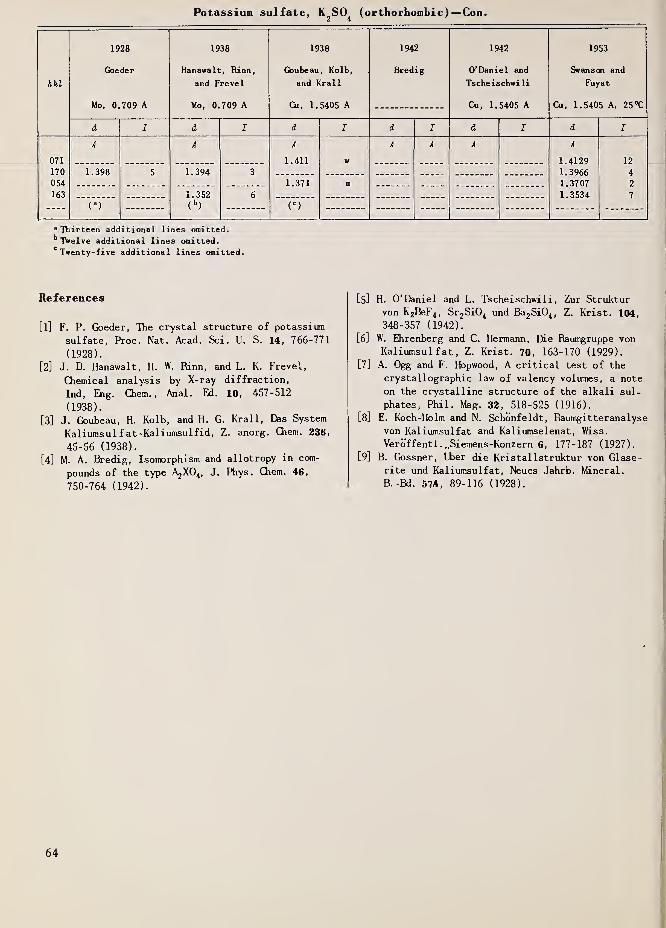
Potassium sulfate, K2S0
4(orthorhombic) —Con.
hkl
1928
Goeder
Mo, 0.709 A
1938
Hanawalt, Rinn,
and Frevel
Mo, 0.709 A
1938
Goubeau, Kolb,
and Krall
Cu, 1.5405 A
1942
Bredig
1942
0’ Daniel and
Tscheischwi li
Cu, 1.5405 A
1953
Swanson and
Fuyat
Cu, 1.5405 A, 25 °C
d I d I d I d I d I d I
071
170
054
163
A A A
1.411 W
A A A A
1.4129
1.3966
1.3707
1.3534
12
4
2
7
1.398 5 1.394 3
1.371 m
1.352
(b
)
6
(a
) (c
)
a Thirteen additional lines omitted.b Twelve additional lines omitted.cTwenty-five additional lines omitted.
References
[1] F. P. Goeder, The crystal structure of potassium
sulfate, Proc. Nat. Acad. Sci. U. S. 14, 766-771
(1928).
[2] J. D. Hanawalt, H. W. Rinn, and L. K. Frevel,
Chemical analysis by X-ray diffraction,
Ind, Eng. Chem.,
Anal. Ed. 10 ,457-512
(1938).
[3] J. Goubeau, H. Kolb, and H. G. Krall, Das System
Kaliumsul f at-Kaliumsulfid, Z. anorg. Chem. 236,
45-56 (1938).
[4] M. A. Bredig, Isomorphism and allotropy in com-
pounds of the type A2X04 ,
J. Phys. Chem. 46,
750-764 (1942).
[ 5] H. O’Daniel and L. Tscheischwili,Zur Struktur
von K 2BeF 4 ,Sr
2Si0
4und Ba
2Si0
4 ,Z. Krist. 104,
348-357 (1942).
[6] W. Ehrenberg and C. Hermann, Die Raumgruppe von
Kaliumsul fat
,
Z. Krist. 70, 163-170 (1929).
[7] A. Ogg and F. Hopwood, A critical test of the
crystallographic law of valency volumes, a note
on the crystalline structure of the alkali sul-
phates, Phil. Mag. 32, 518-525 (1916).
[8] E. Koch-Holm and N. Schonfeldt, Raumgitteranalyse
von Kaliumsul fat and Kaliumselenat, Wiss.
Veroffentl...Siemens-Konzern 6, 177-187 (1927).
[9] B. Gossner, Uber die Kristallstruktur von Glase-
rite und Kaliumsulfat, Neues Jahrb. Mineral.
B.-Bd. 57A, 89-116 (1928).
64

Barium sulfate (barite), BaS04
(orthorhombic
)
ASTM cards
Card number New
index Radiation SourceOld New lines
3277 3377 2.10 Molybdenum.. Hanawalt, Rinn, and
1-1224 3.44 Frevel [l] 1938.
1-1229 3.10
11-2765 3378 2.11 Copper British Museum.
2-1183 3.42
2-1199 3.08
Additional published patterns. None.
NBS sample. The material used for the
NBS pattern was prepared by the Mallinckrodt
Chemical Works. Their spectrographic analy-
sis shows 0.001 to 0.01 percent of iron,
0.0001 to 0.001 percent each of aluminum and
strontium and less than 0.0001 percent each
of calcium, copper and magnesium. The NBS
sample is too finely divided for determina-
tion of the refractive indices.
Interplanar spacings and intensity meas-
urements. The Hanawalt and the British Mu-
seum d-spacings were converted from kX to
angstrom units.
The three strongest lines for each of the
patterns are as follows:
Patterns i 2 3
Hanawalt, Rinn, and Frevel. 113,312 210 211
British Museum 113,312 210 211
Swanson and Fuyat 210 211 113
Lattice constants. The structure was de-
termined by Rinne, Hentschel, and Schiebold
[2] in 1924. The space group is D^-Pnma
with 4(BaS0 4 ) per unit cell.
A group of unit cell values were con-
verted to angstroms for comparison with the
NBS values. The Allison value for the a-
direction was multiplied by two.
Lattice constants in angstroms
1924 Allison [3]..
a
8.916
b
5.459
c
7.18
1924 Rinne, Hentschel, and
Schiebold [2] 8.90 5.46 7.16
1925 Pauling and Emmett [4] 8.864 5.441 7.11
1925 James and Wood [5] 8.87 5.44 7.14
1925 Wyckoff and Merwin [6] 8.916 5.459 7.18
1926 Basche and Mark [7] 8.87 5.46 7.15
1946 Walton and Walden [8] 8.8701 5.4534 7.1507
1953 Swanson and Fuyat 8.878 5.450 7.152 at 26°C
The density of barium sulfate calculated
from the NBS lattice constants is 4.480 at
26 °C.
Barium sulfate (barite), BaS04(orthorhombic)
hkl
1938
Hanawalt, Rinn,
and Frevel
Mo, 0.709 A
Bri tish
Museum
Cu, 1.5405 A
1953
Swanson and
Fuyat
Cu, 1.5405 A, 26°C
d I d I d I
A A A
200 4.44 17
Oil 4.36 20 4.28 40 4.34 36
111 3.90 25 3.83 40 3.90 57
201 3.77 12
002 3.58 10 3.56 40 3.576 31
210 3.45 63 3.43 80 3.442 100
102 3.32 35 3.31 60 3.317 67
211 3.11 63 3.09 80 3.101 97
112 2.84 40 2.85 50 2.834 53
301j
2.734 16
020 j
2.73 45 2.73 50l 2.726 47
212 2.47 15 2.47 20 2.481 14
311 2.444 2
220 2.31 10 2.33 60 2.322 15
103 2.303 6
302 — .2.28 20 2.281 7
221 2.20 15 2.21 40 2.209 27
1131 2.10 100 2.11 100 (
2.120 80
312 J l 2.104 76
410 2.04 10 2.06 40 2.056 23
222 1.947 <1
321 1.92 5 1.93 20 1.930 7
303 1.85 15 1.86 50 1.857 16
004 1.787 3
031 1.760 9
313 1.74 8 1.75 40 1.754 9
131 1.726 5
501 1.723 6
65

Barium sulfate (barite), BaS04
(orthorhombic )—Con.
1938 .. 1953
Hanawalt, Rinn, British Swanson and
hkl and Frevel Museum Fuyat
Mo, 0.709 A Cu, 1.5405 A Cu, 1.5405 A, 26°C
d I d I d I
A A A
230 1.68 50 1.681 7
421 1.67 15 1.673 14
114 1.669 10
231 1.63 8 1.64 40 1.636 8
132 1.594 40 1.593 8
502 1.58 10 ______ 1.590 7
323 1.537 60 1.534 18
512 1.52 25 — — 1.526 11
024 1.495 3
124 1.468 7 1.483 40 1.474 10
521 1.457 3
610
133 )— 1.429 60 1.426 8
503 1.423 20 1.424 16
332 1.421 13
430 1.406 50 1.406 7
611 1.401 10
015 1.384 40 1.384 6
4311.378 5
513 i
040 1.360 40 1.363 6
414 1.349 5
215 — 1.324 40 1.321 6
240
620 )— 1.308 40 1.300 5
523
134 )— 1.268 60 1.262 13
142
504 j1. 258 18 — 1.260 10
1.222 50
1.192 8 1.202 50
1.095 13
1.028 5
References
[1] J. D. Hanawalt, H. W. Rinn, and L. K. Frevel,
Chemical analysis by X-ray diffraction, Ind. Eng.
Chem., Anal. Ed. 10, 457-512 (1938).
[2] F. Rinne, H. Hentschel, and E. Schiebold, Zum
Feinbau von Anhydrit und Schwerspat, Z. Krist.
61, 164-176 (1924).
[3] S. K. Allison, The reflection of X-rays by barite,
Am. J. Sci. 8, 261-276 (1924).
[4] L. Pauling and P. H. Emmett, The crystal structure
of barite, J. Am. Chem. Soc. 47, 1026-1030
(1925).
[5] R. W. James and W. A. Wood, The crystal structure
of baryte, celestine and anglesite, Proc. Roy.
Soc. (London) A109, 598-620 (1925).
[6] R. W. G. Wyckoff and H. E. Merwin, The space group
of barite (BaSO*), Am.__J. Sci. 9, 286-295 (1925).
[7] W. Basche and H. Mark, Uber die Struktur von Ver-
bindungen des Typus MeX04, Z. Krist. 64, 1-70,
(1926).
[8] G. Walton and G. H. Walden, Jr., The nature of the
variable hydration of precipitated barium sul-
fate, J. Am. Chem. Soc. 68, 1750-1753 (1946).
66

Lead sulfate (anglesite), PbS04
(orthorhombic)
ASTM cards
Card number New
Old Newindex
lines
Radiation Source
2117 2119 3.00 Molybdenum Hanawalt, Rinn, and1-0862 2.06 Frevel [l] 1938.1-0867 4.26
.... 3457 2.07 Copper British Museum.3-1006 3.003-1019 4.22
3458 A continuation of the3-1007
3-1020preceding card.
Additional published patterns. None.
NBS sample. The lead sulfate sample
used for the NBS pattern was prepared by the
National Lead Co. Spectrographic analysis at
the NBS showed 0.001 to 0.01 percent each of
bismuth, iron, and silicon, 0.0001 to 0.001
percent each of silver, aluminum, copper, and
magnesium and less than 0.0001 percent of
calcium. Hie refractive indices are too high
to be determined by grain-oil immersion meth-
ods.
Interplanar spacings and intensity meas-
urements. The Hanawalt and British Museum
d-spacings were converted from kX to angstrom
units. The d-spacing 4.69 of the British Mu-
seum pattern is not possible according to the
space group.
The three strongest lines for each of the
patterns are as follows:
Patterns i 2 3
Hanawalt, Rinn, and Frevel 211 122,113 Oil
British Museum 122,113 211 011
Swanson and Fuyat 211 Oil 210
Lattice constants. Hie structure was de-
termined by James and Wood [2] in 1925- Hie
space group is D^jj-Pnma with 4(PbS0 4)per
unit cell.
Data for two unit cells were converted to
angstrom units for comparison with the NBSvalues
.
Lattice constants in angstroms
a b c
1925 James and Wood [2] 8.27 5.39 6.94
1926 Basche and Mark [3] 8.48 5.39 6.96
1953 Swanson and Fuyat 8.480 5.398 6.958 at 25 °C
Hie density of lead sulfate calculated
from the NBS lattice constants is 6.323 at
25 °C.
Lead sulfate (anglesite), PbS04
(orthorhombic)
1938 __ 1953
Hanawalt, Rinn, British Swanson and
hkl and Frevel Museum Fuyat
Mo, 0.7093 A Cu, 1. 5405 A Cu, 1.5405 A, 25°C
d / d I d I
101
A A A
5.381 3
4. 69 25
011 4.27 80 4.23 75 4.26 87
111 3.81 28 3.79 25 3.813 57
201 3.62 8 — 3.622 23
002 3.48 8 3.479 33
210 3.34 60 3.35 75 3.333 86
102 3.22 40 3.21 50 3.220 71
211 3.01 100 3.01 85 3.001 100
112 2.76 32 2.77 25 2.773 35
020 2.69 32 2.70 50 2.699 46
301 2.618 8
212 2.40 12 2.41 50 2.406 17
311 2.355 <1220 2.27 12 2.29 50d 2.276 20
103 2.235 5
302 2.193 7
221 2.16 16 2.16 50 2.164 26
022 2.133 5
122
113 ]2.06 100 2.07 100 2.067 76
312 2.031 34
401 2.02 40 2.01 75 2.028 48
410 1.97 20 1.98 50 1.973 21
222 1.90 4 1.905 3
321 1.87 4 1.88 25 1.879 6
303 1.78 12 1.79 50 1.793 15
031
004 |1.73 6 1.75 25 1.741 8
412 1.716 3
322 1.70 12 1.70 50 1.703 16
230 1.656 7
501 1.65 4 1.65 25 1.648 3
421 1.62 50 1.621 19
231 1.61 20 1.611 10
132 1.57 4 — 1.571 6
214 1. 542 2
502 1. 525 1
67

Lead sulfate (anglesite), PbSO^(orthorhombic)—Con.
1938 ..„ 1953
Hanawalt, Rinn, British Swanson and
hkl and Frevel Museum Fuyat
Mo, 0.7093 A Cu, 1. 5405 A Cu, 1.5405 A, 25°C
d I d I d I
A A A
323 1.493 16 1.49 50 1.493 15
512 1.47 25 1.467 7
124 1.441 8
314 1.43 25 1.429 4
521 1.406 3
133 1.40 25 1.402 7
332 1.391 4
601 1.385 2
105
503 11.37 50 1.371 6
610 1.368 7
233 1.35 50 1.348 4
611 1.341 5— — (a
)
8 This pattern contains thirteen additional lines
References
[1] J. D. Hanawalt, H. W. Rinn, and L. K. Frevel,
Chemical analysis by X-ray diffraction, Ind. Ehg,
Chem., Anal. Ed. 10 ,457-512 (1938).
[2] R. W. James and W. A. Wood, The crystal structureof barytes, celestine and anglesite, Proc. Roy.
Soc. (London) 109A, 598.-620 (1925).
[3] W. Basche and H. Mark, Liber die Struktur von Ver-
bindungen des Typus MeX04 ,
Z. Krist. 64 ,1-70
(1926).
68

2.11. Phosphates
Potassium dihydrogen phosphate,KH
2P0
4(tetragonal)
ASTM cards
Card number New
Old Newindex
lines
Radiation Source
11-2022 2812 2.65 Molybdenum, Hendricks [l] 1927.2-0932 1.96 0.7076.
2-0948 3.76
2669 2813
1-1062 source and pattern as
1-1072 the card above.
1229 1135 3.72 Molybdenum Hanawalt, Rinn, and
1-0499 2.90 Frevel [2 ] 1938.
1-0505 1.95
The second set of Hendricks cards as
listed above gives the same pattern but with
the lattice constants in their proper order
(on the original card C was larger than a).
Additional published patterns
Source Radiation Wavelength
West [hi 1980 Rhodium
NBS sample. Hie monobasic potassium
phosphate used for the NBS pattern was rea-
gent grade material prepared by the Mallinc-
krodt Chemical Works. Spectrographic analy-
sis at the NBS showed the following impuri-
ties: 0.001 to 0.01 percent each of alumi-
num, calcium and iron; 0.0001 to 0.001 per-
cent each of barium, magnesium, lead, sili-
con, and strontium; and less than 0.0001 per-
cent of copper. The NBS sample is uniaxial
negative with <u= 1.511 and e= 1.468.
Interplanar spacings and intensity meas-
urements. The Hanawalt, Binn, and Frevel
Bragg angle data were converted into d-spac-
ings in angstroms. The Hendricks d-spacings
were converted from kX to angstrom units.
The three strongest lines for each of the
patterns are as follows:
Patterns 1 2 3
Hendricks 220 231,132 200
Hanawalt, Rinn, and Frevel.. 200 112 231,132
Swanson and Fuyat 200 112 132
Lattice constants. The structure was de-
termined by West [3] in 1930. The space
group is D^-I42d with 4(KH2P0
4 ) per unit
cell
.
Wests’ unit cell measurements have been
converted from kX to angstrom units for com-
parison with the NBS values.
Lattice constants in angstroms
1930 West [3 ]
a
7.45
c
6.98
1947 Ubbelohde and Woodward [4 I 7.452 6.959 at 20 °C
1953 Swanson and Fuyat 7.448 6.977 at 26°C
The density of potassium dihydrogen phos-
phate calculated from the NBS lattice con-
stants is 2.335 at 26°C.
Potassium dihydrogen phosphate, KH2P0
4
(tetragonal)
1927 1938 1953
Hendricks Hanawalt, Rinn, Swanson and
hkl and Frevel Fuyat
Mo. 0.709 A Mo, 0.709 A Cu, 1.5405 A, 26°C
d I d I d I
A A A
101 5.142 5 5.1 10 5.10 22
200 3.763 80 3.73 100 3.726 100
121 3.01 8 3.008 12
112 2.91 100 2.910 75220 2.650 100B 2.64 16 2.636 23
202 2.54 6 2.547 10
130) 2.358 10 2.34 12 (
2.356 5
301 J l 2.341 10
103 2.212 10 2.22 3 2.220 5
231(1.982 9
132 j
1.966 90B 1.95 40l 1.953 37
213 1.90 2 1.907 4
400 1.863 2
141 1.750 1
303 1.698 <1240 1.672 15 1.66 6 1.667 8
69

Potassium dihydrogen phosphate, KH2P0
4(tetragonal)—Con.
hkl
1927
Hendricks
Mo, 0 709 A
1938
Hanawalt, Rinn,
and Frevel
Mo, 0.709 A
1953
Swanson and
Fuyat
Cu, 1.5405 A, 26°C
d I d I d I
A A A
204] 1.576 40 1.57 8 f
1.580 7
332 I ( 1.569 7
233 1.545 <1242 1.504 <1
224 1.456 I! 1.453 4 1.454 5
152 1.351 20 1.348 6 1.348 8
440 1.316 >1 1.321 2 1.318 3
404 1.273 15 1.273 4 1.273 7
600 1.242 1
244 1.205 30 1.202 6 1.205 5
352 1.1998 2
260 1.179 1.177 2 1.1785 2
602 1.1702 1
116 1.136 1.1348 1
361 — 1.010 2 1 . 0966 <1
136 1.043 1.0424 2
460 1.0333 <1552 1.009 1 . 0087 3
264 .9763 <1732 .9422 <1
References
[1] S. B. Hendricks, The crystal structure of potas-sium dihydrogen phosphate, Am. J. Sci. 14 ,
269-287 (1927).
[2] J. D. Hanawalt, H. W. Rinn, and L. K. Frevel,Chemical analysis by X-ray diffraction, Ind.Eng. Chem.
,Anal. Ed. 10 , 457-512 (1938).
[3] J. West, A quantitative X-ray analysis of thestructure of potassium dihydrogen phosphate, Z.Krist. 74, 306-332 (1930).
[4] A. R. Ubbelohde and I. Woodward, Structure andthermal properties associated with some hydrogenbonds in crystals, Proc. Roy. Soc. (London)A188, 358-371 (1947).
70

2.12. Bromoosmates Ammonium bromoosmate , (NH4 ) 2
0sBr6
(cubic)
Ammonium bromoosmate, (NH4 ) 2
0sBr6
(cubic
)
ASTM cards. None.
Additional published patterns. None.
NBS sample. The ammonium bromoosmate
used for the NBS sample was prepared by R. B.
Johannesen at the NBS. Spectrographic anal-
ysis at the Bureau showed the following im-
purities: 0.01 to 0.1 percent of silicon,
0.001 to 0.01 percent of magnesium, and
0.0001 to 0.001 percent each of copper and
iron. The refractive indices of the NBSsample could not be determined as the sample
was opaque.
Interplanar spacings and intensity meas-
urements. The three strongest lines for the
NBS pattern are as follows!
Patterns 1 2 3
Swanson and Fuyat__ 200 111 400
Lattice constants. No X-ray data appears
to have been published for ammonium bromoos-
mate. From related compounds such as ammoni-
um chloroplatinate the material was found to
be face-centered cubic with a lattice con-
stant of approximately 10 angstroms. The
structure is cubic face-centered with
4 t(NH4 ) 2
0sBr6
] per unit cell and probably
space group 0jj-Fm3m.
Lattice constant in angstroms
1953
—
J
Swanson and Fuyat 10.398 at 25°C
The density of ammonium bromoosmate cal-
culated from the NBS lattice constant is
4.169 at 25°C.
hkl
1953
Swanson and Fuyat
Cu, 1.5405 A, 25°C
d I a
A A
111 6.0 97 10.4
200 5.20 100 10.40
220 3.68 5 10.41
311 3. 135 40 10.398
222 3.002 55 10. 399
400 2.600 83 10,400
331 2.385 12 10.396
420 2.325 51 10.398
422 2.121 <1 10.391
511 2.001 20 10. 398
440 1.838 49 10.397
531 1.756 20 10.389
600 1.733 23 10.398
533 1.585 5 10.394
622 1.567 8 10.394
444 1. 501 12 10.399
711 1.456 10 10.398
640 1.443 8 10.406
642 1.389 <1 10.394
731 1.353 5 10.393
800 1.300 4 10.400
733 1.270 1 10.395
820 1.261 8 10.398
751 1.201 3 10.401
662 1. 1927 3 10.398
840 1.1628 8 10.400
911 1.1414 3 10.399
842 1. 1343 4 10.396
931 1.0900 3 10.398
844 1.0611 5 10.397
933 1.0455 <1 10.403
lO-O’O 1.0397 <1 10.397
951 1.0048 2 10.394
Average of last five lines 10.398
References. None.
71

3. CUMULATIVE INDEXVol
.
Aluminum, A1 I
Aluminum oxide, alpha (corundum), A120
3II
Aluminum oxide mono-hydrate, alpha
(bohmite), A1203
-H20 III
Aluminum oxide monohydrate, beta (dia-
spore), A1203’H
20 III
Ammonium bromide, NH^Br II
Ammonium bromoosmate, (NH4) 2QsBr
6III
Amnonium chloride (sal-anmoniac), NH
4GL I
Antimony, Sb III
Antimony trioxide (senarmontite),Sb
20
3III
Arsenic, As III
Arsenic trioxide (arsenolite),As 203 I
Barium carbonate (witherite), BaC03II
Barium fluoride, BaF2 I
Barium nitrate (nitrobarite),Ba(N0
3 ) 2 I
Barium sulfate (barite), BaS04 III
Barium titanate, BaTi03 III
Beryllium oxide (bromellite),BeO I
Bismuth, Bi III
Cadmium, Gd III
Cadmium oxide, CdO II
Calcium carbonate (aragonite), CaC03
III
Calcium carbonate (calcite), CaC03
II
Calcium fluoride (fluorite), CaF2 I
Calcium hydroxide (portlandite) ,Ca(OH)
2 I
Calcium oxide, CaO I
Carbon (diamond),C II
Cerium (IV) oxide, Ce02
I
Cesium bromide, CsBr.. III
Cesium chloride, CsCl II
Cesium dichloroiodide, CsICl2
III
Copper,Cu I
Copper (II) oxide (tenorite), CuO I
Copper (I) oxide (cuprite), Cu20 II
Gallium, Ga II
Germanium, Ge I
Germanium oxide, Ge02
I
Gold, Au I
Hafnium, Hf III
Indium, In HI
Iodine, I 2III
Lanthanum oxide, La20
3III
Lead, Pb I
Lead bromide, PbBr2
II
Lead carbonate (cerussite), PbC03 II
Lead chloride (cotunnite), PbCl2
II
VOLUMES I, II, AND III
Vol, Page
Lead fluochloride (matlockite),PbFCl I 76
Lead monoxide (litharge), PbO (red) II 30
Lead monoxide (massicot), PbO (yellow) II 32
Lead sulfate (anglesite), PbS04 III 67
Lead sulfide (galena), PbS II 18
Lithium chloride, LiCl I 62
Lithium fluoride, LiF I 61
Magnesium, Mg I 10
Magnesium aluminate (spinel), MgAl204 II 35
Magnesium oxide (periclase), MgQ I 37
Magnesium silicate (forsterite),Mg2
Si04 I 83
Magnesium tungstate, MgW04 I 84
Mercury (II) chloride, HgCl2
I 73
Mercury (I) chloride (calomel), Hg2Cl
2I 72
Mercury (II) iodide, Hgl2
I 74
Mercury (II) oxide (montroydite),H^D III 35
Molybdenum, Mo. I 20
Molybdenum trioxide (molybdite), Mo03
III 30
Nickel, Ni I 13
Nickel (II) oxide (bunsenite), NiO I 47
Palladium, Pd I 21
Platinum, Pt I 31
Potassium bromide, KBr I 66
Potassium chloride (sylvite), KC1 I 65
Potassium cyanide, KCN I 77
Potassium fluoride, KF I 64
Potassium dihydrogen phosphate, KH2P0
4III 69
Potassium iodide, KI I 68
Potassium nitrate (niter), KN03
III 58
Potassium sulfate (arcanite), K2S0
4III 62
Bhenium, Re II 13
Rhodium, Rh III 9
Scandium oxide, Sc20
3III 27
Selenium dioxide (selenolite),Se0
2I 53
Silicon, Si II 6
Silicon dioxide (alpha or low quartz), Si02
III 24
Silicon dioxide (alpha or low cristobal ite),
Si02
I 39
Silicon dioxide (beta or high cristobalite),
Si02
I 42
Silver, Ag I 23
Sodium bromide, NaBr III 47
Sodium chlorate, NaClOj III 51
Sodium chloride (halite), NaCl II 41
Sodium cyanide, cubic, NaCN I 78
Sodium cyanide, orthorhombic, NaCN I 79
Sodium fluoride (villiaumite), NaF I 63
TOPage
11
20
38
41
49
71
59
14
31
6
51
54
70
81
65
45
36
20
10
27
53
51
69
58
43
5
56
49
44
50
15
49
23
9
18
51
33
18
12
16
33
34
47
56
45
72

Vol .
Sodium sulfate ( thenardite) ,Na
2S0
4II
Sodium sulfite, Na2S0
3III
Stannic oxide (cassiterite) , Sn02
I
Strontium carbonate (strontianite) ,SrCOj.. Ill
Strontium nitrate, Sr(NQj)2_ I
Strontium sulfate (celestite), SrS04
II
Strontium titanate, SrTiOj III
Tantalum, Ta_ I
Tellurium, Te I
Thallium (III) oxide, T120
3II
Thorium oxide ( thorianite) ,Th0
2I
Tin, alpha, Sn II
Tin, beta, Sn I
Tin (TV) oxide (cassiterite), Sn02
I
Titanium, Ti - HI
Vol. Page
Titanium dioxide (anatase), Ti02
I 46
Titanium dioxide (rutile), Ti02
I 44
Tungsten, W I 28
Uranium dioxide, U02
II 33
Yttrium oxide, Y20
3III 28
Zinc, Zn I 16
Zinc aluminate (gahnite), ZnAljO^ II 38
Zinc borate, ZnB.O. I 83
Zinc oxide (zincite), ZnO II 25
Zinc pyrosiiicate hydrate (hemimorphite)
,
Zn4(0H)
2Si
20
7*H
20 II 62
Zinc selenide, ZnSe III 23
Zinc sulfide, alpha (wurtzite), ZnS II 14
Zinc sulfide, beta (sphalerite), ZnS II 16
Zirconium, alpha, Zr II 11
73
U.
Page
59
60
54
56
80
61
44
29
26
28
57
12
24
54
1
S. GOVERNMENT PRINTING OFFICE : 1954 O - 298034


PERIODICALS OF THE NATIONAL BUREAU OF STANDARDS
The National Bureau of Standards is engaged in fundamental and applied research in physics, chemistry
mathematics, and engineering. Projects are conducted in thirteen fields: electricity, optics and metrol-
ogy, heat and power, atomic and radiation physics, chemistry, mechanics, organic and fibrous materials,
metallurgy, mineral products, building technology, applied mathematics, electronics, and radio propaga-
tion. The Bureau has custody of the national standards of measurement and conducts research leading
to the improvement of scientific and engineering standards and of techniques and methods of measure-
ment. Testing methods and instruments are developed; physical constants and properties of materials
are determined; and technical processes are investigated.
JOURNAL OF RESEARCH
The Journal presents research papers by authorities in the specialized fields of physics, mathematics,
chemistry, and engineering. Complete details of the work are presented, including laboratory data,
experimental procedures, and theoretical and mathematical analyses. Annual subscription: domestic,
$5.50; foreign, $6.75.
TECHNICAL NEWS BULLETIN
Summaries of current research at the National Bureau of Standards are published each month in the
Technical News Bulletin. The articles are brief, with emphasis on the results of research, chosen on the
basis of their scientific or technologic importance. Lists of all Bureau publications during the preceding
month are given, including Research Papers, Handbooks, Applied Mathematics Series, Building Mate-rials and Structures Reports, Miscellaneous Publications, and Circulars. Each issue contains 12 or moretwo-column pages; illustrated. Annual subscription: domestic, $1.00; foreign, $1.35.
BASIC RADIO PROPAGATION PREDICTIONS
The Predictions provide the information necessary for calculating the best frequencies for communication
between any two points in the world at any time during the given month. The data are important to all
users of long-range radio communications and navigation, including broadcasting, airline, steamship, and
wireless services, as well as to investigators of radio propagation and ionosphere. Each issue, covering a
period of one month, is released three months in advance and contains 16 large pages, including pertinent
charts, drawings, and tables. Annual subscription: domestic, $1.00; foreign, $1.25.
Order all publications from the Superintendent of DocumentsU. S. Government Printing Office, Washington 25, D. C.