Embed Size (px)
Citation preview

Performance Measure:
What is your goal? The
goal should be measurable.
What is your
measurement
instrument or process?
(indicate length of
cycle)
Current Results: What
are your current
results?
Analysis of Results:
What did you learn from
your results?
Action Taken or
Improvement made:
What did you improve or
what is your next step?
Provide a graph or table of
resulting trends (3-5 data
points preferred)
At least 40% of business
graduates will rate their
satisfaction with their college
education as "Excellent".
Annual Graduate Survey Four years of trend data are
reported with the three most
recent years exceeding the
goal.
Scores improved each year
over the four year period.
To further support this positive
trend, the faculty discussed
creating a chapter of Kappa
Beta Delta to increase student
engagement.
See graph immediately below.
Periodic surveys should be made of graduates, transfer institutions, and/or employers of graduates to obtain data on the success of business programs in
preparing students to compete successfully for entry-level positions.
Standard Three: Student- and Stakeholder-Focused Results
Use this format to respond to Criterion 3.8. If you are submitting a self-study for reaffirmation, this is the same table used in your QA report.Student- and stakeholder-focused results examine how well your organization satisfies students and stakeholders key needs and expectations.
Performance measures may include: satisfaction and dissatisfaction of current and past students and key stakeholders, perceived value, loyalty, persistence, or
other aspects of relationship building, end of course surveys, alumni surveys, Internship feedback, etc.
Measurement instrument or processes may include end of course surveys, alumni surveys, Internship feedback, etc.
Each academic unit must demonstrate linkages to business practitioners and organizations, which are current and significant, including an advisory board.
Alumni …
0
0.1
0.2
0.3
0.4
0.5
0.6
0.7
0.8
Excellent Good Fair Poor
Overall Student Satisfaction All Business Students
From LCCC Graduates Survey
May 2010 Grads (n=26)
May 2011 Grads (n=30)
May 2012 Grads (n=16)
May 2013 Grads (n=21)

Performance Measure:
What is your goal? The
goal should be measurable.
What is your
measurement
instrument or process?
(indicate length of
cycle)
Current Results: What
are your current
results?
Analysis of Results:
What did you learn from
your results?
Action Taken or
Improvement made:
What did you improve or
what is your next step?
Provide a graph or table of
resulting trends (3-5 data
points preferred)
Alumni … At least 40% of Business
Department graduates will
complete their programs of
study within 2 years.
Time-to-graduate data over 5-
year period.
Over 5-year period, 47%
finished within 2 years.
Exceeded goal over 5-year
period, but the data show
room to improve.
Enhanced support services for
evening students and for off-
campus students have been
the focus of a current Title III
grant project to improve this
measure college-wide.
See graph immediately below.
13%
34%
24%
11%
6% 9%
3%
0%
5%
10%
15%
20%
25%
30%
35%
40%
0 <
Y ≤
1
1 <
Y ≤
2
2 <
Y ≤
3
3 <
Y ≤
4
4 <
Y ≤
5
5 <
Y ≤
10
Y >
10
Time to Graduate All Business Graduates May 2010 to May 2014
(n=497)
Performance Measure:
What is your goal? The
goal should be measurable.
What is your
measurement
instrument or process?
(indicate length of
cycle)
Current Results: What
are your current
results?
Analysis of Results:
What did you learn from
your results?
Action Taken or
Improvement made:
What did you improve or
what is your next step?
Provide a graph or table of
resulting trends (3-5 data
points preferred)
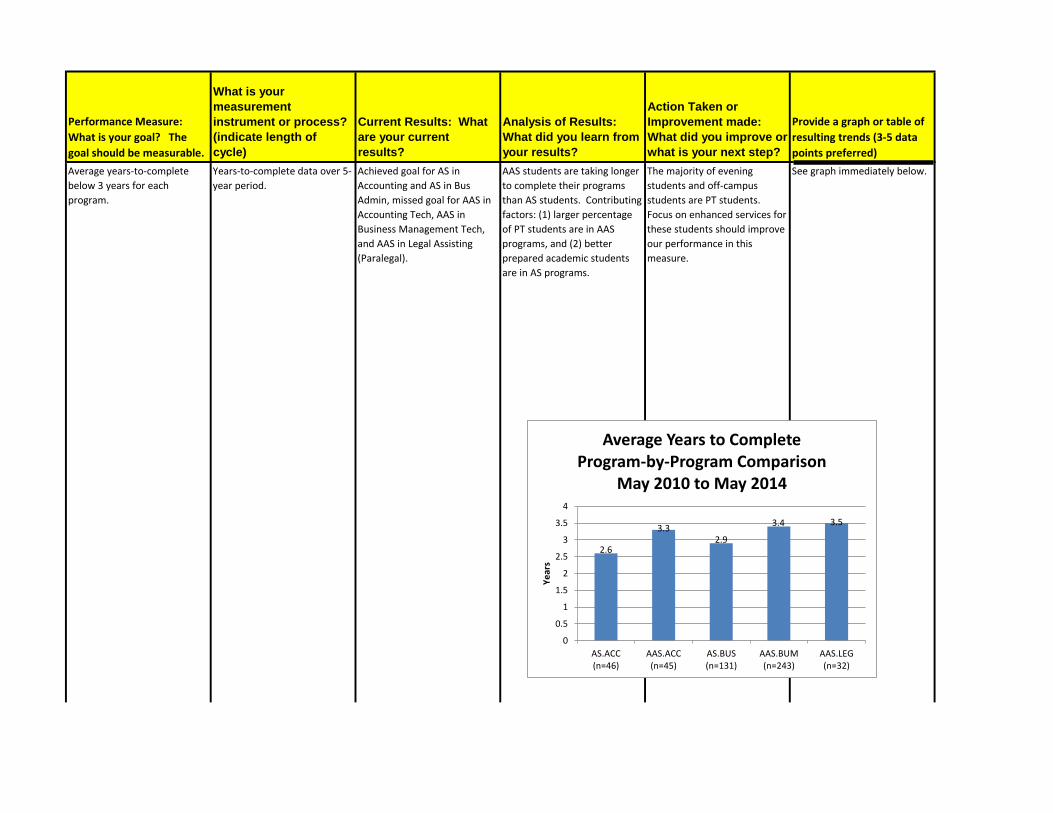
Alumni … Average years-to-complete
below 3 years for each
program.
Years-to-complete data over 5-
year period.
Achieved goal for AS in
Accounting and AS in Bus
Admin, missed goal for AAS in
Accounting Tech, AAS in
Business Management Tech,
and AAS in Legal Assisting
(Paralegal).
AAS students are taking longer
to complete their programs
than AS students. Contributing
factors: (1) larger percentage
of PT students are in AAS
programs, and (2) better
prepared academic students
are in AS programs.
The majority of evening
students and off-campus
students are PT students.
Focus on enhanced services for
these students should improve
our performance in this
measure.
See graph immediately below.
2.6
3.3 2.9
3.4 3.5
0
0.5
1
1.5
2
2.5
3
3.5
4
AS.ACC(n=46)
AAS.ACC(n=45)
AS.BUS(n=131)
AAS.BUM(n=243)
AAS.LEG(n=32)
Ye
ars
Average Years to Complete Program-by-Program Comparison
May 2010 to May 2014

Performance Measure:
What is your goal? The
goal should be measurable.
What is your
measurement
instrument or process?
(indicate length of
cycle)
Current Results: What
are your current
results?
Analysis of Results:
What did you learn from
your results?
Action Taken or
Improvement made:
What did you improve or
what is your next step?
Provide a graph or table of
resulting trends (3-5 data
points preferred)
Alumni … The Fall-to-Spring retention
rates will exceed the college
average of 72% and the Fall-to-
Fall retention rate will exceed
the college average of 49%.
Retention rate of first-time,
degree-seeking students by
academic program.
For the most part, program
retention has been above or
near the college average with
an overall trend of improved
retention in the department's
programs.
The standard method for
measuring retention for
reporting purposes only counts
first-time, degree-seeking
students who start in a Fall
semester. This excludes a
sizable number of our business
students. Not accounted for
are PT students who choose to
take a semester off and then
return, and students who start
in a Spring or Summer
semester.
The department will begin
tracking persistence rates for
each program so that a larger
percentage of business
students are tracked.
See graph immediately below.
0
0.1
0.2
0.3
0.4
0.5
0.6
0.7
0.8
0.9
1
AS.ACC AAS.ACC AS.BUS AAS.BUM AAS.LEG
Fall-to-Spring Retention Rate By Academic Program
First-time, Degree-seeking Students Only
Fall '10 to Spring '11
Fall '11 to Spring '12
Fall '12 to Spring '13
Fall '13 to Spring '14
0
0.1
0.2
0.3
0.4
0.5
0.6
0.7
0.8
0.9
1
AS.ACC AAS.ACC AS.BUS AAS.BUM AAS.LEG
Fall-to-Fall Retention Rate By Academic Program
First-time, Degree-seeking Students Only
Fall '10 to Fall '11
Fall '11 to Fall '12
Fall '12 to Fall '13

Performance Measure:
What is your goal? The
goal should be measurable.
What is your
measurement
instrument or process?
(indicate length of
cycle)
Current Results: What
are your current
results?
Analysis of Results:
What did you learn from
your results?
Action Taken or
Improvement made:
What did you improve or
what is your next step?
Provide a graph or table of
resulting trends (3-5 data
points preferred)
Alumni … Transfer Rate of 60% for
transfer programs and 20% for
terminal programs.
For each program, the percent
of graduates who transferred
to a 4-year institution within 3
years is measured. Five years
of data is reported.
In the most recent year (May
2010 grads), the two AS
programs met the goal and the
three AAS programs were
either right at the goal or
exceeded it.
Transfer rate of AAS in Legal
Assisting program was
surprisingly high given that
there are no 4-year programs
locally in the discipline.
Work on new articulation
agreements for the AS in
Accounting program. In Spring
2014, signed new accounting
agreement with King's College,
now working on agreements
with Penn State for business
administration and accounting.
Once the agreements are in
place, must promote them.
See chart immediately below.
0
0.1
0.2
0.3
0.4
0.5
0.6
0.7
0.8
0.9
1
AS.ACC AAS.ACC AS.BUS AAS.BUM AAS.LEG
Transfer Rate % of Program Graduates Who Transfer to a 4 Year Institution Within 3 Years
May 2006
May 2007
May 2008
May 2009
May 2010

Performance
Indicator
1. Student
Learning Results
Performance
Measure
What is your
measurement instrument
or process?
Current Results Analysis of Results Action Taken or Improvement made Insert Graphs or Tables of Resulting Trends (3-5
data points preferred)
AS in Business
Administration
students will
"communicate a
business issue in
both written and oral
form" by scoring 11
out of 15 points (or 7
out of 10 points) in
each area
measured.
The Marketing Plan
capstone project in BUS-
201 (Principles of
Marketing) is a direct,
summative, internal
assessment. A rubric is
(see evidence file) used to
score students' work.
Students met goal
for most criteria
during most
semesters, but Fall
students performed
better than Spring
& Summer
students.
Students struggled with
understanding the assignment
instructions (e.g.
misunderstanding what an
Executive Summary is). Overall,
the quality of student work varied
fairly significantly (i.e. writing
ability, speaking ability, word
processing & presentation
graphics ability) which is most
likely due to the absence of
prerequisites.
Various iterations of improvements to
the measurement instrument (i.e.
assignment instructions) and the grading
rubric have been applied to clarify
expectations for students. More
importantly, faculty have discussed in
several department meetings the idea of
adding prerequisite requirements to this
course to make it a true capstone
course.
See chart immediately below.
Standard #4 Measurement and Analysis of Student Learning and Performance
Use this table to supply data for Criterion 4.2.
A student learning outcome is one that measures a specific competency attainment. Examples of a direct assessment (evidence) of student learning attainment that might be used include: capstone
performance, third-party examination, faculty-designed examination, professional performance, licensure examination). Add these to the description of the measurement instrument in column two:
Direct - Assessing student performance by examining samples of student work
Indirect - Assessing indicators other than student work such as getting feedback from the student or other persons who may provide relevant information.
Formative – An assessment conducted during the student’s education.
Summative – An assessment conducted at the end of the student’s education.
Internal – An assessment instrument that was developed within the business unit.
External – An assessment instrument that was developed outside the business unit.
Comparative – Compare results between classes, between online and on ground classes, Between professors, between programs, between campuses, or compare to external results such as results
from the U.S. Department of Education Research and Statistics, or results from a vendor providing comparable data.
Definition
Analysis of Results
0
2
4
6
8
10
12
14
16
Exec Sum,Descr, Concl
SituationalAnalysis
MarketingResearch
MarketingStrategy
ProductDesign
Promotion Presentation
Po
ints
Marketing Plan Section
BUS-201 Marketing Plan Assignment AS in Business Administration
PLO: The graduate of this program is able to communicate a business issue in both written and oral form.
Spring 2012 (n=16)
Spring 2013 (n=10)
Fall 2013 (n=30)
Spring 2014 (n=13)
Summer 2014 (n=6)

Performance
Measure
What is your
measurement instrument
or process?
Current Results Analysis of Results Action Taken or Improvement made Insert Graphs or Tables of Resulting Trends (3-5
data points preferred)
Analysis of Results
AAS in Business
Management
Technology
students will
"demonstrate
effective managerial
communications
skills" by scoring 10
out of 15 points (or 7
out of 10 points) in
each area
measured.
The Marketing Plan
capstone project in BUS-
201 (Principles of
Marketing) is a direct,
summative, internal
assessment. A rubric is
used to score the criteria.
Students met goal
for most criteria
during most
semesters, but
these AAS
students performed
more poorly than
the AS students did
on the same
assessment.
Students struggled with
understanding the assignment
instructions (e.g.
misunderstanding what an
Executive Summary is). Like the
AS students, the quality of student
work varied fairly significantly (i.e.
writing ability, speaking ability,
word processing & presentation
graphics ability) which is most
likely due to the absence of
prerequisites.
Various iterations of improvements to
the assessment tool (i.e. assignment
instructions) and the grading rubric have
been applied to clarify expectations for
students (see detailed analysis notes in
evidence file). More importantly, faculty
have discussed in several department
meetings the idea of adding prerequisite
requirements to this course to make it a
true capstone course.
See chart immediately below.
AAS in Business
Management
Technology
students will
"evaluate and
determine solutions
to human resource
management
problems" by
scoring at least
70%.
The business ethics quiz in
BUS-261 (Business Law I)
is a direct, formative,
internal assessment. The
quiz is comprised of 20
questions.
The average
student scores in
Spring 2012, Fall
2012, and Spring
2013 were 81.88%,
75.50%, and
81.25%,
respectively.
Goal was met in each of the
semesters, however, there was a
decrease in student performance
from Spring 2012 to Fall 2012.
Following the Fall 2012 semester (i.e.
following the decrease in performance),
additional lecture material and critical
thinking cases focused on business
ethics were presented in class which
may have contributed to an increase in
performance in Spring 2013. Following
the Spring 2013 assessment, faculty
discussions led to the decision to begin
assessing this PLO in the BUS-251
(Human Resource Management) class
in future semesters.
See chart immediately below.
0
2
4
6
8
10
12
14
16
Exec Sum,Descr, Concl
SituationalAnalysis
MarketingResearch
MarketingStrategy
Product Design Promotion Presentation
Marketing Plan Section
BUS-201 Marketing Plan Assignment AAS in Business Management
PLO: The graduate of this program is able to demonstrate effective managerial communication skills
Spring 2012 (n=9)
Spring 2013 (n=4)
Fall 2013 (n=12)
Spring 2014 (n=15)

Performance
Measure
What is your
measurement instrument
or process?
Current Results Analysis of Results Action Taken or Improvement made Insert Graphs or Tables of Resulting Trends (3-5
data points preferred)
Analysis of Results
AAS in Accounting
Technology
students will
"prepare and
analyze budget
information for a
company" by
scoring 80% in each
area.
A homework assessment in
ACC 213 (Managerial
Accounting) measures
various aspects of budget
and variance analysis. It is
a direct, formative, internal
assessment.
Students met goals
for each area with
two exceptions in
Fall 2012.
This assessment was instituted to
replace a previous test-based
assessment of the same material.
The new homework assessment
required students to apply the
budget analysis principles they
learned in the class and student
performance on the assessment
improved accordingly.
Transitioning from a lecture-test
assessment to a lecture-homework
assessment improved student
performance most likely due to the
learning that resulted from students
applying the knowledge presented in
class.
See chart immediately below.
0
0.1
0.2
0.3
0.4
0.5
0.6
0.7
0.8
0.9
1
Budget Preparation Budget Analysis Material Variances Direct LaborVariances
Overhead Variances ComprehensiveVariance Analysis
ACC-213 Budget Homework Assessment AAS in Accounting Technology
PLO: The graduate of this program is able to prepare and analyze budget information for a company.
Fall 2013 (n=19)
Fall 2012 (n=18)
Fall 2011 (n=13)
Fall 2010 (n=14)
0
0.2
0.4
0.6
0.8
1
Spring 2012 (n=8) Fall 2012 (n=10) Spring 2013 (n=4) Fall 2013 (n=17) Spring 2014 (n=16)
BUS-261 Business Ethics Quiz AAS in Business Management Technology
PLO: The graduate of this program is able to evaluate and determine soutions to human resource
management problems

Performance
Measure
What is your
measurement instrument
or process?
Current Results Analysis of Results Action Taken or Improvement made Insert Graphs or Tables of Resulting Trends (3-5
data points preferred)
Analysis of Results
AS in Accounting
students will
"prepare and
analyze US
Generally Accepted
Accounting Principle
financial
statements" by
scoring at least
90%.
Homework assignment in
ACC-111 (Principles of
Accounting I) is a direct,
formative, internal
assessment requiring
students to prepare
financial statements
including classified balance
sheets.
Student
performance has
been acceptable
throughout the
range of semesters
measured.
This assessment is believed to be
an effective means of measuring
this crucial PLO.
The next step is for other faculty
teaching the course to adopt a standard
assessment instrument such as this so
that a more comprehensive
measurement can be taken. The
accounting faculty have met to plan this
step to be taken in the 2014-2015 school
year.
See chart immediately below.
AAS in Legal
Assisting
(Paralegal)
students will "apply
fundamental legal
concepts and
principles" by
scoring at least 80%
in all areas
measured.
The Internship Supervisor's
Evaluation is an indirect,
summative, external
assessment of 9 areas of a
student's performance.
Results from
Spring 2014 were
very good with the
average student
earning 93% of the
possible points.
In the first 2 years of the 4 years
of trend data, the need for student
performance to improve was
noted by faculty. In the 1st year,
average scores were right at goal
level in 3 of the 9 areas, in the 2nd
year, students peformed
significantly below goal level in 1
of the 9 areas. Student averages
were above goal level in all areas
the last two years.
These data and other information
convinced the department to undergo a
comprehensive review of the curriculum
and to assign an adjunct working as a
corporate attorney to serve as program
coordinator (previously, there was no
program coordinator). Approval of the
revised curriculum was granted in
Spring 2014.
See chart immediately below.
0
0.1
0.2
0.3
0.4
0.5
0.6
0.7
0.8
0.9
1
Fall 2011 Fall 2012 Spring 2013 Summer 2013 Fall 2013
ACC-111 Financial Statement Preparation AS in Accounting
PLO: The graduate of this program is able to prepare and analyze US Generally Accepted Accounting Principle financial statements.

Performance
Measure
What is your
measurement instrument
or process?
Current Results Analysis of Results Action Taken or Improvement made Insert Graphs or Tables of Resulting Trends (3-5
data points preferred)
Analysis of Results
AS in Accounting
students and AAS in
Accounting
Technology
students will
"prepare an
individual United
States Tax Return"
by scoring 90% or
greater.
The Tax Return
Preparation assignment in
ACC-214 (Tax Accounting)
requires students to
prepare an individual tax
return. This is a capstone
course for both the AS in
Accounting students and
the AAS in Accounting
Technology students.
In the most recent
semester (Fall
2013), the AS
students averaged
96.8% and the AAS
students averaged
92.6%.
Current level of student
performance is very good. In Fall
2012, however, performance
dipped to 76.3% for the AS
students and 80.9% for the AAS
students. This was disappointing
but was thought to be unique to
that particular cohort who were
not as strong academically as
most second year accounting
cohorts.
Student performance in Years 1 & 3
were very good. Faculty will observe
whether the Fall 2012 performance was
anomoly by observing the future trend
data. Corrective action does not appear
necessary.
See chart immediately below.
0
1
2
3
4
5
6
Maturity Initiative Flexibility Responsible Adherenceto Rules,
Regs
Ability toCoop
w/Others
Ability toWork
w/Clients
Ability toCoord
w/Others
Willing toSeek Help,
AdviceP
oin
ts
LAP-299 Internship Supervisor Evaluations AAS in Legal Assisting (Paralegal)
PLO: The graduate of this program is able to apply fundamental legal concepts and principles.
Fall 2011 (n=3)
Spring 2012 (n=7)
Spring 2013 (n=4)
Spring 2014 (n=8)
0
0.1
0.2
0.3
0.4
0.5
0.6
0.7
0.8
0.9
1
Fall 2011 Fall 2012 Fall 2013
ACC-214 Tax Return Preparation Assignment AS in Accounting & AAS in Accounting Technology
PLO: The graduate of this program is able to prepare a United States Tax Return.
AS.ACC
AAS.ACC
Faculty and
Staff Focused
Results
Performance
Measure
What is your
measurement
instrument or
process?
Current Results Analysis of Results Action Taken or
Improvement made
Insert Graphs or
Tables of
Resulting Trends
Measurable goal (Indicate length of
cycle)
What are your
current results?
What did you learn from the
results?
What did you improve or
what is your next step?
(3-5 data points
preferred)
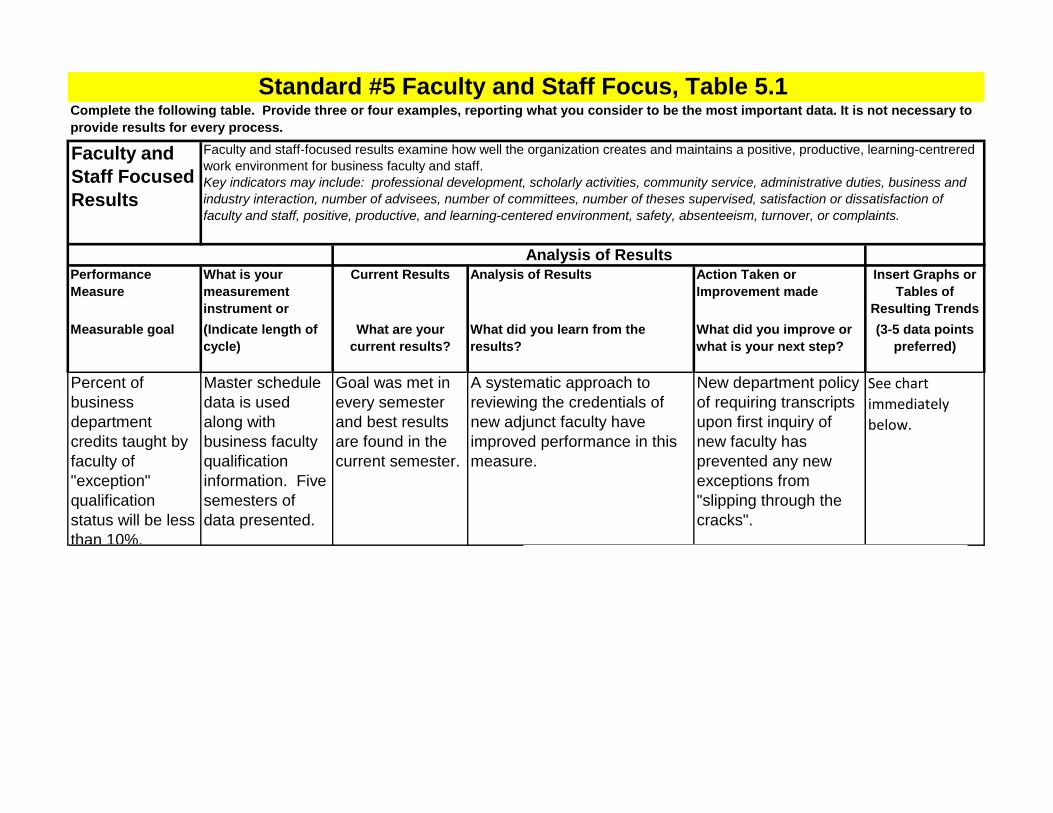
Percent of
business
department
credits taught by
faculty of
"exception"
qualification
status will be less
than 10%.
Master schedule
data is used
along with
business faculty
qualification
information. Five
semesters of
data presented.
Goal was met in
every semester
and best results
are found in the
current semester.
A systematic approach to
reviewing the credentials of
new adjunct faculty have
improved performance in this
measure.
New department policy
of requiring transcripts
upon first inquiry of
new faculty has
prevented any new
exceptions from
"slipping through the
cracks".
See chart
immediately
below.
Standard #5 Faculty and Staff Focus, Table 5.1 Complete the following table. Provide three or four examples, reporting what you consider to be the most important data. It is not necessary to
provide results for every process.
Faculty and staff-focused results examine how well the organization creates and maintains a positive, productive, learning-centrered
work environment for business faculty and staff.
Key indicators may include: professional development, scholarly activities, community service, administrative duties, business and
industry interaction, number of advisees, number of committees, number of theses supervised, satisfaction or dissatisfaction of
faculty and staff, positive, productive, and learning-centered environment, safety, absenteeism, turnover, or complaints.
Analysis of Results

Performance
Measure
What is your
measurement
instrument or
process?
Current Results Analysis of Results Action Taken or
Improvement made
Insert Graphs or
Tables of
Resulting Trends
Measurable goal (Indicate length of
cycle)
What are your
current results?
What did you learn from the
results?
What did you improve or
what is your next step?
(3-5 data points
preferred)
Analysis of Results
2.75%
1.30%
2.75%
5.36%
1.36%
0.00%
1.00%
2.00%
3.00%
4.00%
5.00%
6.00%
Fall 2012(218 Cr.)
Spring 2013(230 Cr.)
Fall 2013(218 Cr.)
Spring 2014(224 Cr.)
Fall 2014(221 Cr.)
% of Credits Taught by Faculty w/ "Exception" Qualification Status

Performance
Measure
What is your
measurement
instrument or
process?
Current Results Analysis of Results Action Taken or
Improvement made
Insert Graphs or
Tables of
Resulting Trends
Measurable goal (Indicate length of
cycle)
What are your
current results?
What did you learn from the
results?
What did you improve or
what is your next step?
(3-5 data points
preferred)
Analysis of Results
Class size for
business sections
less than 20
students.
Average number of
occupied seats for
business sections for
the past 9
semesters.
In most recent
semester (Fall 2014),
average of 19.29
students in business
courses.
This measure helps us to balance the
need to minimuze instructional costs
(high seat count) while maintaining a
learning environment that is
conducive to high academic quality
(low seat count). Trend illustrates
that seat count always declines Fall
to Spring. Overall, seat count has
gone down over the period which
should be expected if offering
approximately the same number of
sections while enrollment drops.
Continue to monitor seat
counts so that the proper
balance can be maintained.
See chart
immediately
below.
19.94
19.3 19.66
18.08
19.49
18.73
19.72
17.57
19.29
16
17
18
19
20
21
Fall 2010 Spring 2011 Fall 2011 Spring 2012 Fall 2012 Spring 2013 Fall 2013 Spring 2014 Fall 2014
Average Seat Count Business Department Sections
By Semester
Performance
Measure
What is your
measurement
instrument or
process?
Current Results Analysis of Results Action Taken or
Improvement made
Insert Graphs or
Tables of
Resulting Trends
Measurable goal (Indicate length of
cycle)
What are your
current results?
What did you learn from the
results?
What did you improve or
what is your next step?
(3-5 data points
preferred)
Analysis of Results
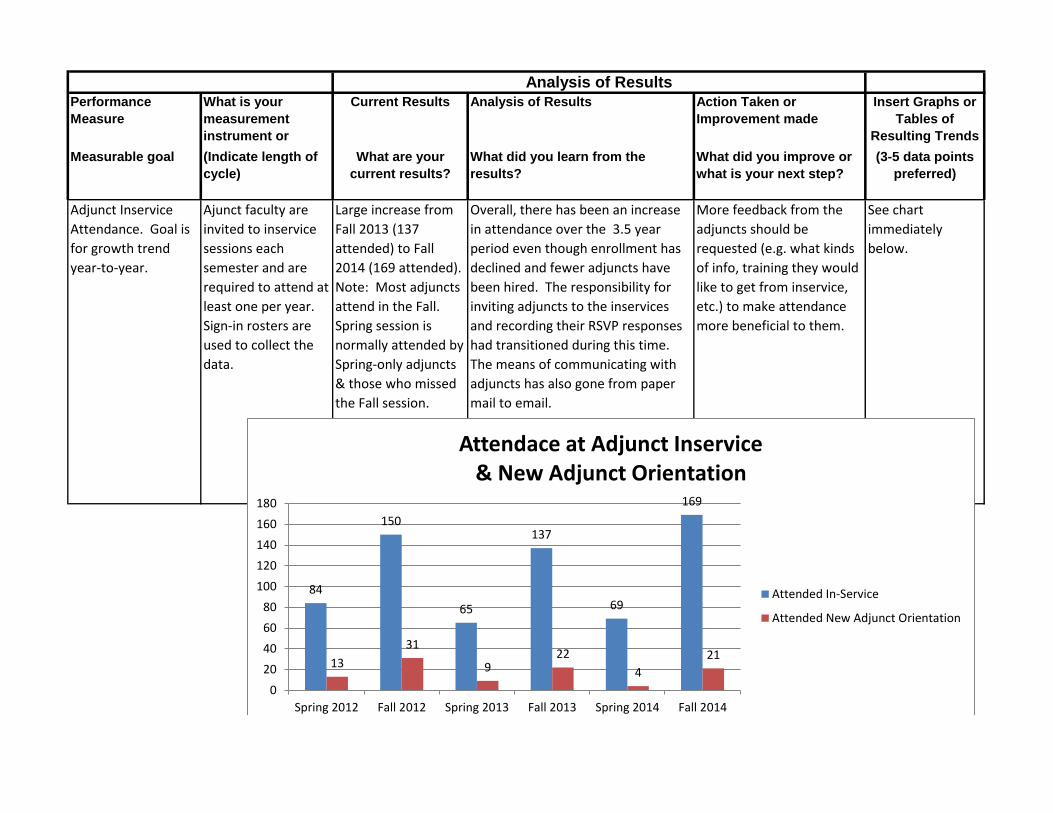
Adjunct Inservice
Attendance. Goal is
for growth trend
year-to-year.
Ajunct faculty are
invited to inservice
sessions each
semester and are
required to attend at
least one per year.
Sign-in rosters are
used to collect the
data.
Large increase from
Fall 2013 (137
attended) to Fall
2014 (169 attended).
Note: Most adjuncts
attend in the Fall.
Spring session is
normally attended by
Spring-only adjuncts
& those who missed
the Fall session.
Overall, there has been an increase
in attendance over the 3.5 year
period even though enrollment has
declined and fewer adjuncts have
been hired. The responsibility for
inviting adjuncts to the inservices
and recording their RSVP responses
had transitioned during this time.
The means of communicating with
adjuncts has also gone from paper
mail to email.
More feedback from the
adjuncts should be
requested (e.g. what kinds
of info, training they would
like to get from inservice,
etc.) to make attendance
more beneficial to them.
See chart
immediately
below.
84
150
65
137
69
169
13
31
9 22
4
21
0
20
40
60
80
100
120
140
160
180
Spring 2012 Fall 2012 Spring 2013 Fall 2013 Spring 2014 Fall 2014
Attendace at Adjunct Inservice & New Adjunct Orientation
Attended In-Service
Attended New Adjunct Orientation

Faculty Member
Name
(alphabetically
by Last Name)
Courses Taught (List the
courses Taught during
the reporting period,
include number of credit
hours)
LIST ALL EARNED DEGREES (State
Degree as Documented on
Transcript, must include Major
Field)
DOCUMENT AT
LEAST TWO OTHER
PROFESSIONAL
CERTIFICATION
CRITERIA :
Two Years Work
Experience
Teaching Excellence
Professional
Certifications
Research and/or
Publication
ACBSP
QUALIFICATION
1. Masters
2. Doctorate
3. Professional
4. Exception
Angle, Maura BUS-201 (Principles of
Marketing) - 3 Credit Hours
M.S. in Classroom Technology - Wilkes
University (2008)
Master's Out-of-Field
with 18 Credit Hrs
B.S. in Business Education - Wilkes College
(1981)
Davis, Sheila
Malahowski
BUS-203 (Salesmanship) - 3
Credit Hours
M.B.A. in Business Administration - Wilkes
University (2002)
Master's In-field
B.S. in Business Administration - College
Misericordia (1984)
Table 5.2 - NEW AND FULL-TIME AND PART-TIME FACULTY QUALIFICATIONS
Standard Five: Faculty and Staff Focus - TABLE 5.2
Complete Table 5.2 for new full-time and part-time faculty members since last self-study or QA report. Do not
include faculty members previously reported, in accordance with Criterion 5.2 in the Standards and Criteria.
Use a separateline in the table for each level of qualification. For example, if Joe Smith is Masters qualified to teach management and
professionally qualified to teach accounting then Joe Smith will be on two lines justifying each level of qualification.

Faculty Member
Name
(alphabetically
by Last Name)
Courses Taught (List the
courses Taught during
the reporting period,
include number of credit
hours)
LIST ALL EARNED DEGREES (State
Degree as Documented on
Transcript, must include Major
Field)
DOCUMENT AT
LEAST TWO OTHER
PROFESSIONAL
CERTIFICATION
CRITERIA :
Two Years Work
Experience
Teaching Excellence
Professional
Certifications
Research and/or
Publication
ACBSP
QUALIFICATION
1. Masters
2. Doctorate
3. Professional
4. Exception
Table 5.2 - NEW AND FULL-TIME AND PART-TIME FACULTY QUALIFICATIONS
Legath, Robert BUS-231 (Principles of
Management) - 3 Credit Hours
M.S. in Management Science - Marywood
University (1993)
Master's Out-of-field
with 18 Credit Hrs
BUS-251 (Human Resources
Management) - 3 Credit Hours
B.S. in Electrical Engineering Technology -
Penn State Univ (1984)
A.S. in Business Administration - Luzerne
County Comm Coll (1994)
Mettler, William BUS-203 (Salesmanship) - 3
Credit Hours
M.B.A. in Business Administration -
Bloomsburg University (1995)
Master's In-field
BUS-241 (Human Resources
Management) - 3 Credit Hours
B.S. in Business Administration -
Bloomsburg University (1989)
Moran, Michael BUS-209 (Business
Communications) - 6 Credit
M.S. in Instructional Technology -
Bloomsburg University (2006)
Master's Out-of-field
with 18 Credit Hrs
B.A. in Communications - King's College
Pealer, Deanna BUS-261 (Business Law I) - 3
Credit Hours
J.D. in Law - Dickinson School of Law
(1997)
Doctorate In-field
B.A. in Political Science - Mansfield State
College (1974)

Faculty Member
Name
(alphabetically
by Last Name)
Courses Taught (List the
courses Taught during
the reporting period,
include number of credit
hours)
LIST ALL EARNED DEGREES (State
Degree as Documented on
Transcript, must include Major
Field)
DOCUMENT AT
LEAST TWO OTHER
PROFESSIONAL
CERTIFICATION
CRITERIA :
Two Years Work
Experience
Teaching Excellence
Professional
Certifications
Research and/or
Publication
ACBSP
QUALIFICATION
1. Masters
2. Doctorate
3. Professional
4. Exception
Table 5.2 - NEW AND FULL-TIME AND PART-TIME FACULTY QUALIFICATIONS
Pindar,Marianne BUS-201 (Principles of
Marketing) - 6 Credit Hours
M.B.A. in Business Administration - Wilkes
University (1987)
Master's In-field
B.A. in Criminal Justice - King's College
(1981)
A.A. in Sociology - Penn State University
(1979)
Rajagopal, Padmini ACC-111 (Principles of
Accounting I) - 3 Credit Hours
M.B.A. in Business Administration - Wilkes
University (1989)
Master's In-field
ACC-112 (Principles of
Accounting II) - 3 Credit Hours
B.S. in Hotel, Restaurant, & Institutional
Mgt - Penn State U (1986)
ACC-215 (Cost Accounting) - 3
Credit Hours
A.A.S. in Hotel & Restaurant Mgt - Luzerne
County Comm Coll (1984)

Table 6.1 Standard 6 - Organizational Performance Results
Organizational
Effectiveness Results
Performance Measure What is your
measurement instrument
or process?
Current Results Analysis of Results Action Taken or
Improvement made
Insert Graphs or Tables of Resulting Trends (3-5
data points preferred)
What is your goal? (Indicate length of cycle) What are your current
results?
What did you learn from
the results?
What did you improve or
what is your next step?
Percentage of credits taught by
FT faculty each semester and
percentage taught by PT faculty.
Goal is for greater than 50% of
credits to be taught by FT faculty.
Data retrieved from master
schedule for each semester for
the past 5 semesters.
In current semester (Fall 2014),
FT faculty usage is 59.3%.
Exceeded the goal each of the
last 5 semesters and now
approaching 60% FT faculty
usage.
Decrease in the second year
(2013-2014) due to retiring
faculty member's replacement
who was not able to teach as
much overload credits as his
predecessor in his first year.
New instructor is now teaching
more overload credits and this
has increased the FT %.
See chart immediately below.
Standard #6 - Organizational Performance Results, Table 6.1
Complete the following table. Provide three or four examples, reporting what you consider to be the most important data. It is not necessary to provide results for every process.
Organizational effectiveness results examine attainment of organizational goals. Each business unit must have a systematic reporting mechanism for each business program that charts
enrollment patterns, student retention, student academic success, and other characteristics reflecting students' performance.
Key indicators may include: graduation rates, enrollment, improvement in safety, hiring equity, increased use of web-based technologies, use of facilities by community organizations,
contributions to the community, or partnerships, retention rates by program, and what you report to governing boards and administrative units.
Analysis of Results
60.1%
55.2% 57.3%
52.7%
59.3%
39.9%
44.8% 42.7%
47.3%
40.7%
0.0%
10.0%
20.0%
30.0%
40.0%
50.0%
60.0%
70.0%
Fall 2012(218 Cr.)
Spring 2013(230 Cr.)
Fall 2013(218 Cr.)
Spring 2014(224 Cr.)
Fall 2014(221 Cr.)
FT Faculty Usage Vs. PT Faculty Usage Percent of Credits Taught by Semester
FT %
PT %

Performance Measure What is your
measurement instrument
or process?
Current Results Analysis of Results Action Taken or
Improvement made
Insert Graphs or Tables of Resulting Trends (3-5
data points preferred)
What is your goal? (Indicate length of cycle) What are your current
results?
What did you learn from
the results?
What did you improve or
what is your next step?
Analysis of Results
Enrollment per program
measured in full-time equivalent
(FTE) students. Goal is for a
growth trend to be present for
each program.
Enrollment data per program
over 5-year period.
Enrollment growth achieved for
AS in Accounting program. AS in
Business Administration declined
over the period. The other 3
programs remained
approximately level.
The increased enrollment in the
AS in Accounting program is
encouraging. The drop in
enrollment in the AS in Bus
Admin program is concerning.
Overall, Business Department
enrollment dropped 8.7% over
the period, however, the college
experienced a larger enrollment
drop of 12.8% over the 5-year
period.
The department has very good
articulation agreements for the
AS in Business Administration
program (i.e. better than those
for AS in Accounting). Doing a
better job of
promoting/advertising these
agreements might help to boost
enrollment in the AS in Bus
Admin program.
See chart immediately below.
0
20
40
60
80
100
120
140
160
180
AS.ACC AAS.ACC AS.BUS AAS.BUM AAS.LEG
Program Enrollment Full-time Equivalent (FTE) Students
2009-2010
2010-2011
2011-2012
2012-2013
2013-2014

Performance Measure What is your
measurement instrument
or process?
Current Results Analysis of Results Action Taken or
Improvement made
Insert Graphs or Tables of Resulting Trends (3-5
data points preferred)
What is your goal? (Indicate length of cycle) What are your current
results?
What did you learn from
the results?
What did you improve or
what is your next step?
Analysis of Results
Number of occupied seats in all
online business sections. Goal is
to maintain a growth trend and
track how full online sections are
each semester.
Master schedule data for online
sections collected over 5
semesters.
Currently delivering more online
education to business students
than ever before and sections
are fuller than ever before.
Student demand for online
business courses continues to
grow. So far, faculty have been
able to accommodate the
demand, however, FT faculty are
at or near their overload limits.
If demand for online instruction
continues to grow, the
department will either need to
add an additional FT faculty
member, or consider training PT
faculty to teach online.
See charts immediately below.
431 433 456
414
525
0
100
200
300
400
500
600
Fall 2012(218 Cr.)
Spring 2013(230 Cr.)
Fall 2013(218 Cr.)
Spring 2014(224 Cr.)
Fall 2014(221 Cr.)
Occupied Seats in Online Business Sections
74.83%
82.01% 79.17% 82.14% 84.13%
0.00%
10.00%
20.00%
30.00%
40.00%
50.00%
60.00%
70.00%
80.00%
90.00%
100.00%
Fall 2012(218 Cr.)
Spring 2013(230 Cr.)
Fall 2013(218 Cr.)
Spring 2014(224 Cr.)
Fall 2014(221 Cr.)
% Seats Occupied in Online Business Sections

Name of Major/Program: AAS in Legal Assisting (Paralegal)
Total Number of Hours in Degree: 62
Course Number Course Title Area of Study Credit Hours
ACC 111 Principles of Accounting I A 3
BUS 261 Business Law I E 3
CIS 110 Computer Literacy & Applications B 3
LAP 203 Corporate Law E 3
OMT 154Office Procedures I I 3
RET 107 Real Estate Law E 3
Total Credit Hours 18
Percent of Total Hours 29%
Course Number Course Title Educational Goal Credit Hours
ENG 101 English Composition 1 3
SPE 125 Fundamentals of Speech 1 3
FYE 101 First Year Experience 1, 3, 4, 8 1
Humanities Elective 3 3
Science Elective 6 3
Social Science Elective 8 3
Mathematics Elective 6 3
Health & Physical Education 6 1
Total Credit Hours 20
Percent of Total Hours 32%
Course Number Course Title Credit Hours
LAP 100 Introduction to Paralegal Studies 3
LAP 250 Legal Research and Writing 3
LAP 201 Tort and Criminal Law 3
LAP 202 Estate Law 3
LAP 204 Bankruptcy Law 3
LAP 205 Family Law 3
LAP 206 Civil Litigation 3
LAP 279 Legal Assisting Internship 3
Total Credit Hours 24
Percent of Total Hours 39%
Table 6 - Curriculum Summary
Professional Component
General Education Component
Business Major Component