Embed Size (px)
Citation preview
Fig
htin
g H
unge
r W
orld
wid
e
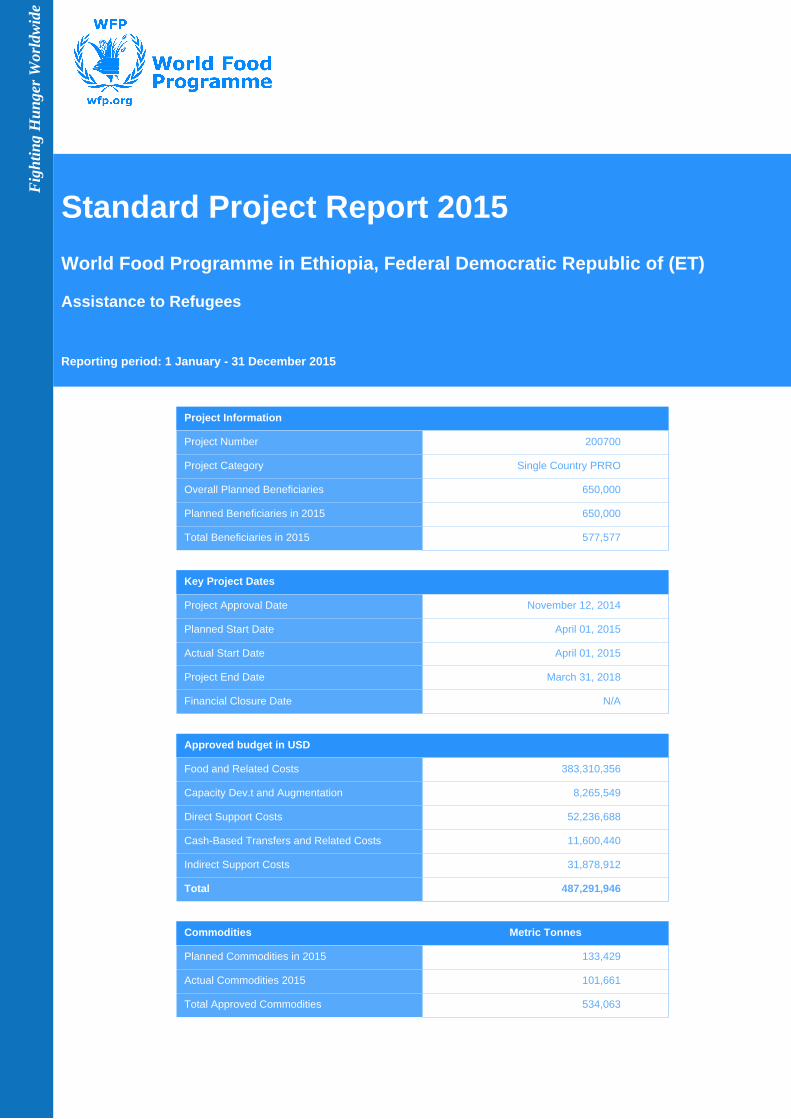
Standard Project Report 2015
World Food Programme in Ethiopia, Federal Democratic Republic of (ET)
Assistance to Refugees
Reporting period: 1 January - 31 December 2015
Project Information
Project Number 200700
Project Category Single Country PRRO
Overall Planned Beneficiaries 650,000
Planned Beneficiaries in 2015 650,000
Total Beneficiaries in 2015 577,577
Key Project Dates
Project Approval Date November 12, 2014
Planned Start Date April 01, 2015
Actual Start Date April 01, 2015
Project End Date March 31, 2018
Financial Closure Date N/A
Approved budget in USD
Food and Related Costs 383,310,356
Capacity Dev.t and Augmentation 8,265,549
Direct Support Costs 52,236,688
Cash-Based Transfers and Related Costs 11,600,440
Indirect Support Costs 31,878,912
Total 487,291,946
Commodities Metric Tonnes
Planned Commodities in 2015 133,429
Actual Commodities 2015 101,661
Total Approved Commodities 534,063
Standard Project Report 2015
Ethiopia, Federal Democratic Republic of (ET) Single Country PRRO - 200700
Table Of Contents
COUNTRY OVERVIEW
Country Background
Summary Of WFP Assistance
OPERATIONAL SPR
Operational Objectives and Relevance
Results
Beneficiaries, Targeting and Distribution
Story Worth Telling
Progress Towards Gender Equality
Protection and Accountability to Affected Populations
Outputs
Outcomes
Sustainability, Capacity Development and Handover
Inputs
Resource Inputs
Food Purchases and In-Kind Receipts
Food Transport, Delivery and Handling
Post-Delivery Losses
Management
Partnerships
Lessons Learned
Endnotes
Operational Statistics
Annex: Participants by Activity and Modality
Annex: Resource Inputs from Donors
Standard Project Report 2015
Ethiopia, Federal Democratic Republic of (ET) Single Country PRRO - 200700
COUNTRY OVERVIEW
Country BackgroundWith a population of almost 97 million people, Ethiopia is the second most populous country in Africa. The countryhas made impressive strides over the last 20 years in reducing poverty and expanding investments in basic socialservices - paving the way for the country to meet many of its Millennium Development Goal (MDG) targets.
From 2004 - 2013, the World Bank estimates that Ethiopia's economy has had strong growth, with annual grossdomestic product (GDP) per capita growth rates of 8.3 percent. According to the Ethiopia MDG Report for 2014, thenumber of people in absolute poverty fell from 48 percent in 1990 to an estimated 25 percent in 2013/2014. At thesame time, the proportion of undernourished people fell from almost 75 percent in 1990/92 to a projected 32 percentin 2014/15 - thereby enabling Ethiopia to reach its MDG Hunger target.
The prevalence of stunting declined from 58 percent in 2000 to 40 percent in 2014, while wasting rates remained at10 percent during the same period. Net primary school enrollment rates have risen from 21 percent in 1996 to 92.6percent in 2014, and the gender parity index currently stands at 0.93, indicating a significant improvement in girls'access to education.
The government's longer-term vision is to attain middle-income country status by 2025. To achieve this goal, thegovernment has organized its policy and investment framework under the umbrella of two 5- year Growth andTransformation Plans - GTP I and GTP II. Both GTPs place an emphasis on agriculture as the main driver forgrowth, coupled with a strong focus on social protection instruments such as the Productive Safety Net Programme(PSNP) to ensure sustained attention on food security and poverty reduction. For example, the latest iteration of thePSNP (PSNP IV) aims to provide conditional food and cash transfers to almost 8 million people per year from 2015
Standard Project Report 2015
Ethiopia, Federal Democratic Republic of (ET) Single Country PRRO - 200700
to 2020.
Despite strong economic gains and a comprehensive policy framework for development, the distribution ofdevelopmental gains remains uneven. According to the UNDP 2015 Human Development Report, Ethiopia isranked 174 out of 188 countries in terms of human development. While national figures on nutrition are fairlypromising, regional variation is quite pronounced. For example, in Afar and Somali regions, global acute malnutrition(GAM) rates can be as high as 30 percent, and stunting rates in Amhara and Afar are close to 60 percent.
Poverty, food insecurity and malnutrition are all inextricably linked. Over 80 percent of the population living in ruralareas is dependent on rain-fed agriculture and livestock rearing as their main source of food and income. In turn,climate shocks are the primary driver behind chronic poverty, food insecurity and malnutrition at household level.The International Food Policy Research Institute's Global Hunger Index scores Ethiopia at 33.9 - or at a “serious”level - even after the impressive gains the country has made from a MDG perspective.
Rainfall data for the period from 1967 to 2000 indicate that Ethiopia's annual variability in rainfall across differentzones is among the highest in the world, ranging from a low of 15 percent to a high of 81 percent. The larger thevariation in rainfall a household is exposed to, the lower its income and consumption levels. Repeated climateshocks have severely eroded rural livelihoods, leaving households with little capacity to cope and meet their mostbasic consumption needs. Climate shocks are a major cause of humanitarian crises in Ethiopia. Since 2003, thecountry has faced five serious droughts affecting millions of people, the most recent of which unfolded over thecourse of 2015 and was compounded by the global El Niño event.
In 2015, the already fragile situation among food insecure and vulnerable people was exacerbated by the failure ofthe belg rains (February-May) and well below normal rainfall for the main kiremt rains (June-September), affectingthe main meher cropping season that contributes around 85 percent of Ethiopia's total annual food production. Withthe onset of the El Niño phenomenon, in July 2015, production assessments reported that up to 25 percent of theharvest was lost at the national level, and in some regions this figure rose to 70 percent.
The lack of water has had devastating effects for both human and animal well-being. An outbreak of scabiesoccurred in large swaths of Amhara, along with communicable diseases in Afar, Oromia and Somali regions.Coupled with a lack of food at the household level, GAM rates reached 20 percent and higher in Oromia, Afar, andSomali regions. Conservative estimates indicate that over 30,000 head of cattle died as a result of no water, pastureor browse. Not only are livestock essential household assets that generate income, but they also represent a keysource of meat and milk for pastoral communities. This, too, contributed to the increase in malnutrition across thecountry.
In the face of the worst drought in over 50 years, the scale of humanitarian needs over the course of 2015 rosedramatically. In February 2015, the Government issued its official Humanitarian Requirements Document (HRD),estimating that 2.9 million people required emergency food assistance. By December 2015, this number had risento 10.2 million - almost a 250 percent increase. With regard to the prevalence of moderate acute malnutrition(MAM), in February 2015, some 200,000 children under 5 and pregnant and lactating women (PLW) were projectedas needing MAM treatment. By the end of 2015, this number peaked at 2.2 million young children and PLW, or a1,000 percent increase.
The adult HIV prevalence in the country is 1.1 percent, with 700,000 HIV positive people and 800,000 orphans andvulnerable children. Significant variation exists between genders, among population groups and across geographicareas. The HIV prevalence rate for men and women is 0.8 percent and 1.4 percent respectively; for rural residents itis 0.5 percent while for urban residents it reaches 3.8 percent. HIV prevalence is disproportionately higher amongurban females (4 percent) compared to urban men (2.4 percent).
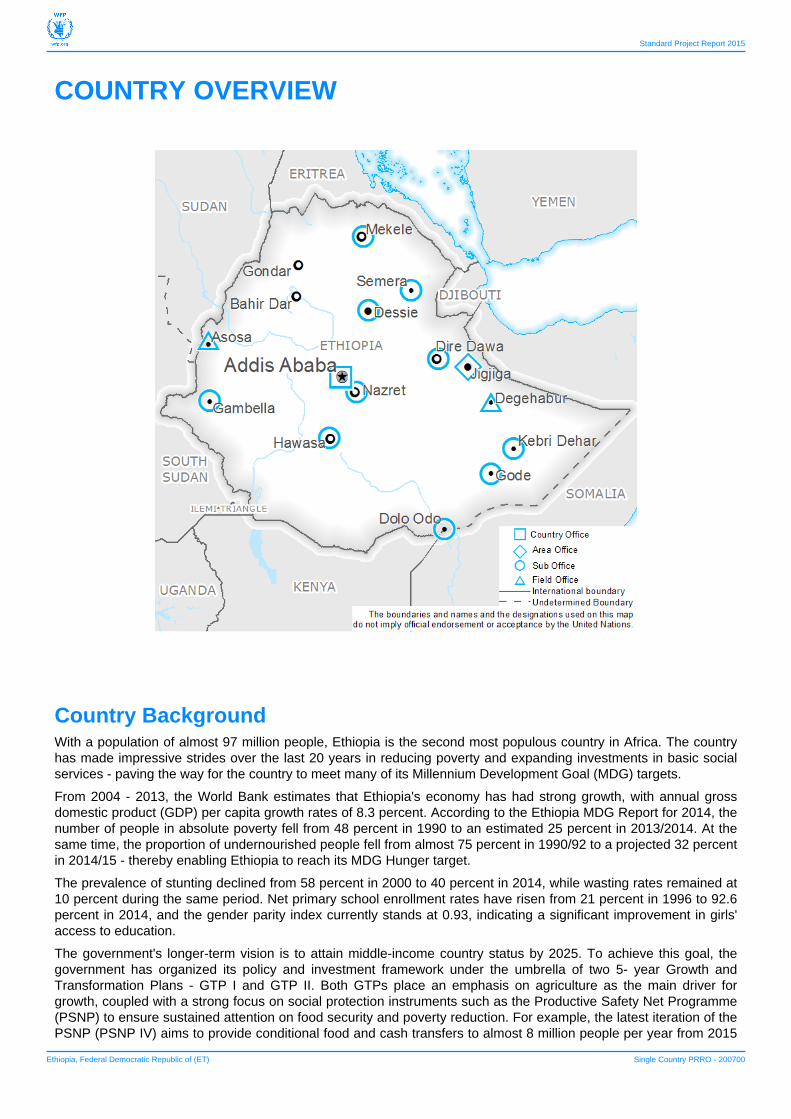
Ethiopia is also host to the largest refugee population on the African Continent. Over 730,000 officially registeredrefugees fom South Sudan, Somalia, Sudan, Eritrea and Kenya now reside in 26 camps located in five regionalstates including Afar, Benishangul-Gumuz, Gambella, Somali and Tigray. Of the total, approximately one-third areSouth Sudanese who arrived into the Gambella region in early 2014 following the eruption of hostilities in SouthSudan in 2013.
Summary Of WFP AssistanceWFP's role in Ethiopia is to support government policies, programmes and systems that address the multipledimensions of hunger and undernutrition among the most vulnerable segments of the population and refugeeshosted in different parts of the country.
Protracted relief and recovery operation (PRRO) 200290 and its successor PRRO 200712 were designed to supportand complement the government's social protection, disaster risk management and nutrition programmes by
Standard Project Report 2015
Ethiopia, Federal Democratic Republic of (ET) Single Country PRRO - 200700
providing emergency food assistance, engaging in productive safety net activities, addressing malnutrition, andoffering technical assistance. In 2015, these PRROs responded to the dramatic rise in acute food and nutritionneeds arising from the failure of both the spring and summer rains and the onset of the El Niño-related drought.Simultaneously, WFP also provided food assistance to chronically food insecure households under the ProductiveSafety Net Programme (PSNP).
PRRO 200365 and its successor, PRRO 200700, aimed to support Ethiopia's significant refugee population,focusing on live-saving food and nutrition assistance for over 560,000 refugees in 26 camps across the country.
WFP's country programme (CP) 200253 comprised five components: 1) support to the Government of Ethiopia inthe development of a national disaster risk management system; 2) building resilience in food insecure communitiesthrough natural resource management activities (Managing Environmental Resources to Enable Transition to MoreSustainable Livelihoods); 3) school feeding under the Children in Local Development Initiative; 4) support to peopleliving with HIV and AIDS; and 5) support to smallholder farmers through Purchase for Progress (P4P).
WFP further assistsed the government through capacity strengthening efforts. Through its P4P programme, WFPworked with local cooperative farms to source cereals that are then distributed under WFP and governmentprogrammes. WFP has also invested in a Food Management Improvement Project that established a commoditymanagement system within the National Disaster Risk Management Commission (NDRMC), which oversees allfood commodity movements in the country. Finally, WFP deployed its expertise in food security analysis to supportthe NDRMC in the preparation of disaster risk profiles at woreda (district) level.
WFP has three special operations (SO) in Ethiopia. SO 200711 operated the United Nations Humanitarian AirServices, which enabled the humanitarian community to reach remote areas where refugee camps are located. SO200358 focused on the construction of a Humanitarian Hub in Djibouti, where WFP and other humanitarianagencies can store cargo intended for operations across East Africa and organise specialized logistics trainingsessions. Lastly, SO 200752 was launched in 2014 for the construction of a bridge in the Somali Region (Geeldoh)to facilitate access to isolated districts and villages that are cut off from basic services and humanitarian assistanceduring rainy seasons.
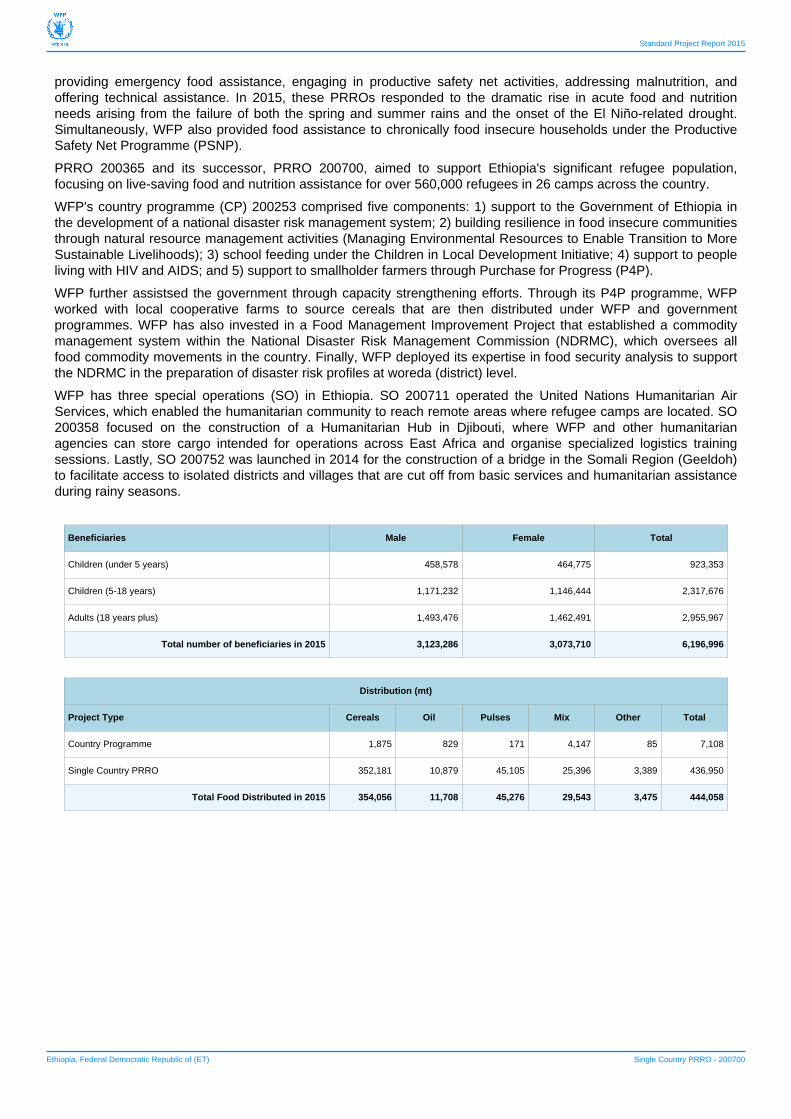
Beneficiaries Male Female Total
Children (under 5 years) 458,578 464,775 923,353
Children (5-18 years) 1,171,232 1,146,444 2,317,676
Adults (18 years plus) 1,493,476 1,462,491 2,955,967
Total number of beneficiaries in 2015 3,123,286 3,073,710 6,196,996
Distribution (mt)
Project Type Cereals Oil Pulses Mix Other Total
Country Programme 1,875 829 171 4,147 85 7,108
Single Country PRRO 352,181 10,879 45,105 25,396 3,389 436,950
Total Food Distributed in 2015 354,056 11,708 45,276 29,543 3,475 444,058
Standard Project Report 2015
Ethiopia, Federal Democratic Republic of (ET) Single Country PRRO - 200700
OPERATIONAL SPR
Operational Objectives and RelevanceThe Government of Ethiopia maintains an open border policy for refugees seeking protection in the country.Refugees and asylum seekers are expected to reside in camps, although with the modified "out of camp" policy,some are permitted to reside in urban areas for health care, education, security and humanitarian reasons. As ageneral rule, refugees hosted in Ethiopia do not have access to agricultural lands, and are denied the right forformal employment. A large majority is therefore heavily reliant on external assistance, of which food and nutritionassistance are key components.
WFP launched PRRO 200700 in April 2015 for a period of three years. The operation aimed to meet the needs ofrefugees from neighboring countries living in 24 camps in Ethiopia. Refugees originated primarily from Somalia,South Sudan, Eritrea, Kenya and Sudan. WFP provided food assistance through general food distributions, schoolfeeding, and targeted and blanket supplementary feeding programmes.
This PRRO supported the objectives in WFP's Strategic Plan (2014-2017) by:
- enabling refugees to meet minimum acceptable levels of food security (Strategic Objective 1);
- preventing and treating acute malnutrition in children under 5 years, pregnant and lactating women, elderly people,people living with HIV (PLHIV) and the disabled (Strategic Objective 1);
- stabilizing school enrolment of refugee girls and boys in WFP-assisted schools (Strategic Objective 2); and
- increasing livelihood opportunities in fragile transition situations for refugees and host communities (StrategicObjective 2).
Income-generating activities and environmental interventions for refugees and local communities were alsoimplemented, consistent with the recommendations of the 2012 Joint UNHCR/WFP Impact Evaluation on theContribution of Food Assistance to Durable Solutions in Protracted Refugee Situations in Ethiopia.
WFP activities were aligned with the local tripartite agreement signed for the period of 2012 - 2015 by thegovernment's Administration for Refugee and Returnee Affairs (ARRA), WFP and UNHCR.
Results
Beneficiaries, Targeting and DistributionRefugees are registered upon arrival in Ethiopia by ARRA and UNHCR. Following a series of interviews designed todetermine their eligibility, they are granted refugee status. Their personal data, including name, age, familycomposition as well as biometric data (fingerprints) are recorded by UNHCR and used to generate food distributionlists. As of 2015, all refugees officially registered in camps were entitled to receive food assistance.
By the end of 2015, refugees receiving food assistance from WFP in the 26 camps were from South Sudan (42percent), Somalia (39 percent), Eritrea (11 percent) and Sudan (8 percent). Overall, more women than men wereregistered in the camps, as a higher proportion of men stayed behind in their countries while sending their familiesto safety. This was the case especially among the refugees from South Sudan. The influx of refugees from SouthSudan, which started in December 2013 following the outbreak of civil war triggered by an attempted coup by VicePresident Riek Machar against President Salva Kiir, continued in the first weeks of 2015, albeit at a much slowerrate than in 2014. Around 2,000 new refugees arrived per month in April - December 2015 compared to a monthlyaverage of 16,000 people in 2014. As of December 2015, over 270,000 South Sudanese refugees were hosted inthe region of Gambella.
Between April and December 2015, WFP distributed over 88,000 mt of food through general distribution (GD),nearly 4,000 mt of various nutrition products under blanket and targeted supplementary feeding programmes andover 450 mt of SuperCereal and sugar under the school meals programme. The amount of food distributed throughGD was less than planned, mainly due to reduced cereal rations during November and December owing to largefunding shortfalls.
The total number of refugees supported by WFP was lower than initially planned, as planning figures were based onUNHCR's 2015 estimate of new arrivals, and in the end fewer people sought refuge than predicted. In addition,
Standard Project Report 2015
Ethiopia, Federal Democratic Republic of (ET) Single Country PRRO - 200700
Eritrean refugees leaving the Tigray camps, and others living with host communities in Afar, Gambella and AddisAbeba, who remained registered with UNHCR and ARRA but did not collect food, were also part of the reason forthe variance between official refugee statistics and the actual number of people residing in the camps and receivingfood. UNHCR and ARRA deregistered 81,000 people who had not collected food between April and June 2015 fromcamps hosting Eritrean refugees.
All refugees received a monthly food basket of cereals (wheat or sorghum), fortified blended food (SuperCereal),pulses, vegetable oil, sugar and salt, which covered over 2,100 kcal/person/day. WFP included a 20 percentallowance to the monthly cereal rations as a top-up for milling costs in all camps, however, in November andDecember, the top-up was suspended due to a severe funding shortage. High-energy biscuits were distributed tonew arrivals from South Sudan and Eritrea for the first three consecutive days upon arrival and during relocationfrom entry points. Whenever early transfer from entry points to the camps was not possible, wet feeding wasprovided by UNHCR. Dried fruit was distributed to all refugees during Ramadan.
In the five camps (Adi Arush, Shedder, Awbarre, Aysaita and Bambasi) where cash was provided in addition tofood, six kg of cereals were replaced with ETB 100 (USD 4.8) with which refugees could purchase other key fooditems from nearby markets. The over-achievement for these cash-based transfers (CBT) was mainly because ahigher level of resources received for CBT enabled WFP to target more beneficiaries than planned.
To prevent acute malnutrition among children aged 6 - 23 months and pregnant and lactating women (PLW), ablanket supplementary feeding programme (BSFP) was planned in all camps. Children received SuperCereal pluswhereas PLW were provided SuperCereal, vegetable oil and sugar. Children aged 24 - 59 months were alsoassisted through BSFP in camps where the global acute malnutrition (GAM) rate was above the emergencythreshold - mainly in Gambella and Afar where GAM rates peaked at 28 and 23 percent, respectively.
Given that the GAM rates were so high in these aforementioned camps, some 31,000 PLW were also supportedthrough BSFP even though the original plan did not include this particular group. PLW received SuperCereal,vegetable oil and sugar. Based on discussions with ARRA, UNHCR and NGOs, WFP plans to include PLW underBSFP for the remainder of this project. In addition, WFP provided nearly 4,500 people with HIV or TB with a mix ofSuperCereal, vegetable oil and sugar under BSFP in the year.
Overall, WFP did not reach the planned number of beneficiaries under BSFP primarily because the activity wasdiscontinued in the five camps in Dollo Ado. After many years of implementing BSFP in Dollo Ado, GAM rates havenot gone down. WFP is planning to conduct a causal analysis of malnutrition in the Dollo Ado camps in 2016 tobetter understand underlying factors that contribute to very high GAM rates even when a full complement of externalassistance is being provided. The study will enable WFP to re-orient its food assistance programmes in thesecamps to better address these underlying causes of malnutrition.
To treat moderate acute malnutrition (MAM) among children under the age of 5, Plumpy'Sup was provided throughWFP's targeted supplementary feeding programme (TSFP). Whenever Plumpy'Sup was not available,children received SuperCereal Plus. However, in the few cases when neither Plumpy'Sup nor SuperCereal Pluswere available, moderately malnourished children under five received a mix of SuperCereal, vegetable oil andsugar. Moderately malnourished PLW were given a premix of SuperCereal, vegetable oil and sugar. Nearly 800moderately malnourished individuals with HIV and TB were also provided with mix of SuperCereal, vegetable oiland sugar under TSFP.
Nearly 40 percent of planned TSFP beneficiaries were reached in 2015. WFP’s planning figures for TSFP are basedon estimates from camp statistics and nutrition surveys. These surveys, using a weight-for-height methodology,overestimated the prevalence of MAM among refugees and, therefore, set the initial planning numbers quite high. For example, in the case of the Gambella and Dollo Addo camps, nutrition surveys indicated that GAM rates hadreached 25 and 15 percent respectively. These locations account for over 80 percent of the PRRO’s beneficiaries,and as such, the planning figures for TSFP in these camps alone reached over 20,000 people. However, during theTSF admission screening campaigns conducted by WFP and nutrition partners, only half of that number of refugeeswere found to be in need of treatment.
Children who were not treated under the TSFP still received nutritional assistance through the BSFP.
WFP's school meals programme supported 18 primary schools for refugee children, and those enrolled received adaily hot meal made of SuperCereal and sugar. The number of school children receiving school meals wassignificantly lower than planned. This was a result of implementation delays in Gambella, where partners lackedcapacity and funds to build structures such as kitchens, feeding shelters and food stores, and to pay for materialsand staff. As a consequence, around 50,000 primary school children in the region were unable to benefit from theassistance. However, the June 2015 community and household surveillance (CHS) survey found that most of themwere attending school without school meals, although attendance rates were not as regular as the ones inWFP-assisted schools. In spite of the absence of school meals, the June 2015 CHS survey also showed thatenrolment rates in Gambella were among the highest in the country. Together with partner NGOs and ARRA, WFP
Standard Project Report 2015
Ethiopia, Federal Democratic Republic of (ET) Single Country PRRO - 200700
will assess the feasibility of launching the school meals programme in the Gambella camps in the future.
In 2015, the PRRO faced supply chain breaks for salt and sugar due to logistics challenges and transportationdelays. In addition, due to a shortage of funds the cereal entitlement was reduced to 37 percent, and the distributionof SuperCereal as part of the GD food basket was suspended in November. This had a significant impact on theoperation.
A total of 500 households benefited from livelihood interventions in two camps, Berhale and Aysaita, in 2015. Inpartnership with a local NGO, WFP supported income-generating activities such as businesss skill training,multi-story vegetable gardening, training on how to establish self-help groups, technical support for vegetablegardening and provision of seedlings for gardens, and provision of donkey carts to support the commercialactivities.
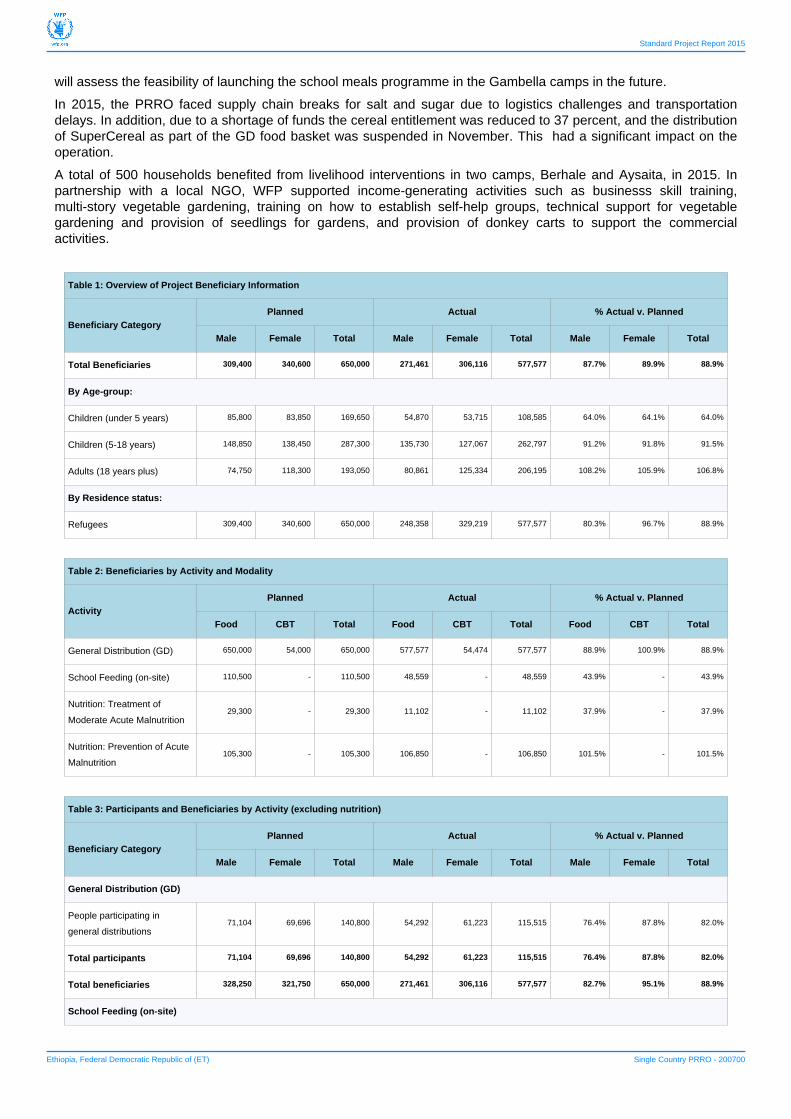
Table 1: Overview of Project Beneficiary Information
Beneficiary CategoryPlanned Actual % Actual v. Planned
Male Female Total Male Female Total Male Female Total
Total Beneficiaries 309,400 340,600 650,000 271,461 306,116 577,577 87.7% 89.9% 88.9%
By Age-group:
Children (under 5 years) 85,800 83,850 169,650 54,870 53,715 108,585 64.0% 64.1% 64.0%
Children (5-18 years) 148,850 138,450 287,300 135,730 127,067 262,797 91.2% 91.8% 91.5%
Adults (18 years plus) 74,750 118,300 193,050 80,861 125,334 206,195 108.2% 105.9% 106.8%
By Residence status:
Refugees 309,400 340,600 650,000 248,358 329,219 577,577 80.3% 96.7% 88.9%
Table 2: Beneficiaries by Activity and Modality
ActivityPlanned Actual % Actual v. Planned
Food CBT Total Food CBT Total Food CBT Total
General Distribution (GD) 650,000 54,000 650,000 577,577 54,474 577,577 88.9% 100.9% 88.9%
School Feeding (on-site) 110,500 - 110,500 48,559 - 48,559 43.9% - 43.9%
Nutrition: Treatment of
Moderate Acute Malnutrition29,300 - 29,300 11,102 - 11,102 37.9% - 37.9%
Nutrition: Prevention of Acute
Malnutrition105,300 - 105,300 106,850 - 106,850 101.5% - 101.5%
Table 3: Participants and Beneficiaries by Activity (excluding nutrition)
Beneficiary CategoryPlanned Actual % Actual v. Planned
Male Female Total Male Female Total Male Female Total
General Distribution (GD)
People participating in
general distributions71,104 69,696 140,800 54,292 61,223 115,515 76.4% 87.8% 82.0%
Total participants 71,104 69,696 140,800 54,292 61,223 115,515 76.4% 87.8% 82.0%
Total beneficiaries 328,250 321,750 650,000 271,461 306,116 577,577 82.7% 95.1% 88.9%
School Feeding (on-site)
Standard Project Report 2015
Ethiopia, Federal Democratic Republic of (ET) Single Country PRRO - 200700
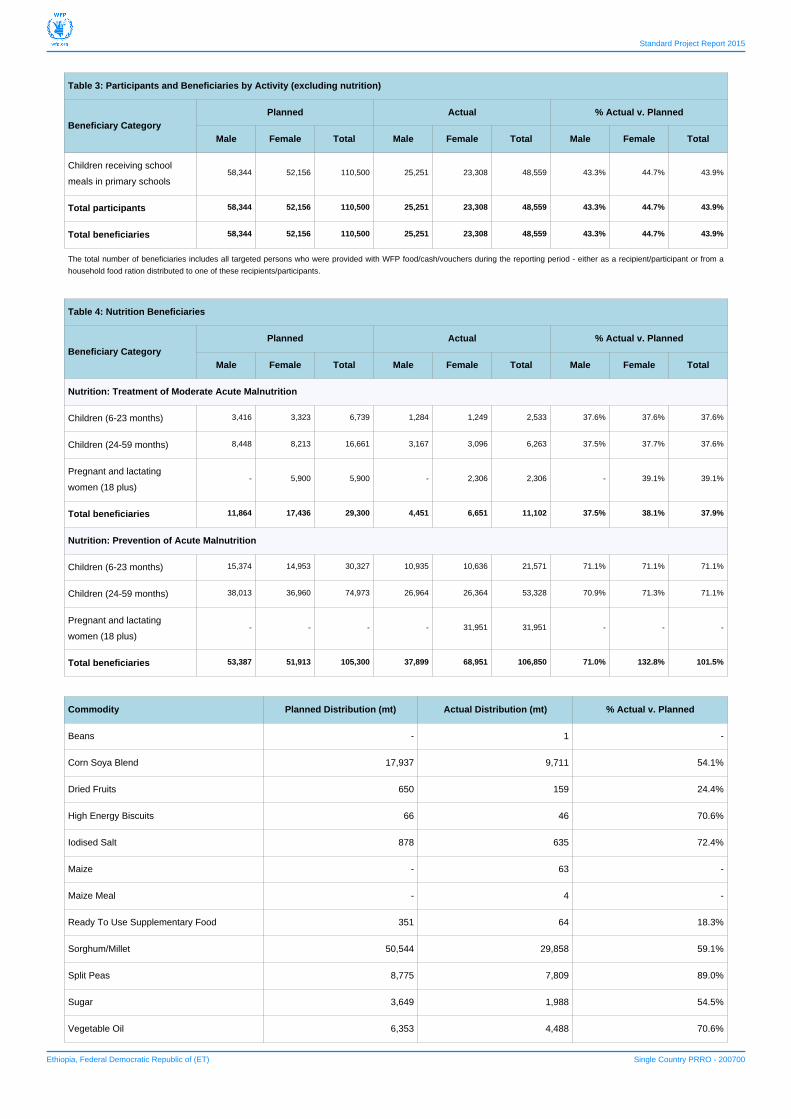
Table 3: Participants and Beneficiaries by Activity (excluding nutrition)
Beneficiary CategoryPlanned Actual % Actual v. Planned
Male Female Total Male Female Total Male Female Total
Children receiving school
meals in primary schools58,344 52,156 110,500 25,251 23,308 48,559 43.3% 44.7% 43.9%
Total participants 58,344 52,156 110,500 25,251 23,308 48,559 43.3% 44.7% 43.9%
Total beneficiaries 58,344 52,156 110,500 25,251 23,308 48,559 43.3% 44.7% 43.9%
The total number of beneficiaries includes all targeted persons who were provided with WFP food/cash/vouchers during the reporting period - either as a recipient/participant or from a
household food ration distributed to one of these recipients/participants.
Table 4: Nutrition Beneficiaries
Beneficiary CategoryPlanned Actual % Actual v. Planned
Male Female Total Male Female Total Male Female Total
Nutrition: Treatment of Moderate Acute Malnutrition
Children (6-23 months) 3,416 3,323 6,739 1,284 1,249 2,533 37.6% 37.6% 37.6%
Children (24-59 months) 8,448 8,213 16,661 3,167 3,096 6,263 37.5% 37.7% 37.6%
Pregnant and lactating
women (18 plus)- 5,900 5,900 - 2,306 2,306 - 39.1% 39.1%
Total beneficiaries 11,864 17,436 29,300 4,451 6,651 11,102 37.5% 38.1% 37.9%
Nutrition: Prevention of Acute Malnutrition
Children (6-23 months) 15,374 14,953 30,327 10,935 10,636 21,571 71.1% 71.1% 71.1%
Children (24-59 months) 38,013 36,960 74,973 26,964 26,364 53,328 70.9% 71.3% 71.1%
Pregnant and lactating
women (18 plus)- - - - 31,951 31,951 - - -
Total beneficiaries 53,387 51,913 105,300 37,899 68,951 106,850 71.0% 132.8% 101.5%
Commodity Planned Distribution (mt) Actual Distribution (mt) % Actual v. Planned
Beans - 1 -
Corn Soya Blend 17,937 9,711 54.1%
Dried Fruits 650 159 24.4%
High Energy Biscuits 66 46 70.6%
Iodised Salt 878 635 72.4%
Maize - 63 -
Maize Meal - 4 -
Ready To Use Supplementary Food 351 64 18.3%
Sorghum/Millet 50,544 29,858 59.1%
Split Peas 8,775 7,809 89.0%
Sugar 3,649 1,988 54.5%
Vegetable Oil 6,353 4,488 70.6%
Standard Project Report 2015
Ethiopia, Federal Democratic Republic of (ET) Single Country PRRO - 200700
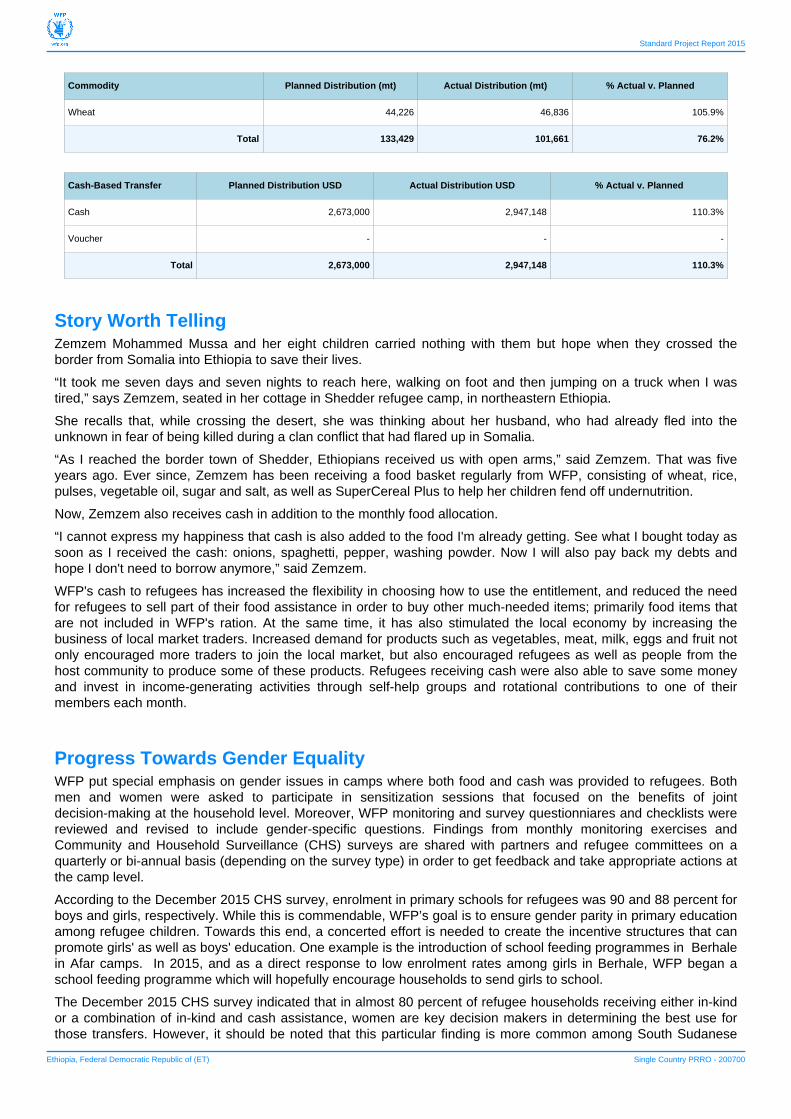
Commodity Planned Distribution (mt) Actual Distribution (mt) % Actual v. Planned
Wheat 44,226 46,836 105.9%
Total 133,429 101,661 76.2%
Cash-Based Transfer Planned Distribution USD Actual Distribution USD % Actual v. Planned
Cash 2,673,000 2,947,148 110.3%
Voucher - - -
Total 2,673,000 2,947,148 110.3%
Story Worth TellingZemzem Mohammed Mussa and her eight children carried nothing with them but hope when they crossed theborder from Somalia into Ethiopia to save their lives.
“It took me seven days and seven nights to reach here, walking on foot and then jumping on a truck when I wastired,” says Zemzem, seated in her cottage in Shedder refugee camp, in northeastern Ethiopia.
She recalls that, while crossing the desert, she was thinking about her husband, who had already fled into theunknown in fear of being killed during a clan conflict that had flared up in Somalia.
“As I reached the border town of Shedder, Ethiopians received us with open arms,” said Zemzem. That was fiveyears ago. Ever since, Zemzem has been receiving a food basket regularly from WFP, consisting of wheat, rice,pulses, vegetable oil, sugar and salt, as well as SuperCereal Plus to help her children fend off undernutrition.
Now, Zemzem also receives cash in addition to the monthly food allocation.
“I cannot express my happiness that cash is also added to the food I'm already getting. See what I bought today assoon as I received the cash: onions, spaghetti, pepper, washing powder. Now I will also pay back my debts andhope I don't need to borrow anymore,” said Zemzem.
WFP's cash to refugees has increased the flexibility in choosing how to use the entitlement, and reduced the needfor refugees to sell part of their food assistance in order to buy other much-needed items; primarily food items thatare not included in WFP's ration. At the same time, it has also stimulated the local economy by increasing thebusiness of local market traders. Increased demand for products such as vegetables, meat, milk, eggs and fruit notonly encouraged more traders to join the local market, but also encouraged refugees as well as people from thehost community to produce some of these products. Refugees receiving cash were also able to save some moneyand invest in income-generating activities through self-help groups and rotational contributions to one of theirmembers each month.
Progress Towards Gender EqualityWFP put special emphasis on gender issues in camps where both food and cash was provided to refugees. Bothmen and women were asked to participate in sensitization sessions that focused on the benefits of jointdecision-making at the household level. Moreover, WFP monitoring and survey questionniares and checklists werereviewed and revised to include gender-specific questions. Findings from monthly monitoring exercises andCommunity and Household Surveillance (CHS) surveys are shared with partners and refugee committees on aquarterly or bi-annual basis (depending on the survey type) in order to get feedback and take appropriate actions atthe camp level.
According to the December 2015 CHS survey, enrolment in primary schools for refugees was 90 and 88 percent forboys and girls, respectively. While this is commendable, WFP’s goal is to ensure gender parity in primary educationamong refugee children. Towards this end, a concerted effort is needed to create the incentive structures that canpromote girls' as well as boys' education. One example is the introduction of school feeding programmes in Berhalein Afar camps. In 2015, and as a direct response to low enrolment rates among girls in Berhale, WFP began aschool feeding programme which will hopefully encourage households to send girls to school.
The December 2015 CHS survey indicated that in almost 80 percent of refugee households receiving either in-kindor a combination of in-kind and cash assistance, women are key decision makers in determining the best use forthose transfers. However, it should be noted that this particular finding is more common among South Sudanese
Standard Project Report 2015
Ethiopia, Federal Democratic Republic of (ET) Single Country PRRO - 200700
refugee households in Gambella - which account for over 30 percent of the total refugee population in Ethiopia andwhere the number of female-headed households is much higher than in other regions. Men are much more likely tomake the key decisions on the use of food or cash among Somali and Eritrean refugee households. WFP will furthermonitor this situation and revisit how sensitization sessions are run so as to promote gender equality in householddecision-making over resource use.
Livelihood activities supported by WFP were all designed based on a plan of at least 50 percent female participants.In addition, activities were carefully selected to ease women's work load and to reduce their vulnerability to potentialprotection risks.
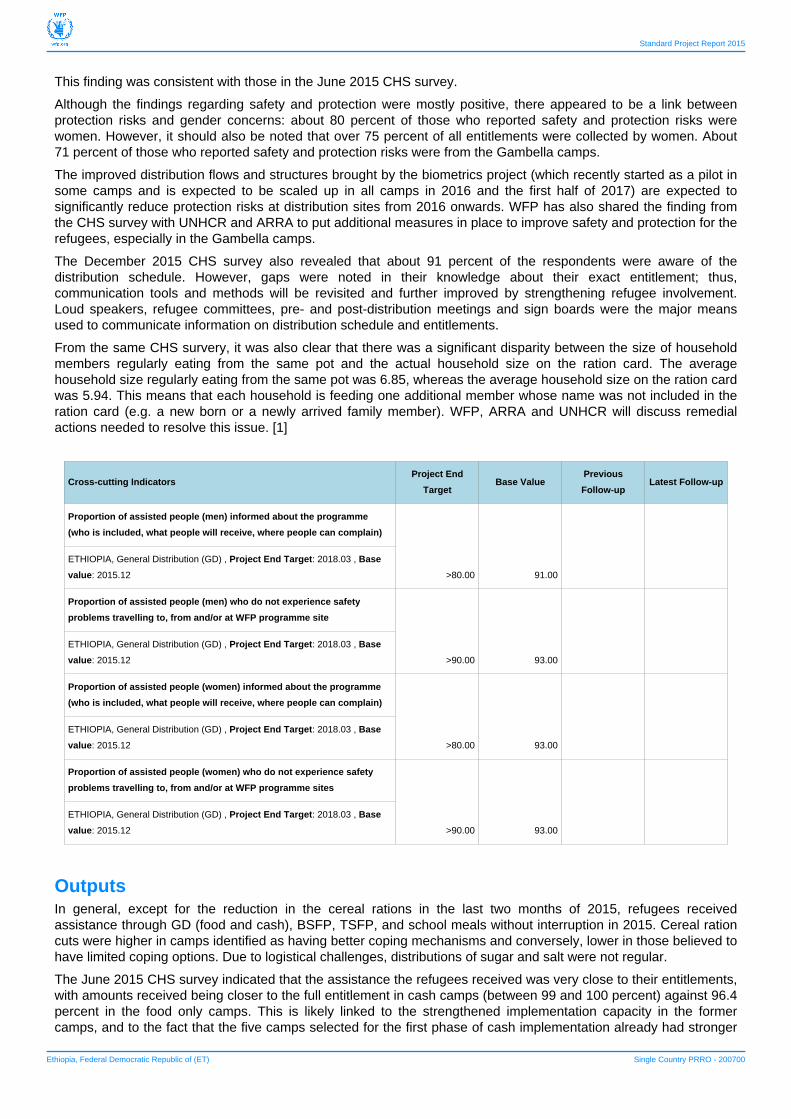
Cross-cutting IndicatorsProject End
TargetBase Value
Previous
Follow-upLatest Follow-up
Proportion of households where females and males together make
decisions over the use of cash, voucher or food
>50.00 11.80 15.20
ETHIOPIA, General Distribution (GD) , Project End Target: 2018.03 , Base
value: 2015.06 , Latest Follow-up: 2015.12
Proportion of households where females make decisions over the use of
cash, voucher or food
>30.00 71.70 79.20
ETHIOPIA, General Distribution (GD) , Project End Target: 2018.03 , Base
value: 2015.06 , Latest Follow-up: 2015.12
Proportion of households where males make decisions over the use of
cash, voucher or food
<20.00 16.40 5.60
ETHIOPIA, General Distribution (GD) , Project End Target: 2018.03 , Base
value: 2015.06 , Latest Follow-up: 2015.12
Proportion of women beneficiaries in leadership positions of project
management committees
>50.00 50.00 52.00
ETHIOPIA, General Distribution (GD) , Project End Target: 2018.03 , Base
value: 2015.06 , Latest Follow-up: 2015.12
Proportion of women project management committee members trained
on modalities of food, cash, or voucher distribution
>60.00 75.00 80.00
ETHIOPIA, General Distribution (GD) , Project End Target: 2018.03 , Base
value: 2015.06 , Latest Follow-up: 2015.12
Protection and Accountability to Affected PopulationsPRRO 200700 was designed with beneficiary protection and accountability aspects included in the programmedesign and implementation. In most of the refugee camps, help desks consisting of representatives from therefugees, ARRA, WFP and UNHCR were established to listen to complaints and take timely corrective actions. Thedesks are active during distributions, and staff there jointly take corrective actions for the complaints that can bemanaged at their level. Complaints that cannot be handled within their capacity are escalated to the appropriateagency for further action. A range of actions were taken with regard to distributions: efforts were made to avoid latehour distributions, waiting shelters were built and sign boards showing entitlements were posted at all distributionsites. People with specific needs were given priority during distributions and protection issues were included in thepre- and post-distribution meetings. Water points and latrines were also made available at distribution sites.
The December 2015 CHS survey indicated that 93 percent of sampled refugee households reported no safety andprotection problems while travelling to and from food distribution sites, and at the distribution sites. The 7 percentwho reported safety issues indicated problems such as theft, conflict and physical harassment, mainly at distributionsites, and while returning to their residence. No one reported safety ad protection issues while going to thedistribution site.
Sensitization meetings, particularly in camps where food as well as cash is provided, have contributed to minimizingprotection risks, even at the household level. About 99 percent of the sampled refugee households in the December2015 CHS survey reported that they did not face any conflict at the household level over control of the entitlement.
Standard Project Report 2015
Ethiopia, Federal Democratic Republic of (ET) Single Country PRRO - 200700
This finding was consistent with those in the June 2015 CHS survey.
Although the findings regarding safety and protection were mostly positive, there appeared to be a link betweenprotection risks and gender concerns: about 80 percent of those who reported safety and protection risks werewomen. However, it should also be noted that over 75 percent of all entitlements were collected by women. About71 percent of those who reported safety and protection risks were from the Gambella camps.
The improved distribution flows and structures brought by the biometrics project (which recently started as a pilot insome camps and is expected to be scaled up in all camps in 2016 and the first half of 2017) are expected tosignificantly reduce protection risks at distribution sites from 2016 onwards. WFP has also shared the finding fromthe CHS survey with UNHCR and ARRA to put additional measures in place to improve safety and protection for therefugees, especially in the Gambella camps.
The December 2015 CHS survey also revealed that about 91 percent of the respondents were aware of thedistribution schedule. However, gaps were noted in their knowledge about their exact entitlement; thus,communication tools and methods will be revisited and further improved by strengthening refugee involvement.Loud speakers, refugee committees, pre- and post-distribution meetings and sign boards were the major meansused to communicate information on distribution schedule and entitlements.
From the same CHS survery, it was also clear that there was a significant disparity between the size of householdmembers regularly eating from the same pot and the actual household size on the ration card. The averagehousehold size regularly eating from the same pot was 6.85, whereas the average household size on the ration cardwas 5.94. This means that each household is feeding one additional member whose name was not included in theration card (e.g. a new born or a newly arrived family member). WFP, ARRA and UNHCR will discuss remedialactions needed to resolve this issue. [1]
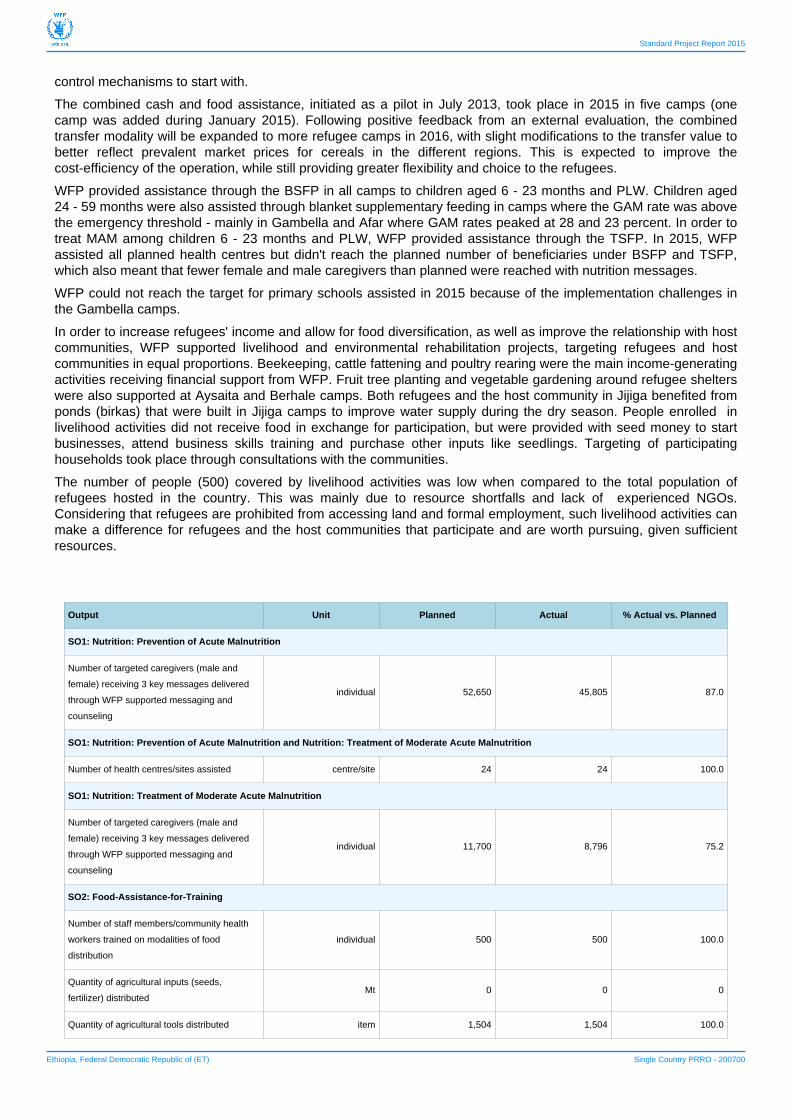
Cross-cutting IndicatorsProject End
TargetBase Value
Previous
Follow-upLatest Follow-up
Proportion of assisted people (men) informed about the programme
(who is included, what people will receive, where people can complain)
>80.00 91.00
ETHIOPIA, General Distribution (GD) , Project End Target: 2018.03 , Base
value: 2015.12
Proportion of assisted people (men) who do not experience safety
problems travelling to, from and/or at WFP programme site
>90.00 93.00
ETHIOPIA, General Distribution (GD) , Project End Target: 2018.03 , Base
value: 2015.12
Proportion of assisted people (women) informed about the programme
(who is included, what people will receive, where people can complain)
>80.00 93.00
ETHIOPIA, General Distribution (GD) , Project End Target: 2018.03 , Base
value: 2015.12
Proportion of assisted people (women) who do not experience safety
problems travelling to, from and/or at WFP programme sites
>90.00 93.00
ETHIOPIA, General Distribution (GD) , Project End Target: 2018.03 , Base
value: 2015.12
OutputsIn general, except for the reduction in the cereal rations in the last two months of 2015, refugees receivedassistance through GD (food and cash), BSFP, TSFP, and school meals without interruption in 2015. Cereal rationcuts were higher in camps identified as having better coping mechanisms and conversely, lower in those believed tohave limited coping options. Due to logistical challenges, distributions of sugar and salt were not regular.
The June 2015 CHS survey indicated that the assistance the refugees received was very close to their entitlements,with amounts received being closer to the full entitlement in cash camps (between 99 and 100 percent) against 96.4percent in the food only camps. This is likely linked to the strengthened implementation capacity in the formercamps, and to the fact that the five camps selected for the first phase of cash implementation already had stronger
Standard Project Report 2015
Ethiopia, Federal Democratic Republic of (ET) Single Country PRRO - 200700
control mechanisms to start with.
The combined cash and food assistance, initiated as a pilot in July 2013, took place in 2015 in five camps (onecamp was added during January 2015). Following positive feedback from an external evaluation, the combinedtransfer modality will be expanded to more refugee camps in 2016, with slight modifications to the transfer value tobetter reflect prevalent market prices for cereals in the different regions. This is expected to improve thecost-efficiency of the operation, while still providing greater flexibility and choice to the refugees.
WFP provided assistance through the BSFP in all camps to children aged 6 - 23 months and PLW. Children aged24 - 59 months were also assisted through blanket supplementary feeding in camps where the GAM rate was abovethe emergency threshold - mainly in Gambella and Afar where GAM rates peaked at 28 and 23 percent. In order totreat MAM among children 6 - 23 months and PLW, WFP provided assistance through the TSFP. In 2015, WFPassisted all planned health centres but didn't reach the planned number of beneficiaries under BSFP and TSFP,which also meant that fewer female and male caregivers than planned were reached with nutrition messages.
WFP could not reach the target for primary schools assisted in 2015 because of the implementation challenges inthe Gambella camps.
In order to increase refugees' income and allow for food diversification, as well as improve the relationship with hostcommunities, WFP supported livelihood and environmental rehabilitation projects, targeting refugees and hostcommunities in equal proportions. Beekeeping, cattle fattening and poultry rearing were the main income-generatingactivities receiving financial support from WFP. Fruit tree planting and vegetable gardening around refugee shelterswere also supported at Aysaita and Berhale camps. Both refugees and the host community in Jijiga benefited fromponds (birkas) that were built in Jijiga camps to improve water supply during the dry season. People enrolled inlivelihood activities did not receive food in exchange for participation, but were provided with seed money to startbusinesses, attend business skills training and purchase other inputs like seedlings. Targeting of participatinghouseholds took place through consultations with the communities.
The number of people (500) covered by livelihood activities was low when compared to the total population ofrefugees hosted in the country. This was mainly due to resource shortfalls and lack of experienced NGOs.Considering that refugees are prohibited from accessing land and formal employment, such livelihood activities canmake a difference for refugees and the host communities that participate and are worth pursuing, given sufficientresources.
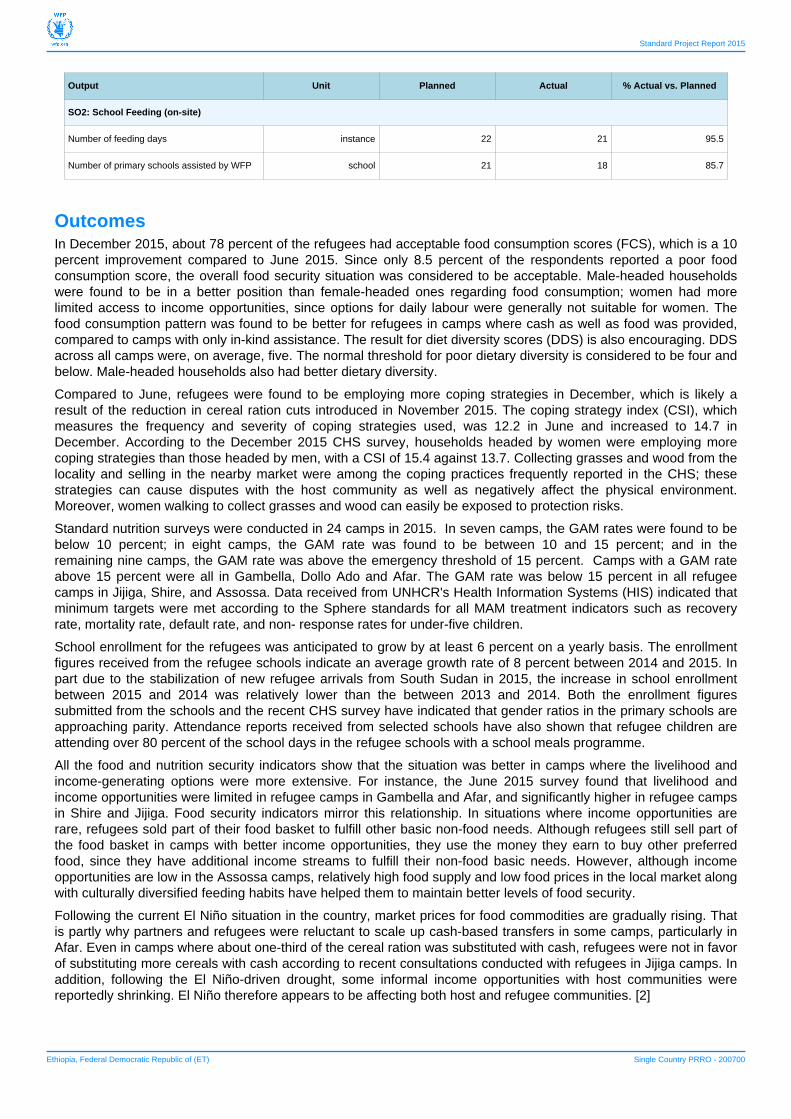
Output Unit Planned Actual % Actual vs. Planned
SO1: Nutrition: Prevention of Acute Malnutrition
Number of targeted caregivers (male and
female) receiving 3 key messages delivered
through WFP supported messaging and
counseling
individual 52,650 45,805 87.0
SO1: Nutrition: Prevention of Acute Malnutrition and Nutrition: Treatment of Moderate Acute Malnutrition
Number of health centres/sites assisted centre/site 24 24 100.0
SO1: Nutrition: Treatment of Moderate Acute Malnutrition
Number of targeted caregivers (male and
female) receiving 3 key messages delivered
through WFP supported messaging and
counseling
individual 11,700 8,796 75.2
SO2: Food-Assistance-for-Training
Number of staff members/community health
workers trained on modalities of food
distribution
individual 500 500 100.0
Quantity of agricultural inputs (seeds,
fertilizer) distributedMt 0 0 0
Quantity of agricultural tools distributed item 1,504 1,504 100.0
Standard Project Report 2015
Ethiopia, Federal Democratic Republic of (ET) Single Country PRRO - 200700
Output Unit Planned Actual % Actual vs. Planned
SO2: School Feeding (on-site)
Number of feeding days instance 22 21 95.5
Number of primary schools assisted by WFP school 21 18 85.7
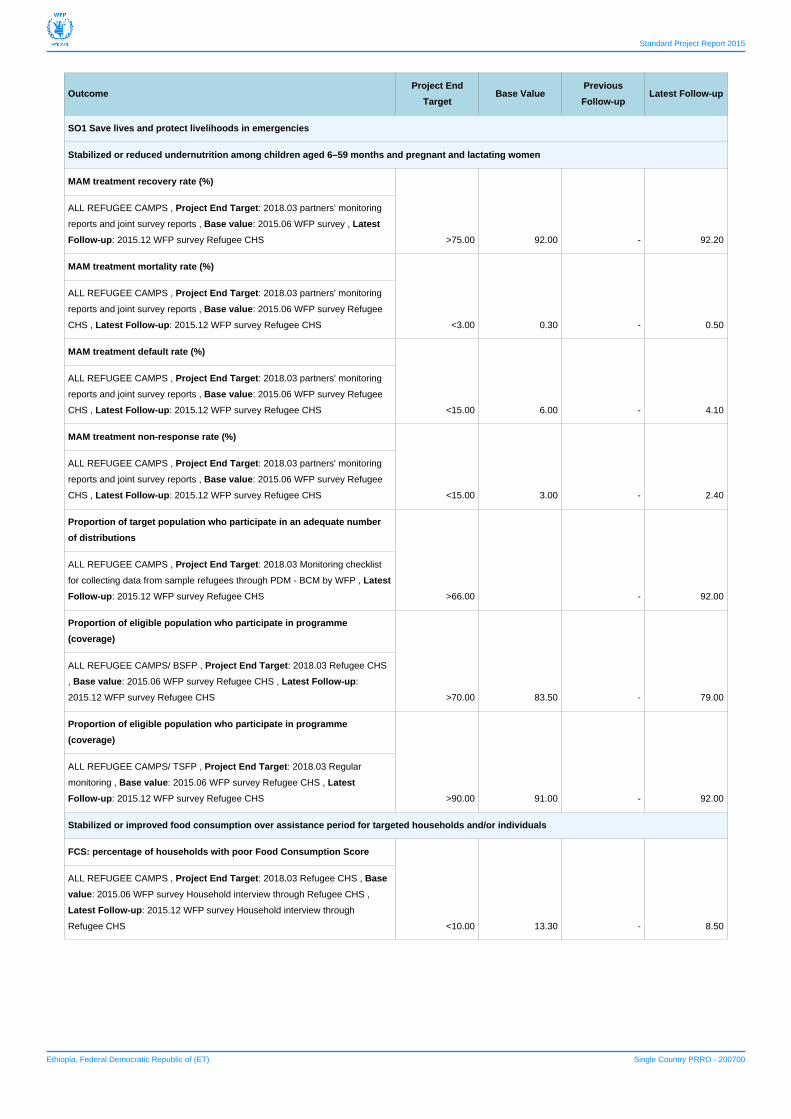
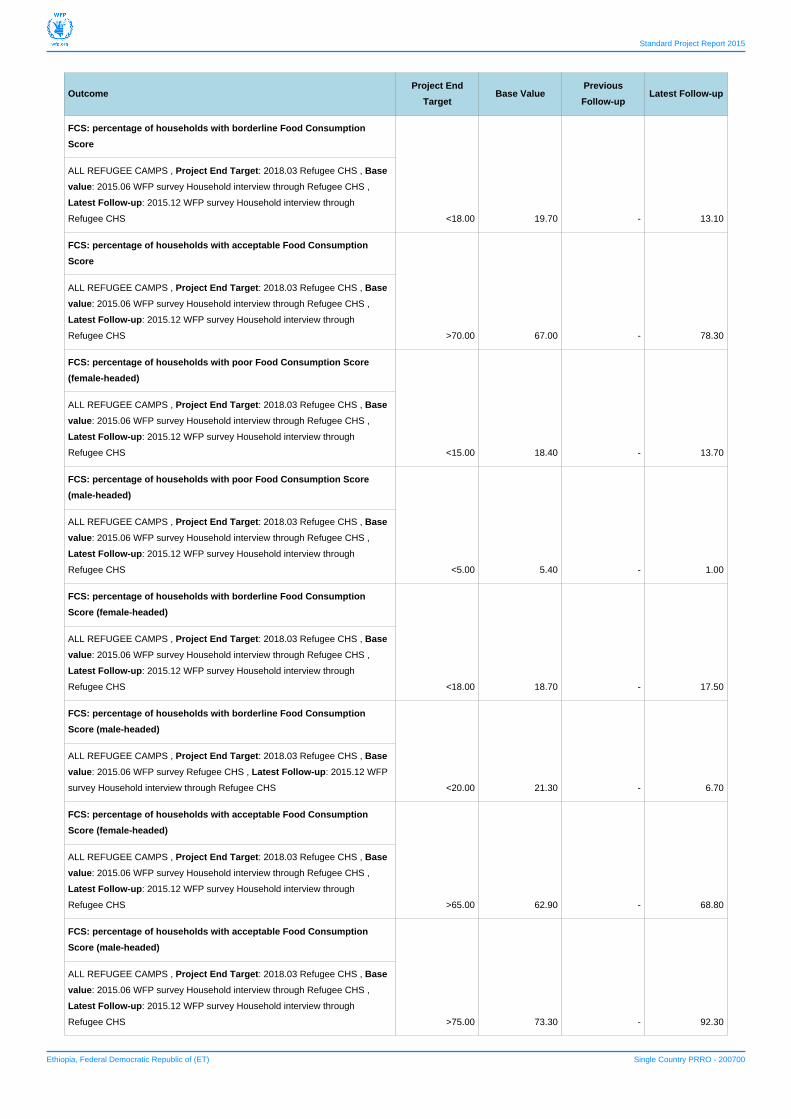
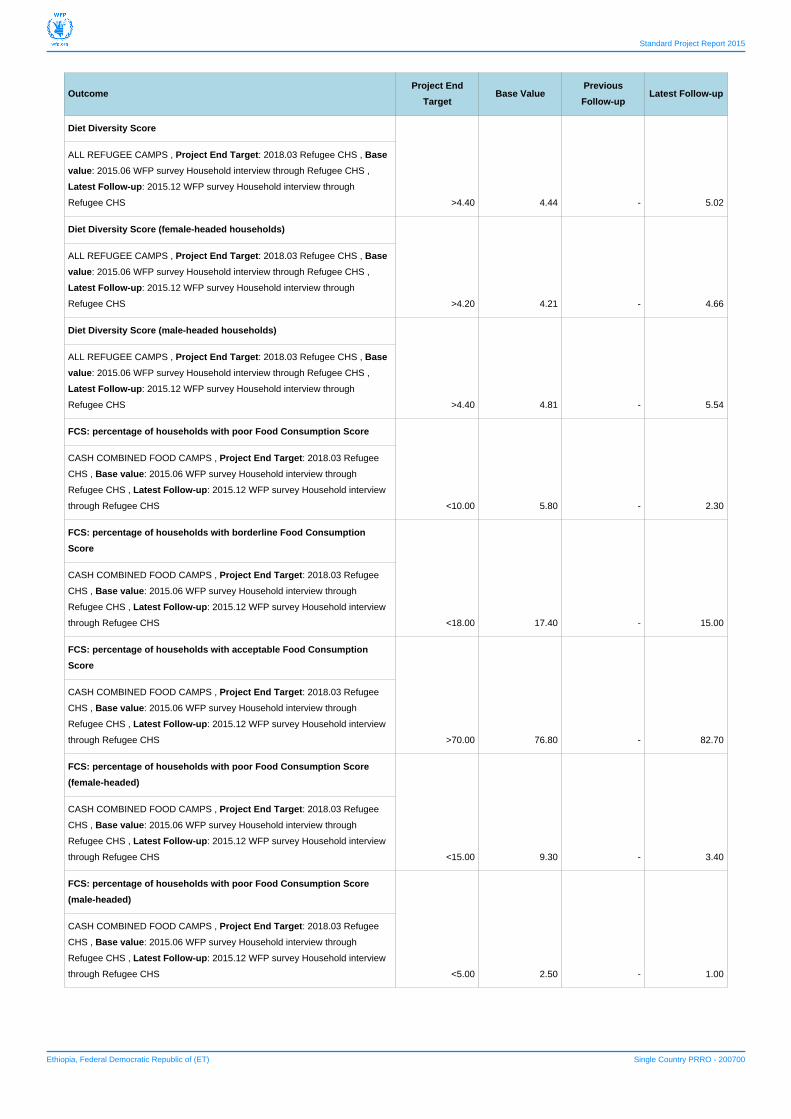
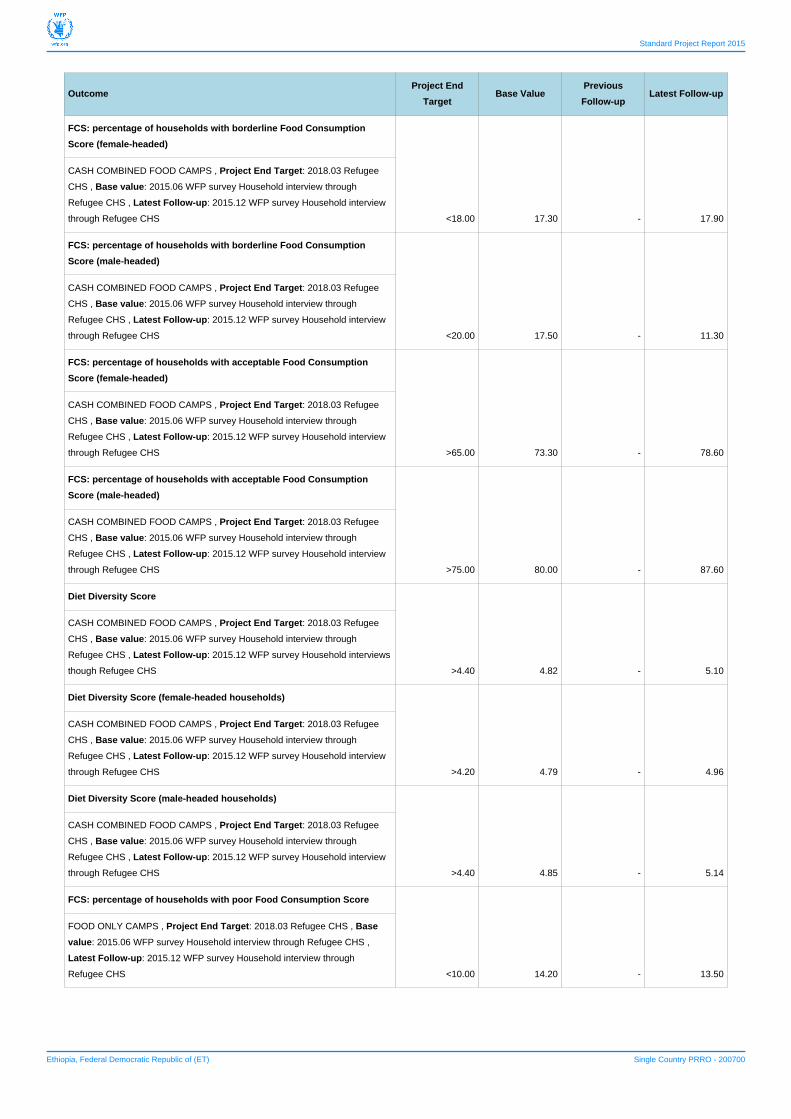
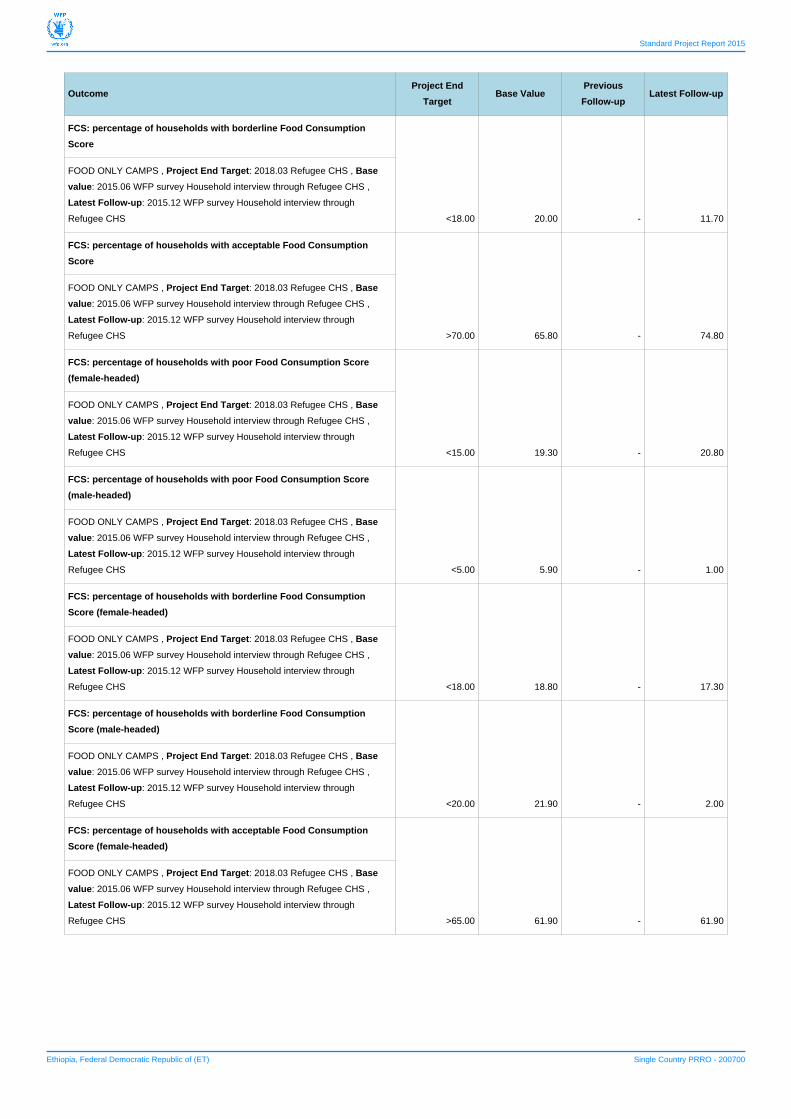
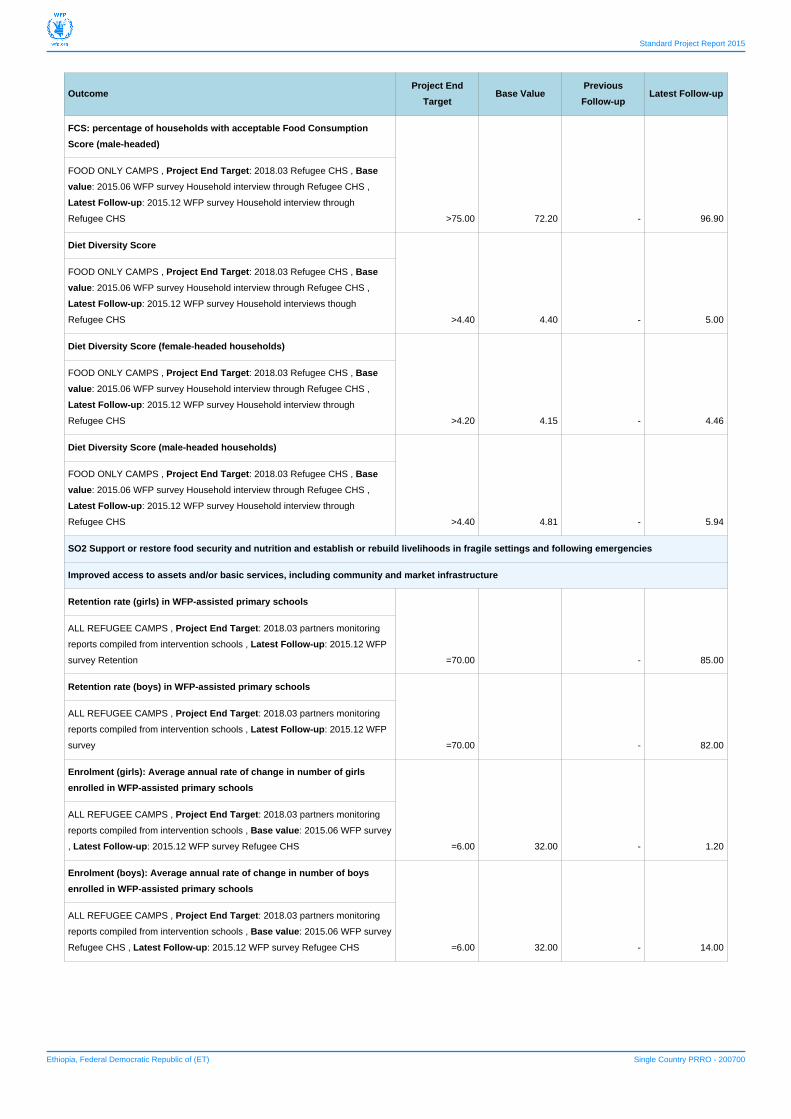
OutcomesIn December 2015, about 78 percent of the refugees had acceptable food consumption scores (FCS), which is a 10percent improvement compared to June 2015. Since only 8.5 percent of the respondents reported a poor foodconsumption score, the overall food security situation was considered to be acceptable. Male-headed householdswere found to be in a better position than female-headed ones regarding food consumption; women had morelimited access to income opportunities, since options for daily labour were generally not suitable for women. Thefood consumption pattern was found to be better for refugees in camps where cash as well as food was provided,compared to camps with only in-kind assistance. The result for diet diversity scores (DDS) is also encouraging. DDSacross all camps were, on average, five. The normal threshold for poor dietary diversity is considered to be four andbelow. Male-headed households also had better dietary diversity.
Compared to June, refugees were found to be employing more coping strategies in December, which is likely aresult of the reduction in cereal ration cuts introduced in November 2015. The coping strategy index (CSI), whichmeasures the frequency and severity of coping strategies used, was 12.2 in June and increased to 14.7 inDecember. According to the December 2015 CHS survey, households headed by women were employing morecoping strategies than those headed by men, with a CSI of 15.4 against 13.7. Collecting grasses and wood from thelocality and selling in the nearby market were among the coping practices frequently reported in the CHS; thesestrategies can cause disputes with the host community as well as negatively affect the physical environment.Moreover, women walking to collect grasses and wood can easily be exposed to protection risks.
Standard nutrition surveys were conducted in 24 camps in 2015. In seven camps, the GAM rates were found to bebelow 10 percent; in eight camps, the GAM rate was found to be between 10 and 15 percent; and in theremaining nine camps, the GAM rate was above the emergency threshold of 15 percent. Camps with a GAM rateabove 15 percent were all in Gambella, Dollo Ado and Afar. The GAM rate was below 15 percent in all refugeecamps in Jijiga, Shire, and Assossa. Data received from UNHCR's Health Information Systems (HIS) indicated thatminimum targets were met according to the Sphere standards for all MAM treatment indicators such as recoveryrate, mortality rate, default rate, and non- response rates for under-five children.
School enrollment for the refugees was anticipated to grow by at least 6 percent on a yearly basis. The enrollmentfigures received from the refugee schools indicate an average growth rate of 8 percent between 2014 and 2015. Inpart due to the stabilization of new refugee arrivals from South Sudan in 2015, the increase in school enrollmentbetween 2015 and 2014 was relatively lower than the between 2013 and 2014. Both the enrollment figuressubmitted from the schools and the recent CHS survey have indicated that gender ratios in the primary schools areapproaching parity. Attendance reports received from selected schools have also shown that refugee children areattending over 80 percent of the school days in the refugee schools with a school meals programme.
All the food and nutrition security indicators show that the situation was better in camps where the livelihood andincome-generating options were more extensive. For instance, the June 2015 survey found that livelihood andincome opportunities were limited in refugee camps in Gambella and Afar, and significantly higher in refugee campsin Shire and Jijiga. Food security indicators mirror this relationship. In situations where income opportunities arerare, refugees sold part of their food basket to fulfill other basic non-food needs. Although refugees still sell part ofthe food basket in camps with better income opportunities, they use the money they earn to buy other preferredfood, since they have additional income streams to fulfill their non-food basic needs. However, although incomeopportunities are low in the Assossa camps, relatively high food supply and low food prices in the local market alongwith culturally diversified feeding habits have helped them to maintain better levels of food security.
Following the current El Niño situation in the country, market prices for food commodities are gradually rising. Thatis partly why partners and refugees were reluctant to scale up cash-based transfers in some camps, particularly inAfar. Even in camps where about one-third of the cereal ration was substituted with cash, refugees were not in favorof substituting more cereals with cash according to recent consultations conducted with refugees in Jijiga camps. Inaddition, following the El Niño-driven drought, some informal income opportunities with host communities werereportedly shrinking. El Niño therefore appears to be affecting both host and refugee communities. [2]
Standard Project Report 2015
Ethiopia, Federal Democratic Republic of (ET) Single Country PRRO - 200700
OutcomeProject End
TargetBase Value
Previous
Follow-upLatest Follow-up
SO1 Save lives and protect livelihoods in emergencies
Stabilized or reduced undernutrition among children aged 6–59 months and pregnant and lactating women
MAM treatment recovery rate (%)
>75.00 92.00 - 92.20
ALL REFUGEE CAMPS , Project End Target: 2018.03 partners' monitoring
reports and joint survey reports , Base value: 2015.06 WFP survey , Latest
Follow-up: 2015.12 WFP survey Refugee CHS
MAM treatment mortality rate (%)
<3.00 0.30 - 0.50
ALL REFUGEE CAMPS , Project End Target: 2018.03 partners' monitoring
reports and joint survey reports , Base value: 2015.06 WFP survey Refugee
CHS , Latest Follow-up: 2015.12 WFP survey Refugee CHS
MAM treatment default rate (%)
<15.00 6.00 - 4.10
ALL REFUGEE CAMPS , Project End Target: 2018.03 partners' monitoring
reports and joint survey reports , Base value: 2015.06 WFP survey Refugee
CHS , Latest Follow-up: 2015.12 WFP survey Refugee CHS
MAM treatment non-response rate (%)
<15.00 3.00 - 2.40
ALL REFUGEE CAMPS , Project End Target: 2018.03 partners' monitoring
reports and joint survey reports , Base value: 2015.06 WFP survey Refugee
CHS , Latest Follow-up: 2015.12 WFP survey Refugee CHS
Proportion of target population who participate in an adequate number
of distributions
>66.00 - 92.00
ALL REFUGEE CAMPS , Project End Target: 2018.03 Monitoring checklist
for collecting data from sample refugees through PDM - BCM by WFP , Latest
Follow-up: 2015.12 WFP survey Refugee CHS
Proportion of eligible population who participate in programme
(coverage)
>70.00 83.50 - 79.00
ALL REFUGEE CAMPS/ BSFP , Project End Target: 2018.03 Refugee CHS
, Base value: 2015.06 WFP survey Refugee CHS , Latest Follow-up:
2015.12 WFP survey Refugee CHS
Proportion of eligible population who participate in programme
(coverage)
>90.00 91.00 - 92.00
ALL REFUGEE CAMPS/ TSFP , Project End Target: 2018.03 Regular
monitoring , Base value: 2015.06 WFP survey Refugee CHS , Latest
Follow-up: 2015.12 WFP survey Refugee CHS
Stabilized or improved food consumption over assistance period for targeted households and/or individuals
FCS: percentage of households with poor Food Consumption Score
<10.00 13.30 - 8.50
ALL REFUGEE CAMPS , Project End Target: 2018.03 Refugee CHS , Base
value: 2015.06 WFP survey Household interview through Refugee CHS ,
Latest Follow-up: 2015.12 WFP survey Household interview through
Refugee CHS
Standard Project Report 2015
Ethiopia, Federal Democratic Republic of (ET) Single Country PRRO - 200700
OutcomeProject End
TargetBase Value
Previous
Follow-upLatest Follow-up
FCS: percentage of households with borderline Food Consumption
Score
<18.00 19.70 - 13.10
ALL REFUGEE CAMPS , Project End Target: 2018.03 Refugee CHS , Base
value: 2015.06 WFP survey Household interview through Refugee CHS ,
Latest Follow-up: 2015.12 WFP survey Household interview through
Refugee CHS
FCS: percentage of households with acceptable Food Consumption
Score
>70.00 67.00 - 78.30
ALL REFUGEE CAMPS , Project End Target: 2018.03 Refugee CHS , Base
value: 2015.06 WFP survey Household interview through Refugee CHS ,
Latest Follow-up: 2015.12 WFP survey Household interview through
Refugee CHS
FCS: percentage of households with poor Food Consumption Score
(female-headed)
<15.00 18.40 - 13.70
ALL REFUGEE CAMPS , Project End Target: 2018.03 Refugee CHS , Base
value: 2015.06 WFP survey Household interview through Refugee CHS ,
Latest Follow-up: 2015.12 WFP survey Household interview through
Refugee CHS
FCS: percentage of households with poor Food Consumption Score
(male-headed)
<5.00 5.40 - 1.00
ALL REFUGEE CAMPS , Project End Target: 2018.03 Refugee CHS , Base
value: 2015.06 WFP survey Household interview through Refugee CHS ,
Latest Follow-up: 2015.12 WFP survey Household interview through
Refugee CHS
FCS: percentage of households with borderline Food Consumption
Score (female-headed)
<18.00 18.70 - 17.50
ALL REFUGEE CAMPS , Project End Target: 2018.03 Refugee CHS , Base
value: 2015.06 WFP survey Household interview through Refugee CHS ,
Latest Follow-up: 2015.12 WFP survey Household interview through
Refugee CHS
FCS: percentage of households with borderline Food Consumption
Score (male-headed)
<20.00 21.30 - 6.70
ALL REFUGEE CAMPS , Project End Target: 2018.03 Refugee CHS , Base
value: 2015.06 WFP survey Refugee CHS , Latest Follow-up: 2015.12 WFP
survey Household interview through Refugee CHS
FCS: percentage of households with acceptable Food Consumption
Score (female-headed)
>65.00 62.90 - 68.80
ALL REFUGEE CAMPS , Project End Target: 2018.03 Refugee CHS , Base
value: 2015.06 WFP survey Household interview through Refugee CHS ,
Latest Follow-up: 2015.12 WFP survey Household interview through
Refugee CHS
FCS: percentage of households with acceptable Food Consumption
Score (male-headed)
>75.00 73.30 - 92.30
ALL REFUGEE CAMPS , Project End Target: 2018.03 Refugee CHS , Base
value: 2015.06 WFP survey Household interview through Refugee CHS ,
Latest Follow-up: 2015.12 WFP survey Household interview through
Refugee CHS
Standard Project Report 2015
Ethiopia, Federal Democratic Republic of (ET) Single Country PRRO - 200700
OutcomeProject End
TargetBase Value
Previous
Follow-upLatest Follow-up
Diet Diversity Score
>4.40 4.44 - 5.02
ALL REFUGEE CAMPS , Project End Target: 2018.03 Refugee CHS , Base
value: 2015.06 WFP survey Household interview through Refugee CHS ,
Latest Follow-up: 2015.12 WFP survey Household interview through
Refugee CHS
Diet Diversity Score (female-headed households)
>4.20 4.21 - 4.66
ALL REFUGEE CAMPS , Project End Target: 2018.03 Refugee CHS , Base
value: 2015.06 WFP survey Household interview through Refugee CHS ,
Latest Follow-up: 2015.12 WFP survey Household interview through
Refugee CHS
Diet Diversity Score (male-headed households)
>4.40 4.81 - 5.54
ALL REFUGEE CAMPS , Project End Target: 2018.03 Refugee CHS , Base
value: 2015.06 WFP survey Household interview through Refugee CHS ,
Latest Follow-up: 2015.12 WFP survey Household interview through
Refugee CHS
FCS: percentage of households with poor Food Consumption Score
<10.00 5.80 - 2.30
CASH COMBINED FOOD CAMPS , Project End Target: 2018.03 Refugee
CHS , Base value: 2015.06 WFP survey Household interview through
Refugee CHS , Latest Follow-up: 2015.12 WFP survey Household interview
through Refugee CHS
FCS: percentage of households with borderline Food Consumption
Score
<18.00 17.40 - 15.00
CASH COMBINED FOOD CAMPS , Project End Target: 2018.03 Refugee
CHS , Base value: 2015.06 WFP survey Household interview through
Refugee CHS , Latest Follow-up: 2015.12 WFP survey Household interview
through Refugee CHS
FCS: percentage of households with acceptable Food Consumption
Score
>70.00 76.80 - 82.70
CASH COMBINED FOOD CAMPS , Project End Target: 2018.03 Refugee
CHS , Base value: 2015.06 WFP survey Household interview through
Refugee CHS , Latest Follow-up: 2015.12 WFP survey Household interview
through Refugee CHS
FCS: percentage of households with poor Food Consumption Score
(female-headed)
<15.00 9.30 - 3.40
CASH COMBINED FOOD CAMPS , Project End Target: 2018.03 Refugee
CHS , Base value: 2015.06 WFP survey Household interview through
Refugee CHS , Latest Follow-up: 2015.12 WFP survey Household interview
through Refugee CHS
FCS: percentage of households with poor Food Consumption Score
(male-headed)
<5.00 2.50 - 1.00
CASH COMBINED FOOD CAMPS , Project End Target: 2018.03 Refugee
CHS , Base value: 2015.06 WFP survey Household interview through
Refugee CHS , Latest Follow-up: 2015.12 WFP survey Household interview
through Refugee CHS
Standard Project Report 2015
Ethiopia, Federal Democratic Republic of (ET) Single Country PRRO - 200700
OutcomeProject End
TargetBase Value
Previous
Follow-upLatest Follow-up
FCS: percentage of households with borderline Food Consumption
Score (female-headed)
<18.00 17.30 - 17.90
CASH COMBINED FOOD CAMPS , Project End Target: 2018.03 Refugee
CHS , Base value: 2015.06 WFP survey Household interview through
Refugee CHS , Latest Follow-up: 2015.12 WFP survey Household interview
through Refugee CHS
FCS: percentage of households with borderline Food Consumption
Score (male-headed)
<20.00 17.50 - 11.30
CASH COMBINED FOOD CAMPS , Project End Target: 2018.03 Refugee
CHS , Base value: 2015.06 WFP survey Household interview through
Refugee CHS , Latest Follow-up: 2015.12 WFP survey Household interview
through Refugee CHS
FCS: percentage of households with acceptable Food Consumption
Score (female-headed)
>65.00 73.30 - 78.60
CASH COMBINED FOOD CAMPS , Project End Target: 2018.03 Refugee
CHS , Base value: 2015.06 WFP survey Household interview through
Refugee CHS , Latest Follow-up: 2015.12 WFP survey Household interview
through Refugee CHS
FCS: percentage of households with acceptable Food Consumption
Score (male-headed)
>75.00 80.00 - 87.60
CASH COMBINED FOOD CAMPS , Project End Target: 2018.03 Refugee
CHS , Base value: 2015.06 WFP survey Household interview through
Refugee CHS , Latest Follow-up: 2015.12 WFP survey Household interview
through Refugee CHS
Diet Diversity Score
>4.40 4.82 - 5.10
CASH COMBINED FOOD CAMPS , Project End Target: 2018.03 Refugee
CHS , Base value: 2015.06 WFP survey Household interview through
Refugee CHS , Latest Follow-up: 2015.12 WFP survey Household interviews
though Refugee CHS
Diet Diversity Score (female-headed households)
>4.20 4.79 - 4.96
CASH COMBINED FOOD CAMPS , Project End Target: 2018.03 Refugee
CHS , Base value: 2015.06 WFP survey Household interview through
Refugee CHS , Latest Follow-up: 2015.12 WFP survey Household interview
through Refugee CHS
Diet Diversity Score (male-headed households)
>4.40 4.85 - 5.14
CASH COMBINED FOOD CAMPS , Project End Target: 2018.03 Refugee
CHS , Base value: 2015.06 WFP survey Household interview through
Refugee CHS , Latest Follow-up: 2015.12 WFP survey Household interview
through Refugee CHS
FCS: percentage of households with poor Food Consumption Score
<10.00 14.20 - 13.50
FOOD ONLY CAMPS , Project End Target: 2018.03 Refugee CHS , Base
value: 2015.06 WFP survey Household interview through Refugee CHS ,
Latest Follow-up: 2015.12 WFP survey Household interview through
Refugee CHS
Standard Project Report 2015
Ethiopia, Federal Democratic Republic of (ET) Single Country PRRO - 200700
OutcomeProject End
TargetBase Value
Previous
Follow-upLatest Follow-up
FCS: percentage of households with borderline Food Consumption
Score
<18.00 20.00 - 11.70
FOOD ONLY CAMPS , Project End Target: 2018.03 Refugee CHS , Base
value: 2015.06 WFP survey Household interview through Refugee CHS ,
Latest Follow-up: 2015.12 WFP survey Household interview through
Refugee CHS
FCS: percentage of households with acceptable Food Consumption
Score
>70.00 65.80 - 74.80
FOOD ONLY CAMPS , Project End Target: 2018.03 Refugee CHS , Base
value: 2015.06 WFP survey Household interview through Refugee CHS ,
Latest Follow-up: 2015.12 WFP survey Household interview through
Refugee CHS
FCS: percentage of households with poor Food Consumption Score
(female-headed)
<15.00 19.30 - 20.80
FOOD ONLY CAMPS , Project End Target: 2018.03 Refugee CHS , Base
value: 2015.06 WFP survey Household interview through Refugee CHS ,
Latest Follow-up: 2015.12 WFP survey Household interview through
Refugee CHS
FCS: percentage of households with poor Food Consumption Score
(male-headed)
<5.00 5.90 - 1.00
FOOD ONLY CAMPS , Project End Target: 2018.03 Refugee CHS , Base
value: 2015.06 WFP survey Household interview through Refugee CHS ,
Latest Follow-up: 2015.12 WFP survey Household interview through
Refugee CHS
FCS: percentage of households with borderline Food Consumption
Score (female-headed)
<18.00 18.80 - 17.30
FOOD ONLY CAMPS , Project End Target: 2018.03 Refugee CHS , Base
value: 2015.06 WFP survey Household interview through Refugee CHS ,
Latest Follow-up: 2015.12 WFP survey Household interview through
Refugee CHS
FCS: percentage of households with borderline Food Consumption
Score (male-headed)
<20.00 21.90 - 2.00
FOOD ONLY CAMPS , Project End Target: 2018.03 Refugee CHS , Base
value: 2015.06 WFP survey Household interview through Refugee CHS ,
Latest Follow-up: 2015.12 WFP survey Household interview through
Refugee CHS
FCS: percentage of households with acceptable Food Consumption
Score (female-headed)
>65.00 61.90 - 61.90
FOOD ONLY CAMPS , Project End Target: 2018.03 Refugee CHS , Base
value: 2015.06 WFP survey Household interview through Refugee CHS ,
Latest Follow-up: 2015.12 WFP survey Household interview through
Refugee CHS
Standard Project Report 2015
Ethiopia, Federal Democratic Republic of (ET) Single Country PRRO - 200700
OutcomeProject End
TargetBase Value
Previous
Follow-upLatest Follow-up
FCS: percentage of households with acceptable Food Consumption
Score (male-headed)
>75.00 72.20 - 96.90
FOOD ONLY CAMPS , Project End Target: 2018.03 Refugee CHS , Base
value: 2015.06 WFP survey Household interview through Refugee CHS ,
Latest Follow-up: 2015.12 WFP survey Household interview through
Refugee CHS
Diet Diversity Score
>4.40 4.40 - 5.00
FOOD ONLY CAMPS , Project End Target: 2018.03 Refugee CHS , Base
value: 2015.06 WFP survey Household interview through Refugee CHS ,
Latest Follow-up: 2015.12 WFP survey Household interviews though
Refugee CHS
Diet Diversity Score (female-headed households)
>4.20 4.15 - 4.46
FOOD ONLY CAMPS , Project End Target: 2018.03 Refugee CHS , Base
value: 2015.06 WFP survey Household interview through Refugee CHS ,
Latest Follow-up: 2015.12 WFP survey Household interview through
Refugee CHS
Diet Diversity Score (male-headed households)
>4.40 4.81 - 5.94
FOOD ONLY CAMPS , Project End Target: 2018.03 Refugee CHS , Base
value: 2015.06 WFP survey Household interview through Refugee CHS ,
Latest Follow-up: 2015.12 WFP survey Household interview through
Refugee CHS
SO2 Support or restore food security and nutrition and establish or rebuild livelihoods in fragile settings and following emergencies
Improved access to assets and/or basic services, including community and market infrastructure
Retention rate (girls) in WFP-assisted primary schools
=70.00 - 85.00
ALL REFUGEE CAMPS , Project End Target: 2018.03 partners monitoring
reports compiled from intervention schools , Latest Follow-up: 2015.12 WFP
survey Retention
Retention rate (boys) in WFP-assisted primary schools
=70.00 - 82.00
ALL REFUGEE CAMPS , Project End Target: 2018.03 partners monitoring
reports compiled from intervention schools , Latest Follow-up: 2015.12 WFP
survey
Enrolment (girls): Average annual rate of change in number of girls
enrolled in WFP-assisted primary schools
=6.00 32.00 - 1.20
ALL REFUGEE CAMPS , Project End Target: 2018.03 partners monitoring
reports compiled from intervention schools , Base value: 2015.06 WFP survey
, Latest Follow-up: 2015.12 WFP survey Refugee CHS
Enrolment (boys): Average annual rate of change in number of boys
enrolled in WFP-assisted primary schools
=6.00 32.00 - 14.00
ALL REFUGEE CAMPS , Project End Target: 2018.03 partners monitoring
reports compiled from intervention schools , Base value: 2015.06 WFP survey
Refugee CHS , Latest Follow-up: 2015.12 WFP survey Refugee CHS
Standard Project Report 2015
Ethiopia, Federal Democratic Republic of (ET) Single Country PRRO - 200700
OutcomeProject End
TargetBase Value
Previous
Follow-upLatest Follow-up
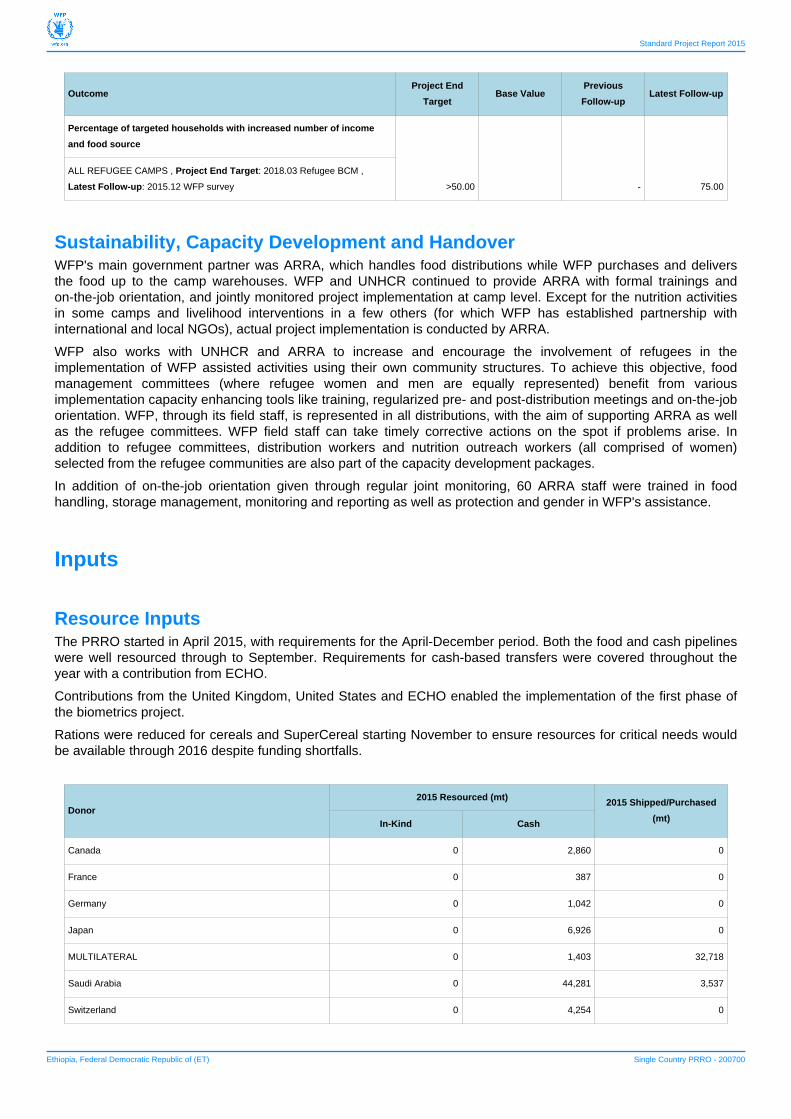
Percentage of targeted households with increased number of income
and food source
>50.00 - 75.00
ALL REFUGEE CAMPS , Project End Target: 2018.03 Refugee BCM ,
Latest Follow-up: 2015.12 WFP survey
Sustainability, Capacity Development and HandoverWFP's main government partner was ARRA, which handles food distributions while WFP purchases and deliversthe food up to the camp warehouses. WFP and UNHCR continued to provide ARRA with formal trainings andon-the-job orientation, and jointly monitored project implementation at camp level. Except for the nutrition activitiesin some camps and livelihood interventions in a few others (for which WFP has established partnership withinternational and local NGOs), actual project implementation is conducted by ARRA.
WFP also works with UNHCR and ARRA to increase and encourage the involvement of refugees in theimplementation of WFP assisted activities using their own community structures. To achieve this objective, foodmanagement committees (where refugee women and men are equally represented) benefit from variousimplementation capacity enhancing tools like training, regularized pre- and post-distribution meetings and on-the-joborientation. WFP, through its field staff, is represented in all distributions, with the aim of supporting ARRA as wellas the refugee committees. WFP field staff can take timely corrective actions on the spot if problems arise. Inaddition to refugee committees, distribution workers and nutrition outreach workers (all comprised of women)selected from the refugee communities are also part of the capacity development packages.
In addition of on-the-job orientation given through regular joint monitoring, 60 ARRA staff were trained in foodhandling, storage management, monitoring and reporting as well as protection and gender in WFP's assistance.
Inputs
Resource InputsThe PRRO started in April 2015, with requirements for the April-December period. Both the food and cash pipelineswere well resourced through to September. Requirements for cash-based transfers were covered throughout theyear with a contribution from ECHO.
Contributions from the United Kingdom, United States and ECHO enabled the implementation of the first phase ofthe biometrics project.
Rations were reduced for cereals and SuperCereal starting November to ensure resources for critical needs wouldbe available through 2016 despite funding shortfalls.
Donor2015 Resourced (mt) 2015 Shipped/Purchased
(mt)In-Kind Cash
Canada 0 2,860 0
France 0 387 0
Germany 0 1,042 0
Japan 0 6,926 0
MULTILATERAL 0 1,403 32,718
Saudi Arabia 0 44,281 3,537
Switzerland 0 4,254 0
Standard Project Report 2015
Ethiopia, Federal Democratic Republic of (ET) Single Country PRRO - 200700
Donor2015 Resourced (mt) 2015 Shipped/Purchased
(mt)In-Kind Cash
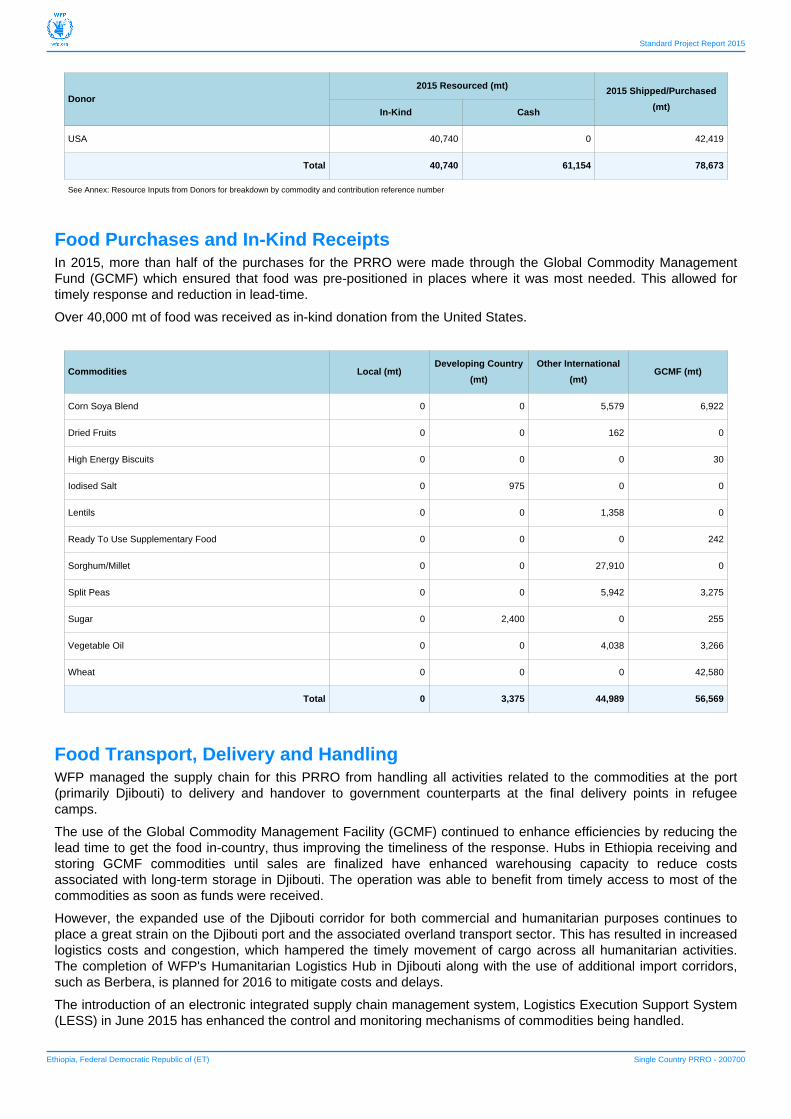
USA 40,740 0 42,419
Total 40,740 61,154 78,673
See Annex: Resource Inputs from Donors for breakdown by commodity and contribution reference number
Food Purchases and In-Kind ReceiptsIn 2015, more than half of the purchases for the PRRO were made through the Global Commodity ManagementFund (GCMF) which ensured that food was pre-positioned in places where it was most needed. This allowed fortimely response and reduction in lead-time.
Over 40,000 mt of food was received as in-kind donation from the United States.
Commodities Local (mt)Developing Country
(mt)
Other International
(mt)GCMF (mt)
Corn Soya Blend 0 0 5,579 6,922
Dried Fruits 0 0 162 0
High Energy Biscuits 0 0 0 30
Iodised Salt 0 975 0 0
Lentils 0 0 1,358 0
Ready To Use Supplementary Food 0 0 0 242
Sorghum/Millet 0 0 27,910 0
Split Peas 0 0 5,942 3,275
Sugar 0 2,400 0 255
Vegetable Oil 0 0 4,038 3,266
Wheat 0 0 0 42,580
Total 0 3,375 44,989 56,569
Food Transport, Delivery and HandlingWFP managed the supply chain for this PRRO from handling all activities related to the commodities at the port(primarily Djibouti) to delivery and handover to government counterparts at the final delivery points in refugeecamps.
The use of the Global Commodity Management Facility (GCMF) continued to enhance efficiencies by reducing thelead time to get the food in-country, thus improving the timeliness of the response. Hubs in Ethiopia receiving andstoring GCMF commodities until sales are finalized have enhanced warehousing capacity to reduce costsassociated with long-term storage in Djibouti. The operation was able to benefit from timely access to most of thecommodities as soon as funds were received.
However, the expanded use of the Djibouti corridor for both commercial and humanitarian purposes continues toplace a great strain on the Djibouti port and the associated overland transport sector. This has resulted in increasedlogistics costs and congestion, which hampered the timely movement of cargo across all humanitarian activities.The completion of WFP's Humanitarian Logistics Hub in Djibouti along with the use of additional import corridors,such as Berbera, is planned for 2016 to mitigate costs and delays.
The introduction of an electronic integrated supply chain management system, Logistics Execution Support System(LESS) in June 2015 has enhanced the control and monitoring mechanisms of commodities being handled.
Standard Project Report 2015
Ethiopia, Federal Democratic Republic of (ET) Single Country PRRO - 200700
Post-Delivery LossesWFP tracked, recovered and reported losses that occurred under WFP's custody, particularly during food storageand transportation. Any losses that occurred during transport were recovered from transporters, but some losseswere also incurred due to overlong storage and infestation. To address these challenges, WFP is assessingdifferent transport and packaging options. In addition, WFP will deliver food more frequently to reduce storage time,and will further improve storage conditions by cementing floors and providing pallets where necessary. Refreshertrainings for store keepers on food handling will also be provided.
Detailed post-delivery loss information will be provided in the Report on Post-Delivery Losses for the Period 1January - 31 December 2015, presented to the WFP Executive Board in June 2016.
Management
PartnershipsUnder the refugee operation, WFP works in close partnership with a number of organizations and agencies thatprovide complementary inputs, knowledge and experience.
The Administration for Refugee and Returnee Affairs (ARRA) is responsible for receiving, storing and distributingWFP food commodities under general distributions and school feeding. ARRA also implements nutrition activities inselected camps (typically where malnutrition rates are below emergency thresholds).
In camps with higher malnutrition rates, all targeted and blanket supplementary feeding programmes (includingones targeting refugees with HIV, TB or other chronic illnesses) were implemented by specialized NGOs such asMédecins Sans Frontières (MSF), Action Contre La Faim (ACF), GOAL, International Mercy Corps (IMC), Concern,and Save the Children International (SCI). NGO partners also participated in the nutrition surveys conducted byUNHCR, WFP and ARRA.
The Norwegian Refugee Council (NRC) worked with WFP under the cash pilot in Adi Arush, Tigray region,managing the distribution and ensuring the purchase of food items for unaccompanied minors from Eritrea living inthe camp. Livelihood activities were implemented in cooperation with NGO partners, who contributed funding,expertise and training on income generating activities, livelihood and environment interventions. WFP has alsoprovided financial and technical assistance to local NGOs such as Organization for Sustainable Developement,Mother and Child Development Organization, and Save the Environment to enhance their capacity in designing andimplementing various livelihood activities.
With Save the Environment, WFP collaborated in the Somali region on income-generating activities such as cattlefattening and bee keeping. In Afar, backyard gardening was also initiated in both Berhale and Assayita camps, inorder to help diversify the refugees' diet. During late 2015, a partnership was also established with Mother and ChildDevelopment Organization at the Jewi Camp in the Gambella Region for the implementation of selected livelihoodactivities.
In addition to the systematic participation of the country office in the United Nations Country Team and high-levelhumanitarian coordination fora, WFP is part of the refugee country team. WFP actively participated in the monthlyrefugee task force in Addis and weekly meetings at field level, in addition to the regular bilateral or trilateralmeetings with UNHCR and ARRA. In addition, WFP participated in all of the main assessments related to foodsecurity and nutrition in the camps.
PartnershipNGO Red Cross and Red
Crescent MovementUN/IO
National International
Total 2 7 1
Standard Project Report 2015
Ethiopia, Federal Democratic Republic of (ET) Single Country PRRO - 200700
Cross-cutting Indicators Project End Target Latest Follow-up
Amount of complementary funds provided to the project by partners (including NGOs, civil society,
private sector organizations, international financial institutions and regional development banks)
>365,000.00 365,464.00ETHIOPIA, Nutrition , Project End Target: 2018.03 , Latest Follow-up: 2015.12
Number of partner organizations that provide complementary inputs and services
=7.00 10.00ETHIOPIA, General Distribution (GD) , Project End Target: 2018.03 , Latest Follow-up: 2015.12
Proportion of project activities implemented with the engagement of complementary partners
=100.00 100.00ETHIOPIA, General Distribution (GD) , Project End Target: 2018.03 , Latest Follow-up: 2015.12
Lessons LearnedAn external evaluation survey and the June 2015 CHS confirmed the need to continue and expand the cash-basedtransfer modality. However, it was noted that the cost-efficiency of the project could be significantly improved bybetter aligning transfer values to prevailing market prices, and by adjusting transfer values across the differentregions.
The CHS provided a better understanding of factors linked to vulnerability and food insecurity, such as the level ofincome, livelihood opportunities present in and around the camps, the number of productive members in thehousehold and family size. These factors will be further explored and researched under a targeting exercise whichwill take place in 2016.
Livelihood activities that provide additional income need to be expanded to support other interventions whichimprove refugees' self-reliance. They also need to grow in scale in order to reach more beneficiaries, both from therefugee camps and the host communities. Discussion with the Tigray Regional Government have started, with aview to developing an ambitious plan for the camps in that region.
In line with this, WFP engaged in discussions with the government and UNHCR, concluding that livelihood activitiessupported by WFP should be linked with the concept of refugees slowly moving out of assistance.
WFP, together with UNHCR, NGOs, and donors, should continue advocating with the Ethiopian Government toidentify opportunities to enhance livelihood options for refugees including through the possibility of formalemployment.
Endnotes[1] Cross-scutting indicators to report results for protection and accountability to affected populations were notpreviously measured disaggregated by gender, therefore no data for base values is in the table.
[2] The outcome indicators under Strategic Objective 1: "Proportion of target population who participate in anadequate number of distributions", and under Strategic Objective 2: "Percentage of targeted households withincreased number of income and food source", as well as "Retention rate (boys) in WFP-assisted primary schools"and "Retention rate (girls) in WFP-assisted primary schools" were measured recently for the first time and no basevalues are available.
Standard Project Report 2015
Ethiopia, Federal Democratic Republic of (ET) Single Country PRRO - 200700
ActivityPlanned Actual % Actual v. Planned
Food CBT Total Food CBT Total Food CBT Total
General Distribution (GD) 130,000 10,800 140,800 115,515 10,985 115,515 88.9% 101.7% 82.0%
School Feeding (on-site) 110,500 - 110,500 48,559 - 48,559 43.9% - 43.9%
Nutrition: Treatment of
Moderate Acute Malnutrition29,300 - 29,300 11,102 - 11,102 37.9% - 37.9%
Nutrition: Prevention of Acute
Malnutrition105,300 - 105,300 106,850 - 106,850 101.5% - 101.5%
Annex: Resource Inputs from Donors
Donor Cont. Ref. No. CommodityResourced in 2015 (mt) Shipped/Purchased in
2015 (mt)In-Kind Cash
Canada CAN-C-00507-05 Corn Soya Blend 0 1,257 0
Canada CAN-C-00507-05 Sugar 0 157 0
Canada CAN-C-00507-05 Wheat 0 1,446 0
France FRA-C-00227-01 Corn Soya Blend 0 250 0
France FRA-C-00227-01 Vegetable Oil 0 137 0
Germany GER-C-00439-01 Corn Soya Blend 0 243 0
Germany GER-C-00439-01Ready To Use
Supplementary Food0 95 0
Germany GER-C-00439-01 Wheat 0 704 0
Japan JPN-C-00365-01 Corn Soya Blend 0 1,000 0
Japan JPN-C-00365-01 Split Peas 0 1,000 0
Japan JPN-C-00365-01 Vegetable Oil 0 600 0
Japan JPN-C-00365-01 Wheat 0 4,326 0
MULTILATERAL MULTILATERAL Corn Soya Blend 0 0 5,606
MULTILATERAL MULTILATERAL High Energy Biscuits 0 0 30
MULTILATERAL MULTILATERALReady To Use
Supplementary Food0 0 147
MULTILATERAL MULTILATERAL Split Peas 0 0 4,287
MULTILATERAL MULTILATERAL Sugar 0 0 301
MULTILATERAL MULTILATERAL Vegetable Oil 0 0 1,848
MULTILATERAL MULTILATERAL Wheat 0 1,403 20,499
Saudi Arabia Iodised Salt 0 0 975
Saudi Arabia SAU-C-00095-07 Dried Fruits 0 0 162
Saudi Arabia SAU-C-00096-02 Corn Soya Blend 0 3,214 0
Saudi Arabia SAU-C-00096-02 High Energy Biscuits 0 30 0
Annex: Participants by Activity and Modality
Operational Statistics
Standard Project Report 2015
Ethiopia, Federal Democratic Republic of (ET) Single Country PRRO - 200700
Donor Cont. Ref. No. CommodityResourced in 2015 (mt) Shipped/Purchased in
2015 (mt)In-Kind Cash
Saudi Arabia SAU-C-00096-02 Iodised Salt 0 975 0
Saudi Arabia SAU-C-00096-02Ready To Use
Supplementary Food0 147 0
Saudi Arabia SAU-C-00096-02 Split Peas 0 2,275 0
Saudi Arabia SAU-C-00096-02 Sugar 0 2,498 2,400
Saudi Arabia SAU-C-00096-02 Vegetable Oil 0 2,332 0
Saudi Arabia SAU-C-00096-02 Wheat 0 32,810 0
Switzerland SWI-C-00420-01 Corn Soya Blend 0 958 0
Switzerland SWI-C-00420-01 Vegetable Oil 0 197 0
Switzerland SWI-C-00481-01 Wheat 0 3,100 0
USA Corn Soya Blend 0 0 2,186
USA Sorghum/Millet 0 0 27,910
USA Split Peas 0 0 2,886
USA Vegetable Oil 0 0 2,988
USA USA-C-01079-01 Corn Soya Blend 0 0 3,393
USA USA-C-01079-01 Split Peas 0 0 3,056
USA USA-C-01079-02 Corn Soya Blend 2,190 0 0
USA USA-C-01079-02 Sorghum/Millet 10,000 0 0
USA USA-C-01079-02 Split Peas 2,890 0 0
USA USA-C-01079-02 Vegetable Oil 2,990 0 0
USA USA-C-01079-04 Corn Soya Blend 2,310 0 0
USA USA-C-01079-04 Lentils 1,400 0 0
USA USA-C-01079-04 Sorghum/Millet 17,910 0 0
USA USA-C-01079-04 Vegetable Oil 1,050 0 0
Total 40,740 61,154 78,673

![DynamicSecurityExchangeSchedulingModelforBusiness ...downloads.hindawi.com/journals/scn/2020/8886640.pdfstandard enterprise operations [2]. Business process occurs at all organizational](https://img.pdfslide.us/doc/110x75/5fe07c7d9582e80bd4222e62/dynamicsecurityexchangeschedulingmodelforbusiness-standard-enterprise-operations.jpg)