Embed Size (px)
Citation preview

Standard Penetration Test measurement variations exposed using a Digital PDM device
Dr Burt G. Look & Dr Julian P. Seidel, Foundation Specialists Pty Ltd, Australia
S. T. Sivakumar & D. L. C. Welikala, Queensland Department of Transport and Main Roads, Australia
International Conference on Geotechnical Engineering, Colombo 2015
Content
SPT circa 1940s
• Counting Blows
• Corrections Required
PDM circa 2010
• Set
• Energy
PDM +SPT
• Test Sites
• Results
Key findings
• Blow count @ 150mm is an estimate and not
“factual”. Seating is not an “exact” 150mm
• University trained supervisors are unable to
count above 20 accurately
• Energy varies
• with ground conditions
• with each blow
• with depth
International Conference on Geotechnical Engineering, Colombo 20152
Judgement Time to decide on blow increment
International Conference on Geotechnical Engineering, Colombo 20153
In carrying out the SPT, typically
- 0.2 seconds for the hammer falling
- < 0.05 second to come to a standstill (temporary compression occurs here),
- < 5 seconds before the next below is delivered
The accuracy of the drilling supervisor’s assessment in that time frame is
examined.
With some automatic hammers the time can be less than 1 second between
blows.
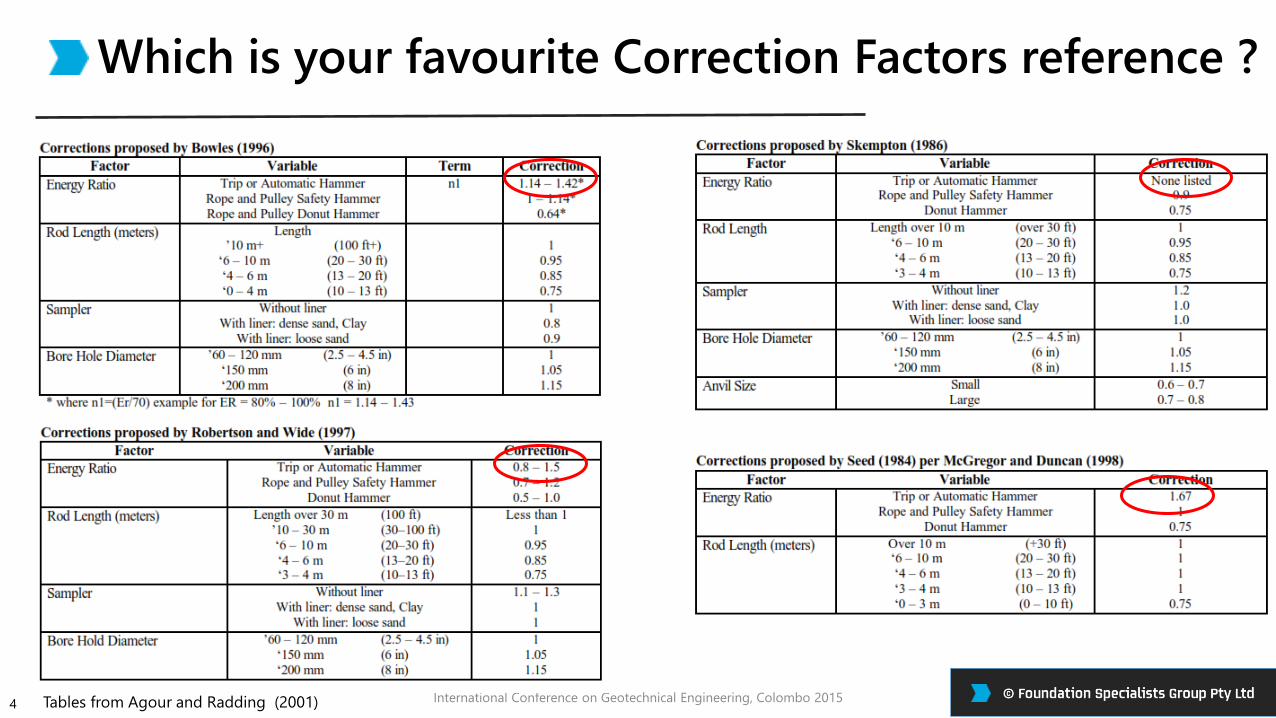
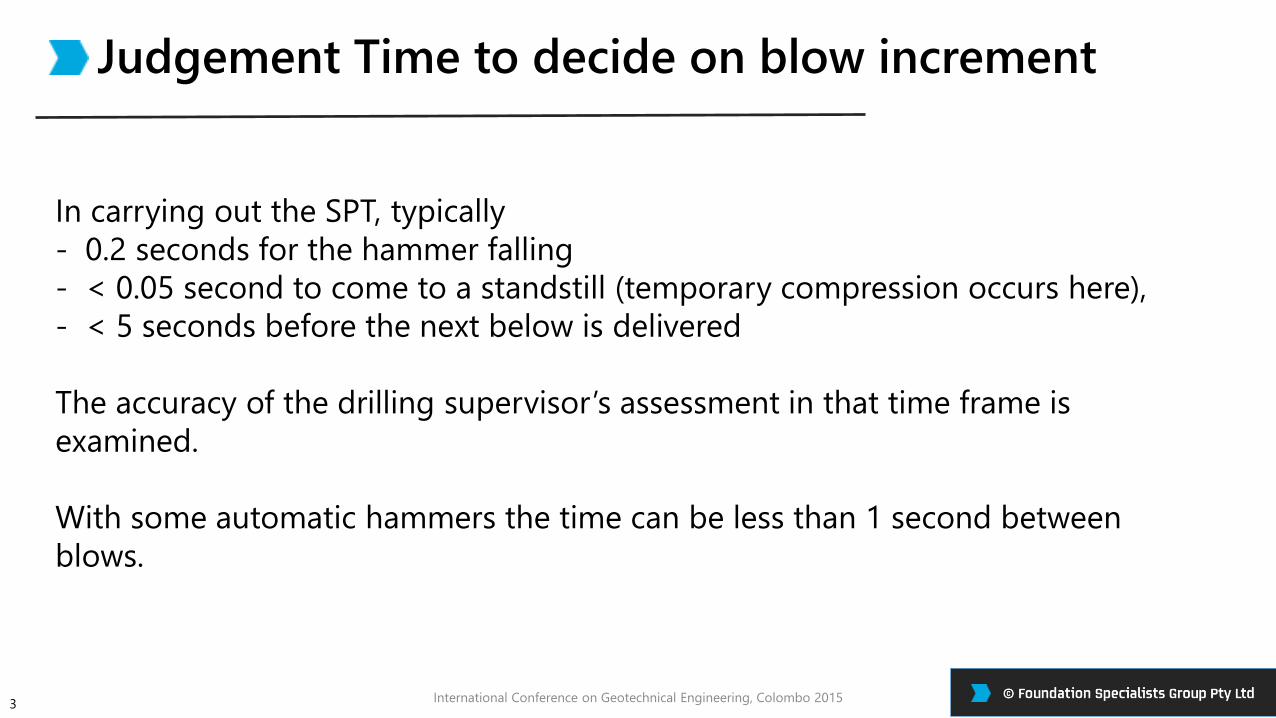
Which is your favourite Correction Factors reference ?
International Conference on Geotechnical Engineering, Colombo 20154 Tables from Agour and Radding (2001)
Hiley Pile Driving Formula
International Conference on Geotechnical Engineering, Colombo 20155
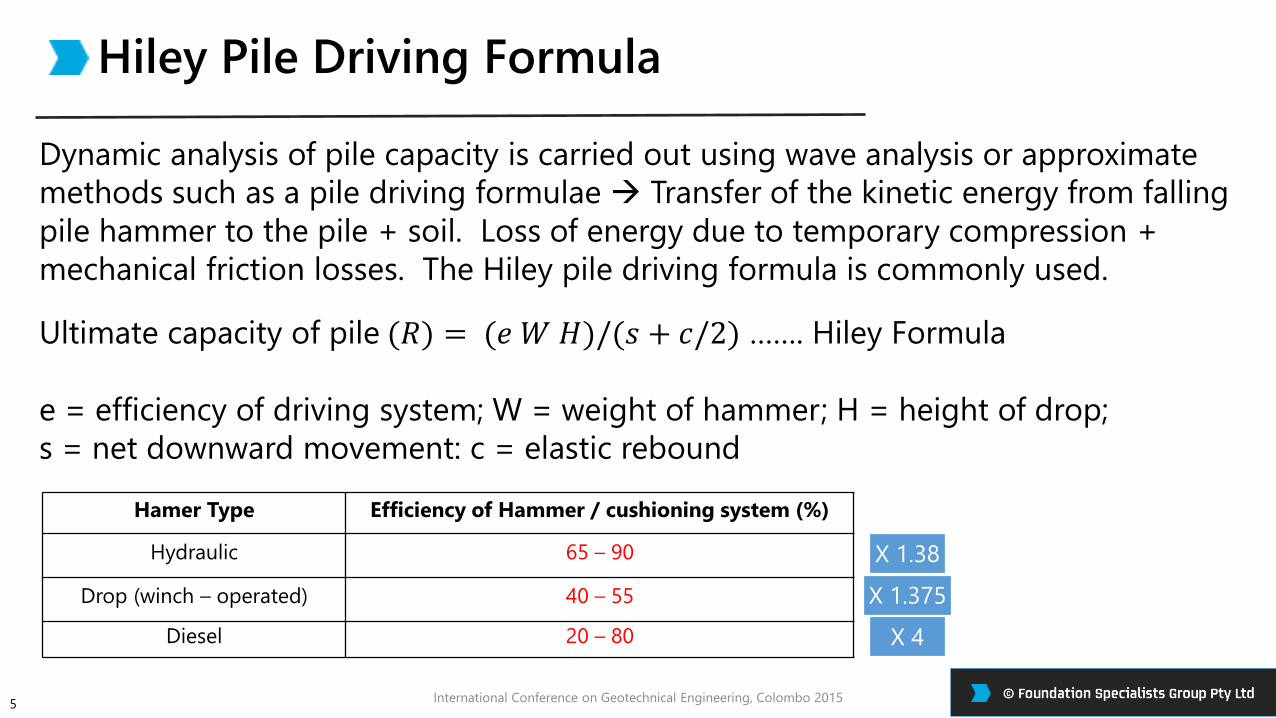
Hamer Type Efficiency of Hammer / cushioning system (%)
Hydraulic 65 – 90
Drop (winch – operated) 40 – 55
Diesel 20 – 80
Ultimate capacity of pile (𝑅) = (𝑒 𝑊 𝐻)/(𝑠 + 𝑐/2) ……. Hiley Formula
e = efficiency of driving system; W = weight of hammer; H = height of drop;
s = net downward movement: c = elastic rebound
Dynamic analysis of pile capacity is carried out using wave analysis or approximate
methods such as a pile driving formulae Transfer of the kinetic energy from falling
pile hammer to the pile + soil. Loss of energy due to temporary compression +
mechanical friction losses. The Hiley pile driving formula is commonly used.
X 1.38
X 1.375
X 4
Traditional Measurement of Set & Rebound
International Conference on Geotechnical Engineering, Colombo 20156
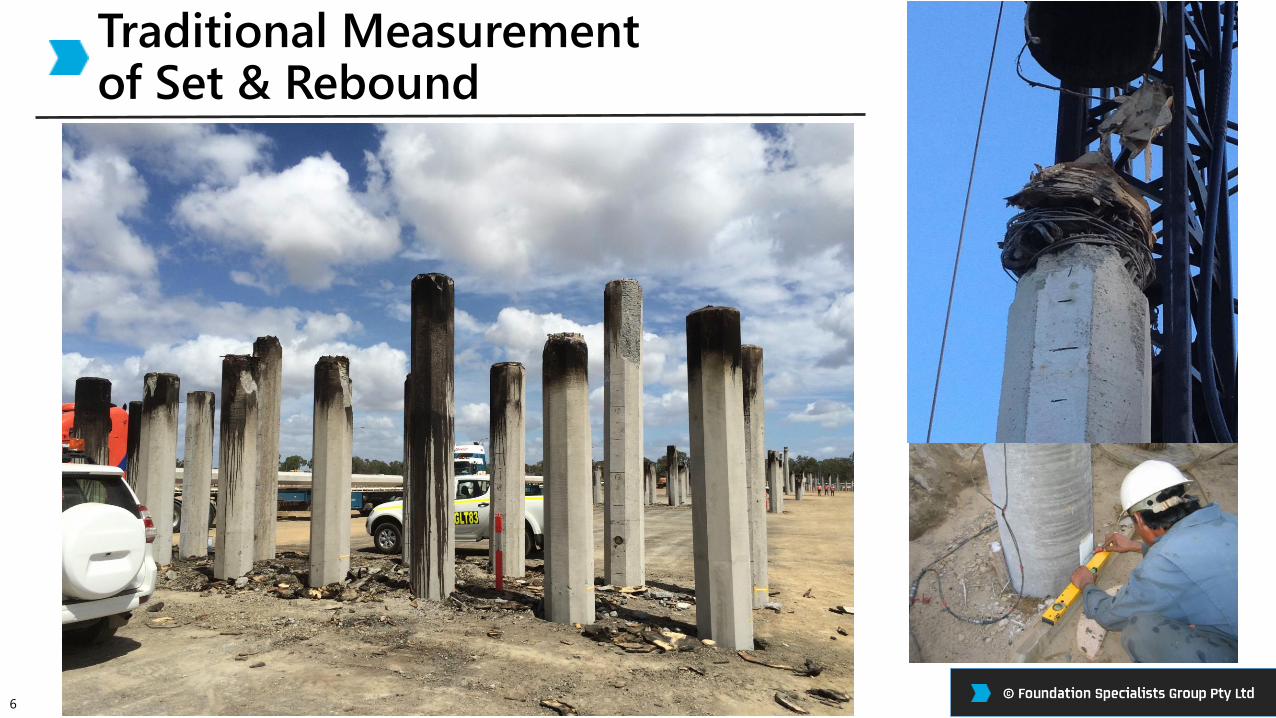
o Traditionally a worker measures set by marking a card attached to the pile during active pile drivingoperations
o The hammer about to drop (not shown) weighs 20T
o The worker is placed in an extremely dangerous environment in the line of falling objects and is in no position to react to events.
Ouch!
PDM Measurement
International Conference on Geotechnical Engineering, Colombo 20157

Introduction – PDM the basics
International Conference on Geotechnical Engineering, Colombo 20158
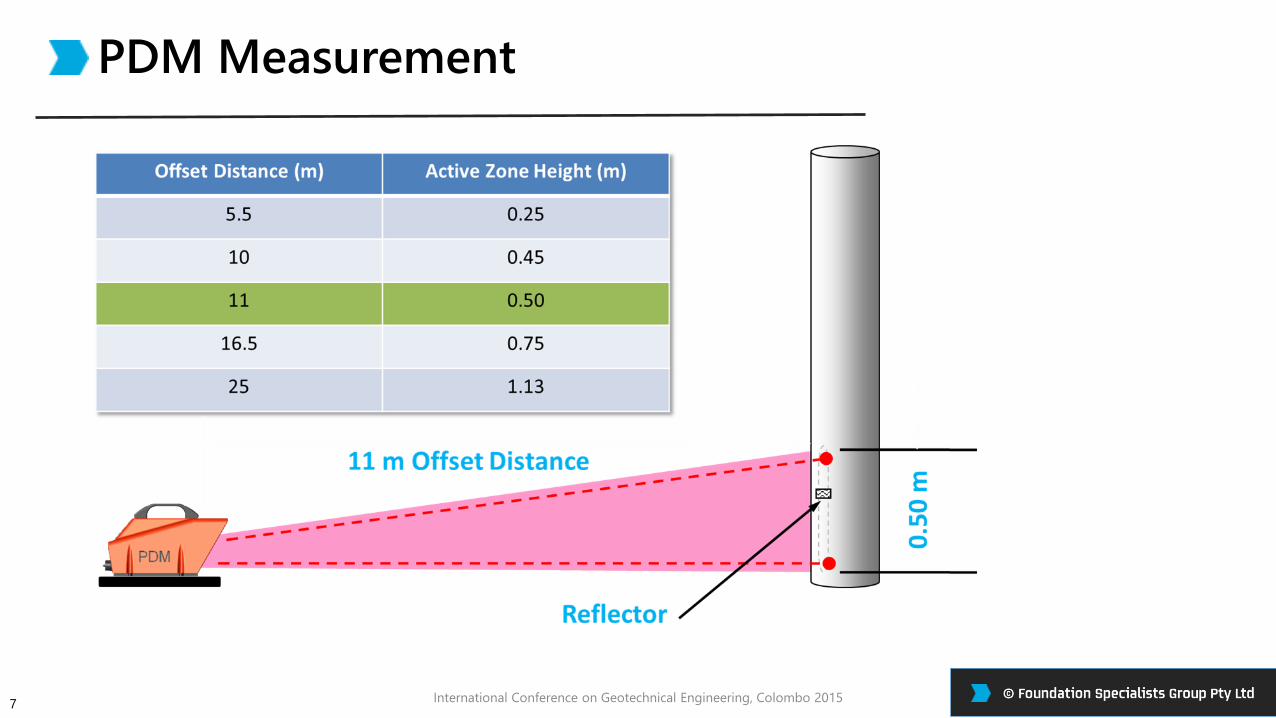
The Pile Driving Monitoring (PDM) is based on LED opto-
electronic technology and measures pile set and temporary
compression by non-contact measurement from a safe
distance. The peak pile velocity can also be calculated.
+ Energy
SPT + PDM measurements
International Conference on Geotechnical Engineering, Colombo 20159
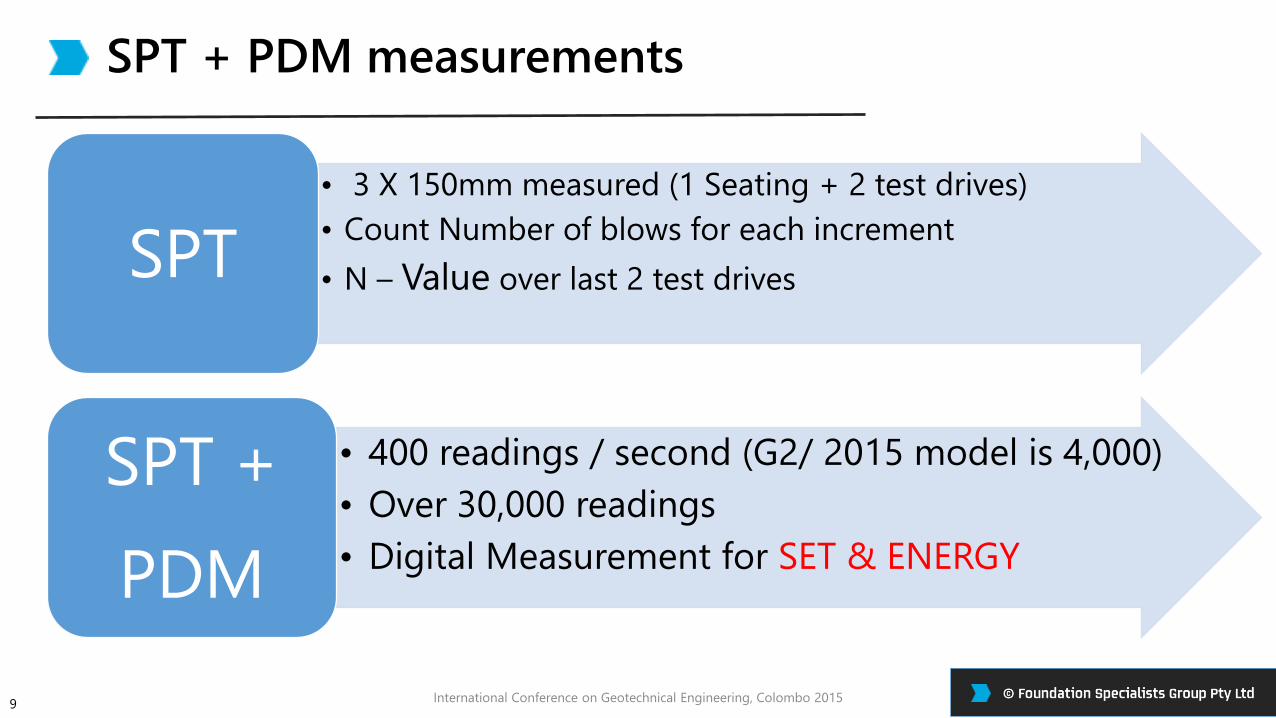
• 3 X 150mm measured (1 Seating + 2 test drives)
• Count Number of blows for each increment
• N – Value over last 2 test drives SPT
• 400 readings / second (G2/ 2015 model is 4,000)
• Over 30,000 readings
• Digital Measurement for SET & ENERGY
SPT +
PDM
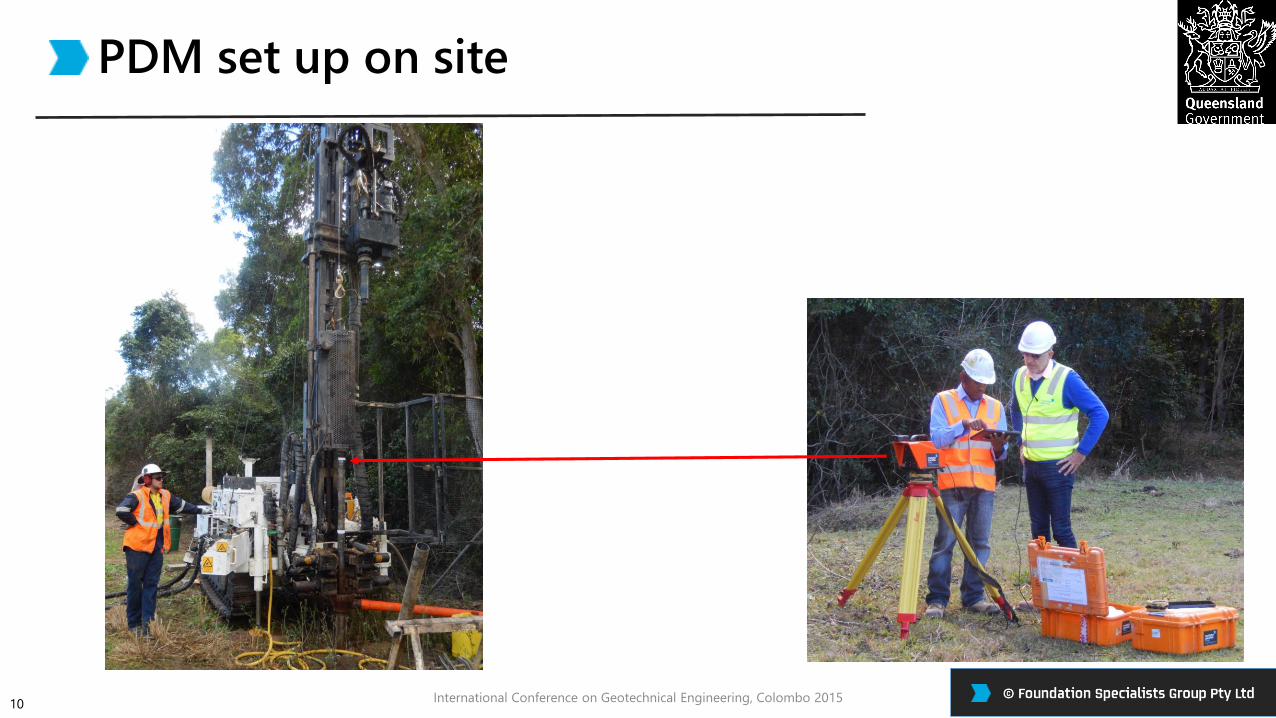
PDM set up on site
International Conference on Geotechnical Engineering, Colombo 201510
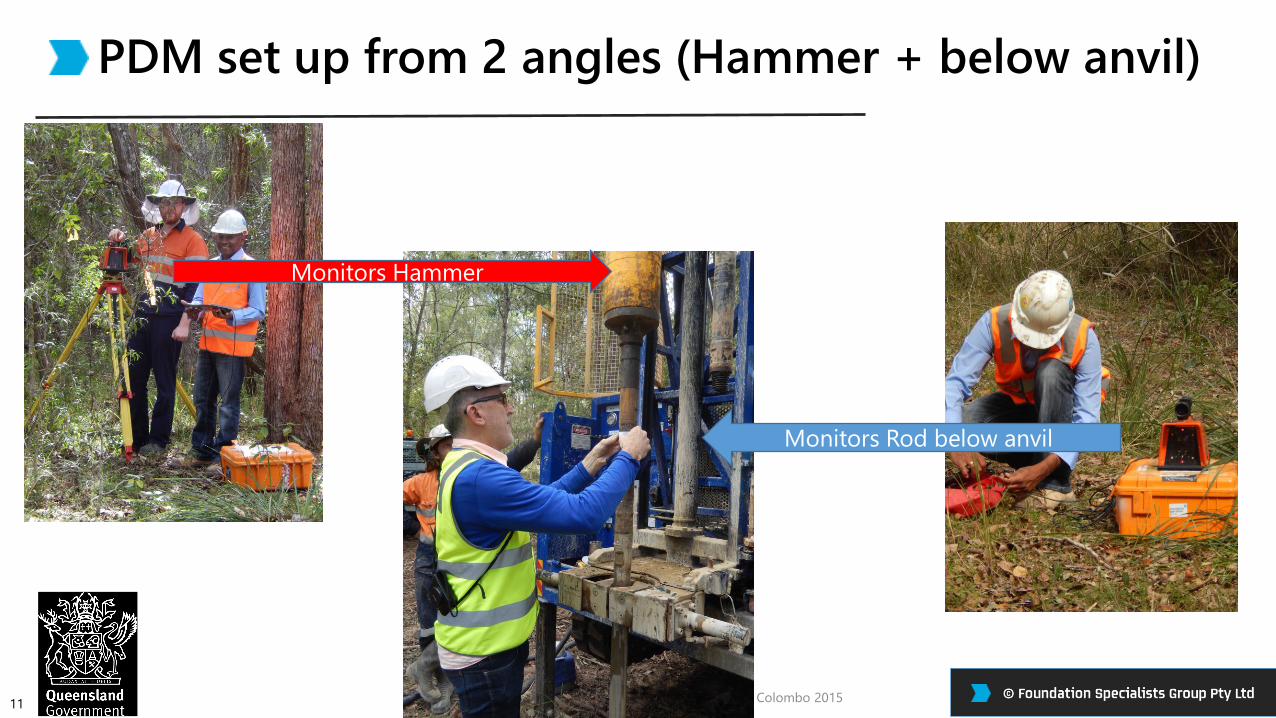
PDM set up from 2 angles (Hammer + below anvil)
International Conference on Geotechnical Engineering, Colombo 2015
Monitors Hammer
Monitors Rod below anvil
11
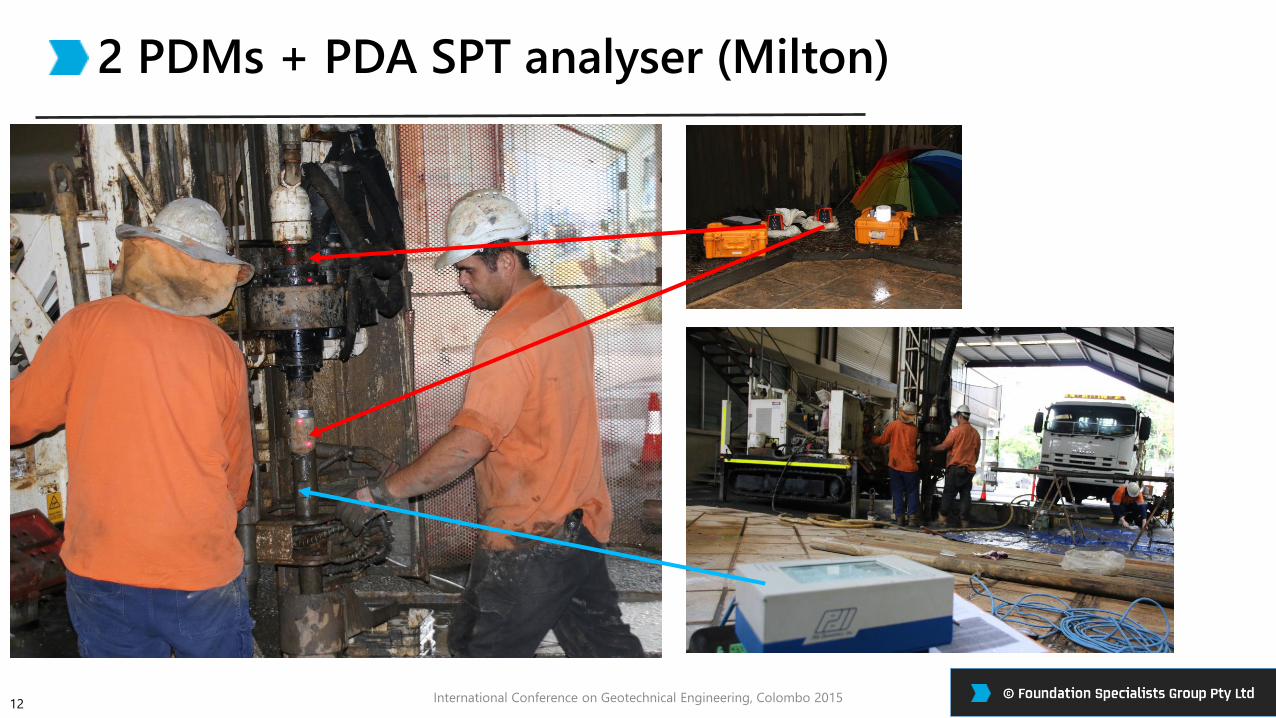
2 PDMs + PDA SPT analyser (Milton)
International Conference on Geotechnical Engineering, Colombo 201512
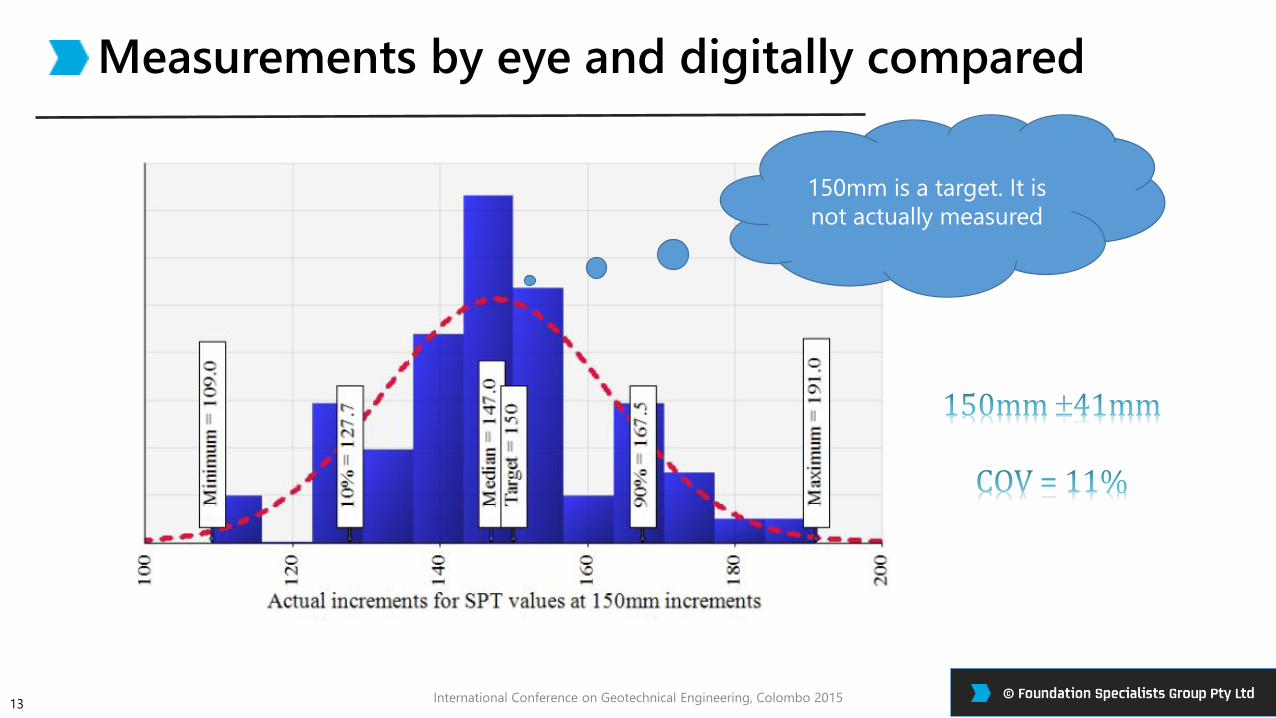
Measurements by eye and digitally compared
International Conference on Geotechnical Engineering, Colombo 201513
150mm is a target. It is
not actually measured

SPT Counting
International Conference on Geotechnical Engineering, Colombo 201514
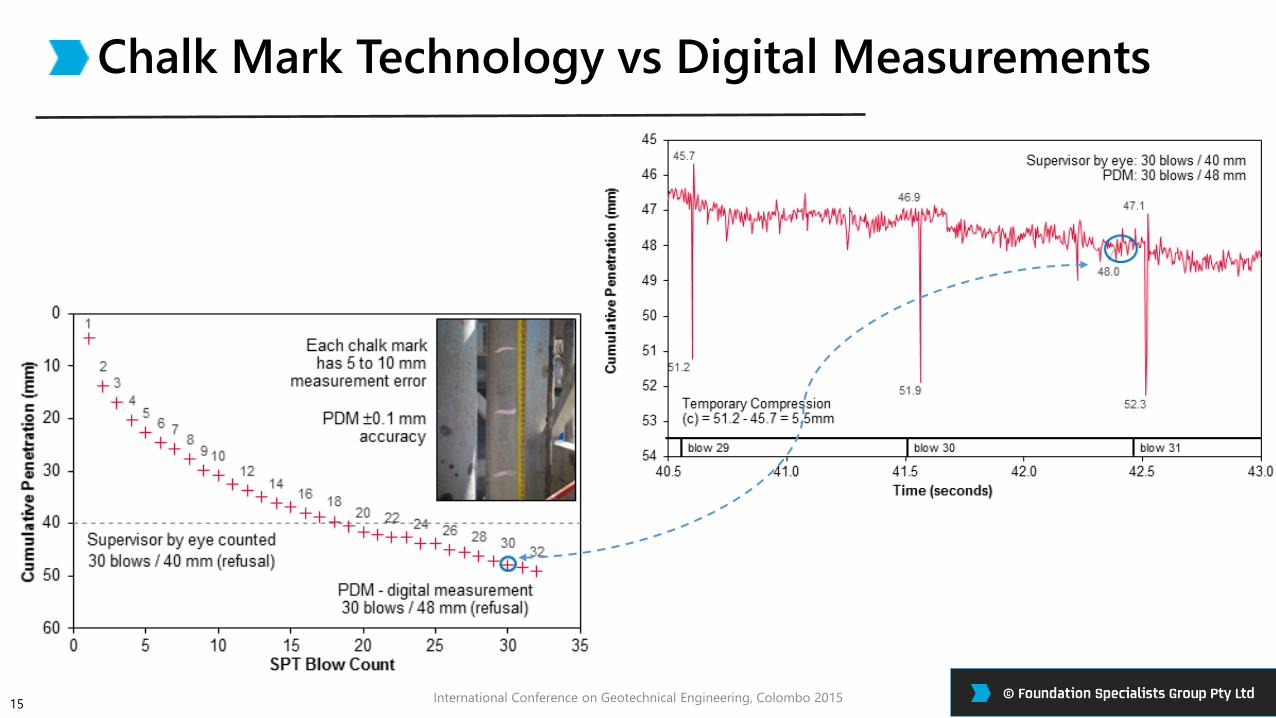
Chalk Mark Technology vs Digital Measurements
International Conference on Geotechnical Engineering, Colombo 201515
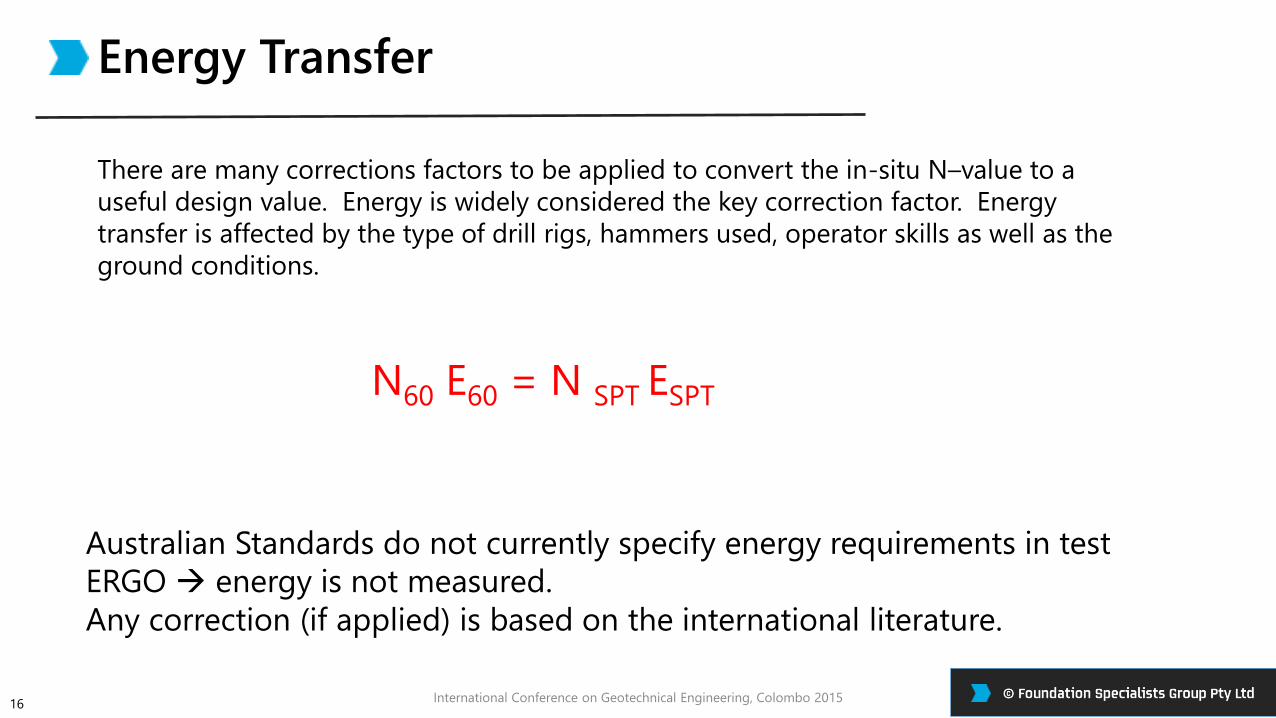
Energy Transfer
International Conference on Geotechnical Engineering, Colombo 201516
N60 E60 = N SPT ESPT
Australian Standards do not currently specify energy requirements in test
ERGO energy is not measured.
Any correction (if applied) is based on the international literature.
There are many corrections factors to be applied to convert the in-situ N–value to a
useful design value. Energy is widely considered the key correction factor. Energy
transfer is affected by the type of drill rigs, hammers used, operator skills as well as the
ground conditions.
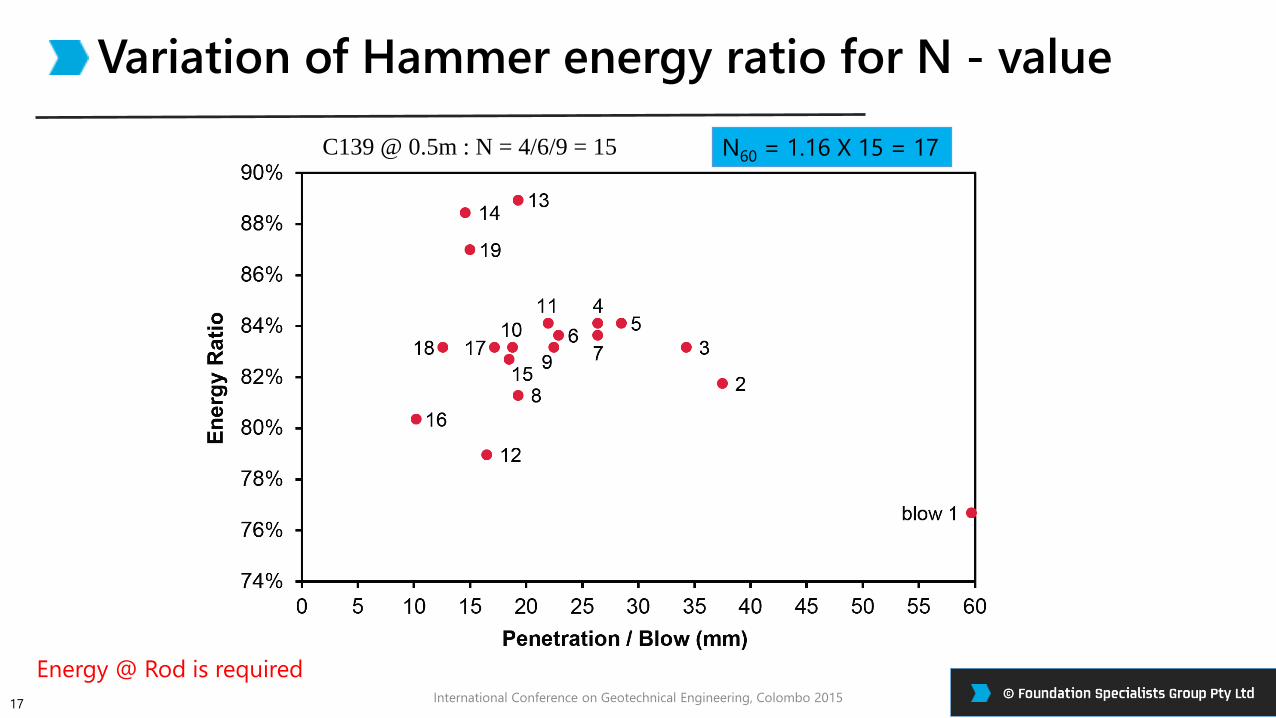
Variation of Hammer energy ratio for N - value
International Conference on Geotechnical Engineering, Colombo 201517
C139 @ 0.5m : N = 4/6/9 = 15 N60 = 1.16 X 15 = 17
Energy @ Rod is required
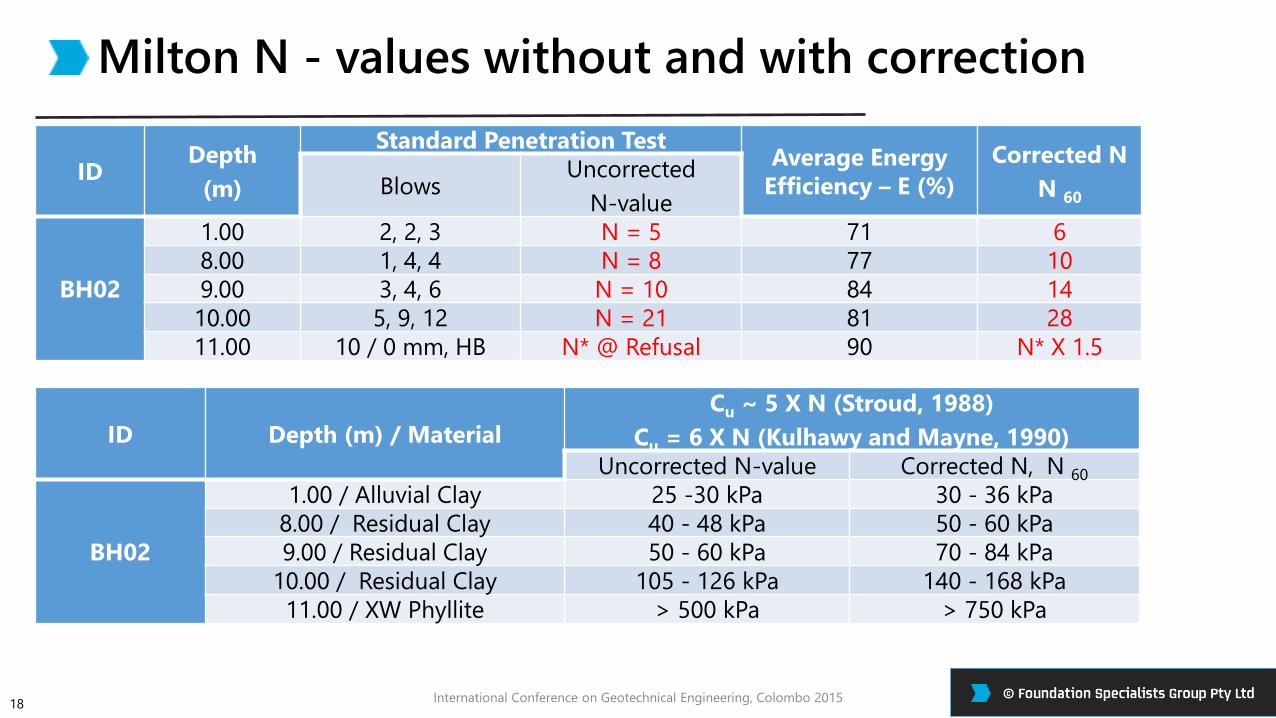
Milton N - values without and with correction
International Conference on Geotechnical Engineering, Colombo 201518
IDDepth
(m)
Standard Penetration TestAverage Energy
Efficiency – E (%)
Corrected N
N 60Blows
Uncorrected
N-value
BH02
1.00 2, 2, 3 N = 5 71 6
8.00 1, 4, 4 N = 8 77 10
9.00 3, 4, 6 N = 10 84 14
10.00 5, 9, 12 N = 21 81 28
11.00 10 / 0 mm, HB N* @ Refusal 90 N* X 1.5
ID Depth (m) / Material
Cu ~ 5 X N (Stroud, 1988)
Cu = 6 X N (Kulhawy and Mayne, 1990)
Uncorrected N-value Corrected N, N 60
BH02
1.00 / Alluvial Clay 25 -30 kPa 30 - 36 kPa
8.00 / Residual Clay 40 - 48 kPa 50 - 60 kPa
9.00 / Residual Clay 50 - 60 kPa 70 - 84 kPa
10.00 / Residual Clay 105 - 126 kPa 140 - 168 kPa
11.00 / XW Phyllite > 500 kPa > 750 kPa
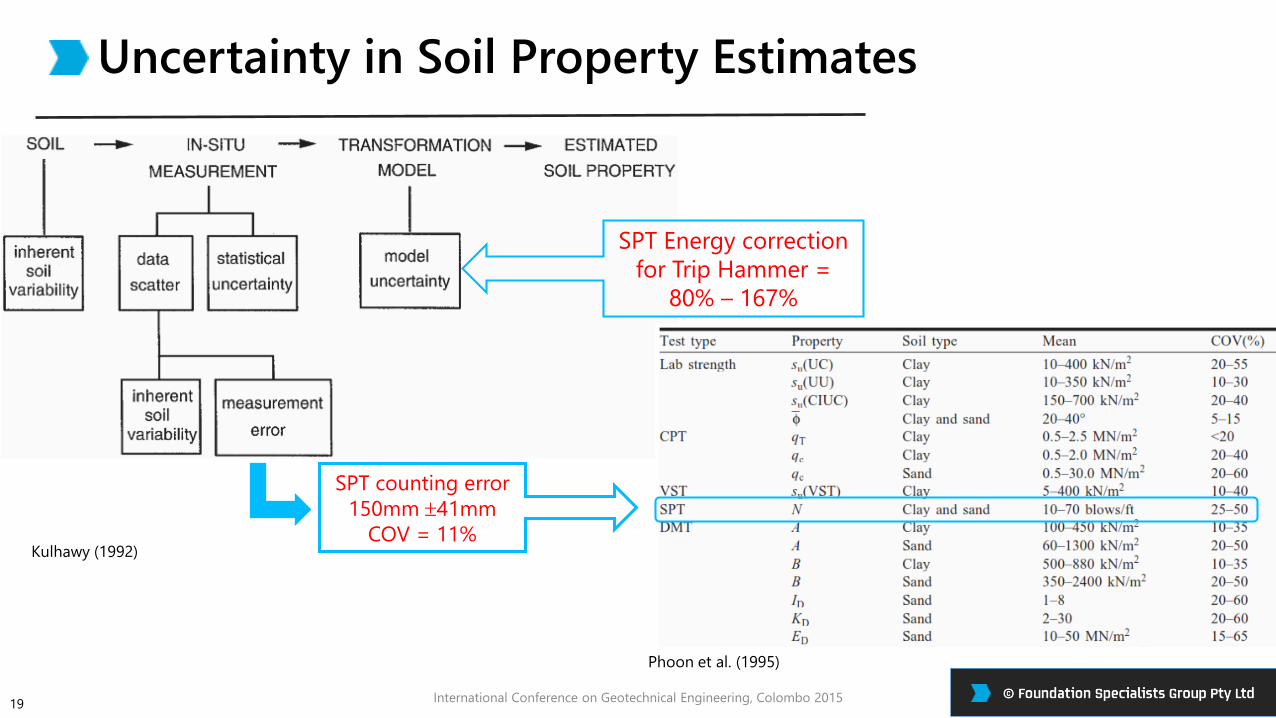
Uncertainty in Soil Property Estimates
International Conference on Geotechnical Engineering, Colombo 201519
Kulhawy (1992)
Phoon et al. (1995)
SPT counting error
150mm 41mm
COV = 11%
SPT Energy correction
for Trip Hammer =
80% – 167%

The Final Word
International Conference on Geotechnical Engineering, Colombo 201520
Perhaps it is time for the ubiquitous SPT (1940s procedure) to
enter the digital age (2010+).
Visually counting values in 150mm increments is shown to vary
and is an “interpretative” number
The field N-Values are useful to show relative change. If Energy is
not measured, the value is questionable as a design value.