Embed Size (px)
Citation preview

NYC-FMJ001-001
Financial Services
Standard of Care HarmonizationImpact Assessment for SEC
October 2010

1NYC-FMJ001-001© 2010 Oliver Wyman www.oliverwyman.com
Contents
1. Executive summary
2. Methodology and source data
3. Background and context
4. Impact on choice
5. Impact on product access
6. Impact on cost to the consumer
Appendix
Case study on impact of MiFID investor protection

NYC-FMJ001-001
Executive summary
Section 1

3NYC-FMJ001-001© 2010 Oliver Wyman www.oliverwyman.com
Summary findings (1)
Oliver Wyman collected data from a broad selection of retail brokerage firms to assess the impact of significant changes to the existing standard of care for broker-dealers and investment advisors– A total of 17 firms provided data– These institutions serve 38.2MM households and manage $6.8TN in client assets – The survey captures approximately 33% of households and 25% of retail financial assets in the US
The primary issue at stake in the SEC ‘standard of care’ study is how to better protect the investor while preserving choice of relationship, product access, and affordability of advisory services
The key insight from the survey is that broker-dealers play a critical role in the financial services industry that cannot be easily replicated with alternative services models
Wholesale adoption of the Investment Advisers Act of 1940 for all brokerage activity is likely to have a negative impact on consumers (particularly smaller investors) across each of the following dimensions– Choice– Product access– Affordability of advisory services
Continued…

4NYC-FMJ001-001© 2010 Oliver Wyman www.oliverwyman.com
Summary findings (2)
Choice
Product Access
Affordability of Advisory Service
Potential impact of rulemaking on retail investors
Reduced access to the preferred ‘investment and advisory model’ for retail investors– 95% of households hold commission-based brokerage accounts today– The fee-based advisory platform is far less popular (only 5% of households)– The ‘preference’ for brokerage accounts is evident across all wealth segments but
strongest for smaller investors with less than $250K in assets
Reduced access to products distributed primarily through broker-dealers– Municipal and corporate bonds represent ~15% of assets held by retail investors– These products (among others) are generally offered on a ‘principal basis’– Restricting principal or proprietary offerings will limit investor access to these products
and possibly limit financing options for municipalities or corporates at current pricing
Reduced access to the most affordable investment options– Fee-based services are 23-37 bps more expensive than brokerage1
– For an investor with $200K in assets, this translates to $460 in additional fees– The cost of shifting to fee-based pricing alone would reduce expected returns by
more than $20K over a 20 year horizon (assuming 5% annual returns)
And the indirect costs of additional compliance, disclosure, and surveillance may have an even greater impact on consumers → we estimate that 12-17MM small investors ‘at the margin’ could lose access to current levels of advisory service if even 2 additional hours of coverage and support is required per client
1. Cost expressed as a percentage of assets under management in basis points (1bp = 0.01%)

NYC-FMJ001-001
Methodology and source data
Section 2

6NYC-FMJ001-001© 2010 Oliver Wyman www.oliverwyman.com
Oliver Wyman collected data from 17 SIFMA member firms to support the impact assessment
Purpose of study
The impact assessment that follows was designed in response to the SEC request for comment on the upcoming study of the standard of care obligations for broker-dealers and investment advisers
Oliver Wyman gathered data from 17 SIFMA member firms to provide relevant market data for the SEC study
The study is intended to help – Identify the investor segments most likely to be affected by changes to the standard of care– Understand the cost to the consumer (choice, product access, transaction costs) of potential changes – Understand the one-time and ongoing costs of compliance for advisory and brokerage firms– Estimate the broader market / economic impact of any changes, particularly for capital formation
Note on survey methodology
17 member firms participated, representing $6.8TN in assets (approximately 27% of total U.S. household financial assets) across 38.2MM households
To obtain a fairly representative sample of the industry, data on asset management accounts, investor profiles, and cost structure was gathered from a diverse set of brokerage firms
Note on confidentiality
Due to the highly sensitive nature of firm-specific information, all data is presented in aggregated form

7NYC-FMJ001-001© 2010 Oliver Wyman www.oliverwyman.com
1-5MM
85% 86%
11% 11%3% 3%
Economic data SIFMA data
The survey proved to be highly representative of the investor population as a whole, capturing 33% of households and 27% of financial assets
16% 20%
24%28%
30%26%
30% 26%
Economic data SIFMA data
Investors by wealth segment1
Number of U.S. households, 2009Assets by wealth segmentInvestable assets, 2009
< 250K
< 250K
250K-1MM
250K-1MM
1-5MM
> 5MM
> 5MM38MM116MM $26.0TN $6.8TN100% =
Note: Economic data includes all investable assets whereas SIFMA data refers to managed assets, SIFMA data skews toward investors with <$1MM in assets
1. Wealth segments based on client assets under managementSource: SIFMA member data, 2007 Federal Reserve Survey of Consumer Finances, Oliver Wyman analysis

NYC-FMJ001-001
Background and context
Section 3

9NYC-FMJ001-001© 2010 Oliver Wyman www.oliverwyman.com
Regulators have wide discretion in establishing a uniform ‘standard of care’ for the IABD industry
Regulators have a range of options in establishing a uniform ‘standard of care’ for broker-dealers and investment advisers in the United States – Limited changes to current model – A ‘standard of care’ with disclosure / consent to conflicts that preserves commission-based brokerage– Wholesale adoption of the Advisers Act of 1940 for all broker-dealers and investment advisers
A major shift in the ‘standard of care’ will impact individual investors in several ways– Choice of advisory model– Access to investment products– Cost of investment and advisory services
Beyond these direct costs to the consumer, we also anticipate broader economic costs to the industry as a whole– Broker-dealers and investment advisory firms will all face one-time and ongoing costs to comply with new
fiduciary, disclosure, and surveillance requirements → these may be passed on to investors– Potential limitations on product accessibility for retail investors will place constraints on capital formation and
issuers’ ability to finance at attractive rates

10NYC-FMJ001-001© 2010 Oliver Wyman www.oliverwyman.com
Our analysis will focus on the relative impact of two possible scenarios for harmonization of the standard of care
Solely in the interest of the client
Best interest of the client or solely in the interest of the client, depending on relationship
Best interest of the client (advisory services) or suitability (brokerage services)
IRA / retirement accounts
Trade-by-trade prior consent required
Best interest of the client with disclosure / consent to conflicts
Best interest of the client (advisory services) or suitability (brokerage services)
Principal transactions
Not available Best interest of the client with disclosure / consent to conflicts
Best interest of the client (advisory services) or suitability (brokerage services)
Proprietary product sales
Best interest of the client Best interest of the client, at point of sale or ongoing depending on relationship
Best interest of the client (advisory services) or suitability (brokerage services)
Advice on client holdings
Best interest of the client Best interest of the client with disclosure / consent to conflicts
Suitability for resultant securities transactions
Asset allocation advice
Best interest of the client Best interest of the client with disclosure / consent to conflicts
Suitability for resultant securities transactions
Investment planning
ActivitySTATUS QUO WITH GREATER DISCLOSUREHarmonized standards that preserve existing practices but require greater disclosure
FIDUCIARY DUTY WITH CONSENT TO CONFLICTSFiduciary standard for advisory activity that preserves commission-based brokerage model
ADOPTION OF ADVISERS ACT OF 1940Fiduciary standard for advisory activity with fees based on assets under management
Rule making scenarios
Baseline for impact analysis

NYC-FMJ001-001
Impact on choice
Section 4

12NYC-FMJ001-001© 2010 Oliver Wyman www.oliverwyman.com
32.8
4.2
1.00.1
0
5
10
15
20
25
30
35
< 250K 250K-1MM 1MM-5MM > 5MM
Hou
seho
lds
(MM
)The vast majority (97%) of the US investor population holds less than $1MM in assets with a broker-dealer or investment adviser
Investor landscape (survey population)Number of investors by wealth segment1, 2009
97% of investors in the survey (37.0MM) hold less than $1MM in assets with broker-dealers or investment advisers
Despite the heavy skew toward small clients, total assets are evenly distributed across the wealth spectrum ($1.3-1.9TN in all groups)
Average account balance for investors in the lowest wealth segment is $40K → this is the segment most likely to be affected by a significant increase in costs
Key observations
Client assets under management
$1.3TN $1.9TN $1.8TN $1.8TN
1. Wealth segments based on client assets under managementSource: SIFMA member data, 2007 Federal Reserve Survey of Consumer Finances, Oliver Wyman analysis
86% of investorsAverage account balance $40K
11% of investorsAverage account balance $456K

13NYC-FMJ001-001© 2010 Oliver Wyman www.oliverwyman.com
Across wealth segments, less than 5% of investors use fee-based accounts alone to serve their investment needs
92%
73%64%
3%
8%
3%
4%
19%
33%
< 250K 250K-1MM > 1MM
Channel preference (survey population)Number of households by relationship model, 2009
Source: SIFMA member data, 2007 Federal Reserve Survey of Consumer Finances, Oliver Wyman analysis
1
3
As wealth increases, more investors use a hybrid model of fees and commissions-based management
Mix of commission- and fee-based accounts
Only 1.3MM investors (4% of total) hold AUM solely under fee-based management
Fees-only management is the least common channel across all wealth segments
Over 30MM households hold assets solely in commission-based accounts; 27MM of these are from the lowest wealth segment
Investors in the lowest wealth segment have a much stronger skew towards commissions-only management than any other wealth segment
2 Fee-based accounts
Commission-based accounts

14NYC-FMJ001-001© 2010 Oliver Wyman www.oliverwyman.com
The current model offers investors a wide range of advisory service, product access, and pricing options
Lowest cost, depending on trading activity
Predominantly lower net worth investors
All investors Affluent and HNW Affluent and HNWCommon investors
Limited service Balanced → point in time advice on specific products
Highest → ongoing advice and account surveillance
Highest → ongoing advice and account surveillance
Level of service
Balanced cost Range = 38-94 bps2
Balanced cost Range = 43-99 bps2
Highest cost Range = 67-117 bps2
Cost
All investable assets Cash and equivalents
Investable assets Cash and equivalents Concentrated positions
with special requirements
Investable assets Cash and equivalents Concentrated positions
with special requirements
Investable assets onlyTypical holdings
Combination of active and passive, depending on client choice
Combination of active and passive, depending on client choice
Active investment Combination of active and passive, depending on client needs
Investment activity
Uncertain Product-specific advice, access to principal products
Broad, portfolio-based financial planning and investment advice plusproduct-specific advice
Broad, portfolio-based financial planning and investment advice
Advisory needs
7%4%Share of population
Key AttributesFee-Based Fees and
CommissionsCommission-Based
Advised
Account Types
Commission-Based1
Non-Advised
88%
1. Non-advised accounts (e.g. self-directed online) were not targeted in this study but represent a significant subset of commission-based accounts2. Range dependent on wealth segment (high end of the range reflects pricing for lowest wealth segment)

NYC-FMJ001-001
Impact on product access
Section 5

16NYC-FMJ001-001© 2010 Oliver Wyman www.oliverwyman.com
< 250K 250K-1MM 1MM-5MM > 5MM
Direct holdings of individual securities (such as municipal bonds) represent an important element of investment strategy across all wealth segments
Asset allocation (survey population)Allocation of assets (%) by wealth segment, 2009
Investors across all wealth segments have at least 30% of their portfolio in direct holdings of individual securities
Municipal and corporate bonds offer tax and diversification benefits that investors may be unable to access via funds
Across all investors, municipal and corporate bonds represent 13% of total wealth and 18% of invested assets (excluding cash)
Allocations to municipal and corporate bonds range from 7% of investable assets for low net worth accounts to as high as 26% for high net worth accounts
Key observations
Cash and other1
Structured productsAlternatives
Mutual Funds / ETFs
Municipal Bonds
Government Bonds
Corporate Bonds
Equities
1. Includes cash, currencies, money market funds, etcSource: SIFMA member data, Oliver Wyman analysis
$1.3TN $1.9TN $1.8TN $1.8TN100% =

17NYC-FMJ001-001© 2010 Oliver Wyman www.oliverwyman.com
Commission Fee
Commission-based brokerage is the primary channel for accessing these products today, especially for investors in the lowest wealth segment
Low Net worth investors (<250K AUM)Product access by account type2
High Net Worth Investors (>5MM AUM)Product access by account type
1. Cash and other includes cash, currencies, money market funds, etc.2. Non-discretionary, commission accounts and discretionary, fee accountsSource: SIFMA member data, Oliver Wyman analysis
$1,100BN
$115BN
$1,400BN
$260BN
Cash and other1
Structured productsAlternatives
Mutual Funds / ETFs
Municipal Bonds
Government Bonds
Corporate Bonds
Equities
Commission Fee
$58BN
$100BN
93% of municipal and corporate bonds held by investors in the lowest net worth segment ($58BN) were purchased through commission-based brokerage accounts
77% of municipal and corporate bonds held by high net worth investors ($100BN) were purchased through commission-based brokerage accounts

18NYC-FMJ001-001© 2010 Oliver Wyman www.oliverwyman.com
Individual investors hold 70% of municipal debt in the US today, both through direct and pooled investments
0.7 0.8 0.9 0.9 0.9 1.0 1.0
0.70.7 0.8
0.9 1.01.0 1.0
0.60.7
0.70.8 0.8
0.8 0.9
0.0
0.5
1.0
1.5
2.0
2.5
3.0
2004 2005 2006 2007 2008 2009 2010ytd
2.02.2
2.42.6 2.7
2.8 2.8
All other1
Individualholdings
34%35%36%36%34%33%34%Indirect
36%36%34%34%36%37%37%Direct
Individual holdings (% of total outstanding)
Investor demand for Municipal SecuritiesHoldings of Municipal Securities by segment, $TN
1. Other sectors include corporates, financial institutions, broker-dealers, and foreign entitiesSource: Federal Reserve
The municipal securities market has grown steadily over the past several years and now provides nearly $3TN in financing for state and local governments
Municipalities in the U.S. have issued ~$400BN debt annually over the past five years through these instruments
The market is dominated by individual investors who hold ~ 70% of outstanding debt, split across direct exposures and pooled investments
Financial institutions are relatively minor players in the space, collectively holding less than 30% of total assets (including broker-dealer inventories)
A significant shift in the ‘standard of care’ required for origination and distribution of investments sold on a principal basis (as Munis are) could have a significant market impact along 2 dimensions
– Access and cost for retail investors– Low cost financing for municipalities
Key observations
Pooledinvestments
Municipal bond market

19NYC-FMJ001-001© 2010 Oliver Wyman www.oliverwyman.com
Transaction costs are built into the ‘discount’ or underwriting fees paid by the issuer
Investors have access to securities with no explicit mark-up during limited retail order periods
Securities trade on the secondary market and prices fluctuate to reflect supply and demand
Investors have access to securities through broker-dealers who act as principals and build inventory (mark-up paid by investors)
Securities are bought and sold by broker-dealers on behalf of pooled investment funds
Investors pay the funds’ asset management / advisory fees in addition to transaction costs / sales loads passed on by the fund
Broker-dealers play a key role in the Munis market, providing individual investors with direct and cost effective access to new issuances of these securities
Primary market
Secondary market
Pooled investment funds
Ret
ail I
nves
tors
Channels
Municipal bond market
Direct, affordable access to municipal bonds for retail investors via primary and secondary principal trading desks → mutual funds are an alternative channel to Munis but at higher cost as management fees erode returns (~1% management fees vs. 4-5% average yield)
Role of the broker-dealer

20NYC-FMJ001-001© 2010 Oliver Wyman www.oliverwyman.com
Individual investors are also important participants in the corporate bond market
1.3 1.6 2.0 1.9 2.3 2.11.4 1.5
1.82.0 2.0
2.1 2.2
5.35.8
6.5
7.4 7.17.1 7.1
1.10.0
2.0
4.0
6.0
8.0
10.0
12.0
2004 2005 2006 2007 2008 2009 2010ytd
7.98.9
10.0
11.4 11.011.4 11.4
All other1
Individualholdings
Investor demand for Corporate and Foreign BondsHoldings of Corporate and Foreign Securities by segment, $TN
1. Other sectors include corporates, financial institutions, broker-dealers, and foreign entitiesSource: Federal Reserve
Key observations
Pooledinvestments
Corporations and foreign entities rapidly increased issuance of new debt between 2004-2007 and have maintained annual new bond issuance of ~ $11TN since the financial crisis
Individual investors (via direct holdings or pooled investments) are the largest single class of investor in the corporate and foreign bond market
Individual investors hold $4.3TN or nearly 40% of outstanding debt today
In absolute terms, individual investors’ share of the corporate securities market is larger than municipal securities
Capital formation for US corporates is driven in large part by individual investment
19%18%18%18%18%17%18%Indirect
18%20%18%18%16%15%14%Direct
Individual holdings (% of total outstanding)
Corporate bond market

21NYC-FMJ001-001© 2010 Oliver Wyman www.oliverwyman.com
Broker-dealers anticipate retail demand for corporate bonds and hold inventory to quickly, efficiently, and cost effectively meet client needs in the secondary market
Corporate bond market
Predominantly institutional market Retail investors have little to no access to primary issuance
Primarily over-the-counter market → broker-dealers provide main point of access for retail investors to these securities
Investors pay upfront mark-ups but no ongoing management fees that are likely to erode returns
Securities are bought and sold by broker-dealers on behalf of pooled investment funds
Investors pay the funds’ asset management / advisory fees in addition to transaction costs / sales loads passed on by the fund
Primary market
Secondary market
Pooled investment funds
Ret
ail I
nves
tors
Channels
Direct, affordable access to corporate bonds for retail investors via secondary principal trading desks → principal traders anticipate retail demand and build inventory that meets specific investment needs of clients
Role of the broker-dealer

NYC-FMJ001-001
Impact on cost
Section 6

23NYC-FMJ001-001© 2010 Oliver Wyman www.oliverwyman.com
We have profiled three typical investors within each wealth segment to evaluate the potential costs of broad application of the Advisers Act of 19401
$500K in assets held in commission-based accounts Active investor with more than 10 trades per year (~75% of investors in $250K-1MM segment) Pays 53 bps or $2,650 in commissions per year Holds $292K (59% of assets) in mutual funds and cash / cash equivalents Holds $117.5K (23% of assets) in equities Hold $90.5K (18% of assets) in fixed income, structured products and alternatives
$10MM in assets held in commission-based accounts Active investor with more than 10 trades per year (~75% of investors in >$1MM segment) Pays 38 bps or $38,000 in commissions per year Mutual funds and cash / cash equivalents together are $4.1MM (41% of assets) Equities are largest part of portfolio, with $3.3MM invested (33% of assets) Fixed income, structured products and alternatives represent $2.6MM (26% of assets)
$200K in assets held exclusively in commission-based accounts Passive investor with less than 10 trades per year (~50% of investors in <$250K segment) Pays 94 bps or $1,890 in commissions per year Holds $132K (68% of assets) in mutual funds and cash / cash equivalents Significant direct holdings (31% of assets), mainly in equities Limited investments in alternatives, fixed income, and structured products
‘Small Investor’ with commission-based
accounts
77% of all investors
‘Affluent Investor’ with commission-based
accounts
7% of all investors
‘High Net Worth Investor’with commission-based
accounts
2% of all investors
1. Asset allocation based on observed average asset allocation for each wealth segmentSource: SIFMA member data, Oliver Wyman analysis
A
B
C

24NYC-FMJ001-001© 2010 Oliver Wyman www.oliverwyman.com
325
2,240
7,335
50,030
0
5,000
10,000
15,000
20,000
< 250K 250K-1MM 1MM-5MM > 5MM
Commission-based accounts provide the most cost effective option for investors across the wealth spectrum today
Financial cost to consumerAverage annual fees and commissions, 2009
1. Based on existing balance of assets between fee-based and commission-based accountsSource: SIFMA member data, Oliver Wyman analysis
0.00%
0.20%
0.40%
0.60%
0.80%
1.00%
1.20%
<250K 250K-1MM 1MM-5MM >5MM
Commissions
Fees
Average annual fees and commissions as % of AUM, 2009
Fees + Commissions1
Δ23 bp
Δ37 bp
A
B
Δ29 bp
C
25NYC-FMJ001-001© 2010 Oliver Wyman www.oliverwyman.com
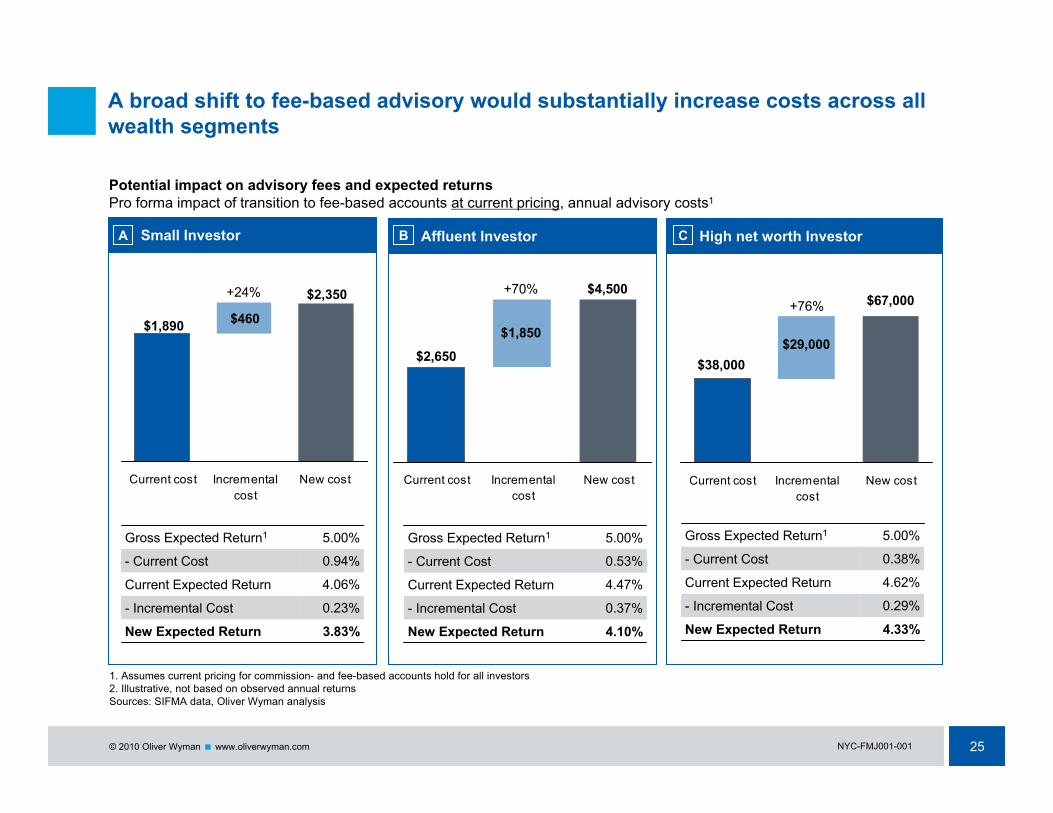
A broad shift to fee-based advisory would substantially increase costs across all wealth segments
Current cost Incrementalcost
New cost Current cost Incrementalcost
New cost Current cost Incrementalcost
New cost
1. Assumes current pricing for commission- and fee-based accounts hold for all investors2. Illustrative, not based on observed annual returnsSources: SIFMA data, Oliver Wyman analysis
0.23%- Incremental Cost
4.06%Current Expected Return
3.83%New Expected Return
0.94%- Current Cost
5.00%Gross Expected Return1
Potential impact on advisory fees and expected returnsPro forma impact of transition to fee-based accounts at current pricing, annual advisory costs1
Small Investor Affluent Investor High net worth Investor
$2,650
$4,500
$38,000
$67,000
$1,850$29,000
$1,890
$2,350
$460
0.37%- Incremental Cost
4.47%Current Expected Return
4.10%New Expected Return
0.53%- Current Cost
5.00%Gross Expected Return1
0.29%- Incremental Cost
4.62%Current Expected Return
4.33%New Expected Return
0.38%- Current Cost
5.00%Gross Expected Return1
+76%+70%+24%
A B C
26NYC-FMJ001-001© 2010 Oliver Wyman www.oliverwyman.com
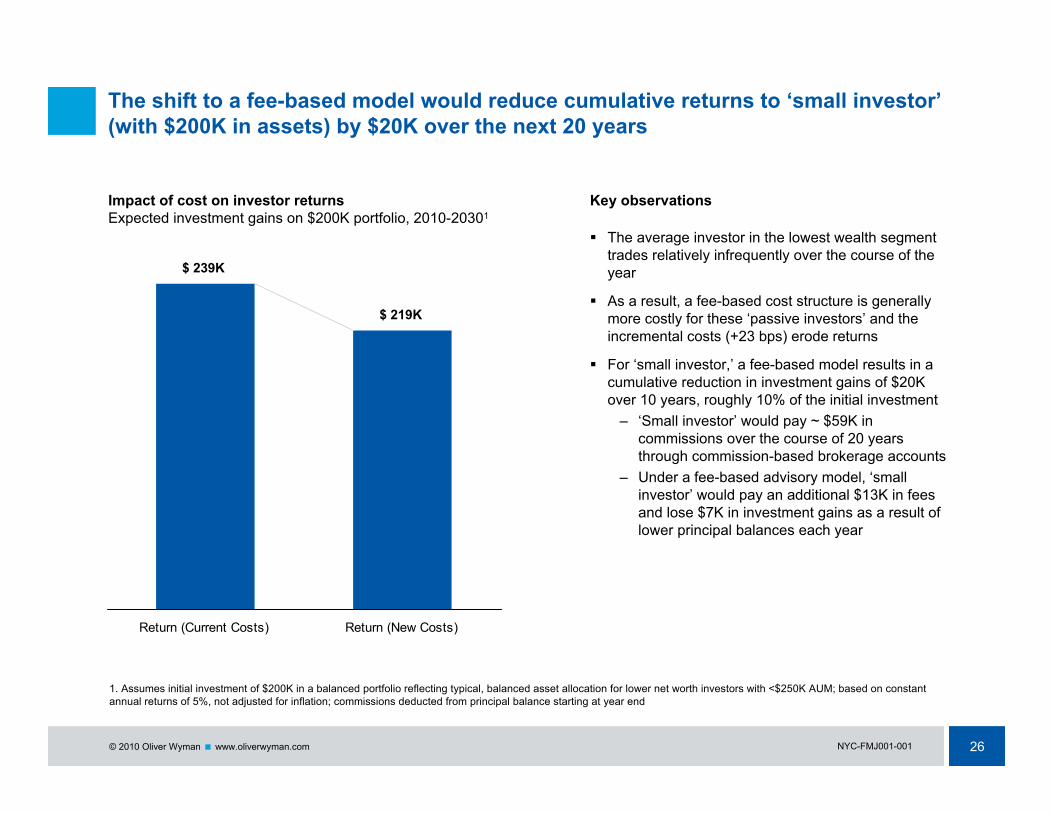
The shift to a fee-based model would reduce cumulative returns to ‘small investor’(with $200K in assets) by $20K over the next 20 years
1. Assumes initial investment of $200K in a balanced portfolio reflecting typical, balanced asset allocation for lower net worth investors with <$250K AUM; based on constant annual returns of 5%, not adjusted for inflation; commissions deducted from principal balance starting at year end
Return (Current Costs) Return (New Costs)
Key observationsImpact of cost on investor returnsExpected investment gains on $200K portfolio, 2010-20301
$ 239K
$ 219K
The average investor in the lowest wealth segment trades relatively infrequently over the course of the year
As a result, a fee-based cost structure is generally more costly for these ‘passive investors’ and the incremental costs (+23 bps) erode returns
For ‘small investor,’ a fee-based model results in a cumulative reduction in investment gains of $20K over 10 years, roughly 10% of the initial investment
– ‘Small investor’ would pay ~ $59K in commissions over the course of 20 years through commission-based brokerage accounts
– Under a fee-based advisory model, ‘small investor’ would pay an additional $13K in fees and lose $7K in investment gains as a result of lower principal balances each year
+120%

27NYC-FMJ001-001© 2010 Oliver Wyman www.oliverwyman.com
However, the costs of complying with and / or demonstrating compliance with the new standard of care will place additional pressure on pricing
Median income for investment advisers estimated at $173K1
Adviser compensation represents 42% of fully loaded costs based on SIFMA member data
Given 2,000 working hours per year, average hourly rate of service is $200 / hour
Increased activities required by shift in ‘standard of care’
Adviser training Increased legal and compliance Increased risk management and oversight Production and mailing of additional disclosures Initial client consultation
– Review relationship– Obtain formal consent for existing strategy
Investment strategy and plan– Evaluate portfolio– Assess investment objectives– Agree on new investment plan for client
Documentation of client discussions Ongoing account surveillance
10bps8bps6bps4bps2bpsHNW investor ($10MM)
20bps16bps12bps8bps4bpsAffluent investor ($500K)
50bps40bps30bps20bps10bpsSmall investor ($200K)
$1,000$800$600$400$200Estimated cost
54321Additional hours
Incremental cost of complianceAnnual costs expressed as bps over assets
Methodology for calculating hourly rate
1. Based on 2010 annual compensation survey by Registered RepSource: SIFMA member data, Oliver Wyman analysis
Focus of analysis on following slides (conservative estimate)
A
B
C

28NYC-FMJ001-001© 2010 Oliver Wyman www.oliverwyman.com
These incremental costs will disproportionately impact investors with smaller investment portfolios
Current cost Incrementalcost
New cost Current cost Incrementalcost
New cost Current cost Incrementalcost
New cost
0.43%- Incremental Cost
4.06%Current Expected Return
3.63%New Expected Return
0.94%- Current Cost
5.00%Gross Expected Return1
$2,650
$4,900
$38,000
$67,400
$1,850$1,890
$2,750
$460
0.45%- Incremental Cost
4.47%Current Expected Return
4.02%New Expected Return
0.53%- Current Cost
5.00%Gross Expected Return1
0.29%- Incremental Cost
4.62%Current Expected Return
4.33%New Expected Return
0.38%- Current Cost
5.00%Gross Expected Return1
$400+46%
+85%$400 +77%
1. Assumes pricing for commission- and fee-based accounts rises to account for additional activity2. Illustrative, not based on observed annual returnsSources: SIFMA data, Oliver Wyman analysis
$29,000
$400
Potential impact on advisory fees and expected returnsPro forma impact of transition to fee-based accounts at new pricing, annual advisory costs
Small Investor Affluent Investor High net worth InvestorA B C

29NYC-FMJ001-001© 2010 Oliver Wyman www.oliverwyman.com
Consumers may also face significant adviser capacity constraints that will limit the availability of service under the new standard of care
19KMinimum number of required advisers
38.1MM hoursTime spent on all investors with <$250K AUM
1.3 hoursTime spent per investor
$200Hourly rate for asset management services
$268Average commissions/investor
28.4MMInvestors with <$250K in commission accounts
Impact of additional service requirements+ 2 hours per investor
28K26K24K20KAdditional advisers needed
17.015.814.212.1Coverage gap (total investors, MM)
11.412.714.316.3Implied capacity (total investors, MM)
38.142.347.654.4Implied capacity (MM hours)
100%90%80%70%Current utilization levels
Current state Given current resources, we estimate that 40-57% of investors in the lowest wealth segment can be covered if advisers are required to spend 2 additional hours with each investor
We estimate that 20-28K additional advisers will be needed to serve the ‘uncovered’ investors in our sample population → our sample population is 33% of US investors, which suggests that 60-84K new advisers may be needed
Faced with this, the brokerage and investment advisory industry can respond in one of three ways
– Increase workforce and raise prices– Increase workforce and absorb new costs– Reduce coverage for lower net worth investors
whose ‘personalized investment’ advisory needs will exceed capacity
While the autonomy provided by self-directed accounts is desirable for certain investors, market data suggests that investors with advised accounts
– Make more sophisticated investment decisions– Achieve higher average investment returns
Implications
Source: SIFMA member data, Oliver Wyman analysis
Capacity analysis

30NYC-FMJ001-001© 2010 Oliver Wyman www.oliverwyman.com
0
100
200
300
400
500
600
700
800
900
2000 2001 2002 2003 2004 2005 2006 2007 2008 2009
Reg
iste
red
reps
(000
s)
Other professionalsInvestor advisory
0%
20%
40%
60%
80%
100%
120%
2005 2006 2007 2008 2009
Discount Broker Regional Broker-Dealer National Broker-Dealer
Current economics of the IA/BD industry suggest that investors will need to accept higher costs or turn to alternative service models for investment
Industry capacity FINRA registered representatives (000s)2
Industry profitabilityTotal costs before tax over total revenues1
Operating margins across the industry are thin and have deteriorated since 2005, leaving little
room to absorb additional cost
Industry headcount has been flat to negative over the past ten years; the additional capacity required to cover small clients would be difficult to provide
(at least in the near term) 1. Public data for companies within the SNL National Broker-Dealer, Regional Broker-Dealer, and Discount Broker indices2. Figures overstate actual industry capacity (approximately 50-60% of individuals who hold Series 7 licenses do not advise investors, but serve in other capacities e.g. legal, compliance, etc.)Sources: SNL Financial, FINRA
-1% CAGR
100% CIRNo profit
633672

31NYC-FMJ001-001© 2010 Oliver Wyman www.oliverwyman.com
And several recent studies suggest that investors without access to advisory services may be disadvantaged and fail to realize investment goals
0%
2%
4%
6%
8%
10%
12%
14%
<25 26-35 36-45 46-55 56-65
Advised portfoliosNon-advised portfolios
Impact of professional financial advice1 on portfolio returns401k returns by age segment, 2006 data
1. Use of advisory services for >1 year, ‘advisory services’ include personalized investment advice online, via phone, or in personSource: Charles Schwab studies on 401(k) portfolio returns (2007) and impact of professional advisory relationships in 401(k) plans (2010)
Δ= +4.7% +3.4% +2.5%+2.7%+2.9%
Key observations
Participants in 401k plans administered by Schwab achieved returns that were 3.3% higher on average if some level of financial advice was provided
In addition to higher portfolio returns, professional financial advice had an impact on several dimensions
– Savings rate → 70% of participants who received financial advice doubled their saving rates from an average of 5% to 10% of pre-tax income
– Portfolio diversification → Participants who received financial advice held positions across 8 asset classes on average vs. self-directed investors who held positions in 3.7
– Investor confidence → Of participants who received advice, 29% were confident of having adequate funds to retire vs. 16% of investors who did not
NYC-FMJ001-001
MiFID Investor Protection
Appendix

33NYC-FMJ001-001© 2010 Oliver Wyman www.oliverwyman.com
In 2007, the Markets in Financial Instruments Directive (MiFID) made significant provisions for ‘investor protection’
Although less onerous than the ‘standard of care’ currently under consideration in the US, MiFIDstudies nonetheless show the impact of similar compliance costs on asset management firms
MiFID provisions
Regulation of alternative trading systems – Regulation of multi-lateral trading facilities– Treatment of systemic internalisers, or principal
traders, as mini-exchanges Increased pre and post trade transparency for all
trading facilities Passporting or development of a single market for
transactions in financial instruments across a number of European Union member states
Requirement to enhance corporate governance structures to accommodate an independent compliance function
Investor protection– Appropriate client categorization and client order
handling– Best execution requirement for all trades on
behalf of clients– Robust record keeping systems for periodic
statements, transaction reporting, and client contracts and agreements
MiFID relative to Advisers Act of 1940
MiFID provisions covered a narrower range of activities and imposed a less onerous standard of care than the ‘best interest’ standards that would be required if the Advisers Act were adopted
MiFID
Best interest
Principal trading
Suitability
Not covered
IRA / retirement accounts
Underwriting
Proprietary product sales
Advice on client holdings
Asset allocation advice
Investment planning

34NYC-FMJ001-001© 2010 Oliver Wyman www.oliverwyman.com
The FSA’s impact studies on MiFID identified investor protection provisions as the greatest contributors to compliance costs
Order Execution
Client Management
Client Acquisition
# trades, # clients, required level of detail# trades, # clients, required level of detail
Electronic/voice storage
Paper document storage
Demonstrating compliance with suitability and best execution requirements
Documentation of trades
# departments, level of principal trading# products offered
Maintaining Chinese Walls
Documentation/database
Identifying/addressing conflicts, actively managing potential issues before they become conflicts
Conflict of Interest
# monitored execution venues # clients, frequency of disclosure
Regular reviews of execution venuesDisclosure to prove best execution policy
Achieving optimal mix of price, speed and likelihood of execution
Best execution
# clients, # products offered
Monitoring client accountsUpholding suitability requirement to maintain AUM in appropriate investments
Maintenance of client portfolios
Response rate, # of clients# clients, frequency of disclosure
One time client agreements/contractsRoutine disclosure
Disclosing information on suitability, best execution policy, conflicts of interest policy, principal trading, etc.
Consent/Disclosure
Fixed cost# clients, level of existing data# products offered
System/process to capture client dataClient data collectionUpdated risk information on products
Understanding needs, objectives, risk profiles, experience and expertise of clients
Suitability/ Appropriateness
Fixed cost # clients, length of client discussions
System/process to capture client dataClient data collection
Categorizing clients according to size of portfolio, # trades, etc.
Classifying client base
Cost DriversCost FactorsObjectiveActivity
Source: Implementing MiFID for Firms and Markets, FSA Consultation Paper 2006

35NYC-FMJ001-001© 2010 Oliver Wyman www.oliverwyman.com
Smaller firms with a large retail client base incurred higher one-off costs of compliance as a percentage of operating costs
One-off compliance costs of MiFID by firm size1
One-off costs as a percentage of operating costs, 2007 The study found that client profile is the most
important determinant of costs, with retail clients incurring significantly more costs than institutional clients
The biggest one-off costs arose from investment in IT and revisions of CRM systems to reflect new data points, especially for certain retail segments
A significant portion of one-off costs were fixed, irrespective of firm size and number of clients
Impact studies indicated that small firms would be unable to sustain large fixed costs of compliance and exit the industry
In absolute terms, average one-off costs were ~€1 MM for a small firm and ~€4 MM for a large firm
There is high variability in the level of one-off costs amongst smaller firms depending upon– Extent to which firms serve retail clients– Ability of firms to make large upfront investments
Determinants of one-off costs
1. Firms with fewer than 100 employees were classified as “Small”Source: Europe Economics Study, 2007
0.0
0.5
1.0
1.5
2.0
2.5
3.0
3.5
4.0
4.5
5.0
5.5
6.0
Small Large

36NYC-FMJ001-001© 2010 Oliver Wyman www.oliverwyman.com
Due to their inability to make sizeable upfront investments, smaller firms typically also sustained higher ongoing costs of compliance as a percent of operating costs
Whereas larger asset managers complied with MiFID by investing in automated systems, smaller firms increased headcount There is a trade-off between one-off and on-going costs, e.g. for smaller firms the option of updating IT systems might have
been too expensive, thus on-going costs of sustaining a larger workforce are much higher The smallest firms in the study had no specialist compliance functions prior to MiFID, and required significant resources to
cover compliance activities
16%2%Audit
7%2%Training
17%12%External reporting
30%4%IT
12%9%Internal reporting
18%70%Additional staff
LargeSmall
On-going compliance costs of MiFIDEuropean asset managers by firm size1, 2007
1. Firms with fewer than 100 employees were classified as “Small”Source: Europe Economics Study, 2007
Ongoing compliance costs of MiFID by firm sizeOngoing costs as a percentage of operating costs, 2007
0.0
0.2
0.4
0.6
0.8
1.0
1.2
1.4
1.6
1.8
Small Large