Embed Size (px)
Citation preview
Standard normal distribution test of college students' test score distribution
Jinming Zuo Education Evaluation Center, Officers College of PAP, Chengdu, 610213, China
Keywords: Examination results; Standard normal distribution; Inspection
Abstract: It is one of the necessary measures taken by various schools to improve the examination quality, proposition and teaching quality by applying the principles of educational surveying and mathematical statistics to analyze the examination from proposition to examination result. The analysis of students' grades is an important link in the whole teaching process, and it is a necessary thing for teachers. Teachers can get many students' test scores every semester. This paper uses Pearson Chi-square criterion as a sample to test whether the scores obey the standard normal distribution, and takes the analysis results as a reference basis for teaching management. It also tentatively puts forward the treatment method of sample size standardization, which has certain practical significance.
1. Introduction In educational measurement, the statistical analysis of test scores is of great significance.
Average, standard deviation and correlation coefficient are the basic concepts in statistical analysis, and the reliability and validity of measuring the quality of educational measurement indicators are also based on statistics. This method is not reasonable enough, because the difficulty level of each scientific examination question is different, and the scoring standard is different; Its "score" is also different [1]. If this method is used to compare the academic achievements of two or more whole (such as classes), it is easy to make the results that have no significant difference sort according to the above calculation, which will cause human error and lead to the irrationality of the evaluation results.
In this paper, the relevant data of advanced mathematics examination for undergraduates from 2019 to 2021 in our university are studied, and Pearson criterion is used to test whether the scores obey the standard normal distribution. Because there are great differences in the number of students in different majors, we put forward a method to standardize the sample size in the analysis, which has certain practical significance. The research results show that normal distribution analysis can reveal the different learning conditions of students of different majors in different classes to a certain extent, and can provide practical and useful reference opinions for strengthening teaching management and improving teaching quality.
2. Significance of normal distribution test of grades There are two main meanings of normal distribution test of test scores [2-3]. (1)First, the calculation of many important test quality evaluation indicators is based on the
premise that the scores obey the standard normal distribution [4]. For example, in the statistical process of test scores and test parameters, the estimation and test of the main statistical parameters such as mean and variance are only applicable to normal distribution or approximate normal distribution, so before using these statistical methods, the normality test must be carried out.
(2)Second, it is used to explain test scores. Different score distributions can be interpreted as the difficulty distribution of test questions and students' learning situation, or in different types of tests, it can be interpreted as teachers' teaching situation [5].
The distribution of students' overall academic performance is as follows: (1)Normal distribution. It shows that the test results are consistent with the students' actual
situation, and the knowledge points of the test questions are comprehensive and the degree of
2021 5th International Conference on Economics, Management Engineering and Education Technology (ICEMEET 2021)
Copyright © (2021) Francis Academic Press, UK DOI: 10.25236/icemeet.2021.098475
difficulty is moderate. (2)Positive skewness distribution. Explain that the test questions are difficult. (3)Negative skewness distribution. Explain that the test questions are difficult. (4)Bimodal distribution. It shows that there is polarization in the test questions, that is, there are
more difficult and low-difficulty items, but less moderately difficult items, and the distribution of item difficulty lacks gradient, which is unreasonable.
(5)Distribution of flat slope type. It shows that the proportion of items with various difficulties is close and the gradient is large.
3. Chi-square test of goodness of fit
Chi-square (2χ ) test is the most important and typical goodness-of-fit test method for category
data, which compares the differences between observed frequency and expected frequency, and uses the monotone function of differences to measure the effect of fitting data for a given distribution [6]. Chi-square test statistics are expressed as:
( )∑=
−=
k
i i
ii
EEO
1
22χ
(1)
In which k is the number of kinds of experimental results, and ii EO , is the observed and expected frequency of the i th experimental result.
However, the overall test scores are a very special one, and there are obvious defects when using 2χ 's goodness-of-fit test to test them normally. For example, a batch of data with negative values
but symmetry can also be considered to obey the standard normal distribution after 2χ test, but it
has no practical significance as a student's test score. Therefore, it is not enough to test the normal
distribution of the test scores only according to the general goodness of fit of 2χ .
In order to reflect the specific situation of teaching and learning under normal teaching conditions, and find out the successful experiences and existing problems in the teaching process,
when the goodness-of-fit test of 2χ is carried out on the special overall test scores, the scores that
reasonably obey the standard normal distribution should meet the following conditions:
(1) [ ]8.0,5.0/ ∈WX , X is the average score (2)According to the σ3 principle in probability theory, the standard deviation [ ]15,5∪σ ;
(3)According to the usual2χ test of goodness of fit, it is tested that students' scores generally
obey the standard normal distribution.
4. Test of normality Kolmogorov-Smirnov(KS) test compares the maximum difference between empirical
distribution function of samples and theoretical empirical distribution function value under zero
hypothesis 0H , where cdf can be regarded as a random variable with uniform distribution (U(0,1)) of [0,1]. For discrete category data, KS tests statistics S :
( )∑ =≤≤==
i
j iiiikiEOZZMaxS
11,,
(2) In order to find and verify that the scores are normally distributed, we can first use kurtosis-
skewness method and 2χ distribution test method. With the help of statistical software SPSS, this
paper uses KS test method to test the normality of single sample. The specific steps are as follows:
476
(1)Assume that the overall distribution ( )xF is zero: ( ) ( ) ( ) ( )xFxFHxFxFH 0100 :,: ≠= ;
(2)The empirical distribution function ( )xFn∗
is constructed from samples;
(3)Make an estimate ( ) ( )xFxFD n
xn −= ∗
∞<<∞−sup
;
(4)Comparing the critical value σ,nD with nD , we can find that the acceptance domain is { }σ,nn DDW ≤= or 05.0≥P , and the rejection domain is { }σ,nn DDW >= or 05.0<P .
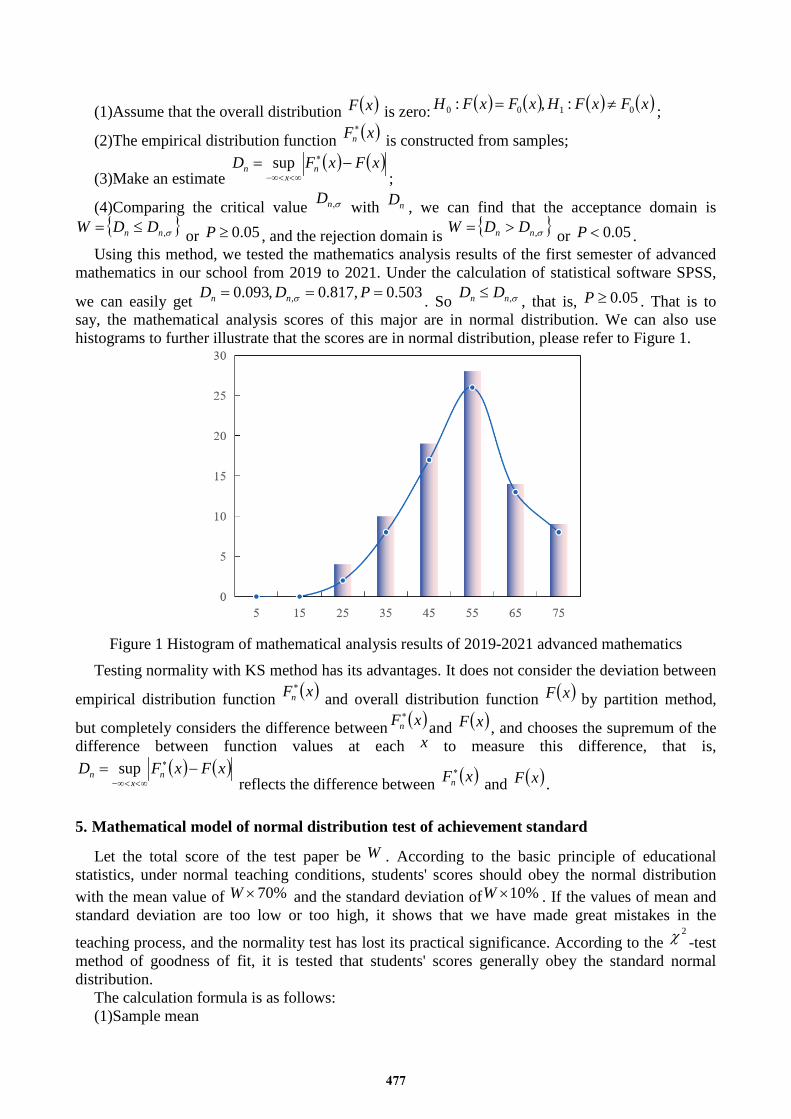
Using this method, we tested the mathematics analysis results of the first semester of advanced mathematics in our school from 2019 to 2021. Under the calculation of statistical software SPSS,
we can easily get 503.0,817.0,093.0 , === PDD nn σ . So σ,nn DD ≤ , that is, 05.0≥P . That is to say, the mathematical analysis scores of this major are in normal distribution. We can also use histograms to further illustrate that the scores are in normal distribution, please refer to Figure 1.
Figure 1 Histogram of mathematical analysis results of 2019-2021 advanced mathematics
Testing normality with KS method has its advantages. It does not consider the deviation between
empirical distribution function ( )xFn∗
and overall distribution function ( )xF by partition method,
but completely considers the difference between ( )xFn∗
and ( )xF , and chooses the supremum of the difference between function values at each x to measure this difference, that is,
( ) ( )xFxFD nx
n −= ∗
∞<<∞−sup
reflects the difference between ( )xFn∗
and ( )xF .
5. Mathematical model of normal distribution test of achievement standard
Let the total score of the test paper be W . According to the basic principle of educational statistics, under normal teaching conditions, students' scores should obey the normal distribution with the mean value of %70×W and the standard deviation of %10×W . If the values of mean and standard deviation are too low or too high, it shows that we have made great mistakes in the
teaching process, and the normality test has lost its practical significance. According to the 2χ -test
method of goodness of fit, it is tested that students' scores generally obey the standard normal distribution.
The calculation formula is as follows: (1)Sample mean
477
∑=
=n
iix
nX
1
1
(3) (2)Sample variance
( )2
1
2 1∑=
−=n
ii Xx
nS
(4) Where n is the number of candidates. Judge whether the mean and standard deviation meet the
conditions (1) and (2), and if not, consider that the score does not obey the standard normal distribution.
If it is satisfied, use the mean X and variance 2S of test paper scores as the estimation of the
overall mean µ and population variance 2σ , and use ξ to express the overall test paper scores,
then make the following assumptions: ( )2
0 ,~: SXNH ξ (5) In order to test whether the above assumptions are correct, the system divides the score interval
[0,W] into k intervals, and the sub-point is 121 −<< kttt . Thereby calculating the frequency iV of
test paper scores in each interval, and if there is ( )2,~ SXNξ , the theoretical probability of taking values in each interval can be obtained:
( ) ( )1−−= iii tFtFP (6)
In which ( ) ( )
−Φ=≤=
SXttXPtF i
ii
and ( )xΦ represent the distribution function of standard normal distribution, ki ,,2,1 = .
Then the theoretical frequency ii nPU = of each interval constitutes a statistic:
( )∑=
−=
n
i i
Ii
UVVx
1
22
(7)
According to Pearson's theorem, the above statistics approach the 2χ distribution of degree of
freedom ( )mk −−1 . Where m is the number of unknown parameters, and m should be equal to 2 for normal distribution.
Given the reliability α , look up the 2χ distribution table to get ( )212 −−kαχ . if
( )2122 −−< kaχχ , accept 0H , indicating that this batch of achievement distribution obeys the
standard normal distribution; otherwise, reject 0H
6. Example analysis The data in this paper are collected from the test paper results of 2019- 2021 undergraduate
students in our university. We take each natural class or major as the sample space. For the reliability of the research, the classes or majors with less than 10 people are deleted, and the results
of the students who follow classes are mainly excluded. In this paper, Pearson 2χ criterion is used
to test whether the random variable ξ satisfies normal distribution. Let's take 10m= first, and divide students' scores into 10 fractions according to every 10
fractions. Usually, when we test the hypothesis of normal distribution, we require that the sample
478
size is greater than 50 and the frequency iv of each interval is greater than 5; However, since the number of classes we consider is mostly about 30, in the discussion, we set the minimum number of students in each fraction as 2. If there are less than 2 students, two or several adjacent fractions will be merged, so there is 10<m .
Using the method in the second section above as a hypothesis test, the classes that are not in normal distribution are screened out, and the normal distribution rate of each test can be obtained at the same time.
By analyzing the classes whose grades are not normal, we find that there are mainly the following situations:
(1)There are two peaks (or multi-peaks) in the histogram of distribution density, which usually shows that students' grades are polarized, which prompts us to strengthen the management of classes with this situation and strengthen the education of study style.
(2)The histogram peak shifts to the left (low subsection), that is, the so-called positive skewness distribution, which shows that the test paper is difficult or the overall effect of students' learning is poor. If it is the latter, education management should also be strengthened vigorously.
(3)On the contrary, the peak shifts to the right (high subsection), which is called negative skewness distribution, which shows that the overall effect of students' learning is better or the test paper is easier. In the actual analysis, we found that the scores of outstanding students in science and engineering classes often appear such distribution, which is in line with expectations.
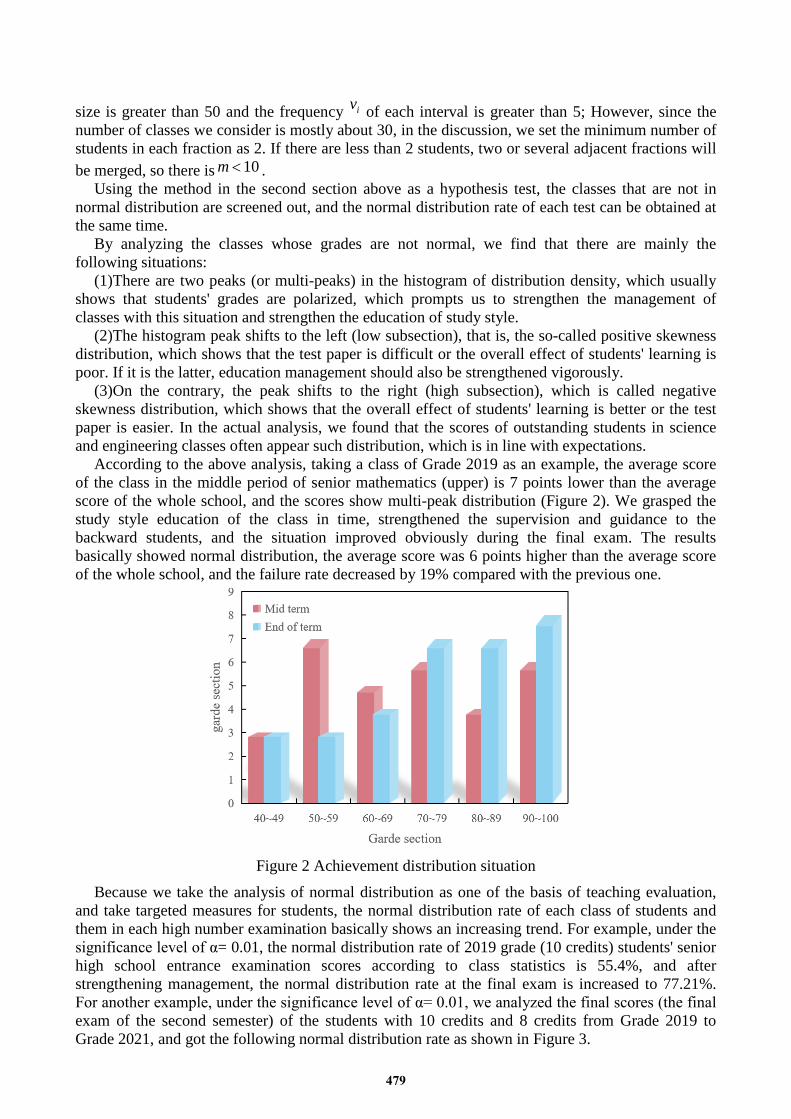
According to the above analysis, taking a class of Grade 2019 as an example, the average score of the class in the middle period of senior mathematics (upper) is 7 points lower than the average score of the whole school, and the scores show multi-peak distribution (Figure 2). We grasped the study style education of the class in time, strengthened the supervision and guidance to the backward students, and the situation improved obviously during the final exam. The results basically showed normal distribution, the average score was 6 points higher than the average score of the whole school, and the failure rate decreased by 19% compared with the previous one.
Figure 2 Achievement distribution situation
Because we take the analysis of normal distribution as one of the basis of teaching evaluation, and take targeted measures for students, the normal distribution rate of each class of students and them in each high number examination basically shows an increasing trend. For example, under the significance level of α= 0.01, the normal distribution rate of 2019 grade (10 credits) students' senior high school entrance examination scores according to class statistics is 55.4%, and after strengthening management, the normal distribution rate at the final exam is increased to 77.21%. For another example, under the significance level of α= 0.01, we analyzed the final scores (the final exam of the second semester) of the students with 10 credits and 8 credits from Grade 2019 to Grade 2021, and got the following normal distribution rate as shown in Figure 3.
479
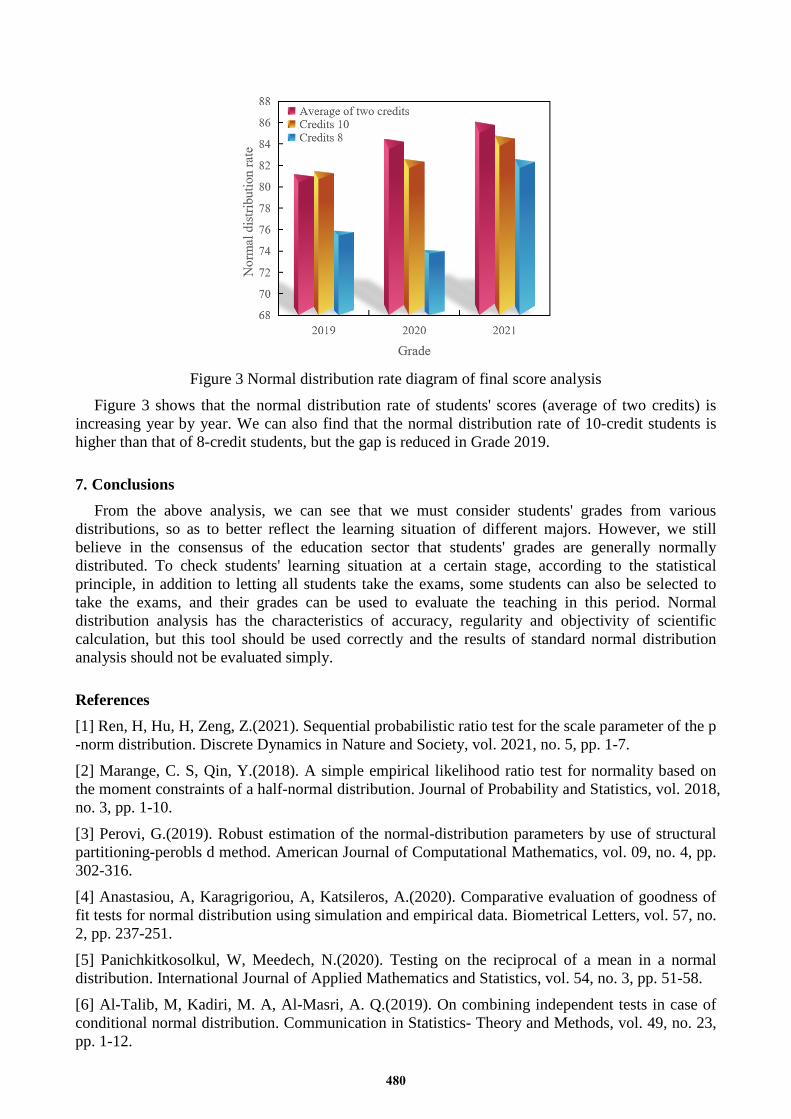
Figure 3 Normal distribution rate diagram of final score analysis
Figure 3 shows that the normal distribution rate of students' scores (average of two credits) is increasing year by year. We can also find that the normal distribution rate of 10-credit students is higher than that of 8-credit students, but the gap is reduced in Grade 2019.
7. Conclusions From the above analysis, we can see that we must consider students' grades from various
distributions, so as to better reflect the learning situation of different majors. However, we still believe in the consensus of the education sector that students' grades are generally normally distributed. To check students' learning situation at a certain stage, according to the statistical principle, in addition to letting all students take the exams, some students can also be selected to take the exams, and their grades can be used to evaluate the teaching in this period. Normal distribution analysis has the characteristics of accuracy, regularity and objectivity of scientific calculation, but this tool should be used correctly and the results of standard normal distribution analysis should not be evaluated simply.
References [1] Ren, H, Hu, H, Zeng, Z.(2021). Sequential probabilistic ratio test for the scale parameter of the p -norm distribution. Discrete Dynamics in Nature and Society, vol. 2021, no. 5, pp. 1-7. [2] Marange, C. S, Qin, Y.(2018). A simple empirical likelihood ratio test for normality based on the moment constraints of a half-normal distribution. Journal of Probability and Statistics, vol. 2018, no. 3, pp. 1-10. [3] Perovi, G.(2019). Robust estimation of the normal-distribution parameters by use of structural partitioning-perobls d method. American Journal of Computational Mathematics, vol. 09, no. 4, pp. 302-316. [4] Anastasiou, A, Karagrigoriou, A, Katsileros, A.(2020). Comparative evaluation of goodness of fit tests for normal distribution using simulation and empirical data. Biometrical Letters, vol. 57, no. 2, pp. 237-251. [5] Panichkitkosolkul, W, Meedech, N.(2020). Testing on the reciprocal of a mean in a normal distribution. International Journal of Applied Mathematics and Statistics, vol. 54, no. 3, pp. 51-58. [6] Al-Talib, M, Kadiri, M. A, Al-Masri, A. Q.(2019). On combining independent tests in case of conditional normal distribution. Communication in Statistics- Theory and Methods, vol. 49, no. 23, pp. 1-12.
480