Embed Size (px)
Citation preview
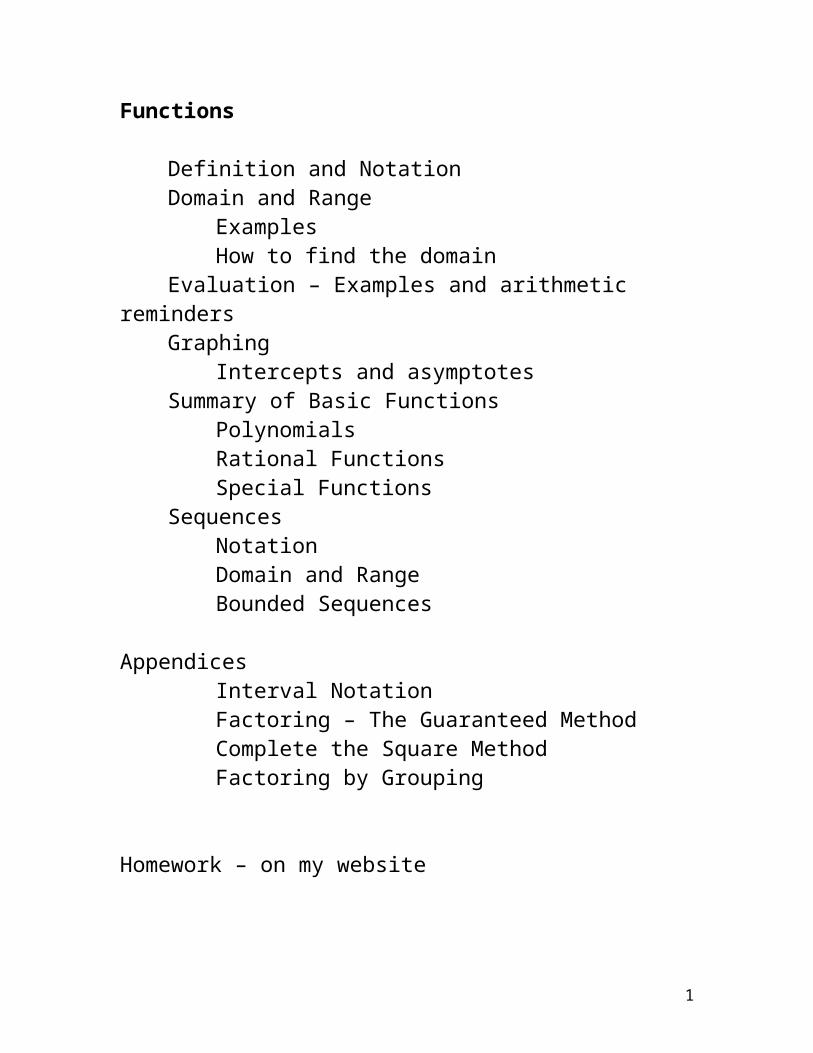
Functions
Definition and NotationDomain and Range
ExamplesHow to find the domain
Evaluation – Examples and arithmetic remindersGraphing
Intercepts and asymptotesSummary of Basic Functions
PolynomialsRational FunctionsSpecial Functions
SequencesNotationDomain and RangeBounded Sequences
AppendicesInterval NotationFactoring – The Guaranteed MethodComplete the Square MethodFactoring by Grouping
Homework – on my website
1

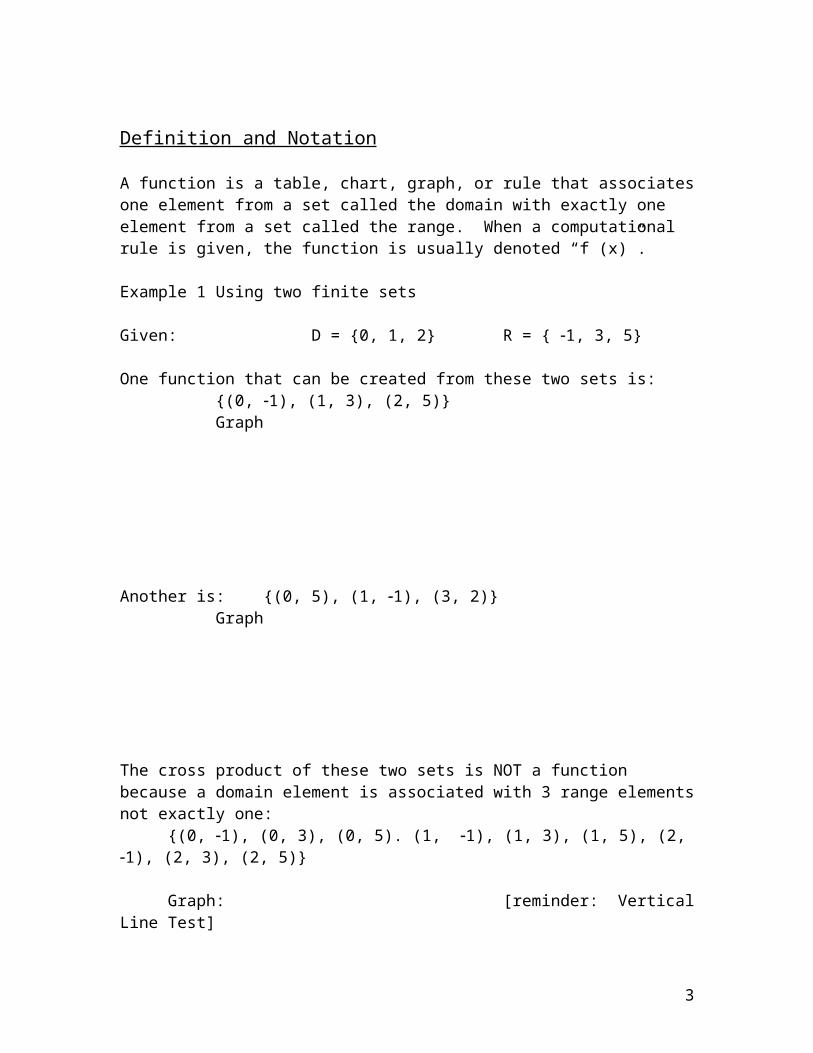
Definition and Notation
A function is a table, chart, graph, or rule that associates one element from a set called the domain with exactly one element from a set called the range. When a computational rule is given, the function is usually denoted “f (x)”.
Example 1 Using two finite sets
Given: D = {0, 1, 2} R = { 1, 3, 5}
One function that can be created from these two sets is:{(0, 1), (1, 3), (2, 5)}Graph
Another is: {(0, 5), (1, 1), (3, 2)}Graph
The cross product of these two sets is NOT a function because a domain element is associated with 3 range elements not exactly one:
{(0, 1), (0, 3), (0, 5). (1, 1), (1, 3), (1, 5), (2, 1), (2, 3), (2, 5)}
Graph: [reminder: Vertical Line Test]
Each function that can be created is a SUBSET of the cross product, though.
2
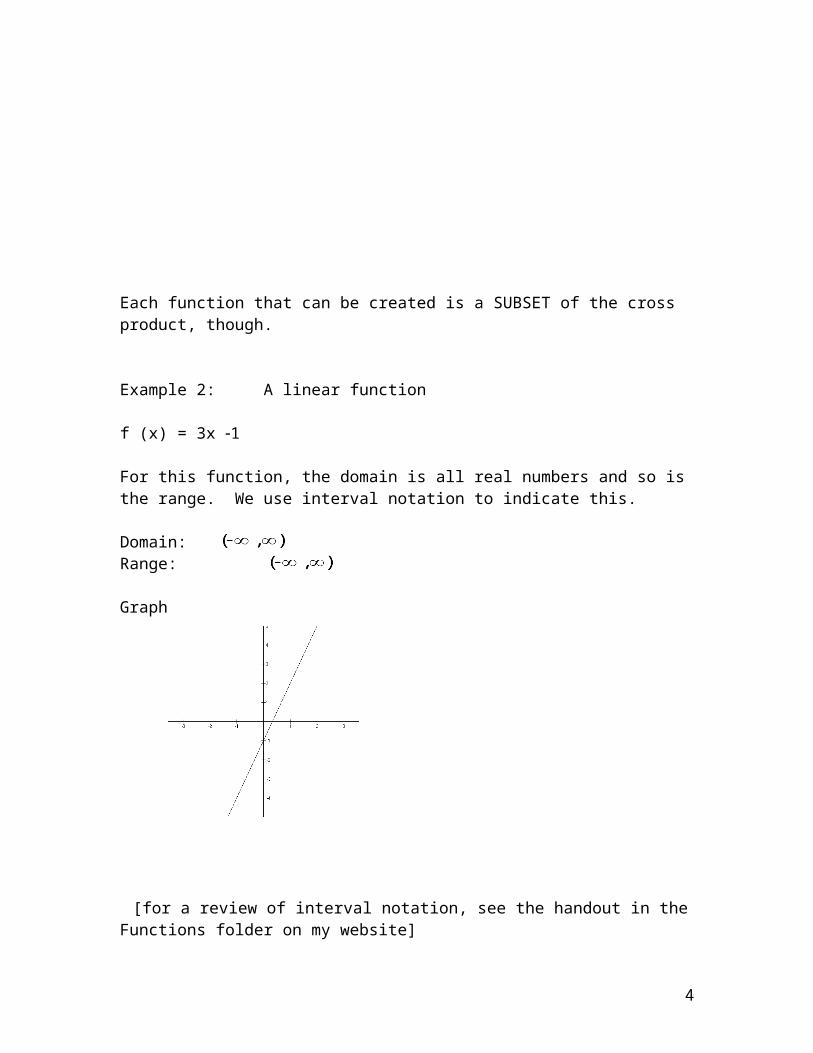
Example 2: A linear function
f (x) = 3x 1
For this function, the domain is all real numbers and so is the range. We use interval notation to indicate this.
Domain:Range:
Graph
[for a review of interval notation, see the handout in the Functions folder on my website]
x-intercept and y-intercept
0
0
3
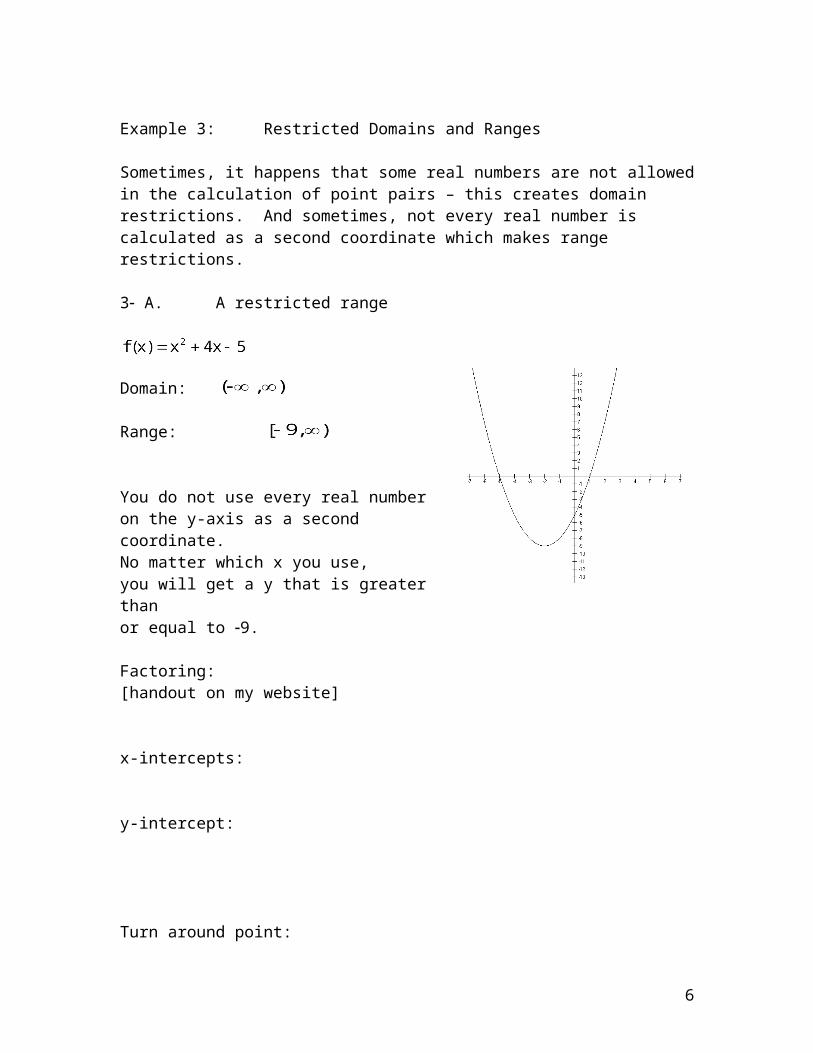
Example 3: Restricted Domains and Ranges
Sometimes, it happens that some real numbers are not allowed in the calculation of point pairs – this creates domain restrictions. And sometimes, not every real number is calculated as a second coordinate which makes range restrictions.
3 A. A restricted range
Domain:
Range:
You do not use every real number on the y-axis as a second coordinate. No matter which x you use, you will get a y that is greater thanor equal to 9.
Factoring:[handout on my website]
x-intercepts:
y-intercept:
Turn around point:[Complete the Square: handout on my website]
4
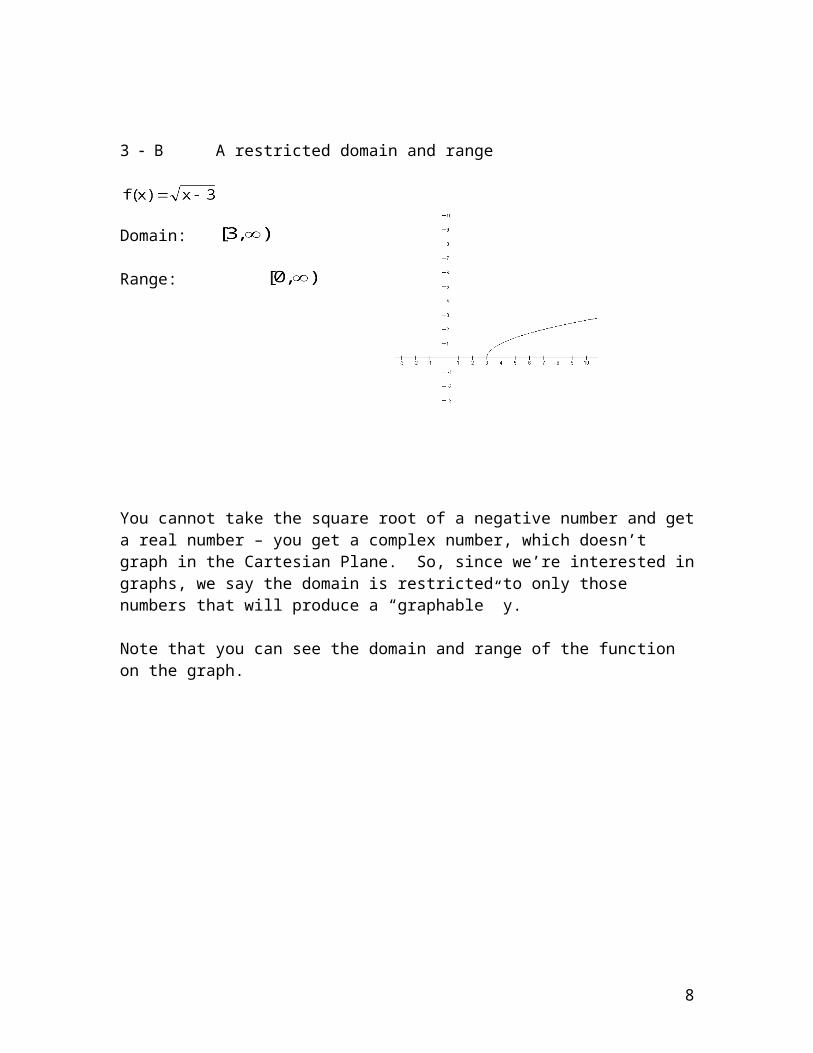
3 B A restricted domain and range
Domain:
Range:
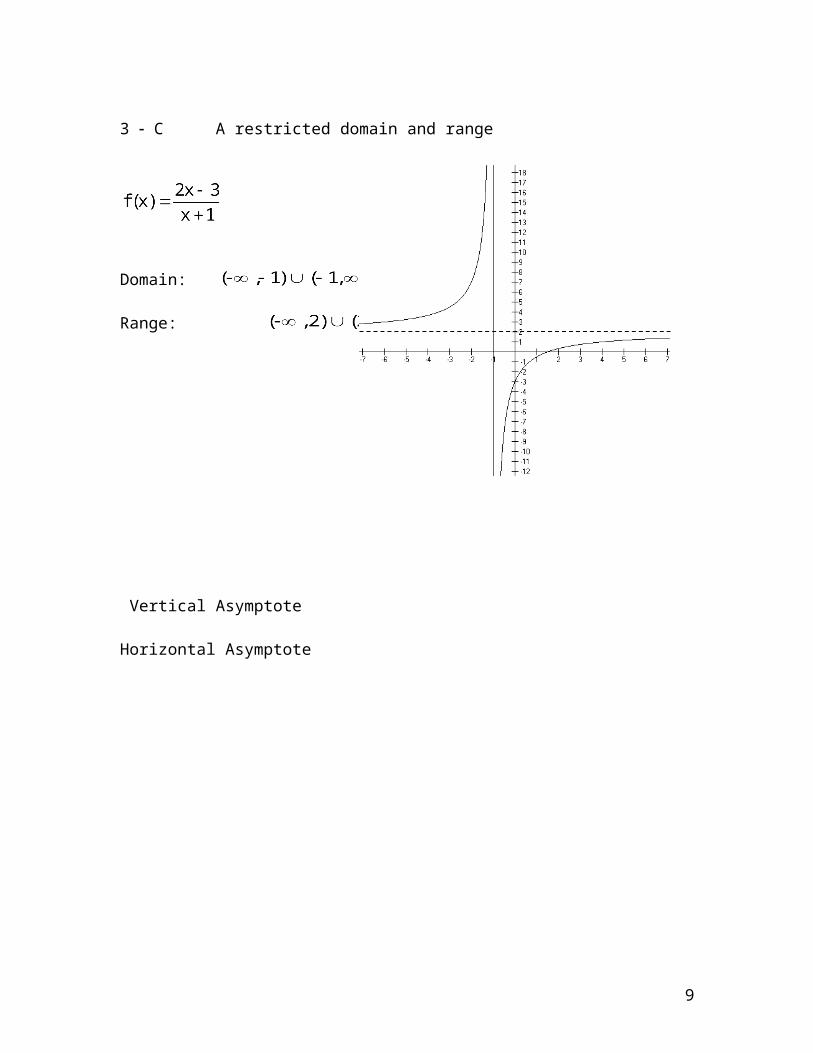
You cannot take the square root of a negative number and get a real number – you get a complex number, which doesn’t graph in the Cartesian Plane. So, since we’re interested in graphs, we say the domain is restricted to only those numbers that will produce a “graphable” y.
Note that you can see the domain and range of the function on the graph.
5
3 C A restricted domain and range
Domain:
Range:
Vertical Asymptote
Horizontal Asymptote
6

How to find the domain
The domain of a function is ALWAYS all real numbers, , unless the function has one of the following problems:
a square root a divide by an expression with an x a “log” as a function name (we won’t be doing any of these)
We will use the graph to find the range unless the function is a very basic one.
Square roots (n.b. or any even root)
We all know you can’t take the square root of a negative number and get a real number; you get an imaginary number that you can’t graph in the Cartesian Plane.
So, if you’re working with point pairs and you’ve got an x that gives you an imaginary y, you throw it out and say it’s “not in the domain”.
Doing this x by x takes too long. So we do it with algebra.
You CAN take the square root of zero and any positive number.
So
Take the expression under the radical Set it greater than or equal to zero Solve for x Report the solution in interval notation
7
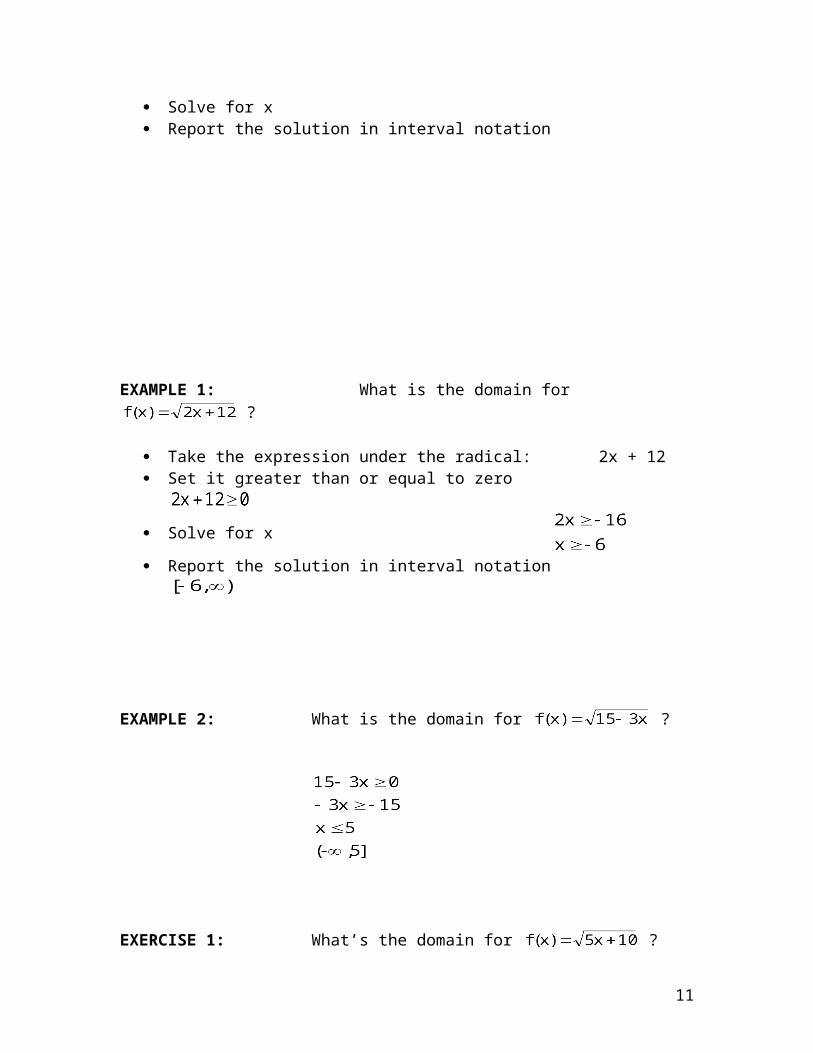
EXAMPLE 1: What is the domain for ?
Take the expression under the radical: 2x + 12 Set it greater than or equal to zero
Solve for x
Report the solution in interval notation
EXAMPLE 2: What is the domain for ?
EXERCISE 1: What’s the domain for ?
Take the expression under the radical Set it greater than or equal to zero
Solve for x
Report the solution in interval notation
Divides with an expression that contains an x
note that dividing by a number, like 3, is not a domain problem
8
the domain for is all Real Numbers.
We all know you can’t divide by zero. So
Take the expression in the denominator Set it equal to zero Solve for x Throw them out, off the number line Report THE REST as the domain
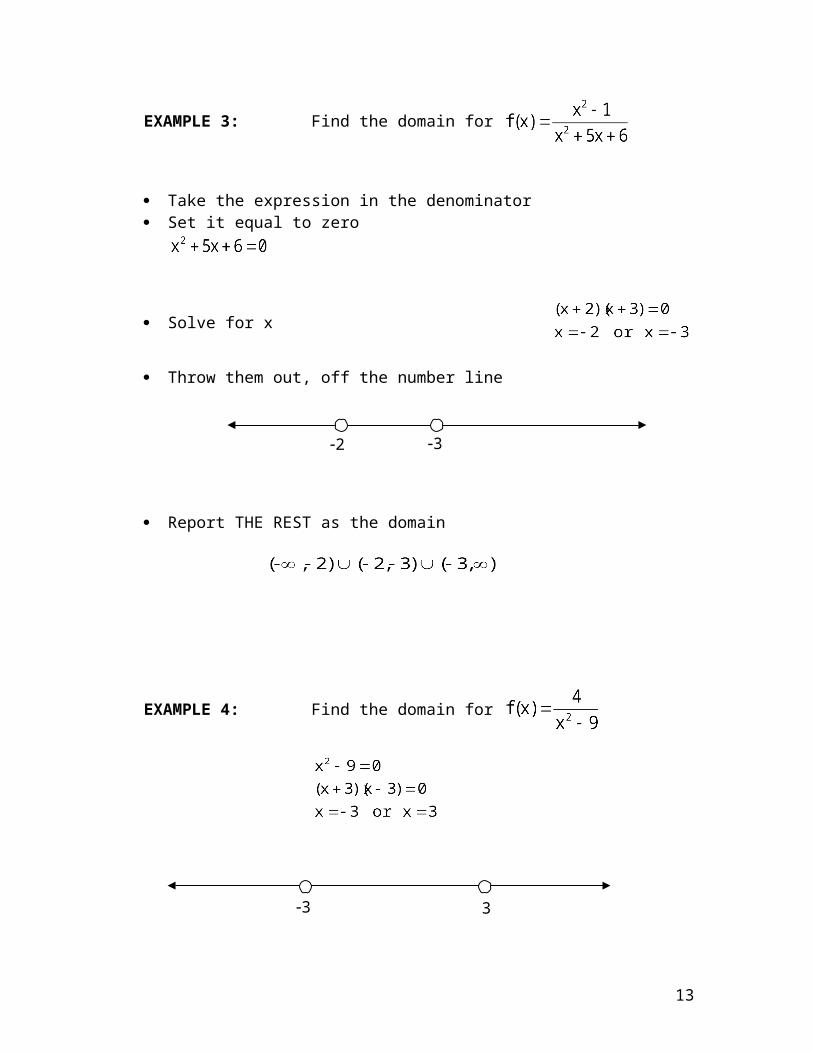
EXAMPLE 3: Find the domain for
Take the expression in the denominator Set it equal to zero
Solve for x
Throw them out, off the number line
Report THE REST as the domain
EXAMPLE 4: Find the domain for
9
2 3
this is the domain
EXERCISE 2: Find the domain for
Take the expression in the denominator Set it equal to zero Solve for x Throw them out, off the number line Report THE REST as the domain
Summary
Tell me the domains for:
10
3 3
11
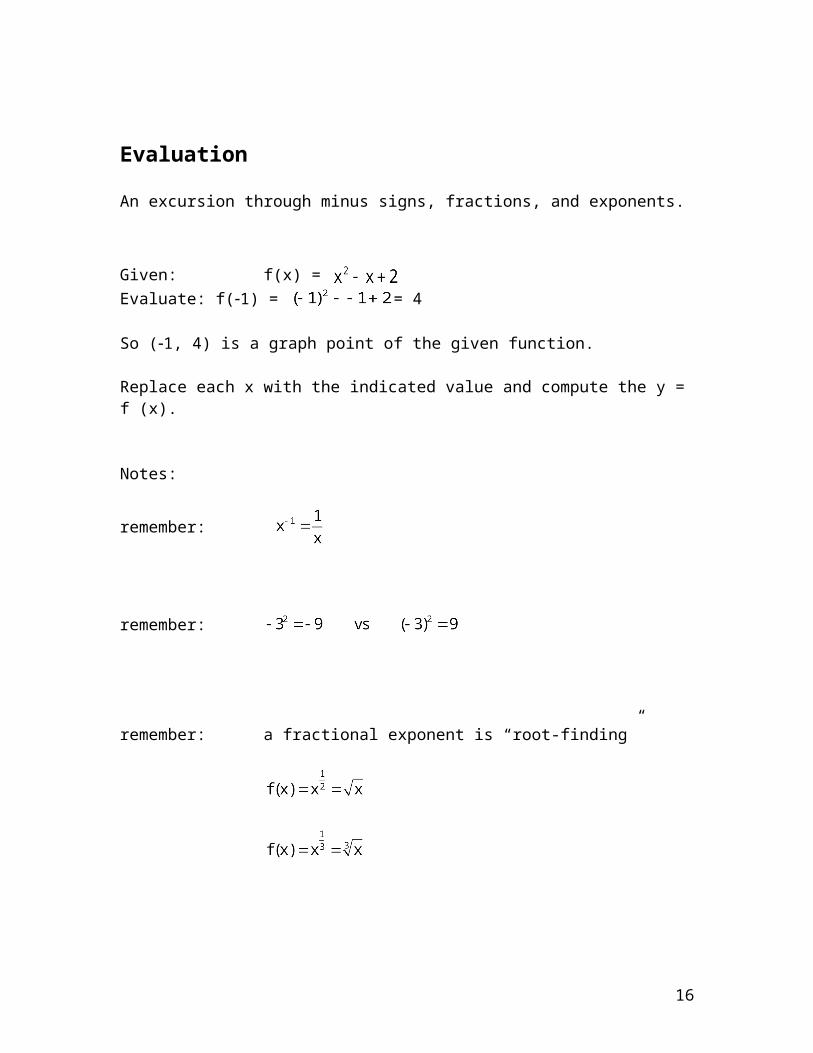
Evaluation
An excursion through minus signs, fractions, and exponents.
Given: f(x) = Evaluate: f(1) = = 4
So (1, 4) is a graph point of the given function.
Replace each x with the indicated value and compute the y = f (x).
Notes:
remember:
remember:
remember: a fractional exponent is “root-finding”
12
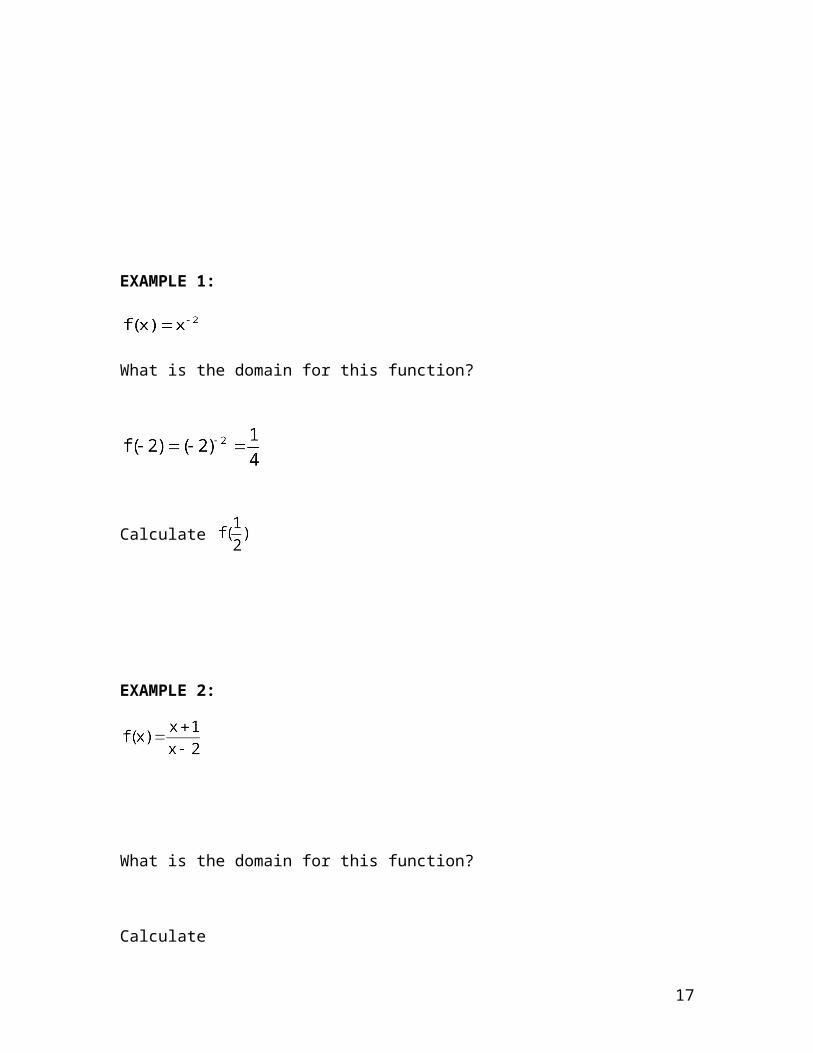
EXAMPLE 1:
What is the domain for this function?
Calculate
EXAMPLE 2:
What is the domain for this function?
Calculate
f(1)
f(0)
f(1/2)
13

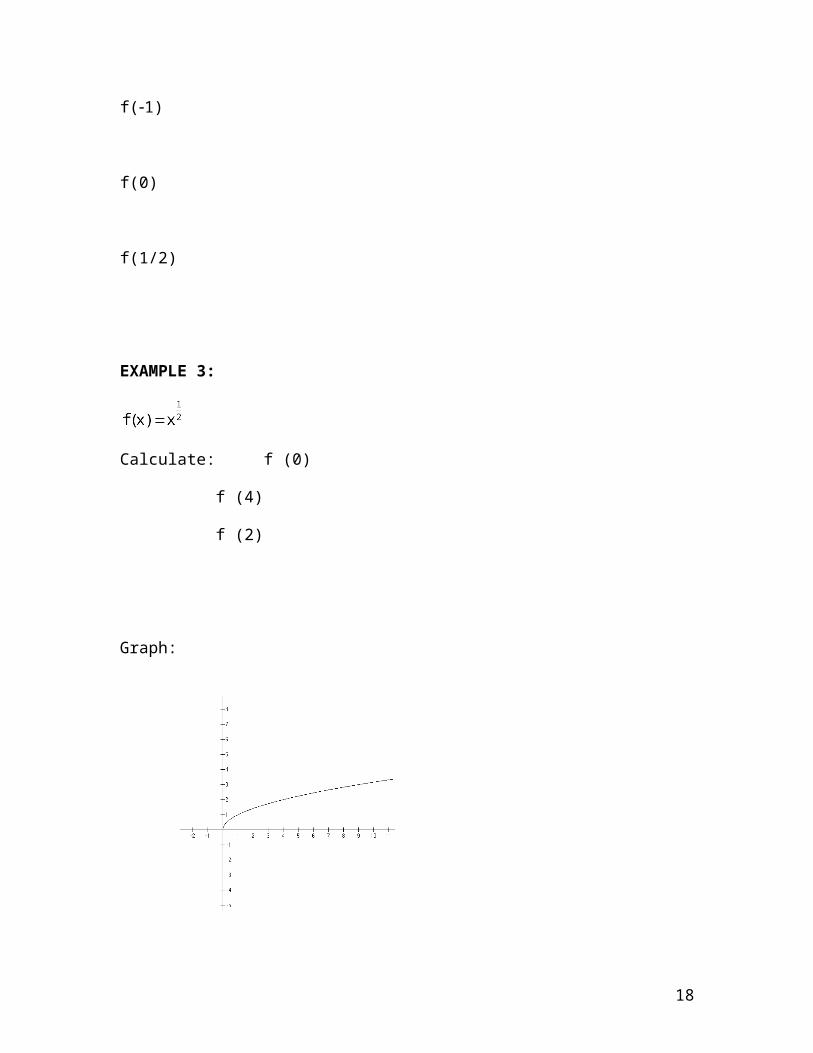
EXAMPLE 3:
Calculate: f (0)
f (4)
f (2)
Graph:
What are the domain and range for this graph?
14
Example 4:
Given two points, let’s review how to get the formula for the line they determine.
The Point-Slope Formula is the way to go:
where m is the slope:
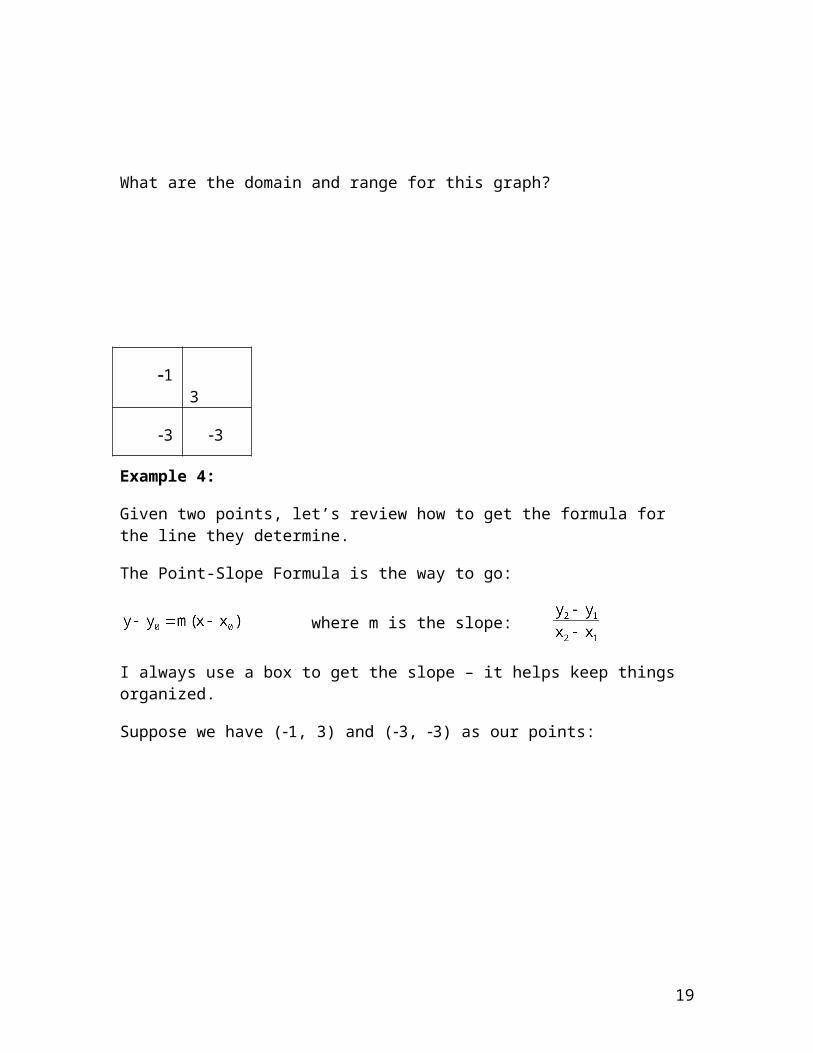
I always use a box to get the slope – it helps keep things organized.
Suppose we have (1, 3) and (3, 3) as our points:
Now subtract down the columns and stack appropriately:
Substitute into our formula using the first point:
This y is an f(x). What are the domain, range, and graph of this function?
1 3
3 3
15
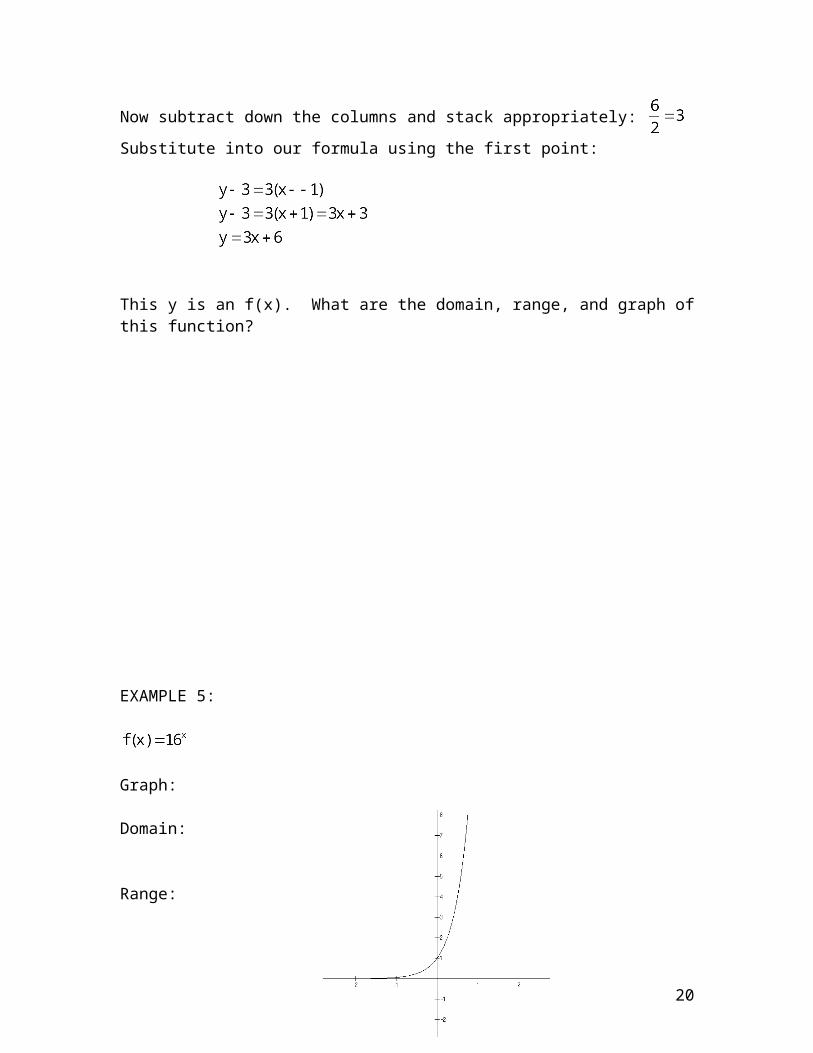
EXAMPLE 5:
Graph:
Domain:
Range:
Domain:
Range:
Evaluation:
f (1) =
f (0) =
f (1/2) =
16
Intercepts and asymptotes
Many graphs have intercepts and asymptotes.
The y-intercept is always f (0). So it’s mostly an evaluation problem.The x-intercept is found by setting y = f (x) = 0 and solving for x.
EXERCISE 1:
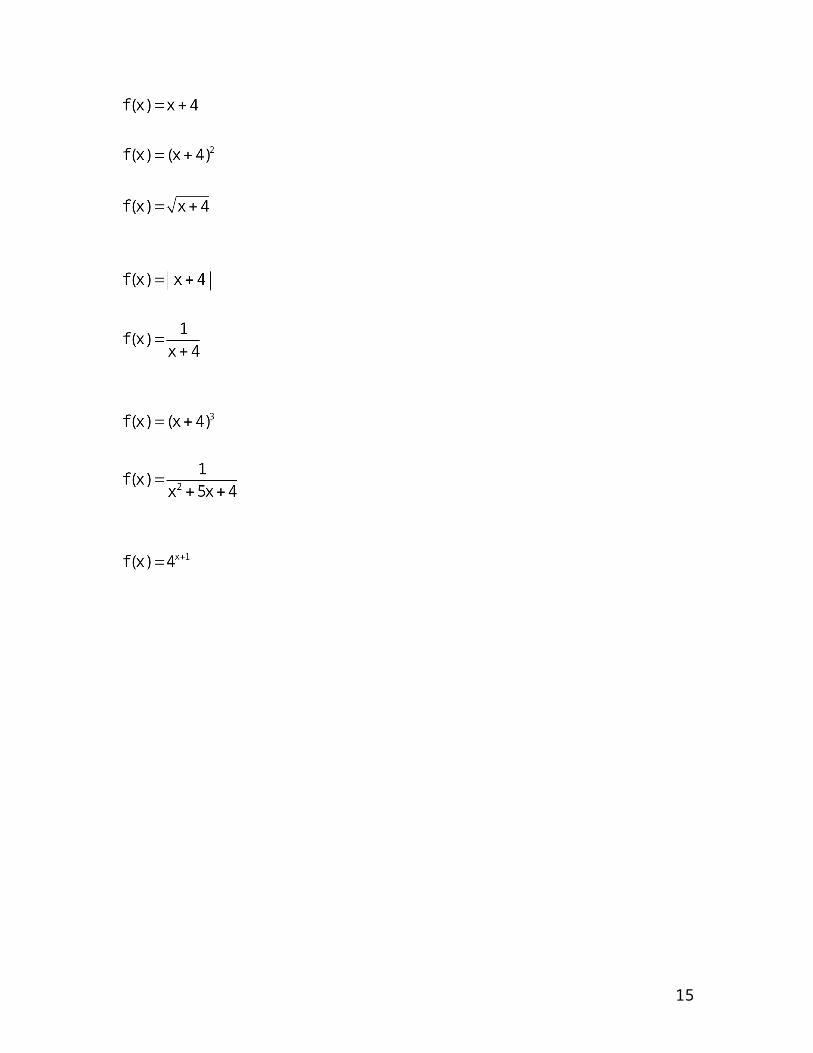
Find the domain, x-intercept(s) and y-intercept for the following functions:
a line:
another line:
a parabola:
17
a polynomial:
a rational function:
another rational function:
18
yet another rational function:
an exponential function:
another exponential function:
19
square-root function:
another square root:
and a last one:
20
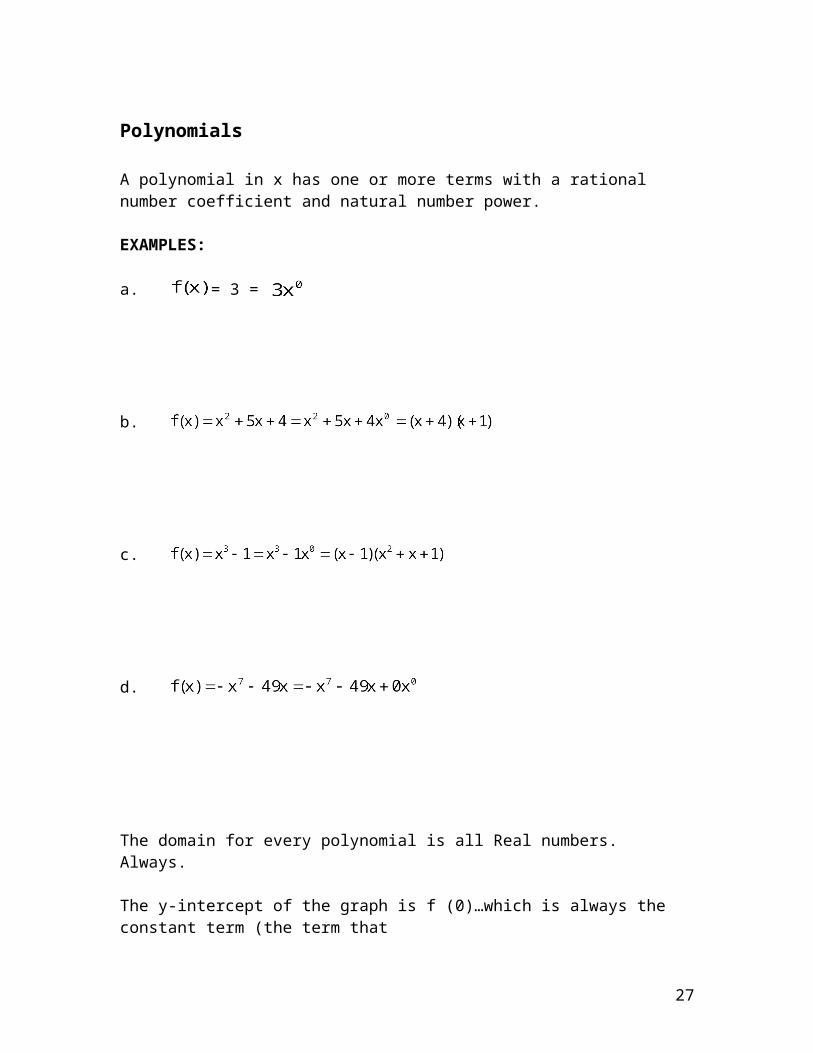
Polynomials
A polynomial in x has one or more terms with a rational number coefficient and natural number power.
EXAMPLES:
a. = 3 =
b.
c.
d.
The domain for every polynomial is all Real numbers. Always.
The y-intercept of the graph is f (0)…which is always the constant term (the term thathas the in it). Give the y-intercept of the polynomials in the example above:
The x-intercepts happen when the y value is zero. Replace f (x) with zero and solve for x. This always involves factoring. Note that the “zero” is the opposite sign of thenumber in the factor. Give the x-intercepts of the examples above.
21
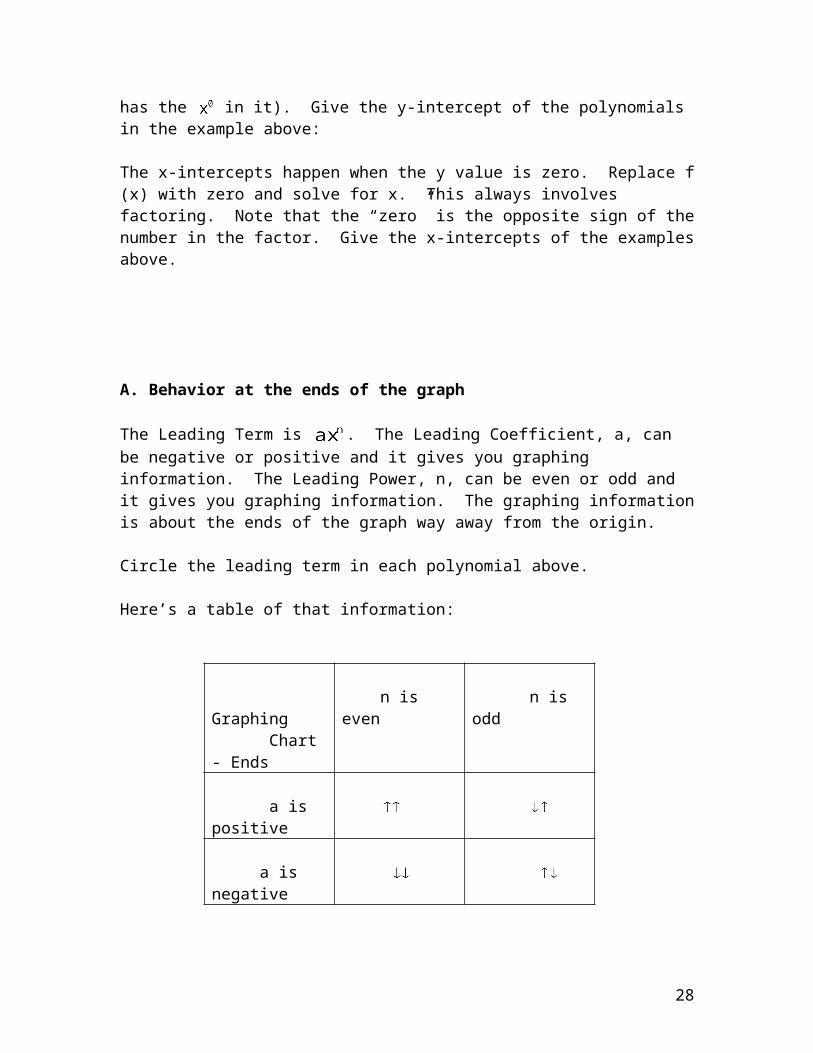
A. Behavior at the ends of the graph
The Leading Term is . The Leading Coefficient, a, can be negative or positive and it gives you graphing information. The Leading Power, n, can be even or odd and it gives you graphing information. The graphing information is about the ends of the graph way away from the origin.
Circle the leading term in each polynomial above.
Here’s a table of that information:
Graphing Chart - Ends
n is even n is odd
a is positive
a is negative
Mnemonic: + even+ odd
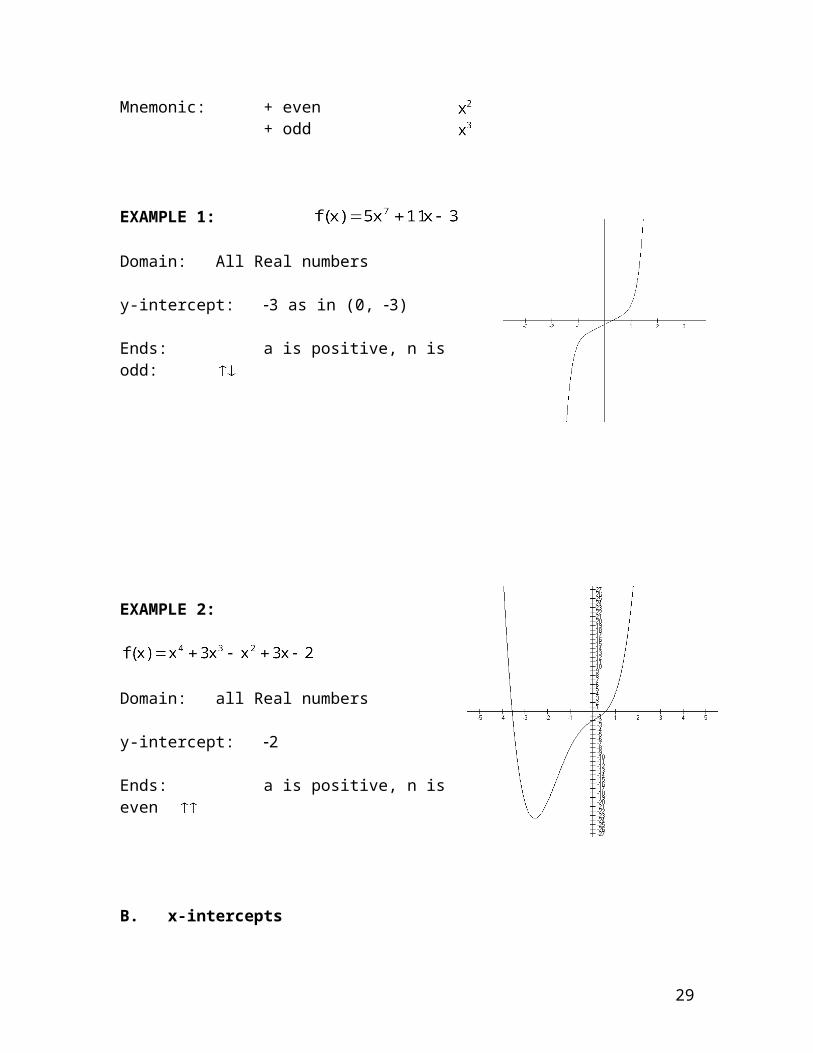
EXAMPLE 1:
Domain: All Real numbers
y-intercept: 3 as in (0, 3)
Ends: a is positive, n is odd:
22
EXAMPLE 2:
Domain: all Real numbers
y-intercept: 2
Ends: a is positive, n is even
B. x-intercepts
Note that both of the graphs above have x-intercepts. You find these by setting the polynomial to zero (y is always zero at an x-intercept) and factoring it to find the intercepts (aka: zeros).
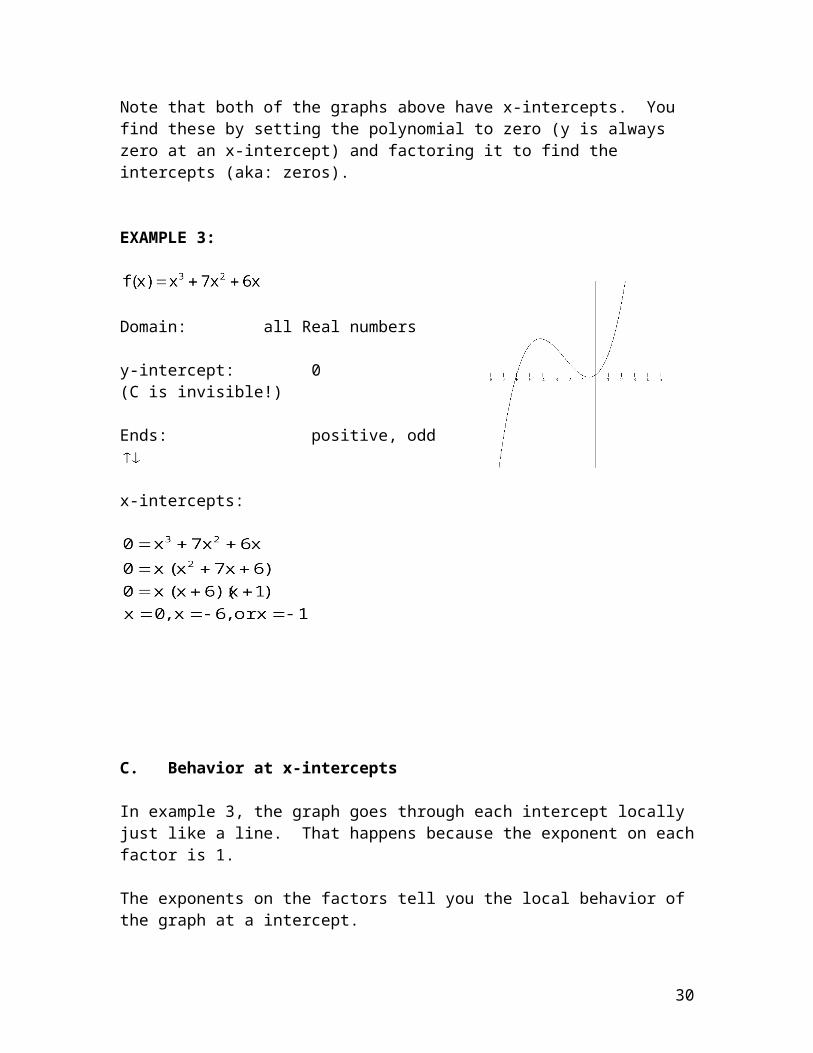
EXAMPLE 3:
Domain: all Real numbers
y-intercept: 0(C is invisible!)
Ends: positive, odd
x-intercepts:
C. Behavior at x-intercepts
23
In example 3, the graph goes through each intercept locally just like a line. That happens because the exponent on each factor is 1.
The exponents on the factors tell you the local behavior of the graph at a intercept.
exponent is 1 graph goes through like a line
exponent is 2 graph curves back tangent to the x-axis like a parabola
exponent is 3 graph squiggles through the point like x-cubed
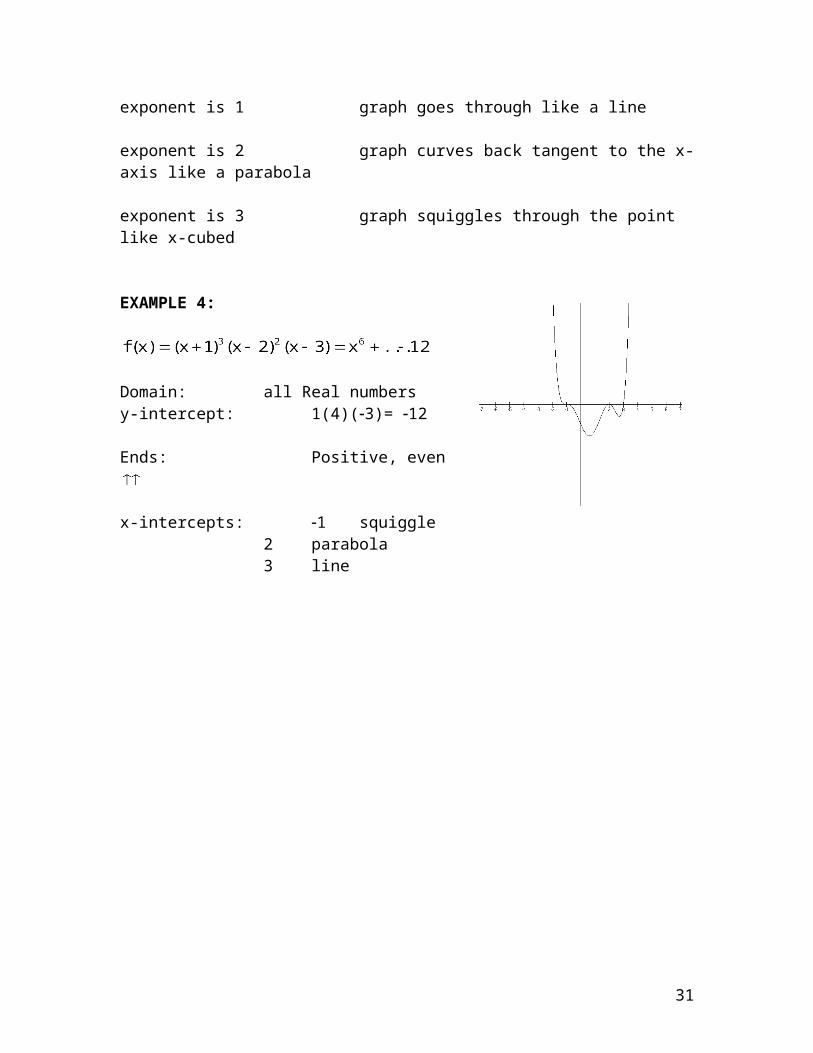
EXAMPLE 4:
Domain: all Real numbersy-intercept: 1(4)(3)= 12
Ends: Positive, even
x-intercepts: 1 squiggle2 parabola3 line
D. Working backwards from the graph to the equation
24
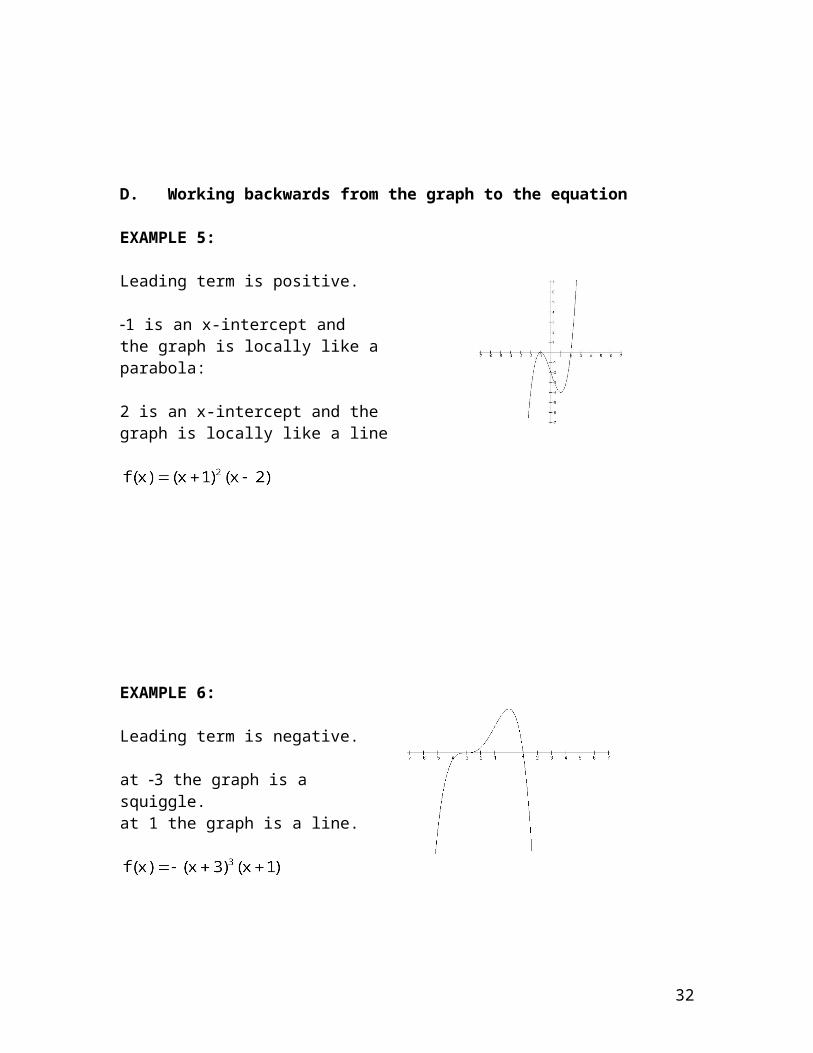
EXAMPLE 5:
Leading term is positive.
1 is an x-intercept and the graph is locally like a parabola:
2 is an x-intercept and thegraph is locally like a line
EXAMPLE 6:
Leading term is negative.
at 3 the graph is a squiggle.at 1 the graph is a line.
Rational Functions
25
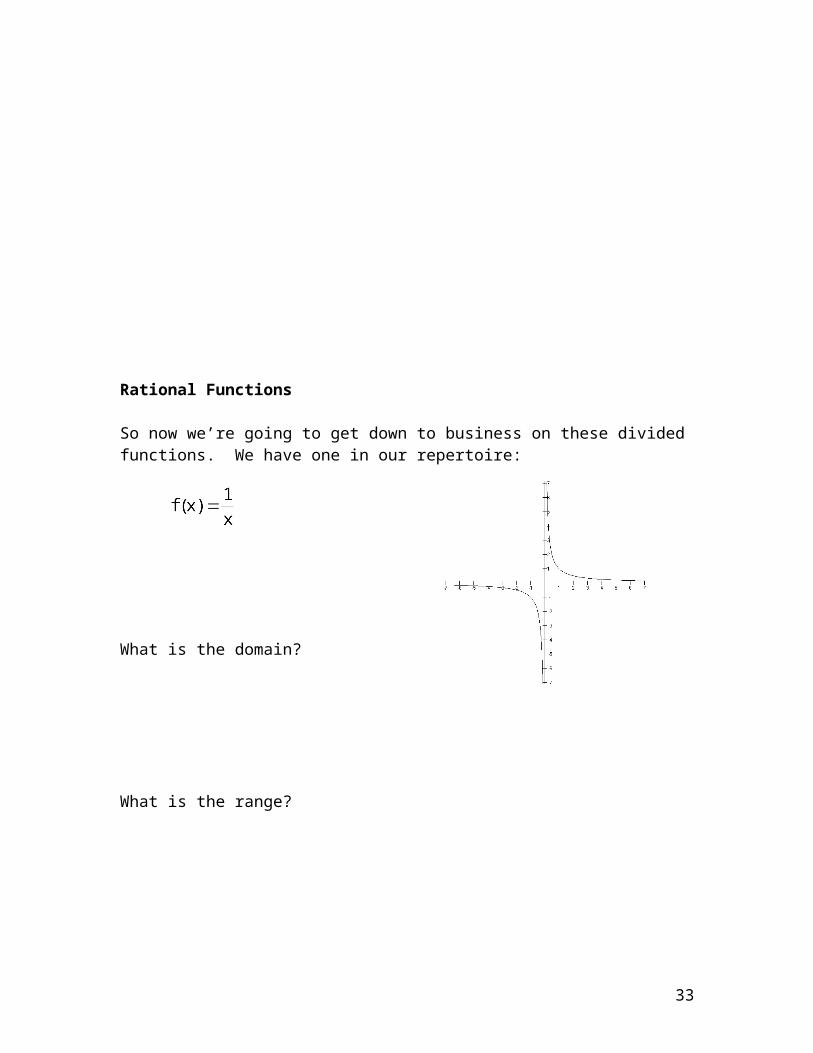
So now we’re going to get down to business on these divided functions. We have one in our repertoire:
What is the domain?
What is the range?
VA
HA
End behavior:
The disallowed values in the domain create vertical asymptotes….x = 0 is a vertical asymptote for this graph…the unattainable values in the range create horizontal asymptotes…y = 0 is a horizontal asymptote.
Asymptotes are lines that shape the graph. Graphs cannot cross a vertical asymptote – these create branches but sometimes cross horizontal asymptotes… the graph resembles a horizontal line for x’s far down either end of the x axis when there’s a horizontal asymptote.
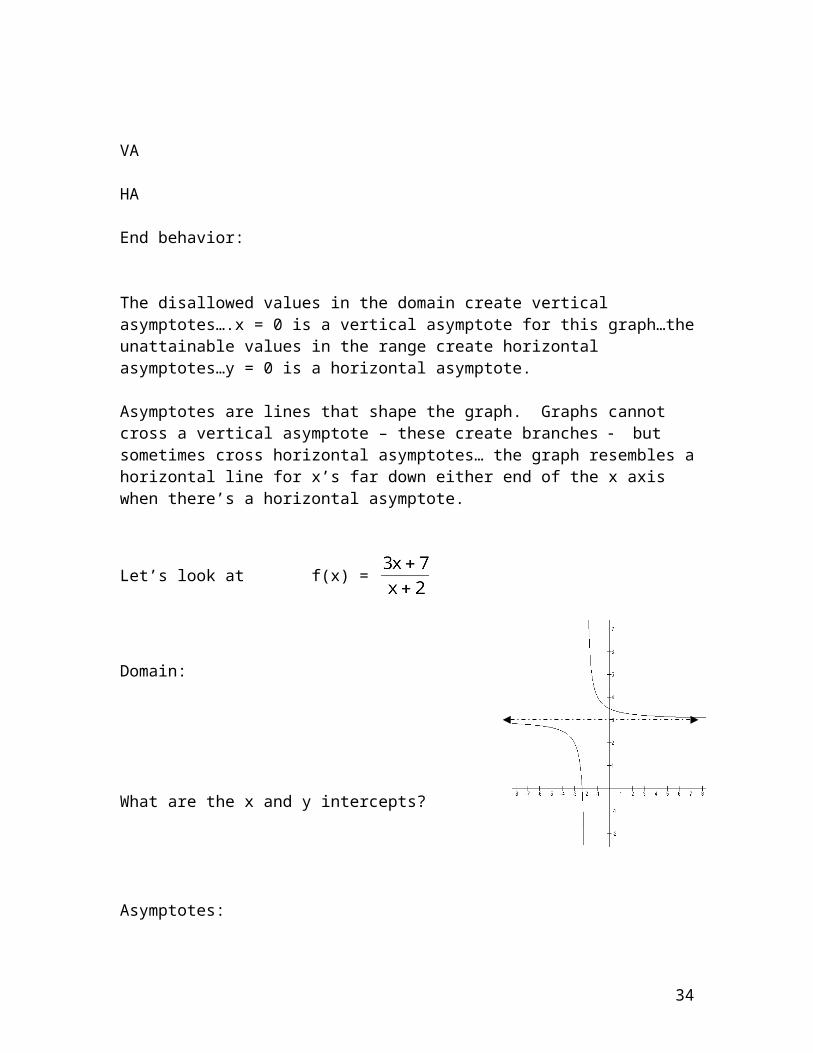
Let’s look at f(x) =
26
Domain:
What are the x and y intercepts?
Asymptotes:
VA:
Behavior at the VA:
HA:
End Behavior:
Note that around (2, 3) the graph does NOT imitatethe asymptotes but far away from this point it does look like these lines.
If you have a polynomial divided by a polynomial, you will have to identify and deal with all kinds of old ideas and new ideas…old ideas include x and y intercepts, new ideas are vertical and horizontal asymptotes and holes.
27
Vertical Asymptotes:
Linear factors in the denominator create vertical asymptotes unless they are cancelled with a like factor in the numerator…in which case, they create a hole.
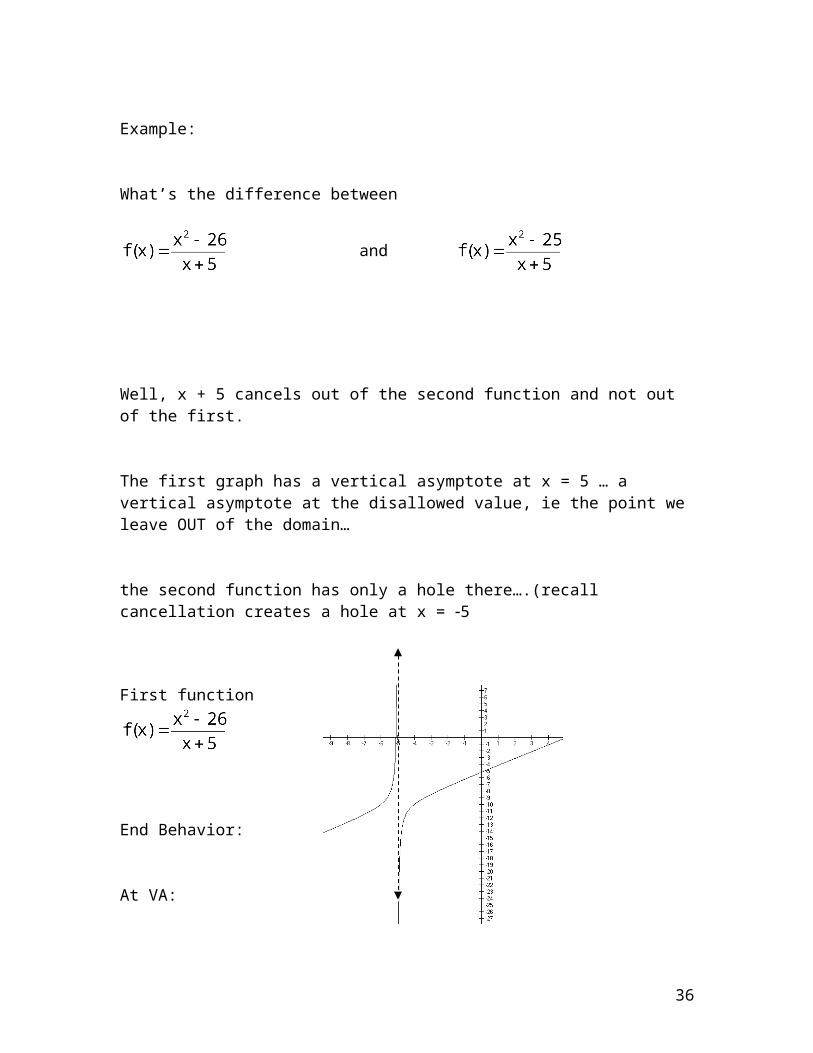
Example:
What’s the difference between
and
Well, x + 5 cancels out of the second function and not out of the first.
The first graph has a vertical asymptote at x = 5 … a vertical asymptote at the disallowed value, ie the point we leave OUT of the domain…
the second function has only a hole there….(recall cancellation creates a hole at x = 5
First function
End Behavior:
At VA:
28
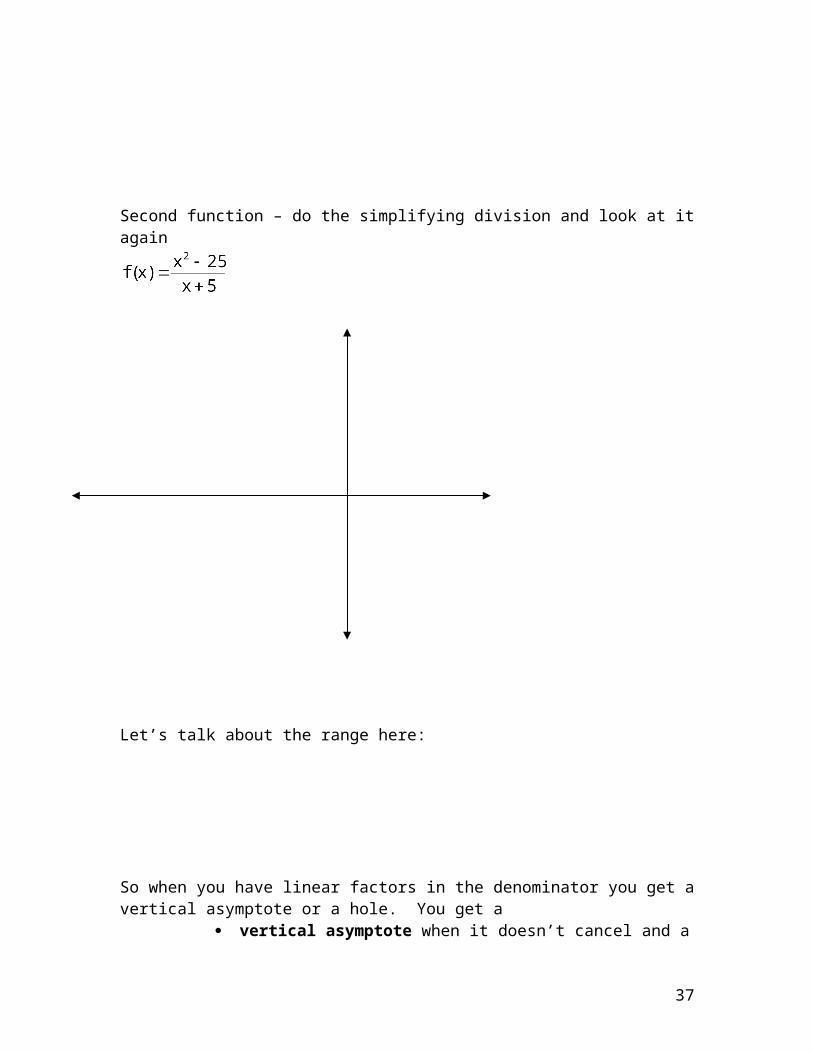
Second function – do the simplifying division and look at it again
Let’s talk about the range here:
So when you have linear factors in the denominator you get a vertical asymptote or a hole. You get a
vertical asymptote when it doesn’t cancel and a hole when it does cancel.
Now let’s review at Horizontal Asymptotes:
29
Basically you work off the leading terms. Divide the power of x in the numerator by the power of x in the denominator. See my handout on the website for more information and practice.
answer > 1 no horizontal asymptote
answer = 1 ha is ratio of coefficients n/d
answer < 1 x axis is horizontal asymptote
What is the HA for
What is the HA for
What is the HA for
Let’s look at some functions and tell what’s going on:
30
Domain:
Vertical asymptotes:
Holes:
HA
x intercepts
y intercept
Sign chart
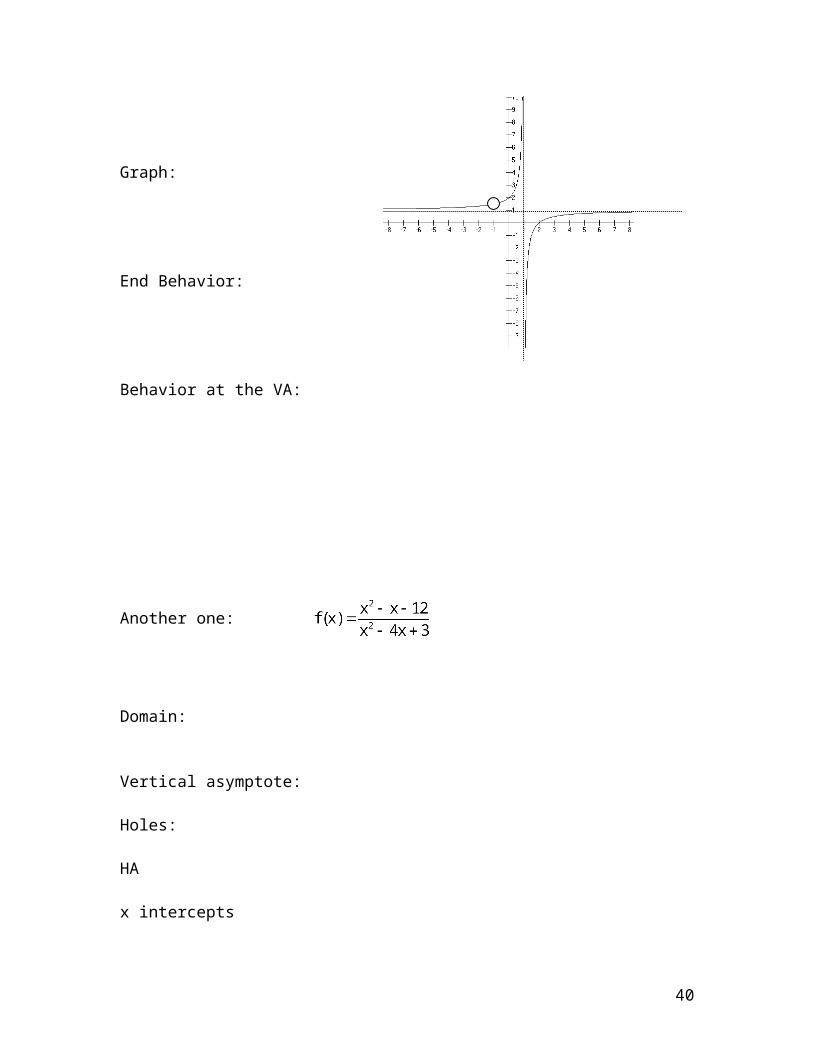
Graph:
End Behavior:
Behavior at the VA:
Another one:
31
Domain:
Vertical asymptote:
Holes:
HA
x intercepts
y intercept
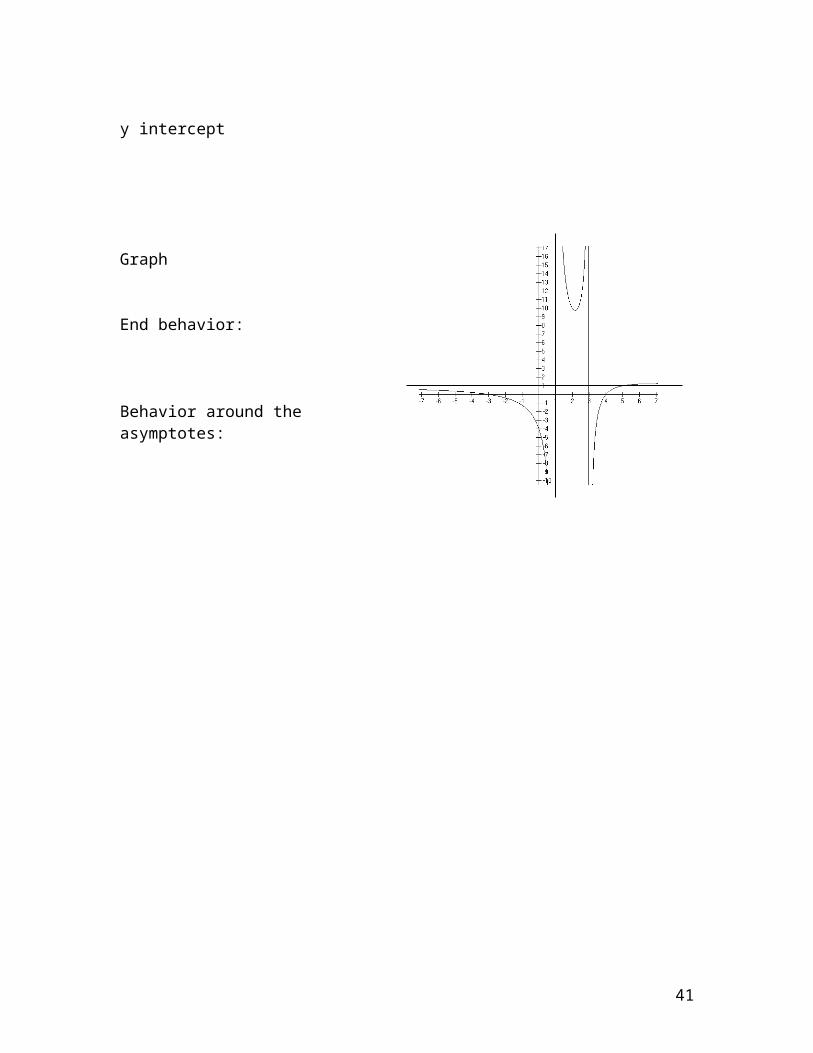
Graph
End behavior:
Behavior around theasymptotes:
32
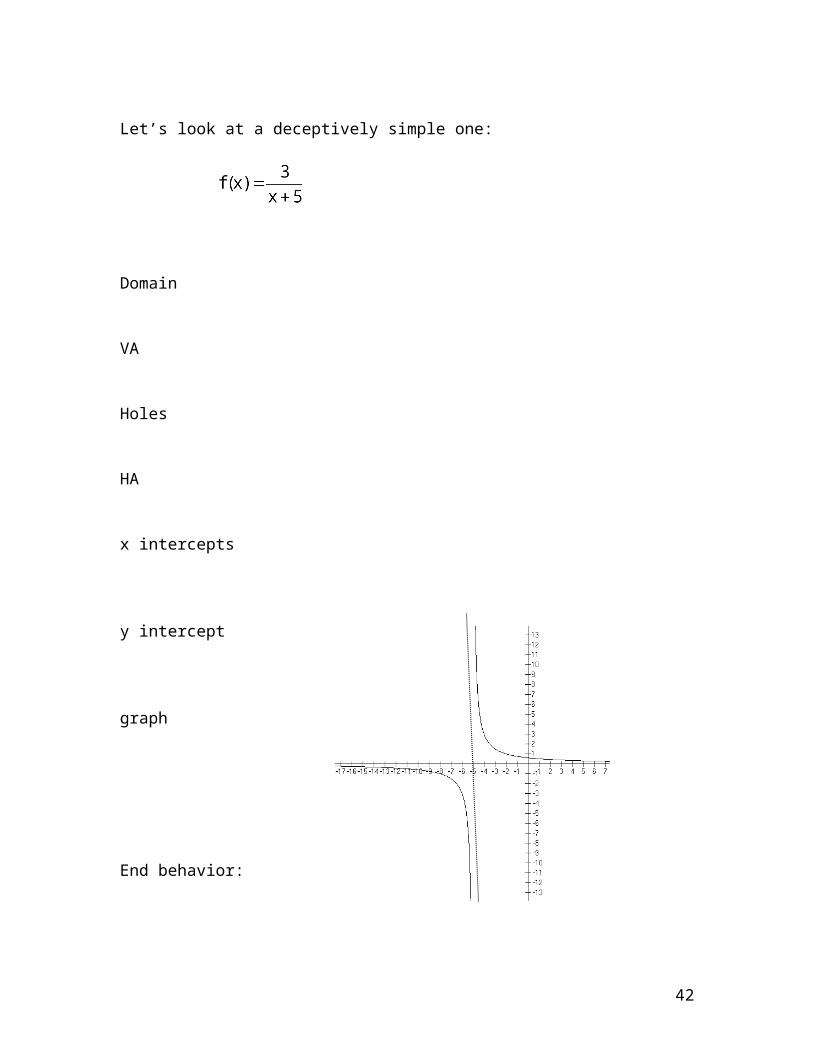
Let’s look at a deceptively simple one:
Domain
VA
Holes
HA
x intercepts
y intercept
graph
End behavior:
Behavior near asymptotes:
33
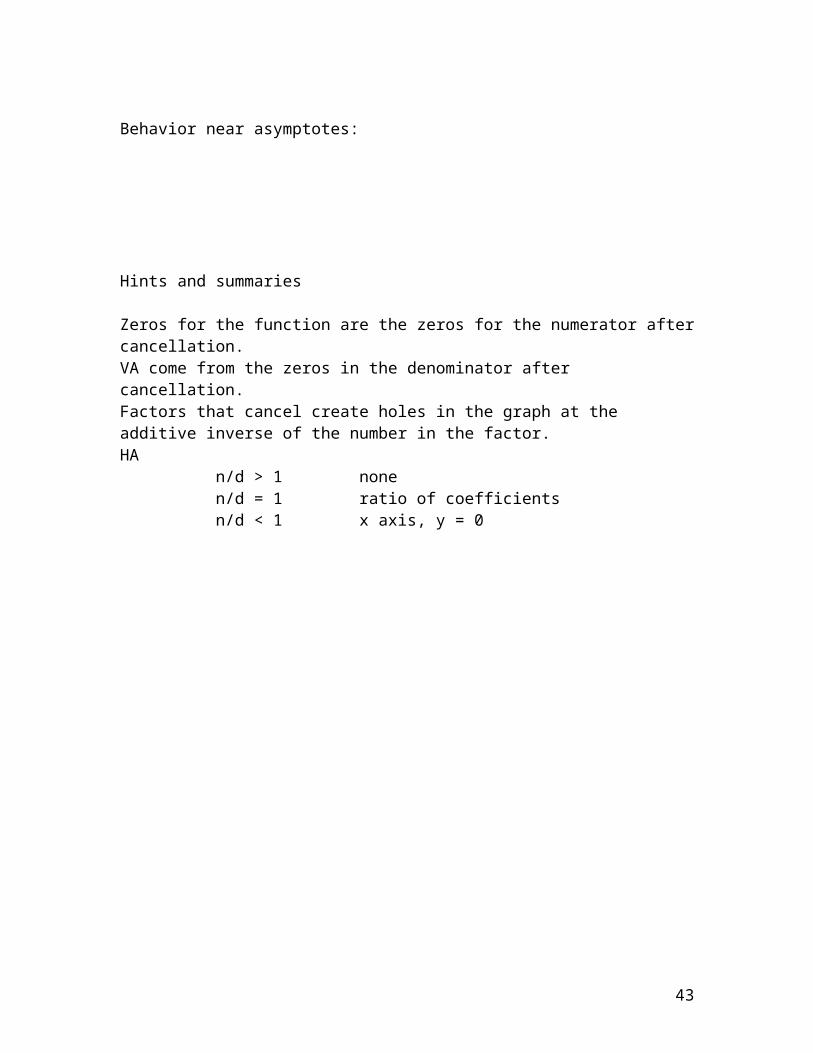
Hints and summaries
Zeros for the function are the zeros for the numerator after cancellation.VA come from the zeros in the denominator after cancellation.Factors that cancel create holes in the graph at the additive inverse of the number in the factor.HA
n/d > 1 nonen/d = 1 ratio of coefficientsn/d < 1 x axis, y = 0
34
Special Functions:
Exponential Functions:
35
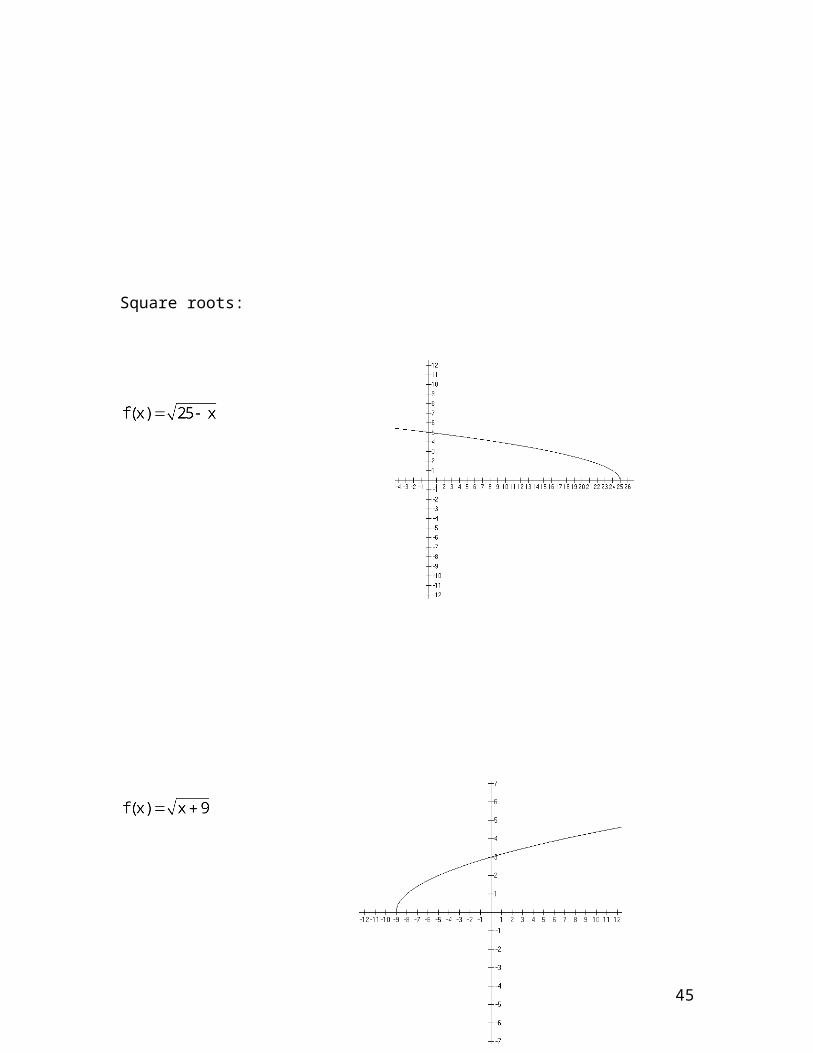
Square roots:
36
Sequences*
*Cohen, David Precalculus, 5th edition West Publishing isbn 0-314-06921-6
A numerical sequence is a function with a domain of the natural numbers. An single element of the range is called a term of the sequence. Some sequences are finite – the number of terms is a given natural number and some are infinite.
Very often the terms are indexed by the natural numbers…the indices are the domain numbers.
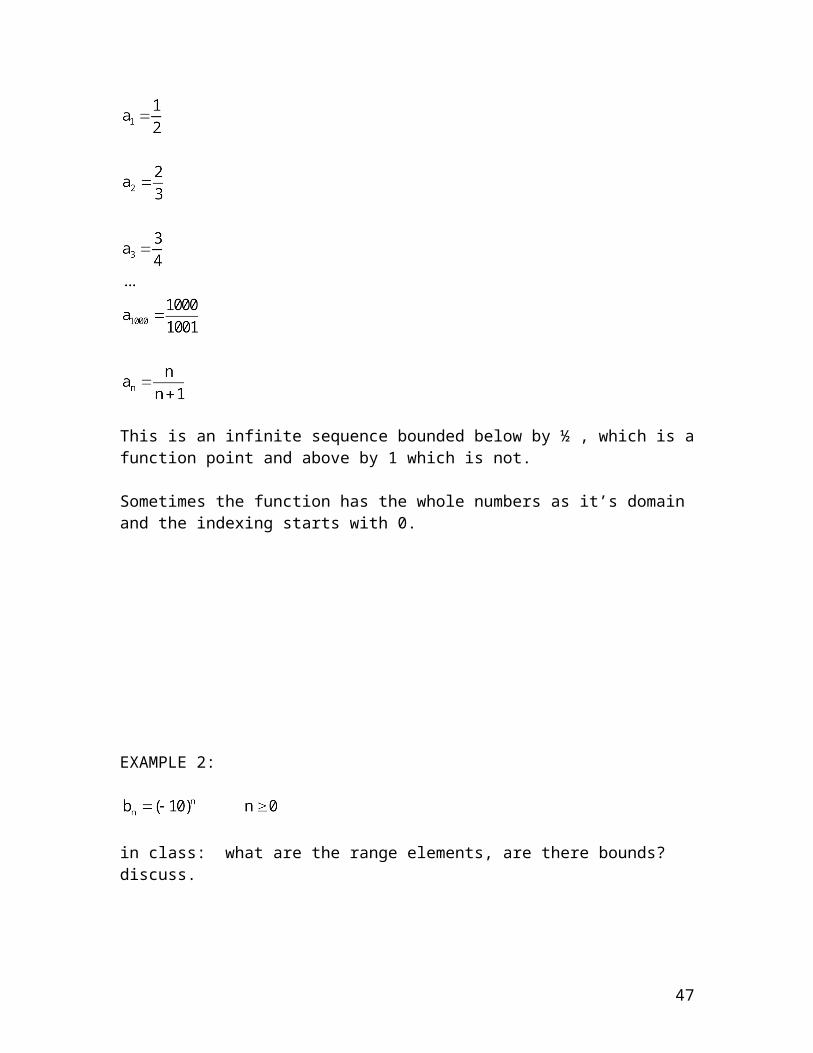
EXAMPLE 1:
This is an infinite sequence bounded below by ½ , which is a function point and above by 1 which is not.
Sometimes the function has the whole numbers as it’s domain and the indexing starts with 0.
37
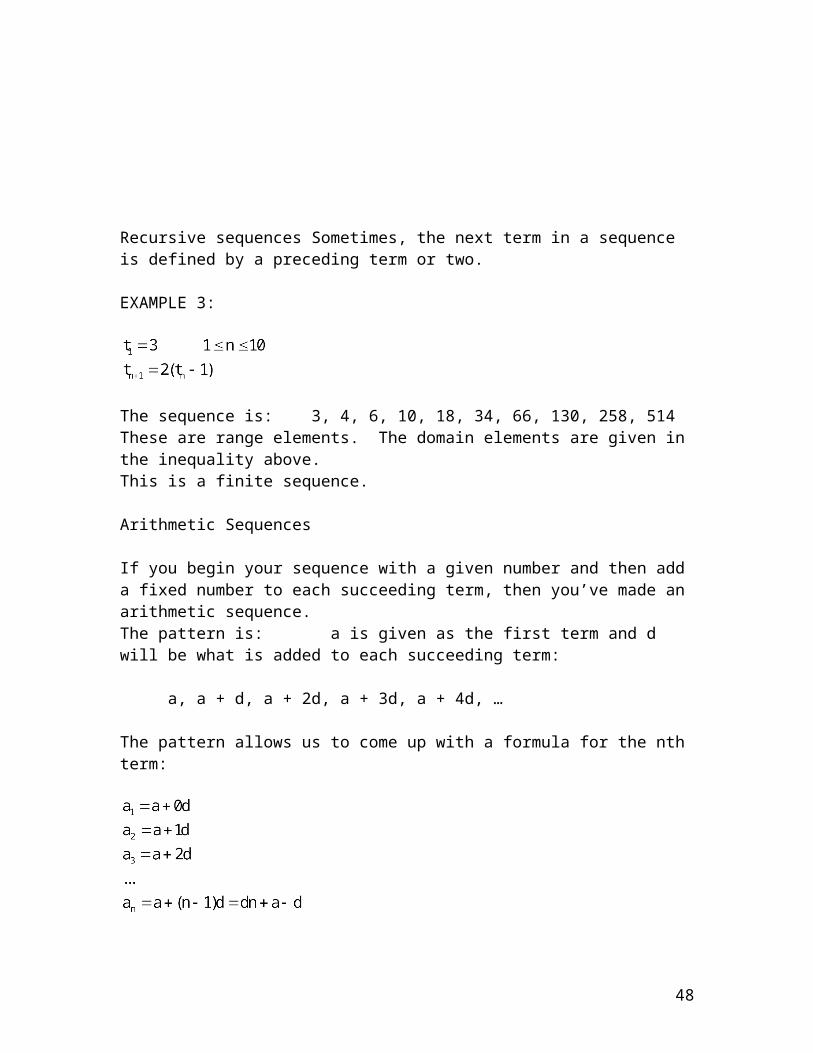
EXAMPLE 2:
in class: what are the range elements, are there bounds? discuss.
Recursive sequences Sometimes, the next term in a sequence is defined by a preceding term or two.
EXAMPLE 3:
The sequence is: 3, 4, 6, 10, 18, 34, 66, 130, 258, 514These are range elements. The domain elements are given in the inequality above.This is a finite sequence.
Arithmetic Sequences
If you begin your sequence with a given number and then add a fixed number to each succeeding term, then you’ve made an arithmetic sequence.The pattern is: a is given as the first term and d will be what is added to each succeeding term:
a, a + d, a + 2d, a + 3d, a + 4d, …
The pattern allows us to come up with a formula for the nth term:
38
Which gives some interesting problems.
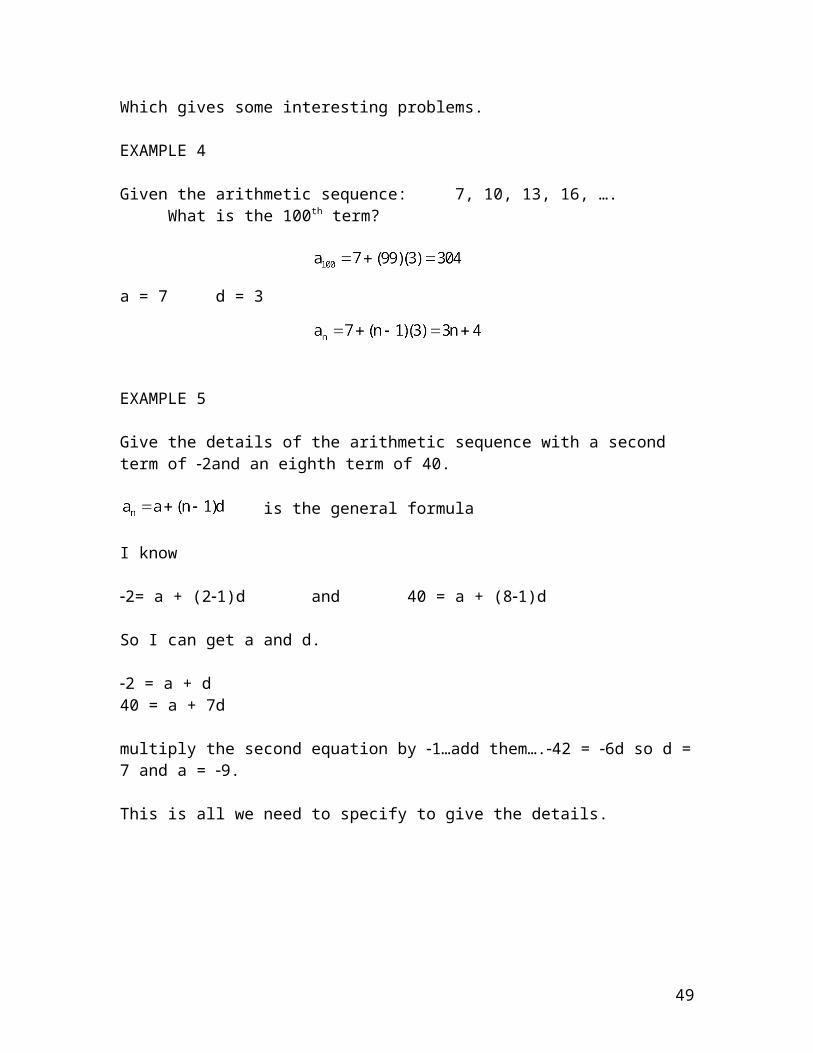
EXAMPLE 4
Given the arithmetic sequence: 7, 10, 13, 16, …. What is the 100th term?
a = 7 d = 3
EXAMPLE 5
Give the details of the arithmetic sequence with a second term of 2and an eighth term of 40.
is the general formula
I know
2= a + (21)d and 40 = a + (81)d
So I can get a and d.
2 = a + d40 = a + 7d
multiply the second equation by 1…add them….42 = 6d so d = 7 and a = 9.
This is all we need to specify to give the details.
39
Geometric Sequences
A geometric sequence is a sequence of the form:
The nth term is then:
EXAMPLE 6
1, ½, ¼, 1/8, …, what are a and r?
10, 100, 1000, 10,000 … what are a and r?
These graph as points in the plane, in Quadrants 1 and sometimes IV.
40
Basic Graphs Worksheet
Basic Linear Function:
Domain:Range:x intercept: (0, 0) y intercept: (0, 0)
Increasing everywhere.
This function is one-to-one.
Example of a shifted graph:
shifting instructions: stretched by 3, left 2, down 1
new formula: try to get this yourself by working with the shifting instructions!
Domain:Range:x intercept: (5/3, 0) y intercept: (0, 5)
41
Basic Quadratic function:
Domain:Range:x intercept: (0, 0) y intercept: (0, 0)
Decreasing:Increasing:
This function is not one-to-one.
Example of a shifted graph:
shifting instructions: left 2, down 9
new formula:
Domain:Range:x intercepts: (5, 0) and (1, 0)y intercept: (0, 5)
track the key point (0, 0) to (2, 9)
42
Basic Cubic function:
Domain:Range:x intercept: (0, 0) y intercept: (0, 0)
Increasing everywhere.
This function is one-to-one.
Example of a shifted graph: ½ f(x 1)
shifting instructions: shrink by ½, right 1
new formula:
Domain:Range:x intercept: (1, 0)y intercept: (0, 1/2)
track the key point (0, 0) to (1, 0)
43

Basic Cube Root function:
Domain:Range:x intercept: (0, 0) y intercept: (0, 0)
Increasing everywhere.
This function is one-to-one.
Example of a shifted graph: f(x + 1) 2
shifting instructions: left 1, down 2
new formula:
Domain:Range:x intercept: (7, 0) y intercept: (0, 1)
track the key point (0, 0) to (1, 2)
44
Basic Square Root function:
Domain:Range:x intercept: (0, 0) y intercept: (0, 0)
Increasing on its domain.
This function is one-to-one.
Example of a shifted graph: f(3 x)
shifting instructions: reflect about the x axis, left 3, reflect about the y axis
new formula:
Domain:Range:x intercept: (3, 0)y intercept:
45
Basic Rational function:
Domain:Range:x intercept: noney intercept: nonevertical asymptote: x = 0horizontal asymptote: y = 0
Decreasing on it’s domain
This function is one-to-one.
Example of a shifted graph: f(x + 2) - 3
shifting instructions: left 2, down 3
new formula:
try to get this yourself by working with the shifting instructions!
Domain:Range:x intercept: (5/3, 0)y intercept: (0, 5/2)vertical asymptote: x = 2horizontal asymptote y = 3
Track the key point (1, 1) to (1, 2).
46
Basic Absolute Value function:
Domain:Range:x intercept: (0, 0) y intercept: (0, 0)
Decreasing:Increasing:
This function is not one-to-one.
Example of a shifted graph: f(x 5) +2
shifting instructions: reflect about the x axis, right 5, up 2
new formula:
Domain:Range:x intercepts: (7, 0) and (3, 0) y intercept: (0, 3)
47
Basic exponential function:
Domain:Range:x intercept: none y intercept: (0, 1)horizontal asymptote: y = 0
Increasing everywhere.
(illustration is with b = 3)
Example of a shifted graph: f(x + 3) + 9
shifting instructions: reflect about the x axis, left 3, up 9,
new formula:
Domain:Range:x intercept: (1, 0)y intercept: (0, 18)horizontal asymptote: y = 9
Be sure to know how to handle thisif b = e.
48
Basic logarithmic function:
Domain:Range:x intercept: (0, 1) y intercept: none
Vertical asymptote: x = 0
Increasing everywhere.
This function is 1:1.
(illustration is with b = 10)
Example of a shifted graph:
shifting instructions: left 2, reflect y
new formula:
try to get this yourself by working with the shifting instructions!
Domain:Range:x intercept: (1, 0) y intercept:
vertical asymptote: x = 2
49